Article

Accumulation of Inert Impurities in a Polymer Electrolyte Fuel Cell System with Anode Recirculation and Periodic Purge: A Simple Analytical Model

Fuel Cell Research Laboratory, School of Mechatronic Systems Engineering, Simon Fraser University, Surrey, BC V3T0A3, Canada
*
Author to whom correspondence should be addressed.
Energies 2022, 15(6), 1968; https://doi.org/10.3390/en15061968
Submission received: 9 February 2022 / Revised: 1 March 2022 / Accepted: 4 March 2022 / Published: 8 March 2022
(This article belongs to the Section A5: Hydrogen Energy)

Abstract

:
Anode recirculation with periodic purge is commonly used in polymer electrolyte fuel cell systems to control the accumulation of nitrogen, water, and other impurities that are present in the fuel or diffuse through the membrane from the cathode compartment. In this work, we develop a simple, generalized analytical model that simulates the time dependence of the accumulation of inert impurities in the anode compartment of such a system. It is shown that, when there is transport out of the anode chamber, the inert species is expected to accumulate exponentially until equilibrium is reached when the rate of inert entering the anode in the fuel supply and/or via crossover from the cathode is balanced by the rate of leakage and/or crossover to the cathode. The model is validated using recently published experimental data for the accumulation of N2, CH4, and CO2 in a recirculated system. The results show that nitrogen accumulation needs to be taken into account to properly adjust system parameters such as purge rate, purge volume, and recirculation rate. The use of this generalized analytical model is intended to aid the selection of these system parameters to optimize performance in the presence of inerts.

1. Introduction

To optimize fuel efficiency and to limit the accumulation of fuel impurities, a polymer electrolyte fuel cell (PEFC) is often operated in dead-ended anode (DEA) mode with either a small bleed or periodic purge [1,2]. In addition to the distribution of fuel and control of impurity build-up, the fuel supply system must also prevent the build-up of water in the fuel distribution plates, which can lead to fuel starvation and subsequent corrosion of the carbon used to support the catalyst [3,4]. It has been found that a high fuel flow velocity must be maintained to remove water from the gas channels in the gas distribution plate. Sufficient fuel velocity often cannot be maintained in a PEFC operating in DEA mode with small bleed because most of the hydrogen is consumed along the channel and the fuel flow velocity is low at the end of the flow field. In this situation, water accumulates resulting in fuel starvation over a portion of the anode. To overcome the problem of water accumulation, recirculation of the anode fuel stream is a commonly used technique to increase fuel velocity through the gas distribution plate while maintaining high fuel utilization—in some cases as high as 99%. These high fuel utilization rates, however, cause significant enrichment of any impurities (such as N2, CH4, CO, and CO2) in the fuel stream as well as impurities (such as N2 and CO2) that can diffuse across the membrane from the cathode.
A number of experimental studies of the accumulation of impurities in PEFCs have been reported. Matsuura et al. [5] studied cell degradation caused by nitrogen and water build-up in a dead-ended PEFC. Their electrochemical impedance spectroscopy (EIS) measurements showed that the build-up of impurities resulted in carbon corrosion near the cell outlet. Karimaki et al. [6] made nitrogen accumulation measurements using an 8 kW PEFC stack with periodic purge. In these measurements, it was demonstrated that the inert gas crossover rate could be measured using an on-line hydrogen concentration sensor. The same system was used by Nikiforow et al. [7] to optimize the purge cycle and fuel efficiency. Their experiments showed that high fuel efficiency (>99%) could be achieved. Matsuda et al. [8] have measured the accumulation of impurities in a recirculated, single cell PEFC and found that N2 and He accumulated while CO did not, presumably because of oxygen crossover from the cathode. In a recent study, Matsuda et al. [9] also compared the effect of CO on the performance of a PEFC with hydrogen recirculation and in a flow through system. Koski et al. [10] made detailed studies of the dynamics of the enrichment of N2, CH4, CO2, and CO in a recirculated, single cell PEFC with continuous bleed. In a recent report [11], this work was extended to study the time dependence of the dynamics of the accumulation of N2, CO2, and CH4 between purge cycles in a 1 kW PEFC stack with fuel recirculation and periodic purge.
Modeling work has been carried out by Chen et al. [12] to optimize the purge cycle in a dead ended PEFC, taking into account system efficiency and cell degradation due to carbon corrosion. Their optimization was based on a two-phase, 1+1D computational fuel cell model. The authors examined the influence of purge interval and cycle duration on the cathode carbon corrosion and system performance. The accumulation of impurities in recirculated PEFCs has also been the subject of a number of modeling studies. Ahluwalia and Wang [13] developed a one-dimensional steady state model to estimate the amount of nitrogen build-up in a PEFC stack taking into account: the ionic potential and electronic potential distribution; current generation in the catalyst layers; ionic and electronic current distribution; water transport across the membrane; species concentrations across the porous catalyst and gas diffusion layers; species concentration in the gas channels; and transport of water. This work demonstrated that the rate of nitrogen crossover was high, leading them to the conclusion that there was little point in defining strict limits on the concentration of inerts in the fuel. Promislow et al. [14] developed a one-dimensional analytical model to study the steady state profile of nitrogen in the gas channels of a recirculated PEFC. Their model showed that the times for the nitrogen concentration to reach steady state is of the order of minutes and that nitrogen dilution is severe without anode bleed. They further examined the effect of anode bleed on system efficiency. Gardner et al. [15] developed a time dependent, zero-dimensional numerical model for the accumulation of inert species as well as CO in a recirculated system with a small continuous bleed, assuming perfect gas mixing in the anode chamber. Comparison of the modeled results with available experimental accumulation measurements showed good agreement. This work also showed that, when the assumption of perfect mixing is made, the results for accumulation of impurities in a PEFC with recirculation and transport of the species out of the anode chamber by leakage and/or diffusion is the same as those for a PEFC with a DEA and the same rate of transport provided the anode volumes are the same. Recently, Koski et al. [11] proposed a theory and methodology for the calculation of the composition and dynamics of the accumulation of inerts in a recirculated PEFC during the purge cycle once steady state conditions are achieved. Similar to the assumptions made by Gardner et al. [15], they also assumed perfect mixing in the anode chamber. Using this approach, they obtained an approximate solution for linear accumulation (when there is minimal change in the inert concentration over the purge period) and exponential accumulation (when there is significant change in concentration over the purge period).
The objective of this work is to develop a generalized model capable of following the complete time dependent accumulation of any inert in the anode chamber, considering the transport of inerts into and out of the anode chamber due to fuel flow, physical leakage, and diffusion. As mentioned above, previous modeling studies have been either steady state or pseudo-steady state. In the present work, we develop a simple analytical model for the accumulation of inerts in a recirculated PEFC with occasional purge to control the build-up of impurities capable of modeling accumulation over all times rather than the pseudo-steady state approach used by Koski et al. [11]. As with our previous model [15] and the model of Koski et al. [11], the assumption of perfect mixing within the anode chamber and recirculation loop is made. Results from the model are compared to experimental results available in the literature for the accumulation of N2, CH4, and CO2 in a recirculated system to validate the model and demonstrate its capabilities. This methodology has not been used previously to model species accumulation in a recirculated PEFC, and may provide an important, practical aid for fuel cell system design and operation in the presence of inerts.

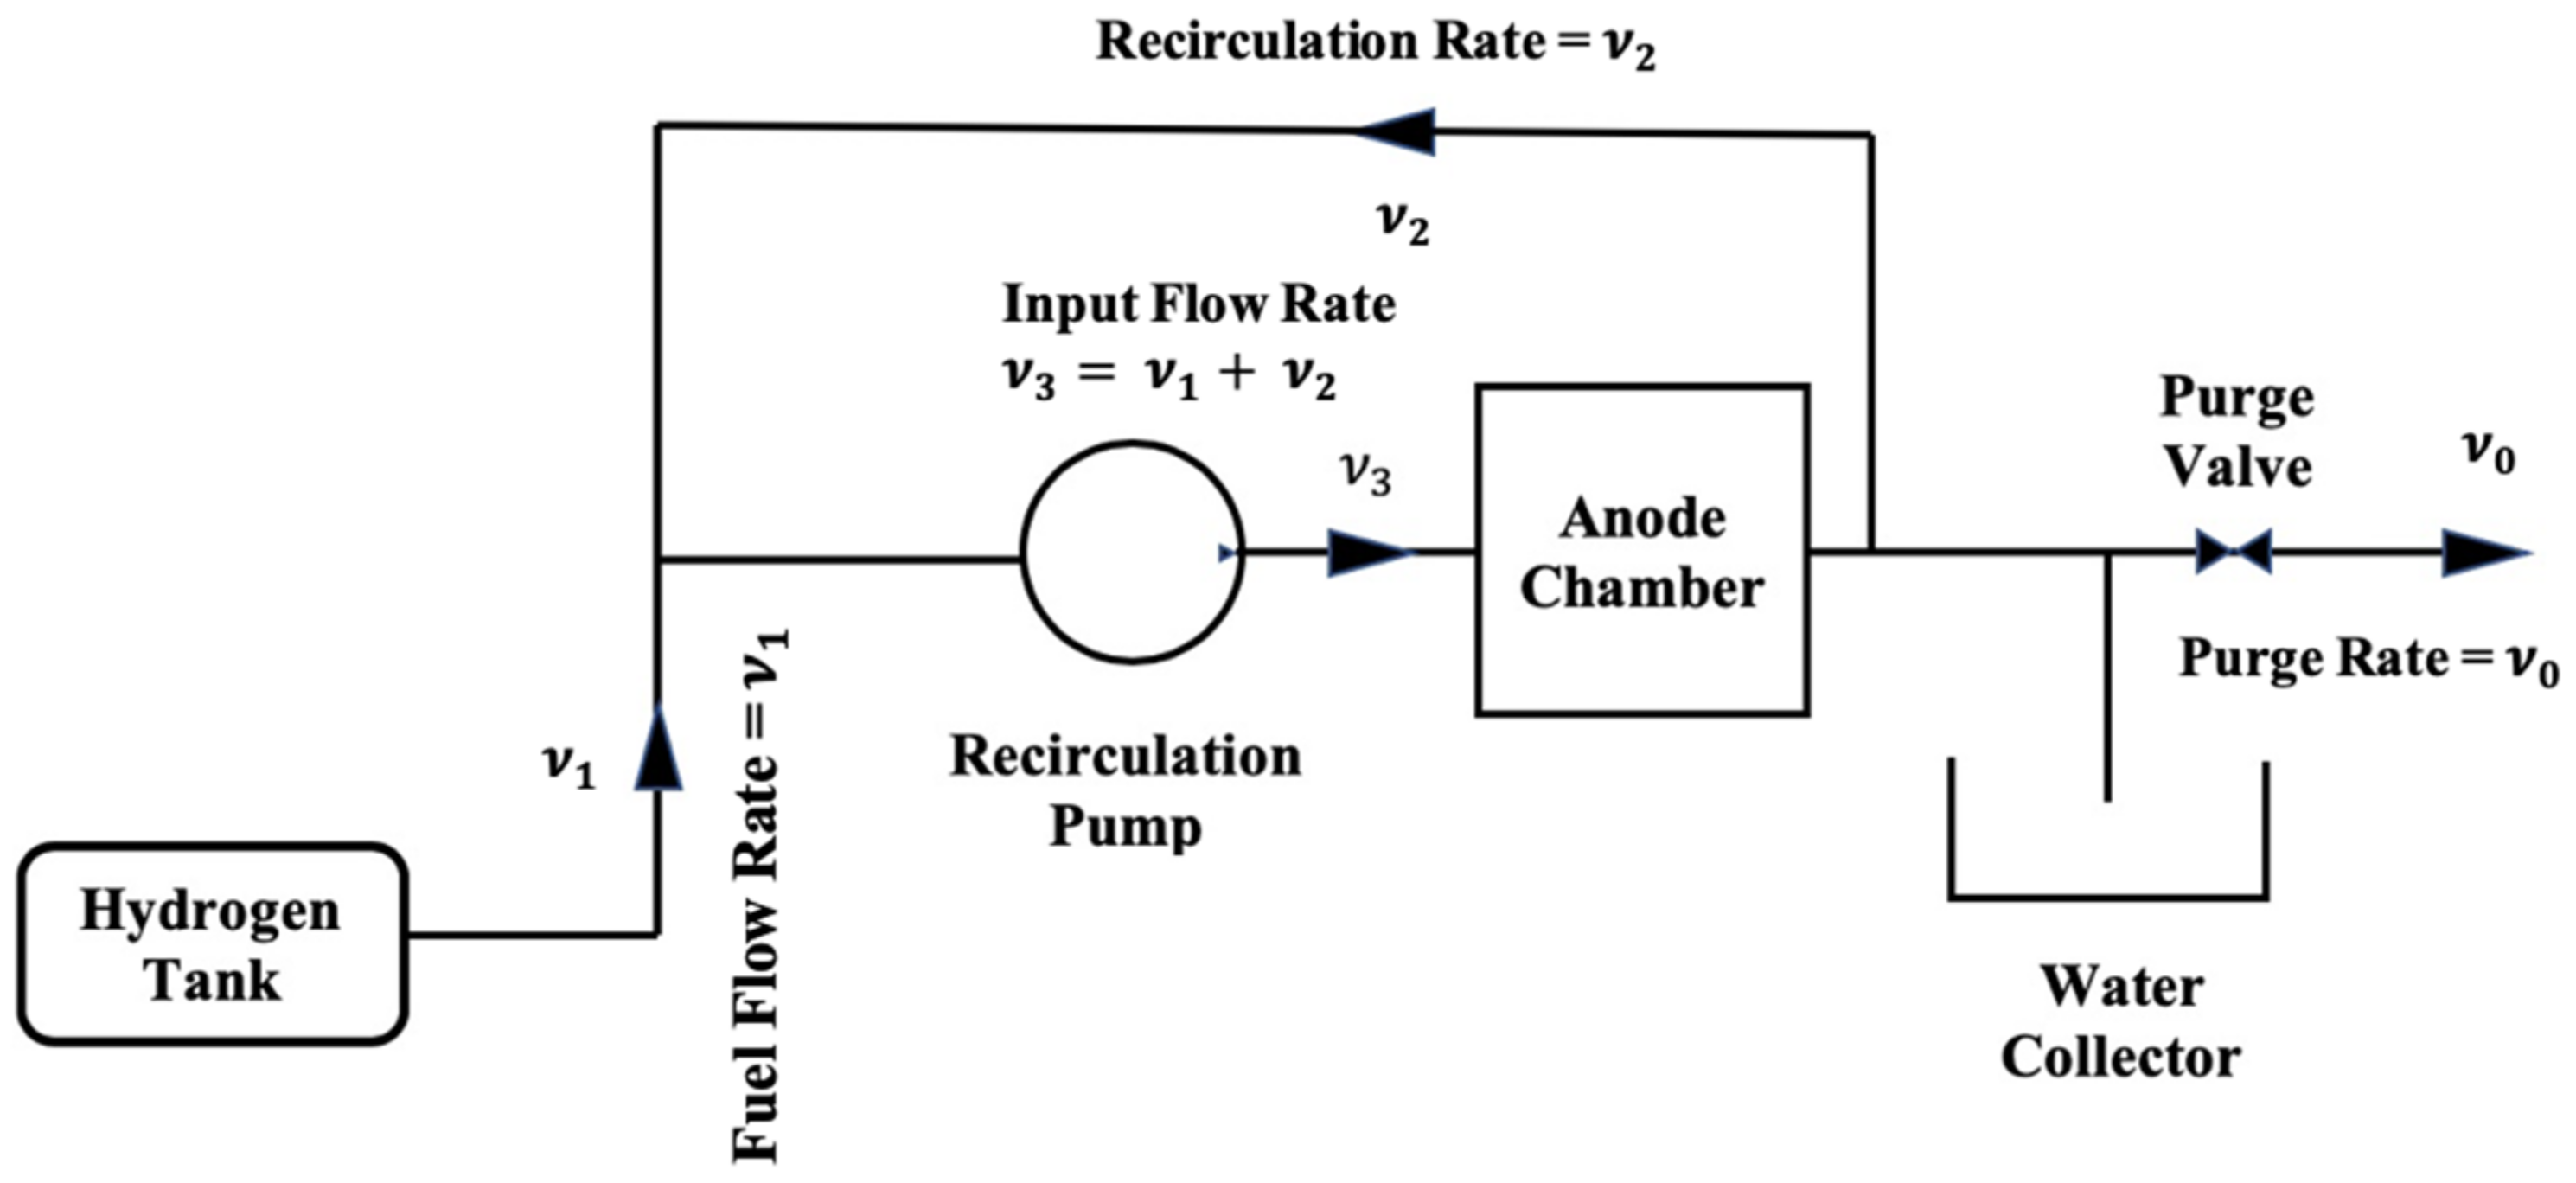
2. Model Development

In this section, we develop a simple analytical model of a PEFC with a recirculated anode fuel system with periodic purge as illustrated in Figure 1. The aim is to develop a model that will predict the time dependence for the concentration of the various inert species inside the anode chamber. In developing this model, the following assumptions are made:
(a)
All reactants and inert species inside the anode recirculation loop are assumed to be well mixed.
(b)
Temperatures and pressures across the recirculation plumbing are assumed to be constant.
(c)
The system is assumed to be operating at steady state with pure hydrogen flowing before time t = 0. The impure hydrogen stream is assumed to be introduced at time t = 0. The dynamics of the accumulation of impurities in the anode chamber is then followed at times > 0.
Similar assumptions have been used effectively by other researchers in their PEFC modeling studies. In particular, they have been used to model CO poisoning effects [16,17,18,19,20], electrochemical preferential oxidation (ECProx) [21], and species accumulation [11,15,22,23]. In these cases, each phenomenon is controlled largely by mass transport of species into and out of the cell. In the case of accumulation in a recirculated system, the large added volume of the recirculation system and a high recirculation rate helps maintain a more uniform concentration of species in the anode chamber. It should also be noted that most experiments collect information at the cell or stack level rather than detailed measurements along the flow channels. In this case, the grid used in the model matches the experiment and avoids the need to go back and average parameters that are necessary when higher dimensional models are used to calculate species concentration along the flow channels. While the simplifications used for the model add uncertainty to the results, it should be noted that a similar level of uncertainty will also exist in the experimental data. For instance, it is difficult to accurately control the purge volume using a timed solenoid valve. For this reason, it is expected that the model we present should produce reasonable guidance in the selection of the system parameters needed to control the build-up of inerts in the recirculation loop in order to maintain system performance.
In this system, gas in the anode chamber is operated in a repetitive mode with the system dead ended for a time, t c , at which point the purge valve is opened for time, t p , and gas flows out of the anode chamber at rate ν p . After this the cycle repeats itself. The volume of gas purged each cycle is then V p = ν p × t p . Because of the requirement to maintain a constant pressure in the system, impure hydrogen flows out of the hydrogen tank at a rate, ν 1 , that is determined by the rate of physical removal of hydrogen from the anode chamber as a result of system leakage, purge, and diffusion and the rate of electrochemical removal of hydrogen due to electro-oxidation during operation of the fuel cell. Primarily for the purposes of water removal, some of the gas in the anode chamber is recirculated at a rate, ν 2 , via the recirculation loop and mixed with the hydrogen feed to give a total flow rate into the cell of ν 3 .
The model assumes that inert impurities are present in the fuel stream and that they can be transported out of (or into) the anode chamber via physical leakage and/or diffusion through the fuel cell membrane as illustrated in Figure 2.
Previous work [13] has shown that, when air is used as the oxidant, the amount of N2 diffusing through the membrane from the cathode is large and, as Ahluwalia and Wang [13] pointed out, there is little incentive to reduce inert impurities in the fuel to a very low level because of N2 crossover. This is reflected in the hydrogen quality specification for PEFCs in road vehicles (ISO FDIS 14687-2) where the limit for N2 is set at 100 ppm and the total limit of non-hydrogen gases at 300 ppm.
As illustrated in Figure 2, nitrogen will diffuse through the membrane from the cathode until the concentration in each chamber is equal. Without purge and when there is N2 in the fuel, the concentration in the anode chamber can eventually exceed that at the cathode and reverse the direction of diffusion from the anode to the cathode. An equilibrium concentration will eventually be reached when the amount of N2 flowing into the cell is balanced by that flowing out. The same is true for CO2 which has an atmospheric concentration of about 409 ppm. For other inerts, such as CH4, where the concentrations in the air stream are very low, diffusion can be considered to only occur from anode to cathode.
The material balance for species i in the anode chamber can be expressed as:
V A d c i , a d t = ν 3 c i , i n ν 2 c i , a ν 0 c i , a ν d   c i , a c i , c
where V A is the total volume of the anode chamber and recirculation loop, c i , i n is the concentration of species i at the anode inlet after the gas flowing from the cylinder and the recirculated gas from the anode compartment are mixed, c i , a is the concentration of species i in the anode chamber, c i , c is the concentration of species i in the cathode chamber, ν 0 is the leakage rate, and ν d is the rate of diffusion of species i through the membrane where:
ν d = P m , i A l
In this equation P m , i is the permeability. of species i through the membrane, l is the membrane thickness, and A is the geometric area of the electrode.
If we note however that, due to species conservation at the inlet juncture,
ν 3 c i , i n = ν 1 c i , 0 + ν 2 c i , a
where c i , 0 is the concentration of species i flowing from the hydrogen tank, then Equation (1) can be rewritten as:
V A d c i , a d t = ν 1 c i , 0 ν 0 c i , a ν d c i , a c i , c
This shows that, when the assumption is made that there is perfect mixing in the anode chamber, the results for accumulation of impurities in a PEFC with recirculation and transport of the species out of the anode chamber by leakage and/or diffusion is the same as those for a PEFC with a DEA and the same rate of transport provided the anode volumes are the same.
In terms of mole fractions, Equation (4) can be rewritten as:
P a n o d e V A R T   d x i , a d t = P 0 ν 1 R T 0 x i , 0 P 0 R T 0 { ν 0 x i , a + ν d ( P a n o d e x i , a P c a t h o d e x i , c ) }
In this equation, x i , a , x i , c and x i , 0 are the mole fraction of species i in the anode chamber, cathode chamber, and anode feed, respectively. From Equation (5) it is seen that the direction of flow of species i through the membrane will depend on the relative concentrations of the species in the anode and cathode chambers. Note also that, in general, the anode and cathode pressures may be different which will influence the rate of diffusion across the membrane.
The net inflow rate, ν 1 , is the sum of the flow of hydrogen needed to support the cell current and the flux of the inert species out of the cell and is given by
ν 1 = ν   0 + ν d + ν H
where ν H is the volumetric flow of hydrogen required to sustain the current flowing in the cell.
In general, it can be expected that when air flowing at a fairly high stoichiometry is used as the oxidant, the mole fraction, x i , c , of species i in the cathode, will be constant allowing Equation (5) to be rewritten in the form
P a n o d e V A R T   d x i , a d t = P 0 R T 0 { ( ν 1 x i , 0 + P c a t h o d e ν d x i , c ) ( ν 0 x i , a + P a n o d e ν d x i , a ) }
Under constant current conditions so that ν H is constant, Equation (7) has the general form
d x i , a d t = a b x i , a
Equation (8) is identical in form to that obtained in the chemical kinetics of first order reactions, and the solution is well known [24]. This methodology has not, however, been used previously to model species accumulation in a recirculated PEFC. Following [24], the time dependence for the accumulation of inert species, i, can be obtained by separating variables and integrating Equation (8).
Rearranging Equation (8) we obtain
d x i , a a b x i , a = d t
for which integration gives
1 b l n a b x i , a = t + C
or
l n a b x i , a = b t + C
But for t = 0 ,   x i , a = 0 thus C = −ln(a) which yields
l n a a b x i , a = b t
and   hence   x i , a = a b ( 1 e b t )
Equation (13) shows that x i , a increases exponentially until a maximum is achieved for large t when x i , a   = a/b. For large t, equilibrium is reached when the quantity of inert flowing into the anode chamber, ν i n , is balanced by the leakage out, ν o u t . That is when ν o u t x i , a = ν i n x i , 0 . Note also that, for very small t,
e b t 1 b t +
showing that the initial slope is a, the same as the no leakage case discussed below.
When there is no leakage or diffusion, b = 0 and Equation (8) becomes
d x i d t = a
which has solution
x i = a t + C = a t
here, C = 0 when t = 0 since it is assumed that pure hydrogen is flowing for t < 0 and thus the accumulation will be linear with slope a.
During the purge period, a volume of fresh fuel, V p , flows into the anode chamber and mixes with that in the anode chamber. Assuming perfect mixing and ignoring the small amount of inert in the fuel stream, the final concentration of the inert species after purge will be,
c f i n a l = c i n i t i a l V p V A
This shows that the purge volume can be determined from the drop in impurity concentration following purging.
Accumulation calculations were made using Scilab© to solve the equations. A flow chart showing the computational procedure used to follow the accumulation of the inert species with time in a system with periodic purge is given in Supplementary Figure S4. Calculations were made using an iMac and typically took less than 2 min to complete.
An example of the effect of the magnitude of the leakage (transport) out of the anode chamber on the shape of the accumulation curves is shown in Figure 3. Note the transition from essentially linear accumulation (when ν o u t = 0.137 cm3·s−1) to exponential accumulation (when ν o u t = 1.37 cm3·s−1). When there is minor increase in impurity concentration during the period between purge cycles the accumulation is essentially linear whereas when there is a large increase the accumulation is exponential because of the increased rate of transport of the inert species out of the anode chamber as the concentration increases. The black curves in Figure 3 show the accumulation results for the system with a continuous bleed equivalent to the purge case (i.e., with the same amount of gas being lost over the same time period).

3. Results and Discussion

In this section we examine the accumulation of inert species in the anode chamber of a recirculated PEFC in the specific cases that (a) there is no loss from the anode chamber between purge periods and (b) there is physical leakage out of the anode chamber as well as diffusion of the species through the membrane between purge periods. With diffusion, the direction of flow of the species will depend on whether the concentration is higher in the anode or cathode compartments. In both cases, available experimental data are used to validate the modeling results.
The novelty in the results we present lies in the fact that the model, though simple, gives results for the accumulation of inert species in a recirculated PEFC that are in general agreement with experiment. The results clearly demonstrate the important role that diffusion of species both into and out of the anode chamber plays in the accumulation process. This information is needed to properly control system purging to avoid performance degradation yet still maintain high fuel utilization.

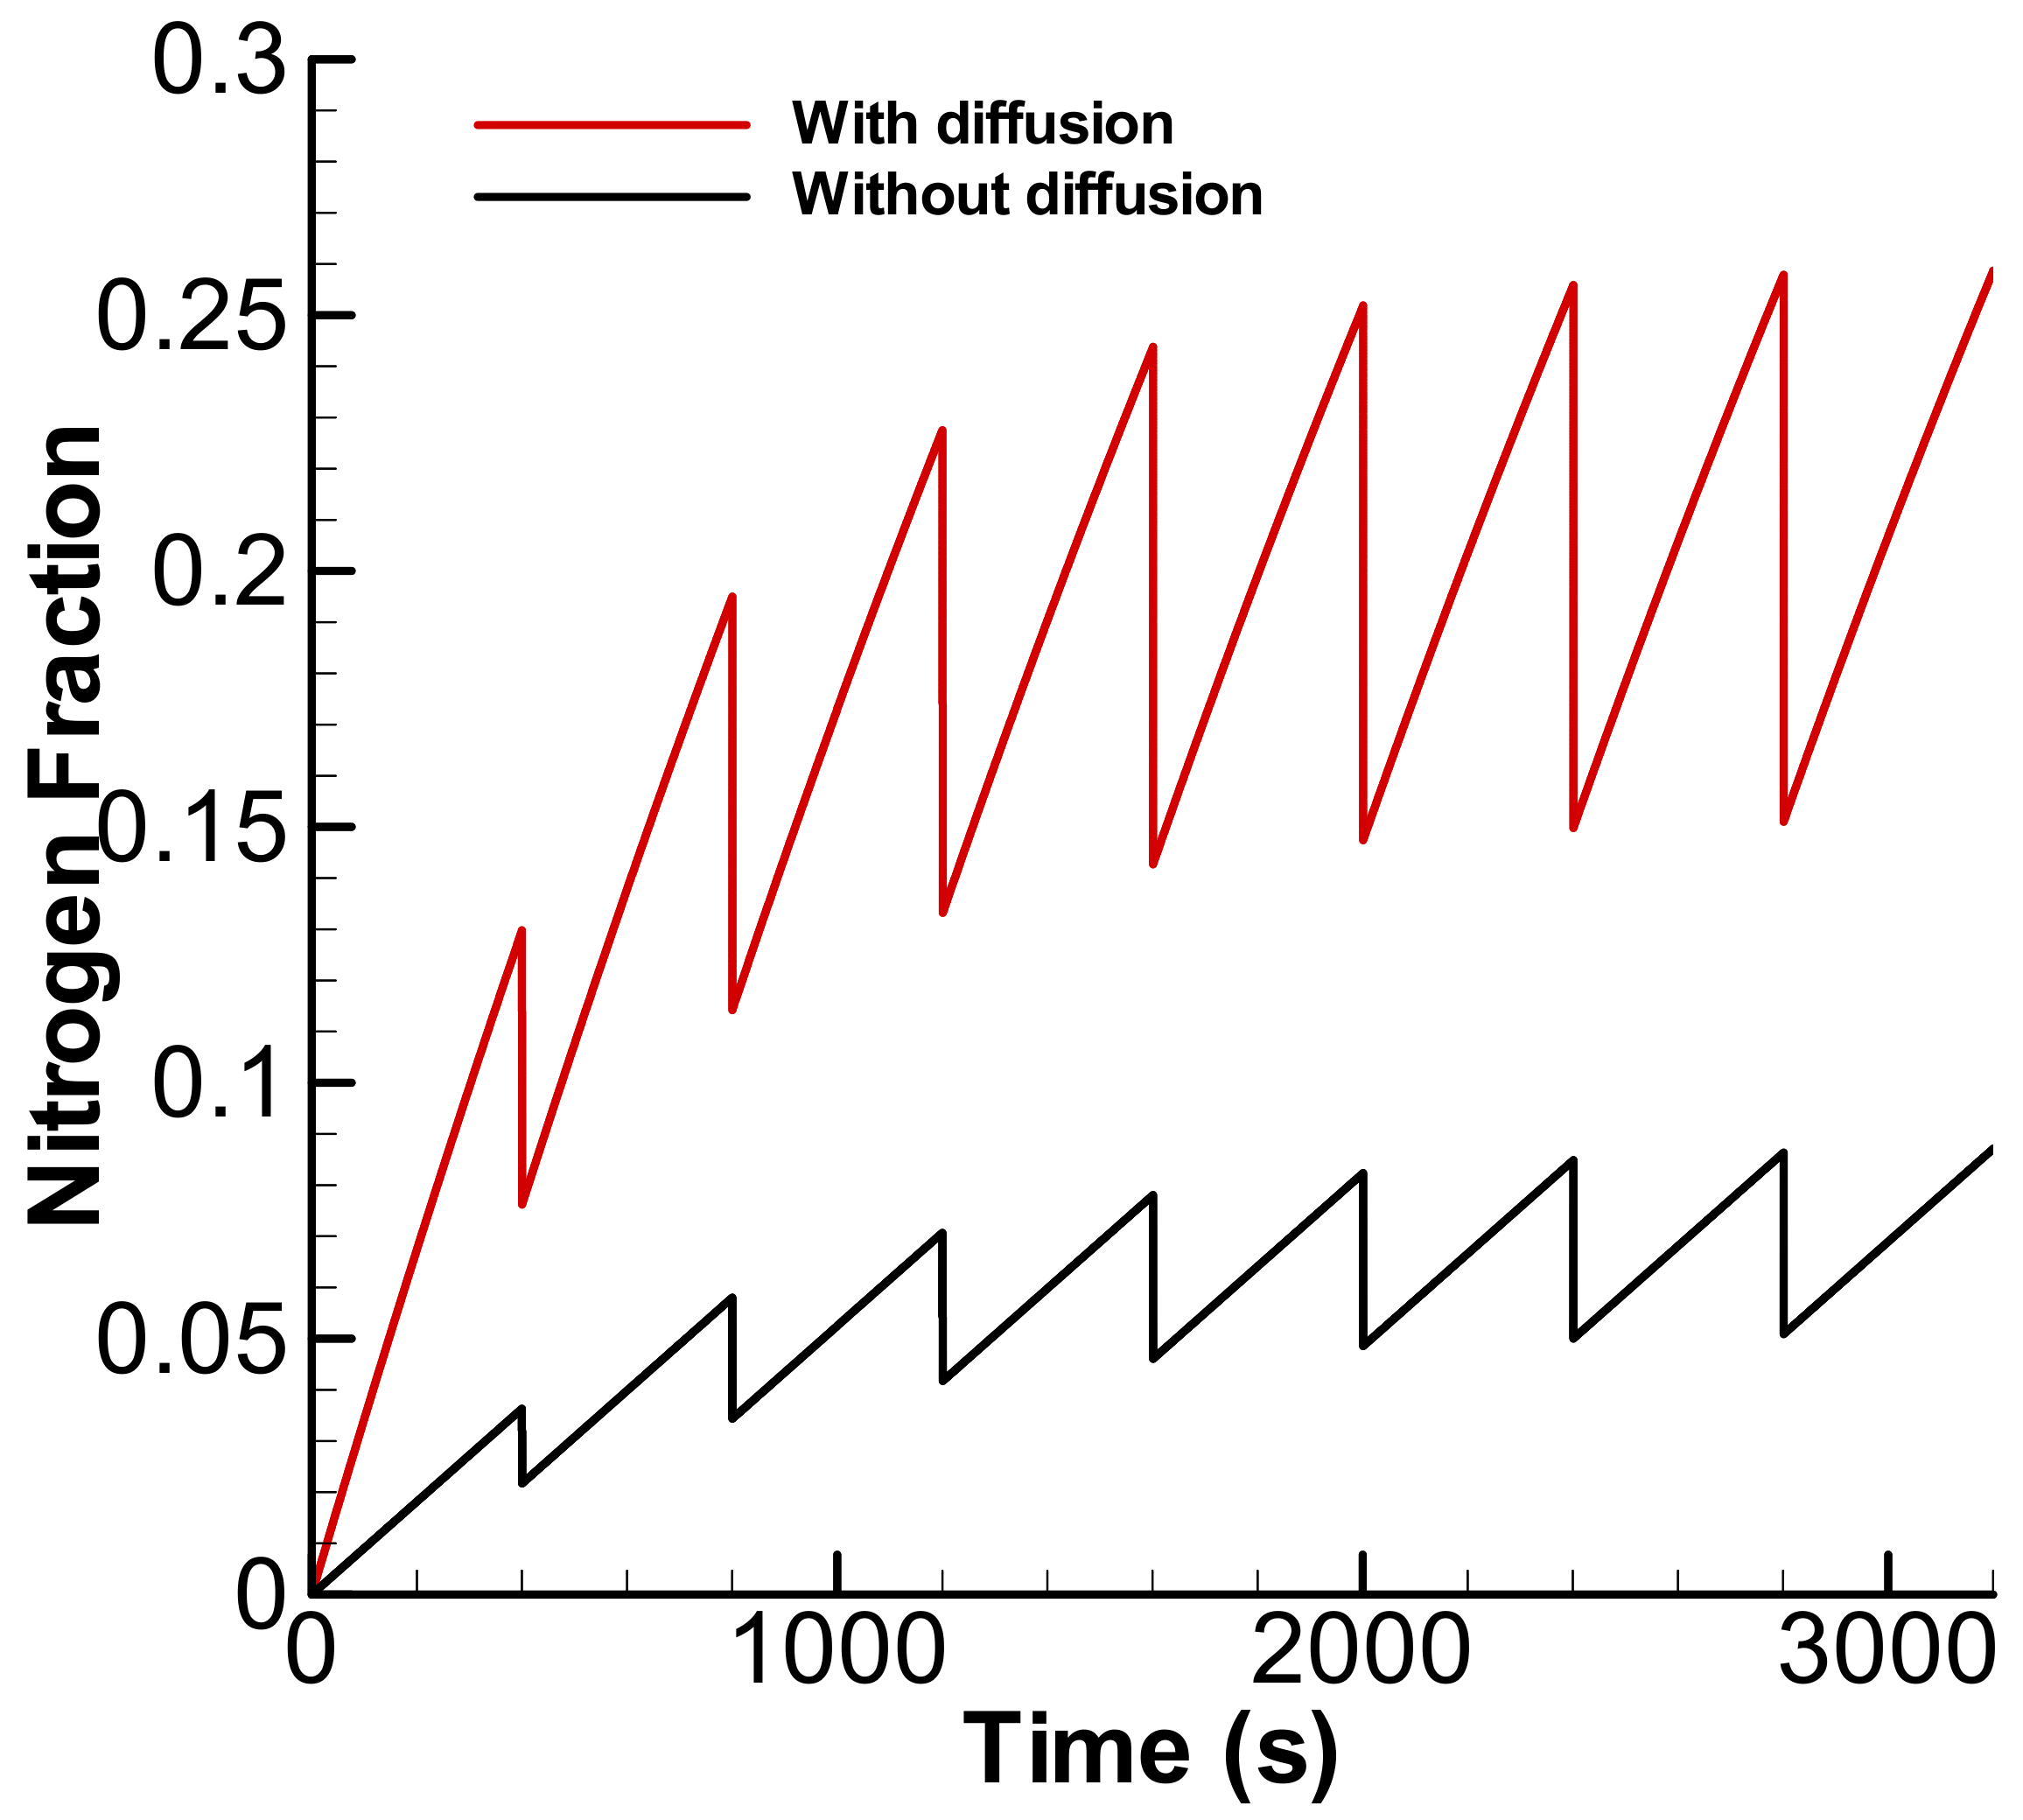
3.1. Linear Accumulation—No Significant Loss from the Anode Chamber

When the loss of the inert species is very low, we assume that ν o u t = ν 0 + ν d = 0 , (i.e., there is no leakage of inert out of the anode chamber), and Equation (7) becomes:
P a n o d e V A R T   d x i , a d t = P 0 ν H R T 0 x i , 0
which gives
x i = T P 0 ν H x i , 0 T 0 P a n o d e V A t
showing that x i should increase linearly with slope m = T P 0 ν H x i , 0 T 0 P a n o d e V A . This shows that the slope is directly proportional to hydrogen flow (hence current) and impurity concentration and inversely proportional to system volume.
An example of the accumulation of a generic inert species is shown in Figure 4a. The conditions chosen approximate the conditions used by Koski et al. [11] in their accumulation experiments. The black curves correspond to an equivalent continuous bleed rather than periodic purge. An expanded portion of the last 400 s segment is shown in Figure 4b. Note that, as expected, all segments have a common slope in agreement with the findings of Koski et al. [11]. The small time shift between the curves reflects the difference in the number of 0.2 s purge cycles as the purge frequency is decreased.
Using this model, we can make a comparison of the modeled data with data extracted from the paper by Koski et al. [11] for the accumulation of methane where the rate of permeation is known to be low [10]. There is some discrepancy between the data given for the purge volume (0.2 L) and their later discussion of gas exchange fraction (Table 7 in the paper by Koski et al.’s [11]) where they estimate it at 50%. As discussed in Section 2, the volume of gas purged can be estimated from the drop in concentration following purge. These data show that the purge volume must be close to 50% to obtain their experimental results; hence, we have used this value. If we use the total volume of the plumbing of the recirculation system (705 cm3) and take other parameters as given in Table 1, the slope of the linear curve (dashed blue curve) is smaller than that observed experimentally. A better fit is obtained if just the volume of the recirculation loop (564 cm3) is used. A comparison of the modeled accumulation data with the experimental data of Koski et al. [11] during the 100 s, 200 s, and 400 s accumulation periods are shown in Figure 5.

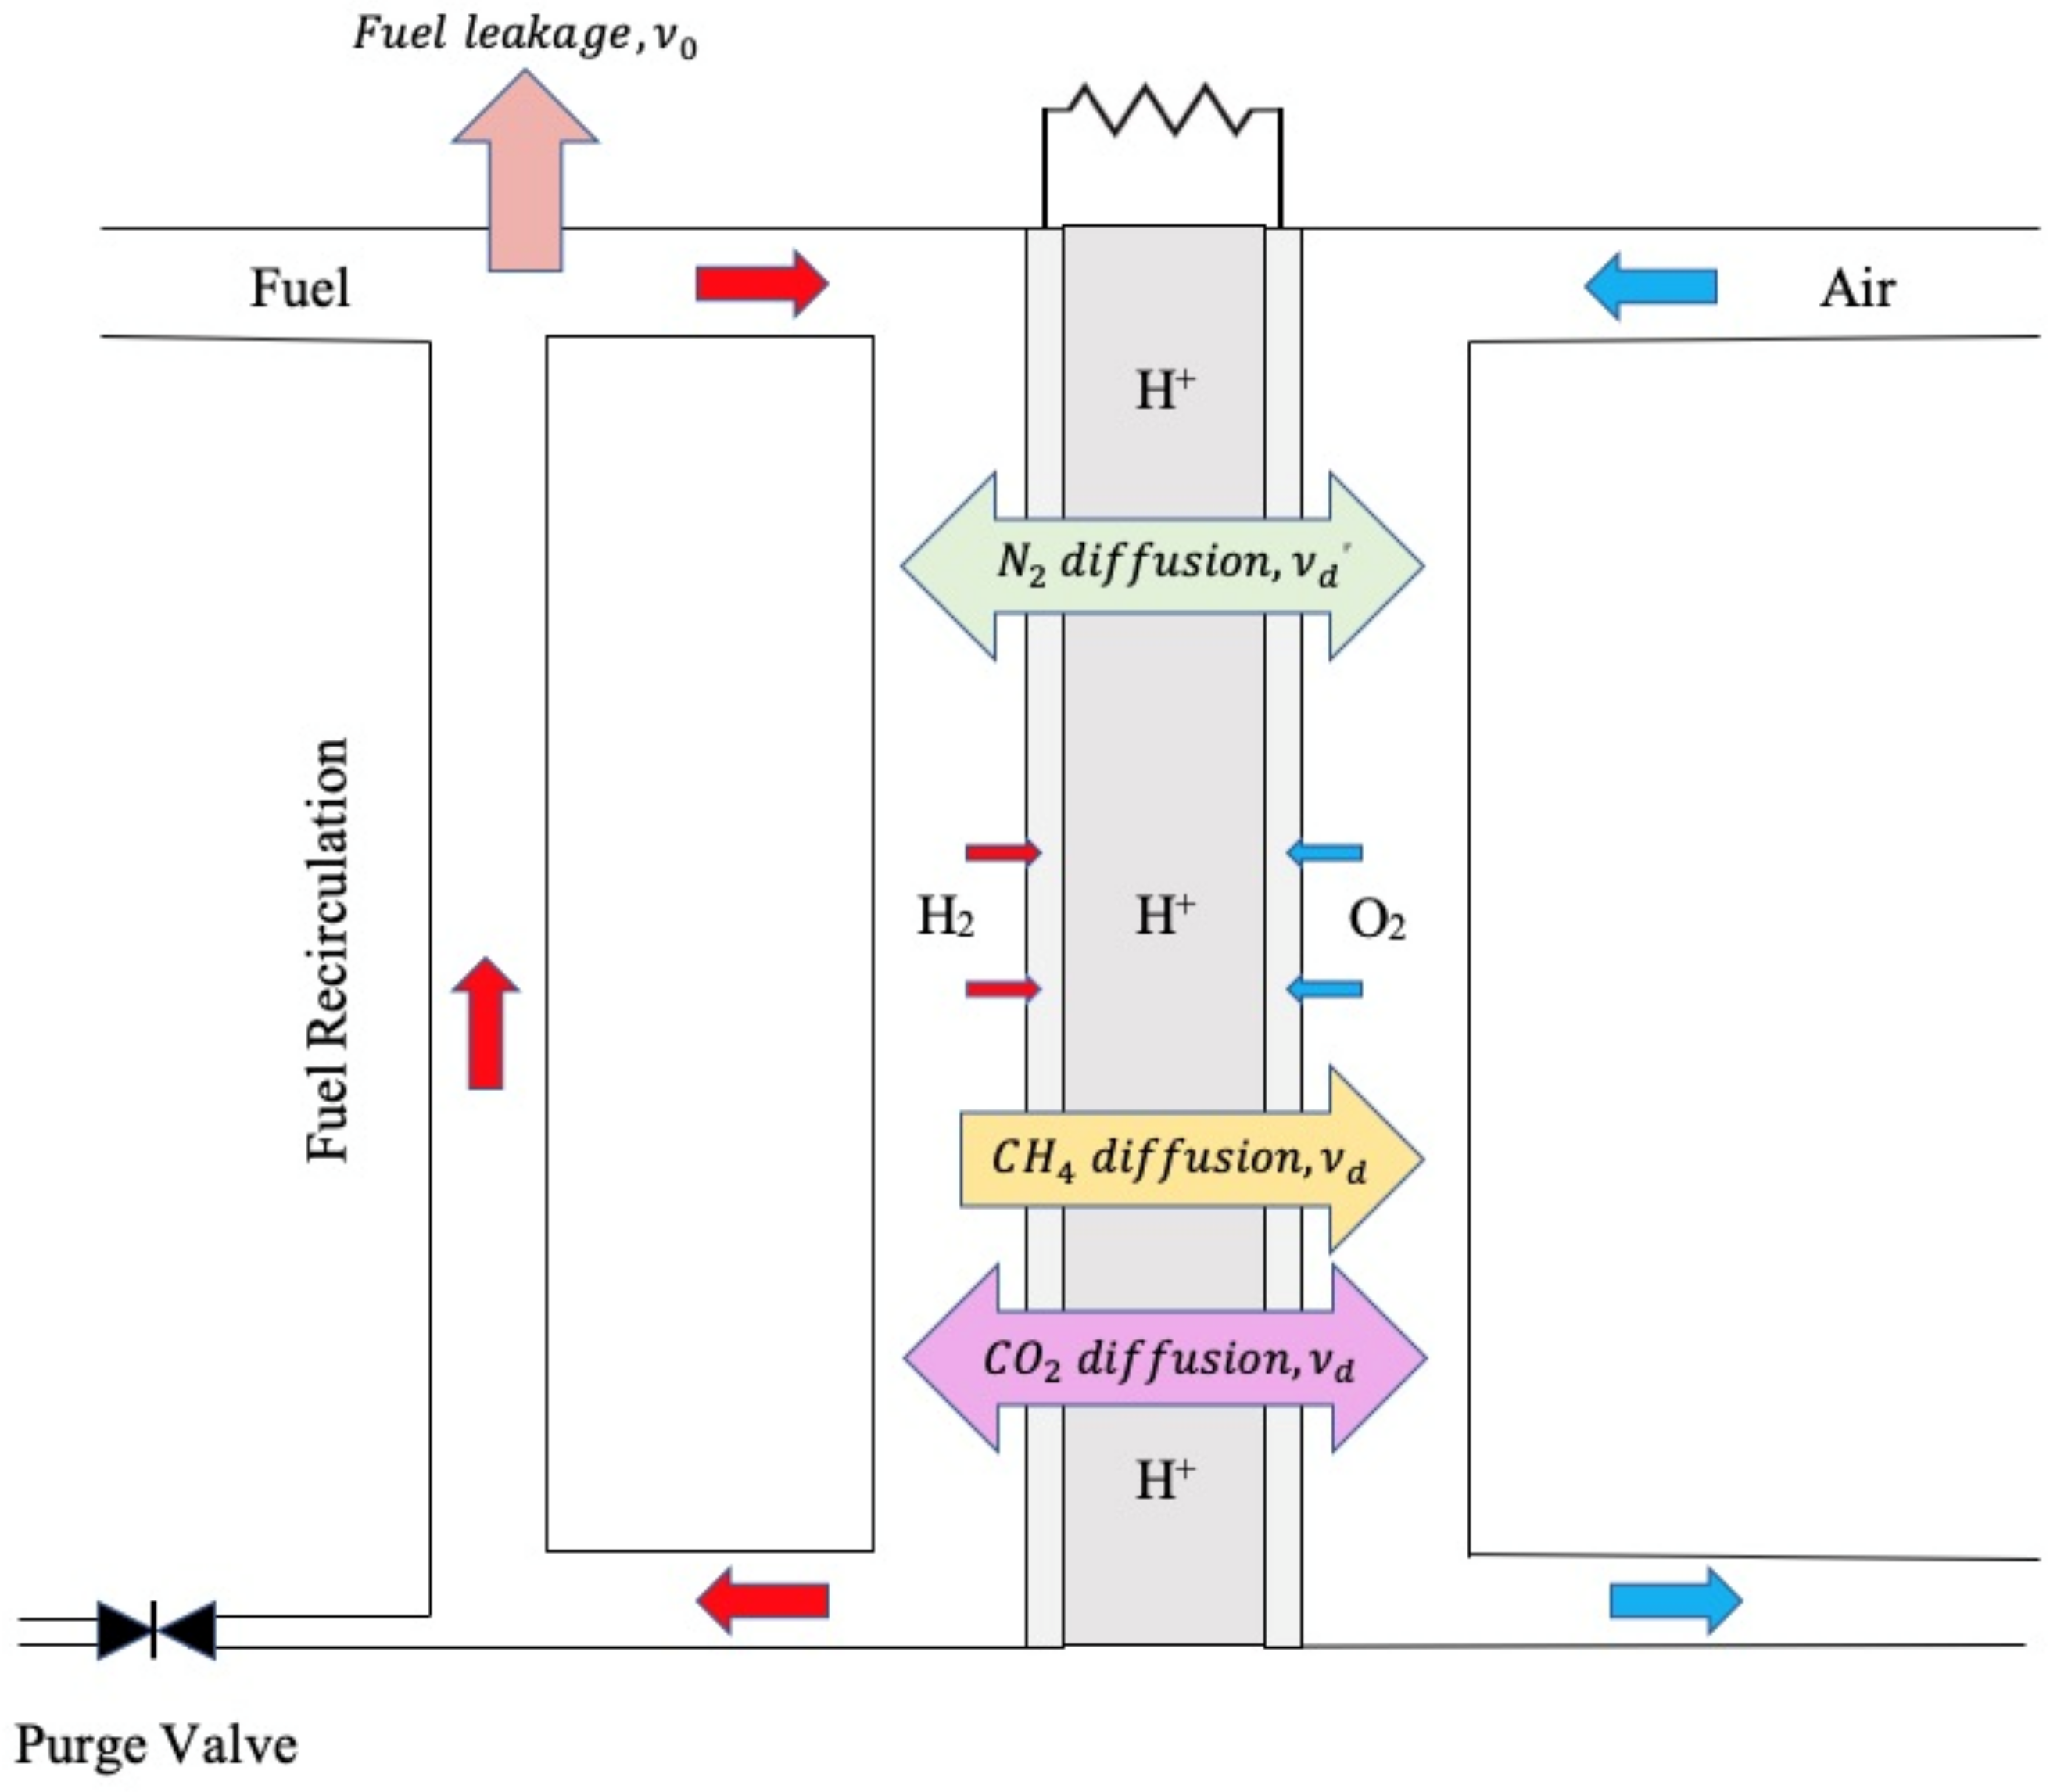
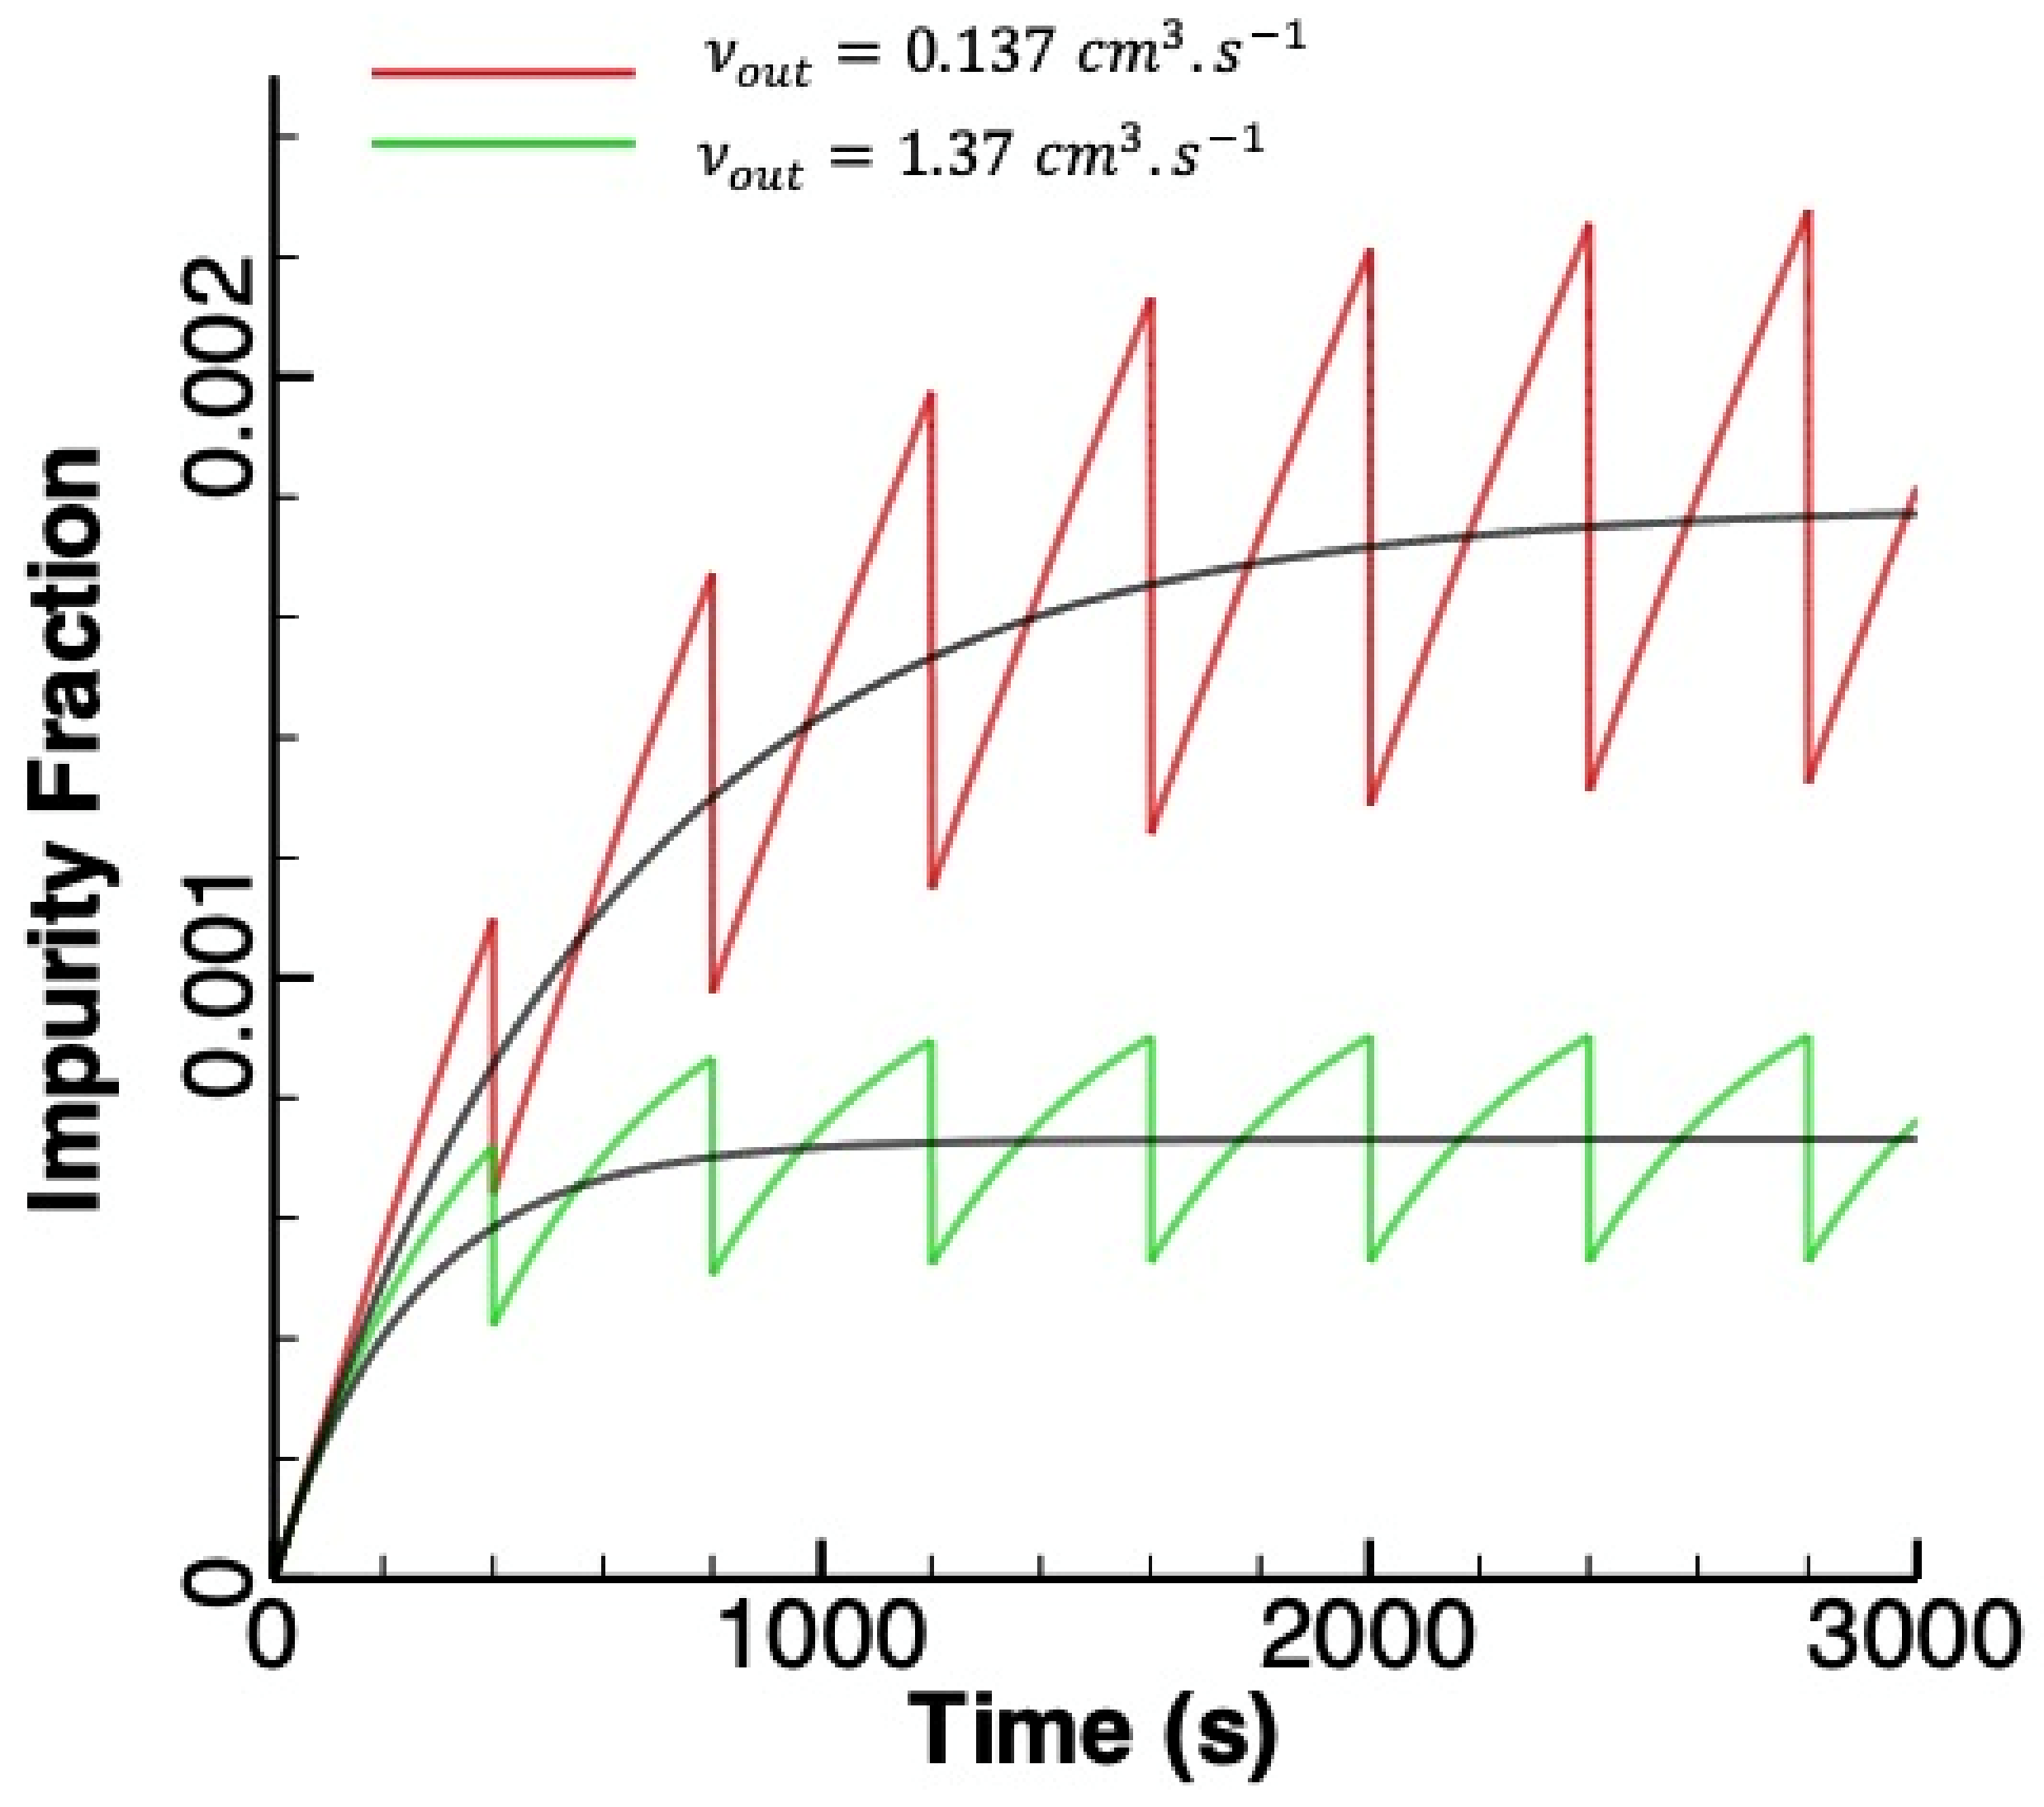
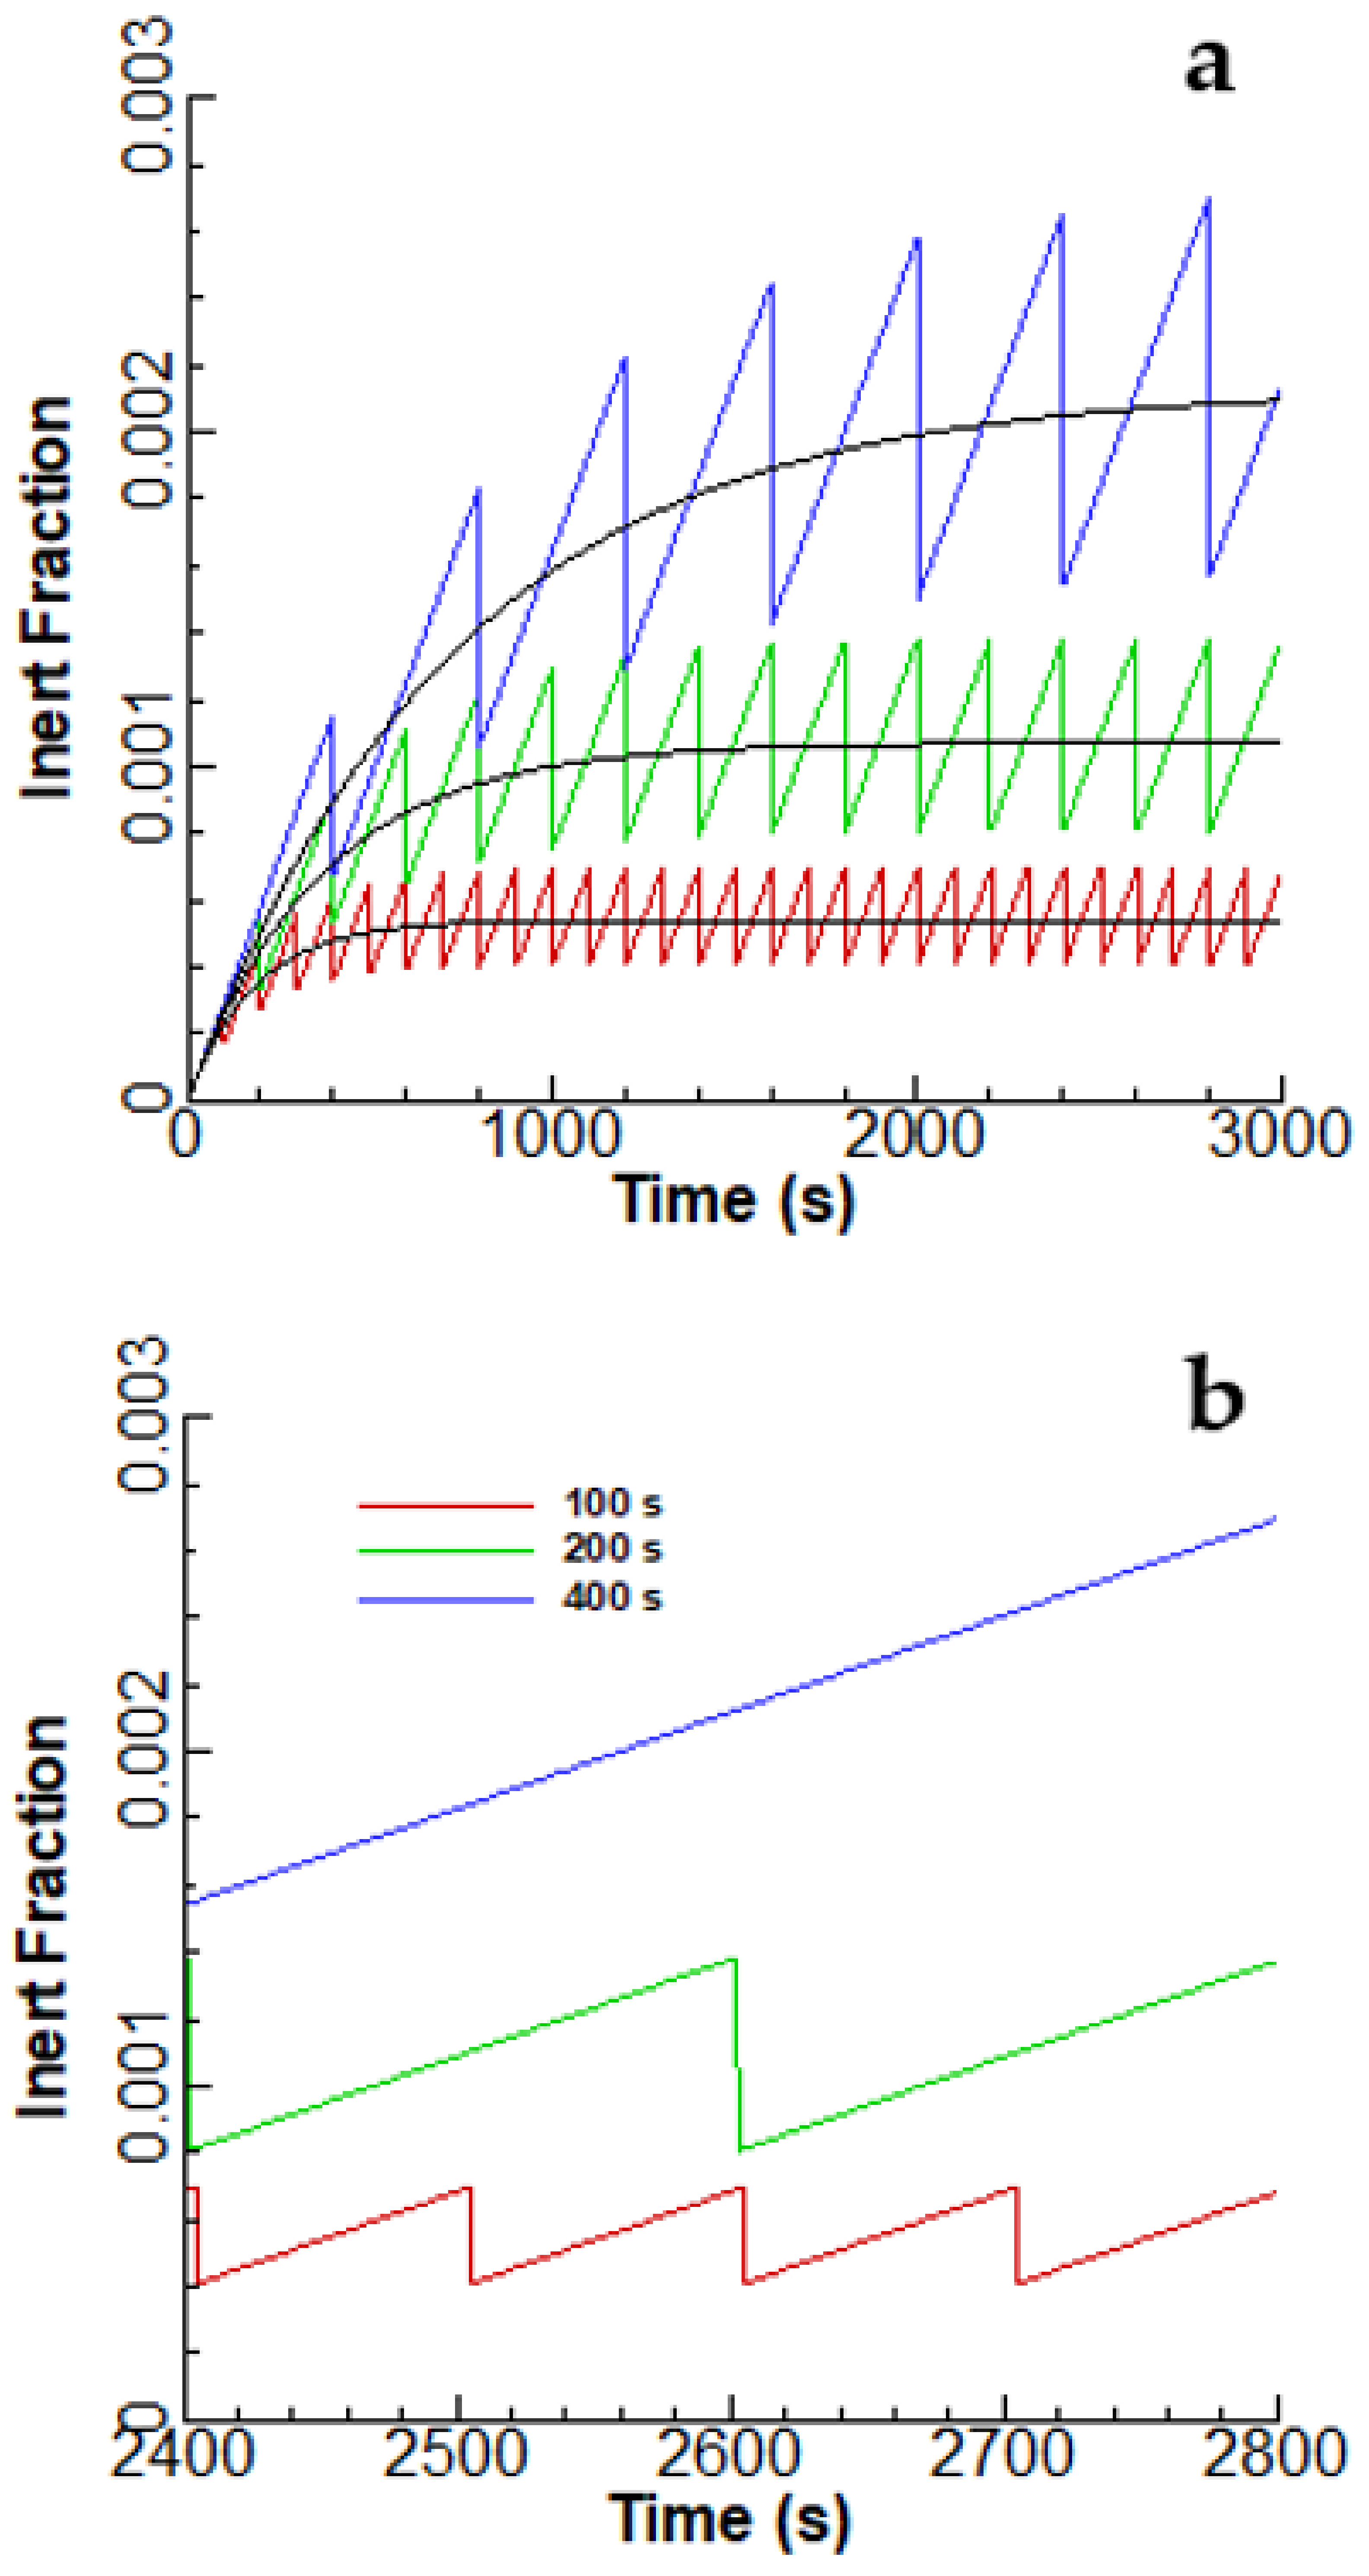
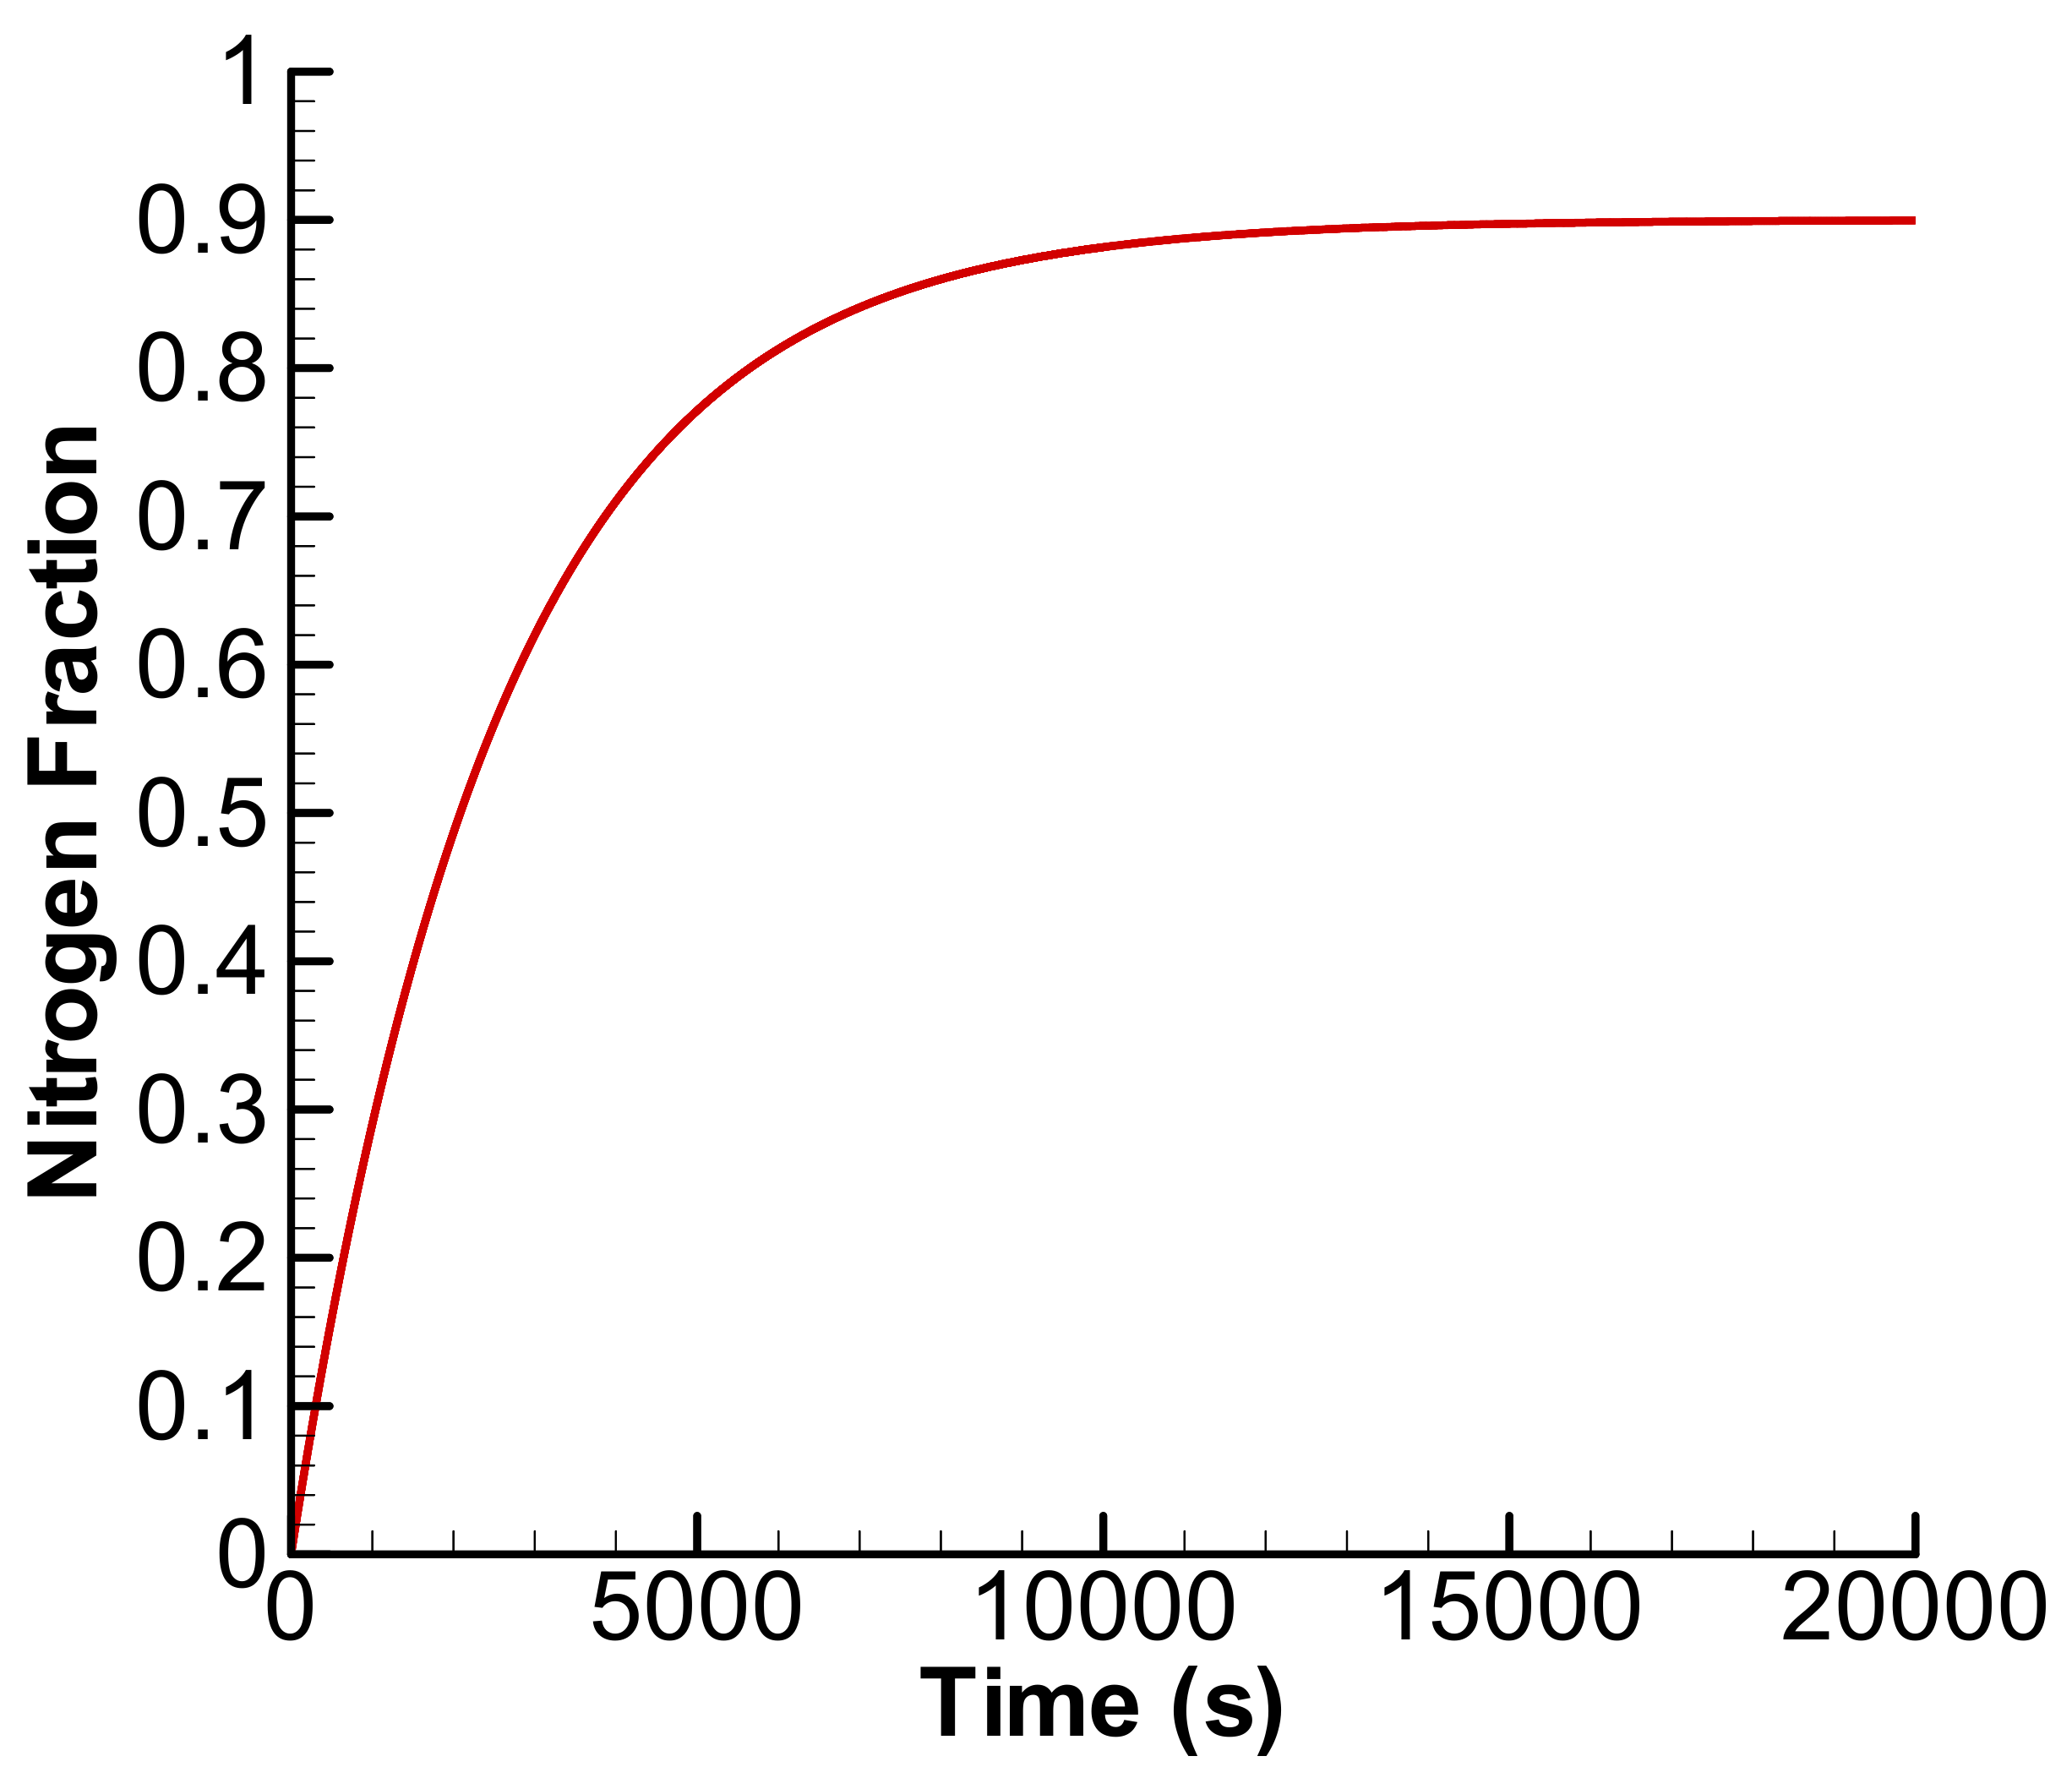
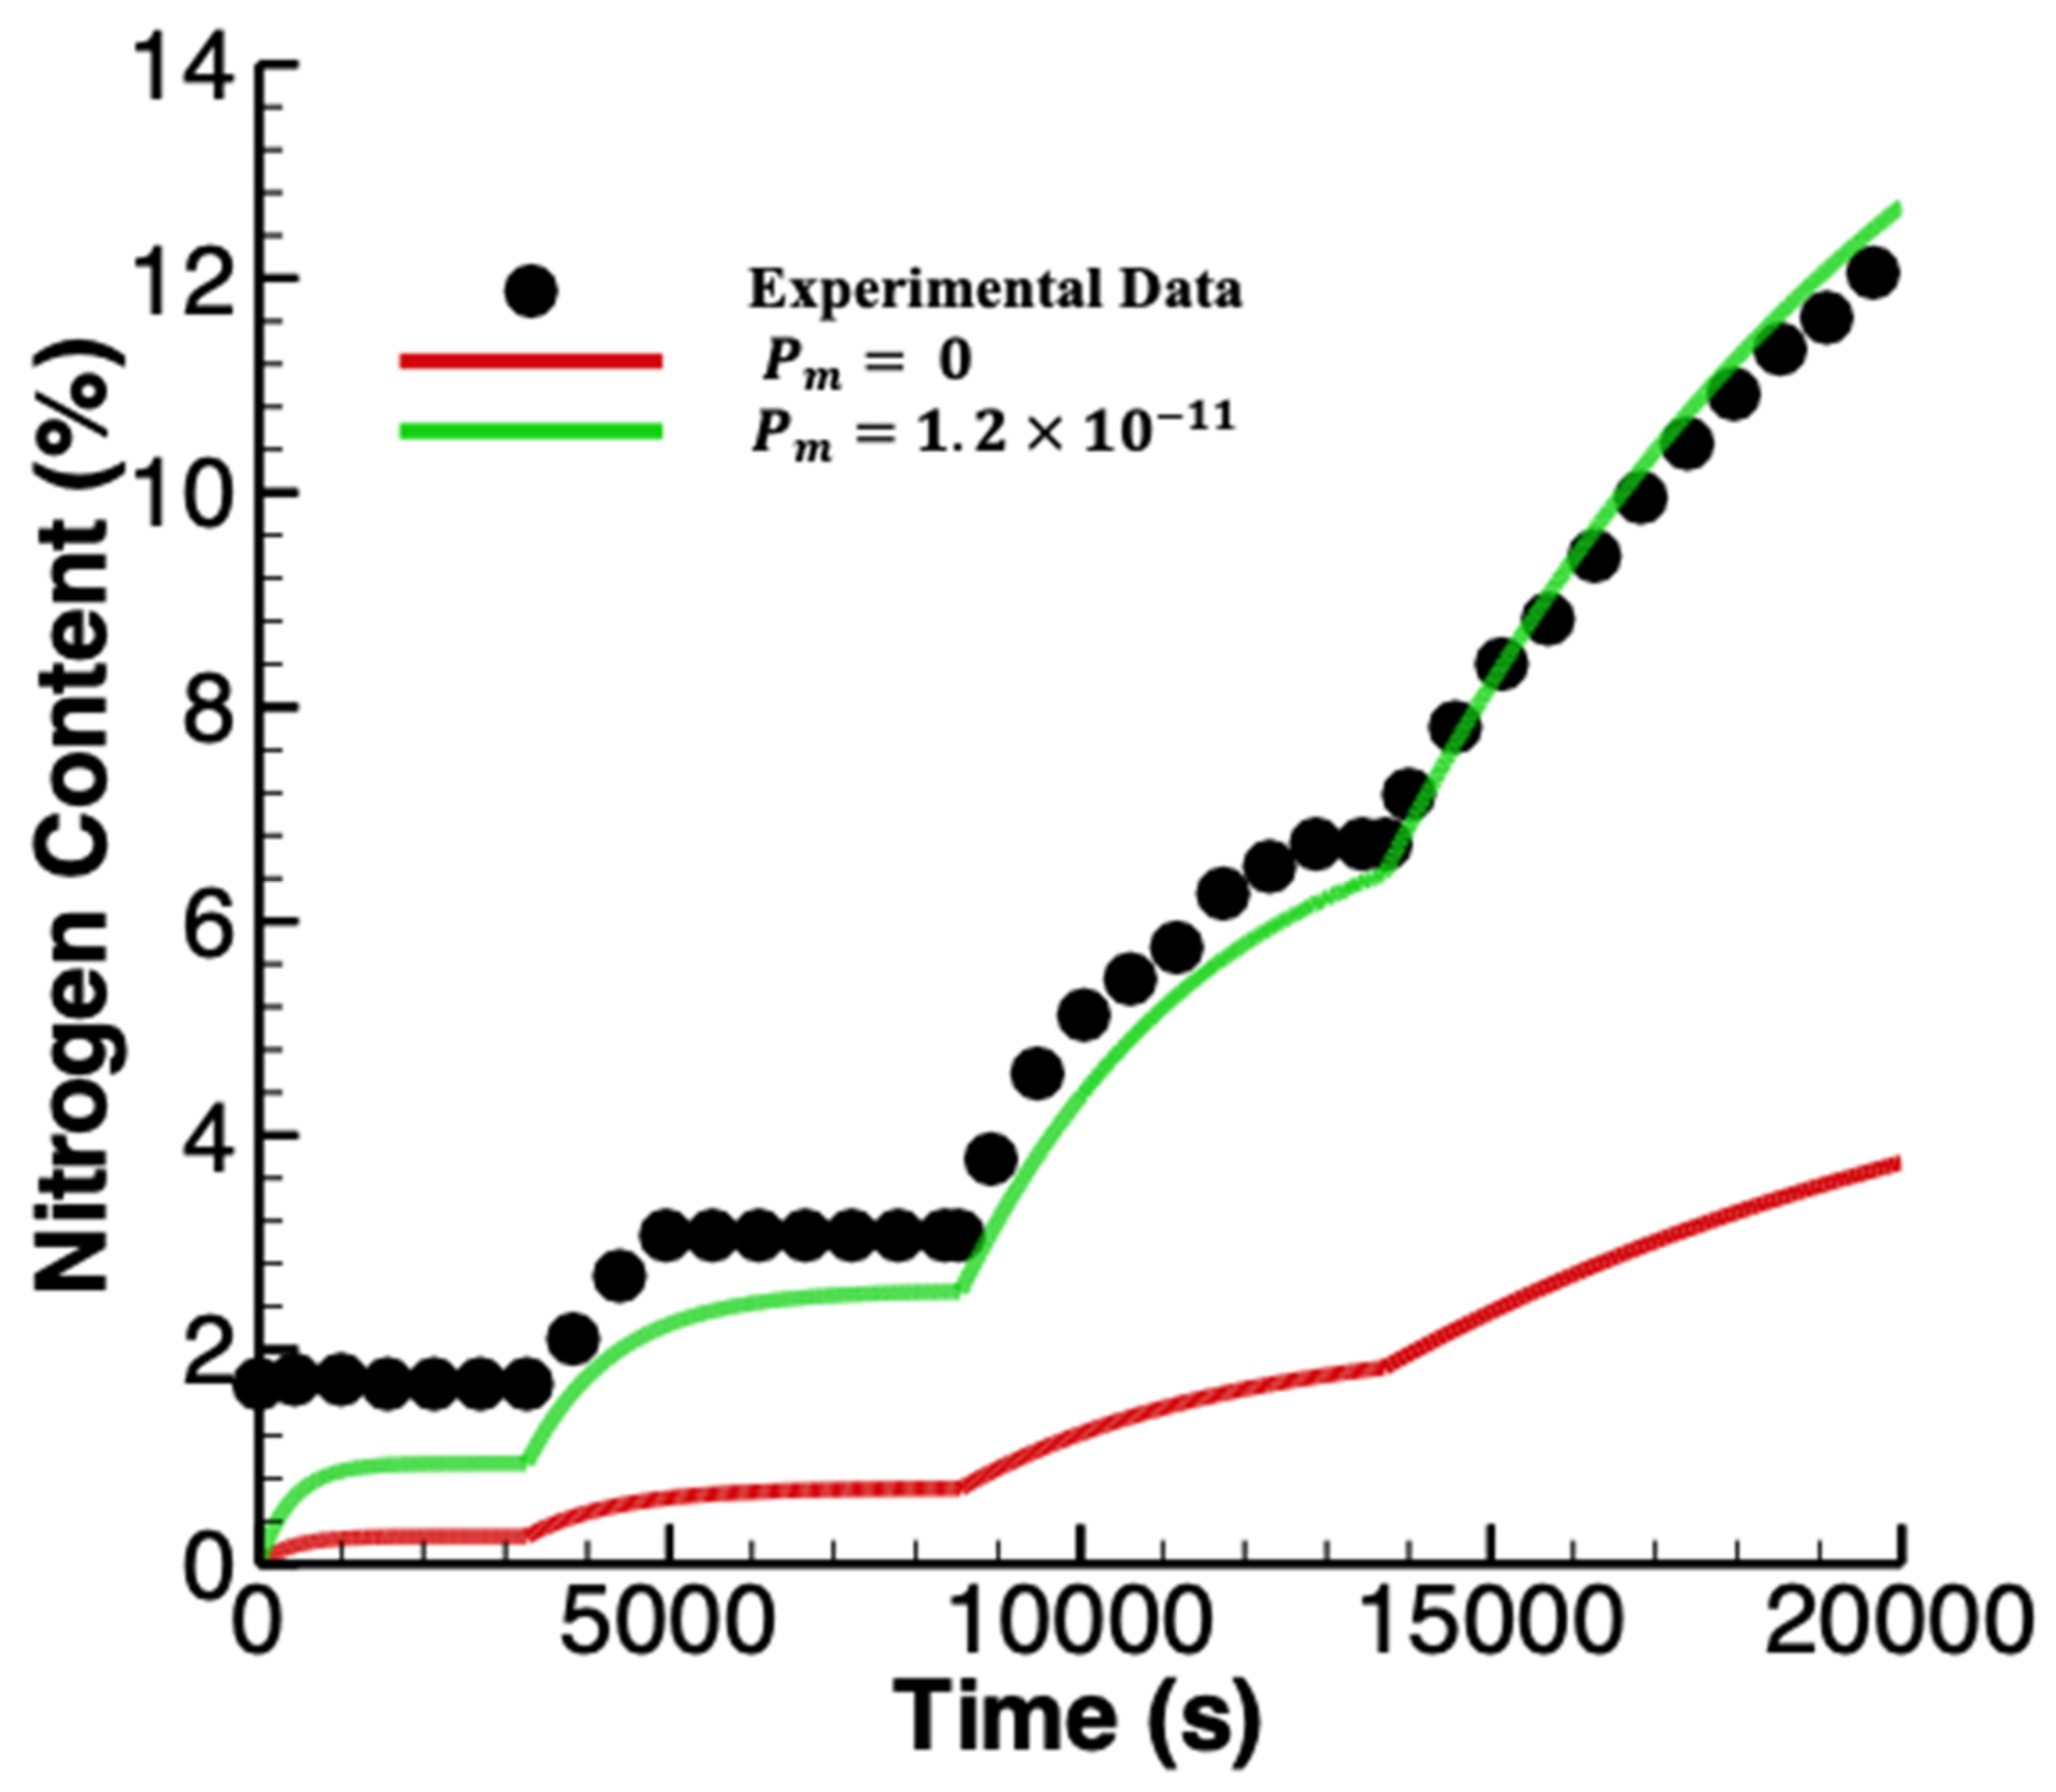
3.2. Exponential Accumulation—Diffusion through the Membrane

When there is diffusion of an inert species into or out of the anode chamber by diffusion through the membrane, we can write
d x i , a d t = P 0 T P a n o d e V A T 0 { ( ν 1 x i , 0 + P c a t h o d e ν d x i , c ) ( ν 0 x i , a + P a n o d e ν d x i , a ) }
As discussed earlier, from this equation the direction of flow of species i through the membrane will depend on the relative concentrations of the species in the anode and cathode chambers. The accumulation of nitrogen in the anode chamber is of particular concern for recirculated PEFCs operating on air. Nitrogen can enter the anode chamber both as an impurity in the fuel and by diffusion through the membrane from the cathode where the mole fraction of nitrogen is high (~0.78). From Equation (20) it is seen that there will be a net flow of nitrogen into the anode chamber by diffusion from the cathode until the nitrogen concentrations in the anode and cathode chambers are the same. Once the nitrogen concentration at the anode exceeds that in the cathode, nitrogen will then diffuse out of the anode back to the cathode and the nitrogen fraction will rise until the amount of nitrogen flowing into the cell with the fuel is balanced by that flowing out. This behavior can be seen in Figure 6 which shows the results for accumulation without any purge, unlike the experiments of Koski et al. [11] where a purge cycle was initiated every few hundred seconds. In this case, as illustrated in Figure 7, pseudo-steady state conditions are reached after about 10 purge cycles and the nitrogen fraction in the anode chamber is maintained at a much lower value. Note that, in the time frame of the accumulation data collected by Koski et al. [11] (100–400 s), this portion of the curve is essentially linear as observed in their experiments. In spite of the N2 concentration in the fuel being 350 ppm, Figure 7 shows that nitrogen diffusion from the cathode is the major contributor to nitrogen accumulation. This figure shows results both with and without allowance for nitrogen diffusion, keeping the fuel concentration constant.
Using this model, we can make a comparison of the modeled data with extracted experimental data from Koski et al. [11] for the accumulation of N2 in the anode chamber as a result of diffusion through the membrane from the cathode. In making this calculation, we assume that there is air in the cathode chamber at a pressure of 1 atm and that the N2 fraction is approximately 0.78. A reasonable fit to Koski’s data is shown in Figure 8. To obtain this fit a value for N2 permeability of ( 6.6 ± 0.2 ) × 10−12 mol·cm−1·s−1.atm was used. This is in reasonable agreement with the values given by Mittelstaedt and Umbrell [25].
The state of hydration of the membrane is also expected to influence how nitrogen accumulates in the recirculation loop. Mittelstaedt and Umbrell [25] have shown that the permeation of gases through the membrane can be divided into two parts—transport through the polymer and transport through the water phase. These authors have measured nitrogen permeability in Nafion 112 as a function of relative humidity and temperature. Using their data for the permeability of nitrogen at 80 °C, Figure 9 shows how the accumulation of nitrogen, calculated after stabilization, is expected to be influenced by membrane hydration under the same conditions as in Figure 8. The figures show that the degree of hydration of the membrane will have a significant effect on how nitrogen accumulates and thus needs to be understood to optimize the purge process. At 20% relative humidity, for example, it is seen that the nitrogen concentration reached under these conditions is only about 50% of that at 100% humidity.
A comparison can also be made to the measured data of Koski et al. [10] for the accumulation of N2 in a recirculated anode system with small continuous bleed. The results from this comparison are shown in Figure 10. It is seen that a reasonable fit is obtained using a permeability of 1.2 × 10⁻¹¹ mol·cm−1·s−1.atm for nitrogen which is somewhat higher than the value as used in Figure 8. A possible explanation for this is that the membrane humidity was higher in this experiment. Of particular note is the large impact that nitrogen diffusion has on the amount that accumulates in the anode chamber. In this figure, the green curve shows the amount of nitrogen expected to accumulate just considering the 350 ppm N2 that is in the fuel supply and no diffusion whereas the black curve allows for both nitrogen in the fuel and diffusion of nitrogen through the membrane. It is seen that nitrogen diffusion increases the amount that accumulates by about 300%. Within the anode chamber, nitrogen acts primarily as a hydrogen diluent that requires periodic or continuous purge to avoid adverse impact on fuel cell performance.
Ahluwalia and Wang [13] have shown that, with pure hydrogen fuel, there is a 10–18 mV decrease in cell voltage when the nitrogen concentration increases to 25–60%. As pointed out by Ahluwalia and Wang [13], the amount of nitrogen that diffuses through the membrane is so large that there is little incentive to put stringent limits on the amount of nitrogen and other inerts in the fuel. While the results of Ahluwalia and Wang [13] show that the effect of fuel dilution on the anode potential is relatively small and roughly in line with that predicted from the Nernst equation, fuel dilution can be expected to have a major effect on the operation of a recirculated system—in particular, it is necessary to ensure that the recirculation rate is high enough to deliver the hydrogen needed to support the hydrogen oxidation reaction. As an example, in the experiments carried out by Koski et al. [11], the recirculation rate was roughly double (15 L/min) the hydrogen consumption rate (8.1 L/min). As fuel dilution increases, failure to increase the recirculation rate could be expected to result in fuel starvation over part of the anode which could result in carbon corrosion [3,4]. For 90% nitrogen dilution, the recirculation rate would need to increase to more than 80 L/min to avoid fuel starvation. From this example, proper account of the amount of nitrogen both in the fuel stream and by crossover from the cathode is needed to properly adjust system parameters such as purge rate and recirculation rate to maintain good system performance.
While the effect of fuel dilution by nitrogen on the anode overpotential may be relatively small, the same is not true however if the fuel also contains other impurities, such as CO, which adsorb strongly on the platinum catalyst and significantly reduce the catalyst surface that is available for hydrogen oxidation. Several studies [16,26,27] have shown that fuel dilution causes a significant decrease in cell voltage when the fuel contains CO. As explained by Bhatia and Wang [16], the presence of 10 ppm CO in hydrogen reduces the hydrogen coverage on the anode by an order of magnitude resulting in significant kinetic losses at the anode. Fuel dilution further decreases hydrogen coverage and makes the situation worse. Their results show that the poisoning from a fuel stream containing 10 ppm CO but with only 40% hydrogen content is equivalent to that of a hydrogen stream containing 100 ppm CO. The impact of fuel dilution on the performance of a PEFC using anode recirculation clearly needs to be considered when the fuel contains even low levels of CO in order to optimize purge times and volumes as well as the choice of the CO mitigation strategy [15,28] used including operating conditions such as pulse frequency and/or air bleed rate.
Another contaminant of interest is CO2. As is well known from concerns of global warming, atmospheric CO2 levels have now reached about 409 ppm. CO2 is also a common impurity in hydrogen produced by reforming hydrocarbons. Because of the high solubility of CO2 in the membrane water phase, the permeability of CO2 through Nafion is high [29]—about an order of magnitude higher than that of nitrogen, for example. Using the present analytical model, we can make a similar comparison of the modeled data with extracted data [11] for the accumulation of CO2 as was previously completed for nitrogen. A reasonable fit to the data is shown in Figure 11. An exponentially increasing concentration trend is observed, which demonstrates the impact of diffusive CO2 transport across the membrane, in this case from the anode to the cathode. A fit to the experimental data gives a value for the CO2 permeability of 5.1 ± 0.2 × 10 11 mol·cm−1·s−1.atm. From the data reported by Ren et al. [29], we can obtain a permeability value of 7.03 × 10⁻¹⁰ mol·cm−1·s−1.atm at 80 °C and 75% relative humidity, which is in reasonable agreement with the value used in Figure 11. Due to the high solubility of CO2 in the membrane water phase, the permeability is strongly dependent on humidification. As the humidity level drops, the permeability decreases substantially and it should be noted that the experiment reported by Koski et al. [11] used dry gas at the anode. It may also be expected that water transport from the cathode to the anode will inhibit CO2 diffusion in the opposite direction. All in all, it appears that the assumed permeability of 5.1 × 10⁻¹¹ mol·cm−1·s−1.atm is reasonable in terms of the known physical parameters.
The present model can also be used to examine the effect that diffusion of CO2 has on accumulation based on the results that Koski et al. [10] obtained with a recirculated single cell PEFC with a small continuous anode bleed. In these measurements, the system was stabilized at a bleed rate of 0.156 of the hydrogen used to generate current. The amount of fuel bled out of the anode chamber was then systematically reduced in three steps, while measuring the CO2 concentration in the recirculation loop. In our previous work [15], it was demonstrated that the experimental enrichment ratios were higher than the modeled results for the two lower bleed rates, indicating that the actual bleed rates were slightly smaller than the experimental set points used by Koski et al. In their paper, Koski et al. [10] point out that error in the mass flow controller causes the realized stoichiometry to differ from the set point. At a bleed rate of 0.014, they estimated this error to be ±2.2 mL/min. To account for this in our calculations, the bleed rate was adjusted based on their methane data where diffusion is known to be small. Next, the membrane CO2 permeability was estimated by obtaining a best fit to their experimental CO2 accumulation data. The results of this fit are shown in Figure 12. These curves demonstrate the significant effect that loss of CO2 from the anode chamber has on the amount of CO2 that is accumulated in the anode chamber. CO2 diffusion reduces the CO2 concentration in the recirculation chamber to about 60% of the value that would have been obtained in the absence of diffusion through the membrane. In the case of fuel dilution by CO2 impurity, membrane crossover is therefore favorable for fuel cell operation. It should be noted that the presence of CO2 at the anode can also be detrimental since the electroreduction of CO2 on Pt can produce small amounts of CO which can cause significant performance degradation [30] in recirculated automotive fuel cells.
Overall, we estimate the uncertainty in the modeled results to be on the order of ~20%. Major contributions to this uncertainty are the values used for permeability, which will vary with membrane humidity, and variations in membrane thickness and errors introduced by the assumption of perfect mixing within the recirculation loop. It should be noted, however, that similar levels of uncertainty (~20%) can be expected in experimental measurements. In a practical system, accurate control of purge volume is going to be difficult when, for example, a timed solenoid valve is used for purging. In general, there will also be uncertainty in the concentrations of inert species in the fuel supply. From these considerations, it is expected that the model we have presented should produce reasonable guidance in the selection of system parameters such as purge rate, purge volume, and recirculation rate.

4. Conclusions

A simple analytical model was developed that simulates the time dependence of the accumulation of inert species in a PEFC with anode recirculation and periodic purge. It was shown that, when there is either leakage out of the anode chamber or diffusion of the inert species through the fuel cell membrane, the inert species is expected to accumulate exponentially until equilibrium is reached when the amount of inert flowing into the cell either in the fuel supply or through diffusion is balanced by the amount flowing out by leakage and/or diffusion through the membrane. If the time between purge cycles is small compared with the time to reach equilibrium, the deviation from linearity will be minor and the accumulation will appear to be essentially linear over that time period. The model is generalized in order to be compatible with any inert gas phase impurity originating from the anode, cathode, cell reaction, or any combination thereof.
Results from the model were compared with recent experimental results reported by Koski et al. [10,11] for the accumulation of CH4, CO2, and N2 both in a single cell PEFC and in a 1 kW PEFC stack with anode recirculation and periodic purge. A good agreement was shown between the modeled and experimental results using the literature values for the permeation of the gases across the membrane. Modeling results showed that the nitrogen concentrations in the anode compartment can reach very high levels at high fuel utilizations when air is used as the oxidant. While voltage loss due to fuel dilution by nitrogen is not expected to be of major concern in a recirculated PEFC, careful control of system parameters including recirculation rate and purge cycle is expected to be needed to ensure delivery of sufficient hydrogen so that fuel starvation and cell degradation are avoided. Modeling results also show that significant levels of CO2 can accumulate in the anode chamber because of the relatively high concentration of CO2 in the atmosphere and a high diffusion rate for CO2 through the membrane. The presence of CO2 at the anode can result in the formation of small amounts of CO which, together with any CO present in the fuel supply, can result in poisoning of the anode catalyst and fuel cell performance degradation [22]. Furthermore, fuel dilution due to enrichment of inerts may also adversely affect CO tolerance in PEFCs.
Our results have shown that a proper account of the amount of nitrogen both in the fuel stream and that enters the anode chamber by crossover from the cathode is needed to properly adjust system parameters such as purge rate and recirculation rate to prevent fuel starvation and to maintain good system performance. It is the intention that the presently reported general analytical model can be used as a simple tool to optimize system design and operation in the presence of such impurities.

Supplementary Materials

The following supporting information can be downloaded at: https://www.mdpi.com/article/10.3390/en15061968/s1, Figure S1: Linear regression of the experimental N2 accumulation data of Koski et al. [11]; Figure S2: Fit to the experimental CO2 accumulation data of Koski et al. [10]; Figure S3: Comparison of experimental [10] and calculated enrichment of N2 in an anode recirculation loop for various permeability values. Conditions: XN2 = 350 ppm; P = 1 atm; V = 202 cm3; and I = 1 A/cm2; Figure S4: Flow Diagram of Program used for Accumulation Calculations.

Author Contributions

Conceptualization, C.L.G.; Methodology, C.L.G.; Software, C.L.G.; Validation, C.L.G. and P.J.S.; Formal analysis, P.J.S.; Investigation, C.L.G.; Resources, E.K.; Writing—original draft, C.L.G.; Writing—review and editing, E.K.; Supervision, E.K.; Project administration, E.K.; Funding acquisition, E.K. All authors have read and agreed to the published version of the manuscript.

Funding

This research was supported by the Natural Sciences and Engineering Research Council of Canada, Canada Foundation for Innovation, British Columbia Knowledge Development Fund, and Western Economic Diversification Canada. The research was undertaken, in part, thanks to funding from the Canada Research Chairs program.

Institutional Review Board Statement

Not applicable.

Informed Consent Statement

Not applicable.

Data Availability Statement

Not applicable.

Conflicts of Interest

The authors declare no conflict of interest.

References

  1. Kurnia, J.C.; Sasmito, A.P.; Shamim, T. Advances in proton exchange membrane fuel cell with dead-end anode operation: A review. Appl. Energy. 2019, 252, 113416. [Google Scholar] [CrossRef]
  2. Hwang, J.J. Effect of hydrogen delivery schemes on fuel cell efficiency. J. Power Sources 2013, 239, 54–63. [Google Scholar] [CrossRef]
  3. Meyers, J.P.; Darling, R.M. Model of Carbon Corrosion in PEM Fuel Cells. J. Electrochem. Soc. 2006, 153, A1432–A1442. [Google Scholar] [CrossRef]
  4. Tang, H.; Qi, Z.; Ramani, M.; Elter, J.F. PEM fuel cell cathode carbon corrosion due to the formation of air/fuel boundary at the anode. J. Power Sources 2006, 158, 1306–1312. [Google Scholar] [CrossRef]
  5. Matsuura, T.; Chen, J.; Siegel, J.B.; Stefanopoulou, A.G. Degradation phenomena in PEM fuel cell with dead-ended anode. Int. J. Hydrogen Energy 2013, 38, 11346–11356. [Google Scholar] [CrossRef]
  6. Karimaki, H.; Perez, L.C.; Nikiforow, K.; Keranen, T.M.; Viitakangas, J.; Ihonen, J. The use of on-line hydrogen sensor for studying inert gas effects and nitrogen crossover in PEMFC system. Int. J. Hydrogen Energy 2011, 36, 10179–10187. [Google Scholar] [CrossRef]
  7. Nikiforow, K.; Karimäki, H.; Keränen, T.M.; Ihonen, J. Optimization study of purge cycle in proton exchange membrane fuel cell system. J. Power Sources 2013, 238, 336–344. [Google Scholar] [CrossRef]
  8. Matsuda, Y.; Hashimasa, Y.; Imamura, D.; Akai, M.; Watanabe, S. Accumulation Behavior of Impurities in Fuel Cell Hydrogen Circulation System. Rev. Automot. Eng. 2009, 30, 167–172. [Google Scholar] [CrossRef]
  9. Matsuda, Y.; Shimizu, T.; Hashimasa, Y. Effect of Carbon Monoxide on Polymer Electrolyte Fuel Cell Performance with a Hydrogen Circulation System. J. Electrochem. Soc. 2020, 167, 044509. [Google Scholar] [CrossRef]
  10. Koski, P.; Pérez, L.C.; Ihonen, J. Comparing Anode Gas Recirculation with Hydrogen Purge and Bleed in a Novel PEMFC Laboratory Test Cell Configuration. Fuel Cells 2015, 15, 494–504. [Google Scholar] [CrossRef]
  11. Koski, P.; Viitakangas, J.; Ihonen, J. Determination of fuel utilisation and recirculated gas composition in dead-ended PEMFC systems. Int. J. Hydrogen Energy 2020, 45, 23201–23226. [Google Scholar] [CrossRef]
  12. Chen, J.; Siegel, J.B.; Stefanopoulou, A.G.; Waldecker, J.R. Optimization of purge cycle for dead-ended anode fuel cell operation. Int. J. Hydrogen Energy 2013, 38, 5092–5105. [Google Scholar] [CrossRef]
  13. Ahluwalia, R.K.; Wang, X. Buildup of nitrogen in direct hydrogen polymer-electrolyte fuel cell stacks. J. Power Sources 2007, 171, 63–71. [Google Scholar] [CrossRef]
  14. Promislow, K.; St-Pierre, J.; Wetton, B. A simple, analytic model of polymer electrolyte membrane fuel cell anode recirculation at operating power including nitrogen crossover. J. Power Sources 2011, 196, 10050–10056. [Google Scholar] [CrossRef]
  15. Gardner, C.L.; Sarma, P.; Mehta, D.; Chugh, S.; Kjeang, E. Accumulation of CO and other fuel impurities in the anode recirculation loop of a fuel cell: A zero dimensional transient model. J. Power Sources 2021, 489, 229420. [Google Scholar] [CrossRef]
  16. Bhatia, K.K.; Wang, C.-Y. Transient carbon monoxide poisoning of a polymer electrolyte fuel cell operating on diluted hydrogen feed. Electrochim. Acta 2004, 49, 2333–2341. [Google Scholar] [CrossRef]
  17. Zhang, J. Investigation of CO Tolerance in Proton Exchange Membrane Fuel Cells. Ph.D. Thesis, Worcester Polytechnic Institute, Worcester, MA, USA, June 2004. [Google Scholar]
  18. Zhang, J.; Datta, R. Sustained Potential Oscillations in Proton Exchange Membrane Fuel Cells with PtRu as Anode Catalyst. J. Electrochem. Soc. 2002, 149, A1423. [Google Scholar] [CrossRef] [Green Version]
  19. Zhang, J.; Fehribach, J.D.; Datta, R. Mechanistic and Bifurcation Analysis of Anode Potential Oscillations in PEMFCs with CO in Anode Feed. J. Electrochem. Soc. 2004, 151, A689–A697. [Google Scholar] [CrossRef]
  20. Farrell, C.G.; Gardner, C.L.; Ternan, M. Experimental and modelling studies of CO poisoning in PEM fuel cells. J. Power Sources 2007, 171, 282–293. [Google Scholar] [CrossRef]
  21. Hanke-Rauschenbach, R.; Weinzierl, C.; Krasnyk, M.; Rihko-Struckmann, L.; Lu, H.; Sundmacher, K. Operating Behavior and Scale-Up of an ECPrOx Unit for CO Removal from Reformate for PEM Fuel Cell Application. J. Electrochem. Soc. 2009, 156, B1267. [Google Scholar] [CrossRef]
  22. Steinberger, M.; Geiling, J.; Oechsnera, R.; Freya, L. Anode recirculation and purge strategies for PEM fuel cell operation with diluted hydrogen feed gas. Appl. Energy 2018, 232, 572–582. [Google Scholar] [CrossRef]
  23. Reshetenko, T.V.; Bethune, K.; Rubio, M.A.; Rocheleau, R. Study of low concentration CO poisoning of Pt anode in a protonexchange membrane fuel cell using spatial electrochemical impedancspectroscopy. J. Power Sources 2014, 269, 344–362. [Google Scholar] [CrossRef]
  24. Moore, W.J. Physical Chemistry; Prentice-Hall Inc.: Upper Saddle River, NJ, USA, 1955; p. 533. [Google Scholar]
  25. Mittelstaedt, C.; Umbrell, M. Gas Permeability in Perfluorinated Sulfonic Acid Polymer Electrolyte Membranes. In Proceedings of the 207th Electrochemical Society Meeting, Abstract # 770, Quebec City, QC, Canada, 15–20 May 2005. [Google Scholar] [CrossRef]
  26. Springer, T.E.; Rockward, T.; Zawodzinski, T.A.; Gottesfeld, S. Model for Polymer Electrolyte Fuel Cell Operation on Reformate Feed: Effects of CO, H2 Dilution, and High Fuel Utilization. J. Electrochem. Soc. 2001, 148, A11–A23. [Google Scholar] [CrossRef]
  27. Chen, C.-Y.; Lai, W.-H.; Yan, W.-M.; Chen, C.-C.; Hsu, S.-W. Effects of nitrogen and carbon monoxide concentrations on performance of proton exchange membrane fuel cells with Pt–Ru anodic catalyst. J. Power Sources 2013, 243, 138–146. [Google Scholar] [CrossRef]
  28. Sarma, P.J.; Gardner, C.L.; Chugh, S.; Sharma, A.; Kjeang, E. Strategic implementation of pulsed oxidation for mitigation of CO poisoning in polymer electrolyte fuel cells. J. Power Sources 2020, 468, 228352. [Google Scholar] [CrossRef]
  29. Ren, X.; Myles, T.D.; Grew, K.N.; Chiu, W.K.S. Carbon Dioxide Transport in Nafion 1100 EW Membrane and in a Direct Methanol Fuel Cell. J. Electrochem. Soc. 2015, 162, F1221–F1230. [Google Scholar] [CrossRef]
  30. Erbach, S.; Epple, S.; Heinen, M.; Toth, G.; Klages, M.; Gaudreau, D.; Ages, M.; Putz, A. CO2 Enrichment in Anode Loop and Correlation with CO Poisoning of Low Pt Anodes in PEM Fuel Cells. Fuel Cells 2018, 18, 613–618. [Google Scholar] [CrossRef]
Figure 1. Schematic of the anode fuel recirculation system.
Energies 15 01968 g001
Figure 2. A PEFC showing diffusion and leakage of inerts into and out of the anode recirculation system.
Energies 15 01968 g002
Figure 3. Impurity accumulation curves as a function of leakage rate. 11 ppm inert; other conditions given in Table 1.
Energies 15 01968 g003
Figure 4. (a) Accumulation of a generic inert species in a system with periodic purge. (b) Details showing the last 400 s segment. 11 ppm inert; other conditions given in Table 1. Time between purge cycles: blue—400 s; green—200 s; and red—100 s.
Energies 15 01968 g004
Figure 5. Accumulation of methane in the anode recirculation loop of a PEFC. Comparison between the modeled and experimental data [11] for 1.5 ppm CH4; with other conditions given in Table 1.
Energies 15 01968 g005
Figure 6. Accumulation of nitrogen in the anode chamber as a function of time in the presence of diffusive transport across the membrane. Conditions: fuel containing 350 ppm N2; Pm = 7 × 10⁻¹² mol·cm−1·s−1.atm; and other conditions given in Table 1.
Energies 15 01968 g006
Figure 7. Accumulation of nitrogen in a recirculated PEFC anode with periodic purge. Conditions: fuel containing 350 ppm N2; Pm = 7 × 10⁻¹² mol·cm−1·s−1.atm; and other conditions given in Table 1.
Energies 15 01968 g007
Figure 8. Accumulation of nitrogen in a recirculated PEFC anode with periodic purge. Comparison between the modeled and experimental data [11]. Conditions: fuel containing 350 ppm N2; Pm = 6.6 × 10⁻¹² mol·cm−1·s−1.atm; other conditions given in Table 1.
Energies 15 01968 g008
Figure 9. The effect of membrane humidity on nitrogen accumulation in the anode chamber in the presence of diffusive transport across the membrane. Conditions: fuel containing 350 ppm N2; other conditions given in Table 1.
Energies 15 01968 g009
Figure 10. Comparison of experimental [10] and calculated enrichment of N2 in an anode recirculation loop. Conditions: XN2 = 350 ppm; P = 1 atm; V = 202 cm3; and I = 1 A/cm2.
Energies 15 01968 g010
Figure 11. Accumulation of carbon dioxide in an anode recirculation system with periodic purge. Comparison between the modeled and experimental data [11]. Conditions: 9 ppm CO2; Pm = 5.1 × 10⁻¹¹ mol·cm−1·s−1.atm; and other conditions given in Table 1.
Energies 15 01968 g011
Figure 12. Comparison of experimental and calculated enrichment of CO2 in the anode recirculation loop [11]. Conditions: XCO2 = 19 ppm; P = 1 atm; V = 202 cm3; and I = 1 A/cm2.
Energies 15 01968 g012
Table 1. Symbol definitions and parameter values.
SymbolMeaningValueUnit
V a n o d e Anode volume564cm3
V p u r g e Purge volume282cm3
c i , a Concentration of species i in the anode chamberVariablemol/L
c i , c Concentration of species i in the cathode chamberVariablemol/L
x i , a Mole fraction of species i in the anode chamberVariable
x i , c Mole fraction of species i in the cathode chamberVariable
P m , i Permeability of species iVariablemol·cm−1·s−1.atm
A Cell area25cm2
P a n o d e Anode pressure1.2atm
P c a t h o d e Cathode pressure1atm
P 0 Normal pressure1atm
l Membrane thickness0.0018cm
ν Flow rateVariablescc/s
R Gas constant8.314Latm/mol
t TimeVariables
t p Purge time0.2s
I Current density0.6A/cm2
T Operating Temperature353K
T 0 Standard temperature298K
Publisher’s Note: MDPI stays neutral with regard to jurisdictional claims in published maps and institutional affiliations.

