1. Introduction
Renewable energy technologies are evolving at a breakneck pace throughout the world; wind power, in particular, has witnessed tremendous growth over the last decade. Wind power plants are being connected to a wide range of voltage levels of power systems around the world, with a large number of them directly connected to high voltage transmission grids. However, the power generated by wind farms relies primarily on natural conditions such as wind speed, which is stochastic and cannot be predicted accurately. The uncertain nature of wind power can have significant effects on system operations by creating a power gap between the load demand and generation, thus deviating the generation and power exchanges from their scheduled values. Power system schedulers employ a variety of scheduling approaches to balance the generation and load demand throughout the day. However, the overall supply of energy differs from the total demand due to the unpredictability and/or uncertainty of wind power, therefore, system operators must deploy extra operational reserves to address the incurred energy imbalance. The additional amount of reserves is often provided from conventional power plants, which raises the cost of operation and CO
2 emissions. The increase in reserve requirement during large-scale wind power integration is investigated in [
1]. It is revealed from the study that uncertain behavior of wind power causes a significant increase in utilization of operating reserves to keep the active power balance in the system. The study in [
2,
3] attempted to integrate large-scale wind power in a conventional power grid by providing the required reserves from a thermal power system, which significantly impacted the operational cost of the system. Hence, for better utilization of wind power, it is required to utilize its power capacities for providing system services in active power-balancing operations in the same way as conventional power systems. Furthermore, better coordinating control strategies are required to optimally utilize the wind energy capacity for regulatory purposes, which will reduce both operating costs and carbon emissions, thereby resulting in a reliable and secure operation of power system.
Over the past decade, intensified research work was conducted in both academia and industry to develop ancillary services for wind power plants systems [
4,
5,
6,
7,
8,
9,
10]. The authors in [
4] presented the results from various tests to evaluate the performance of an 800 kW, IEC Type 4 wind turbine (located in Regina, SK, Canada) in providing the secondary frequency response (AGC). The details about the technical capabilities and limitations of wind turbine technology to provide the secondary response service to the grid are presented. Performance scores of 59% and 65% are calculated with the PJM method above and below rated wind speeds, respectively. It has been proven in the study that the utilization of wind power in the regulation market is more profitable despite the minimum performance score, which can be improved for the regulation of wind power if there is sufficient wind power available, and the wind turbine can accurately and rapidly track the power command signal from automatic generation control (AGC) [
6]. In [
11], a detailed study is conducted on a generic power system model integrating a large share of wind power to analyse the performance of ancillary service from a wind power plant in a simple but relevant environment. The security of future power systems having a large share of wind power can be achieved with careful coordination between the wind power plants system (WPPs) and other conventional energy sources. The authors in [
7,
8] presented a detailed analysis on implementation of a doubly-fed induction generator-based wind energy system to provide a secondary frequency regulation support to the grid that strengthened the reliability of the gird in the presence of a large-scale wind energy system. Furthermore, the utilization of a battery energy storage system is a potential solution for handling the intermittent behavior of wind power due to its prompt response. However, the effective increase in the cost of operation precludes its application for grid active power regulation services.
Moreover, to maximize the effectiveness of wind power resources, loads must be made flexible so that they may actively participate in load-generation balance as needed. Flexible loads such as EVs, heat pumps and cold storage units have the capability to contribute actively to grid ancillary services [
12,
13,
14,
15,
16,
17,
18,
19,
20]. The authors in study [
19] suggested an appropriate integration approach for space heating loads of buildings in an integrated community energy system to optimize the schedules of power generation and consumptions. It is illustrated in the study that roughly 40 percent of load share in worldwide energy consumption comes from buildings, and in that share, 50 percent is consumed for heating or cooling purposes. Among the flexible loads, electric vehicles (EVs) have shown to be an excellent resource for demand response, piquing researchers’ attention in recent years. Utilizing vehicle to grid (V2G) technology, an EV can acquire a status of battery energy storage system realizing a bi-directional power flow with the power system. EVs are not stationary and are dispersed over a region at any time. EV’s are used for commuting purposes when they are not stationary or used for a long distance. According to [
18], a normal driving distance in the U.S. of a roundtrip is 50 km and driving time is around 52 min, but there is enormous variability. Survey information on the driving examples of U.S. drivers across the country shows that 60% of the commuters drive a distance under 80 km. Furthermore, EVs utilized for daily commuting purposes are inactive for 22 h a day. Therefore, the total energy in the EV batteries is not fully utilized in the travel and can be used as a potential source to support the grid, in addition, to supply the load of EVs for energizing the battery. Research work on EV contribution in secondary frequency response has been comprehensively conducted over the past decade. The authors in [
15,
16] presented a conceptual framework for the integration of EVs in large power system grids covering the technical operation of grids and the market environment for electricity. Furthermore, the potential benefits and different challenges that occurred in these processes to alleviate the problem with anticipated errors are presented in a detailed manner. In [
21,
22], the authors investigated the inertial response and adaptive mechanism-based droop control for primary frequency response to guarantee the system stability. Therefore, the effective utilization of EVs along with wind power for grid regulation services can increase the share of wind energy in modern power systems.
The aforementioned literature presented different methodologies for integrating the wind power capacities and EVs to support the grid during power balancing operations. However, several bottlenecks remain in terms of effectively and efficiently using wind energy and electric vehicles’ capacity for grid ancillary services. For instance, in [
4,
5,
6,
7,
8], the secondary frequency control (AGC) strategies are based on static optimization techniques, which do not consider the generating unit operating constraints and dispatch the generating unit’s power signals using a predefined participating factor. This approach cannot anticipate the current loading of generators and might influence the security of system operations. In [
4], the presented approach for AGC to support the grid operation in a large-scale wind-based power system is based on the fact that regulation from wind power is fixed at several specific values. Moreover, the power curtailment issue in the utilization of wind power for regulation purpose has not been addressed. Likewise, in [
8,
23], the aggregated response of conventional power plants and WPPs along with energy storage systems are analyzed to provide the grid support for ancillary services. However, the constraints affiliated with real-time forecasting errors and practical limits of generating units are not considered in the study. The investigations in [
24,
25] attempted to moderate the issue of power balancing in the grid by proposing an algorithm, which is only practicable for offline analyses such as daily scheduling and cannot be carried out in real-time. A real-time algorithm is, however, suggested in [
26] to tackle the variability issues of power balance in the system due to the presence of WPPs, but the ramping constraints are not considered in this study, which largely affect the secure operation of power systems.
Likewise, in the case of EV integration, sufficient literature in the past covering the various integration issues in power balancing operations exists; however, some loopholes exist, which have not yet been addressed. For instance, closed-loop control for contribution of EVs in the AGC system is proposed in [
13] to have a bi-directional flow of power for meeting the charging demand and providing the frequency regulation service. In this study, the assumed time delay is 1–2 s, however, keeping the actual turbines’ response and the EVs’ actual response, the delay time increases from 7–8 s. Similarly, in [
27], a robust AGC system for a multi-area power system with participation from EVs is developed to provide the required supplementary response. However, the research work lacks the consideration of the practical constraints such as dead bands and higher time delays along with the assessment of a realistic EV capacity. The authors in reference [
28] have analyzed the integration of plug-in EVs in the power system AGC to suppress the oscillation of grid frequency and tie-line engendered due to the integration of large-scale electric power from solar and wind energy sources. Furthermore, a PIPDF controller is proposed in the study to further optimize the results of AGC by adjusting the open-loop poles. On the other hand, to tackle the low inertial problem of the isolated power grids, the authors in [
29] have proposed a PI-PD cascaded controller for the AGC system to tackle the high variability of certain parameters of an isolated grid. The combined integration of EV and heat pumps in the AGC system is discussed and analyzed in study [
30]. A lump model of EV and HV is used in the study, which are operated by FOPID controller to control the power consumption of HPs and the discharging state of EVs. However, the study has ignored the contribution of EVs for a 24 h period to analyze the availability of EVs from the view point of EV stations. Nonetheless, benefiting to an extent from the existing literature, the dynamical contribution of EVs to AGC requires detailed study in large-scale power system models by considering practical constraints such as a dead band, delays and parametric uncertainties to fully understand the system stability.
Referring to the above-mentioned works, this research work investigates the use of wind power and the storage capacities of EVs to support future grids for regulation purposes with massive integration of wind power sources. This work aims to develop a simple, robust and dynamic AGC system for a real power system model, which incorporates the capacities of wind power and electric vehicle along with a thermal power system to provide enhanced active power regulation services. The proposed dispatch strategy of the AGC system addresses major challenges of power systems to integrate wind power and EVs in active power balancing operation. This includes the power curtailment issue of wind power, consideration of maximum limits of generating units and other operational constraints such as dead bands and delays associated with the AGC system. The resultant power system AGC models are beneficial for current and future power systems, in the sense to better allocate the regulating reserves from WPPs and EVs, considering their power threshold level and wind power plant capacities. Furthermore, the proposed dispatch strategy keeps the system operation more economical and reduces the environmental stresses by prioritizing the utilization of power from wind and electric vehicles over the thermal power system during the grid balancing operation. This study emphasizes only the active power control strategies. Therefore, the consideration of other grid parameters, such as voltage and reactive power control strategies, are not included in the scope of this study. The performance of the proposed AGC dispatch strategies is assessed via generating the power system model in DigSilent power factory software, which is based on the Council on Large Electric Systems standards (CIGRE). These models include thermal power plants (THPP), gas turbine power plants (GTPP), wind power plants (WPP) and EVA systems. The primary frequency control capabilities of power plants are measured, which are provided through speed governors modelled for each generating unit. The response of individual power plants in providing primary control is analyzed through load step response, and secondary control response is validated by changing the reference power set point. The collective response of power plant units in providing the primary response is also analyzed, where the power plants activate the primary reserves according to their speed droop settings. The response time of GTPP and WPP lies in a range of seconds, while that of THPP is measured in a range of minutes due to its slow boiler response. Furthermore, the AGC model with multiple dispatch strategies is developed to provide the secondary frequency response. The aggregated secondary response from the power system generating units and EVA model is often measured in 10–12 min, which is due to the delays associated with the generating unit’s EVA model and AGC system. The main contribution of the paper is based on developing and analyzing three case studies, which are listed below:
The first case study integrates the THPPs capacities in the AGC dispatch process and analyzes its response in providing secondary regulatory reserves during the power balancing operation.
The second case strategy integrates wind power along with the THPP model in the AGC dispatch process to further improve the AGC response by activating fast-acting secondary reserves from WPPs. The proposed coordinated dispatch strategy in this case addresses the power curtailment issue of wind power and prioritizes its utilization over thermal power in the active power control process. This not only guarantees the reduction in spinning reserves but also decreases the energy storage requirements, thereby allowing the system to be operated at its minimum operational cost.
The third case study integrates the storage capacities of electric vehicles along with thermal power plants in the AGC dispatch process to provide the required secondary response during unbalanced grid operation. The power from electric vehicles is stored in batteries, which are better at providing an instant response during power balancing operation.
This paper is structured as follows:
Section 2 explains the modelling of generating units for the THPP, GTPP, WPP and EVA model.
Section 3 describes the modelling of the AGC system incorporating the developed generating unit’s model and EVAs.
Section 4.1 describes the power balancing control through THPPs, while
Section 4.2 presents power balancing control through THPPs and WPPs. Likewise,
Section 4.3 explains the control of regulating power through activation of reserves from THPPs and EVAs. In
Section 5, a comparative analysis of the results from the aforementioned case studies is provided. Finally, the conclusion is presented in
Section 6.
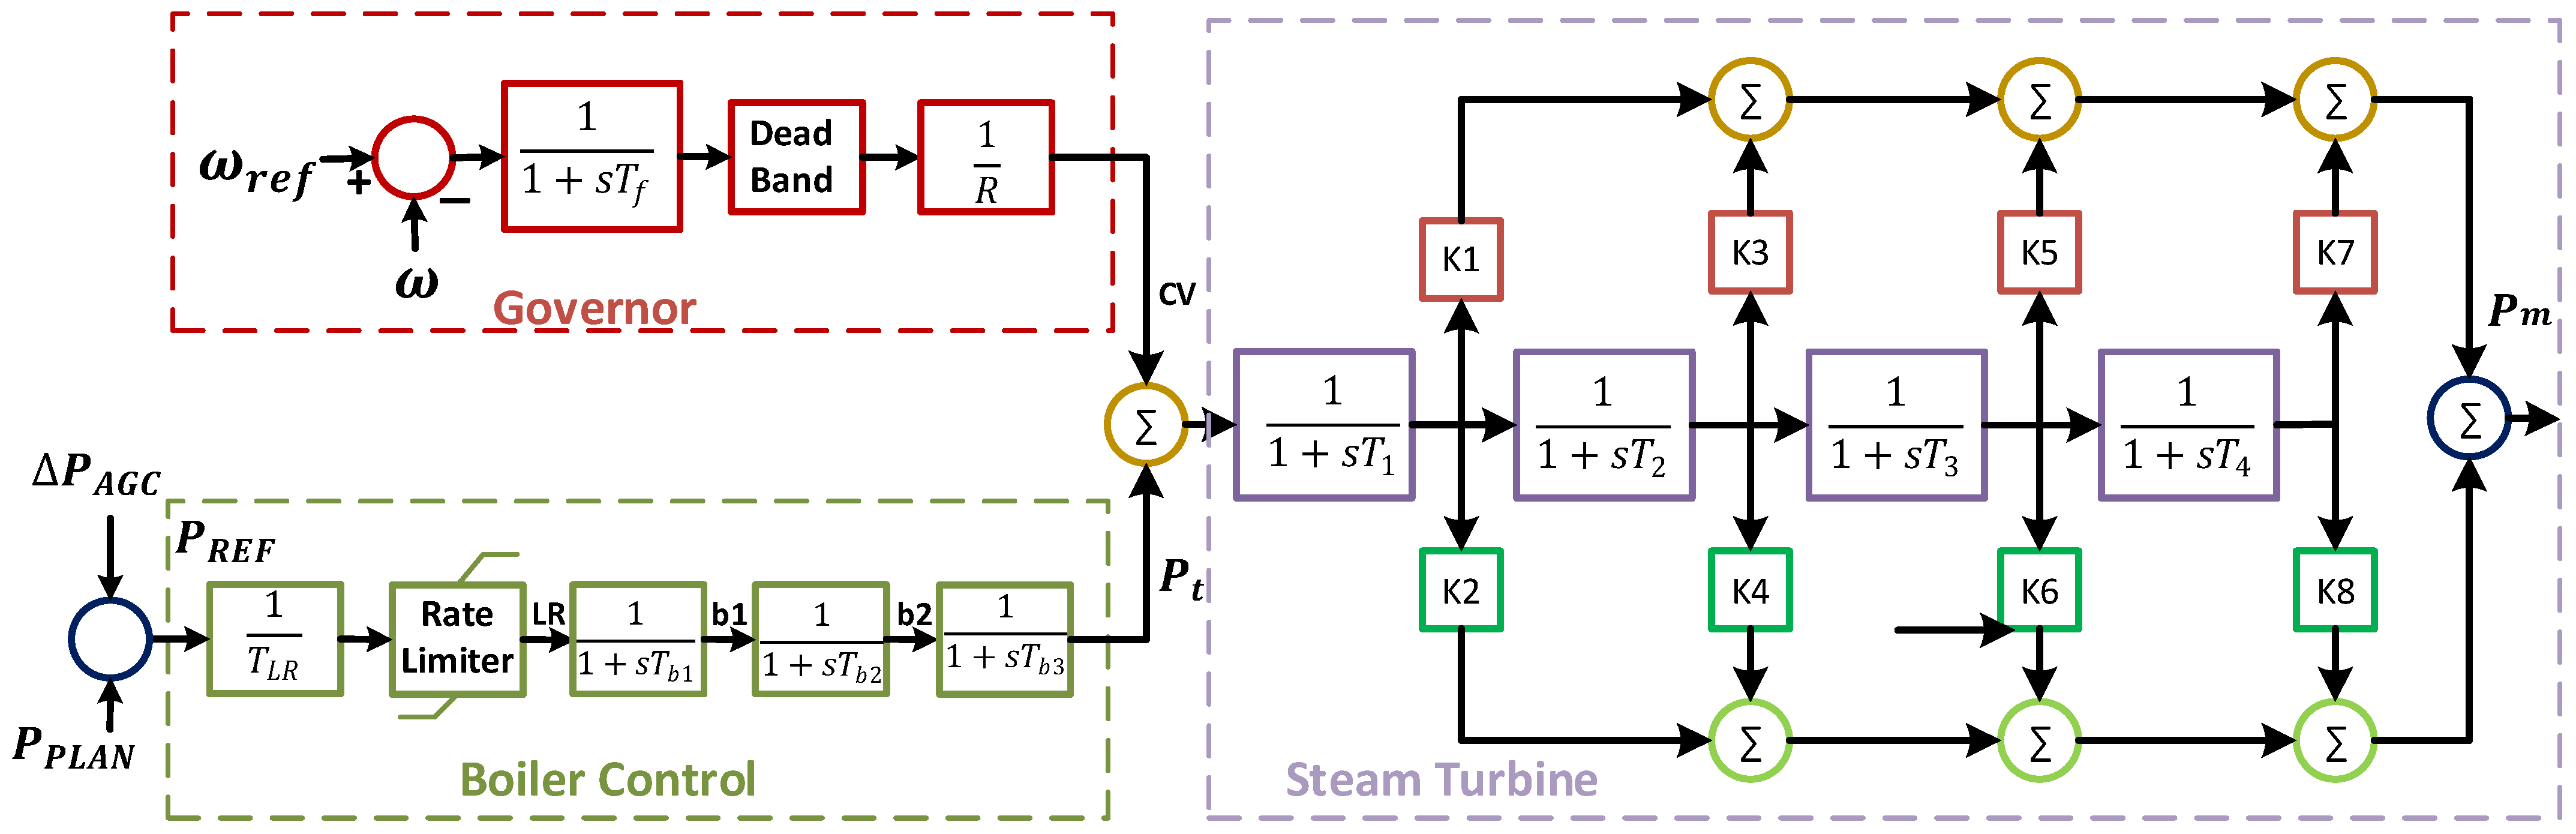
3. Modelling of Automatic Generation Control (AGC) System
The goal of ensuring efficient, dependable and stable power in an integrated power network is accomplished via the use of AGC, which continually analyses load fluctuations and adjusts generator output appropriately. Two factors must be regularly checked in the AGC service: tie-line interchanges and frequency fluctuations. These two variables are used to form the Area Control Error direct equation (ACE). The important step in the AGC control is to calculate the
which is given as:
In (11),
is the total imbalance in the
ith control area.
and
are the scheduled and actual power of the tie line, respectively. The difference between these two parameters is referred to as the tie-line error and is denoted by the symbol
Here, in this equation,
is the frequency bias constant of the
ith area and is given as
, where
is the power system damping and
is the governor droop. The frequency variation from the present value is denoted by
. In a scenario where there is a mismatch between supply and demand, the speed governor triggers the frequency containment reserve (FCR); however, meanwhile, the AGC senses the change in
and activates the frequency regulation reserves (FRR) to regulate the
and relieve the primary reserves for future use. AGC regulators modify the reference point (
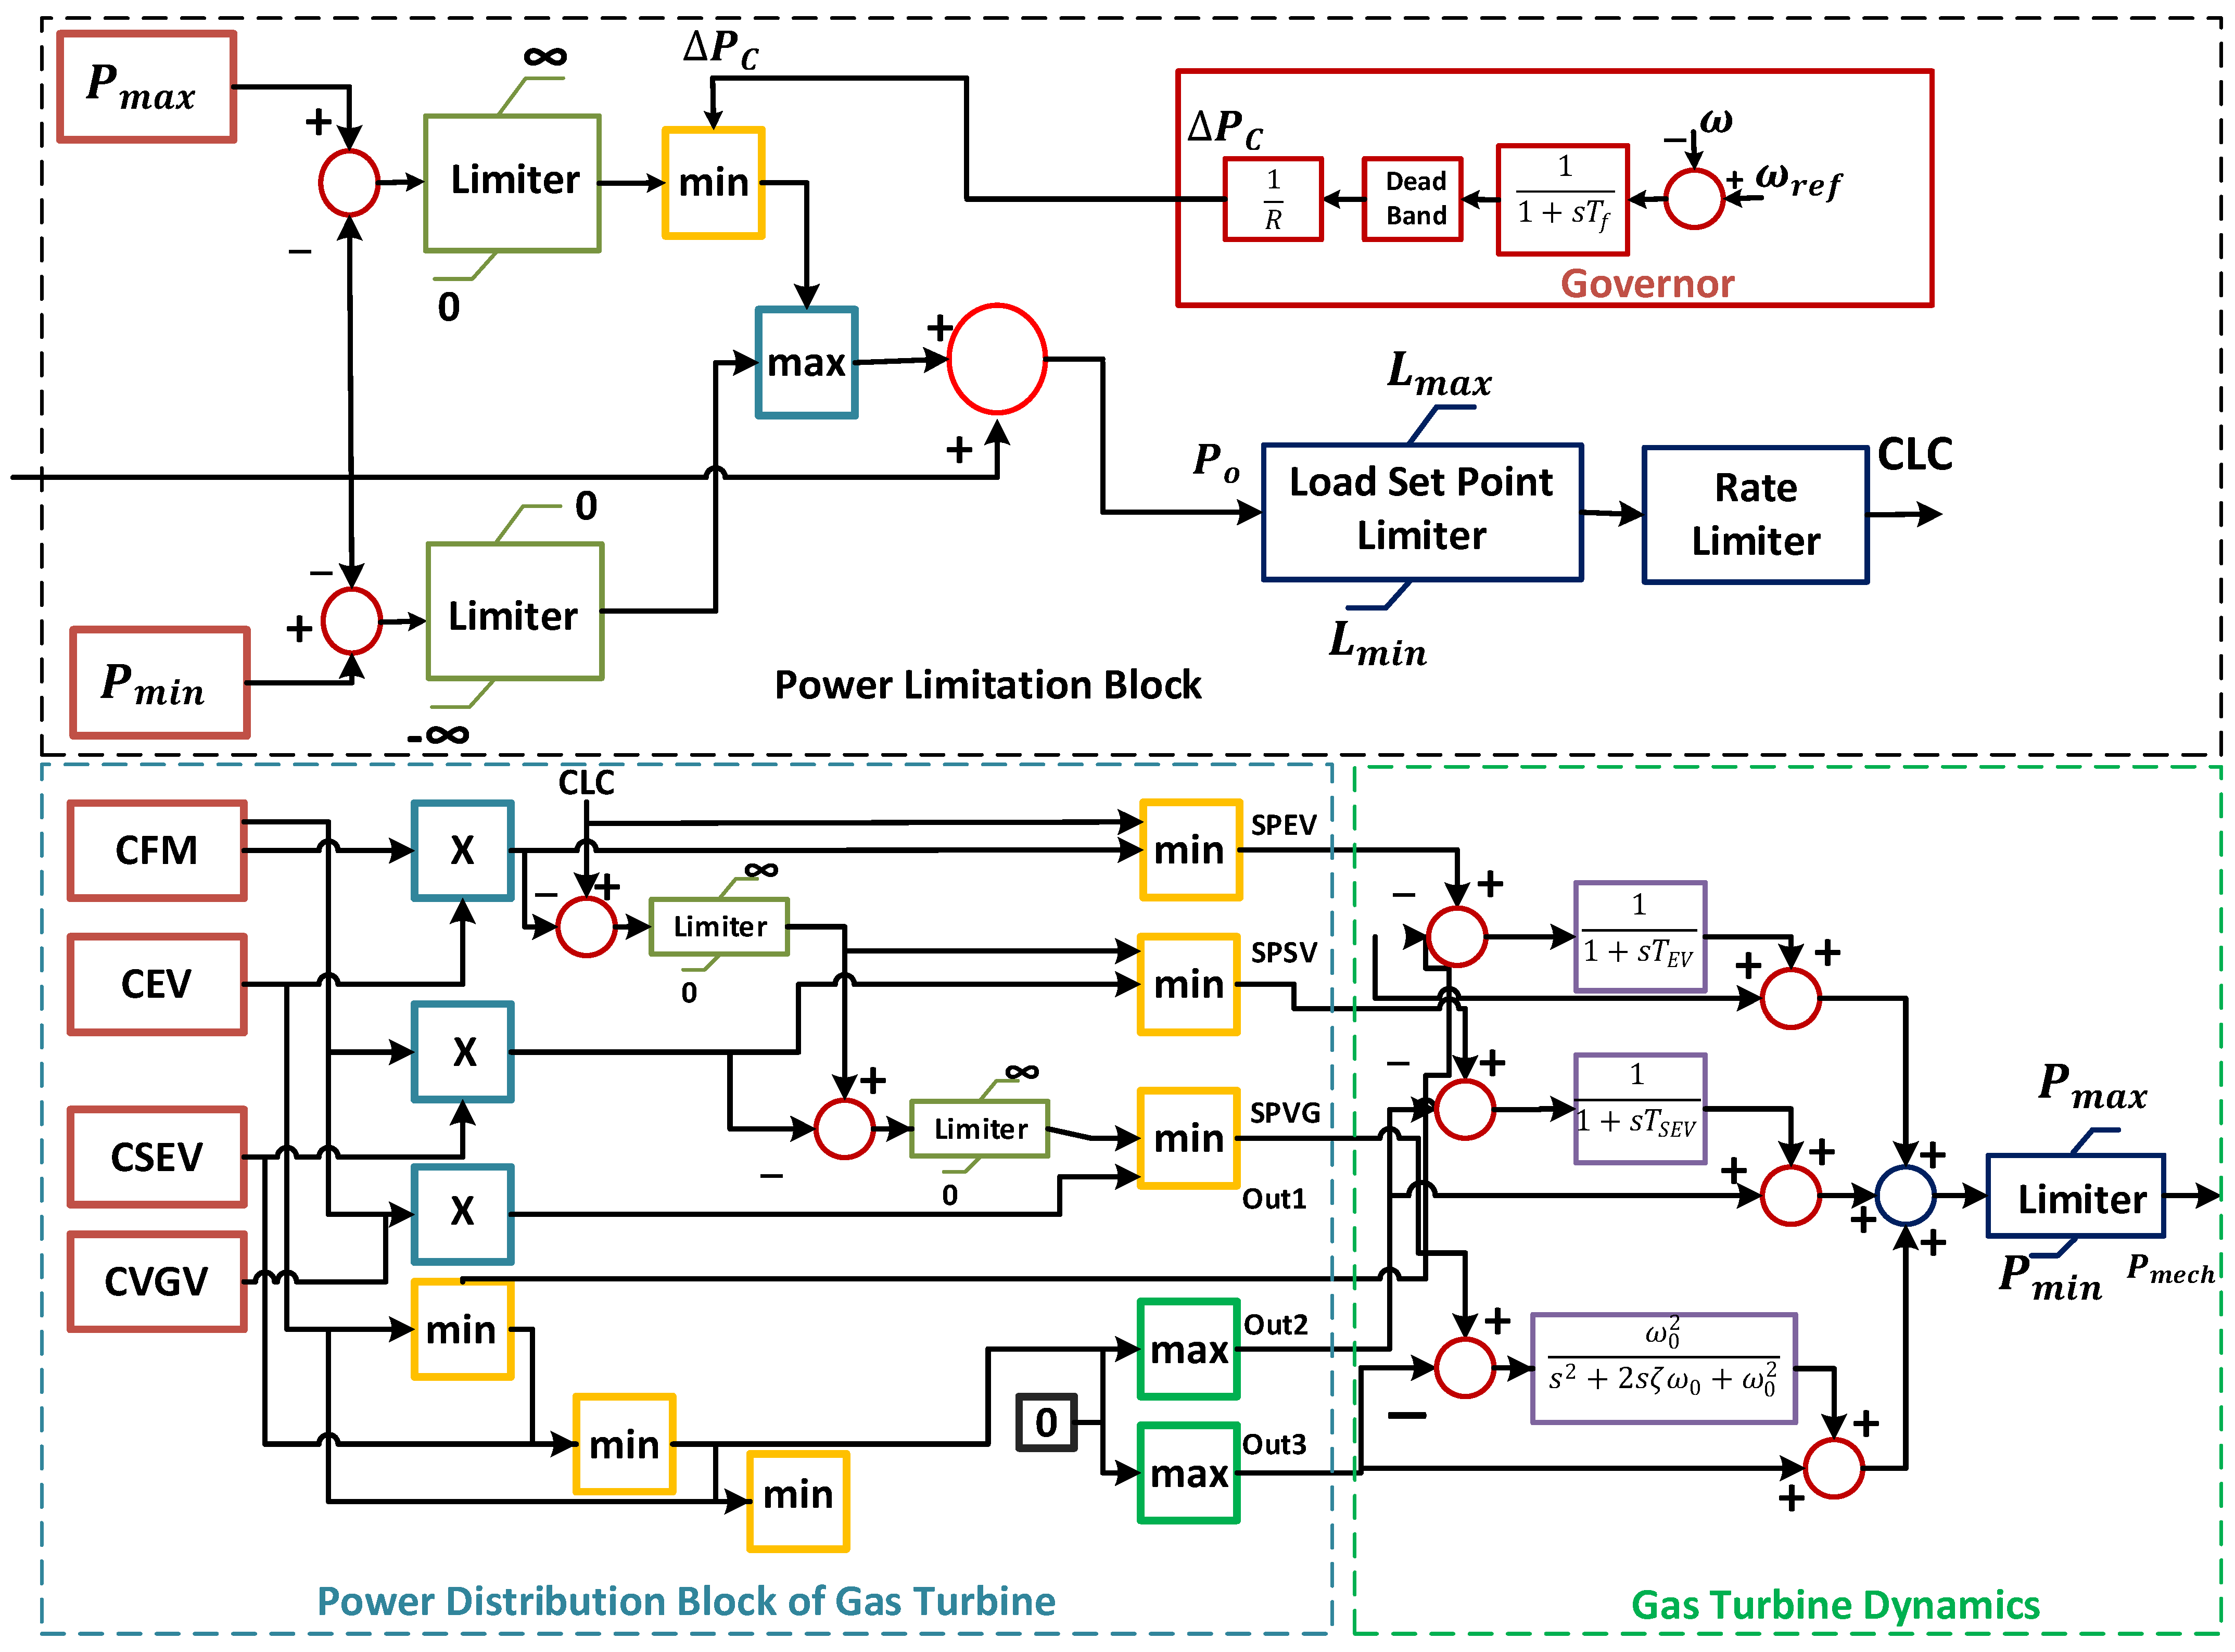
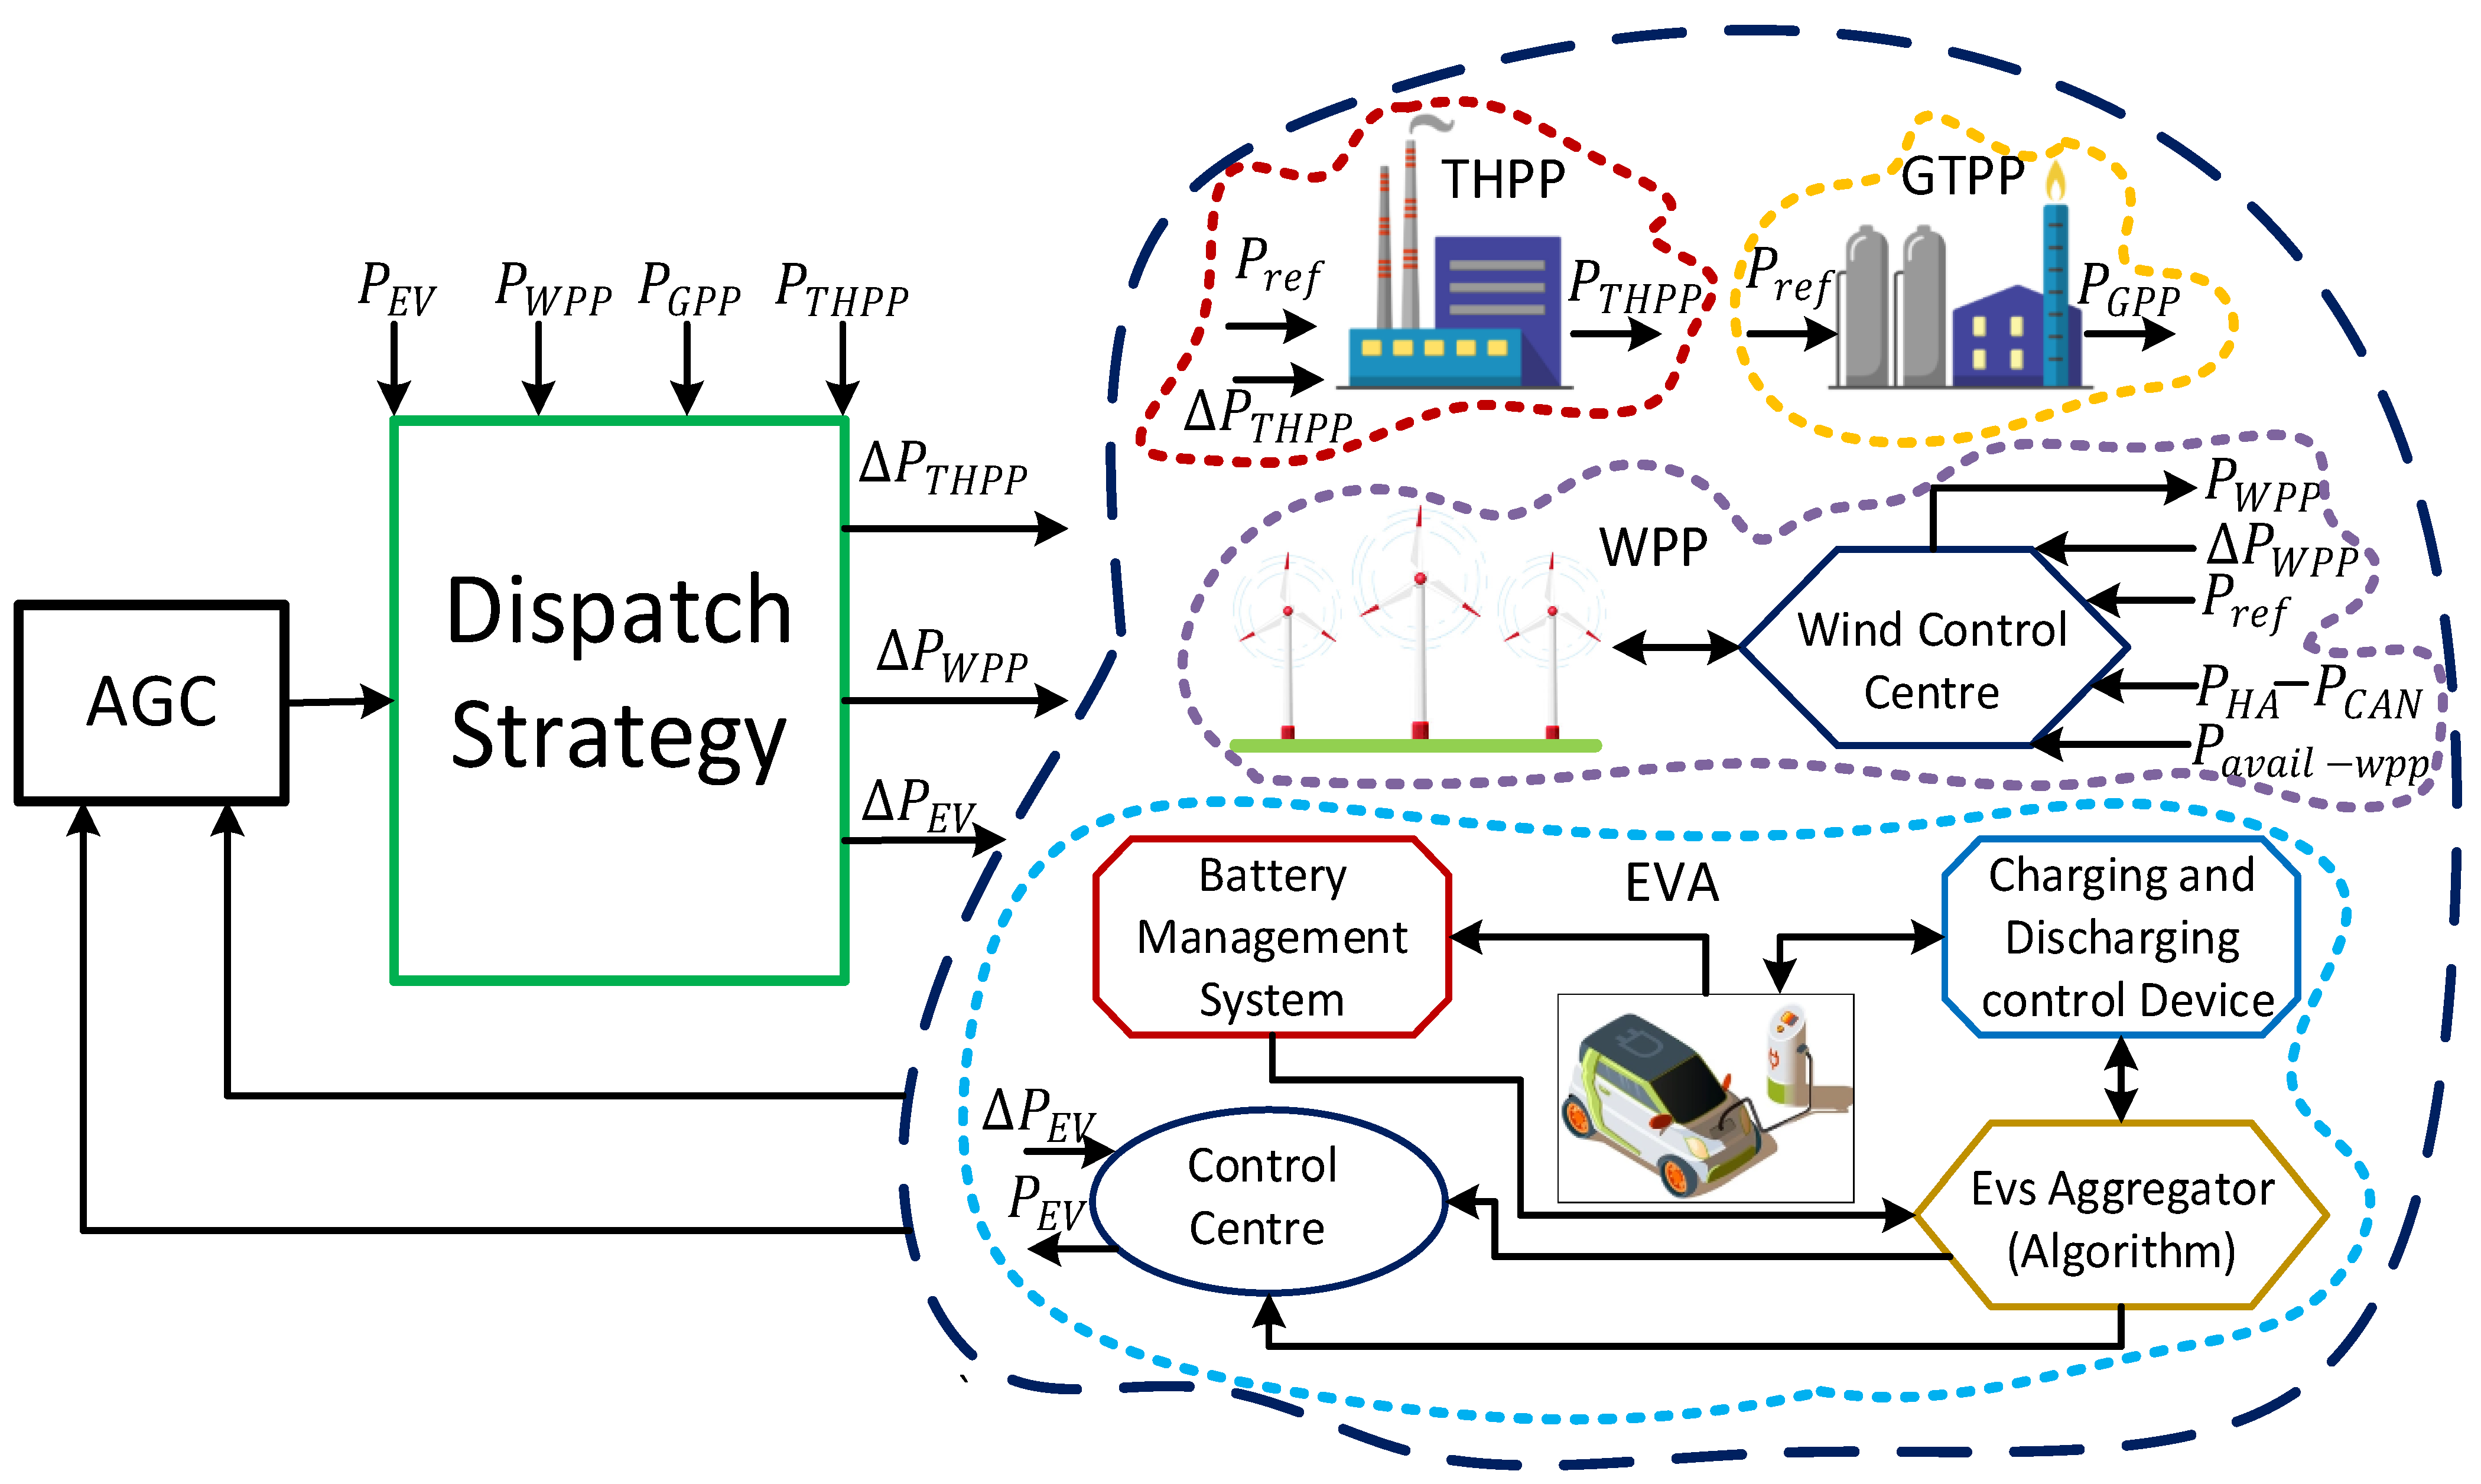
) of all participating generators in AGC operations at the same time in order to achieve this objective. The AGC employed in this investigation is seen in
Figure 6, which employs a PI controller to reduce the
as specified in Equation (12).
The parameters K and T values are required to regulate the frequency of network to its original value and the interchange power to its scheduled value. The values of these parameters are selected based on a common guideline for a secondary control system. Normally, the value of proportional constant (K) varies from 0 to 0.5 and the time constant value ranges from 50 to 200 s [
34]. The time constant is defined as the regulator tracking speed to control the process of activation of power from the generator taking part in the secondary regulation process. The resulting required change (
), calculated by the AGC regulator, is then distributed among the generating units and EVs participating in the AGC control process as shown in
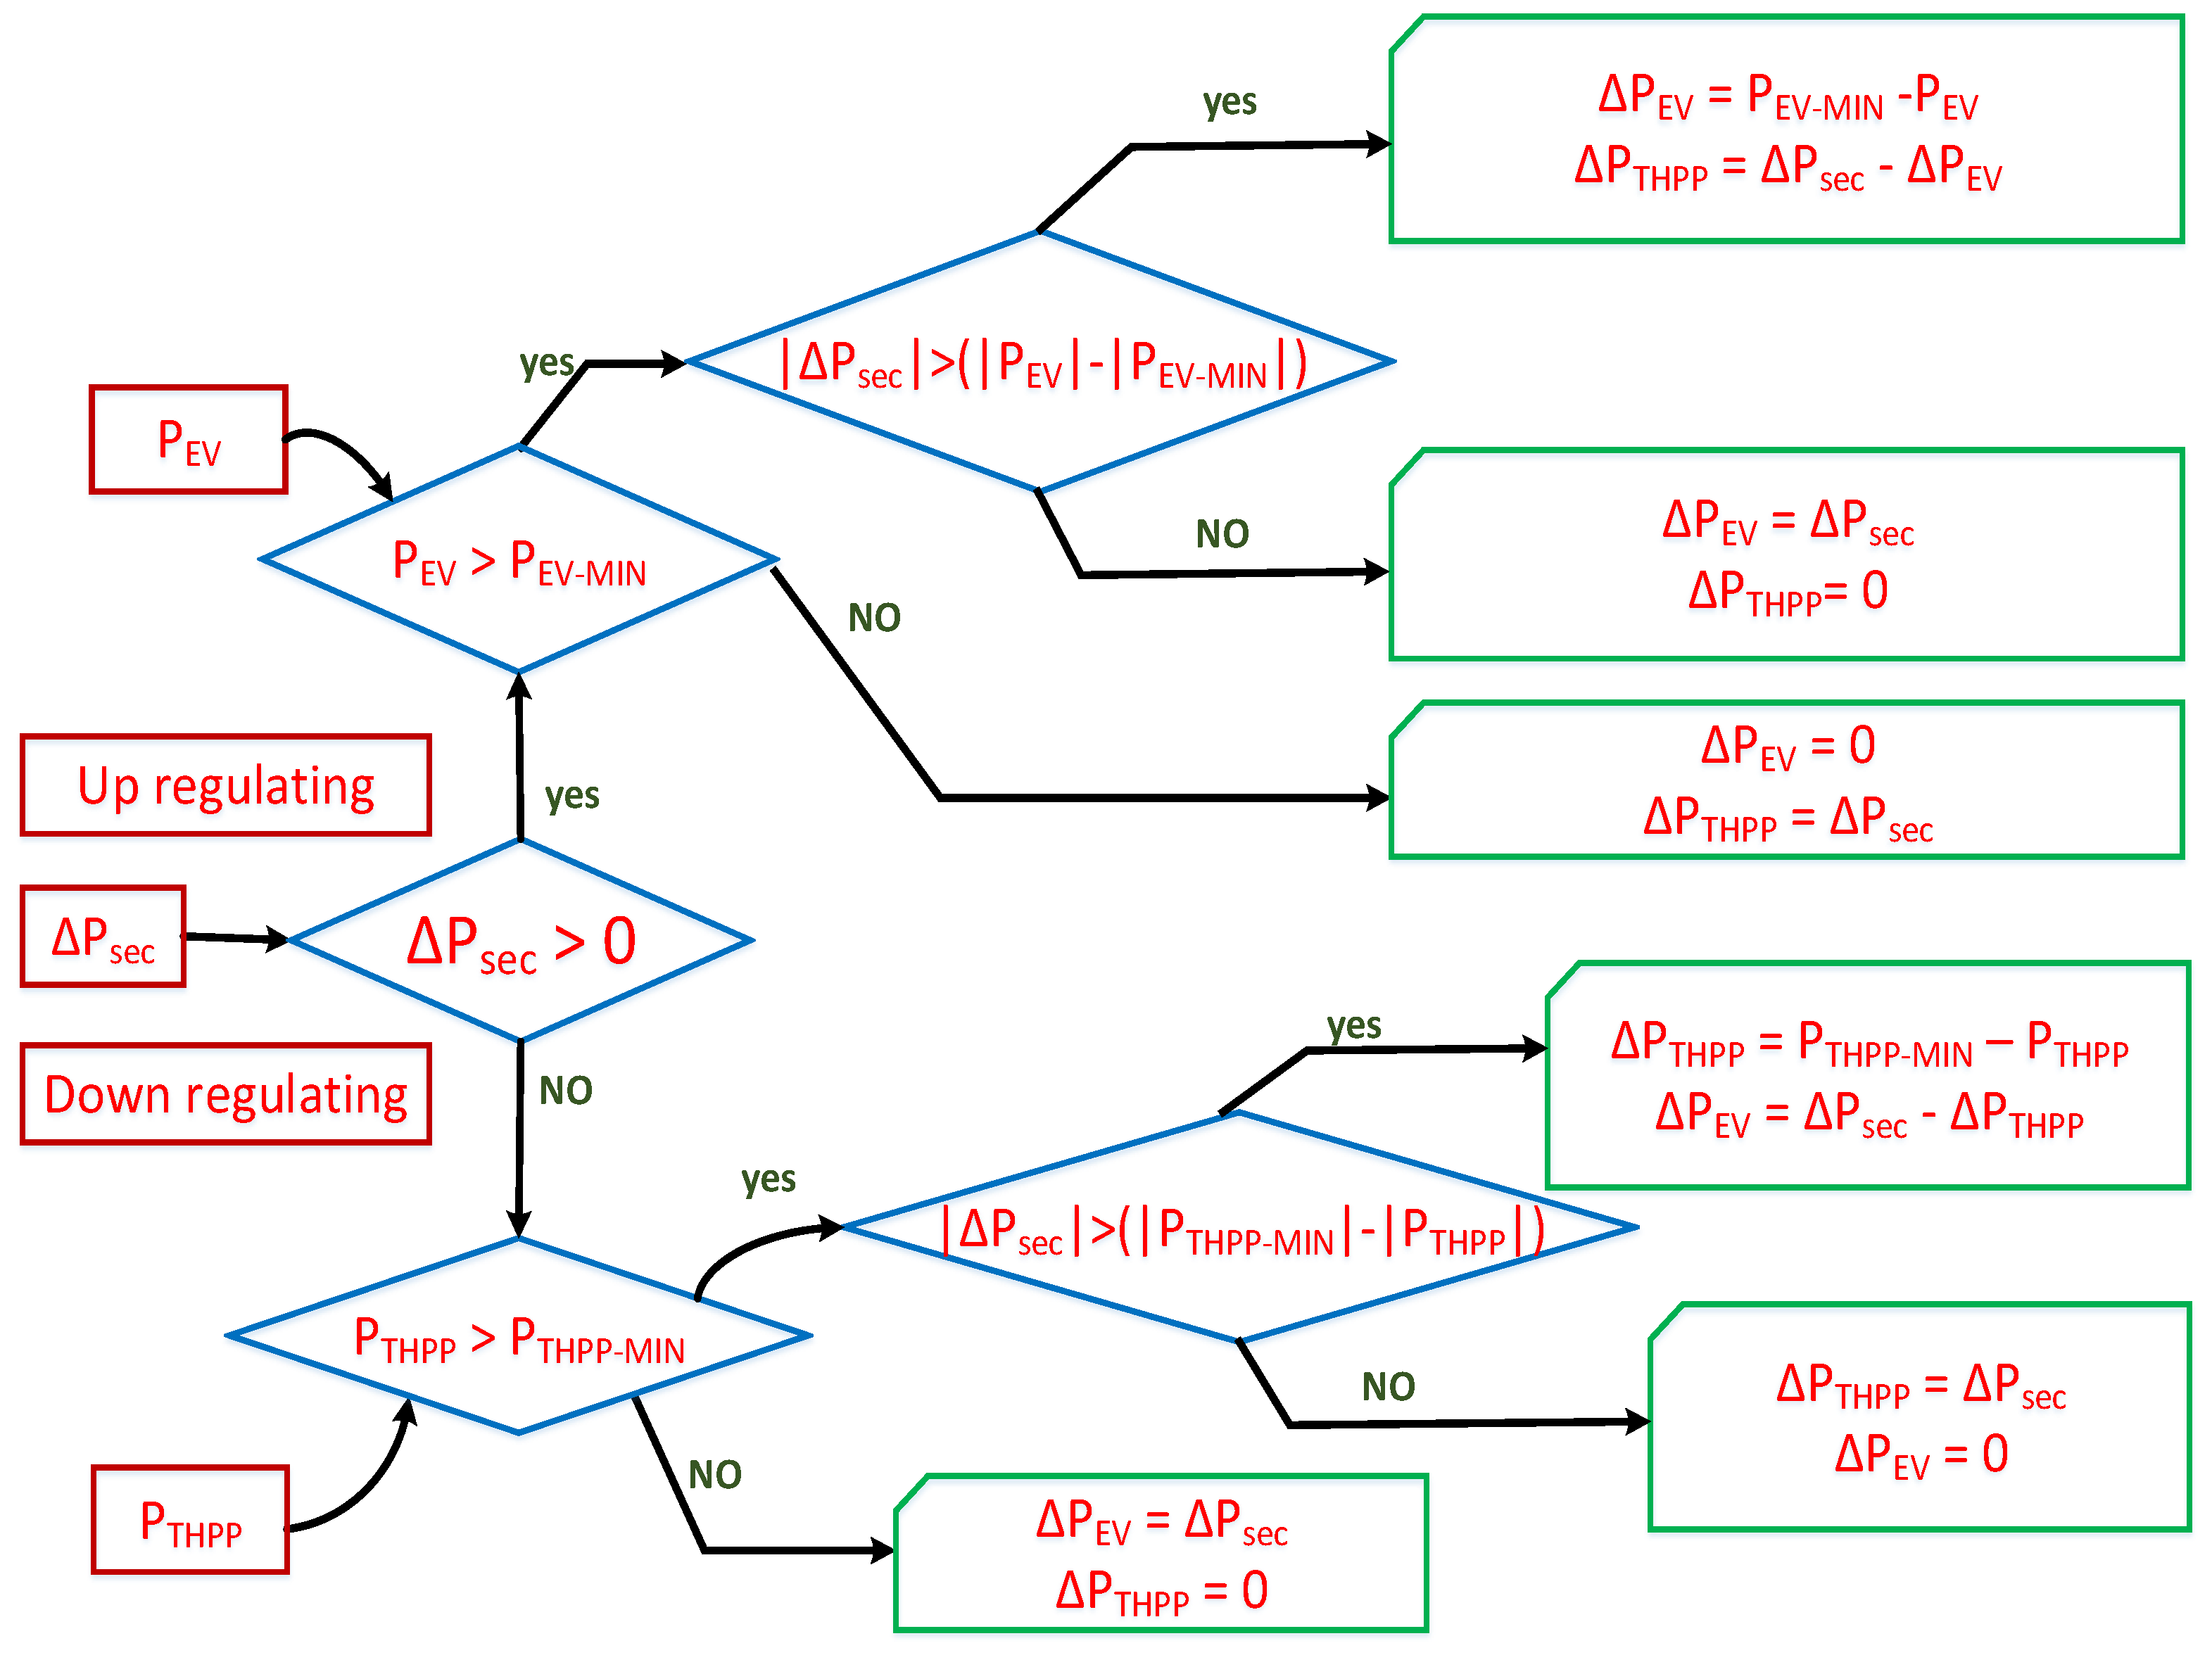
Figure 6. In this study, the AGC system inculcates the thermal power plant, wind power plant and EVs for providing the secondary regulation reserves. The dispatch block, after receiving the required change in the generating power (
), input from EVs and the generating unit’s power (
, computes the needed change in reference power of the generating units, which are
and
.
4. Performance Analysis through Case Studies
This study is categorized into different case studies to implement and analyze the proposed dispatch strategies. The power system model consists of a THPPs, GTPPs, WPPs and an EVA model. Furthermore, the system network is connected to an external grid emulating the explicit characteristics of a grid with a primary frequency response of 6000 MW/0.1 Hz and inertia of 16 S. To perform the simulation analysis, the capacities and the supplementary regulating reserves of different generating units and EVs are fixed for all the case studies as listed in
Table 1. Supplementary reserves from different generating units are provided in each case study using the proposed AGC dispatch strategies.
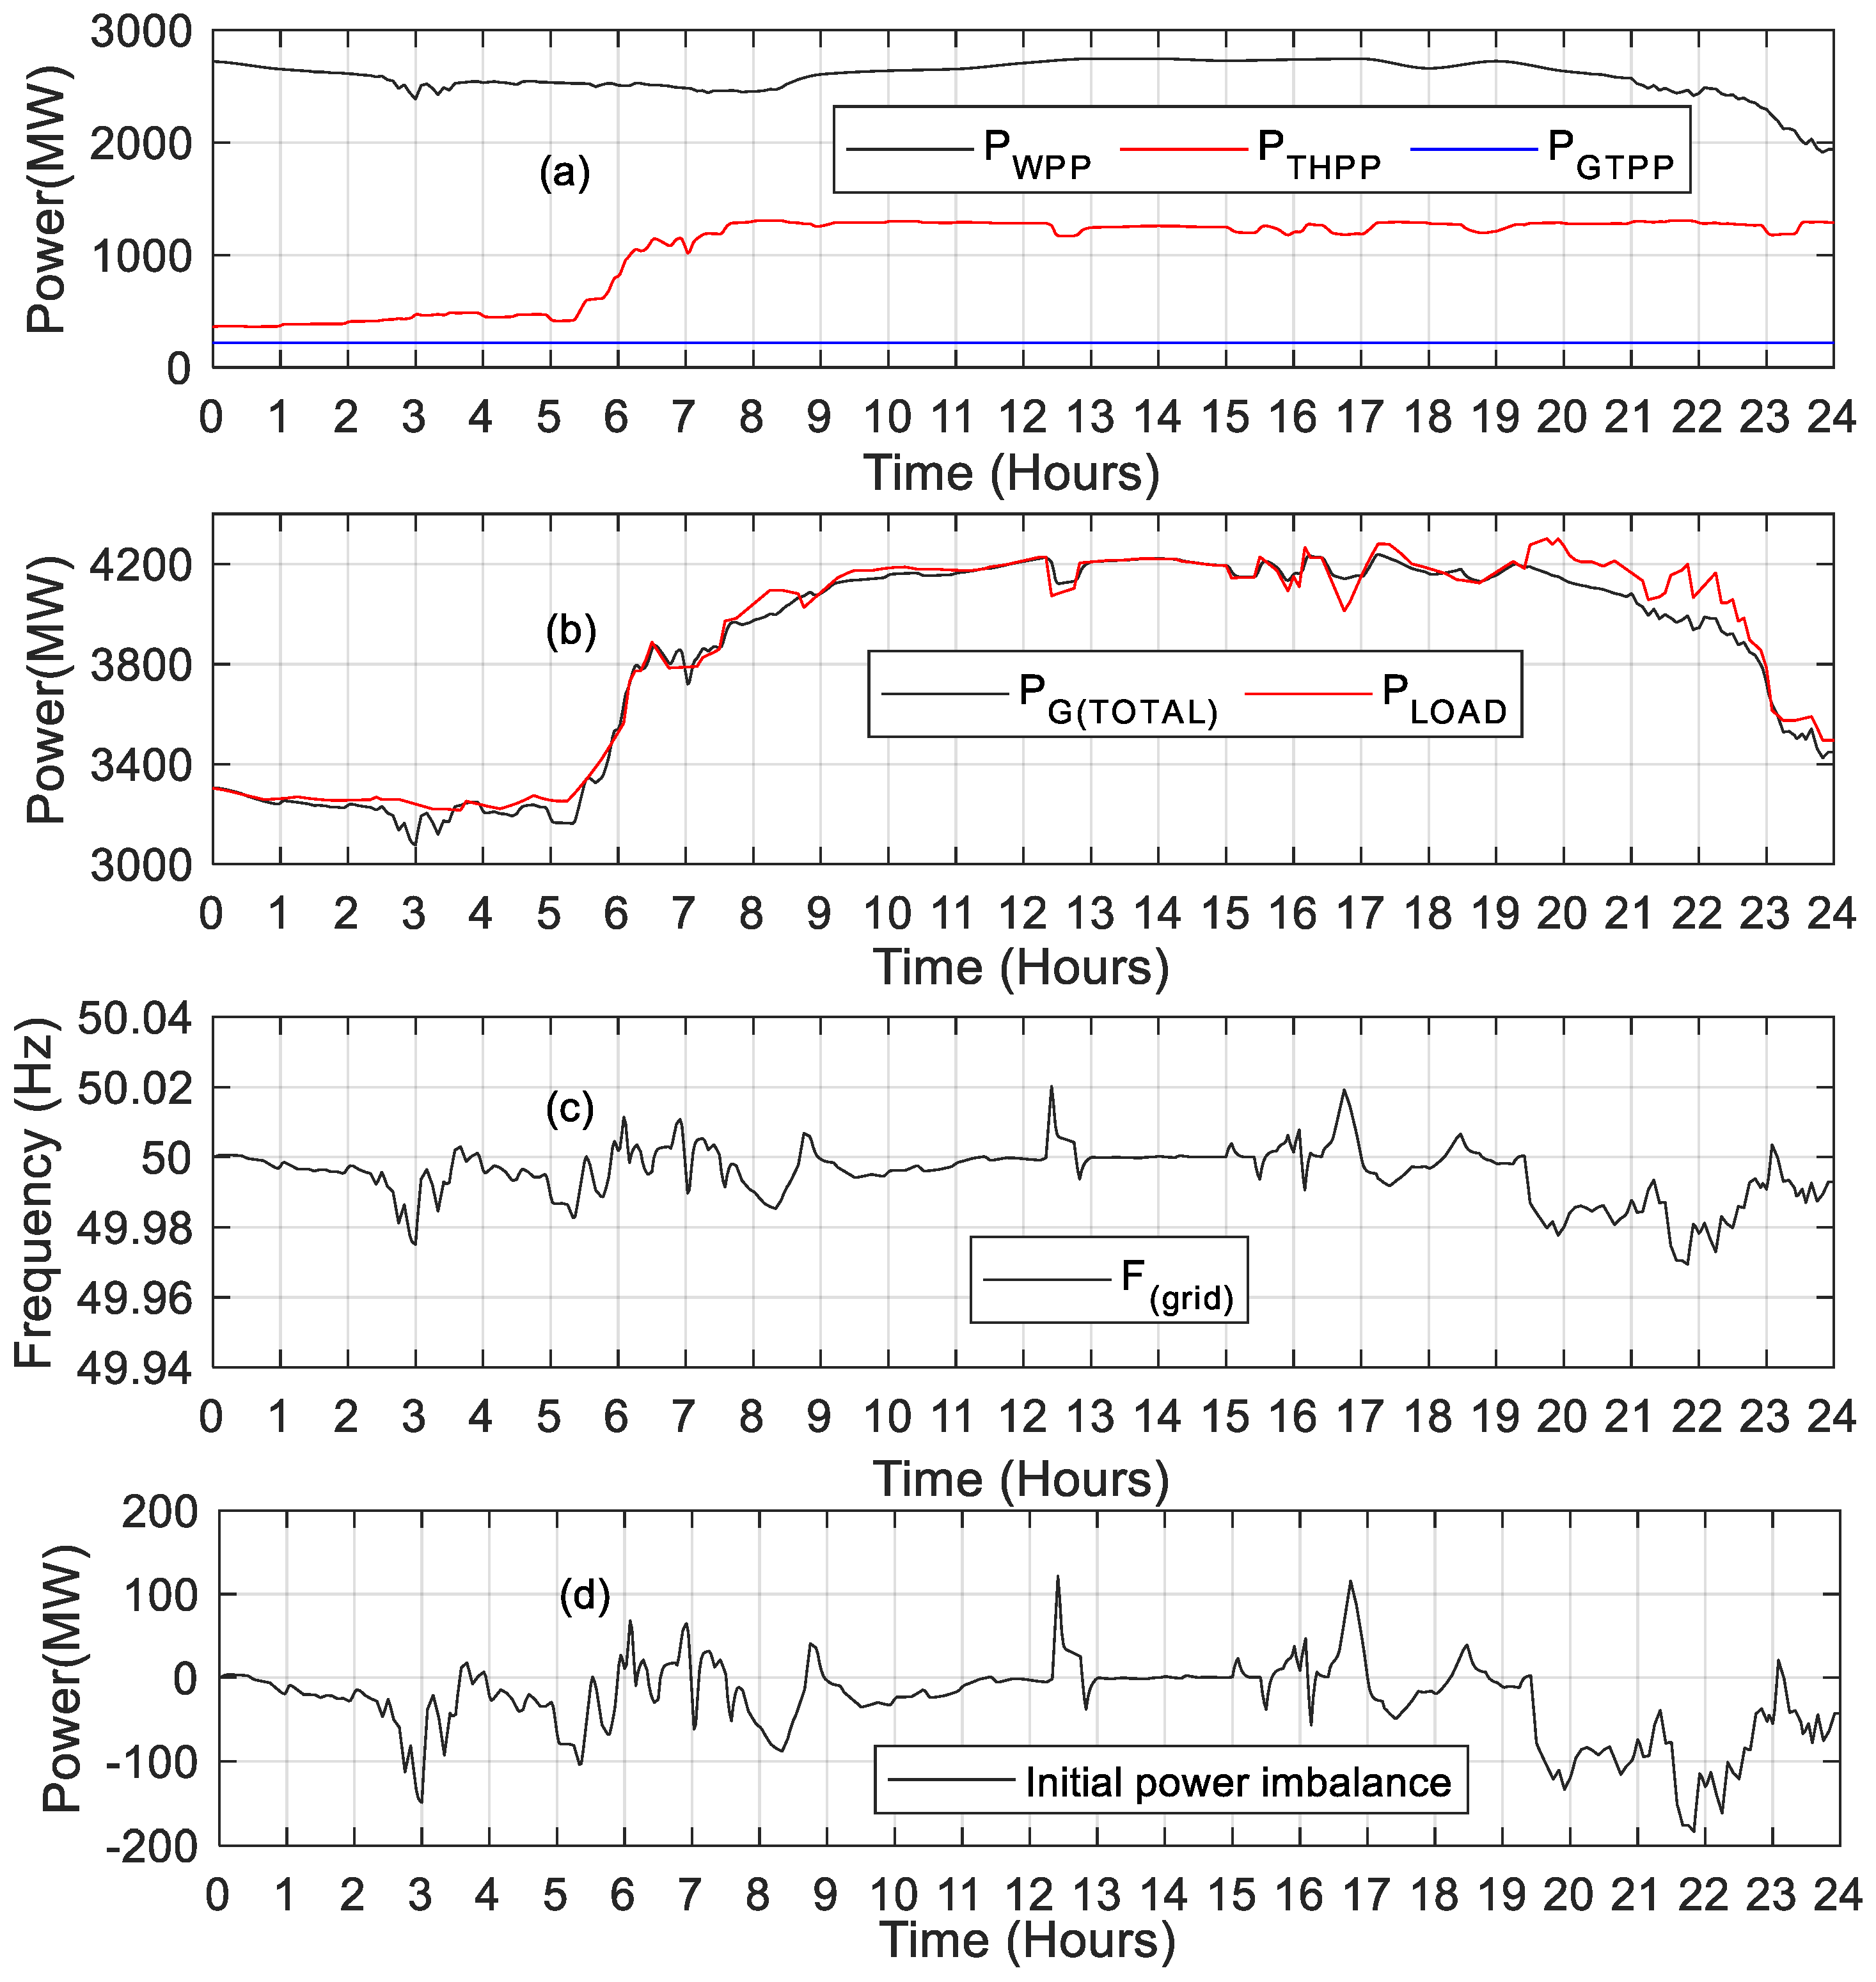
The actual generation from different power plants’ units, including the THPPs, GTPPs and WPPs, are shown in
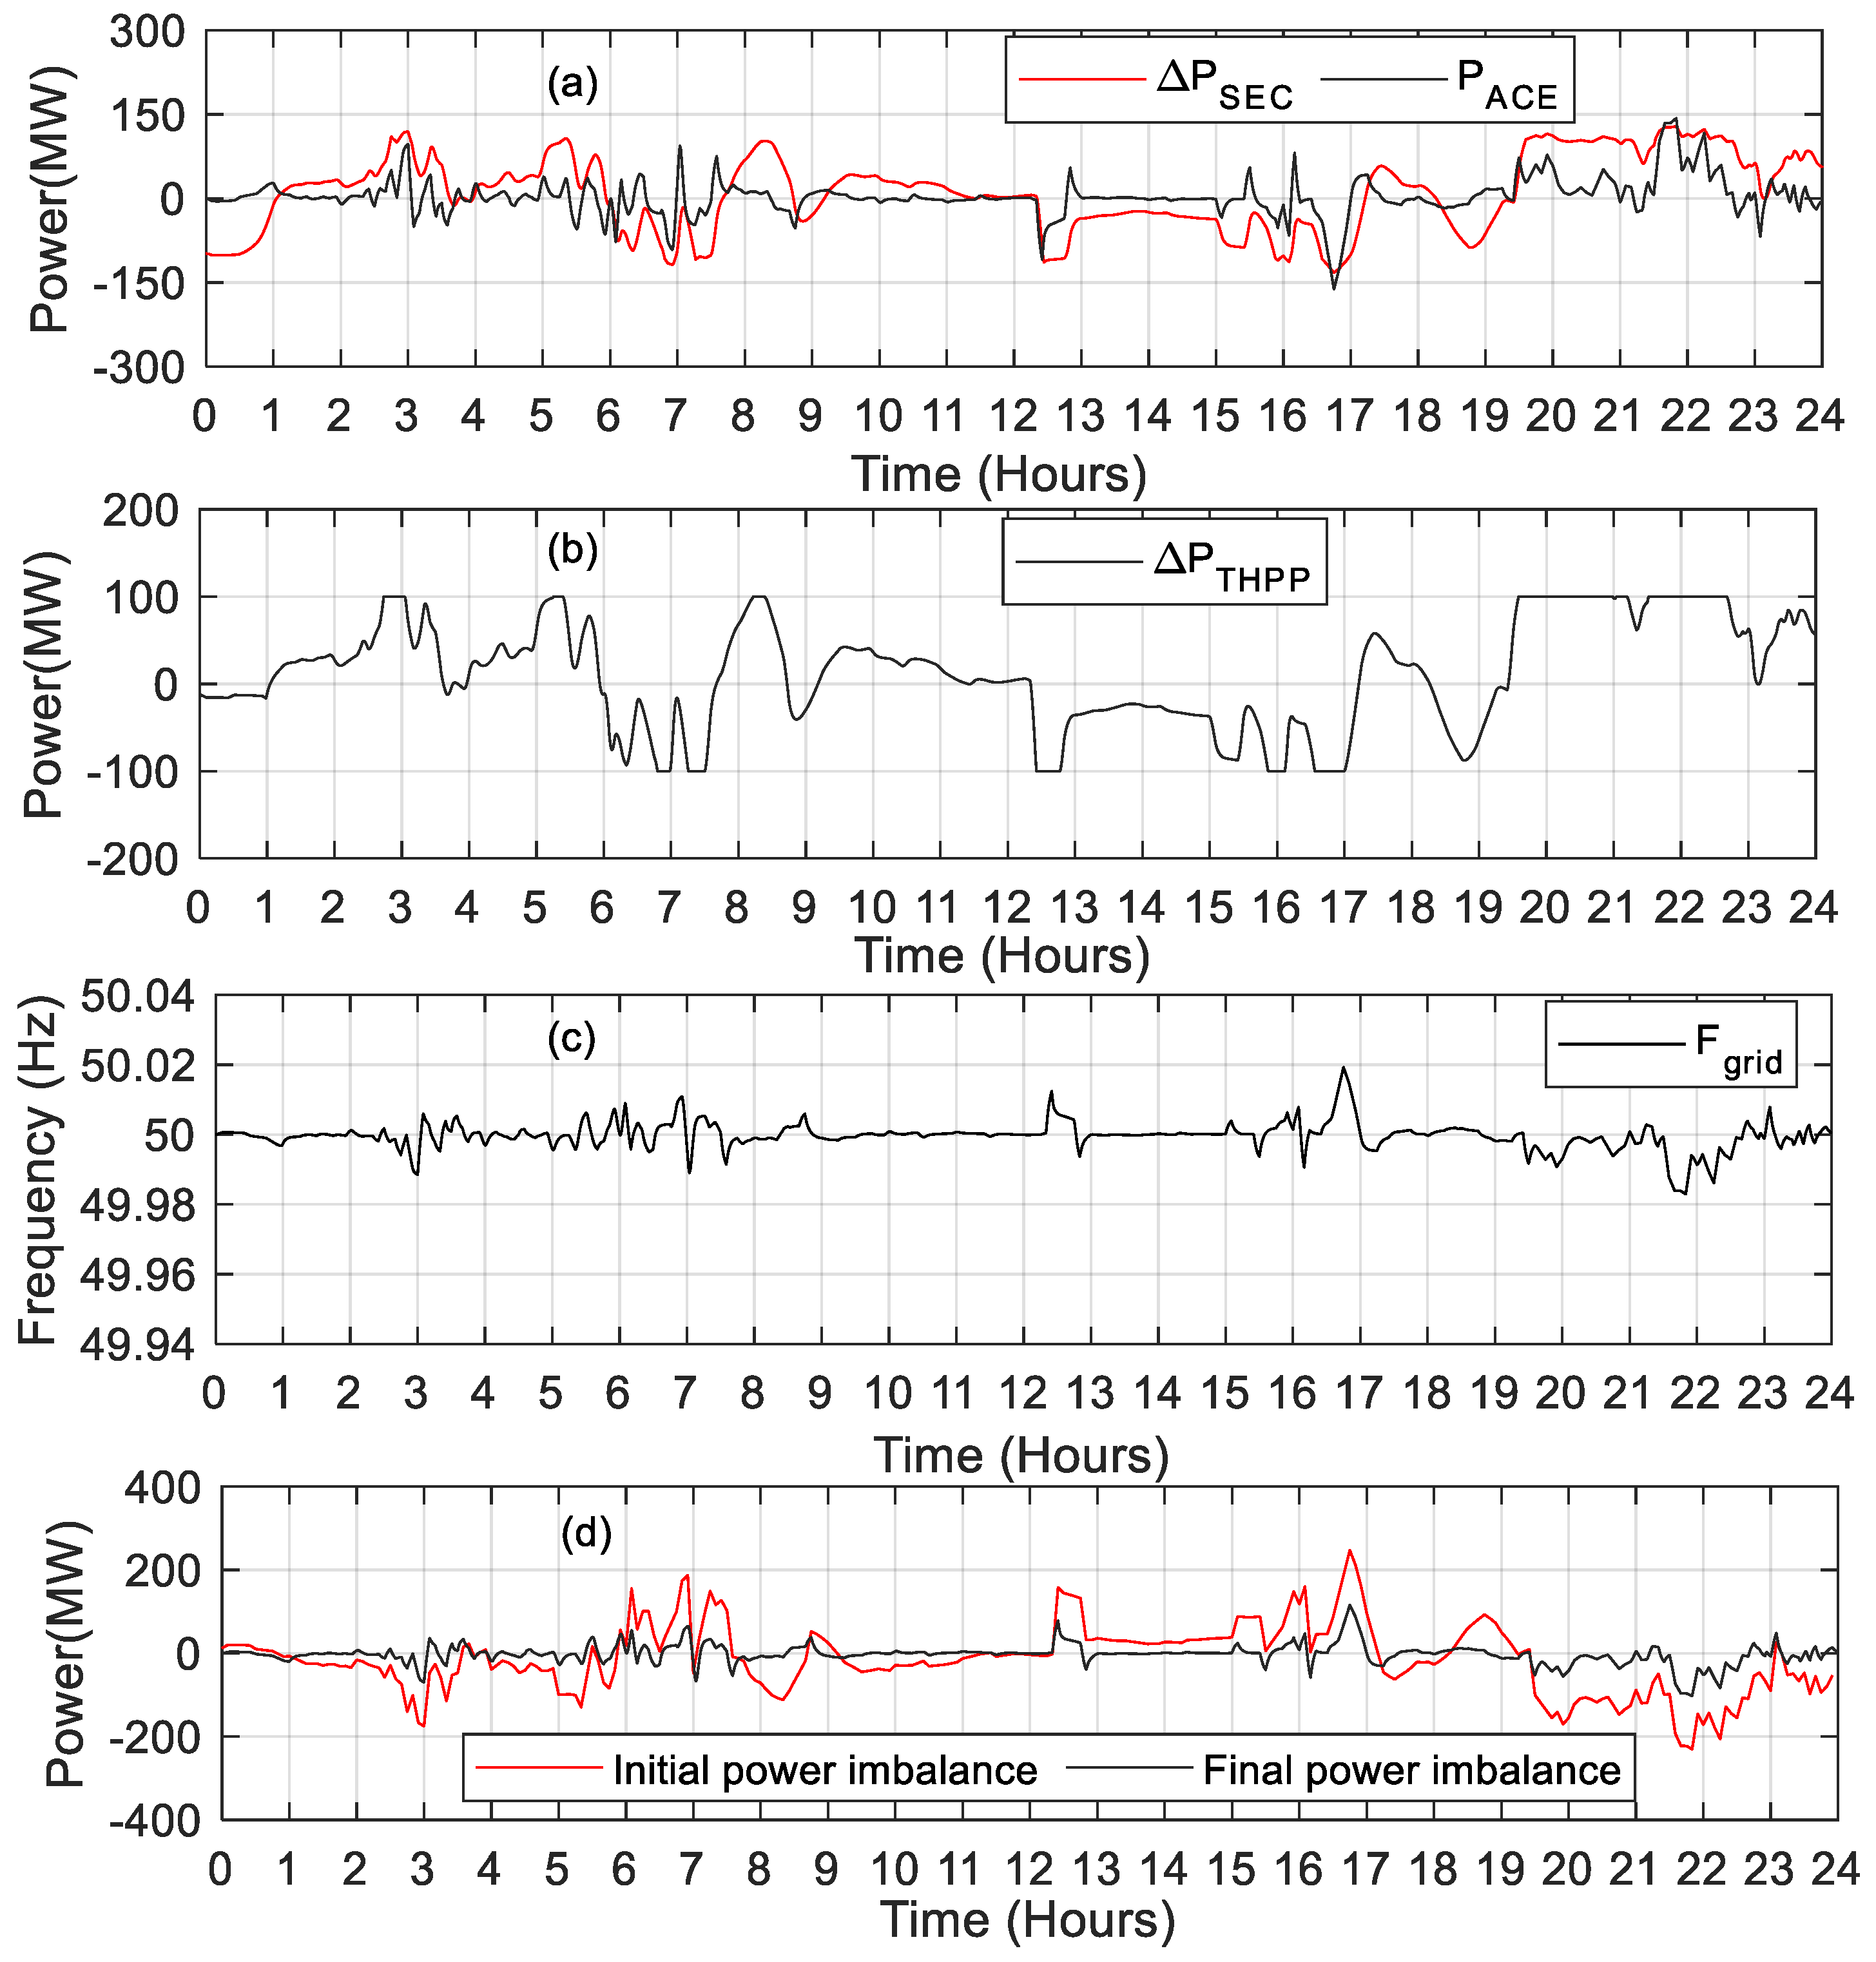
Figure 7a for a 24 h period. A winter day of the year 2020 was selected to acquire the input data for THPPs and WPPs. However, the generation of GTPPs remained fixed at a constant value. Here it is important to mention that the actual input values of the wind power plant are different from the reference value (forecasted value), which was used for the calculation of load-generation balance at the initial stage. The subsequent difference between the actual and forecasted value of wind power plants along with changing load demands generates a real-time power imbalance between the load demand and generation.
This difference can be seen in
Figure 7b, where the load demand and accumulative generation from all three sources are shown. Furthermore, the frequency response of the proposed power system model is shown in
Figure 7c, where there are continuous variations due to the changing load and generation behavior. This study proposes different control strategies for the AGC system to utilize the secondary reserves from generating units and EVs, which will suppress the engendered power imbalances in the network. In
Figure 7d, the resulting power imbalance between the load demand and total power generation is plotted separately, which will be compared later with the result of each case study. The process of controlling the active power balance passes through different phases. Initially, when the power system imbalances are generated, it results in a change in system frequency, which is sensed by the governors installed on each generating unit. In response to these changes, the governor activates the FCRs that are dependent on the power system characteristics of a power plant and the synchronous power of the entire network.
The activation of FCRs stabilize the system frequency at a new steady-state level. This process is automatic and depends on the droop characteristic of governors, which are installed on generating units taking part in the primary control process. This whole process is completed within a range of seconds. Secondary reserves, which are typically operated in a minute time frame, are triggered at this instant to regulate the system frequency back to its nominal level and release the FCR reserves. Secondary reserves are often activated manually or through the AGC system. In the AGC process, the system automatically senses the ACE and minimizes it by dispatching the required balancing power from the selected generating units. In normal AGC operation, the dispatch strategy utilizes a static optimization technique to estimate the participation factor and re-dispatch the power from power plants without considering the actual constraints related to the operation of the generating units and load. Such a regulation system increases operational costs and may compromise the system’s security. In such a scenario, it is essential to have an AGC system with a dynamic dispatch strategy considering reserve power availability of generating units and dispatch limits along with the reserve power cost. This work develops a smart management approach for the AGC system to provide support for future work on the massive renewable energy resources integrated grid. The proposed AGC system is based on a simple, robust approach, which incorporates the capacities of wind power and electric vehicles along with a thermal power system for providing enhanced active power regulation services in highly renewable energy-based power systems. Furthermore, the dispatch strategy of the AGC system addresses major challenges of wind power and electric vehicles in the integrating process, which include the consideration of practical operation constraints such as dead bands, delays, power curtailment issues of wind power and parameter uncertainties. This results in a smart power system eliminating the grid balancing issues and avoiding the usage of conventional sources for regulation purposes, which subsequently prevent higher costs, operational stress and greenhouse effects. The first case study provides a detailed analysis of integrating the capacity of THPPs in AGC dispatch to analyze its response in providing the secondary regulatory reserves during the power balancing operation. In the second case study, the capacities of a wind power plant are integrated with a thermal power plant to provide the required regulating reveres using the AGC dispatch process. A coordinated dispatch strategy is developed in this case for the dispatch process, which prioritizes the utilization of wind power to decrease the dependency of the power system on the thermal power plant and subsequently reduces the operational cost of the system. The third case study integrates the storage capacities of electric vehicles along with the reserve power from THPPs to provide the required secondary response. In this case, electric vehicles act as storage devices and are better at providing instant responses during the power deviations. The detailed analysis of the different case studies proposed in this work are given below.
4.1. Case Study 1: Power Imbalances Control through THPPs Only
In this case study, the response of the proposed AGC system is analyzed, when installed only on the thermal power plant system. As mentioned in the aforementioned section, the simulation is based on real-time data collected on a specific day in the year 2020, and therefore, due to unpredictable patterns of the wind power plant, the actual value of the wind may differ from the projected value of the hour ahead plan in real-time data. Hence, if the wind power generated during the working hour differs from the predicted value, a power gap between production and demand is established. Therefore, combined with the load variations, there is always a continuous variation between the production and demand, as shown in
Figure 7b. The governor installed on the generating units senses these variations as the speed variations are observed in the rotor speed of generating units. Subsequently, the generating units respond to these variations by activating the primary reserves. The primary reserves are activated based on the concerned power plant characteristics and the dynamics of the power system. The release of primary reserves sustained the imbalances in the system by arresting the frequency from further change. To restore this balance, AGC response is required, which regulates the system frequency by activating the secondary reserves from AGC-controlled power plants, which also releases the primary reserves. Hence, AGC regulates the ACE, which is generated in response to any change in the system frequency. Here, in this case, the AGC is installed on the THPPs, for which the secondary reserves are kept limited to ±100 MW.
Figure 8a provides a comparison of results for the AGC-installed THPP output and power imbalance in the form of ACE, generated due to the intermittent behavior of wind power and the changing load demand. It can be perceived from the figure that THPP is actively participating in the secondary response of the system, when
, that is AGC activates the THPPs’ secondary reveres during the excess or deficiency of power, and thus minimizes the steady-state value of frequency deviation. However, it may be noted from the figure that at some point the value of
crosses the limit of ±100 MW of power, which is the maximum limit of secondary reserve on THPPs. Therefore, in such a case, AGC will not be able to provide the required regulation power and hence there will be a sustained deviation in the steady-state frequency of the system, as shown in
Figure 8c. The activation of the secondary reserves from the THPPs reduces the power imbalances within the range of
, which is shown in
Figure 8d by comparing the initial power imbalances with the final imbalance resulting after the AGC response. The comparison of power imbalances shows that the activation of reserves from THPP actively reduces ACE. However, the limitation on the reserves still results in some imbalance, which can be reduced further by participating WPPs in the AGC response. The next section analyzes the response of AGC for a system integrating the WPPs along with THPPs.
4.2. Case Study 2: Power Imbalance Control through THPPs and WPPs
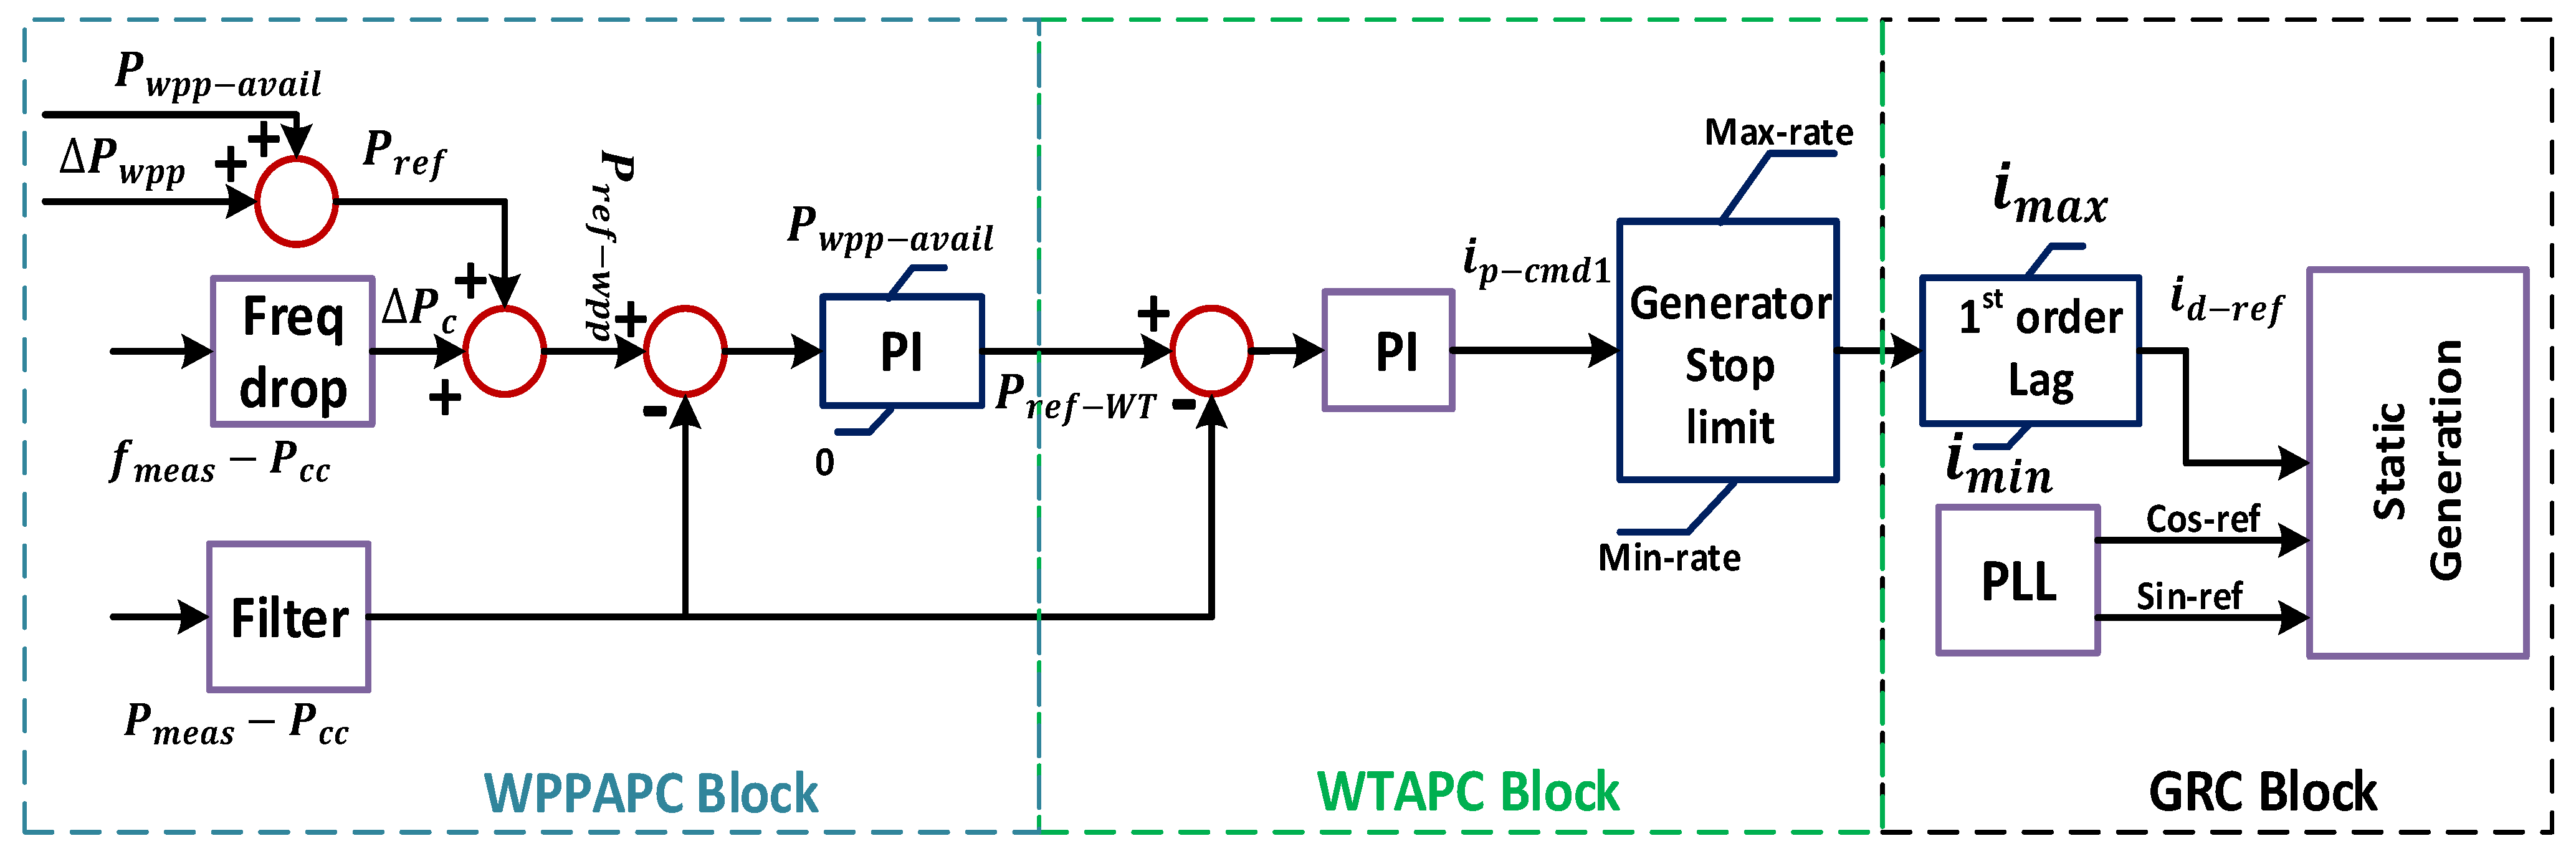
Traditionally, secondary reserves are only kept on the traditional generating units as witnessed in case study 1, which are more expensive and have a longer response time, thereby threatening the security and economy of the system. As already discussed, the integration of WPP on a large scale engenders an imbalance in the active power due to its intermittent behavior, creating a power gap between the reference value of WPP and the forecasted value. This difference, along with load demand, results in a frequency deviation, which must be corrected by activating the power plant units’ additional reserves. Unlike the previous case study, WPP in this case is being incorporated into the AGC dispatch process to control the grid frequency. The participation of WPP in the AGC operation, along with the conventional power plants (CPPs), makes the power balancing operation more secure by adding the fast-acting secondary reserves and allowing the CPPs to operate at their lower limits, thus reducing the overall cost of operation.
The study employs the same time series for generation and load demand as in case study 1, which is taken on a specific day in 2020 with a high generation of wind power. The response of WPPs for the positive and negative regulation power is provided by activating the function of the delta production constraint. As per the regulation TF 3.2.5, presented in [
35], a wind turbine connected with the grid having a voltage greater than 100 kV and having a function of delta production constraint can provide regulation power by limiting the power from the current production of WPPs. Therefore, a fixed amount of power is allocated for handling the regulation problems. However, it should be mentioned that operating the wind turbine in delta operating constraint mode raises the operation cost of WPPs by decreasing power plant output from a normal point. This case study presented a methodology for integrating the WPPs into the AGC system, which only responds to the negative power imbalances. As discussed, WPPs can also provide positive regulation power. However, it will increase the operational cost as the reserve power kept from the WPPs will be generated from CPPs or will be imported from the neighboring power system if not utilized in the AGC operation. Therefore, it is more economical to produce power from the WPPs at their maximum value due to their lower incremental cost, and then down-regulate its power only when there is an excess of generation.
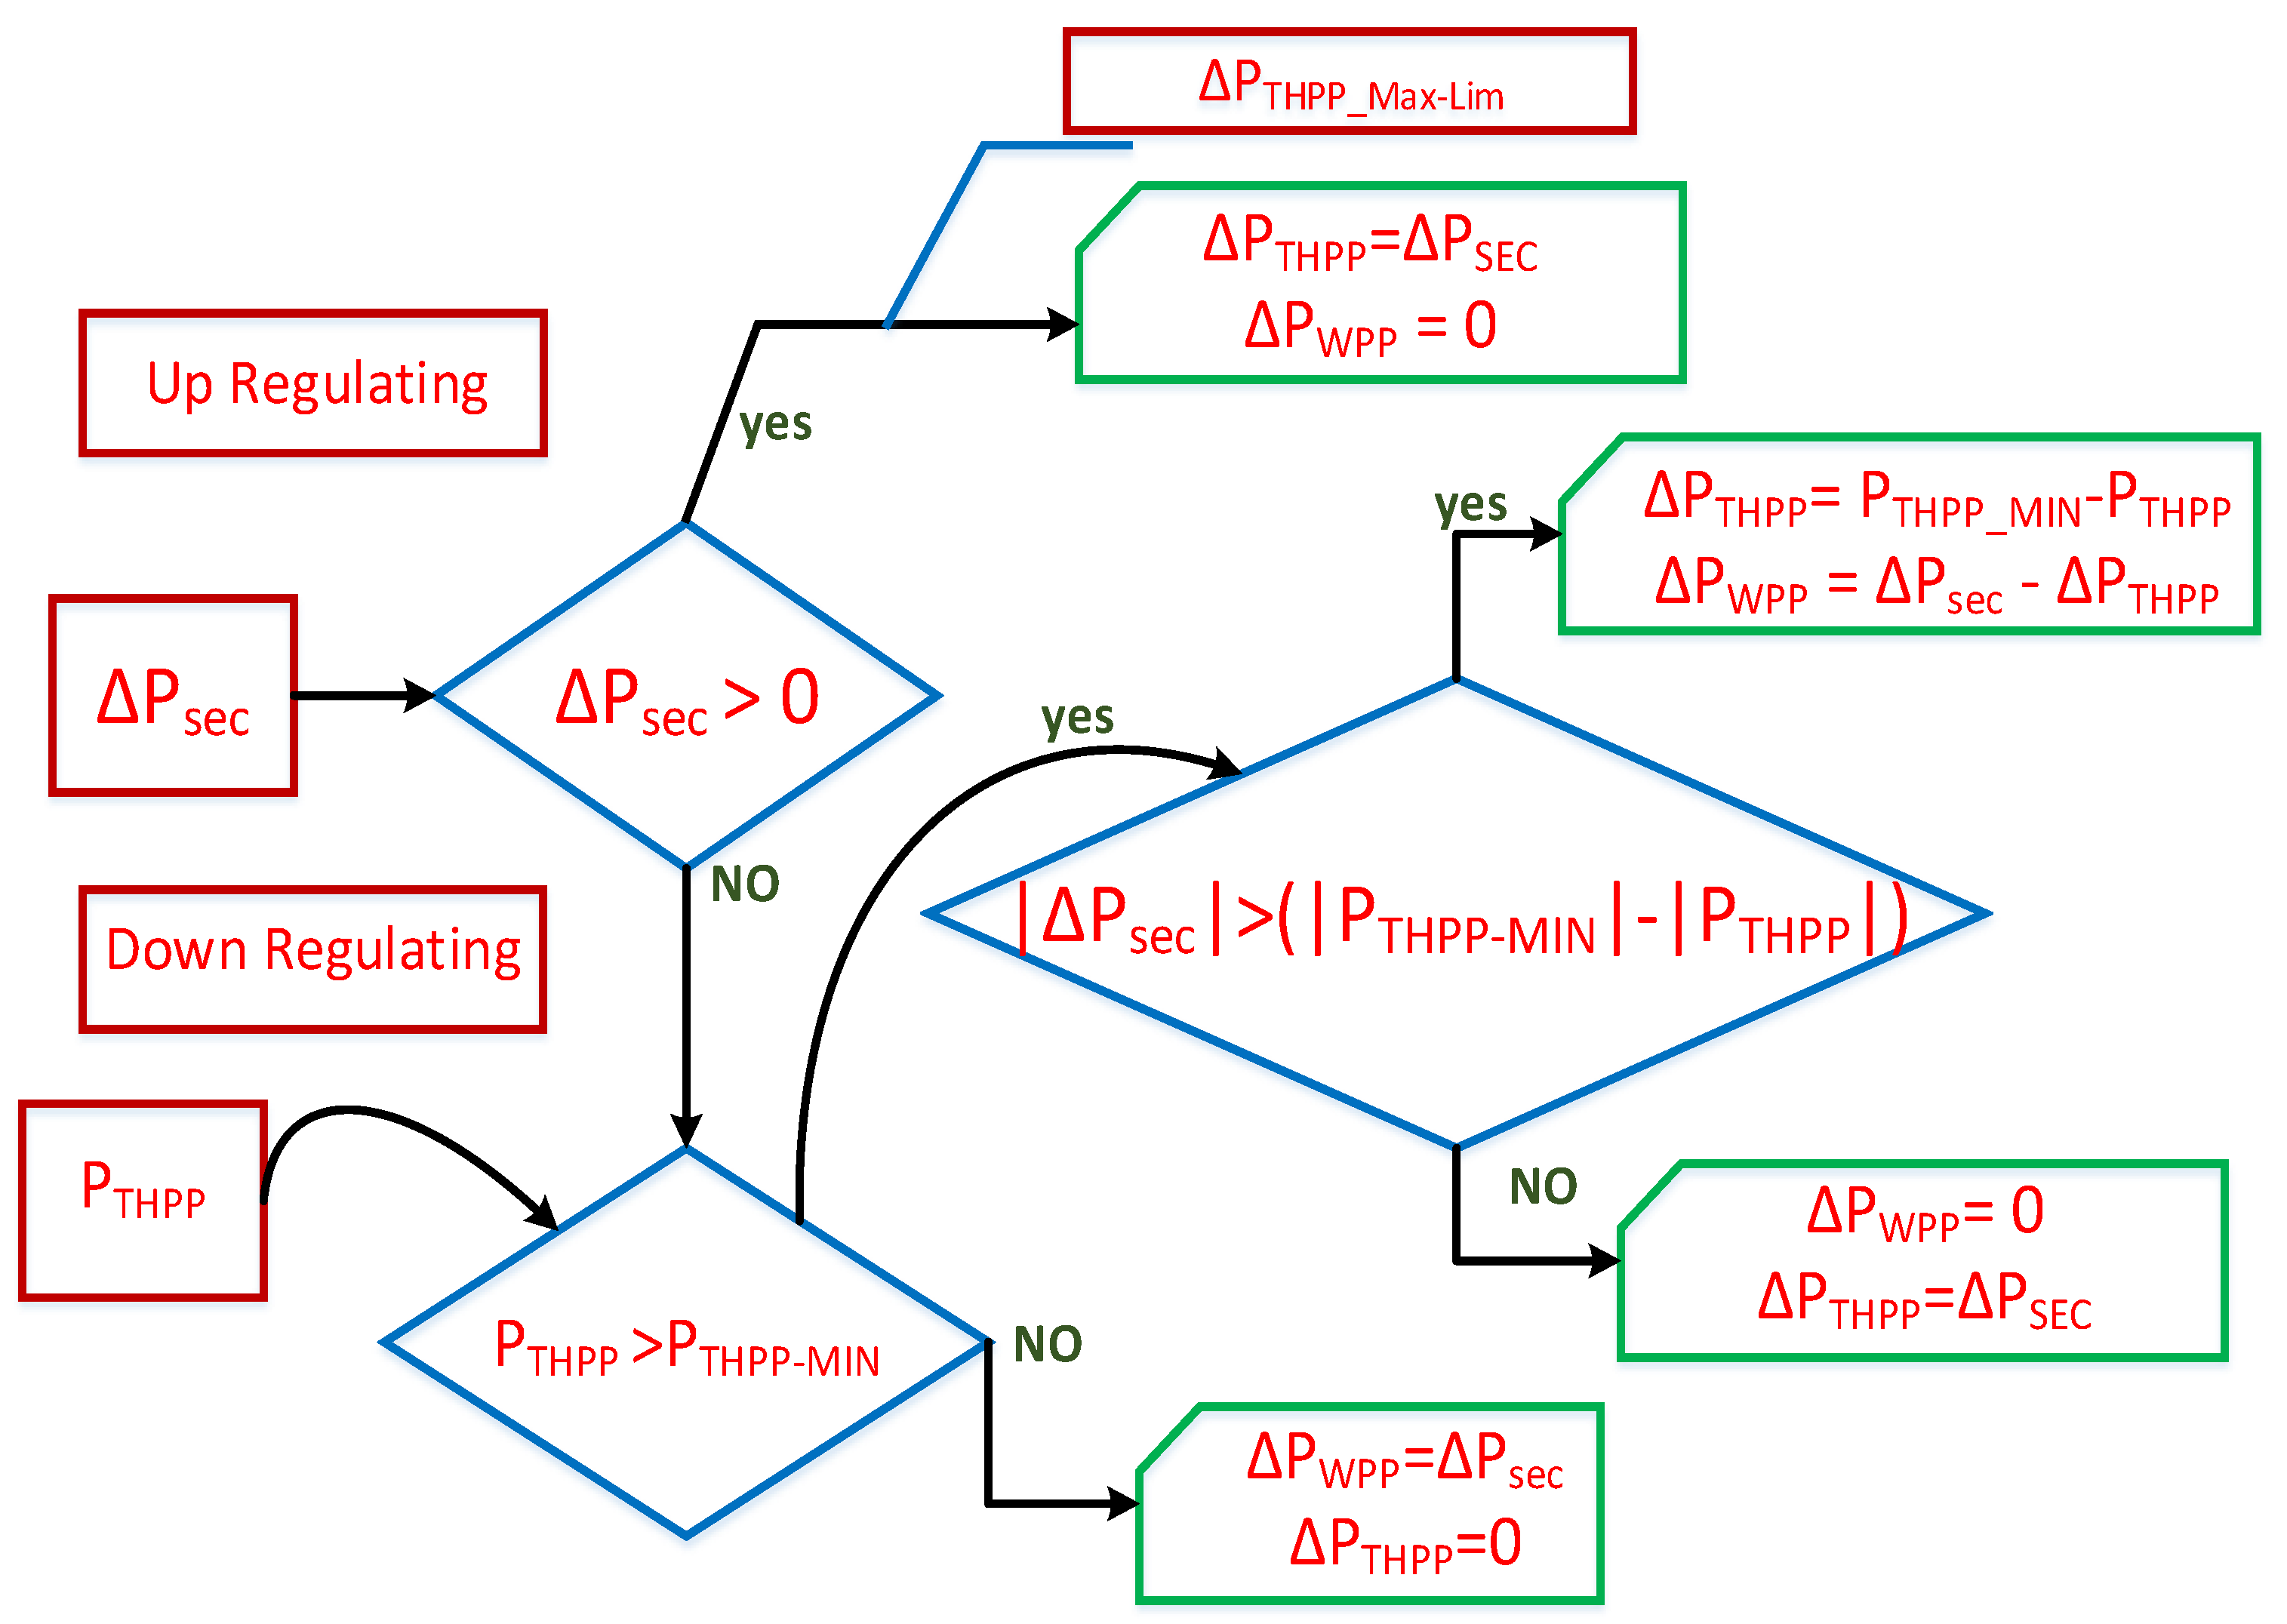
This case study investigates the behavior of wind power when it is integrated into the AGC operation for the power balancing process during the integration of large-scale wind power into the power grid. Specifically, in a situation when WPPs are contributing to the electricity production at a large scale, when the THPPs are operating at their lower limits and generating power cannot be further downregulated in the event of generation surplus. The proposed dispatch strategy is shown in
Figure 9, which is based on the cost minimization function. The activation of reserves from WPPs is processed only when there is an excess of generation that is,
, while THPP reserves (±100 MW) are activated in both excess and deficiency of generation power. In the proposed dispatch strategy, the production of power from the wind power plant reduces only when the THPP is running at its lower limit (
, which is generally set to 20% of its capacity, or when secondary dispatch from AGC hits its lower limit (
), i.e., −100 MW, the power from the WPP power is reduced. As the THPP is unable to contribute further to actual power regulation, the wind power plant dispatch will regulate the
by limiting energy output by system requirements. However, when positive regulation is necessary, i.e.,
, AGC initiates a command for the WPP, but it is unable to give the response since the WPP is already operating at its full capacity. In such a scenario, the whole response is provided through the THPP by activating its secondary reserves. Such regulation results in the utilization of WPP at its full capacity, allowing the THPPs to operate at their lower limits, thereby minimizing the overall operational cost and CO
2 emissions.
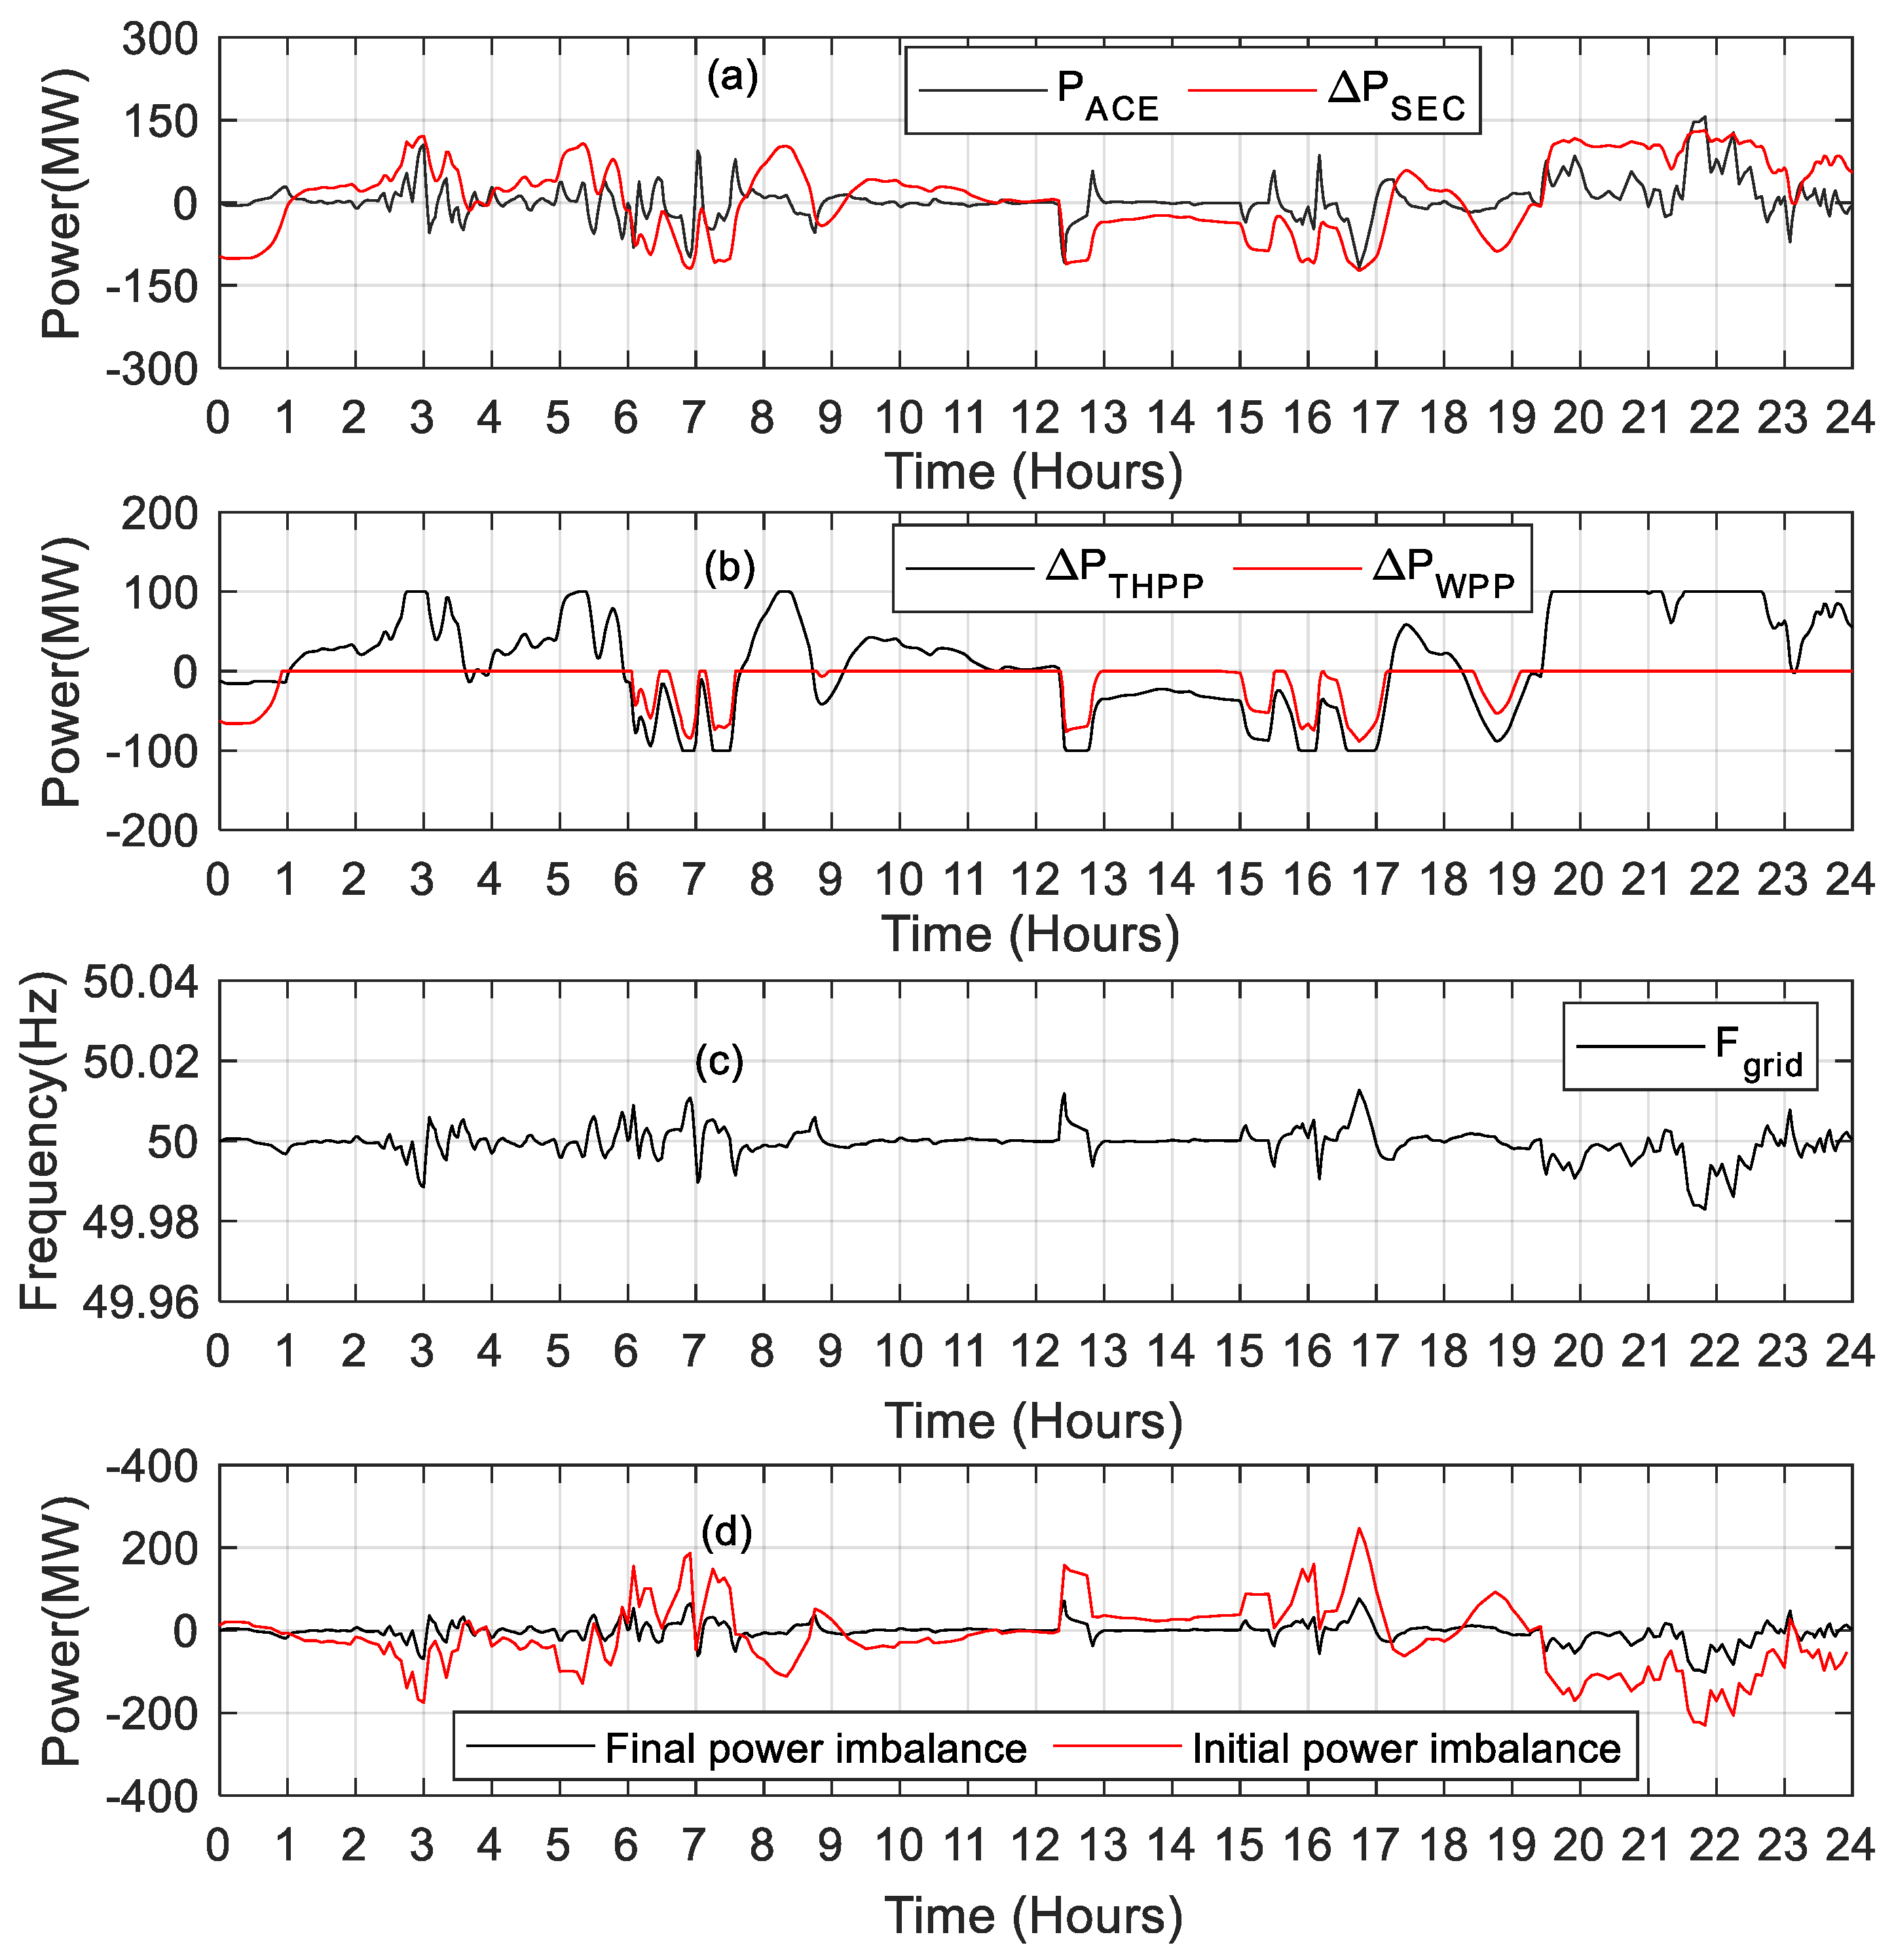
The real-time initial power imbalances are shown in
Figure 7d, which are required to be damped, in this case utilizing the regulating reserves from WPPs and THPPs. As stated in the aforementioned case study, initially, the speed governor installed on generating units detects these power imbalances as a function of frequency change and responds to them by activating the FCR. Subsequent to the activation of FCR, the AGC system activates FRR to restore frequency to its nominal level and releases the primary reserves. The AGCs respond based on the calculated ACE (
) signal in their respective power system. To determine the necessary secondary response (Δ
) from participating generating units, the PI controller uses the
as an input signal. Secondary dispatch determines the change in setpoints for active generating units (
and
), which are WPP and THPP in this case. The
and Δ
(total secondary dispatch) are drawn in
Figure 10a, in which Δ
lags
signal due to the delays in the AGC system and generating unit response. The resultant individual response (
and
) of the THPP and WPP system against the ACE is shown in
Figure 10b. WPP regulates its production according to the AGC command only, when THPP dispatch (
) touches the lower limit (−100 MW) or when operating at its lower generation limit (20% of the online capacity). The activation of FRR (
and
) minimizes the total power imbalances replicated in the form of
. The resultant frequency response of the grid following the AGC response is shown in
Figure 10c. Furthermore, in the
Figure 10d, it is illustrated that the integration of WPP has considerably reduced power imbalances in real-time, notably in cases of generating a surplus. Hence, the active penetration of wind power into the AGC dispatch strategy is an attractive solution for active power balancing control in power system networks with massive penetration of wind power.
4.3. Case Study 3: Power Imbalance Control through THPPs and EVs
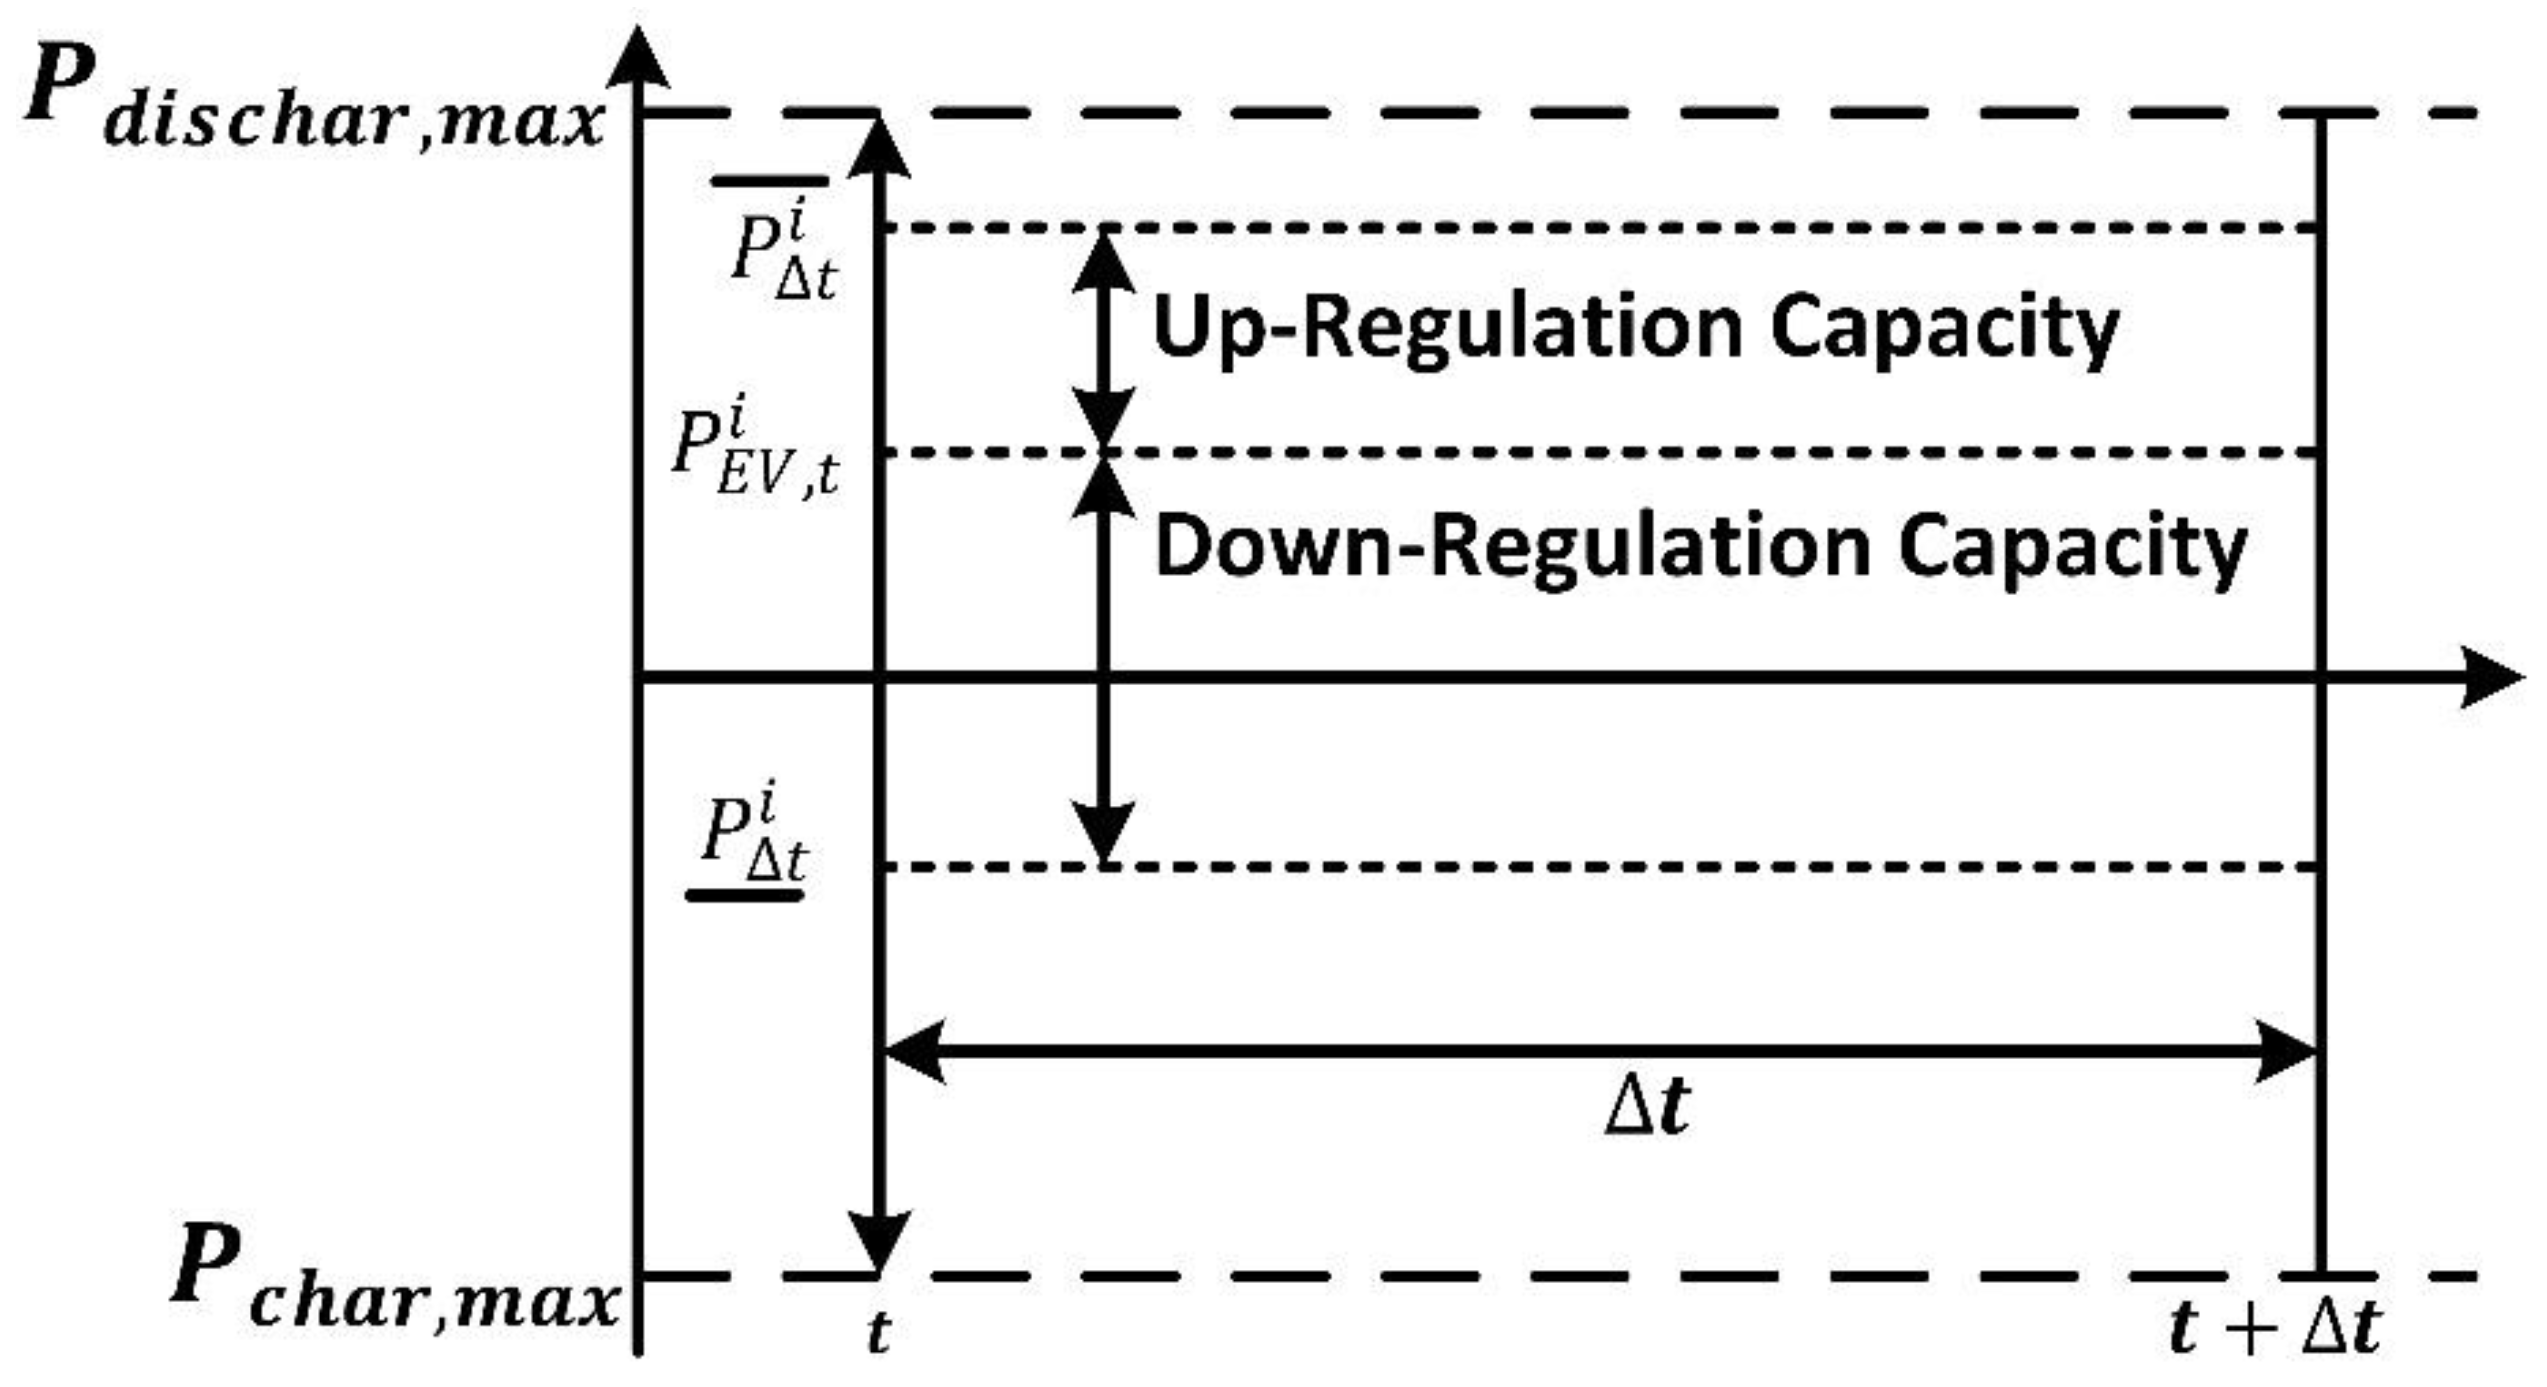
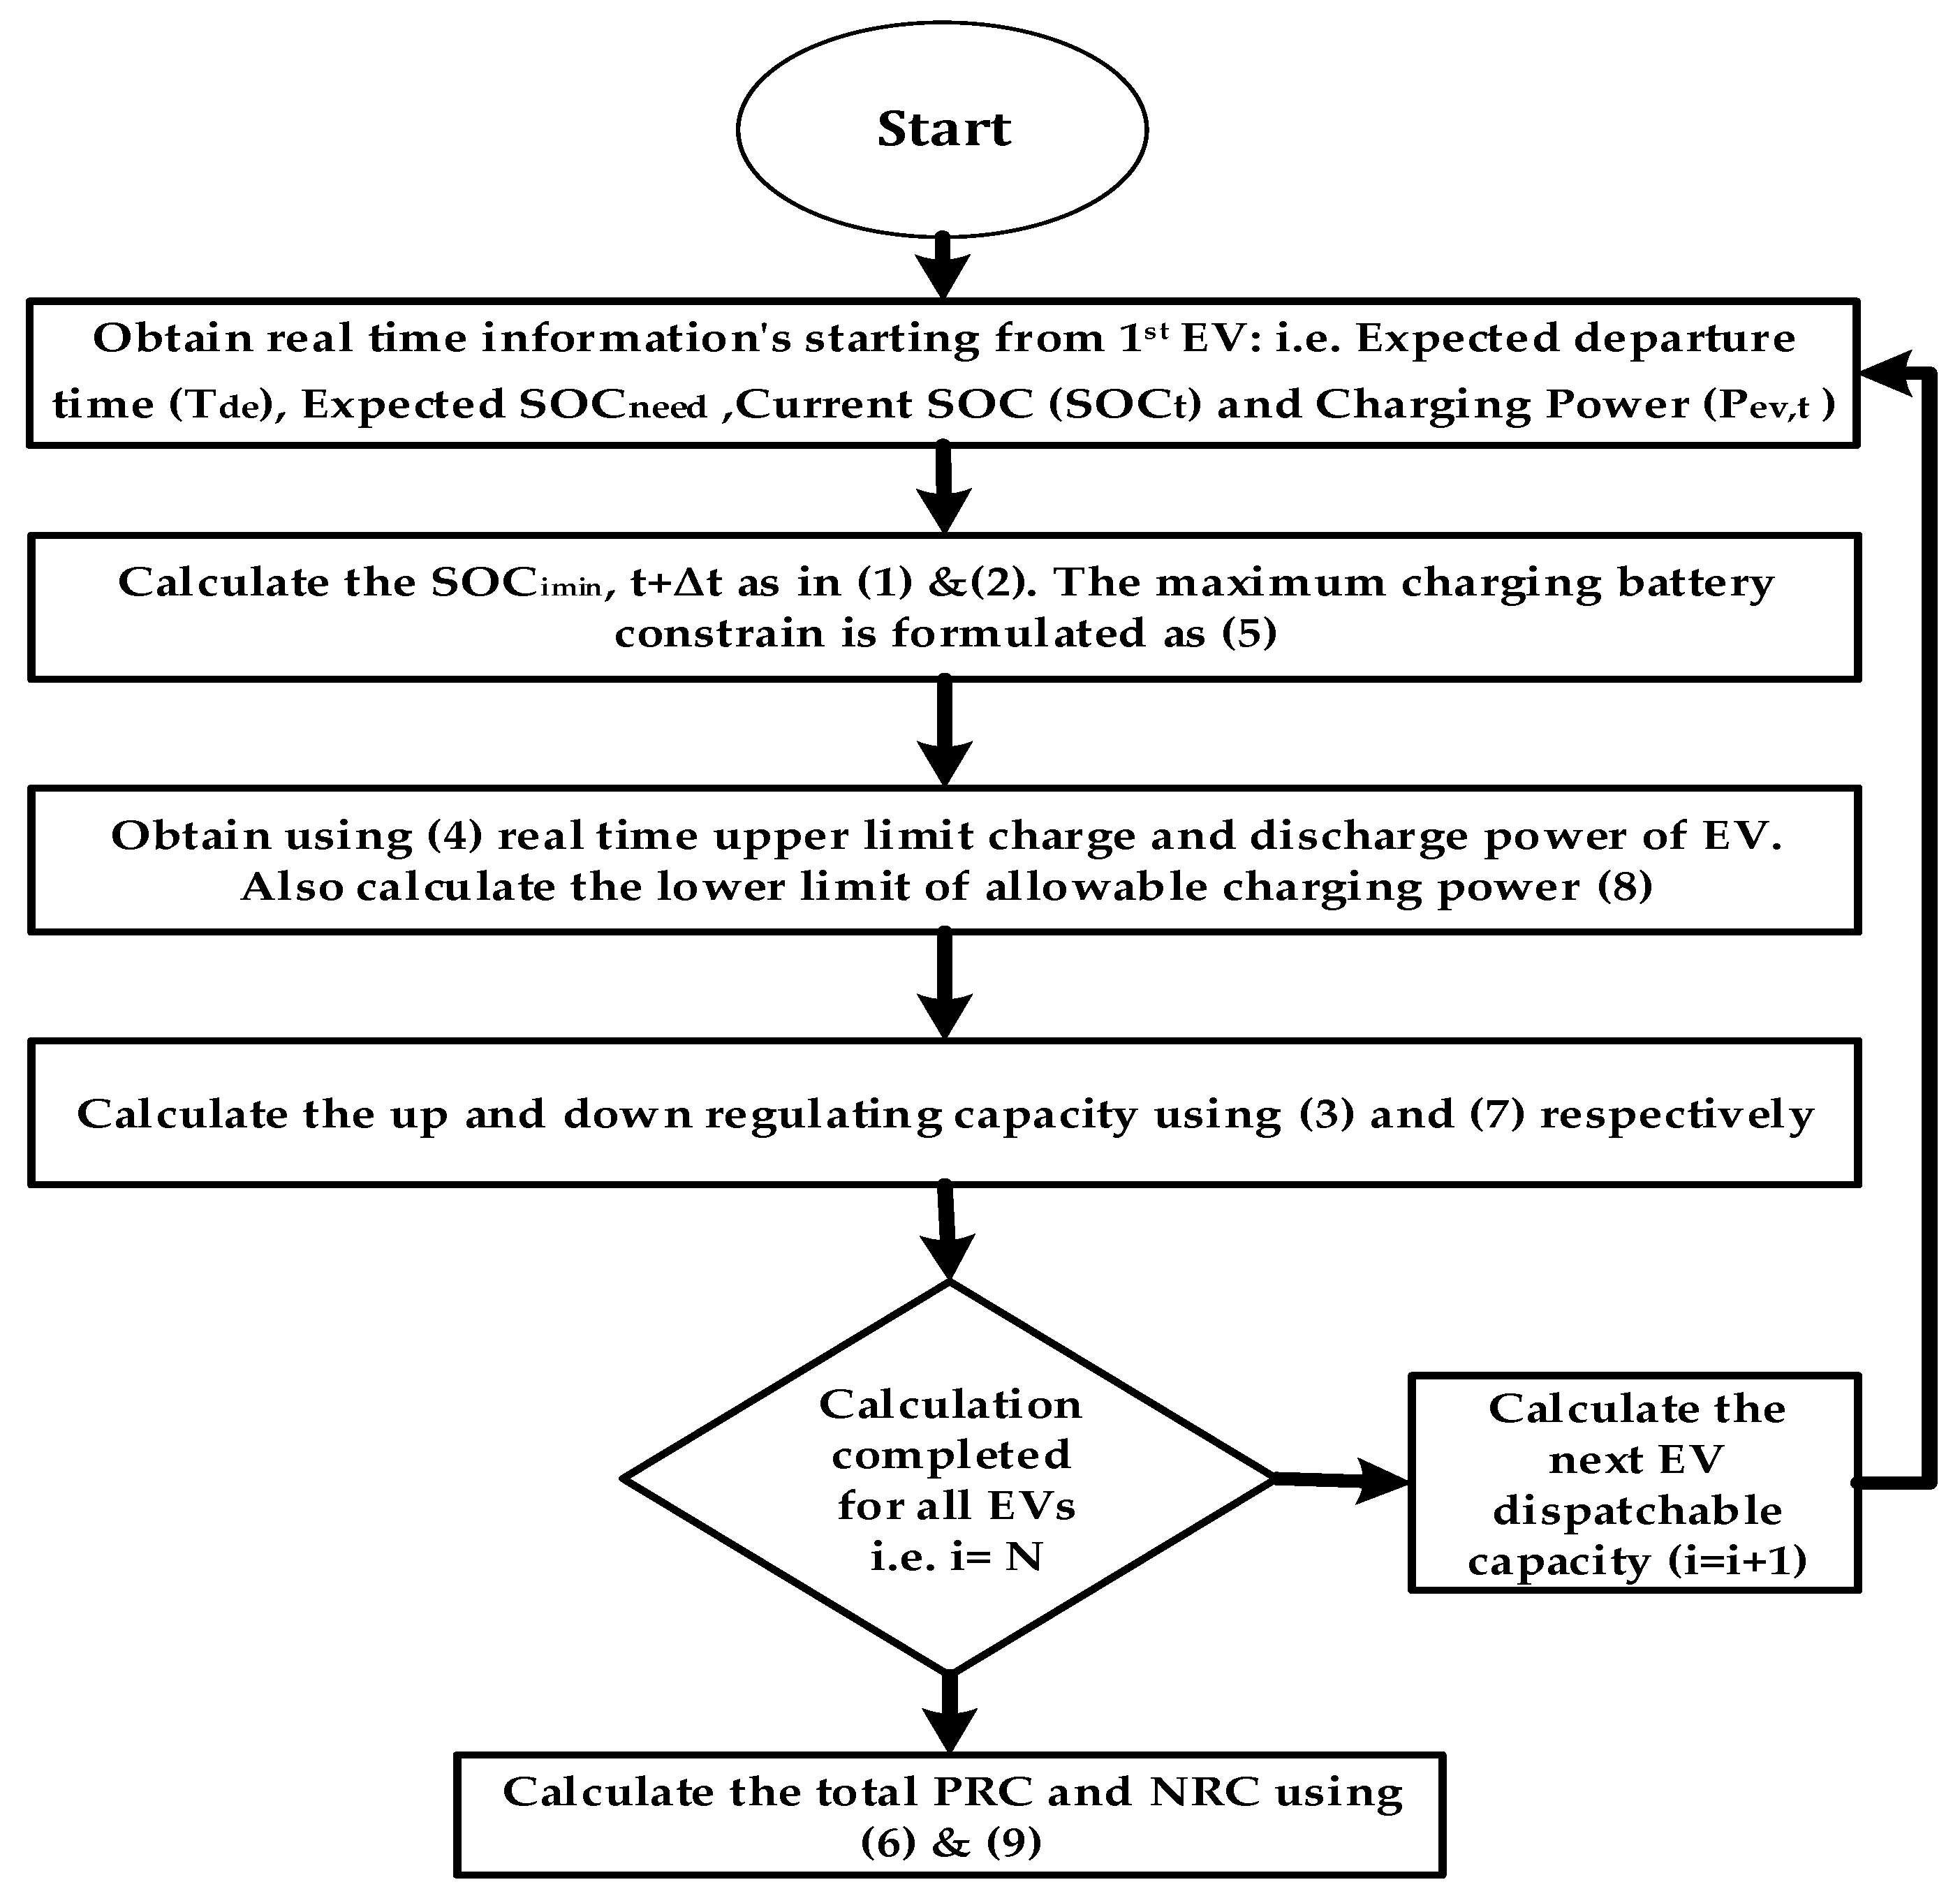
This case study investigates the active power control capabilities of EVs and a thermal power plant during the power balancing operation. The integration of EV in AGC dispatch process is of more concern, when power system grids are connected to a wide variety of wind power sources. The intermittent behavior of wind power often results in forecasting errors, which require the availability of reserve in the same manner as provided from a conventional power plant. As mentioned in
Section 2.4.1, a total ±75 MW regulatory power is provided from EVs through AGC, without compromising its primary responsibility. Hence, in this case, when there is any deviation in the system frequency, it generates the area control error (
which is minimized by the AGC through activation of secondary reserves combinedly from the THPP and EVs. The total primary response, in this case, is provided from generating units of THPP, GTPP and WPPs, while the secondary regulation is only provided through THPP and EVs.
The simulation parameters and time series for load and generation profiles are kept the same as those used in case study 1 and case study 2. The AGC dispatch strategy is shown in
Figure 11, which is based on the cost optimization process. Unlike case 2, EVs provide both positive and negative regulation capacities. The positive and negative regulation capacities are calculated through a process as shown in
Figure 5 of
Section 2.4, where different parameters are initially measured and then the calculation is performed for each dispatch interval to measure the PRCs and NRCs. The PRC operation is attained by reducing the load effect or by transferring the battery power back to the grid, while in the case of NRC the discharging power of the battery is increased. When positive regulation is required, i.e.,
, a command is initiated by AGC for the electric vehicle area (EVA) to utilize all its available reserves before the THPP responds. This is due to the lower incremental cost of power generated from electric vehicles. In case of a negative regulation process, the loading power of the batteries increases only when THPP is operating at a lower limit (
usually set to 20% of its capacity, or when secondary dispatch from the AGC reaches its lower limit (
), i.e., −100 MW.
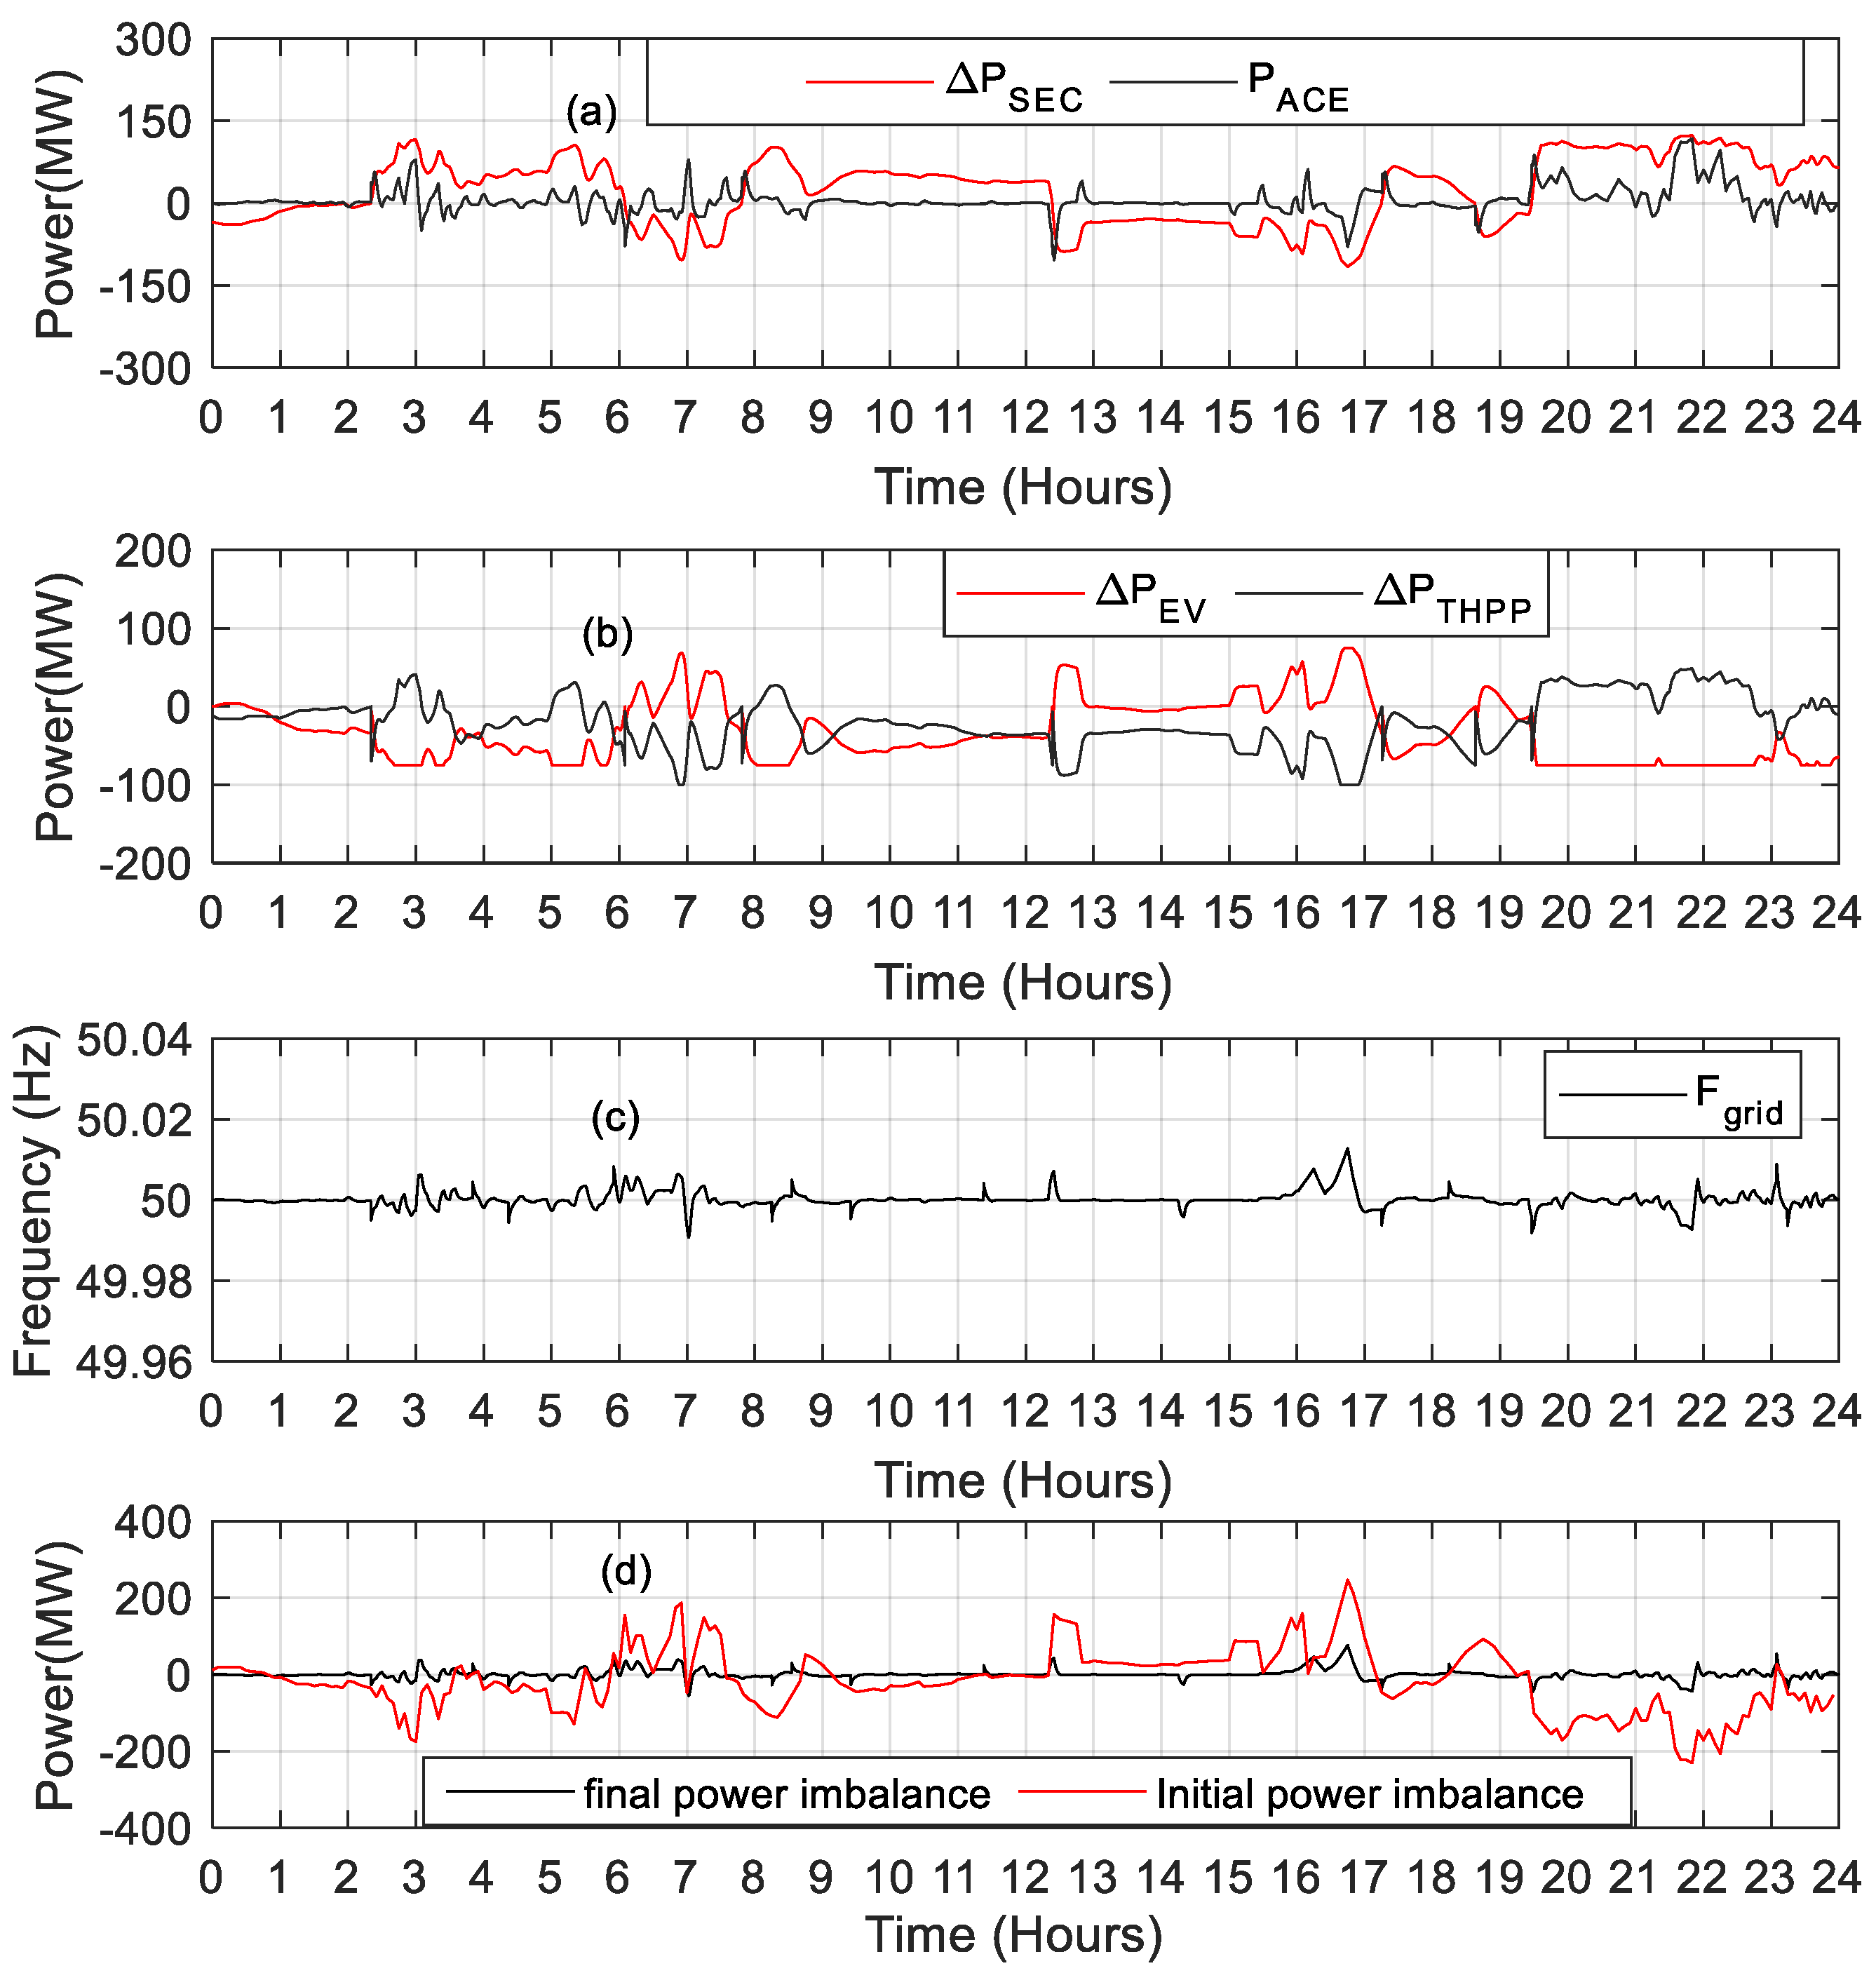
Figure 7d shows the initial imbalance between the demand and generation, which is compensated in this case through the AGC system by dispatching the reserve power from the EVs and THPP.
The total secondary dispatch (Δ
) from generating units participating in secondary response is shown in
Figure 12a, which follows the
signal. Here, in this case, the slow response is due to the delays associated with the AGC system and generating units. The secondary dispatch from generating units (
and
) is shown in
Figure 12b, from which it can be inferred that THPP responds only when all the reserve power from EVs are exhausted in the up-regulation process. In case of a negative regulation process, regulatory power from the thermal power plant is provided prior to the dispatch of power from EVs to reduce the incremental cost.
Figure 12c illustrates the resultant frequency deviations in the system grid following the AGC response in this case study. The comparison of real-time power imbalances before and after the AGC response is shown in
Figure 12d, from which it is illustrated that power imbalance has been significantly reduced in both the situation of generation deficit and generation excess. Furthermore, to quantify the EV response, AGC triggered a total of 1.8 GWh of energy from EVs throughout the generation shortage and generation surplus. Hence, it would be necessary for a power system to use a significant number of conventional power plants if EVs are not used to deal with the active power imbalance in a power system with large wind power integration.
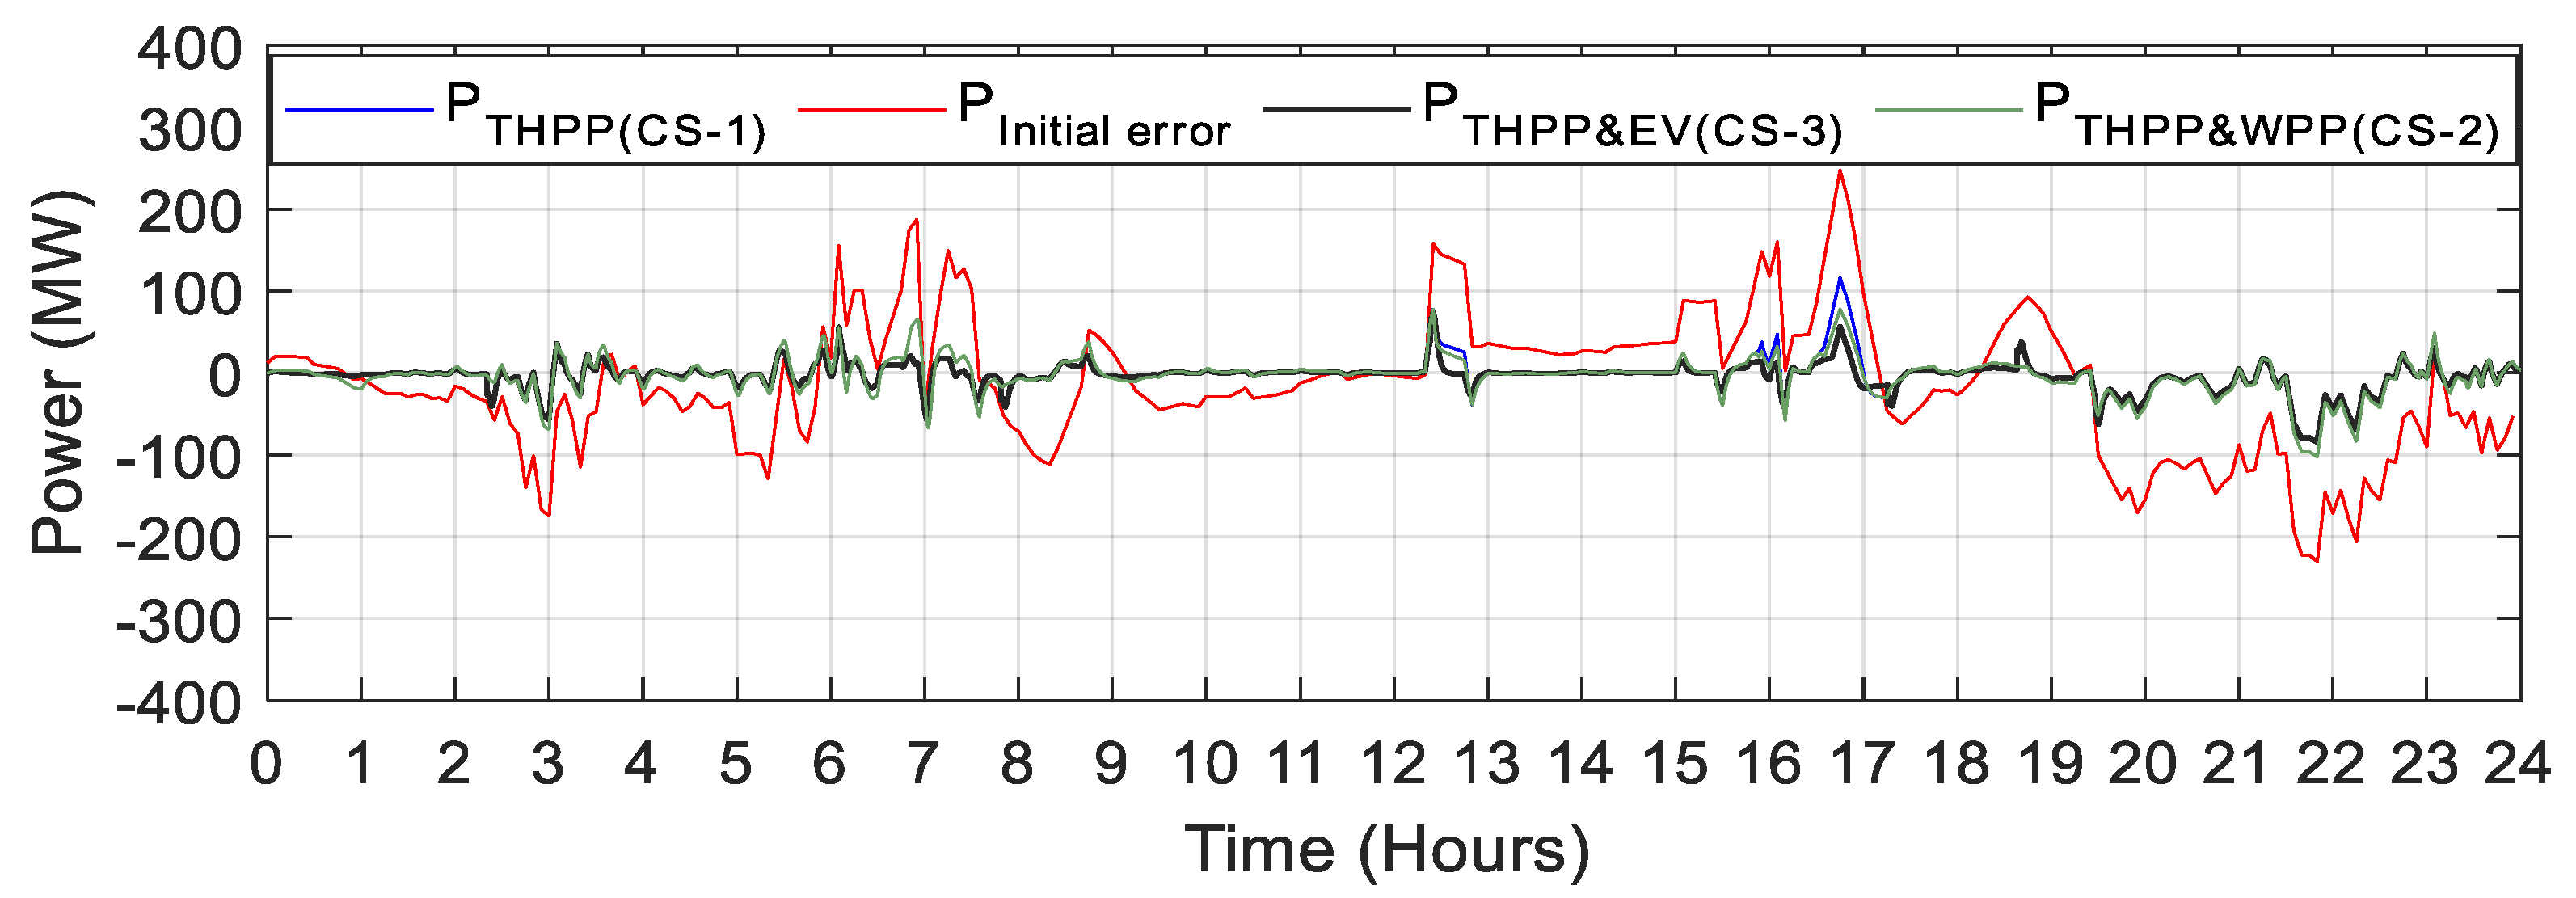
5. Comparative Analysis
This section provides detailed analysis of the different results achieved during the aforementioned case studies, where the regulation power from different power plants, including the electric vehicles, is utilized to minimize the initial power imbalances engendered in the power system network due to the forecasting issues of wind power plants. In
Figure 13, the error resulting from initial power imbalance is compared with the rest of the results. The peak curve of initial power imbalance (red color line) almost crosses the
figure, which is then reduced by activation of secondary reserves from different generation sources through the AGC system.
In the first case study, the reserves power is activated from a thermal power plant system, which is limited to ±100 MW. Hence, in this case, when the imbalances crossed
, they remained in the power system due to the limitation of regulation reserves on thermal power plants. The final imbalances resulting from the first case study can be seen in
Figure 13 (blue line). It is important to mention that the response time of a thermal power plant depends on the boiler of the power plant, which ranges from 6–7 min. However, owing to the delay associated with the AGC system, the total response of AGC is slower than this figure. Furthermore, the resultant area control error after AGC response is quantitively expressed in
Table 2, which illustrates a considerable decrease in magnitude of error. Hence, the utilization of thermal power plants for active power control is a better remedial source, however, it results in the increased cost of operation and environmental stresses. To counter these problems, the 2nd case study integrates the wind power plant capacities along with a thermal power plant to regulate the area control error
. The proposed control strategy in this case is based on the cost-effective optimization function, keeping in view the wind curtailment issues during the positive regulation process. Therefore, in this case, wind power contributes only to the negative regulation process (
. Furthermore, during the negative regulation process, the production of power from the wind power plant reduces only when THPP is running at its lower limit
, which is generally set to 20% of its capacity, or when secondary dispatch from the AGC hits its lower limit (
), i.e., −100 MW. The final imbalances resulting from this case study are drawn in
Figure 13 and are represented in green color, while
Table 2 shows the quantitative magnitude of area control error following the AGC response. The results from case study 2 illustrate a better response of AGC by integrating the wind power capacities. Moreover, the black line in
Figure 13 represents the results from case study 3, in which reserves power from electric vehicles is activated along with the thermal power plant to counter the initial power imbalances engendered due to forecasting errors of the wind power plant. In this case study, the proposed dispatch strategy is based on the cost-effective optimization process, in which positive regulation power from the thermal power plant is only provided when reserves from EVs are exhausted completely. However, the reverse is true in the case of negative regulation process.
Table 2 provides a quantitative comparison of initial imbalances with final imbalances. The results from case study 3 show a better response in terms of the reduction in area control error, as both sources contribute in positive as well as negative regulation processes.
6. Conclusions and Future Directions
This research work carried out a detailed analysis on providing active power support to highly wind-integrated based power systems utilizing wind power and EVs’ capacities along with thermal power plant systems. Wind-based power systems always possess an intermittent nature resulting in forecasting errors, which creates a power imbalance between demand and generation. The increased demand in the reserve requirement is fulfilled by providing additional operating reserves from conventional generation sources, which are not only economically impracticable, but also increase environmental stresses. This research work has proposed real-time dynamic dispatch strategies for the AGC system to utilize wind power and EVs’ capacities in secondary-power dispatch processes. The proposed dynamic dispatch strategies are implemented by developing the AGC system and incorporating power from generating units and electric vehicle areas. Power generating units including thermal power plants, gas turbines and wind power plants were modelled for the active power regulation purpose considering their characteristics of long-term dynamic simulation studies. Furthermore, EVAs were meticulously modelled to investigate their behavior during AGC operation. Three case studies were presented, in which the performance of the proposed AGC system was analyzed utilizing the supplementary reserves from the THPPs, WPPs and EVs. In the first case study, the response of AGC was provided using a thermal power plant system with limited reserves. The resulting response was having a longer response time and an increased operational cost, which were improved in the second case study by utilizing the reserves from WPP along with the THPP system. The utilization of wind power reserves improved the AGC operation by allowing the THPP to operate at their lower limits, thus reducing the operation cost and increasing the security of the system. In the third case study, electric vehicles were integrated into the proposed AGC system along with the THPP to provide both positive and negative regulation services. The performance analysis shows that wind power plants and EVs along with THPP can effectively help in reducing real-time power imbalances acquainted in the power system due to the large-scale integration of wind power and subsequently improve the power system security. Furthermore, the proposed dispatch strategies also reduce the operational cost of the system by utilizing minimum power from conventional power plants.
The study can be extended in the future to an AI-based AGC system, where AI techniques can be used to forecast different grid operational parameters that will make the power system operation more reliable and secure. Furthermore, the present control system was designed for a power system with a significant level of inertia. The suggested control system can be used in future work at the micro-grid level, where system inertia is minimal due to the integration of large-scale renewable energy sources. Moreover, building loads, which are used for heating or cooling purposes, contribute a major share in worldwide energy consumption. Therefore, the integration of building loads along with EVs in the proposed control strategies are required in the future, which might fully replace the reserve capacity obtained from conventional generation sources.


