Article

CO2 Emissions and Economy of Co-Firing Carbonized Wood Pellets at Coal-Fired Power Plants: The Case of Overseas Production of Pellets and Use in Japan

1
Energy Transformation Research Laboratory, Central Research Institute of Electric Power Industry, 2-6-1 Nagasaka, Yokosuka 240-0196, Japan
2
Grid Innovation Research Laboratory, Central Research Institute of Electric Power Industry, 2-6-1 Nagasaka, Yokosuka 240-0196, Japan
3
Institute of Engineering, Tokyo University of Agriculture and Technology, 2-24-16 Nakacho, Koganei 184-8588, Japan
*
Author to whom correspondence should be addressed.
Energies 2022, 15(5), 1770; https://doi.org/10.3390/en15051770
Submission received: 25 January 2022 / Revised: 21 February 2022 / Accepted: 23 February 2022 / Published: 27 February 2022

Abstract

:
CO2 emissions reduction from coal-fired power plants is an urgent issue in Japan, as well as around the world. The purpose of this study is to estimate the CO2 emissions and economy of using carbonized wood pellets produced overseas and co-fired at coal-fired power plants in Japan. We examined carbonized wood pellets produced in Canada and Vietnam, since those countries are major exporters of wood pellets for Japan. The results obtained are as follows: (1) The CO2 emissions and calculated cost per calorific value of carbonized wood pellets (CP25), which have a fixed carbon content of 25 wt.%, are lower than those of wood pellets at the port of import in Japan. When the fixed carbon of carbonized biomass is controlled at 25 wt.% or more via a carbonizer, sufficient pyrolysis gas (the heat source used for drying and carbonization without auxiliary fuel) can be obtained. (2) Carbonized wood pellets manufactured in Vietnam are more economical than those manufactured in Canada, since the resource of wood is less expensive and the transportation distance is shorter from Vietnam compared to Canada. (3) When carbonized wood pellets at CP25 are co-fired in coal-fired power plants, they do not affect the cost of the electricity generated, even if the carbonized pellets are blended at a high ratio.

1. Introduction

Coal-fired power generation accounts for about 30% of the total amount of power generated by general power utilities and is one of Japan’s main sources of power [1]. CO2 emissions reduction from coal-fired power plants is an urgent issue in Japan, as well as around the world. One of the measures used to reduce CO2 emissions is the co-firing of wood biomass [2,3,4,5,6,7]. However, the calorific value and bulk density of wood biomass are lower than those of coal, so transportation and storage are inefficient. In addition, since wood biomass is fibrous, the grindability of coal is reduced when wood biomass is blended and pulverized with coal. For this reason, the biomass co-firing rate at existing pulverized coal-fired power stations is about 3–4% on a calorific basis [8]. The carbonization of wood biomass serves to improve energy density [9], grindability [10,11,12], and combustibility. Carbonized wood pellets (CP) can be used at high co-firing rates at existing coal-fired power plants without structural modifications, and they could reduce CO2 emissions from existing coal-fired power plants drastically [13,14,15]. However, as the resource potential of wood biomass in Japan is limited, an effective approach would be to produce CP overseas using wood biomass, and then import them for use at coal-fired power plants in Japan. In previous studies, it has also been reported that the use of carbonized biomass for energy is environmentally friendly and economical [16,17,18]. In order to further clarify the of this approach feasibility in Japan, it is necessary to design an actual-scale carbonizer and estimate the optimum operating conditions based on carbonization experiment results [19]. Furthermore, based on this information, it is essential to estimate the CO2 emissions and costs related to producing CP overseas and transporting them to Japan.
The purpose of this study was to estimate the CO2 emissions and economy of CP produced overseas and co-fired at coal-fired power plants in Japan. We assumed that CP are produced in Canada and Vietnam, since they are the major exporters of wood pellets for Japan. In addition, we compared CP with wood pellets (WP) that had already been imported and examined the differences in CO2 emissions and fuel costs.

2. Methodology

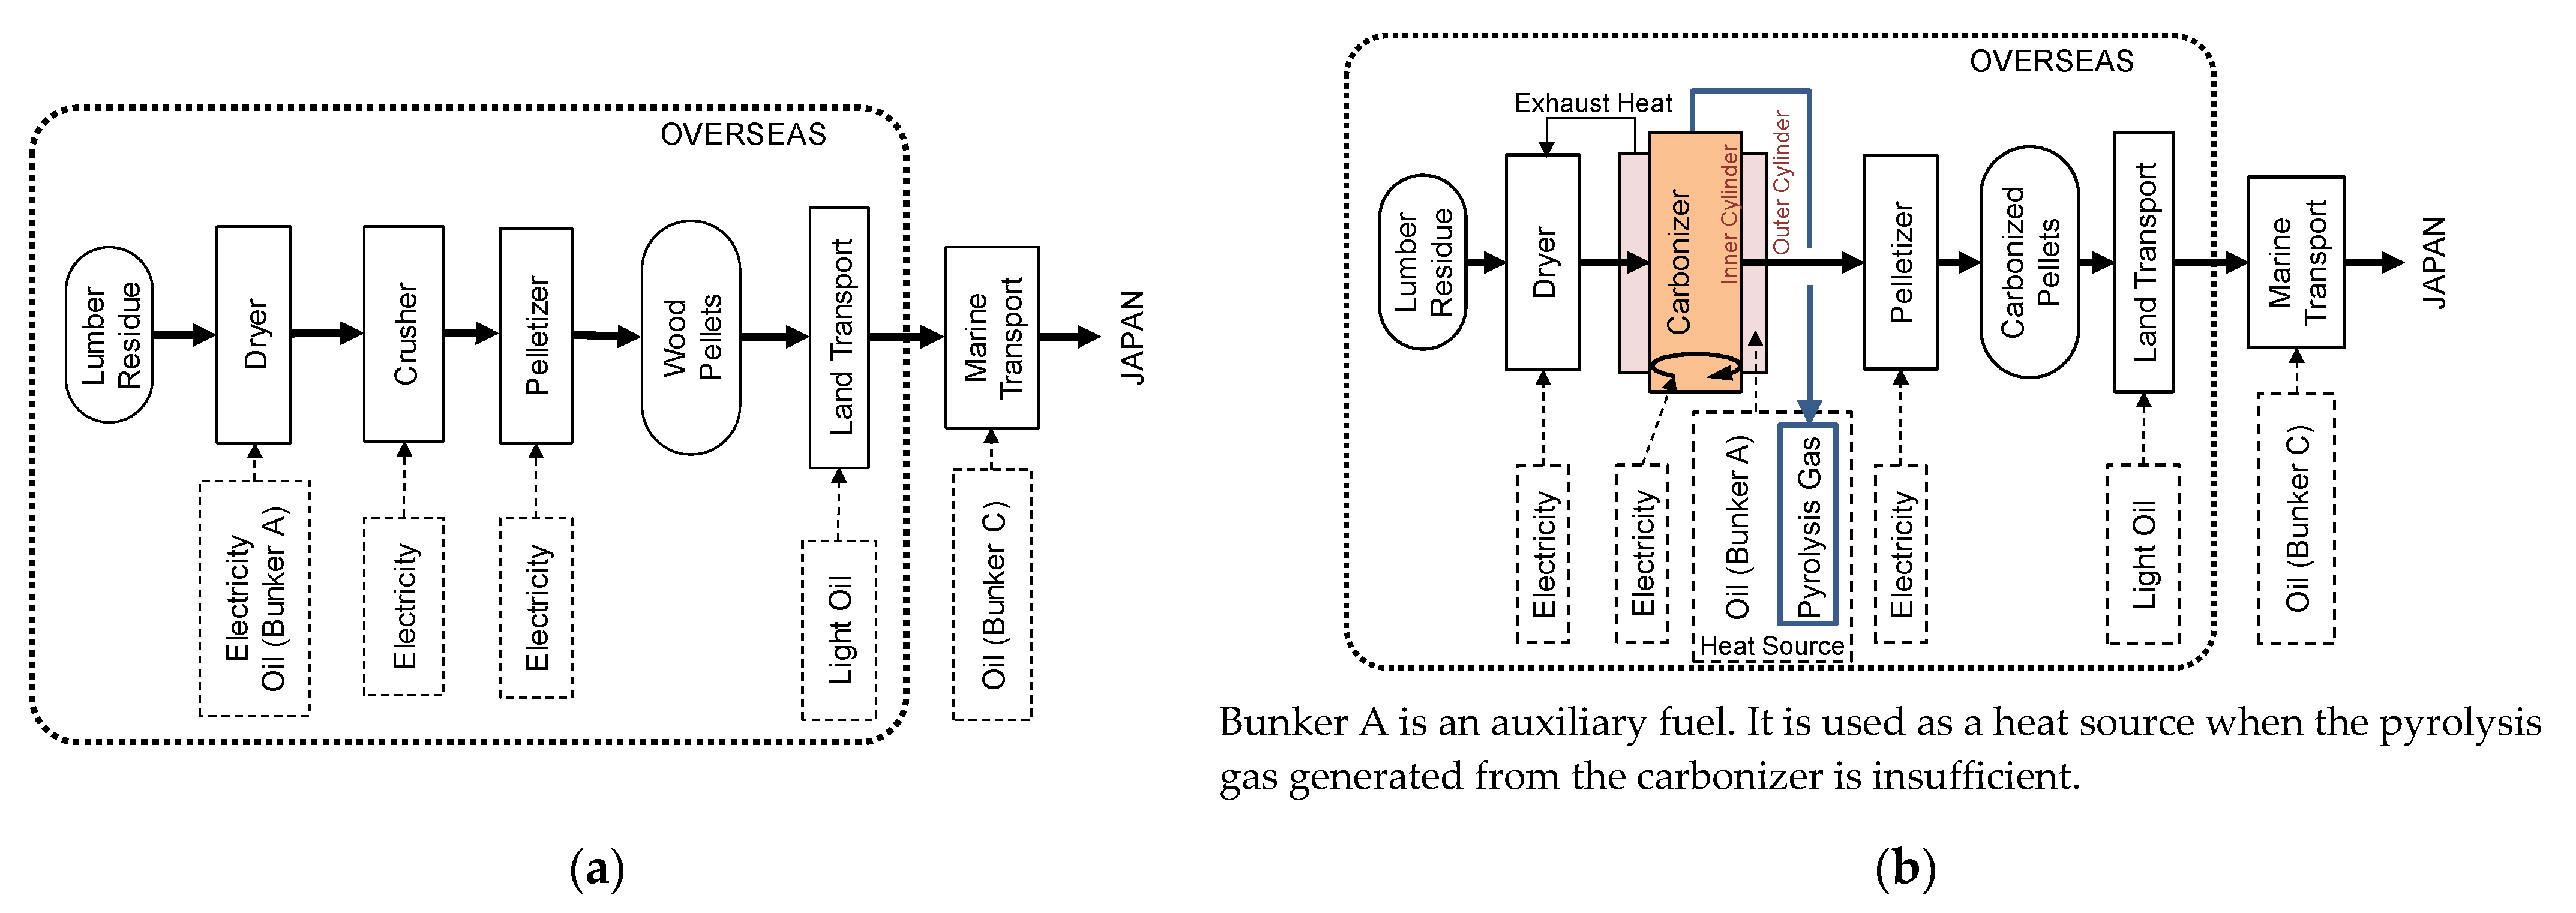
2.1. Assumptions of Fuel Production Process

Figure 1 shows a flow chart of WP and CP production and transportation processes. We assumed that lumber residue from sawmills was used as the raw material for WP and CP. The torrefaction process using wood pellets as a raw material was beyond the scope of this study. Bunker A was used to dry the raw material, and electricity was used in the dryer, crusher, and pelletizer. However, in CP, the combustion heat of the pyrolysis gas generated in the carbonization process was used as the carbonization heat source and the drying heat source. If the combustion heat is insufficient, Bunker A was added for auxiliary fuel. Canada and Vietnam, two countries which export large volumes of WP to Japan [20], were selected as the countries of production of WP and CP. WP and CP were transported overland in containers from a local mill near the port of export, and then via a bulk carrier to a Japanese port.

2.2. Assumptions of Transportation Conditions of WP and CP

We assumed that forty-foot containers (with a maximum load capacity of 26 tons) would be used for the land transportation of the produced WP and CP, and that light oil-fueled trucks would carry them. Meanwhile, Bunker C would be used as fuel for marine transportation. Table 1 shows the fuel production sites in Canada and Vietnam and the specifications of the transportation to Japan.
The energy consumption during land transportation was calculated using Equation (1) [21].
Energy consumption (L) = Cargo weight (t) × Transportation distance (km) × Fuel consumption intensity (L/t/km)
As derived from Reference [21], 0.0285 (L/t/km) was used as the fuel consumption intensity, with a maximum load capacity of 12–17 tons (at a loading rate of 100%).

2.3. Cost Estimation

For cost estimation, the levelized cost of fuel (LCOF) given by Equation (2) was used. This equation of LCOF is the same concept as the levelized cost of electricity (LCOE) method adopted by the IEA report [22].
L C O F = n = 1 N t = 0 t = t m a x ( I n ,   t + O n ,   t + T n ,   t ) ( 1 + r ) t t = 0 t = t m a x ( P t ( 1 + r ) t )
Here, I is the initial cost, O is the operation cost, T is the transportation cost, P is the fuel production amount, r is the discount rate, and tmax is the number of years of operation. We set r = 5% and tmax = 15 years.
The initial costs of the facilities for WP and CP production are shown in Table 2, with reference to the values in Reference [23]. The assumed O&M cost is shown in Table 3.

3. Results and Discussion

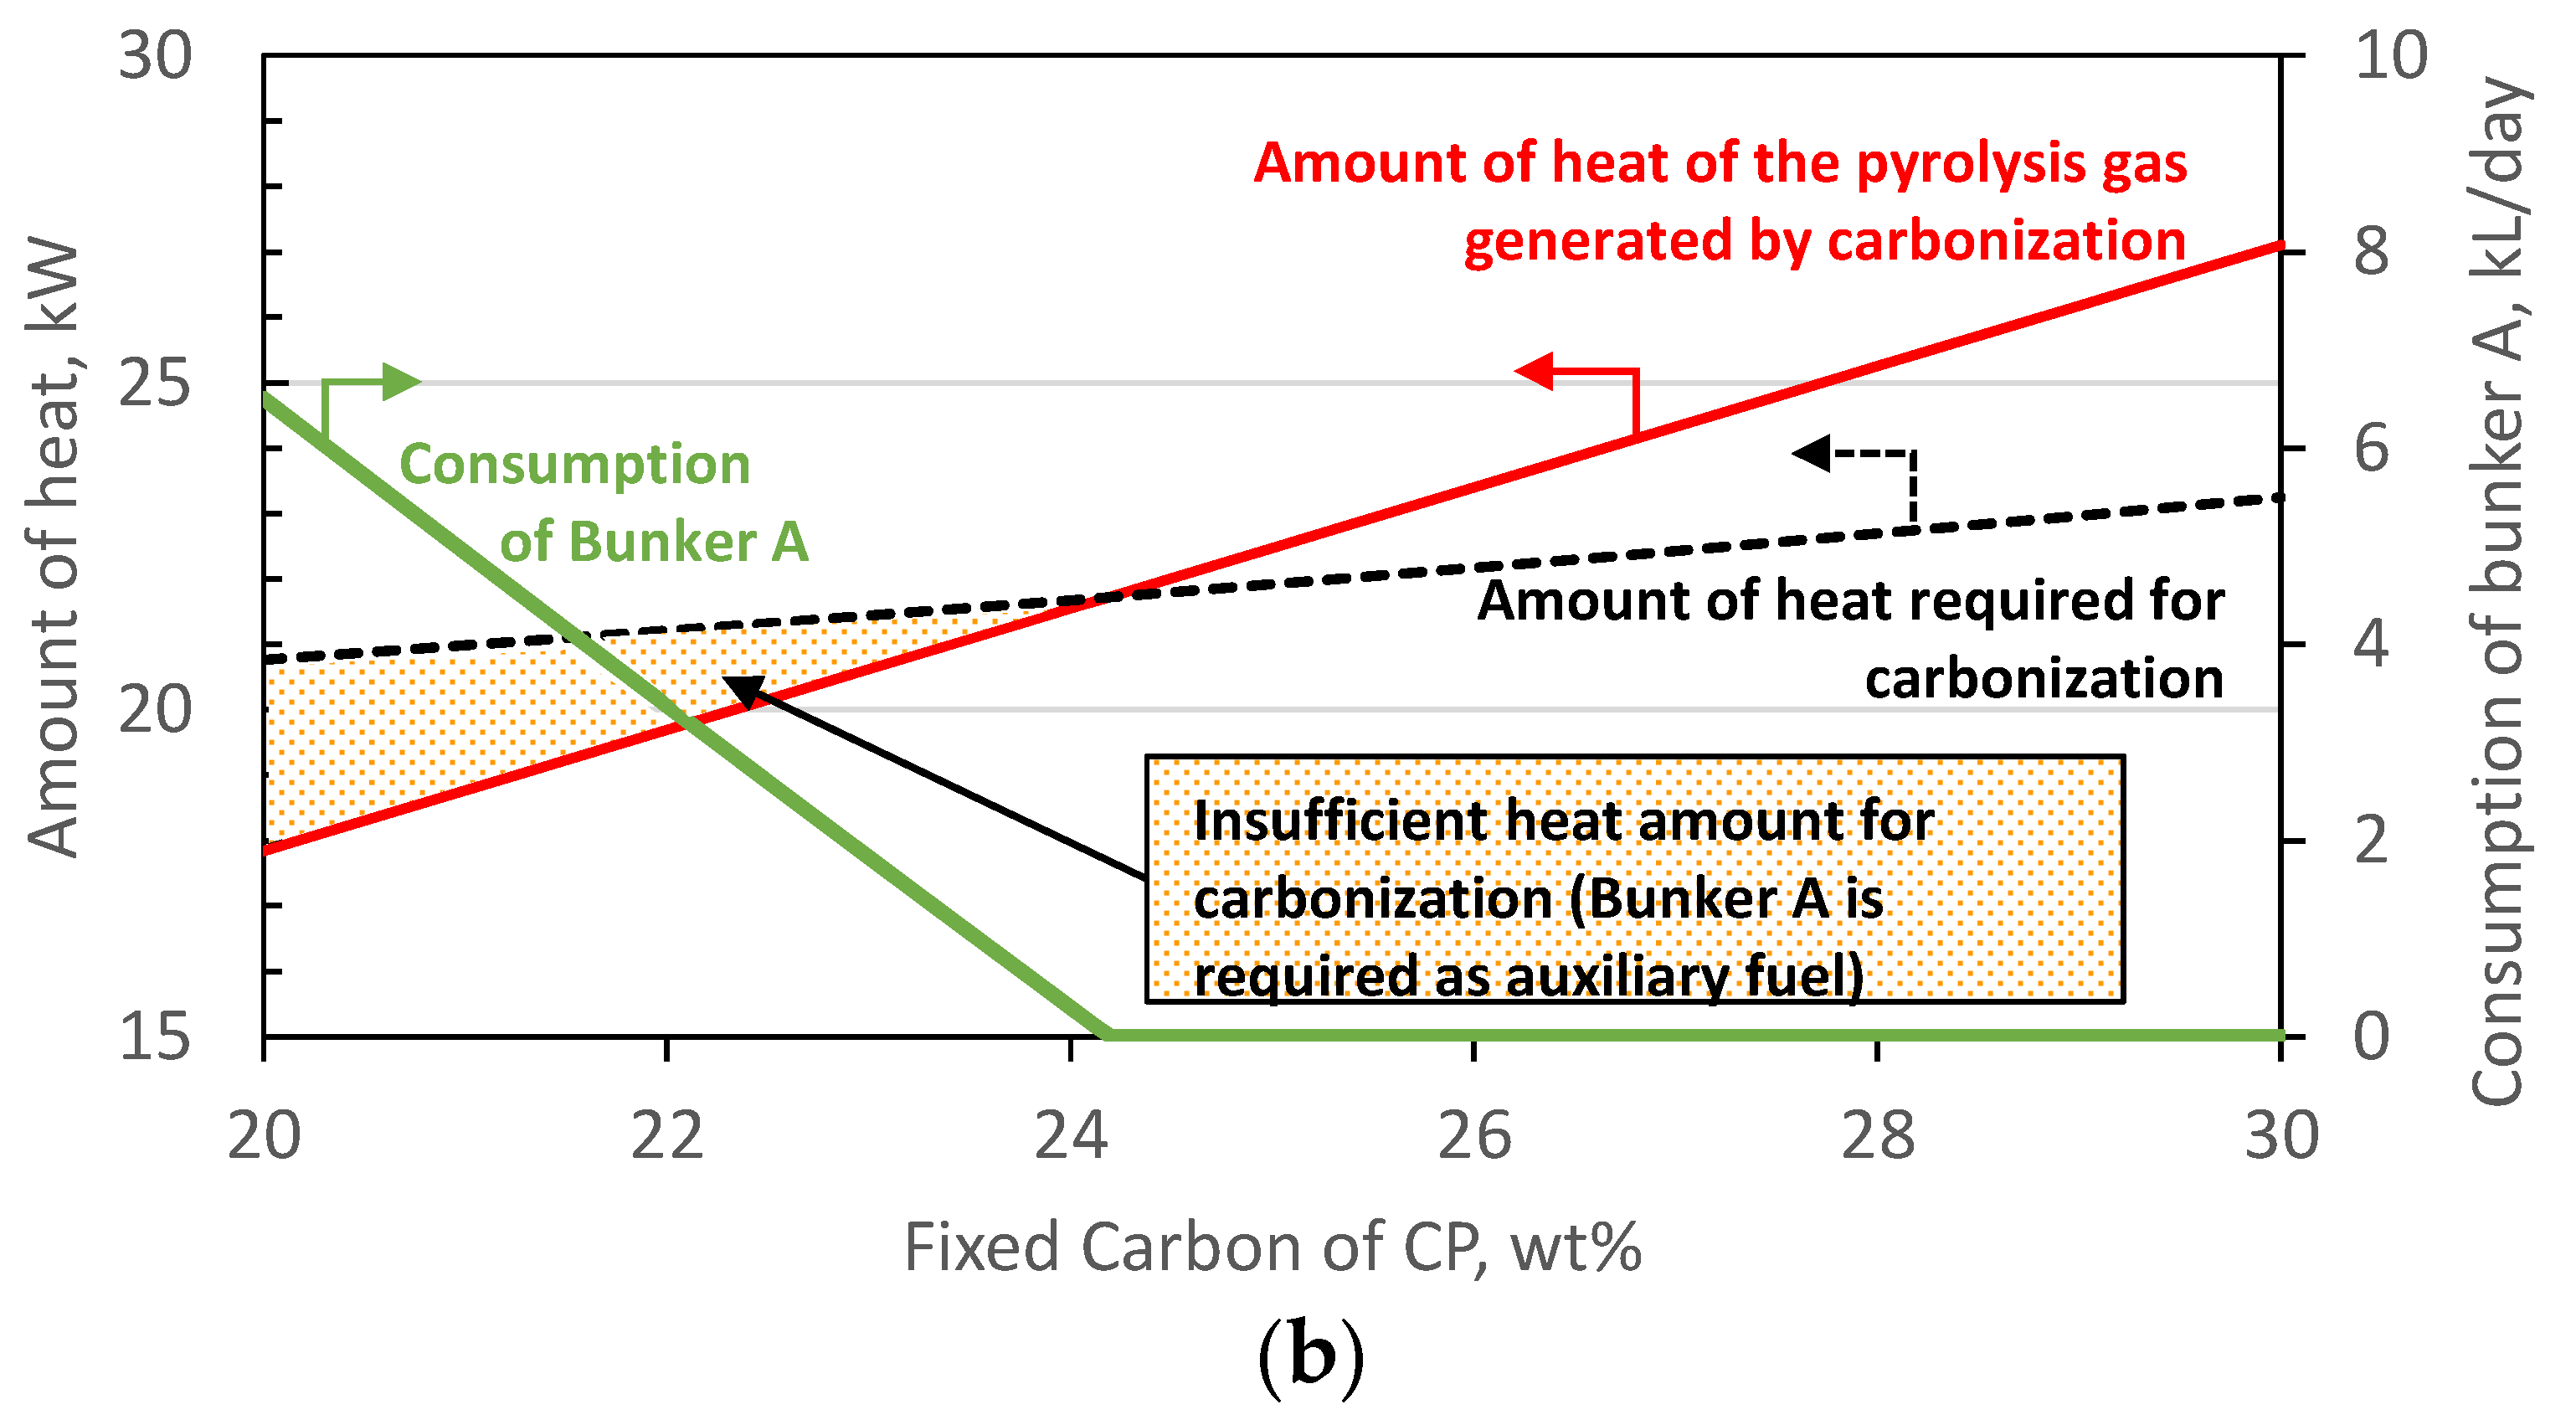
3.1. Estimation of Energy Consumption during Production of WP and CP

We conducted several wood biomass carbonization experiments with Mitsubishi Heavy Industries Environmental and Chemical Engineering Co., Ltd., Yokohama, Kanagawa, Japan and thus had already obtained energy balance data [27]. The heat/mass balance of the carbonizer can be organized by fixed carbon of CP even if the carbonization conditions such as the type of biomass, temperature, and residence time are different [19]. The amount of heat of the pyrolysis gas generated by the carbonizer also correlates with the fixed carbon of CP [27]. Fixed carbon is a term for analytical items defined in “JIS M8812 Coal and coke—Methods for proximate analysis”. Fixed carbon does not indicate the total carbon content of the sample, but rather the weight ratio of solid combustible residue to the sample material that consists of solid combustible residue, volatile matter, and ash.
Figure 2 shows a conceptual diagram of CP and pyrolysis gas generation by carbonization, and the auxiliary fuel consumption obtained from the heat/mass balance analysis of the carbonizer. As shown in Figure 2, as the fixed carbon of CP increases, the amount of heat from the pyrolysis gas produced by the carbonizer increases. Figure 2 also shows the amount of heat required by the carbonizer. When the fixed carbon of CP is about 25 wt.%, the amount of heat of the pyrolysis gas exceeds the required amount and Bunker A is not required as auxiliary fuel. When fixed carbon is over 25 wt.%, auxiliary fuel is not required, and a thermally independent operation of the carbonizer can be achieved.
Based on the above results, we selected WP and two types of CP with 20 wt.% fixed carbon (CP20) and 25 wt.% fixed carbon (CP25). Table 4 shows the estimation of energy consumption during the production of WP and CP. We assumed the amount of raw biomass input to be approximately 280,000 tons per year (wet basis, approximately 100,000 tons per year for pellet production) based on the typical scale of pellet production facilities in Canada [28].

3.2. Estimation of Energy Consumption during Transportation
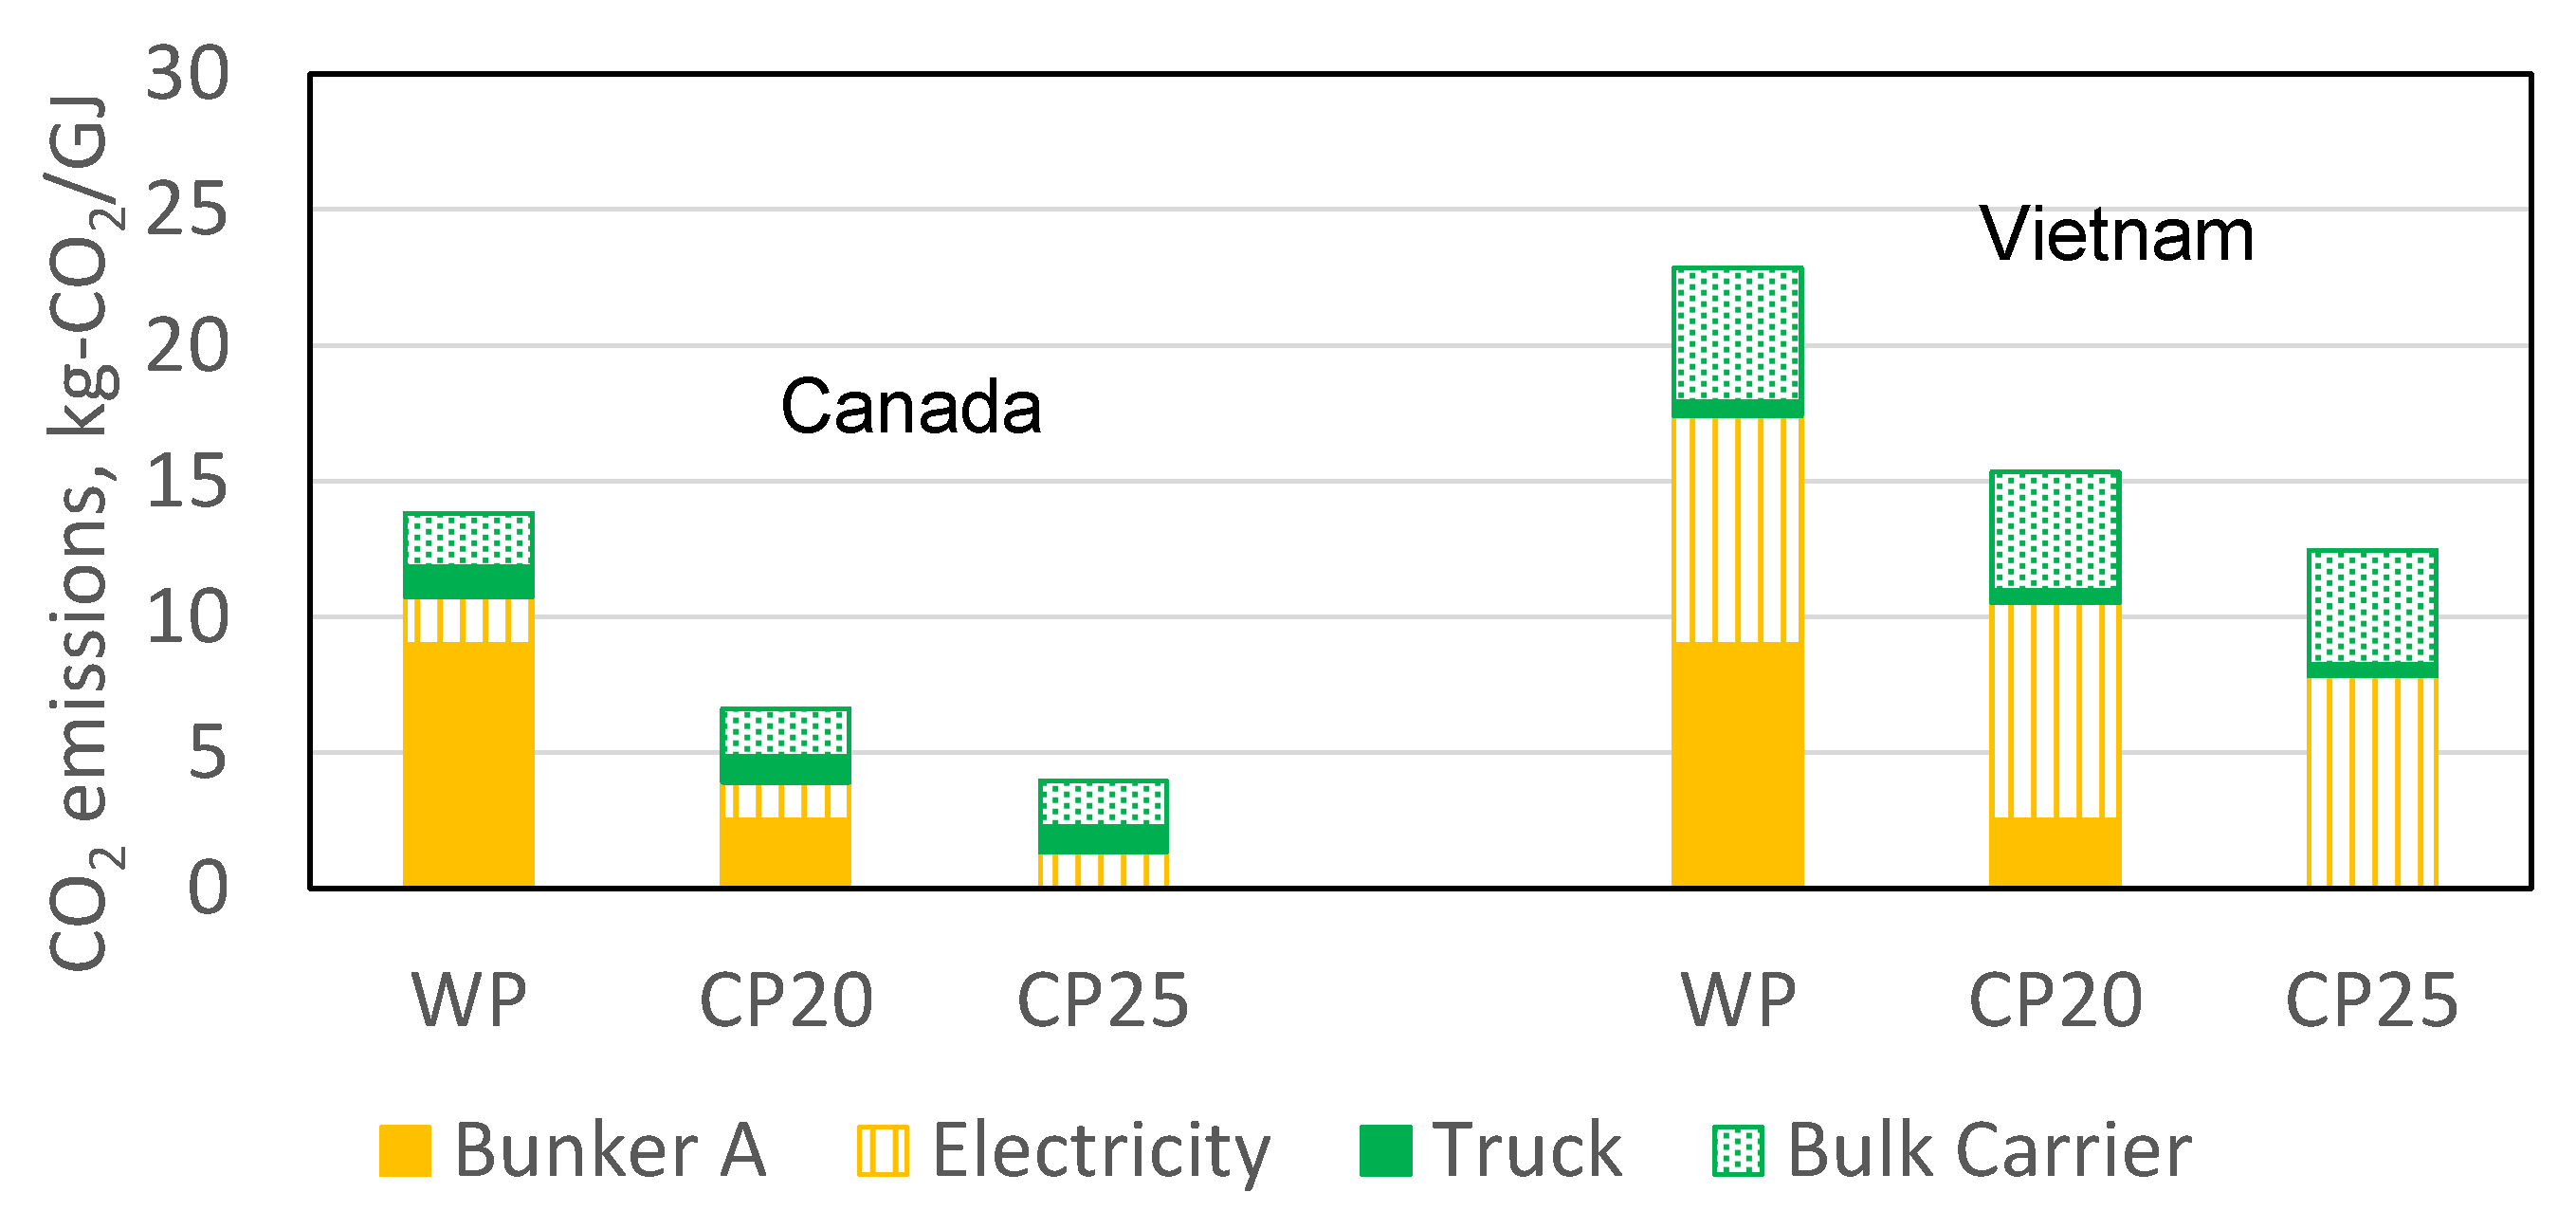
Table 5 shows the energy consumption of the fuels during transportation. According to discussions between the authors and the operator of a wood biomass power generation company, bulk carriers are used to transport wood chips and WP. Bulk carriers of the 20,000 to 60,000-ton class are used on the North American route, and those of the 10,000-ton class are used on the Southeast Asian route. As per [29], the CO2 emission intensity was 4.6 g-CO2/t/km in Canada (ship size: 60,000–99,999 DWT (deadweight tonnage)), which was calculated by considering the navigation distance of the ship. For Vietnam, it was 20.3 g-CO2/t/km (ship size: <9999 DWT). The energy consumption (Bunker C consumption) for marine transportation was calculated backwards from the CO2 emission intensity of bulk carriers and the CO2 emission of Bunker C during transportation.

3.3. CO2 Emissions

Table 6 shows the calorific value of the fuel used for the production and transportation of WP/CP and the CO2 emission intensity of fuel and electricity, respectively. Figure 3 shows the calculated CO2 emissions of WP and CP based on the data in Table 6.
When comparing the CO2 emissions for WP and CP, the CO2 emissions for CP25 were less than half those of WP. This lower value of CO2 emission for CP25 is due to the zero consumption of Bunker A during the drying process of the raw material. However, in overseas pellet factories, the combustion heat of sawmill residues is often used for the drying process instead of Bunker A. In this case, the CO2 emissions from Bunker A are zero; thus, CO2 emissions are almost the same as those for CP.
When comparing CP20 and CP25, CP25, which has zero consumption of Bunker A, was superior. In addition, as energy density increased due to carbonization, the energy consumption for transportation was reduced, thereby slightly lowering CO2 emissions.
Comparing Canada and Vietnam, the CO2 emission intensity of grid power in Canada (0.15 kg/kWh) is lower than that in Vietnam, at 0.8649 kg/kWh (see Table 6). In addition, as it was assumed that the size of bulk vessels was 60,000–99,999 DWT on the Canada route and less than 9,999 DWT on the Vietnam route, the CO2 emissions in Canada were lower than those in Vietnam due to the difference in the fuel efficiency of bulk vessels. Consequently, the CO2 emissions of Canadian pellets with a long transportation distance were smaller than those of Vietnamese pellets with a short transportation distance.

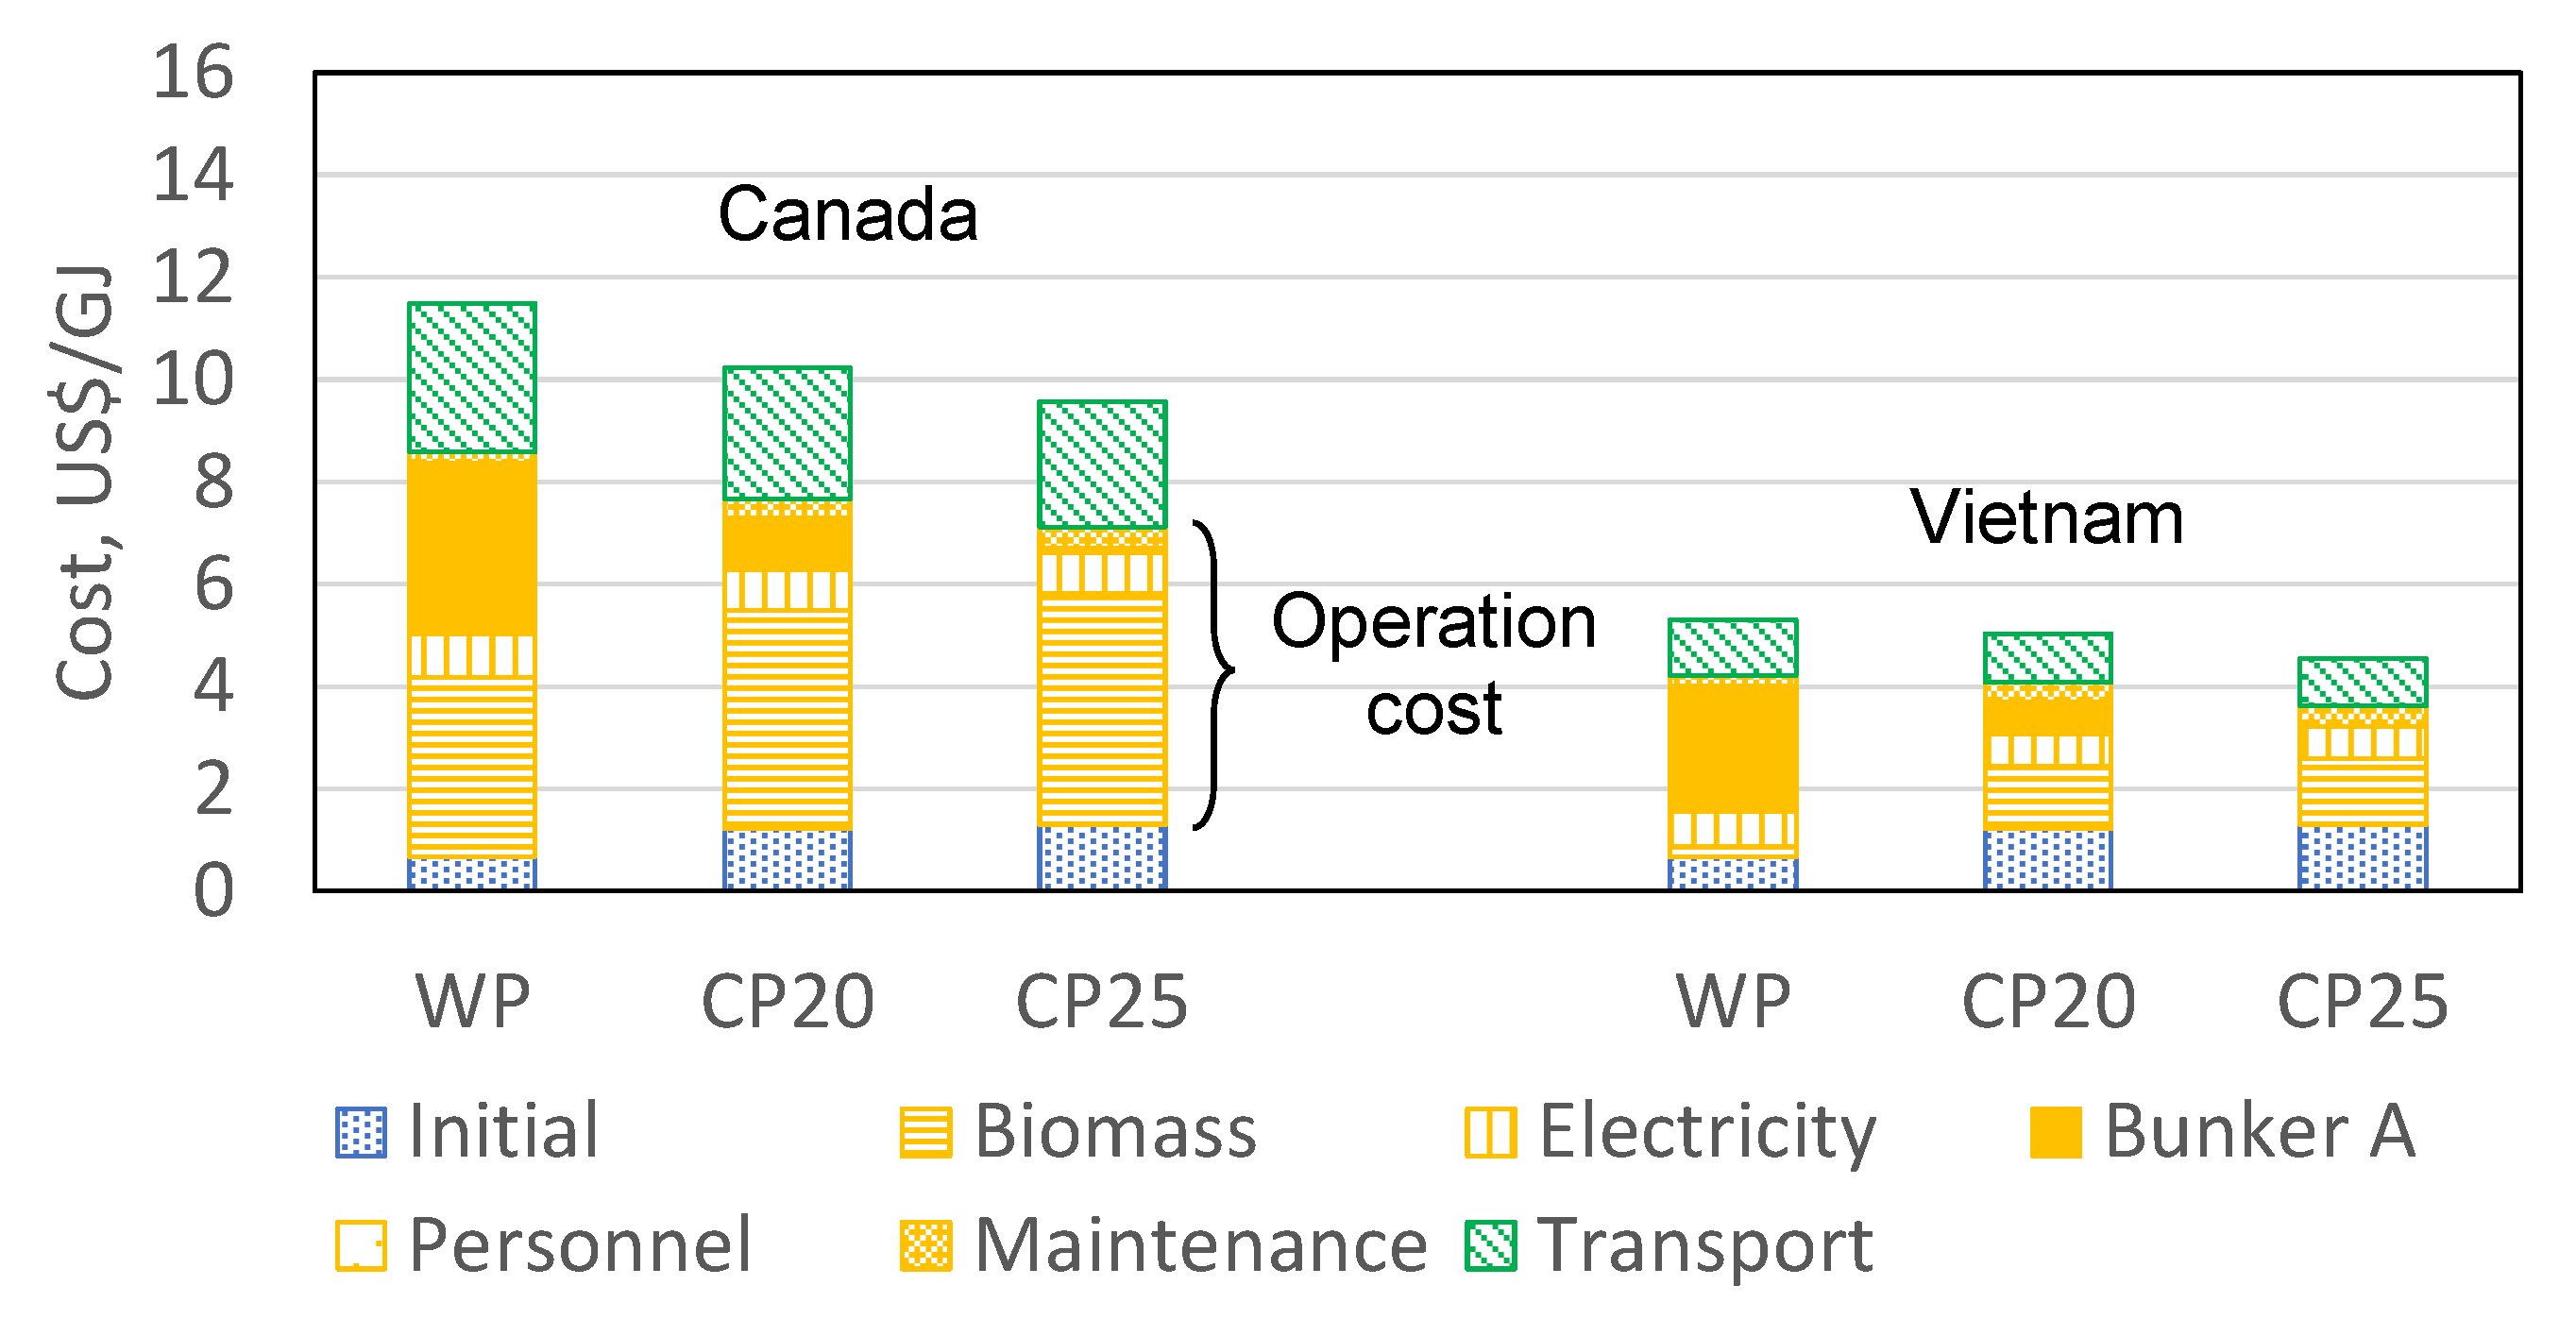
3.4. Economic Efficiency

LCOF values at the port of import in Japan, which includes the initial cost, operation cost, and transportation cost in each case, were evaluated (Figure 4). CP have a higher equipment cost compared to WP (see Table 2). However, as Bunker A is used in the drying process for WP, the operation cost for WP is higher than that for CP. As a result, CP have a lower total cost compared to WP. Comparing CP20 and CP25, CP20 uses Bunker A as an auxiliary fuel for the carbonization process heat source (see Figure 1 and Figure 2), resulting in a slightly higher operating cost than for CP25. Comparing Canada and Vietnam, pellets from Vietnam can be imported at a lower cost due to the difference in operating costs, such as the costs of biomass raw material (sawmill residue), the fuel unit price, labor costs, and transportation costs (see Table 3).

3.5. Co-Firing at a Coal-Fired Power Plant

We estimated the CO2 emissions and procurement costs of co-firing WP or carbonized biomass (CP20, CP25) at a coal-fired power plant. These results are shown in Figure 5 and Figure 6, respectively. Both CO2 emissions and procurement costs are shown as dimensionless numbers based on coal alone. The horizontal axis is organized by the blending ratio of biomass with coal. For the import price of coal, the CIF (Cost Insurance and Freight) price (USD120.54/t) of steaming coal in 2018 was used [32].
The blending ratio of WP with coal reaches about 4%, even at the most modern coal-fired power plant [8,33]. The main reason for this is the increased vibration and power required when WP are pulverized with a roller mill for coal. Contrastingly, CP are easy to pulverize and can thus have an increased blending ratio with coal [19]. It was observed that if the blending ratio was increased to 40% (10 times), CO2 emissions could be reduced by about 35–40% in all cases.
The cost of generating electricity using WP from Canada increased by a factor of about 1.4–1.5 compared to that of coal alone, but in the case of Vietnam, the cost of generating electricity using WP was stable at any blending ratio of the pellets. On the other hand, CP25 was the best in terms of both CO2 emissions and fuel costs at the same ratio of blending biomass with coal. The reason for this is that CP25, which allows the thermally self-sustaining operation of the carbonizer, consumes less energy during production.

4. Conclusions

The CO2 emissions and economic efficiency of manufacturing CP (carbonized pellets) overseas and using them at a coal-fired power plant in Japan were estimated in this study. The following conclusions were drawn.
(1) We found that the CO2 emission intensity and the procurement cost per calorific value of CP were equal to or less than those of WP (wood pellets). This is mainly because the consumption of Bunker A that is required for CP production can be curtailed using the pyrolysis gas generated in the carbonization process as fuel. (2) The equipment cost for manufacturing CP is higher than that of WP. However, the operation cost and CO2 emissions of the former are lower than those of the latter. This is because the manufacturing conditions for CP25 (fixed carbon ratio of 25 wt.%) were adopted, and the thermally independent operation of the carbonizer was achieved using the pyrolysis gas generated in the carbonization process. (3) The procurement cost involved in manufacturing CP in Vietnam was significantly lower than that in Canada. The use of CP manufactured in Vietnam would not affect the cost of the generated electricity, even if the carbonized pellets were blended at high ratio; thus, it was very cost effective as a means of reducing CO2 emissions from coal-fired power plants.

Author Contributions

Conceptualization, M.A., M.O., H.Y. and A.A.; methodology, M.A., M.O. and H.Y.; software, M.A. and M.O.; validation, M.O., H.Y. and A.A.; formal analysis, M.A.; investigation, M.A., M.O. and H.Y.; data curation, M.A., M.O. and H.Y.; writing—original draft preparation, M.A.; writing—review and editing, M.A.; visualization, M.A.; supervision, A.A.; project administration, M.O.; funding acquisition, M.O. All authors have read and agreed to the published version of the manuscript.

Funding

This research received no external funding.

Institutional Review Board Statement

Not applicable.

Informed Consent Statement

Not applicable.

Data Availability Statement

Sufficient data are presented in the methodology, results, and discussion sections.

Acknowledgments

We would like to express our sincerest gratitude to Tsuyoshi Yoshioka of Nomadic Energy Co., Ltd., Yokohama, Kanagawa, Japan, for his invaluable cooperation in carrying out this research.

Conflicts of Interest

The authors declare no conflict of interest.

References

  1. Ministry of Economy, Trade and Industry; Agency for Natural Resources and Energy (METI/ANRE). Power Survey Statistics 2019. Available online: https://www.enecho.meti.go.jp/statistics/electric_power/ep002/pdf/2019/0-2019.pdf (accessed on 8 August 2021).
  2. Gil, M.V.; Rubiera, F. 5—Coal and biomass cofiring: Fundamentals and future trends. In New Trends in Coal Conversion; Suárez-Ruiz, I., Diez, M.A., Rubiera, F., Eds.; Woodhead Publishing: Sawston, Cambridge, UK, 2019; pp. 117–140. [Google Scholar]
  3. De, S.; Assadi, M. Impact of cofiring biomass with coal in power plants—A techno-economic assessment. Biomass Bioenergy 2009, 33, 283–293. [Google Scholar] [CrossRef]
  4. Narayanan, K.V.; Natarajan, E. Experimental studies on cofiring of coal and biomass blends in India. Renew. Energy 2007, 32, 2548–2558. [Google Scholar] [CrossRef]
  5. Demirbaş, A. Sustainable cofiring of biomass with coal. Energy Convers. Manag. 2003, 44, 1465–1479. [Google Scholar] [CrossRef]
  6. Holtmeyer, M.L.; Kumfer, B.M.; Axelbaum, R.L. Effects of biomass particle size during cofiring under air-fired and oxyfuel conditions. Appl. Energy 2012, 93, 606–613. [Google Scholar] [CrossRef]
  7. Loeffler, D.; Anderson, N. Emissions tradeoffs associated with cofiring forest biomass with coal: A case study in Colorado, USA. Appl. Energy 2014, 113, 67–77. [Google Scholar] [CrossRef]
  8. Mitsui & Co. Future Perspectives: Biomass Co-Firing in Coal-Fired Power Generation Attracting Domestic Attention, Global Strategic Studies Institute Monthly Report. Available online: https://www.mitsui.com/mgssi/en/report/detail/__icsFiles/afieldfile/2018/01/12/170703m_unokikuchi_e.pdf (accessed on 8 June 2021).
  9. Xue, J.; Chellappa, T.; Ceylan, S.; Goldfarb, J.L. Enhancing biomass + coal Co-firing scenarios via biomass torrefaction and carbonization: Case study of avocado pit biomass and Illinois No. 6 coal. Renew. Energy 2018, 122, 152–162. [Google Scholar] [CrossRef]
  10. Arias, B.; Pevida, C.; Fermoso, J.; Plaza, M.G.; Rubiera, F.; Pis, J.J. Influence of torrefaction on the grindability and reactivity of woody biomass. Fuel Process. Technol. 2008, 89, 169–175. [Google Scholar] [CrossRef] [Green Version]
  11. Phanphanich, M.; Mani, S. Impact of torrefaction on the grindability and fuel characteristics of forest biomass. Bioresour. Technol. 2011, 102, 1246–1253. [Google Scholar] [CrossRef] [PubMed]
  12. van der Stelt, M.J.C.; Gerhauser, H.; Kiel, J.H.A.; Ptasinski, K.J. Biomass upgrading by torrefaction for the production of biofuels: A review. Biomass Bioenergy 2011, 35, 3748–3762. [Google Scholar] [CrossRef]
  13. Ndibe, C.; Maier, J.; Scheffknecht, G. Combustion, cofiring and emissions characteristics of torrefied biomass in a drop tube reactor. Biomass Bioenergy 2015, 79, 105–115. [Google Scholar] [CrossRef]
  14. Huang, C.-W.; Li, Y.-H.; Xiao, K.-L.; Lasek, J. Cofiring characteristics of coal blended with torrefied Miscanthus biochar optimized with three Taguchi indexes. Energy 2019, 172, 566–579. [Google Scholar] [CrossRef]
  15. Yoshida, T. Production and Evaluation Method of Heat-Treated Biomass Pellet Fuels. J. Jpn. Soc. Exp. Mech. 2019, 19, 175–181. [Google Scholar]
  16. Nunes, L.J.R.; Matias, J.C.O.; Catalão, J.P.S. A review on torrefied biomass pellets as a sustainable alternative to coal in power generation. Renew. Sustain. Energy Rev. 2014, 40, 153–160. [Google Scholar] [CrossRef]
  17. Tabata, T.; Torikai, H.; Tsurumaki, M.; Genchi, Y.; Ukegawa, K. Life cycle assessment for co-firing semi-carbonized fuel manufactured using woody biomass with coal: A case study in the central area of Wakayama, Japan. Renew. Sustain. Energy Rev. 2011, 15, 2772–2778. [Google Scholar] [CrossRef] [Green Version]
  18. Kamimura, K.; Kuboyama, H.; Yamamoto, K. Wood biomass supply costs and potential for biomass energy plants in Japan. Biomass Bioenergy 2012, 36, 107–115. [Google Scholar] [CrossRef]
  19. Ashizawa, M.; Otaka, M.; Shoji, T.; Yamamoto, H. Carbonized characteristics of woody biomass, grindability and combustibility for carbonized woody biomass. J. Jpn. Sol. Energy Soc. 2021, 47, 49–56. Available online: https://www.jses-solar.jp/journal/backnumbers/j265/p49-56 (accessed on 24 January 2022).
  20. Japan Woody Bioenergy Association. Customs Statistics. Available online: https://www.jwba.or.jp/database/price-transition01/ (accessed on 8 June 2021).
  21. Ministry of Economy, Trade and Industry; Agency for Natural Resources and Energy (METI/ANRE). The Promotion of Energy Saving by Transportation 5th. Available online: https://www.enecho.meti.go.jp/category/saving_and_new/saving/ninushi/pdf/ninushitebiki_ver5.pdf (accessed on 8 June 2021).
  22. International Energy Agency; Nuclear Energy Agency; Organization for Economic Co-Operation and Development. Projected Costs of Generating Electricity 2015 Edition. Available online: https://www.oecd-nea.org/jcms/pl_14756/projected-costs-of-generating-electricity-2015-edition (accessed on 24 January 2022).
  23. Ministry of the Environment (MOE). List of Calculation Methods and Emission Factors in the Calculation/Reporting/Publication System. Available online: https://ghg-santeikohyo.env.go.jp/files/calc/itiran_2020_rev.pdf (accessed on 8 June 2021).
  24. Dehkordi, M.; Mahdi, M. On the Design and Analysis of Forest Biomass to Biofuel and Bioenergy Supply Chains, The University of British Columbia. 2015. Available online: https://open.library.ubc.ca/cIRcle/collections/ubctheses/24/items/1.0166110 (accessed on 8 June 2021).
  25. Alibaba.com. Biomass FOB Price. Available online: https://www.alibaba.com/product-detail/100-Pine-Wood-Sawdust_50039271188.html?spm=a2700.7724857.main07.3.189c198e979l2f (accessed on 8 June 2021).
  26. JETRO. Investment Cost Comparison of Vancouver in Canada/of Ho Chi Minh in Vietnam. Available online: https://www.jetro.go.jp/world/search/cost.html (accessed on 8 June 2021).
  27. Mitsubishi Heavy Industries Environmental & Chemical Engineering Co., Ltd. Development and Testing of Technologies to Further Reduce CO2 Emissions Commissioned by the Ministry of the Environment (MOE), Devising Processes to Produce Energy through Increased Use of Carbonized Biomass and Development of Firing Technologies for Use in 100% Pulverized Coal-Fired Boilers. 2017. Available online: https://id.ndl.go.jp/bib/029342406 (accessed on 8 June 2021).
  28. Iuchi, M. Evaluation of life cycle CO2 emissions of domestic and foreign biomass fuel for coal-fired power plant. CRIEPI Res. Rep. 2011, Y10010, 2. Available online: https://criepi.denken.or.jp/hokokusho/pb/reportDownload?reportNoUkCode=Y10010&tenpuTypeCode=30&seqNo=1&reportId=7739 (accessed on 24 January 2022).
  29. Japan Ship Technology Research Association. Research on Carbon Footprint Formulation in Ship Transportation, Research Report 2009. Available online: https://www.jstra.jp/html/PDF/2009_CFP_houkokusyo.pdf (accessed on 8 June 2021).
  30. JAERO. Comparison of CO2 Emission Factors (Power Generation Ends) in Each Country. Available online: http://www.ene100.jp/www/wp-content/uploads/zumen/2-1-18.pdf (accessed on 8 June 2021).
  31. Global Environment Centre Foundation (GEC). Electricity CO2 Emission Factor by Country Used in the 2019 JCM Equipment Subsidy Project. Available online: http://gec.jp/innovation/2019/S.2019JCM_emission_factor.pdf (accessed on 8 June 2021).
  32. Ministry of Economy, Trade and Industry; Agency for Natural Resources and Energy (METI/ANRE). Handbook of Electric Power Industry 2019; Research Institute of Economy, Trade and Industry (RIETI): Ginza, Chuo-ku, Tokyo, Japan, 2019. [Google Scholar]
  33. J-POWER. About the Start of Commercial Operation of the New No. 1 Takehara Thermal Power Station. Available online: https://www.jpower.co.jp/news_release/pdf/news200630.pdf (accessed on 8 June 2021).
Figure 1. Flow chart of the WP and CP production and transportation processes: (a) WP; (b) CP.
Energies 15 01770 g001
Figure 2. Conceptual diagram for CP and the pyrolysis gas generated by carbonization, and the auxiliary fuel consumption obtained from a heat/mass balance analysis of the carbonizer: (a) conceptual diagram of changes in components based on proximate analysis before and after carbonization; (b) relationship between the amount of heat of the pyrolysis gas generated by the carbonizer, the amount of heat required for the carbonizer, the amount of consumption of bunker A as auxiliary fuel, and the fixed carbon of CP.
Energies 15 01770 g002aEnergies 15 01770 g002b
Figure 3. CO2 emissions of WP and CP.
Energies 15 01770 g003
Figure 4. Economic efficiency of WP and CP at the port of import in Japan.
Energies 15 01770 g004
Figure 5. Estimated CO2 emissions at a coal–biomass co-firing power plant in Japan: (a) case of Canada; (b) case of Vietnam.
Energies 15 01770 g005
Figure 6. Estimated costs for generated electricity at a coal–biomass co-firing power plant in Japan: (a) case of Canada; (b) case of Vietnam.
Energies 15 01770 g006
Table 1. Fuel production sites in Canada and Vietnam and specifications of transportation to Japan.
CountryCanadaVietnam
Sawmill locationMerritt, British ColumbiaThanh Tam Commune Chon Thanh Dist., Binh Phuoc
Loading portVancouverCai Mep
Unloading portYokohama, Japan
Land transportation distance, km274128
Marine transportation distance, km79124476
Table 2. Assumption of initial cost of facilities for WP and CP production (in million USD).
Case NameWPCP20 and CP25
Stockyard55
Dryer4.53.6
Carbonizing unit-13
Crusher2-
Pelletizer43.1
Silo1-
Construction34.3
Total19.529
Facility Scale: The raw material processing amount is approximately 280,000 tons per year.
Table 3. Assumption of O&M cost.
CountryCanadaVietnam
Lumber residue, USD/t11.83 [24]2 [25]
Maintenance3%/year of plant cost
Electricity, USD/kWh0.0875 [26]0.07 [26]
Oil bunker A, USD/L0.987 [26]0.74 [26]
Personnel expenses, USD/Month2817 [26]242 [26]
Table 4. Estimation of energy consumption during the fuel production of WP and CP.
Case NameWPCP20CP25
Production FuelWood PelletCarbonized Wood Pellet
Proximate Analysis (*1), Dry Basis
Ash, wt.%0.10.60.6
Volatile matter, wt.%87.779.474.4
Fixed carbon, wt.%12.22025
Fuel production rate, t/day464336305
Moisture of fuel, wt.% (wet basis)8.05.05.0
HHV of fuel, MJ/kg (dry basis)20.0021.9422.80
Energy Consumption
Oil bunker A, L/day28,33165130
Electric power of dryer, kW338338338
Electric power of carbonizing unit, kW-211204
Electric power of pelletizer, kW312321471948
Annual Energy Consumption
Availability, %90
Fuel production rate, t/year152,467110,327100,087
Oil bunker A, kL/year930721400
Electric energy, MWh/year27,29121,25719,636
Information on raw biomass: (1) HHV (dry basis): 20.0 MJ/kg; (2) input amount (wet basis): 280,539 t/year; (3) moisture: 50.0 wt.%; (*1): according to JIS M 8812.
Table 5. Energy consumption during transportation.
Case NameWPCP20CP25
CanadaLand, kL/year1191862782
Marine, kL/year185013381214
VietnamLand, kL/year556402365
Marine, kL/year461833423031
Table 6. Calorific value of fuel and CO2 emission intensity.
ItemsValues
Calorific value of fuelOil bunker A, MJ/L39.1
Light oil, MJ/L37.7
Oil bunker C, MJ/L41.9
CO2 emission intensityOil bunker A, kg/L2.71 [23]
Light oil, kg/L2.58 [23]
Oil bunker C, kg/L3.00 [23]
Electricity in Canada, kg/kWh0.15 [30]
Electricity in Vietnam, kg/kWh0.8649 [31]
Publisher’s Note: MDPI stays neutral with regard to jurisdictional claims in published maps and institutional affiliations.

