
Cost Optimal Renewable Electricity-Based HVAC System: Application of Air to Water or Water to Water Heat Pump


Abstract
1. Introduction
2. Method
2.1. Energy
2.2. Costs
3. Case Study
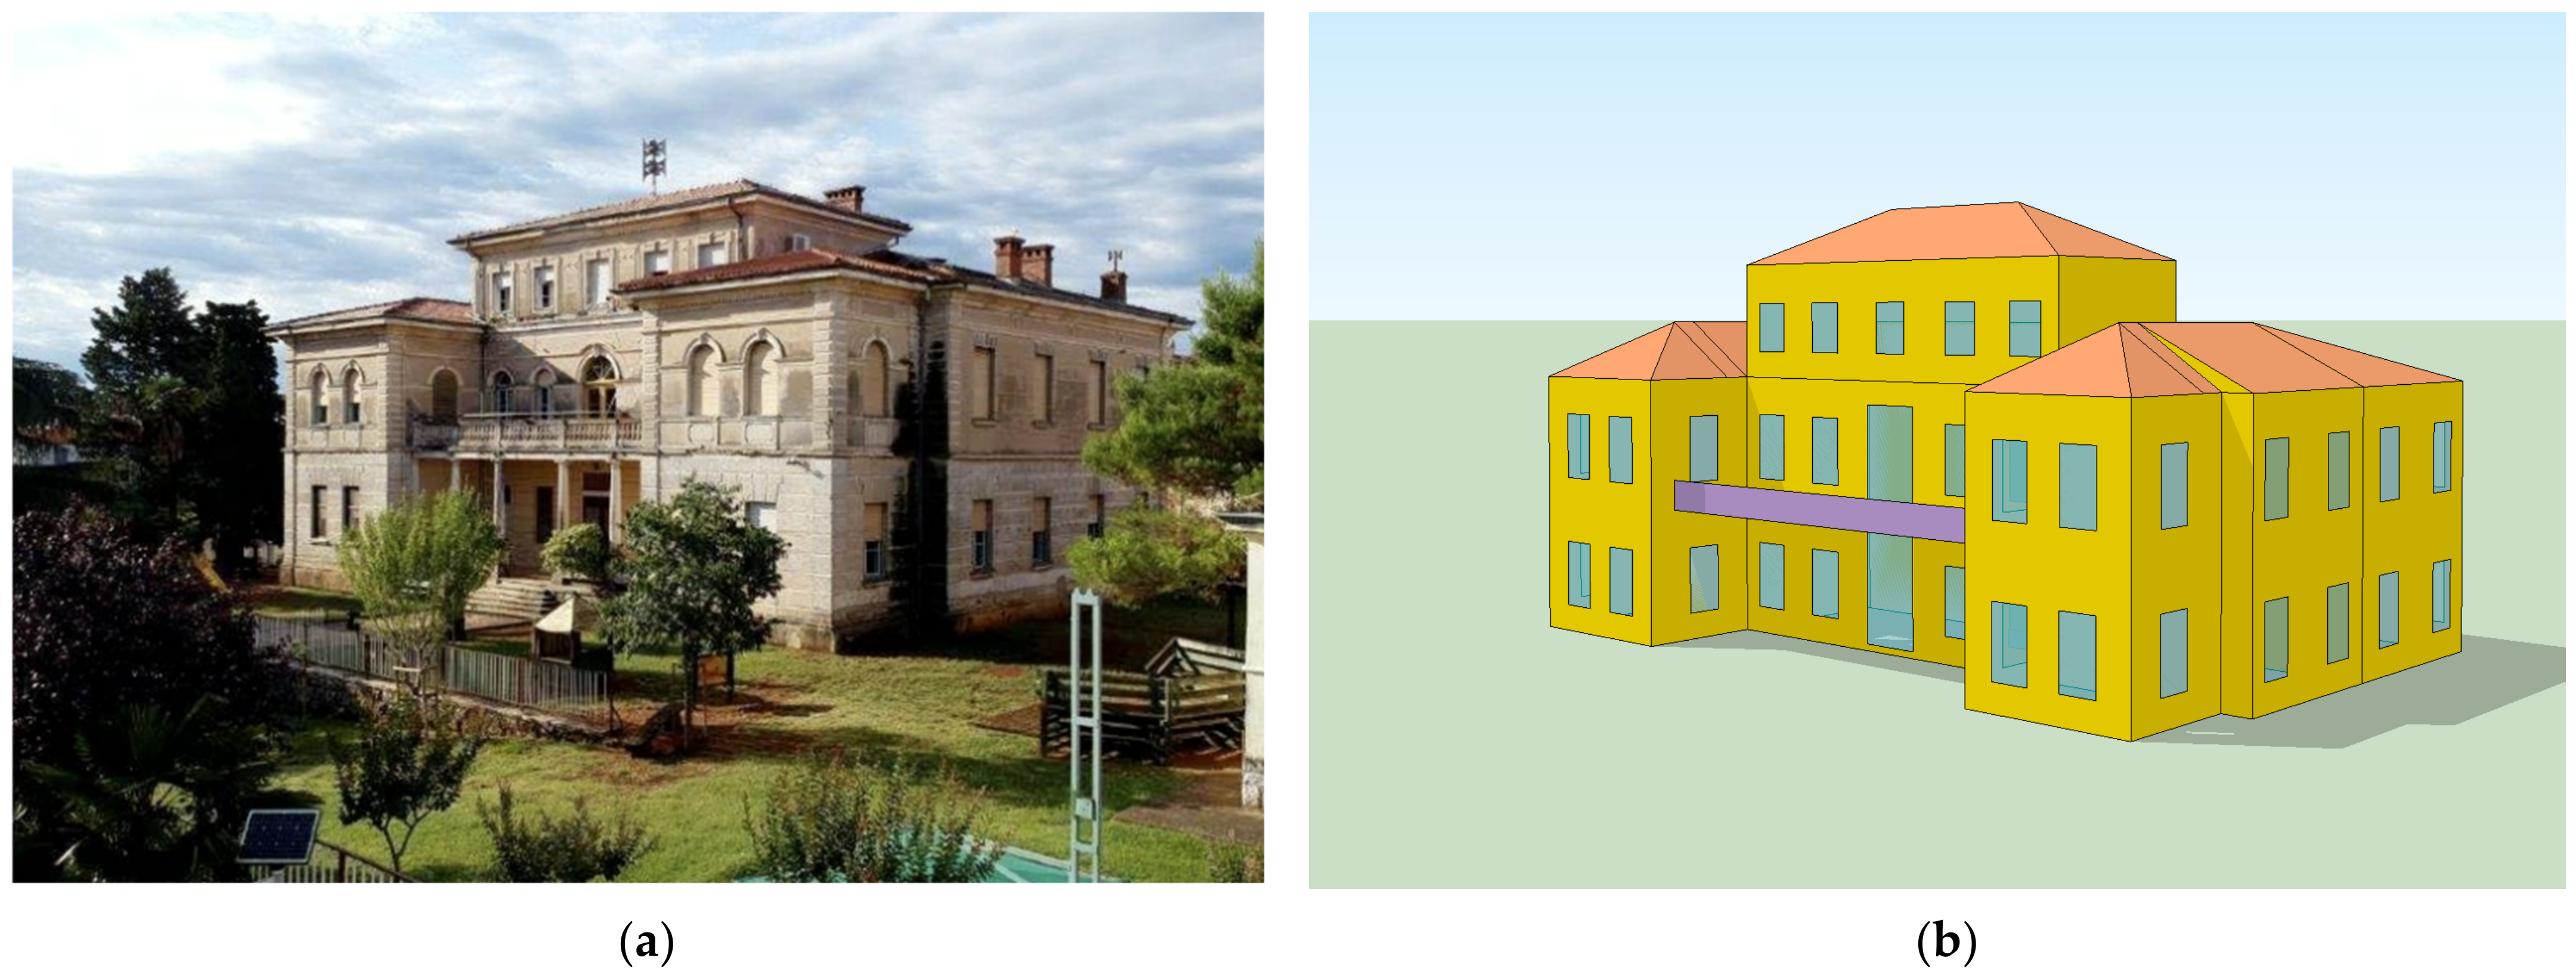
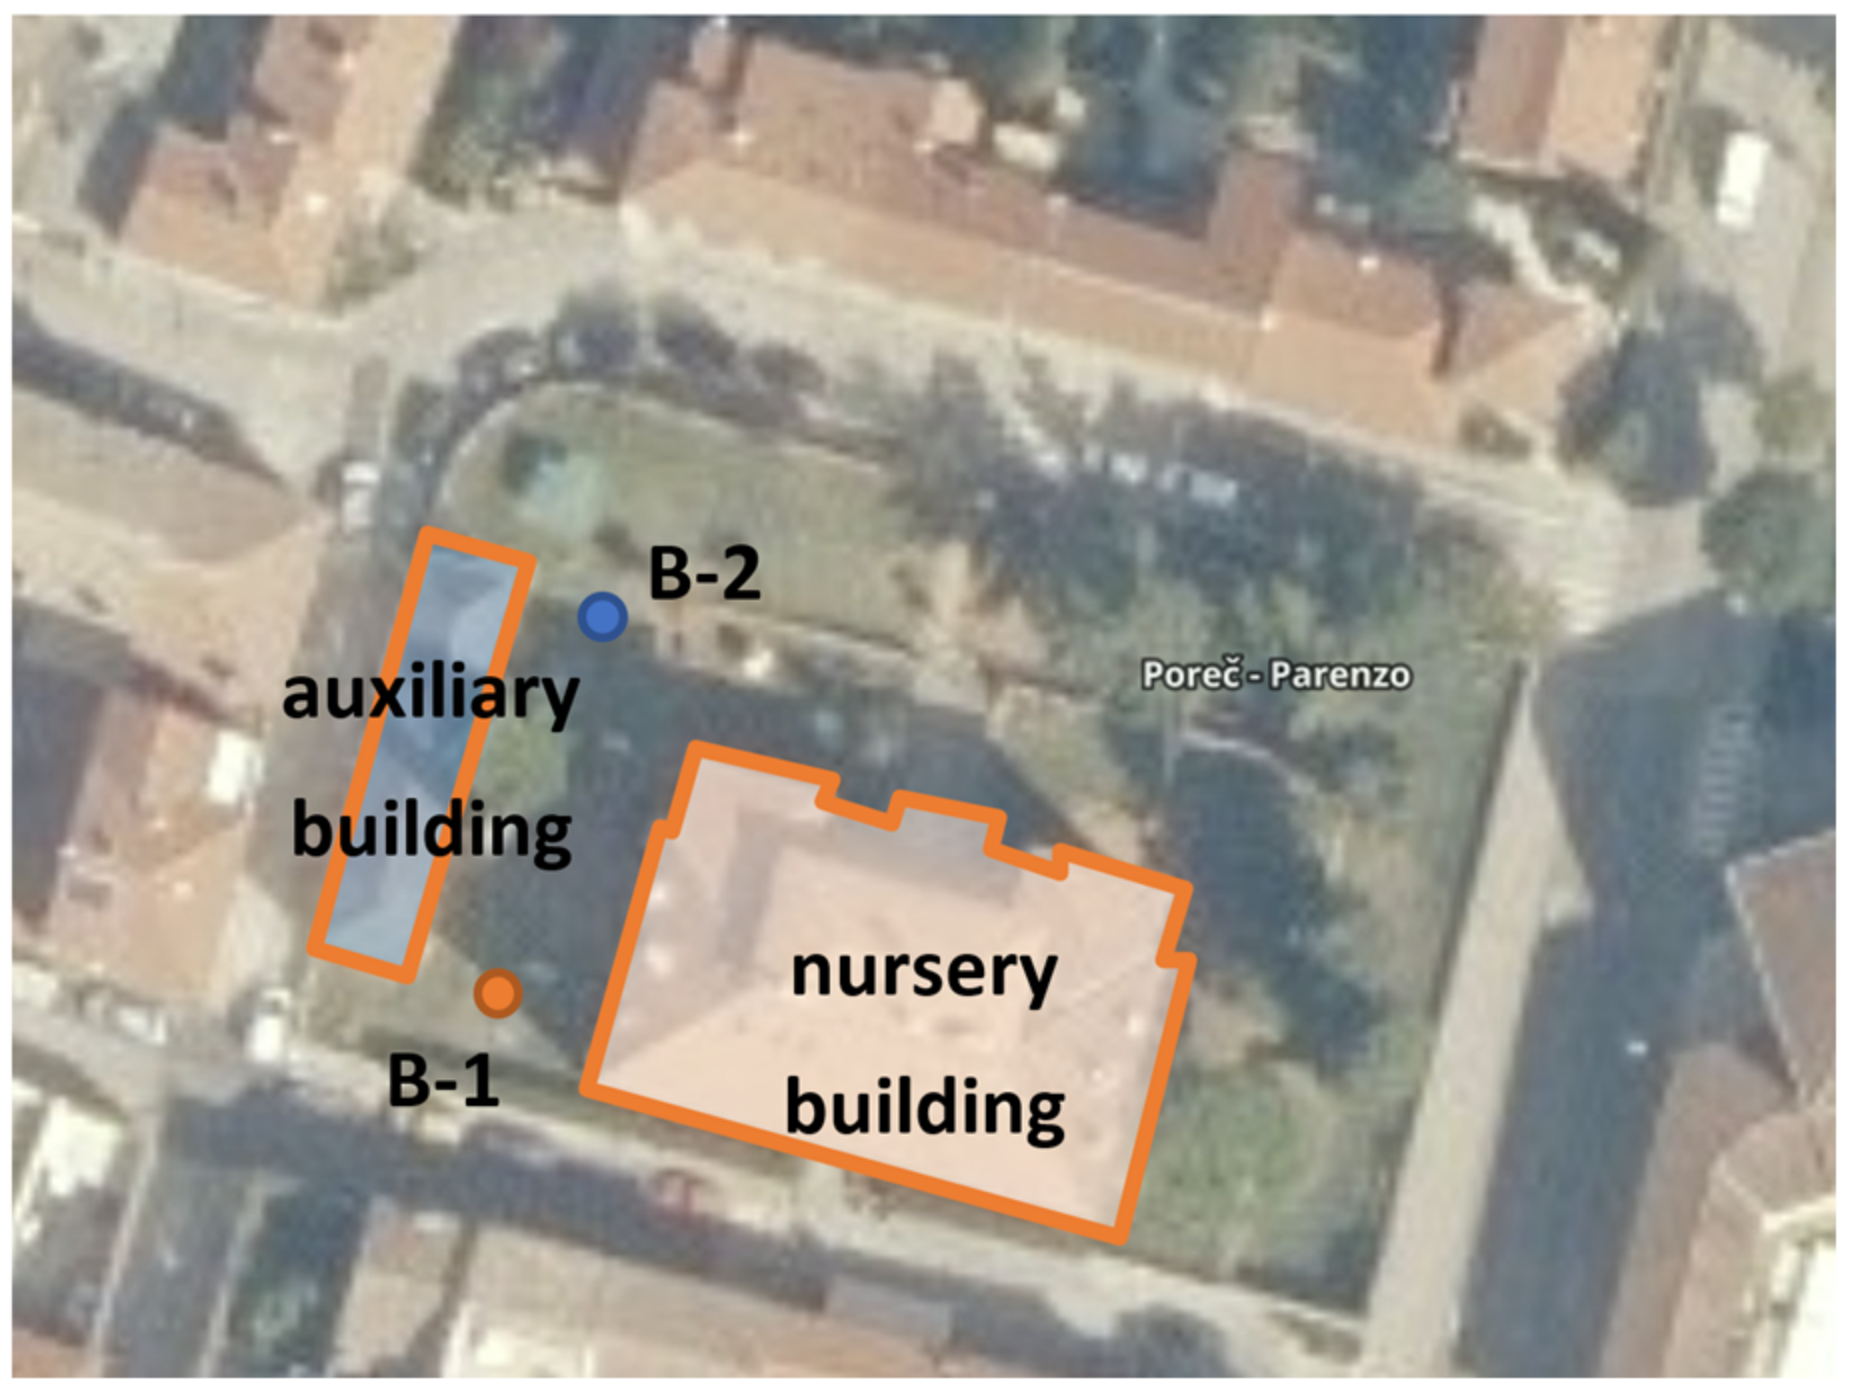
3.1. Building
3.2. Building Energy Systems
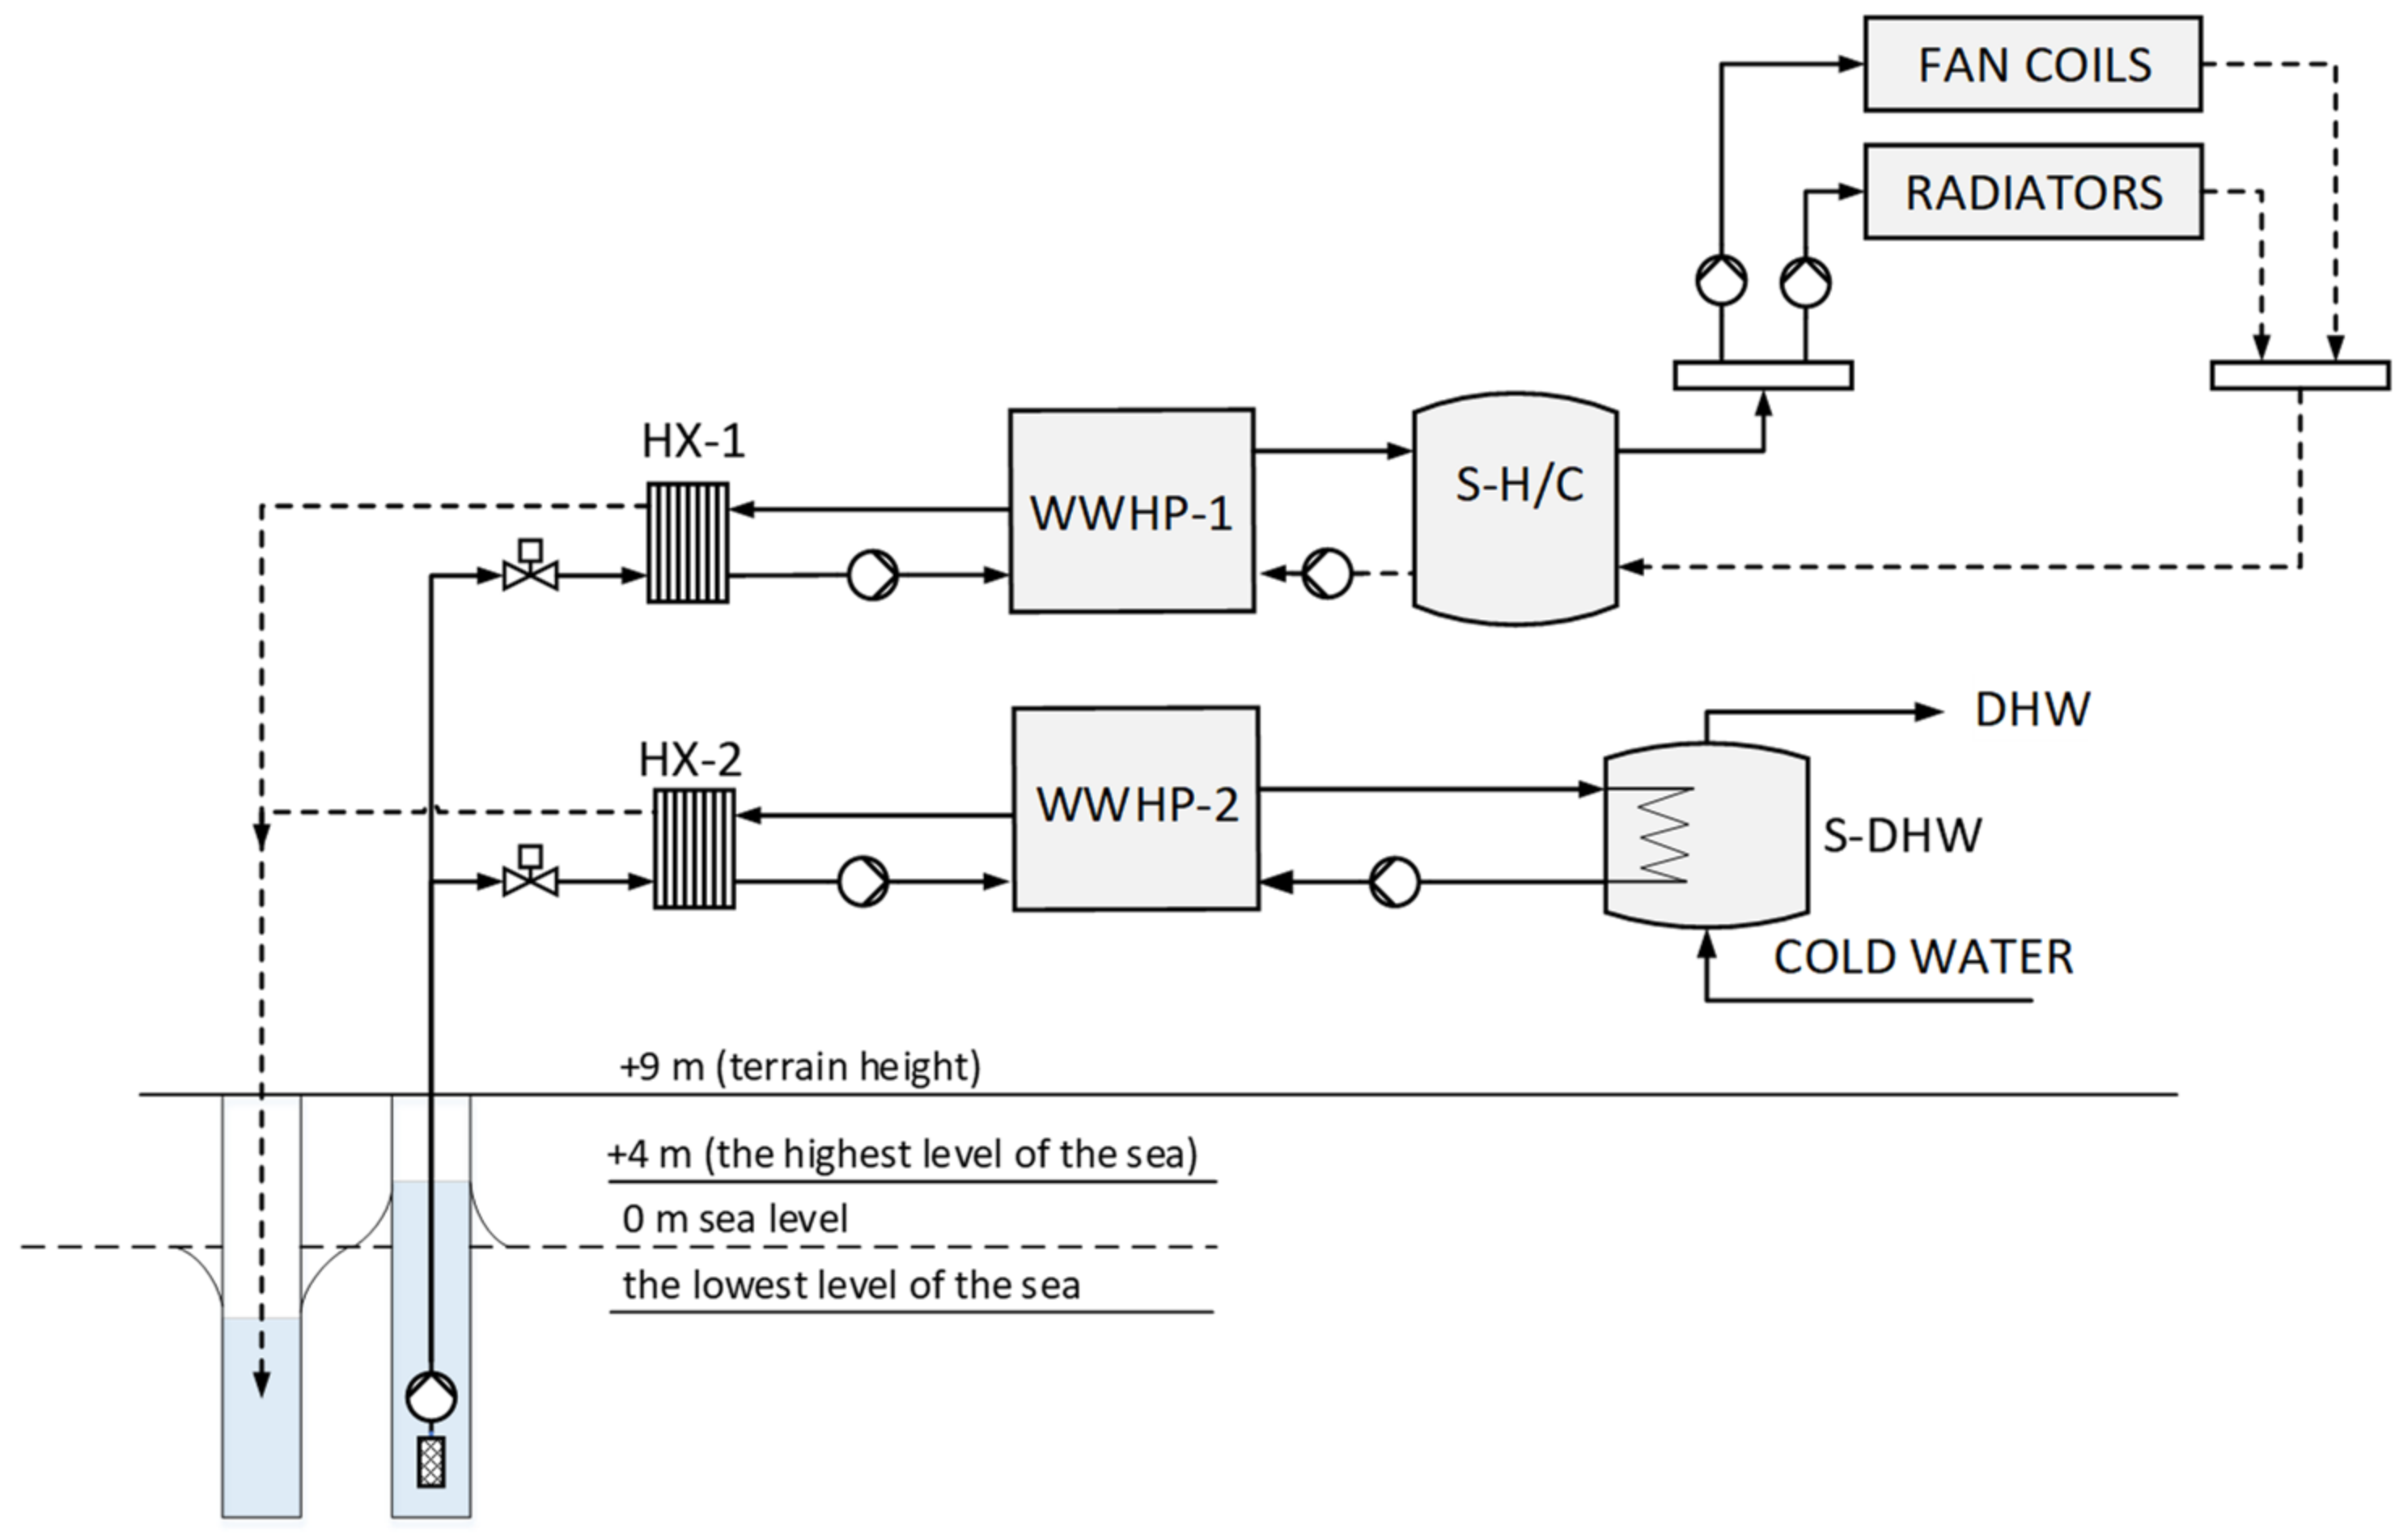
3.2.1. HVAC System with WWHP
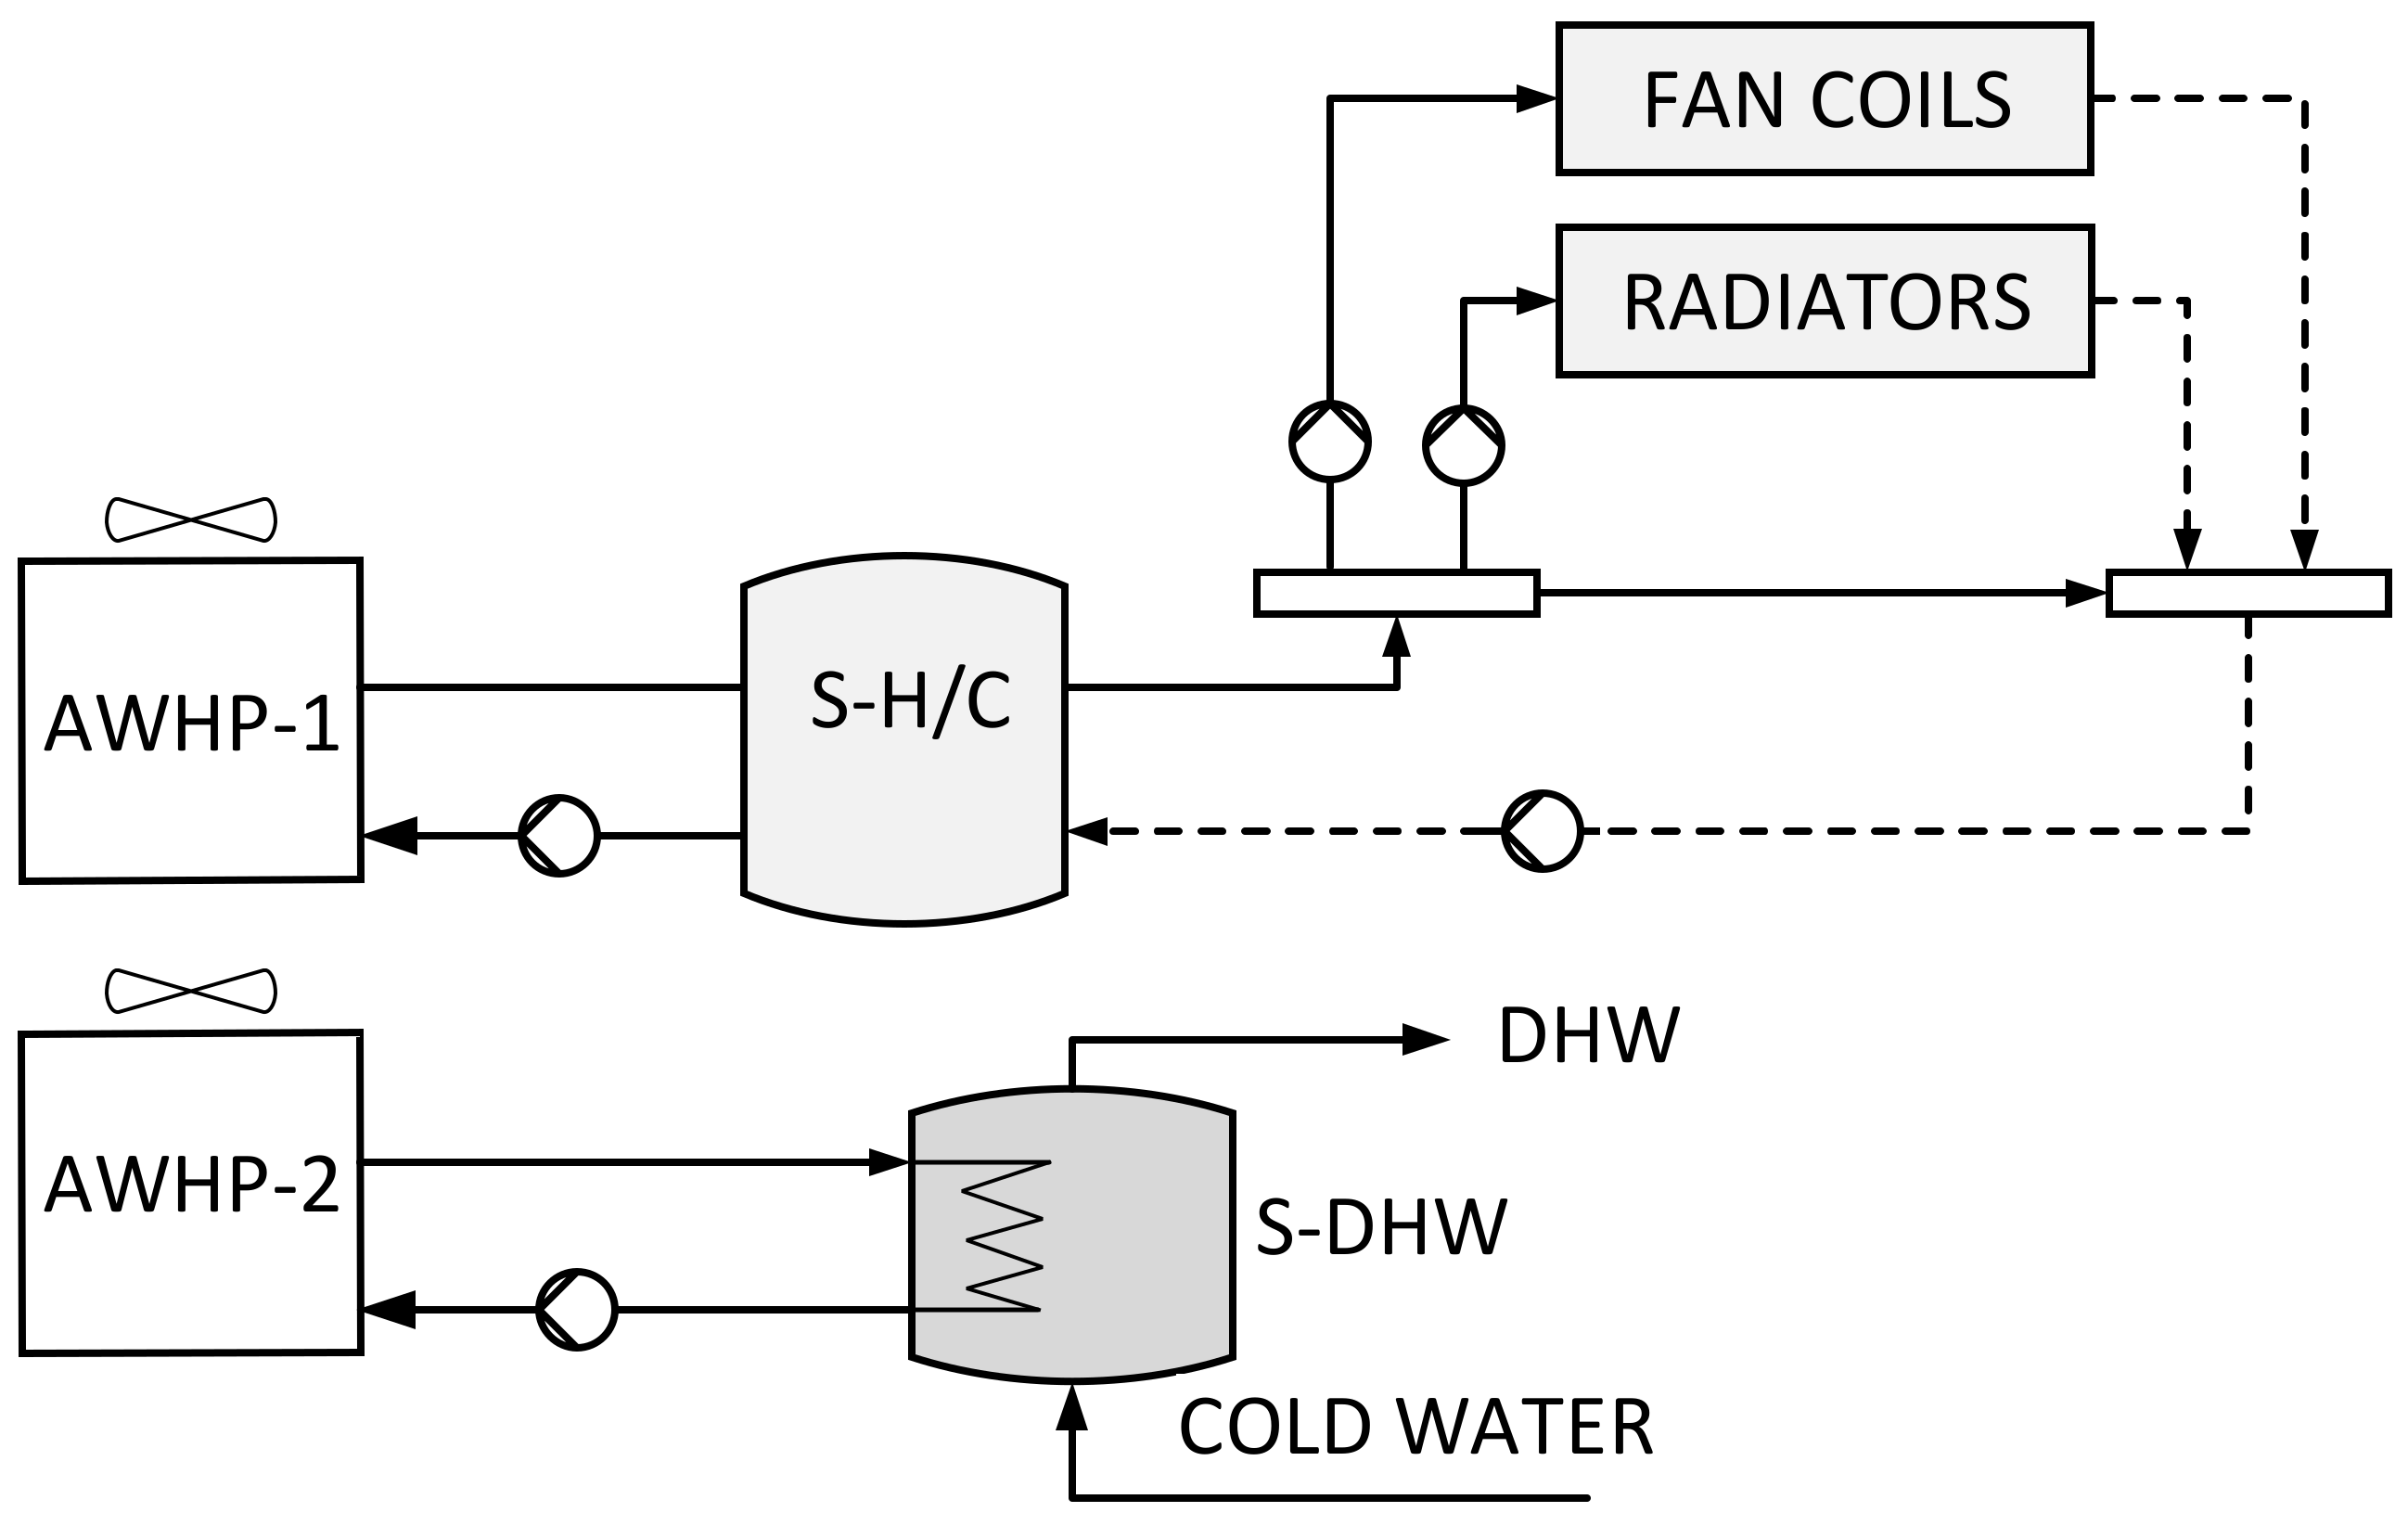
3.2.2. HVAC System with AWHP
3.2.3. Heat Pump Units
3.2.4. PV System
3.3. Costs
4. Results
5. Discussion
6. Conclusions
Author Contributions
Funding
Institutional Review Board Statement
Informed Consent Statement
Data Availability Statement
Conflicts of Interest
Abbreviations
| A | area (m2) |
| Cg | global cost (€) |
| CI | cost indicator (€/m2) |
| E | energy (kWh) |
| EI | energy indicator (kWh/m2) |
| f | primary energy factor (-) |
| U | overall heat transfer coefficient (W/m2K) |
| X | energy ratio (-) |
| aux | auxiliary |
| AWHP | air to water heat pump |
| c | cooling |
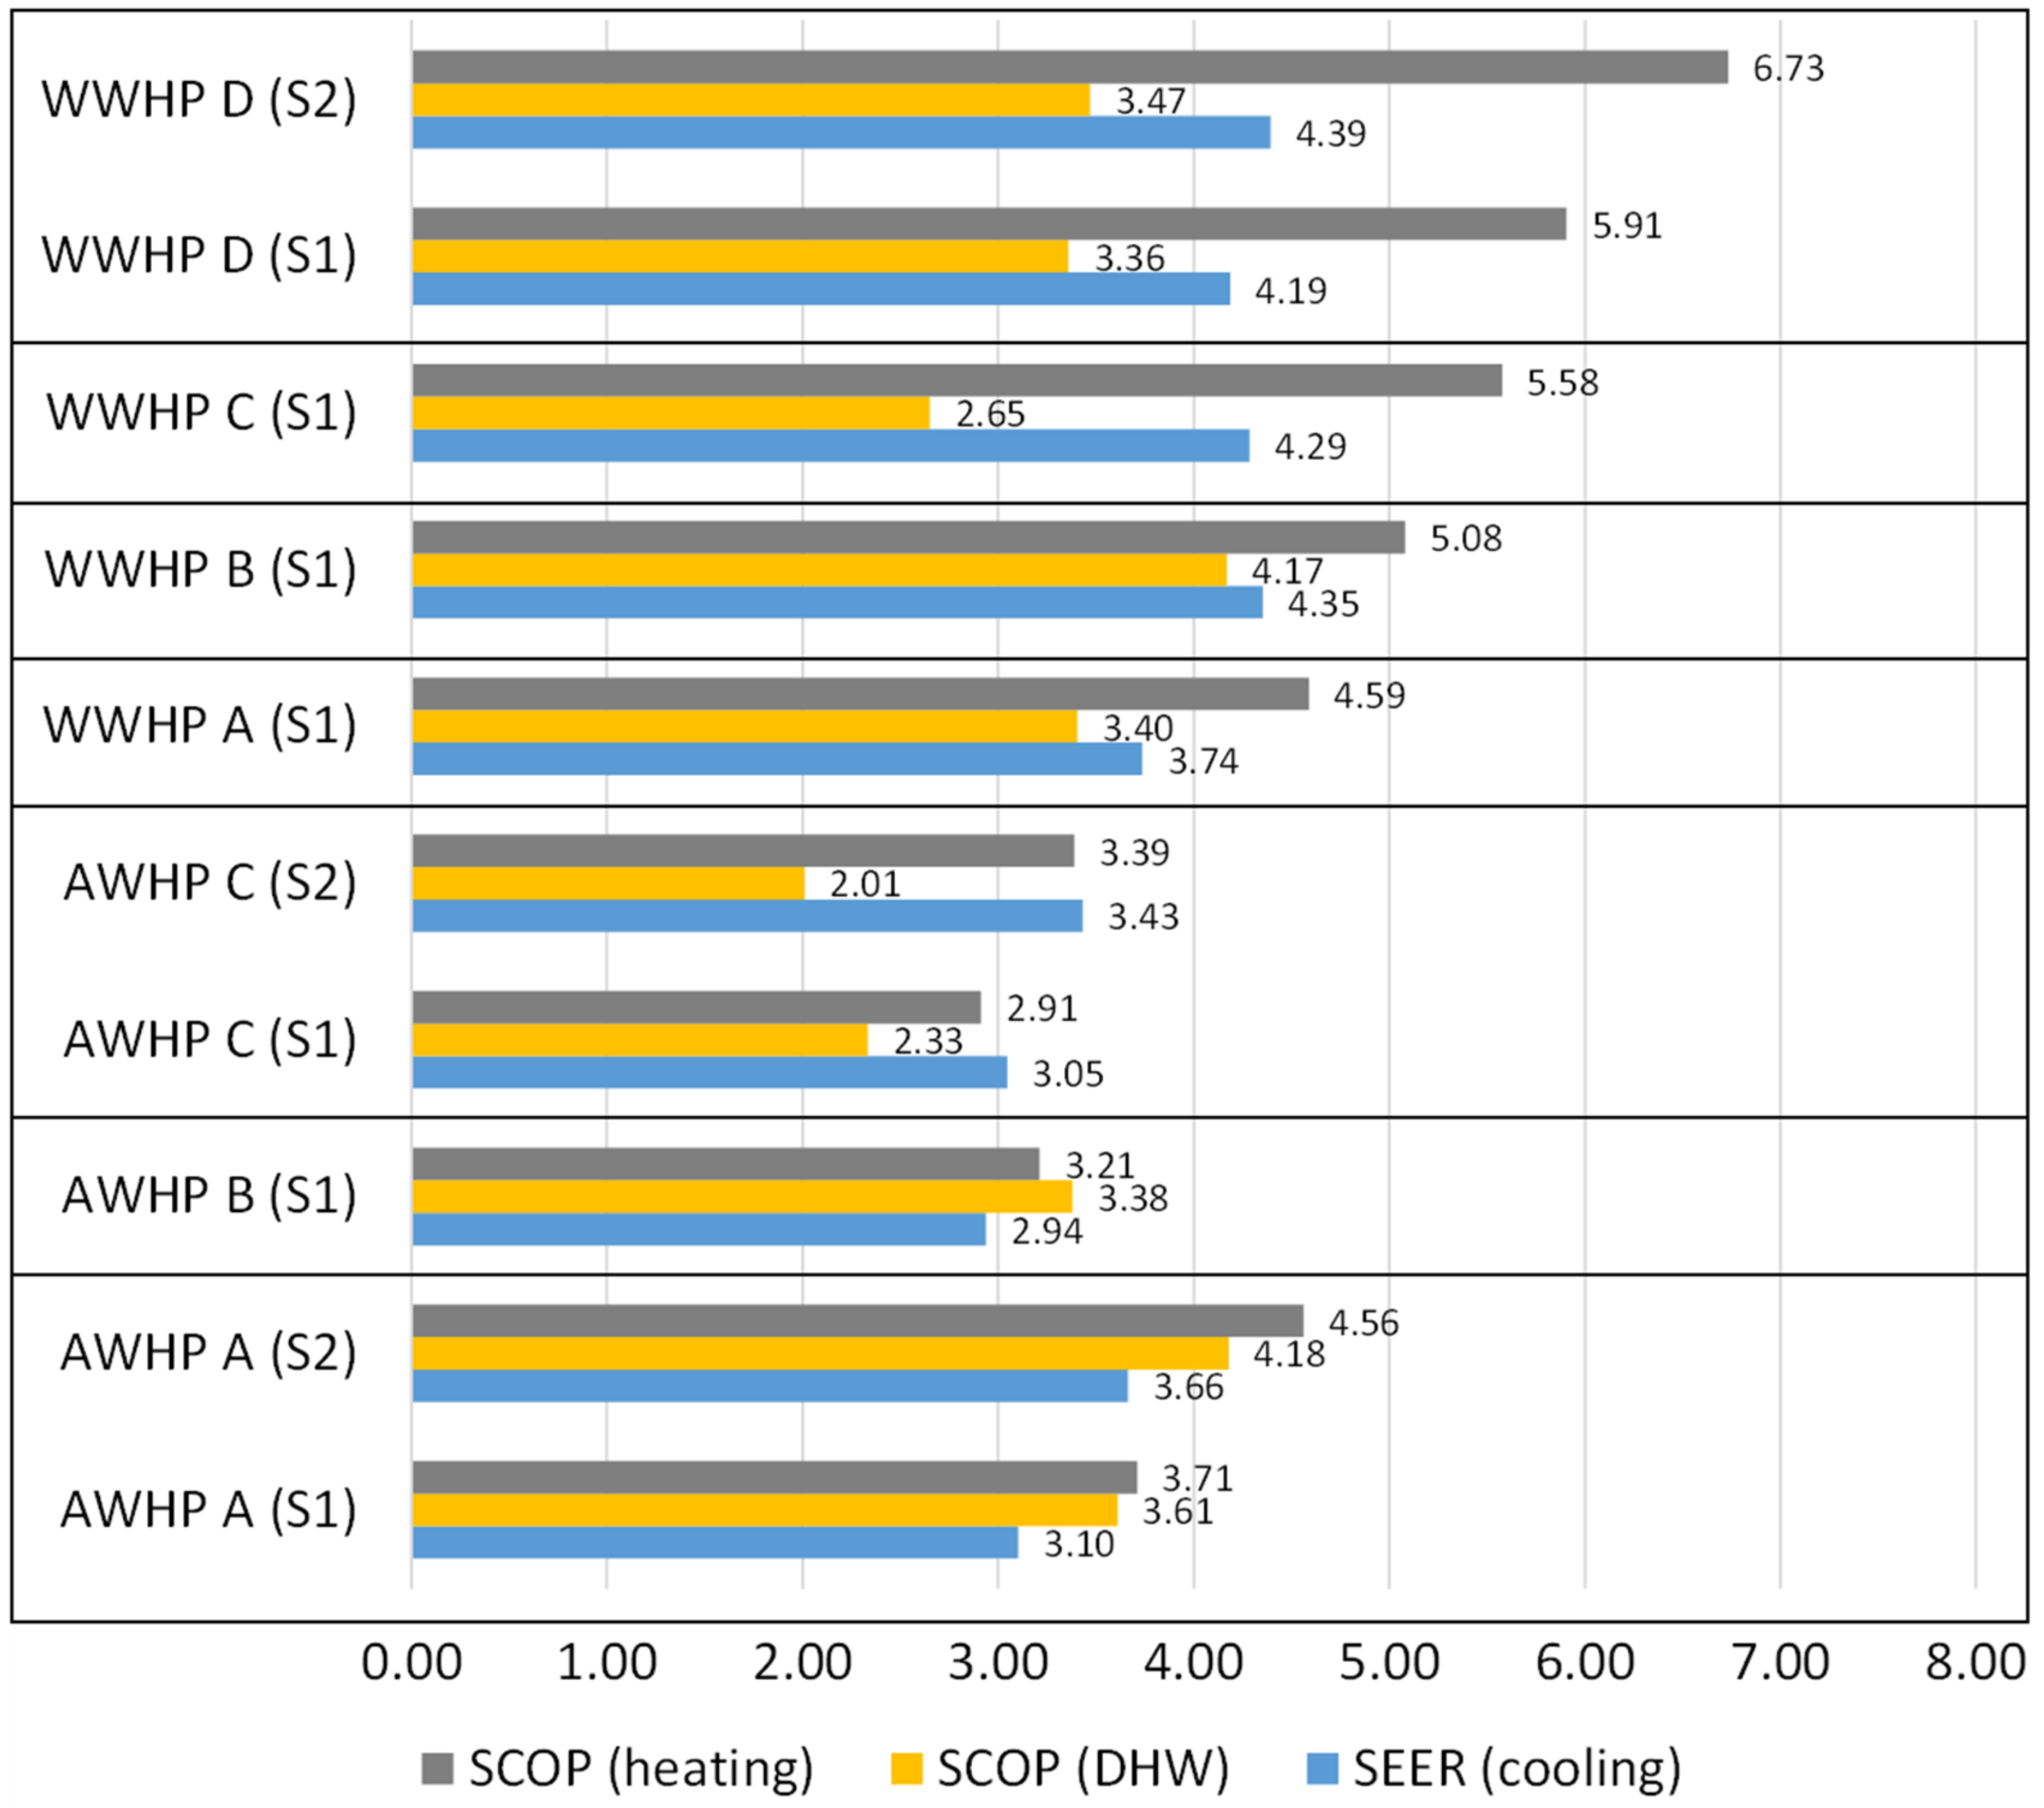
| COP | coefficient of performance |
| DHW | domestic hot water |
| EEM | energy efficiency measure |
| EER | energy efficiency ratio |
| GWP | global warming potential |
| h | heating |
| H/C | heating and cooling |
| hp | heat pump |
| HVAC | heating, ventilation and air conditioning |
| HX | heat exchanger |
| nren | nonrenewable |
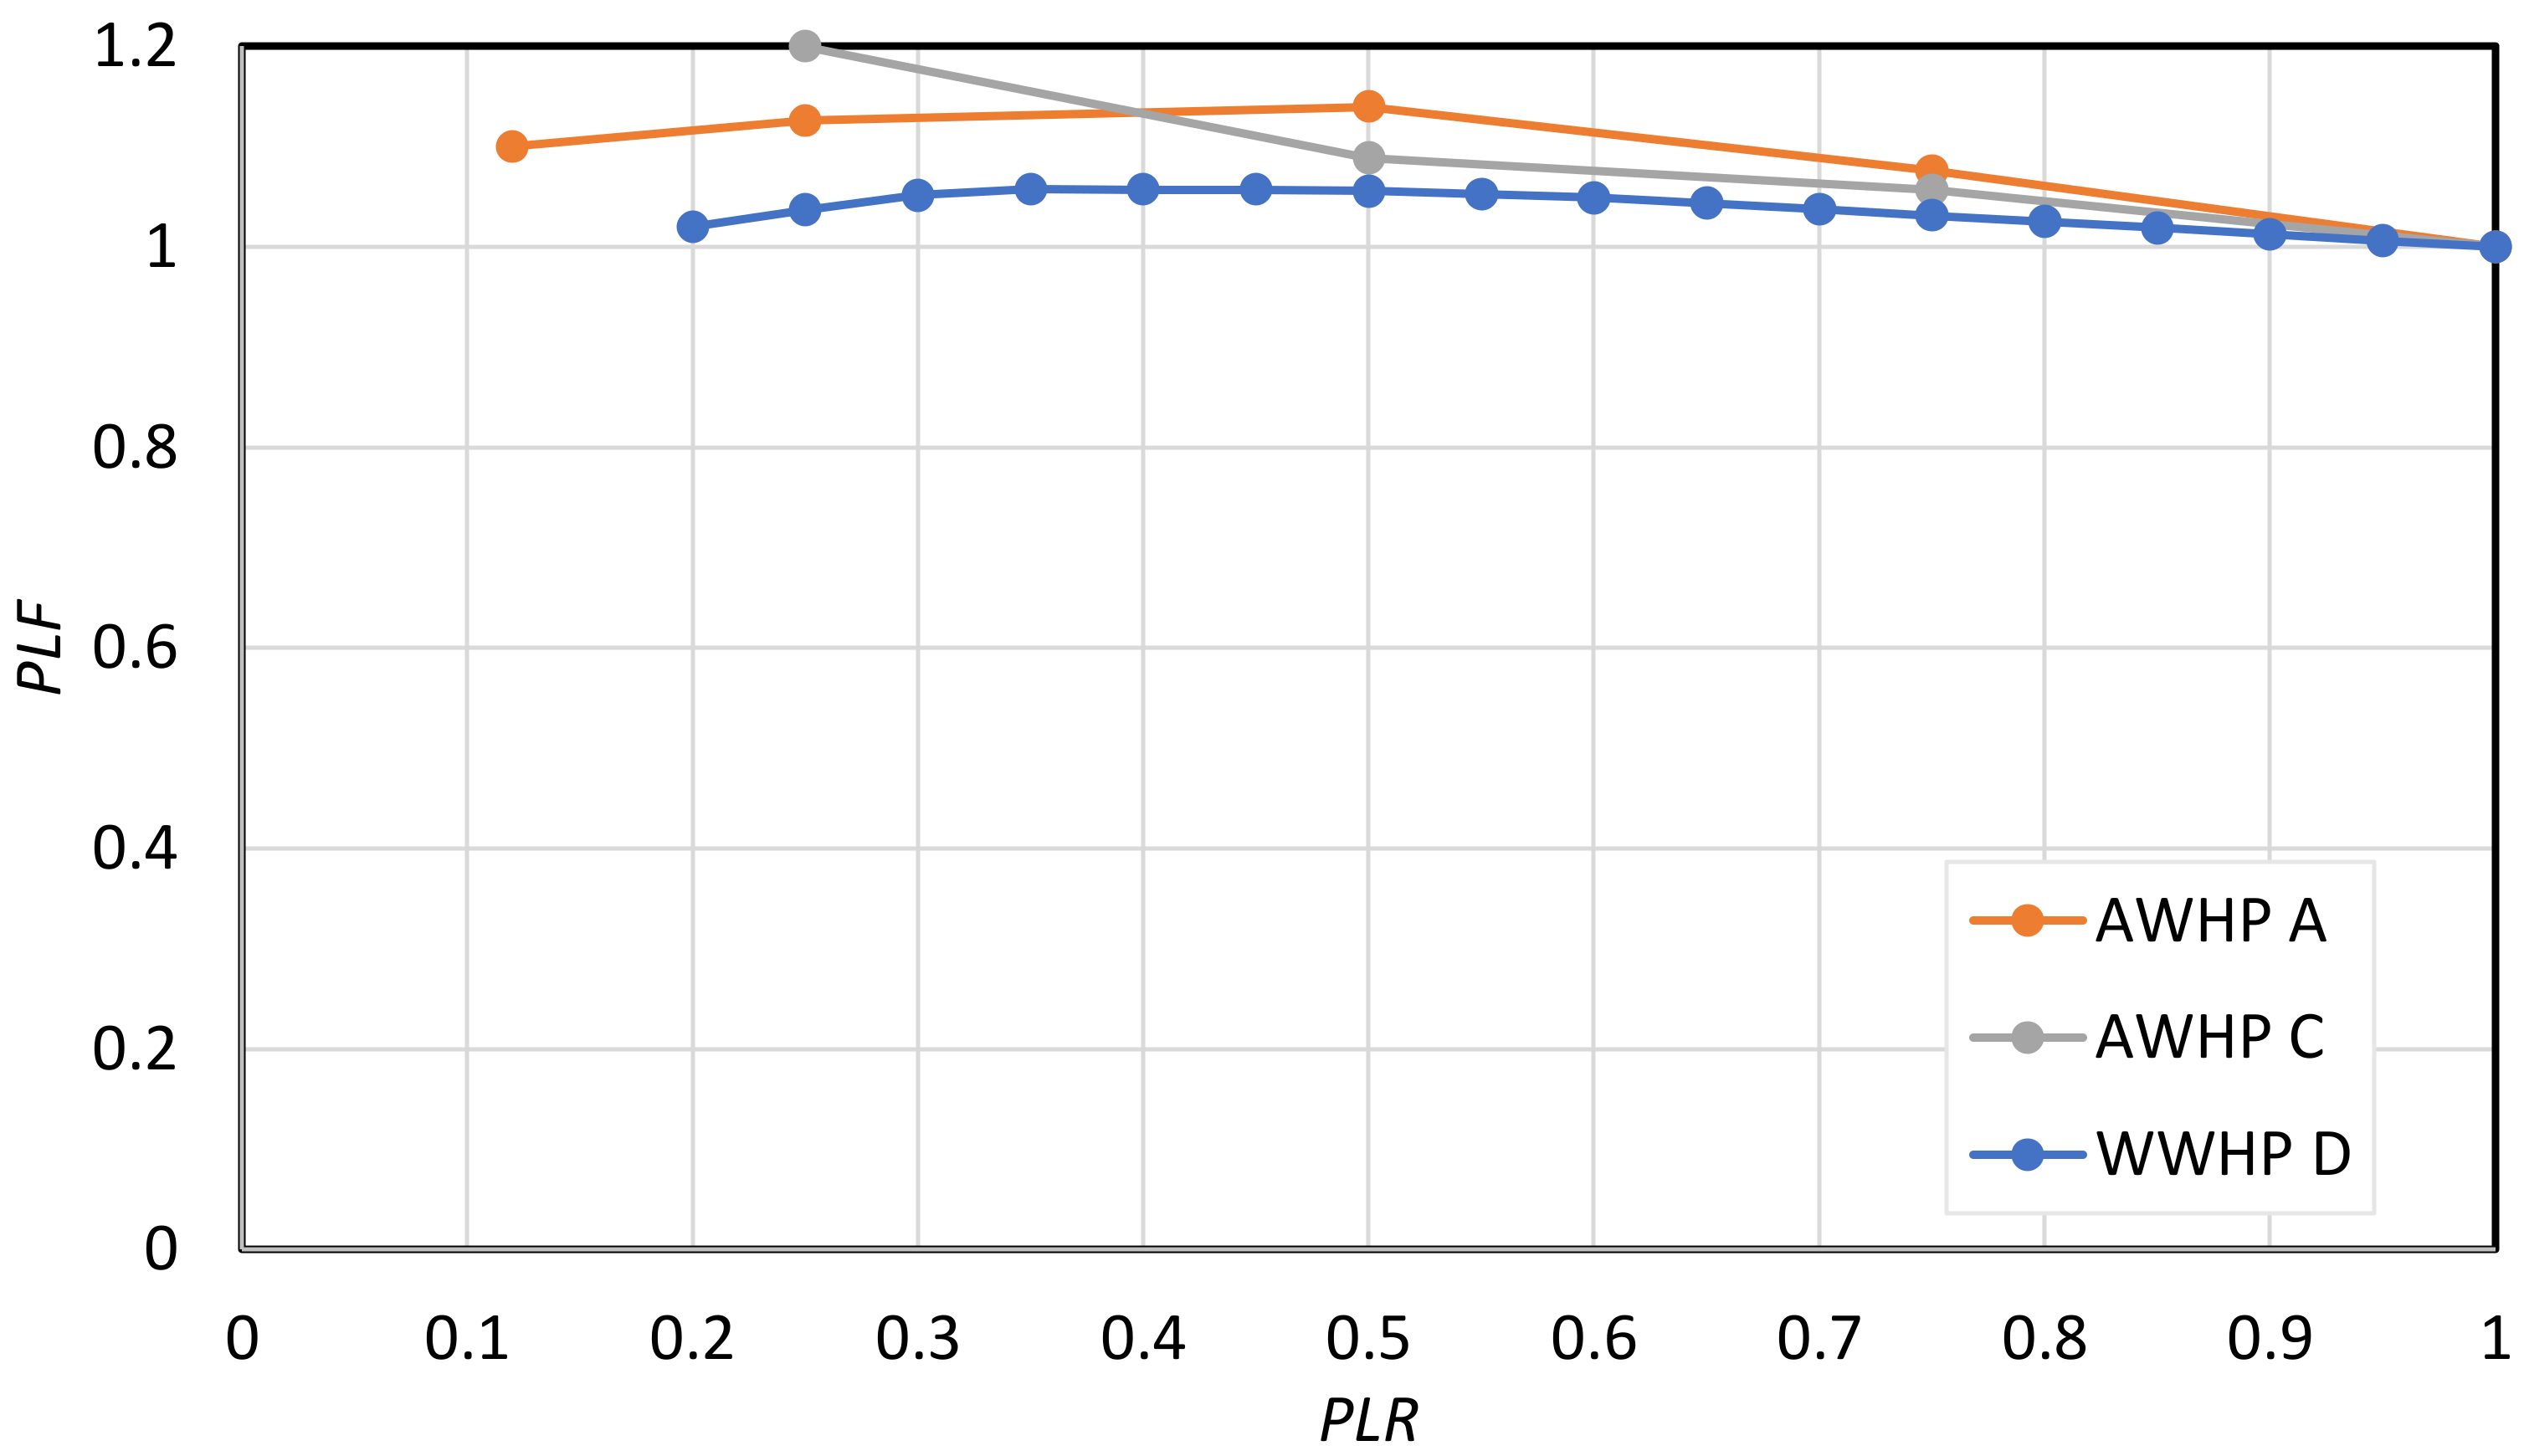
| PLF | partial load factor |
| PLR | partial load ratio |
| PV | photovoltaic |
| s | system |
| SCOP | seasonal coefficient of performance |
| SEER | seasonal energy efficiency ratio |
| TRY | test referent year |
| WWHP | water to water heat pump |
References
- Nocera, F.; Giuffrida, S.; Trovato, M.R.; Gagliano, A. Energy and New Economic Approach for Nearly Zero Energy Hotels. Entropy 2019, 21, 639. [Google Scholar] [CrossRef] [PubMed]
- Corrado, V.; Murano, G.; Paduos, S.; Riva, G. On the Refurbishment of the Public Building Stock toward the Nearly Zero-Energy Target: Two Italian Case Studies. Energy Procedia 2016, 101, 105–112. [Google Scholar] [CrossRef][Green Version]
- Becchio, C.; Corgnati, S.P.; Vio, M.; Crespi, G.; Prendin, L.; Magagnini, M. HVAC solutions for energy retrofitted hotel in Mediterranean area. Energy Procedia 2017, 133, 145–157. [Google Scholar] [CrossRef][Green Version]
- Smitt, S.; Tolstorebrov, I.; Gullo, P.; Pardiñas, A.; Hafner, A. Energy use and retrofitting potential of heat pumps in cold climate hotels. J. Clean. Prod. 2021, 298, 126799. [Google Scholar] [CrossRef]
- Vujnović, N.; Dović, D. Cost-optimal energy performance calculations of a new nZEB hotel building using dynamic simulations and optimization algorithms. J. Build. Eng. 2021, 39, 102272. [Google Scholar] [CrossRef]
- Belussi, L.; Barozzi, B.; Bellazzi, A.; Danza, L.; Devitofrancesco, A.; Fanciulli, C.; Ghellere, M.; Guazzi, G.; Meroni, I.; Salamone, F.; et al. A review of performance of zero energy buildings and energy efficiency solutions. J. Build. Eng. 2019, 25, 100772. [Google Scholar] [CrossRef]
- Fahlén, P. Capacity control of heat pumps. REHVA Eur. HVAC J. 2012, 49, 28–31. [Google Scholar]
- Uhlmann, M.; Bertsch, S.S. Theoretical and experimental investigation of startup and shutdown behavior of residential heat pumps. Int. J. Refrig. 2012, 35, 2138–2149. [Google Scholar] [CrossRef]
- Waddicor, D.A.; Fuentes, E.; Azar, M.; Salom, J. Partial load efficiency degradation of a water-to-water heat pump under fixed set-point control. Appl. Therm. Eng. 2016, 106, 275–285. [Google Scholar] [CrossRef]
- Riviere, P.; Malaspina, N.F.; Lebreton, J.M. A New Installation for Part Load Testing of Air to Water Single Stage Chillers and Heat Pumps. In Proceedings of the 2004 International Refrigeration and Air Conditioning Conference, West Lafayette, IN, USA, 12–15 July 2004; p. 726. [Google Scholar]
- Eurovent Certita Certification. Available online: https://www.eurovent-certification.com/en/ (accessed on 26 January 2022).
- Schibuola, L.; Scarpa, M. Experimental analysis of the performances of a surface water source heat pump. Energy Build. 2016, 113, 182–188. [Google Scholar] [CrossRef]
- Zacà, I.; D’Agostino, D.; Congedo, P.M.; Baglivo, C. Assessment of cost-optimality and technical solutions in high performance multi-residential buildings in the Mediterranean area. Energy Build. 2015, 102, 250–265. [Google Scholar] [CrossRef]
- Marini, D. Optimization of HVAC systems for distributed generation as a function of different types of heat sources and climatic conditions. Appl. Energy 2013, 102, 813–826. [Google Scholar] [CrossRef]
- Filotico, L.; Piccininni, F.; Scialpi, T. A Taranto’s hotel apllication of sea water air heat pump. In Proceedings of the International Conference on Heat Transfer, Thermal Engineering and Environment, Corfu, Greece, 20–22 August 2005. [Google Scholar]
- Wang, W.; Zhang, S.; Li, Z.; Sun, Y.; Deng, S.; Wu, X. Determination of the optimal defrosting initiating time point for an ASHP unit based on the minimum loss coefficient in the nominal output heating energy. Energy 2020, 191, 116505. [Google Scholar] [CrossRef]
- Rossi di Schio, E.; Ballerini, V.; Dongellini, M.; Valdiserri, P. Defrosting of Air-Source Heat Pumps: Effect of Real Temperature Data on Seasonal Energy Performance for Different Locations in Italy. Appl. Sci. 2021, 11, 8003. [Google Scholar] [CrossRef]
- ASHRAE Standard 116-1995; Method of Testing for Rating Seasonal Efficiency of Unitary Air Conditioners and Heat Pumps. ASHRAE Standard: Atlanta, GA, USA, 1995.
- EN 14825:2019; Air Conditioners, Liquid Chilling Packages and Heat Pumps, with Electrically Driven Compressors, for Space Heating and Cooling—Testing and Rating at Part Load Conditions and Calculation of Seasonal Performance. European Standards: Brussels, Belgium, 2019.
- UNI 10963; Air Conditioners, Liquid Chilling Packages And Heat Pumps—Performance Tests at Part Load. Ente Nazionale Italiano di Unificazione (UNI): Rome, Italy, 2001.
- Energy in Croatia—Annual Energy Report 2019; The Ministry of Economy and Sustainable Development: Zagreb, Croatia, 2020.
- Eurostat (European Statistical Office). 2022. Available online: https://ec.europa.eu/eurostat (accessed on 26 January 2022).
- TRNSYS Transient System Simulation Tool. 2013. Available online: http://www.Trnsys.Com/ (accessed on 17 January 2022).
- Soldo, V.; Novak, S.; Horvat, I. Algorithm for Calculating the Energy Required for Heating and Cooling Building Space According to HRN EN ISO 13790; Faculty of Mechanical Engineering and Naval Architecture, University of Zagreb: Zagreb, Croatia, 2017. [Google Scholar]
- Recknagel, E.; Sprenger, H.; Schramek, E.-R. Taschenbuch fur Heizung und Klimatechnik; Oldenbourg Industrieverlag: Munchen, Germany, 2007. [Google Scholar]
- Meteonorm Meteonorm—Global Meteorological Database. Available online: https://www.energiehaus.es/wp-content/uploads/2015/06/flyer-meteonorm-7.pdf (accessed on 10 January 2022).
- Technical Regulation on Rational Use of Energy and Thermal Protection in Buildings, Croatia. 2015. Available online: https://narodne-novine.nn.hr/clanci/sluzbeni/dodatni/438515.pdf (accessed on 17 January 2022).
- EN 12831; Energy Performance of Buildings—Method for Calculation of the Design Heat Load. European Committee for Standardizations: Brussels, Belgium, 2017.
- Richtlinie VDI 2078 Blatt 1. Berechnung der Kühllast klimatisierter Gebäude bei Raumkühlung über Raumumschließungsflächen. Bauphysik 2003, 25, 172–173. [Google Scholar] [CrossRef]
- Delač, B. Optimization of Energy Systems for Nearly Zero Energy Buildings Using Dynamic Simulations; University of Rijeka—Faculty of Engineering: Rijeka, Croatia, 2017. [Google Scholar]
- Pavković, B.; Delač, B.; Mrakovčić, T. Modified water loop heat pump system for a hospital with complex HVAC systems. Teh. Vjesn. Gaz. 2012, 19, 621–631. [Google Scholar]
- Pavković, B.; Jelušić, K.; Frank, M. Optimization of the Heat Pump Systems Using Surface Water at Low Temperatures as the Heat Source. In Proceedings of the 38th International Congress on Heating, Ventilation and Air-Conditioning, SMEITS, Belgrade, Serbia, 5–7 December 2007; SMEITS: Belgrade, Serbia, 2007; pp. 253–264. [Google Scholar]
- Commission Delegated Regulation No. 244/2012. 2012. Available online: http://www.buildup.eu/sites/default/files/content/l_08120120321en00180036.pdf (accessed on 17 January 2022).
- European Union. Guidelines Accompanying Commission Delegated Regulation (EU) No 244/2012 of 16 January 2012 Supplementing Directive 2010/31/EU of the European Parliament and of the Council (2012/C 115/01); European Union: Brussels, Belgium, 2012. [Google Scholar]
- ASHRAE: Service Life and Maintenance Cost Database. Available online: http://weblegacy.ashrae.org/publicdatabase/ (accessed on 26 January 2022).
- Joint Research Centre—Photovoltaic Geographical Information System. Available online: https://re.jrc.ec.europa.eu/pvg_tools/en/ (accessed on 26 January 2022).


| Climate data | City | Poreč (Croatia) |
| Longitude | 17°36′ E | |
| Latitude | 45°13′ N | |
| Dry bulb temperature-annual daily mean | 13.9 °C | |
| Dry bulb temperature-daily mean minimum | −6.5 °C | |
| Dry bulb temperature-daily mean maximum | 29.6 °C | |
| Mean relative humidity | 74% | |
| Global irradiation | 1428 kWh/m2 | |
| Physics | Dimensions (length × width × height) | 24.4 m × 15.5 m × 20.5 m |
| Conditioned area | 690 m2 | |
| Conditioned volume | 5045 m3 | |
| Envelope | External wall U-value | 1.4 W/m2K |
| Internal wall U-value | 1.5 W/m2K | |
| Floor on the ground U-value | 1.7 W/m2K | |
| Roof U-value | 3.1 W/m2K | |
| Ceiling towards the attic U-value | 1 W/m2K | |
| Window/door U-value | 3.2 W/m2K | |
| Ventilation | Infiltration/required ventilation rate | 0.48 h−1/1.32 h−1 |
| Mechanical ventilation | Not existing | |
| Occupancy and operation | Occupancy | 5 days in week 6 A.M.–5 P.M. |
| Number of persons | 120 | |
| Internal heat gains | 6 W/m2 | |
| Heating and cooling operation | Interrupted | |
| Heating temperature set point | 22 °C | |
| Cooling temperature set point | 24 °C | |
| DHW set point | 45 °C |
| Unit | Operation | Groundwater Temperature Regime | Water Temperature Regime | WWHP Temperature Regime |
|---|---|---|---|---|
| WWHP-1 | Heating | 15/11 °C (HX-1) | 13/9 °C (evaporator) | 40/45 °C (condenser) |
| WWHP-1 | Cooling | 19/23 °C (HX-1) | 21/25 °C (condenser) | 12/7 °C (evaporator) |
| WWHP-2 | Heating | 15/11 °C (HX-2) | evaporator: 13/9 °C | 45/50 °C (condenser) |
| Regime | WWHP-1 | WWHP-2 | Flow Rate | Required Pressure Drop | Efficiency | Power Consumption |
|---|---|---|---|---|---|---|
| A | On | On | 6 L/s | 180 kPa | 50.5% | 2.137 kW |
| B | On | Off | 4.5 L/s | 160 kPa | 45.9% | 1.568 kW |
| C | Off | On | 1.5 L/s | 130 kPa | 22.2% | 0.879 kW |
| Manufacturer | Heat Pump Type | Refrigerant | Capacity Modulation | PLF Data Provided | Price for 2 Heat Pumps (H/C and DHW) |
|---|---|---|---|---|---|
| A | AWHP | R32 | Yes (12–100%, stepless) | Yes | 55.500 € |
| B | AWHP | R410A | Yes (50, 100%) | No | 34.500 € |
| C | AWHP | R410A | Yes (25, 50, 75, 100%) | Yes | 32.600 € |
| A | WWHP | R410A | No (on-off) | No | 23.800 € |
| B | WWHP | R410A | Yes (50, 100%) | No | 21.700 € |
| C | WWHP | R410A | No (on-off) | No | 13.000 € |
| D | WWHP | R410A | Yes, (20–100%, stepless) | Yes | 37.000 € |
| System | Description | Price |
|---|---|---|
| WWHP | Groundwater heat source system (mechanical and geotechnical works) Auxiliary HVAC equipment and related installation works | 53.000 € |
| AWHP | Auxiliary HVAC equipment and related installation works | 13.000 € |
| PV | Procurement and construction of PV power plant | 800 €/kW |
| Energy Source | Cost | Price | |
|---|---|---|---|
| Electricity | Day tariff | 0.083 | €/kWh |
| Night tariff | 0.052 | €/kWh | |
| Groundwater | 0.013 | €/m3 |
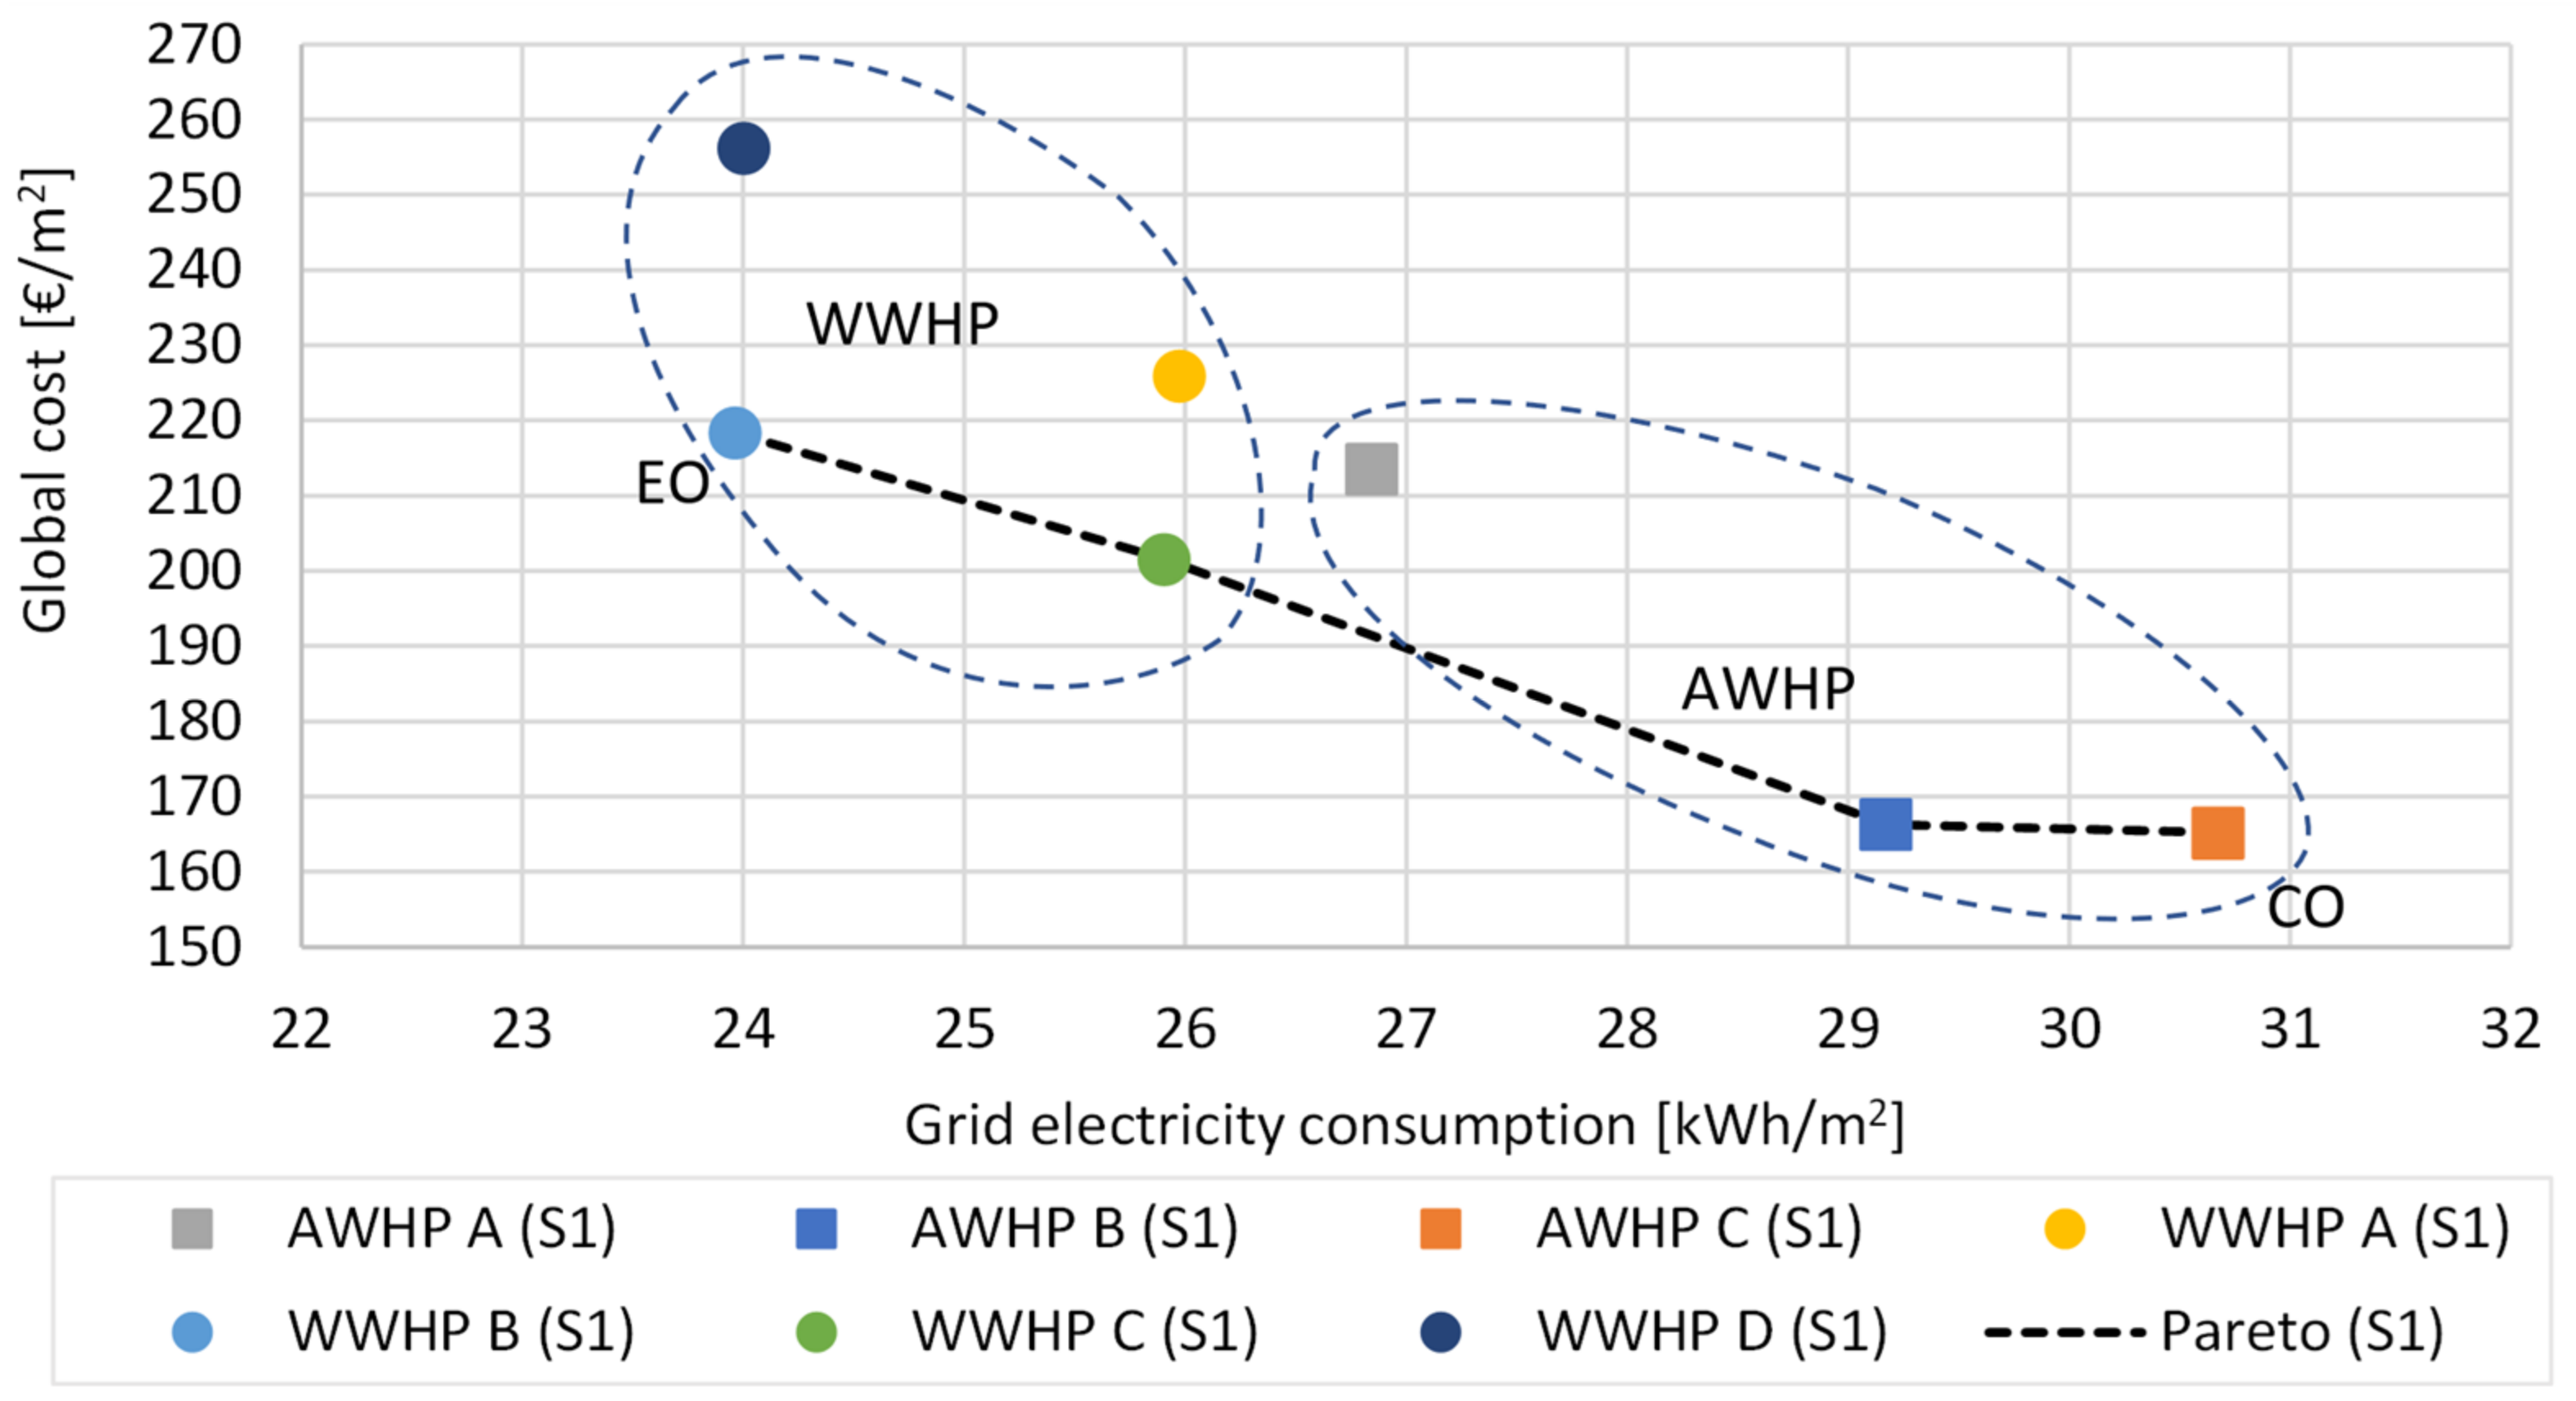
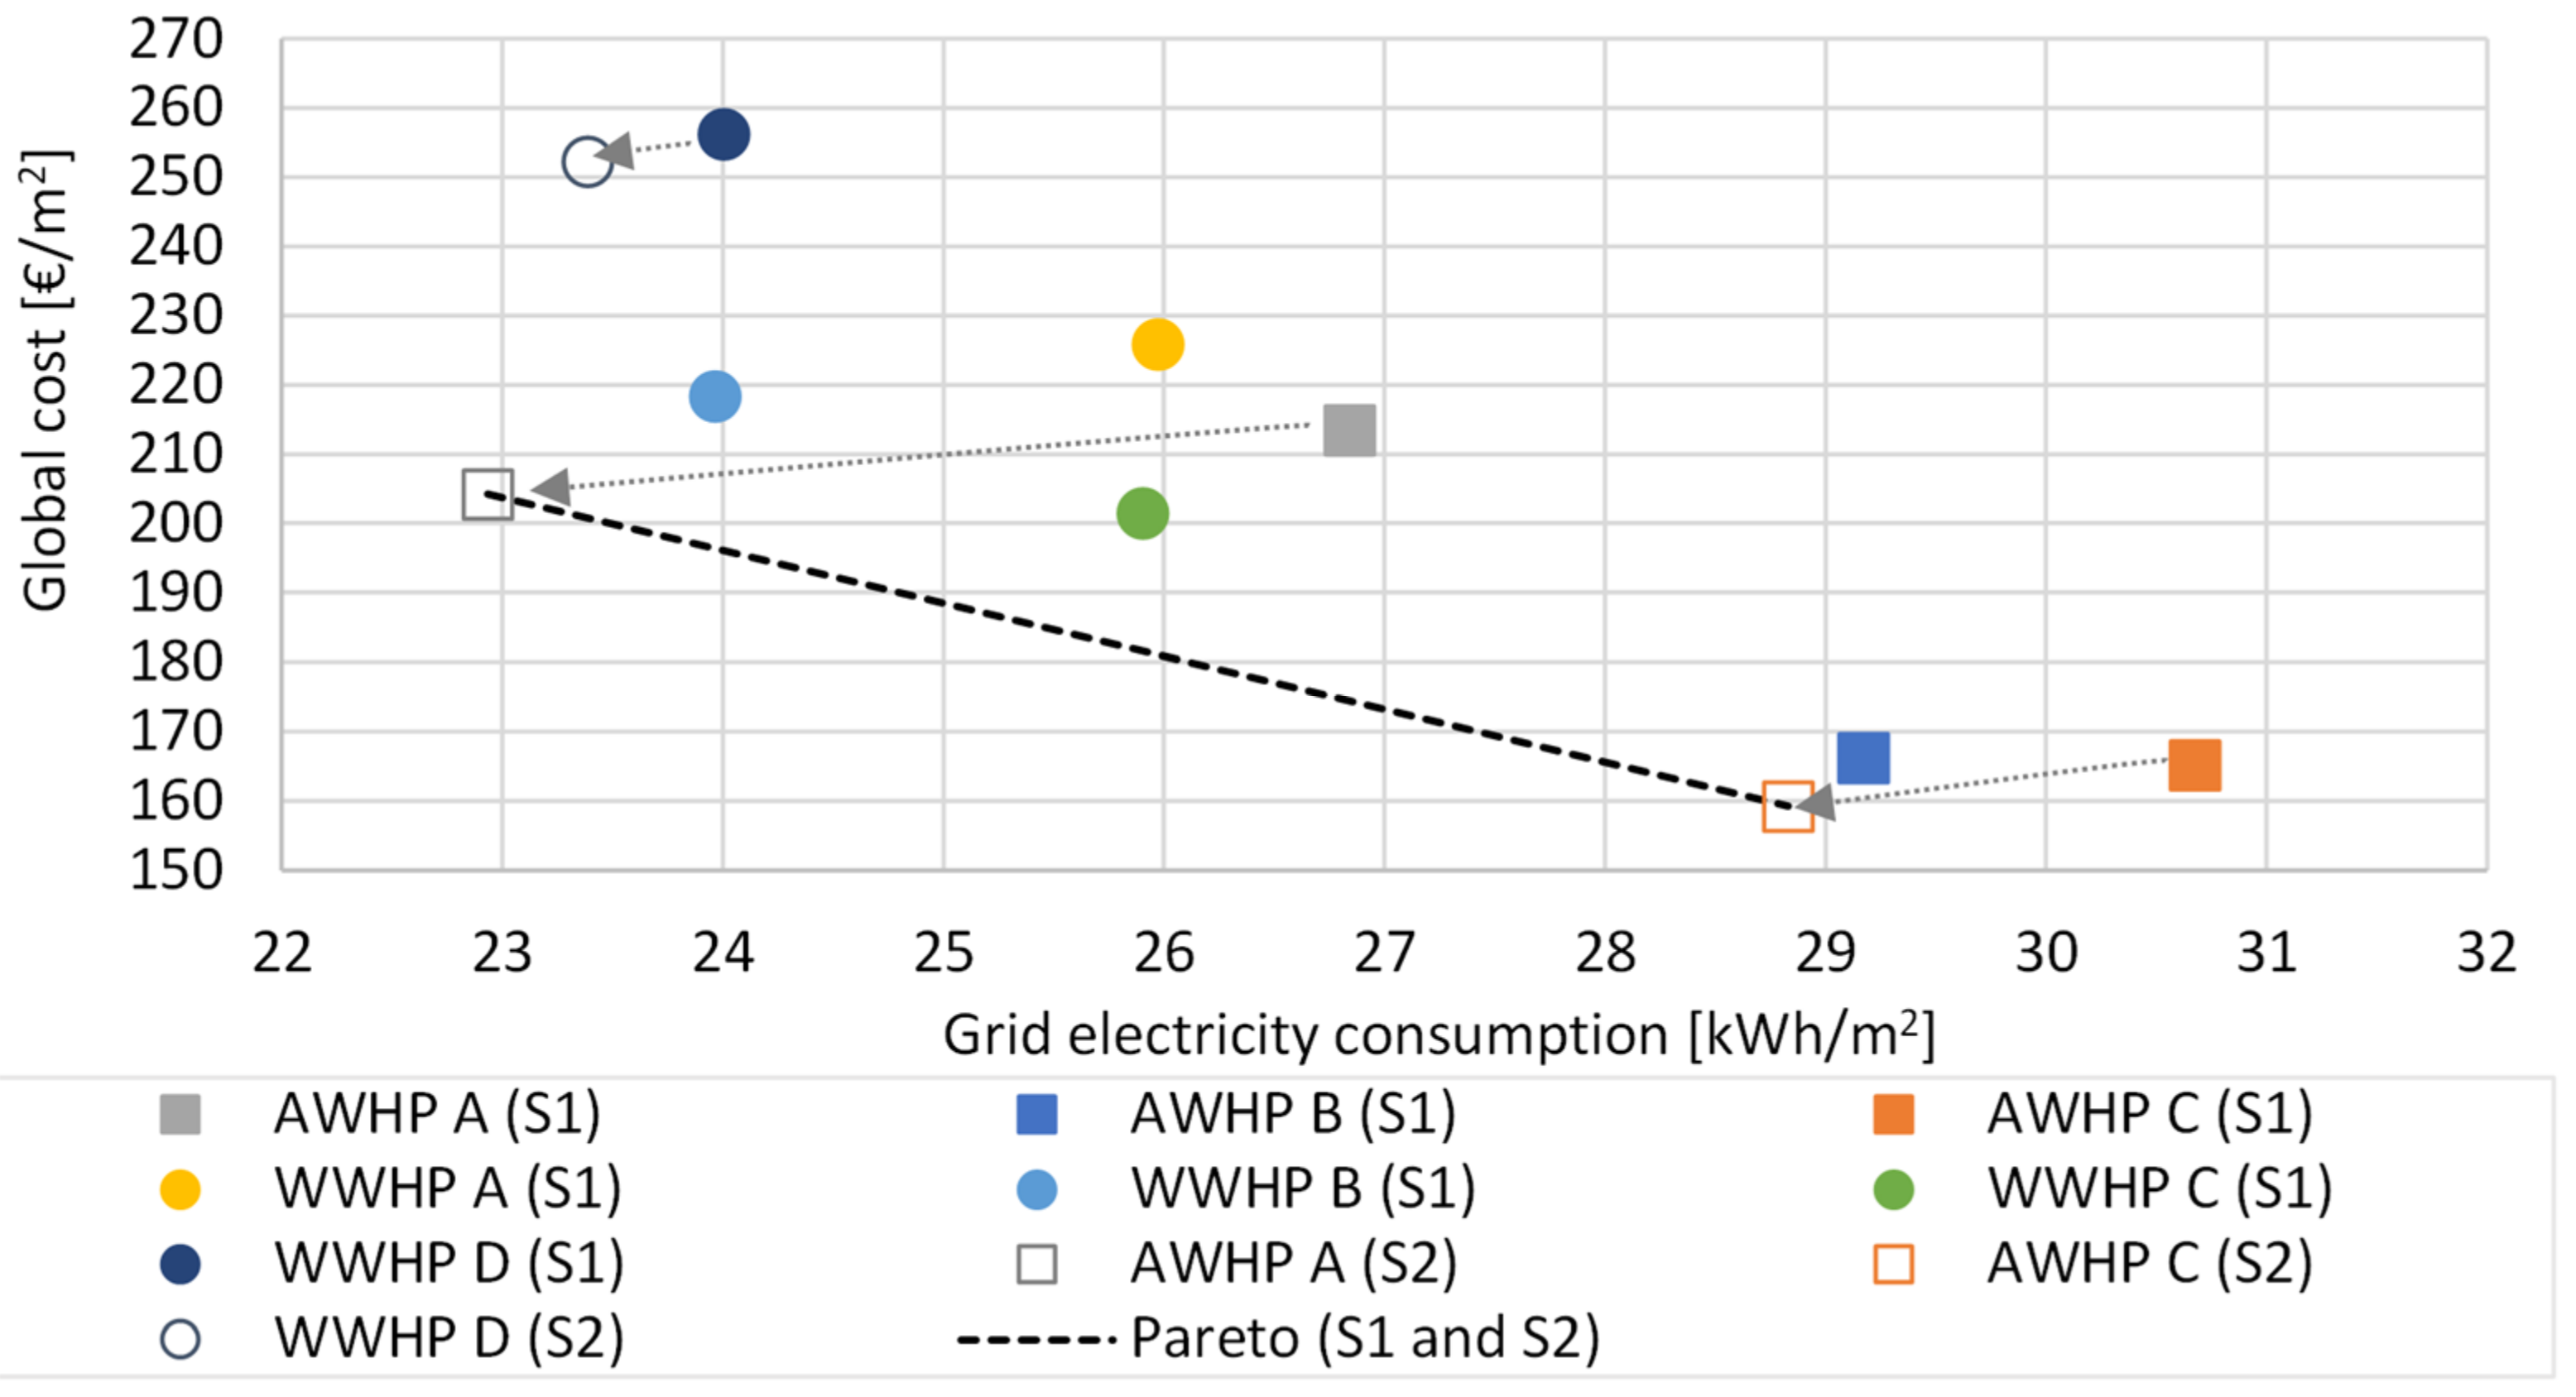
| System | Electricity from Grid,kWh/m2 | Global Cost, €/m2 | Investment, €/m2 | Operating Cost, €/m2 | Maintenance Cost, €/m2 | PV Plant Size, kW |
|---|---|---|---|---|---|---|
| AWHP A (S1) | 27.0 | 213.5 | 139.0 | 27.8 | 46.7 | 20.4 |
| AWHP B (S1) | 29.2 | 166.3 | 103.9 | 29.9 | 32.5 | 21.6 |
| AWHP C (S1) | 30.7 | 165.2 | 102.7 | 31.3 | 31.2 | 23.4 |
| WWHP A (S1) | 26.0 | 225.9 | 141.2 | 37.0 | 47.8 | 19.8 |
| WWHP B (S1) | 24.0 | 218.4 | 136.1 | 35.9 | 46.3 | 18.6 |
| WWHP C (S1) | 25.9 | 201.6 | 122.4 | 38.7 | 40.5 | 19.8 |
| WWHP D (S1) | 24.0 | 256.2 | 162.7 | 36.8 | 56.7 | 18.6 |
| AWHP A (S2) | 22.9 | 204.2 | 135.5 | 22.0 | 46.7 | 17.4 |
| AWHP C (S2) | 28.8 | 159.3 | 100.6 | 27.5 | 31.2 | 21.6 |
| WWHP D (S2) | 23.4 | 252.4 | 161.3 | 34.4 | 56.7 | 17.4 |
Publisher’s Note: MDPI stays neutral with regard to jurisdictional claims in published maps and institutional affiliations. |
© 2022 by the authors. Licensee MDPI, Basel, Switzerland. This article is an open access article distributed under the terms and conditions of the Creative Commons Attribution (CC BY) license (https://creativecommons.org/licenses/by/4.0/).
Share and Cite
Delač, B.; Pavković, B.; Grozdek, M.; Bezić, L. Cost Optimal Renewable Electricity-Based HVAC System: Application of Air to Water or Water to Water Heat Pump. Energies 2022, 15, 1658. https://doi.org/10.3390/en15051658
Delač B, Pavković B, Grozdek M, Bezić L. Cost Optimal Renewable Electricity-Based HVAC System: Application of Air to Water or Water to Water Heat Pump. Energies. 2022; 15(5):1658. https://doi.org/10.3390/en15051658
Chicago/Turabian StyleDelač, Boris, Branimir Pavković, Marino Grozdek, and Luka Bezić. 2022. "Cost Optimal Renewable Electricity-Based HVAC System: Application of Air to Water or Water to Water Heat Pump" Energies 15, no. 5: 1658. https://doi.org/10.3390/en15051658
APA StyleDelač, B., Pavković, B., Grozdek, M., & Bezić, L. (2022). Cost Optimal Renewable Electricity-Based HVAC System: Application of Air to Water or Water to Water Heat Pump. Energies, 15(5), 1658. https://doi.org/10.3390/en15051658