Article

FOWT Stability Study According to Number of Columns Considering Amount of Materials Used

by
Ho-Seong Yang
1,2,
Ali Alkhabbaz
1,
Dylan Sheneth Edirisinghe
1,2,
Watchara Tongphong
1 and
Young-Ho Lee
1,2,*
1
Department of Mechanical Engineering, Korea Maritime and Ocean University, Busan 49112, Korea
2
Interdisciplinary Major of Ocean Renewable Energy Engineering, Graduate School, Korea Maritime and Ocean University, Busan 49112, Korea
*
Author to whom correspondence should be addressed.
Energies 2022, 15(5), 1653; https://doi.org/10.3390/en15051653
Submission received: 25 January 2022 / Revised: 20 February 2022 / Accepted: 21 February 2022 / Published: 23 February 2022

Abstract

:
Considering stability and fabrication cost, 3–4 columns are usually adopted for semi-submersible platform designs. Although increasing the number of columns provides more stability for both floating platform and system as a whole, it is generally not economically viable. In this respect, the present work provides a high-fidelity analysis of semi-submersible platform stability and hydrodynamic response for different design concepts. The number of columns was considered as the main design parameter and was varied from 3–6 columns. The semi-submersible weight was kept constant during the simulation period by changing the column diameter and amount of ballast water. The investigation was carried out using the potential code Orcawave, the results of which were input directly to the engineering tool OrcaFlex. Four different types of semi-submersible platforms with a varying number of columns were tested and compared under extreme environmental conditions in order to ensure their stability and hydrodynamic response. The simulation findings revealed that platform stability was more affected by the geometrical features of the floater than by the number of columns. Furthermore, the number of columns did not have a significant impact on hydrodynamic behavior for the same platform geometry.

1. Introduction

Carbon dioxide is one of the most important factors contributing to climate change and global warming. It is released as a byproduct of the annual use of large quantities of fossil fuels for various industrial processes [1,2,3,4,5]. Nonrenewable resources such as nuclear power stations represent good sustainable sources that provide a large amount of energy and low emissions. However, researchers tend to use nuclear energy as minimally as possible in order to reduce nuclear waste and radioactive pollution from uncontrolled accidents. As an energy-related policy, Germany plans to terminate the use of new sources of nuclear power by the end of 2022. Moreover, many countries such as China, India, and the United States have tremendously reduced the use of fossil fuels, oil, and gas for energy generation. In particular, China has introduced a policy to suspend coal power generation. Generating power using fossil fuels is harmful to the environment, and fossil fuels supplies are limited and subject to price volatility. In this sense, more attention is being channeled towards low-carbon sources such as renewable and sustainable technologies. Renewable energy is generated from sources that naturally replenish themselves and never run out. The most common renewable resources are solar, wind, hydro, and biomass. When it comes to itemizing renewables, wind power is a crucial source of renewable energy that cannot be overemphasized. However, wind energy usage for power generation is not commensurate with its abundance, which is due to several challenges including noise emissions and unpredictable or low wind speeds. In this respect more attention is being drawn to research on floating wind turbines for harvesting energy in the deep sea far from densely populated areas.
Several types of foundations for such floating wind turbines have been proposed over the years, including spar buoy, tension-leg, and semisubmersible platforms. Considering water depth and stability method, semisubmersible platforms provide positive buoyancy due to a heave plate attached to the bottom of the pontoons. However, the use of floating support and mooring lines increases the technological challenges, as the entire wind turbine moves in six degrees of freedom of motion, both heave motion (up and down following the waves) and pitch motion (tilting against or with the wind). In this regard it is important to ensure the stability of the entire floating system while continuing to produce electricity. Furthermore, these degree of freedom motions create challenges for the control of the wind turbine itself, particularly under extreme wave and wind conditions.
Therefore, there is need to design a floating platform that maintains a high level of stability even under extreme environmental conditions. The well-known OC4 semi-submersible platform shows high stability and the design information is freely available to researchers; thus, it has been widely used for floating wind turbine investigation and analysis in recent decades. Karimi et al. [6] studied several factors that determine the optimal shape of three types of floating platforms, tension-leg, spar buoy, and semi-submersible, in order to minimize the platform manufacturing cost and increase overall turbine performance for different environmental conditions. Brommundt et al. [7] and Benassai et al. [8] conducted optimization studies using a multi-objective genetic algorithm approach for the mooring systems while keeping the platform geometry fixed.
Being one of the platform optimization methods, a study on a moonpool-type barge platforms was performed as well. Moonpool is helpful in reducing fabrication cost and improving motion performance [9,10].
Generally, full-scale floating wind turbine testing is more expensive and most of the analysis data are confidential and not available to researchers. However, a few experimental tests have been performed with scaled-down models using wave tanks. Moreover, several design codes and numerical tools have been created over the years. Allen et al. [11] conducted a study to verify simulation reliability by comparing the experimental results of scaled-down floating turbines with the corresponding data from numerical analysis. Robertson et al. [12] compared the accuracy of various numerical codes by conducting a simulation of a floating turbine under the same environmental conditions. Several topics can be addressed in the platform design. Zhou et al. [13] reported the manufacturing cost, structural characteristics (stiffness and natural frequency), and hydrodynamics varied according to ten shape design variables for a semi-submersible platform having a simple shape with four columns (the concept presented by NAUTLUS); AAT sensitivity analysis was used to conduct the platform optimization work.
Based on the aforementioned works, it is evident that the fabricating cost of the floating platform is highly affected by the radius of the columns. Furthermore, this has a significant impact on the natural frequency of the platform surge response as well as the first-order hydrodynamics. It has been observed that platform stability is affected by the column radius and that the number of columns should be taken into consideration. Thus, in the present work, the impact of the number of columns on the platform hydrodynamic response was analyzed using the potential code OrcaFlex. The number of columns was changed while keeping the overall platform mass constant by reducing the radius of the columns. The workflow of the present paper first involves the methodology and design of a new platform with different columns; second, the verification of hydrodynamic coefficients and responses; third, the selection of Design Load Cases (DLC) and environmental conditions; and finally, a fully-coupled simulation of the hydrodynamic response of the new platform designs.

2. Methodology

2.1. The Workflow of the Present Simulation

The present paper involves two main parts, code validation and hydrodynamic response and stability analysis as shown in Figure 1. Numerical analysis is usually based on mathematical models that describe the various physical processes involved in engineering applications. Code validation is one of the priorities of numerical simulation as it ensures the accuracy of the mathematical models. The NREL reference turbine, with a capacity of 5-MW supported with a semi-submersible OC4-OC4 platform, was selected for the validation test. Thereafter, diffraction analysis was performed in order to obtain the platform hydrodynamic characteristics, which were eventually used for fully-coupled simulation in the final stage. The hydrodynamic behavior of the platform was predicted based on its characteristics. Thus, it was essential to determine the platform characteristics in order to accurately capture its hydrodynamic performance. Two commercial tools ANSYS-AQWA and Orcawave, were adopted in the present work to conduct the diffraction analysis and to obtain the OC4-OC4 platform characteristics. The reasons for using various tools for diffraction analysis are explained as follows. To perform fully coupled simulation with the Orcaflex tool, there is a need to input the diffraction data required for platform analysis. Orcawave enables the generation of diffraction data and the easy importation of the generated data. However, in the Orcawave tool it has been confirmed that sometimes a result does not converge even if the size of the grid becomes smaller. Therefore, when the convergence of the results was not guaranteed using the grid sensitivity test, ANSYS AQWA, another diffraction analysis tool, was used to secure the reliability of the analysis.
The obtained diffraction data were then fed into OrcaFlex to perform a fully-coupled simulation of the entire 5-MW floating wind turbine. A comparison of the hydrodynamic response of the 5-MW FOWT between the results obtained from OrcaFlex and corresponding data from previously published papers was implemented.
The next major step in the current work was the stability analysis of the new platform concepts designed based on the number of columns and with constant overall weight. This involved hydrodynamic diffraction analysis for each design concept. Moreover, a mesh dependency test was conducted using the commercial code ANSYS-AQWA in order to ensure that the obtained results were independent of the spatial mesh size and to sufficiently capture the hydrodynamic behavior of the platform. Finally, a fully-coupled simulation of a 5-MW floating wind turbine fixed on the presently-designed floating-bottom foundations was performed under extreme environmental conditions.

2.2. Orcawave

In the present work, the Orcawave commercial code was adopted in order to obtain hydrodynamic diffraction data for the platform. According to the verification report released from Orcina Ltd., the hydrodynamic load applied to the floating structure using the first-order and second-order waves was compared with the corresponding data obtained from the WAMIT v7.0 code.
It was observed that the obtained results from Orcawave were more consistent, with some undesired outcomes such as irregular frequencies on the structure’s inner surfaces effectively filtered and eliminated compared to WAMIT code [14]. Orcawave code is a hydrodynamic analysis tool based on potential flow theory. It determines the load and hydrodynamic responses applied to a floating structure by the water surface. Furthermore, the potential velocity ϕ is calculated for all lattices that make contact with the water surface. In addition, all hydrodynamic responses and coefficients, such as Response Amplitude Operator (RAO) for all platform responses, added mass, and damping coefficients can be estimated using Orcawave code. Added mass and damping coefficients are determined using Equation (1), as follows:
A i j i ω B i j = ρ S B ( n v e l ) i ϕ j d S
Here, A i j is the added mass and B i j is the damping coefficient. These values are defined by radiation potential, denoted ϕ j and located on the right-hand side of Equation (1). It should be noted that ϕ j is not the mean total radiation potential; rather it represents the radiation potential variable for each six degrees of freedom. The total radiation potential is denoted ϕ R and expressed in Equation (2); each radiation potential defined the solution satisfying boundary value problem in Equations (3)–(6) as follows:
ϕ R = i ω j ξ j ϕ j
2 ϕ = 0   X ν
ϕ n = q B ( X ) X S B
g ϕ Z ω 2 ϕ = q F ( X ) X S F
ϕ Z = 0 Z ( or   on   seabed )
Orcawave code provides two ways of estimating RAO load: Haskind RAOs and Diffraction RAOs. The Haskind method determines RAO load as a function of the incoming wave field ( ϕ D ) and radiation potential ( ϕ i ). Equation (7) can be used to calculate the RAOs based on the Haskind approach:
F i = i ω ρ S B ( n v e l ) i ϕ D d S
The diffraction approach estimates RAOs using Equation (8) as a function of the incoming wave field, ϕ I , and the pressure integration of the diffraction potential:
F i = i ω ρ S B { ( n v e l ) i ϕ i ϕ I n } d S
Although the above two equations are mathematically identical, discretization errors may occur due to the numerical analysis using the integral equation and the separated mesh constituting the body. In this regard, the discretization error obtained from each of the Haskind and diffraction approaches was determined and compared in order to increase the accuracy of the numerical analysis.
The results obtained from the diffraction analysis were then fed into OrcaFlex commercial software in order to perform an investigation of a fully floating turbine. Orcaflex is a fully-coupled simulation program that can analyze the wave load acting on the platform as well as the response and load applied to the fairlead by complex loads such as wind and mooring lines.

3. Code Validation

As a part of the verification step, code validation was carried out in order to ensure the accuracy of the numerical tool and estimate the difference between physical reality and the applied mathematical model. A popular benchmark NREL 5-WM wind turbine fixed on a floating semi-submersible platform was adopted for this analysis. A systematic comparison of the hydrodynamic coefficients and platform response between the OrcaFlex results and the corresponding data obtained from the recently published experimental and numerical results was conducted [15].

3.1. Reference Model

In the present work, the well-known OC4-OC4 semi-submersible floating wind turbine was adopted for the verification test. This turbine features three blades, a diameter of 126 m, and hub height of 90 m. The turbine rotor, nacelle, and tower were placed on an OC4 semi-submersible platform. This consists of a main column with a diameter of 6.5 m and three offset columns connected to the main column via pontoons and cross members. The design specifications are reported in Table 1.

3.2. Diffraction Analysis

Diffraction analysis is used to estimate the hydrodynamic loads on a floating structure due to excitation from incident waves. A comparison of the hydrodynamic coefficients of a semi-submersible platform including added mass and damping coefficients was performed between the potential codes (Orcawave, WAMIT, and ANSYS-AQWA). Overall, the results obtained from Orcawave and AQWA in terms of the added mass of different matrices (   A 11 , A 33 , A 55 and A 66 ) showed good agreement with the corresponding data from previously published works, as depicted in Figure 2. However, there was an evident difference in the added mass matrix ( A 55 ) between potential codes AQWA and Orcawave. In this respect, Lin et al. [15] mentioned that a slight difference in added mass between potential codes could be due to different approaches used to estimate hydrodynamic diffraction. In any case, the overall hydrodynamic behavior of the floating platform was not affected by these slight differences.
Figure 3 displays a comparison of the hydrodynamic behavior in terms of the damping coefficients of different matrices ( B 11 , B 33 , B 44 and B 66 ) between the present results obtained from AQWA and Orcawave and the corresponding published data. Overall, the results show good agreement between the results obtained from both AQWA and Orcawave and the corresponding data from previously published work [16]. However, slight discrepancies were captured between AQWA and Orcawave, particularly for the damping matrix B 44 , which is due to the different approaches used to estimate hydrodynamic diffraction.

3.3. Fully Coupled Simulation

Because the simulation performed in the stability analysis step was performed under environmental conditions in which uniform wind speed is considered in regular wave conditions, fully coupled simulation verification was required. However, there was no reference result satisfying all these conditions; in order to utilize reference data, the analysis was verified by classifying them into two categories, a case in which only the regular wave condition was considered and a case in which both irregular waves and turbulent wind speeds were considered.
Figure 4 shows the simulation results for the surge, heave and pitch motions considering the regular wave condition without wind. These simulations were performed with a wave height of 6 m and a wave period of 10 s. The blue line represents the present results, while the red area represents the simulation result performed by A. Robertson et al. [10]. They obtained their platform motion results using various simulation tools; however, these graphs show only one region for the sake of clarity. Moreover, the upper and lower regions of the reference result zone are displayed with a red dotted line. In Figure 4, it can be seen that the present result are in agreement with previously published data under regular wave conditions.
We intended to use uniform wind conditions to analyse the stability of the newly designed platforms; however, there were no reference studies which used uniform wind conditions. Therefore, in this case comparative verification was conducted with simulations using a turbulence wind model, which is more complex than using a uniform wind condition.
The wind field in the reference analysis model used the Mann model spectrum. However, OrcaFlex cannot recognize spatially varying wind fields such as the Mann model. In OrcaFlex, a 2D wind field such as an API spectrum can be generated. In Figure 5, it is reasonable to use the OrcaFlex API wind spectrum to consider high-frequency wind speeds. However, low-frequency regions should be considered as well as this region is more dominant. Comparing the OrcaFlex API and IEC Kaimal model, the Kaimal model is better with the Mann model at the low frequency. According to Bussemakers et al. [16], it was confirmed that the IEC Kaimal model defined in IEC 61400-1 was similar to the Mann model in the turbulent flow field. Thus, the turbulence model called IEC Kaimal was adopted in this analysis, with the wave conditions Hs = 6 m, Tp = 10 s, and y = 2.87. The Turbsim program was used to generate the IEC Kaimal wind spectrum. Turbsim is a 3D wind field generate program made by NREL; in order to generate the wind spectrum, the default value of Turbsim was used. Therefore, we used a power law profile on the rotor disc with a logarithmic profile with a surface roughness of 0.03 m and Power law exponent of 0.2, and the IEC coherence model.
The simulations were performed under the above-mentioned environmental conditions. Moreover, we compared surge, pitch, and tower moment values with other researchers’ simulation results from different tools under the same environmental conditions, as displayed in Figure 6. Other research organizations’ exact names are displayed in the index, and they are referenced along with the paper by A. Robertson et al. [10].
All graphs show the 10 min average result of each motion, and the first bar displays the present KMOU study. In these results, surge, pitch and tower bending moment all show excellent agreement with the other potential codes.

4. DLC and Simulation Condition

Platform stability analysis simulation by shape was performed by applying extreme environment data from 35 ° 45 0   N ,   129 ° 45 00 .   E , Ulsan waters, located off eastern Korea. This location is displayed as red circle in Figure 7. The extreme environment data used in the simulation made use of the 2019 deep sea design wave data provided by the Ministry of Oceans and Fisheries; only wave height, wave period, and wind speed data for each direction were used. In order to analyze the overall stability of the platform with DLC, the influence of waves and winds in all directions was analyzed. In addition, in order to understand the stability of the wave and wind misalignment conditions three cases of wind misaligned by 22.5° left and right based on the direction of the aligned wind and wave direction for each wave condition were carried out for each platform, for a total of 48 cases per platform. Simulations were additionally performed for the collected ten-year environmental data; the NNE direction with the strongest wind speed was set as the wind blowing in front of the turbine. The applied environmental conditions and locations are explained in detail in Figure 7 and Table 2 and Table 3 below.

5. New Designed Platform Stability Condition

5.1. Wind Turbine

In this study, analyses were performed using an NREL 5MW reference wind turbine. Currently, this is the most commonly used wind turbine in 5MW-scale wind farm and wind power research. In order to conduct wind-related research more smoothly, all required information on the turbine is available online; therefore, a great deal of research data has been accumulated on this turbine. Because this study analyzed the stability of the platform in extreme sea conditions, the turbine was set in the parking condition. ANSYS AQWA was used for verification with Orcawave; in both the AQWA and Orcaflex simulations the turbine was set as a rigid body. Following simulation verification, the turbine was further analyzed by activating the degree of freedom. Hence, the turbine was affected by external forces based on the turbine’s inertia armor and structural characteristics, very similar to a real one. The turbine was tilted five degrees upward and was positioned 89.6525 m away from the top of the platform. For the turbine parameters, the turbine information provided by NREL was used [17].

5.2. Mooring System

It is common to use mooring lines according to the number of columns. However, if the number of mooring lines increases as the number of columns increases the variation of important factors that determine the stability of the platform, such as pitching, heave, and surge will be affected as well. Therefore, in this study the same number of mooring lines was used as in the reference model, as the purpose of the study was to analyze the effect of the number of columns on platform stability while using the same amount of material for the platform design. The fairlead was located 14 m below sea level in the z-direction and 40.87 m away from the platform center in the x–y plane. These values were set as a standard to attach the mooring lines to the columns of the reference platform model. As the newly-designed platforms in this study were slightly smaller in the x–y plane compared to the reference model, the position of the fairleads was spaced apart from the column by a slight distance. As there are points where the Fairlead cannot be attached to the columns directly, they were located between the columns depending on the number of columns, with three mooring lines installed at 120-degree intervals. This study does not deeply address these matters. The same information provided by the NREL was used for the mooring characteristics used in this analysis [15].

5.3. New Designed Platform

The platform was designed based on OC4 semi-submersible platform shape information. In order to apply the same size and material usage as the reference shape OC4 platform, the design was considered such that the distance from the shape center to the column center of the newly designed platform was 28.87 m, and the material amount was not made to exceed 5% at 3,821,142 kg in order to apply the same material amount as the reference shape.
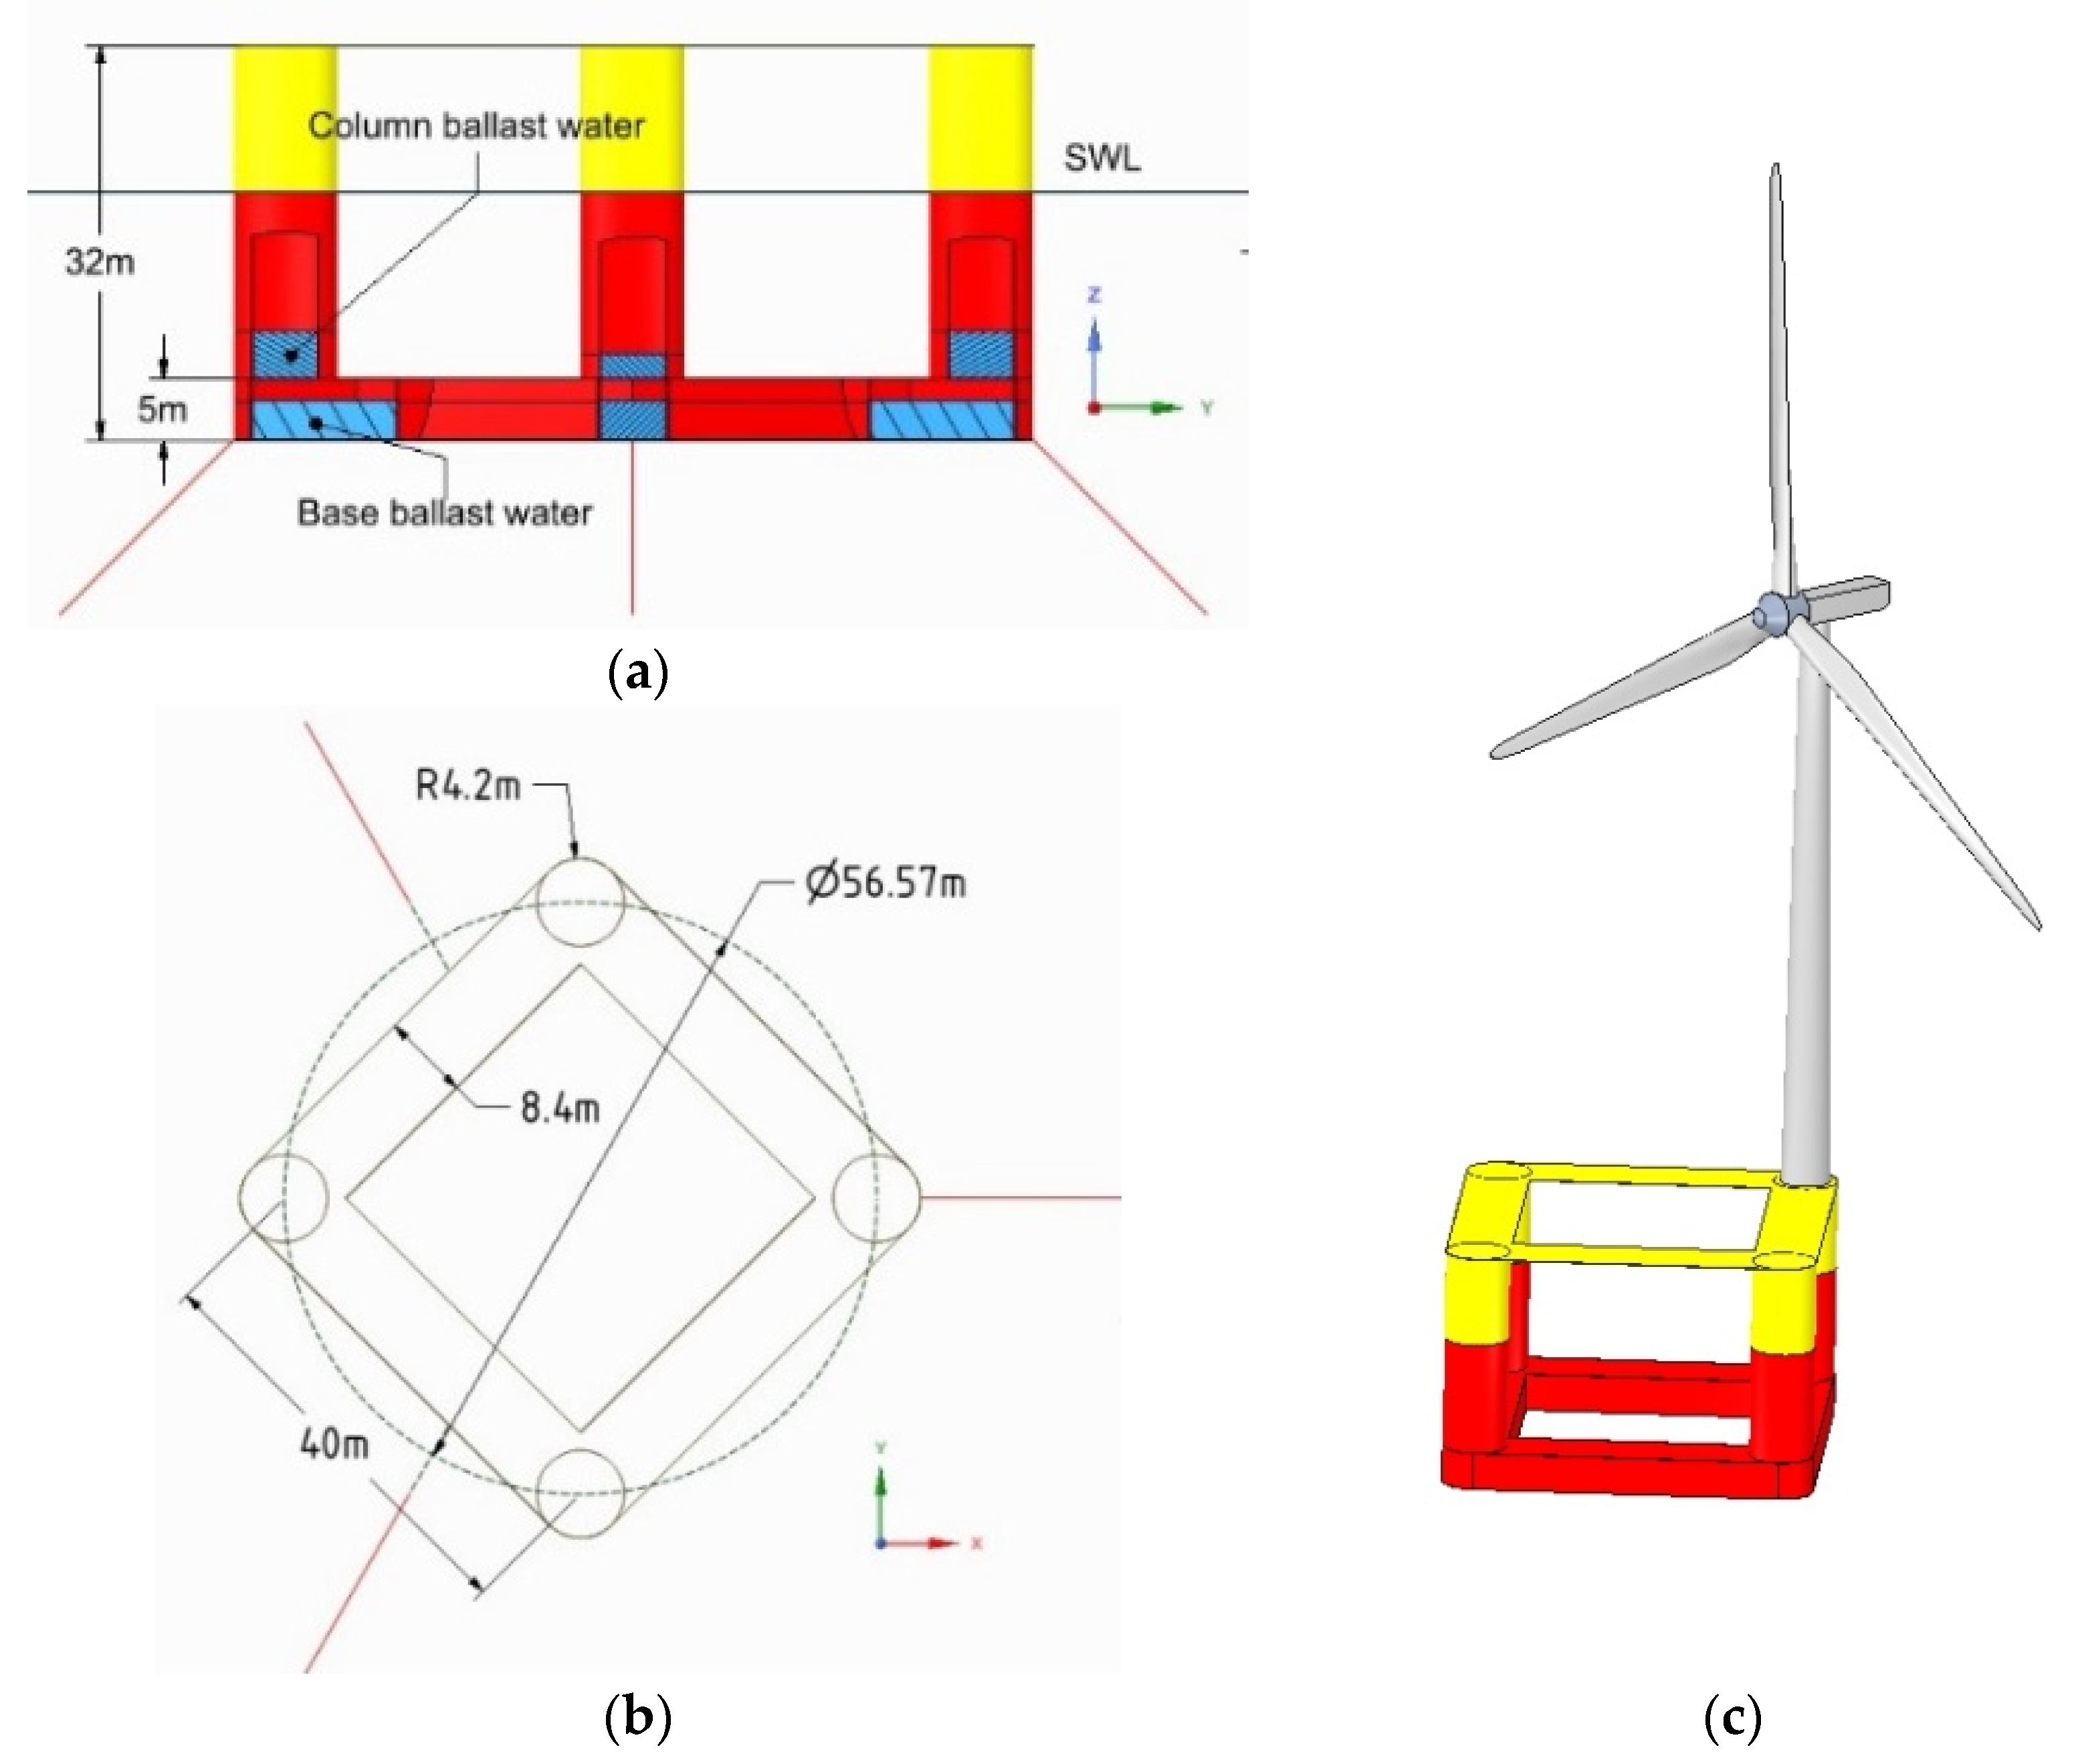
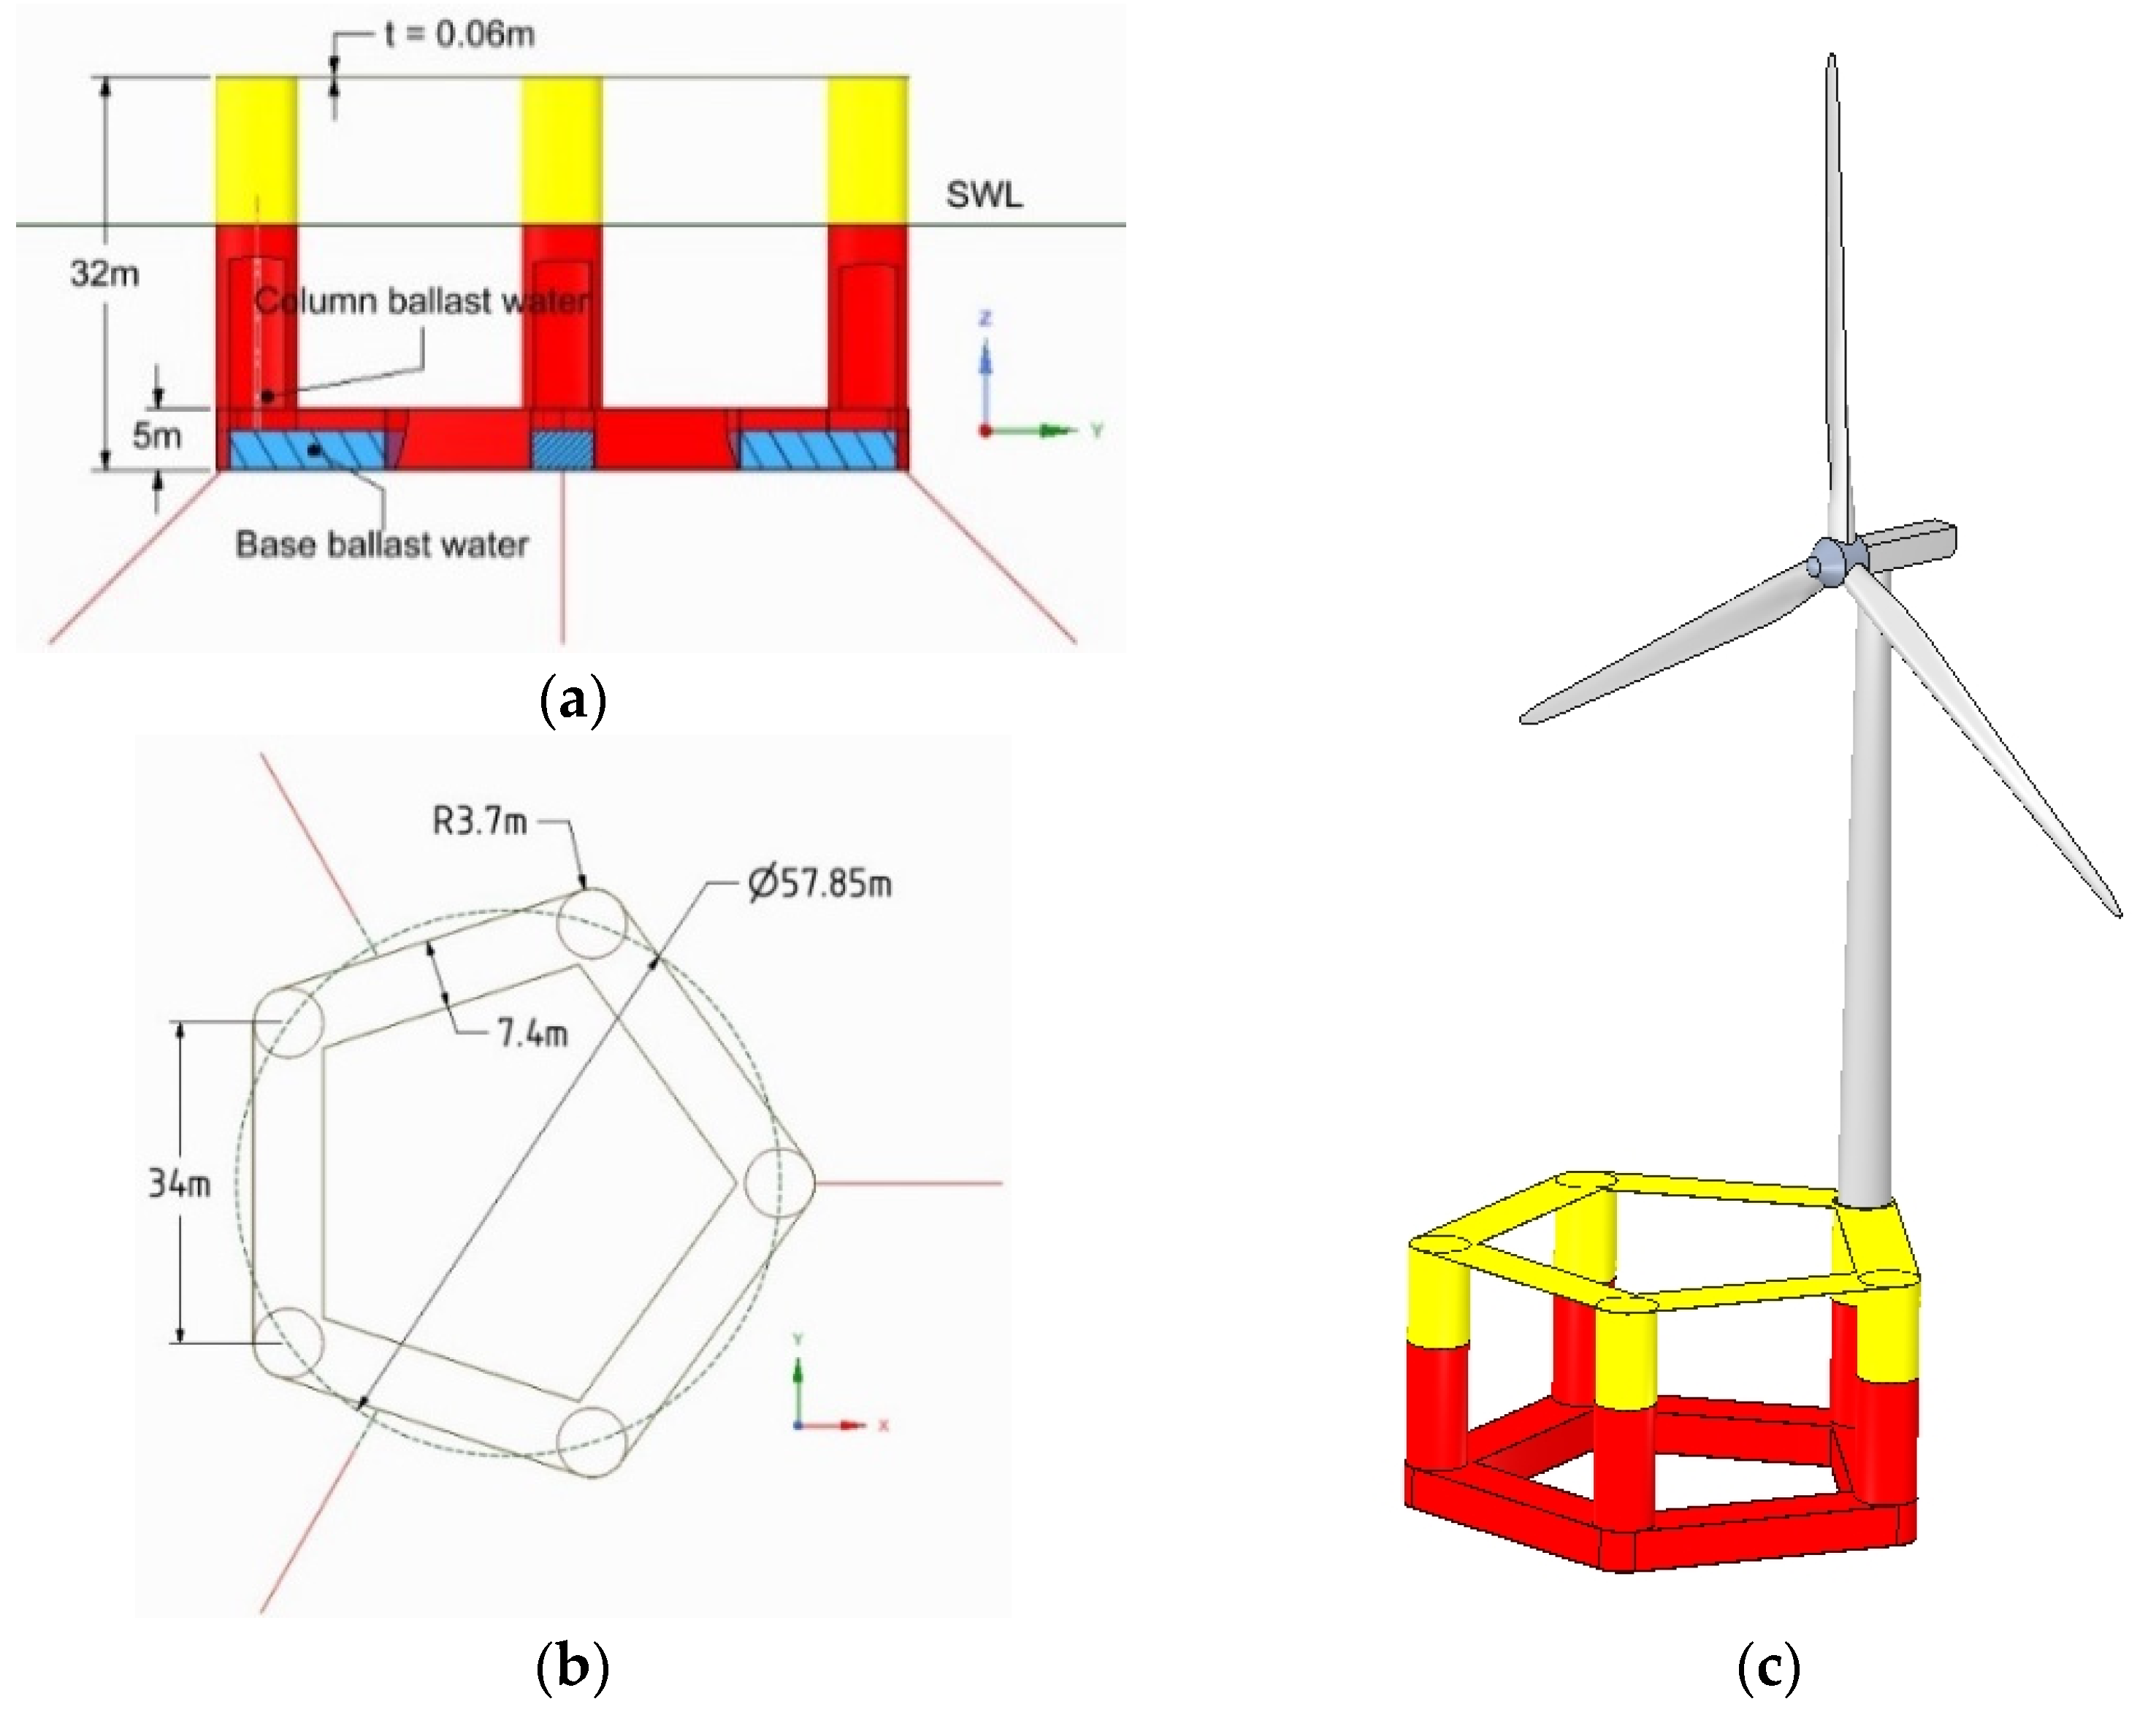
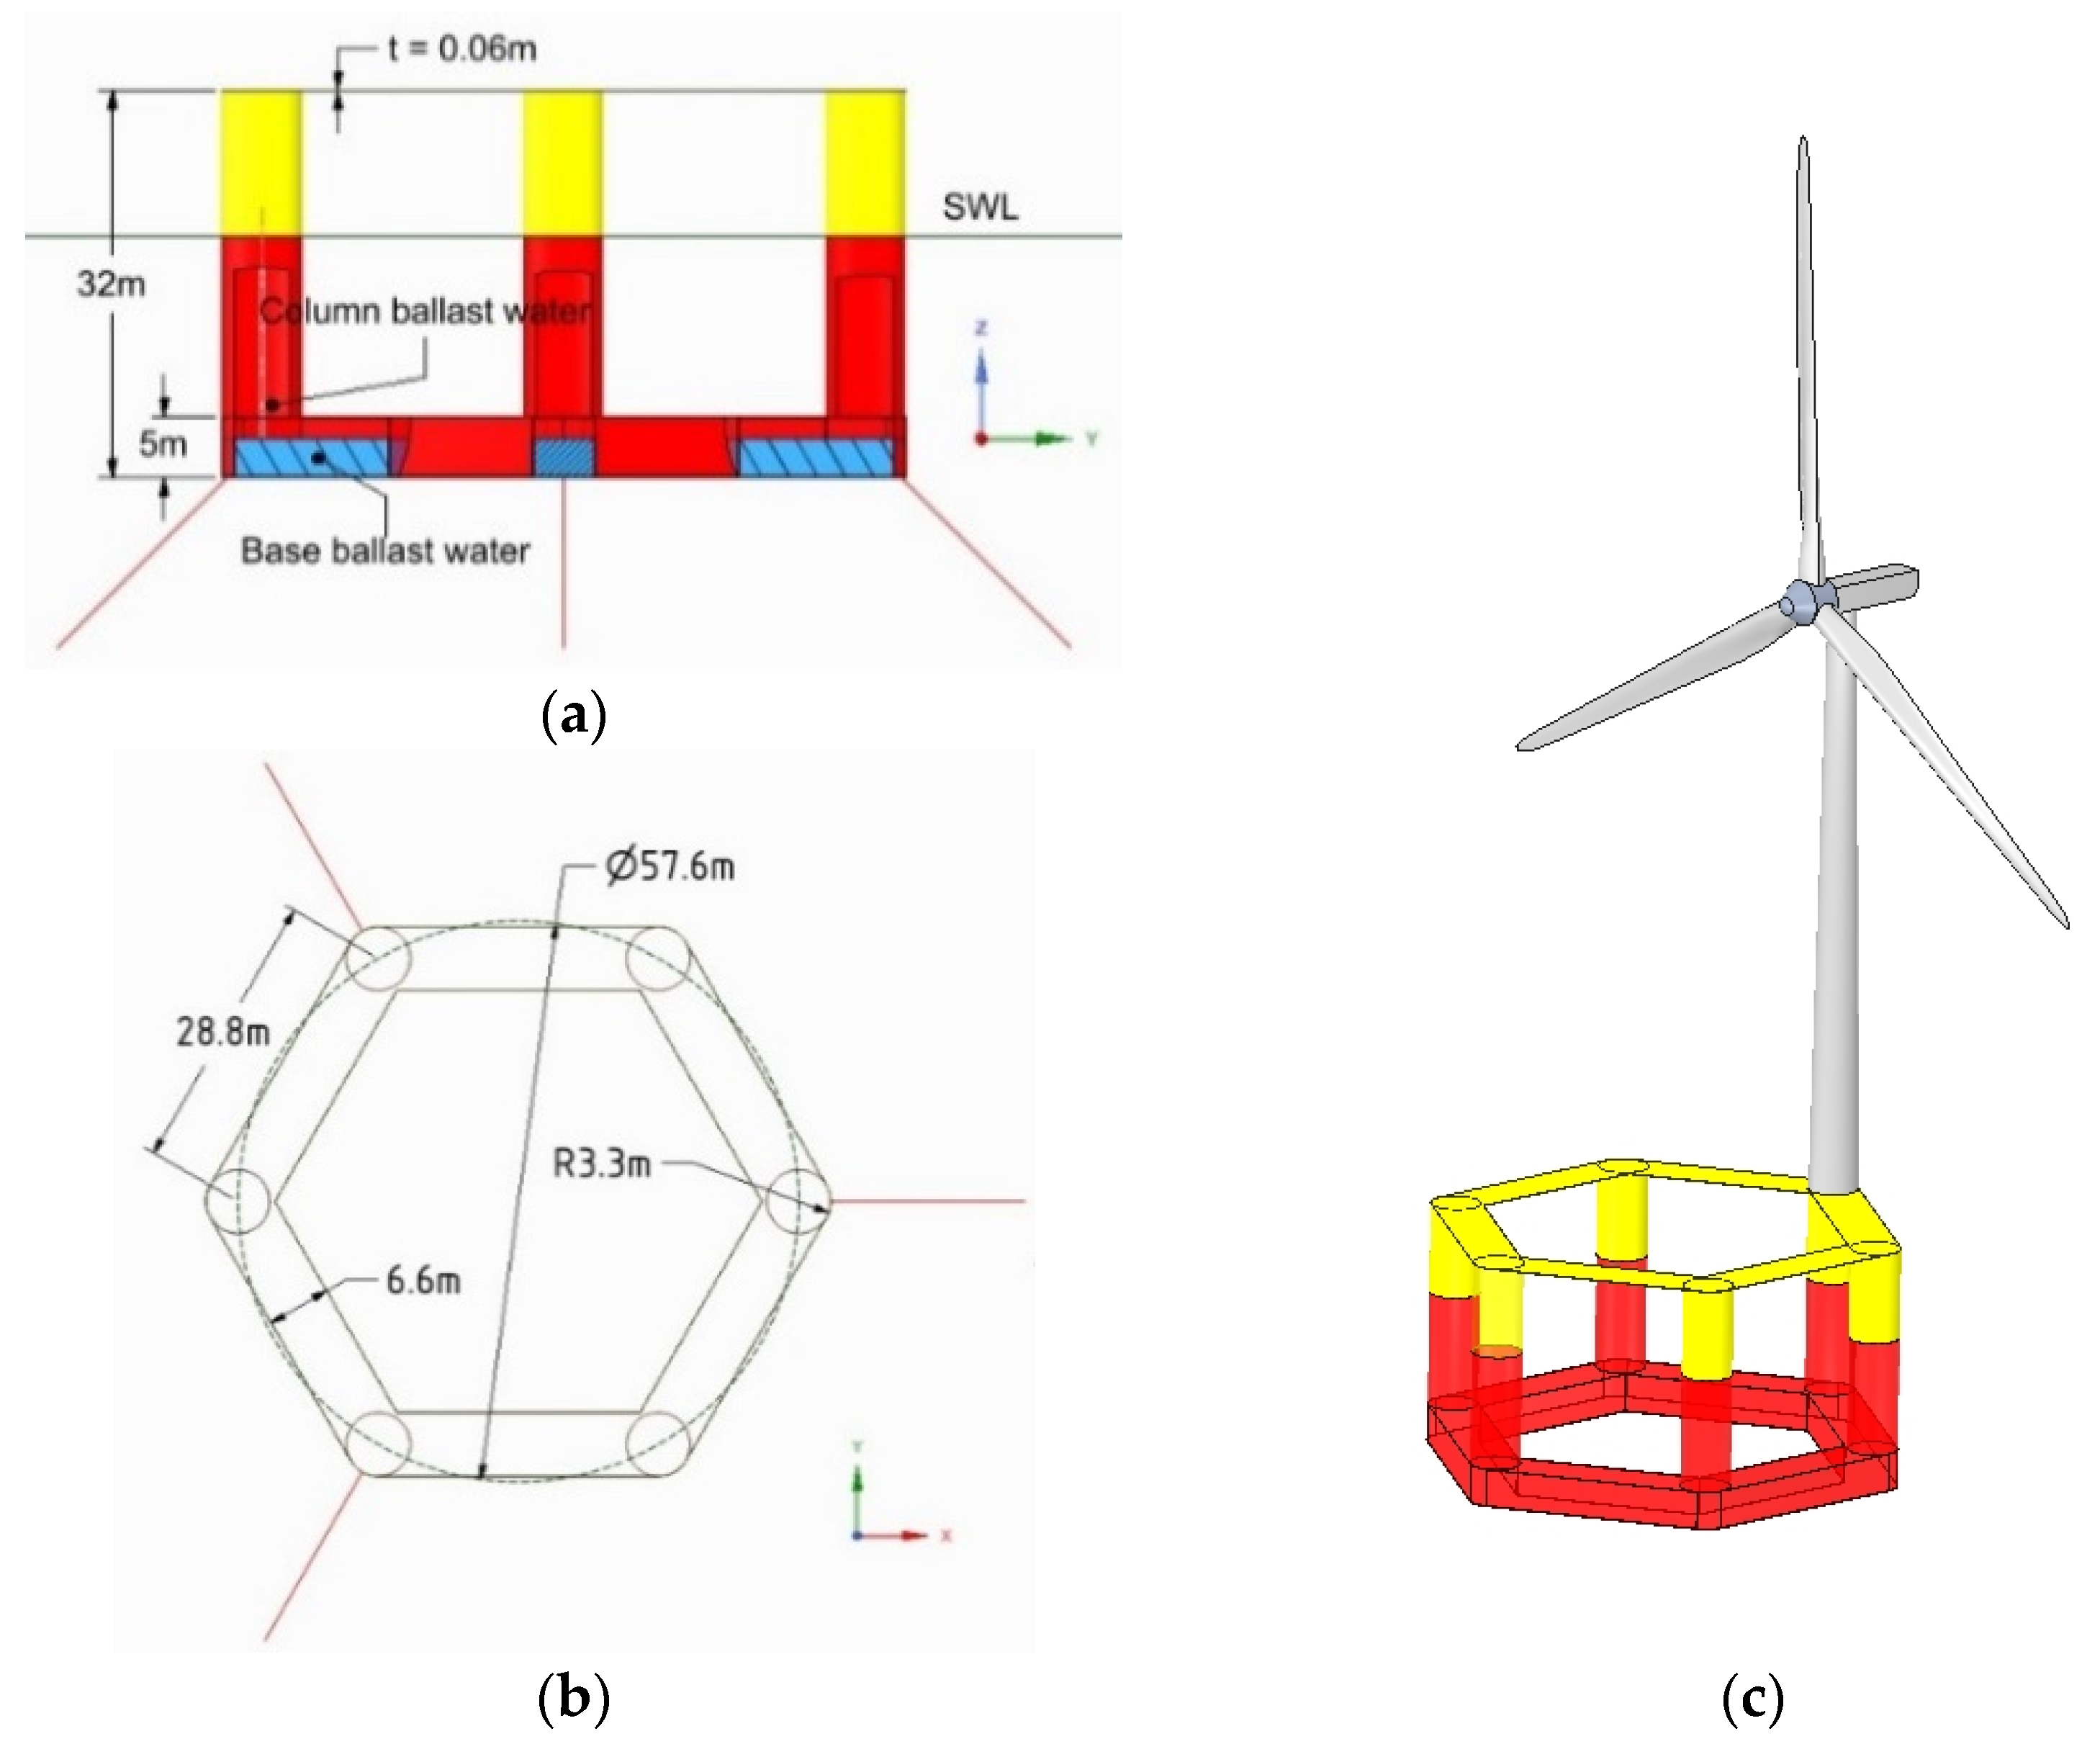
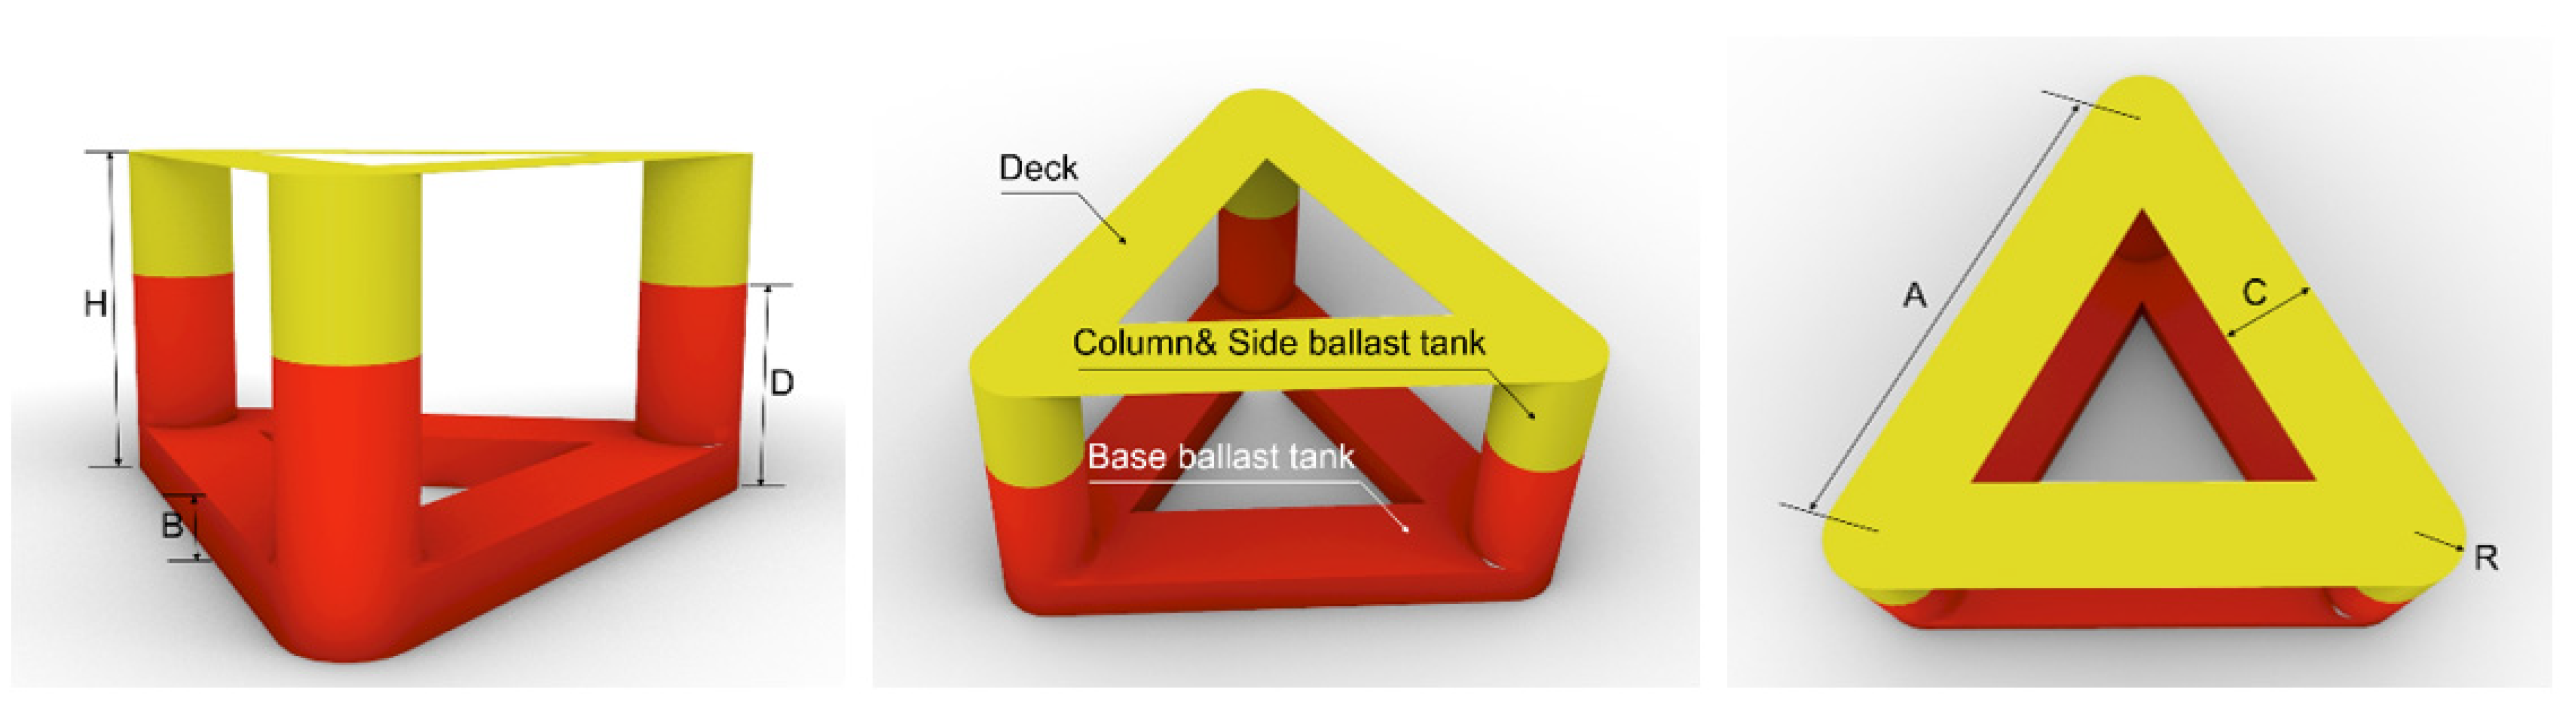
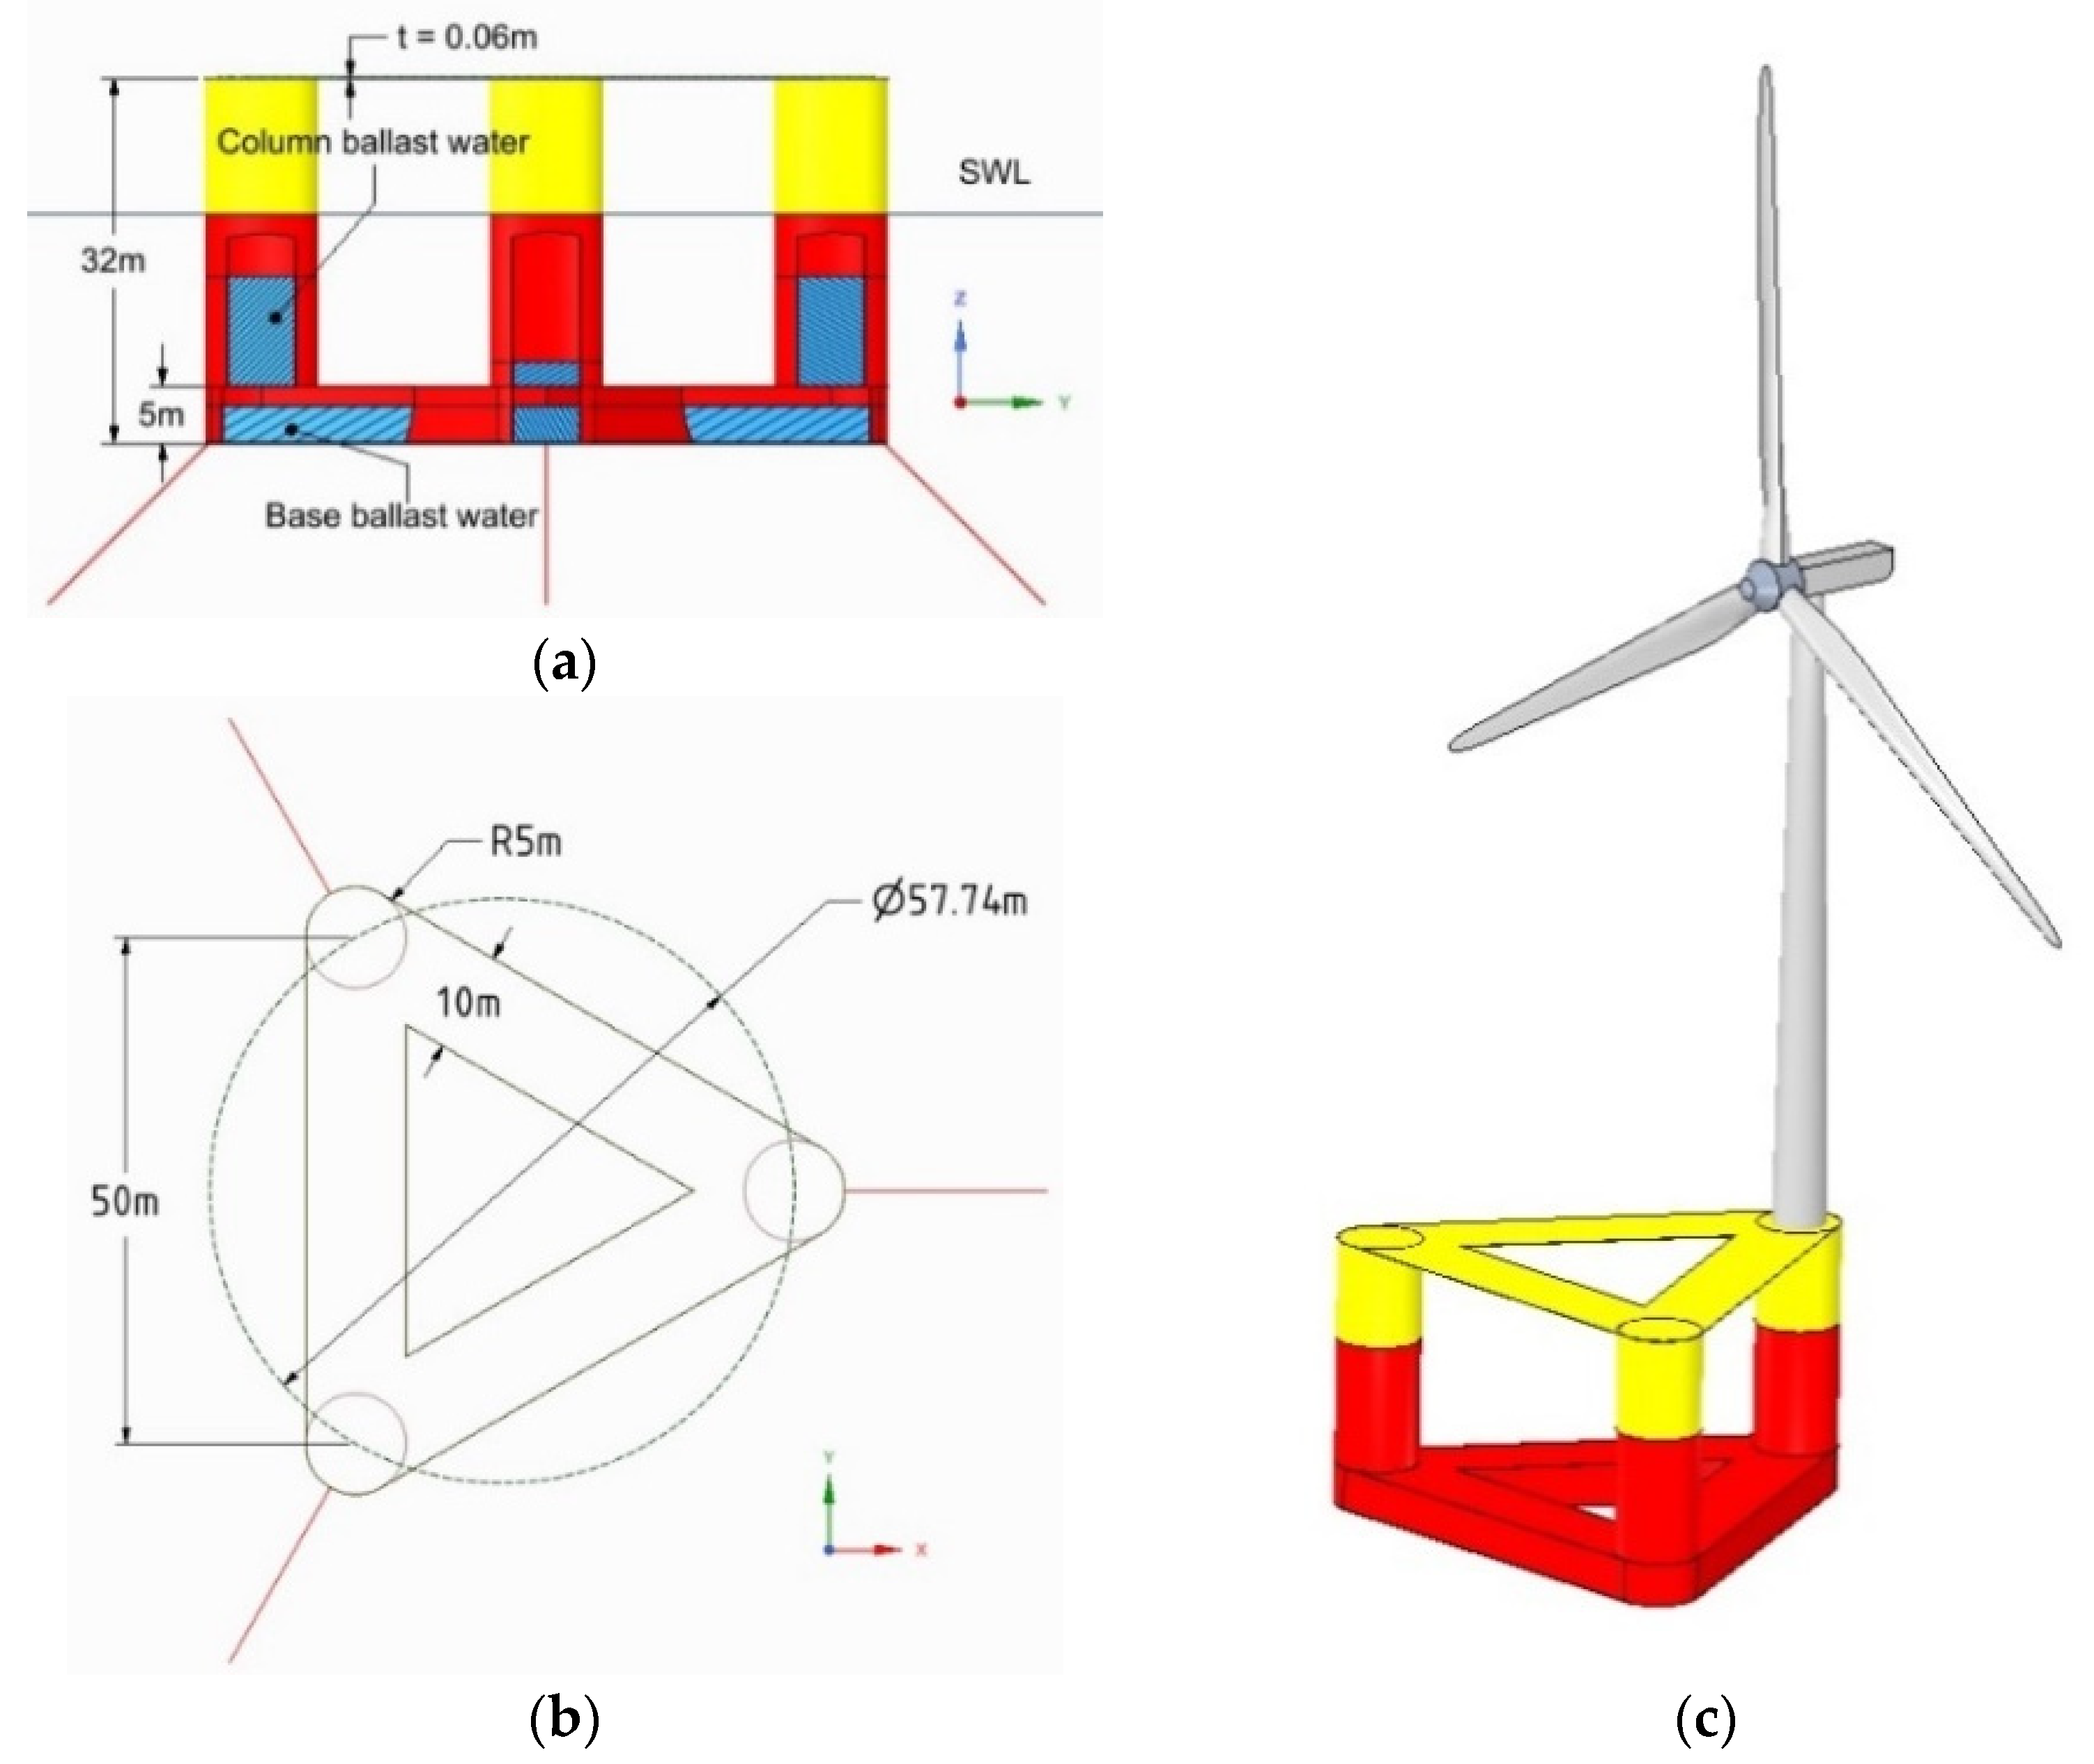
The existing OC4 semi-submersible platform was designed by adding a small column in the platform center to install towers and RNA, and each column was connected using pontoons. The newly designed platform in this study removed the center column that existed on the reference platform. The reason for this was to simplify the design and compensate for a problem which makes it difficult to install towers and turbines at the center of the platform when the distance from the center to the edge of the platform increases. Structural safety was secured by connecting the lower part of the column to a ballast tank and the upper part to a deck. Ballast water containers can be seen at the lower part of the platform and the column; the base ballast water tank and column ballast water tanks are separated by caps. The use of ballast water to separate the columns was designed to fill the ballast water such that the center of gravity of the platform could be tailored to the design. The thickness of the outer wall constituting the platform was set to 0.06 m, the same as in the reference model, and the upper deck thickness was set at the same value.
Figure 8 shows a platform with three columns as an example along with the names of the parts of the platform and the parameters considered in the design. The base ballast tank was set to 5 m in consideration of the amount of material used in platform manufacturing while allowing enough ballast water to be filled. The width of the deck was designed similar to that of the diameter of the column such that the width of the deck was changed as the diameter of the column changed. As the purpose of this study was to compare and analyze the stability according to the number of columns with the amount of materials the same, the column radius was selected as a factor that inevitably had to be changed in order to maintain the same amount of materials used. Drift was set to 20 m, the same as the standard without the number of columns, and the height of the platform was set to 32 m; the location of the fairlead was set to 6m from the bottom of the platform, the same as the standard. Shape information for each platform is shown in Table 4.
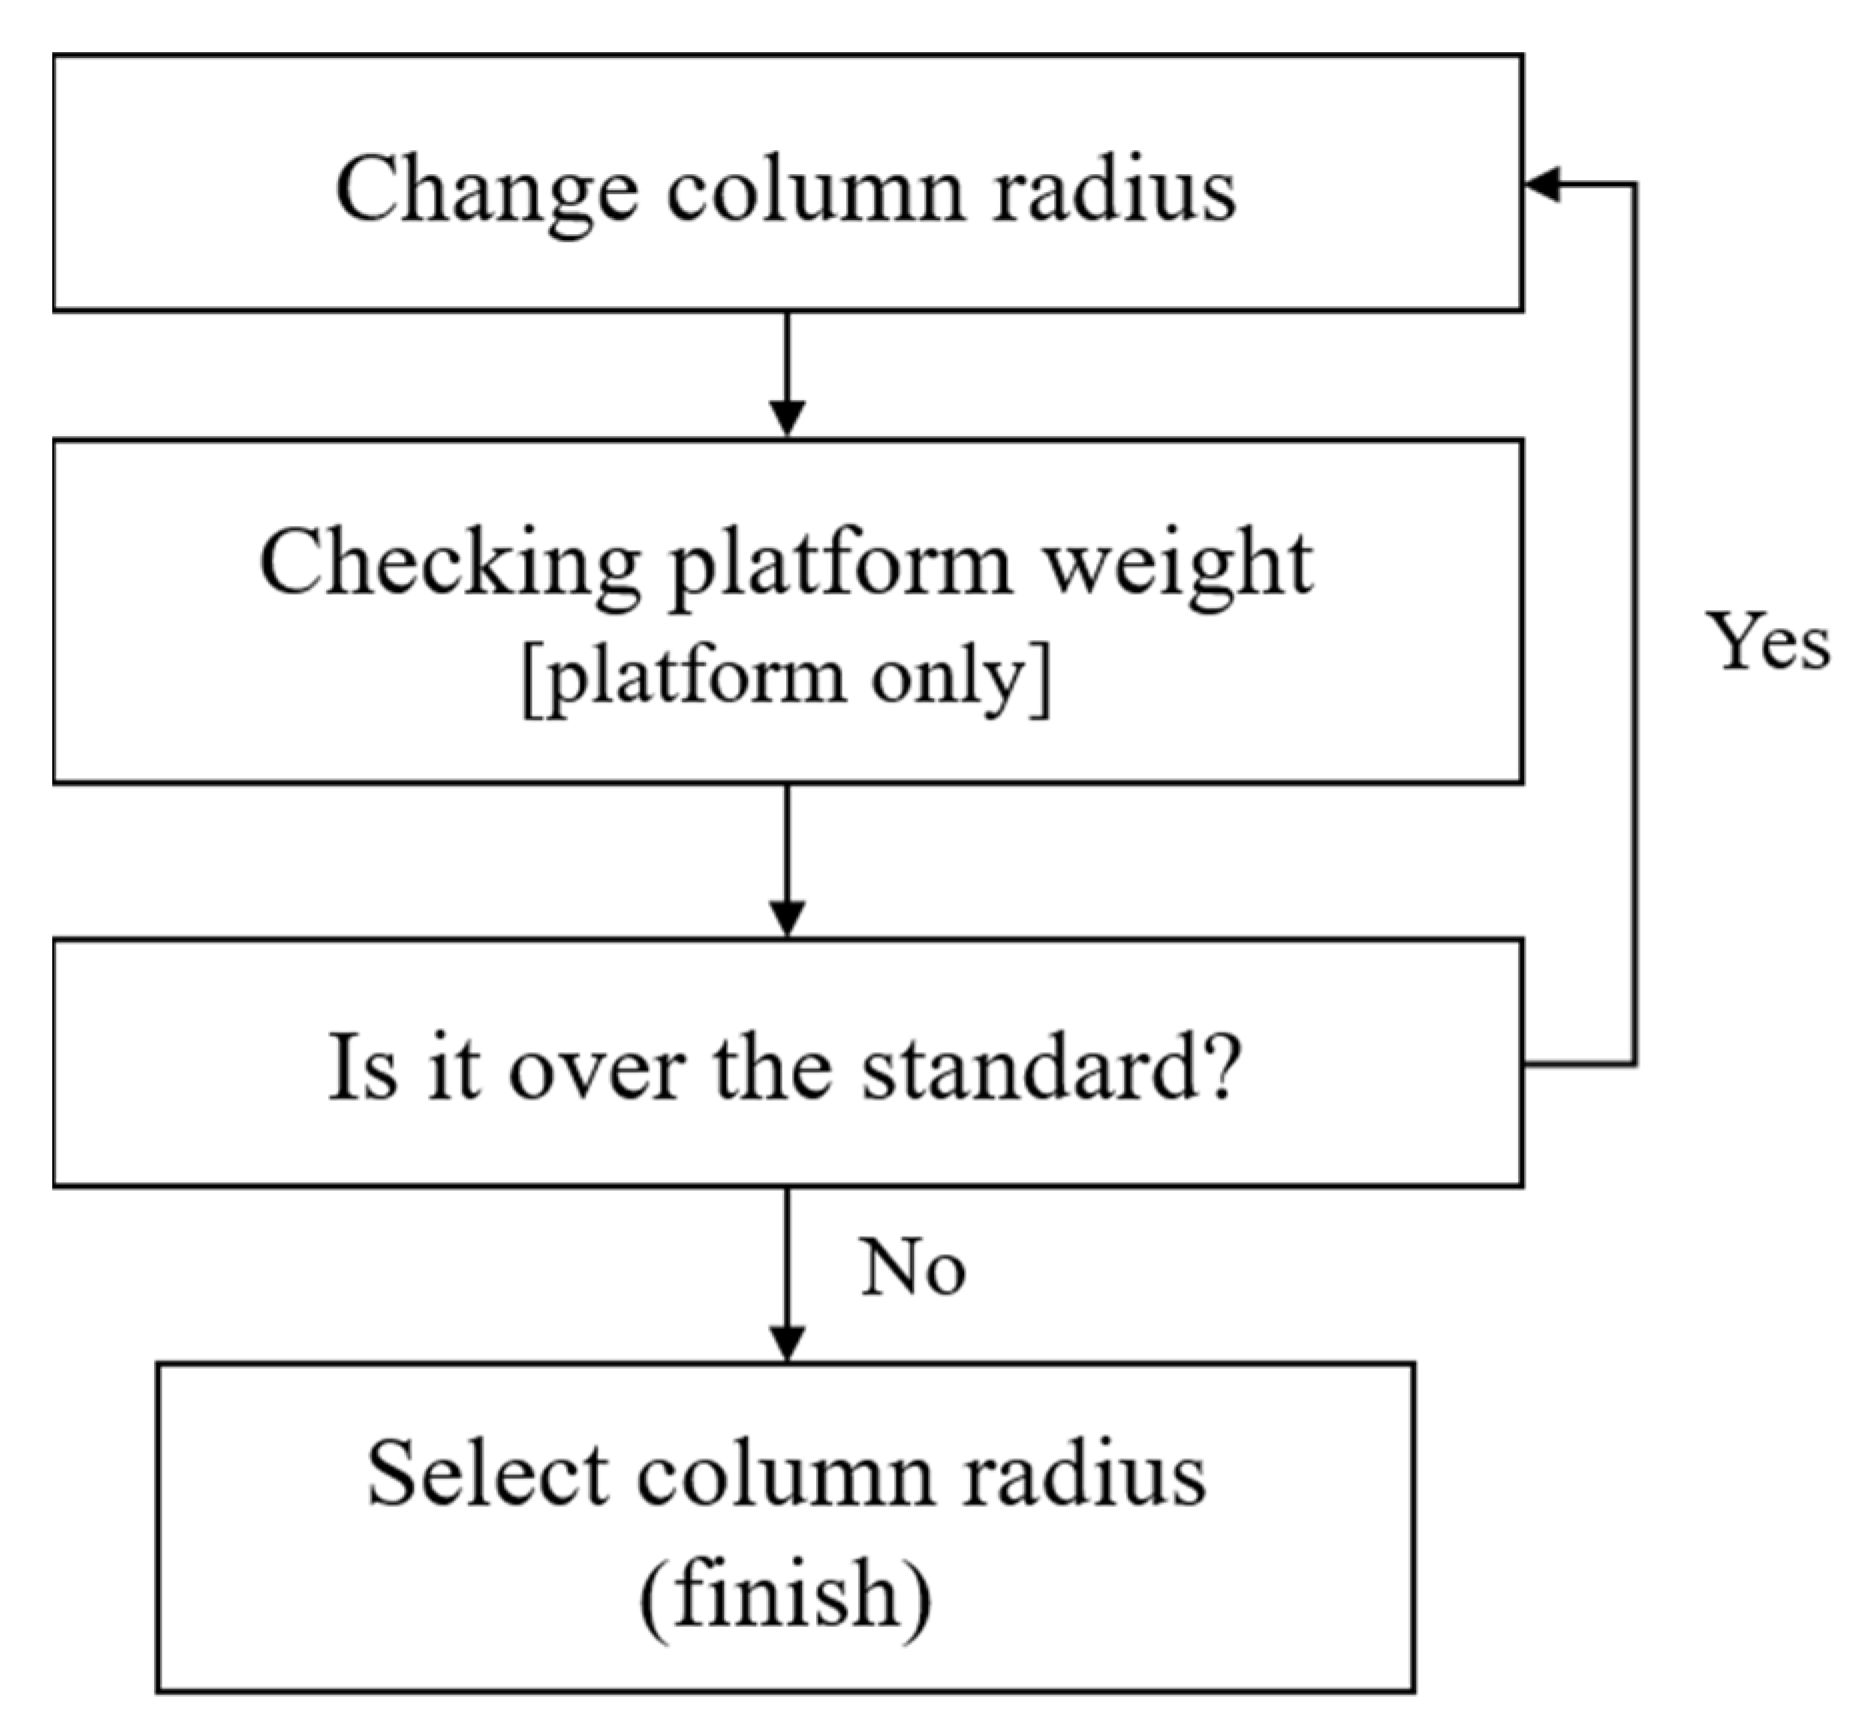
The column radius was selected based on the reference range of the amount of material compared with the reference platform design. The platform design presented in this paper was determined by selecting the radius of the column according to the procedure shown in Figure 9.
However, when the column radius changes, the width of the base ballast tank and the width of the deck wall change as well. Therefore, it is not simple to design the shape considering the center of gravity and the amount of material. After changing the column radius, simple processes such as modeling the platform and checking whether the modeled platform falls within the reference weight range can take a considerable amount of time. Therefore, when designing a platform with a fixed cost and material amount, we divided the platform into several parts to allow the mass of the platform to be easily calculated. In this paper, the platform was divided into four parts and the mass of each part was calculated as shown in Equations (9)–(13). Referring to Equations (14)–(16), the column radius was defined as not less than the tower radius = 3.25 m. The platform mass was equal to the OC4 platform mass or less than 1.05 times the OC4 platform mass. Each platform designed using the equations is shown in Figure 10, Figure 11, Figure 12 and Figure 13.
P a r t   1 = A ( B 2 t ) t N c + π ( R 2 r 2 ) ( B 2 t )
P a r t   2 = π ( R 2 r 2 ) ( H B t ) N c
P a r t   3 = [ { A 2 R t a n ( 45 + α f ) } t + t 2 tan ( 45 + a f ) ] ( B 2 t ) N C
P a r t   4 = 3 t [ 2 R { A 2 R t a n ( 45 + a f ) } N c + π R 2 + 3 R 2 tan ( 45 + a f ) N c ]
w P = ( P a r t 1 + p a r t 2 + p a r t 3 + p a r t 4 ) ρ P
R > 3.25
w s w P 1.05 w s
w s = 3 , 852 , 143   k g
N C   used in Equations (9)–(13) applies the following constant values show in Table 5 according to the type of platform.
The density of the material used for the platform was 7850 kg/m3. The characteristics and the center of momentum derived using the Equations (9)–(16) are shown in Table 6 for each platform. The center of mass shown in Table 6 is defined based on the water surface and the weight of the tower rotor, nacelle, mooring, and ballast water. The ballast water mass is calculated in order the platform can be horizontal to the sea level when all parts (tower, rotor nacelle assembly, and mooring) are bonded to the platform. Once the ballast water is determined as follows, the inertial moment value required to derive the hydrodynamic data of the platform can be obtained; these values are shown in Table 7, Table 8, Table 9 and Table 10. The moment of inertia provided in these tables considers the tower, RNA, mooring, and ballast water.

5.4. Diffraction Analysis

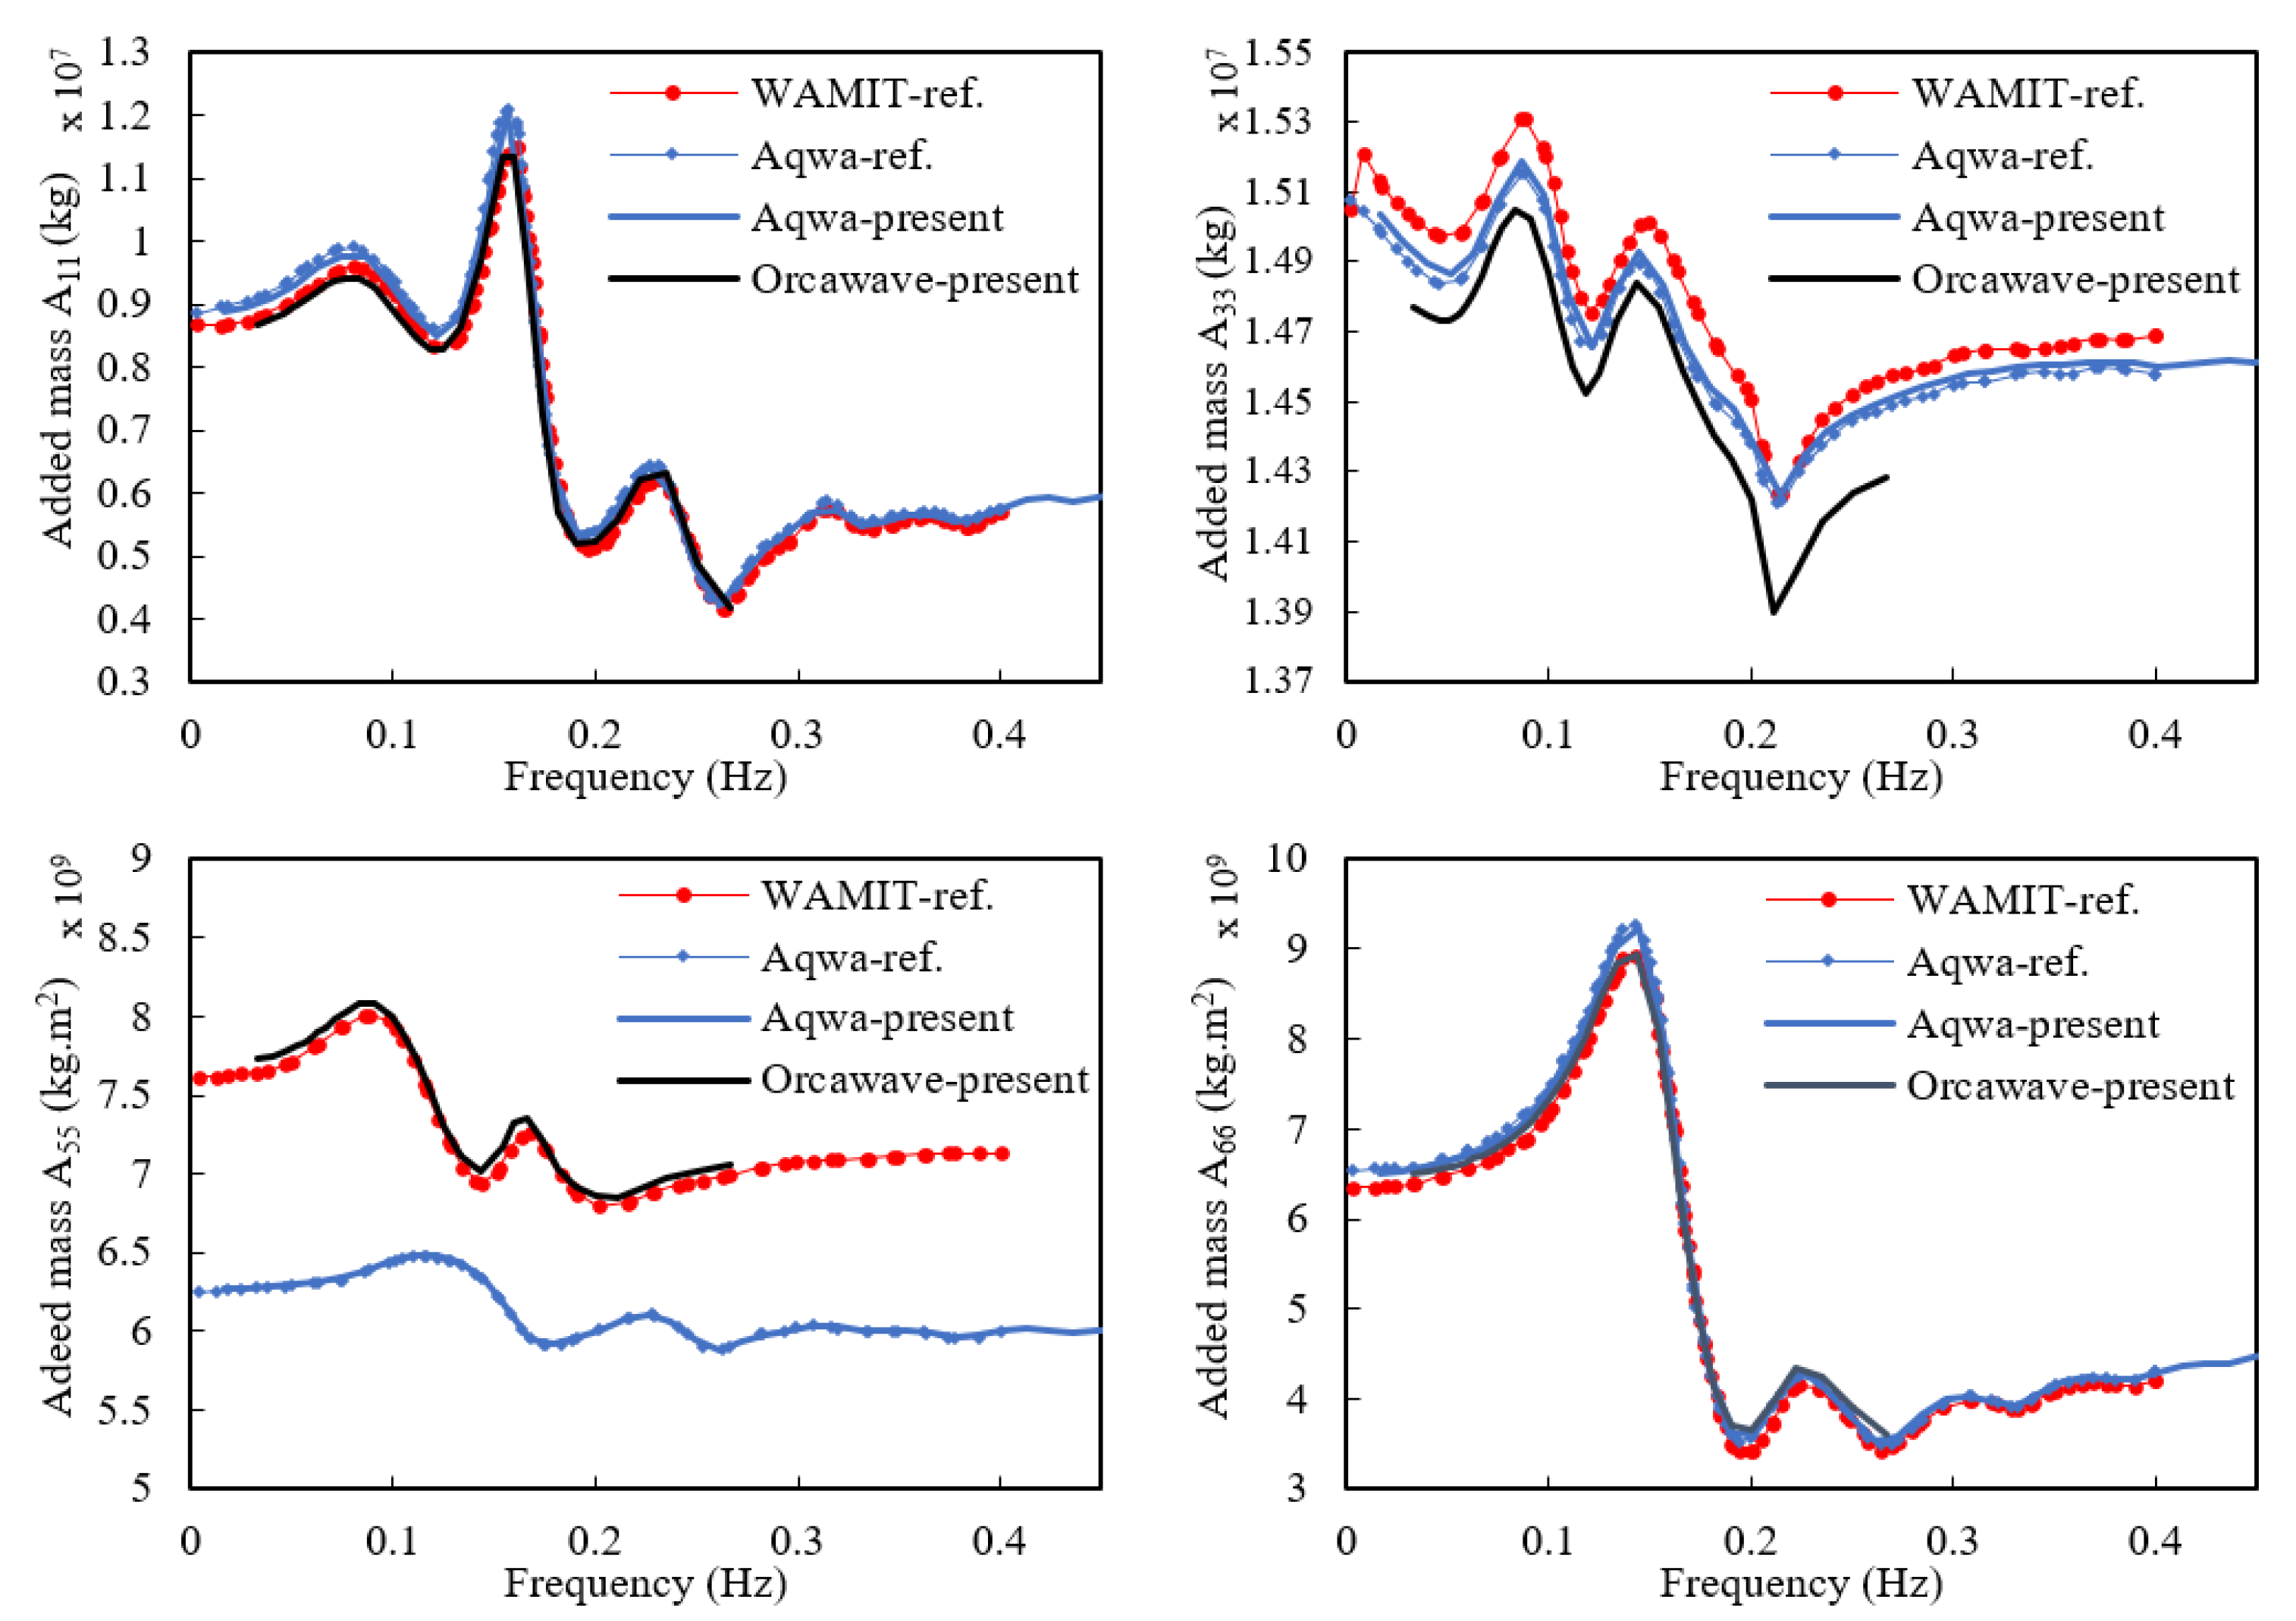
Hydrodynamic diffraction analyzes the platform characteristics for all directions and orientations, such as surge, sway, heave, roll, pitch, yaw, etc. Comparison of all calculated data by grid size is a more accurate method of selecting platform properties data. However, comparison of all data is an inefficient method; here, we mainly performed comparisons for roll and pitch, which are generally considered important in platform behavior. In this paper, only two graphs for each platform are shown, one for the added mass and the other for the damping characteristics, as these show the most remarkable differences in results depending on the grid size.
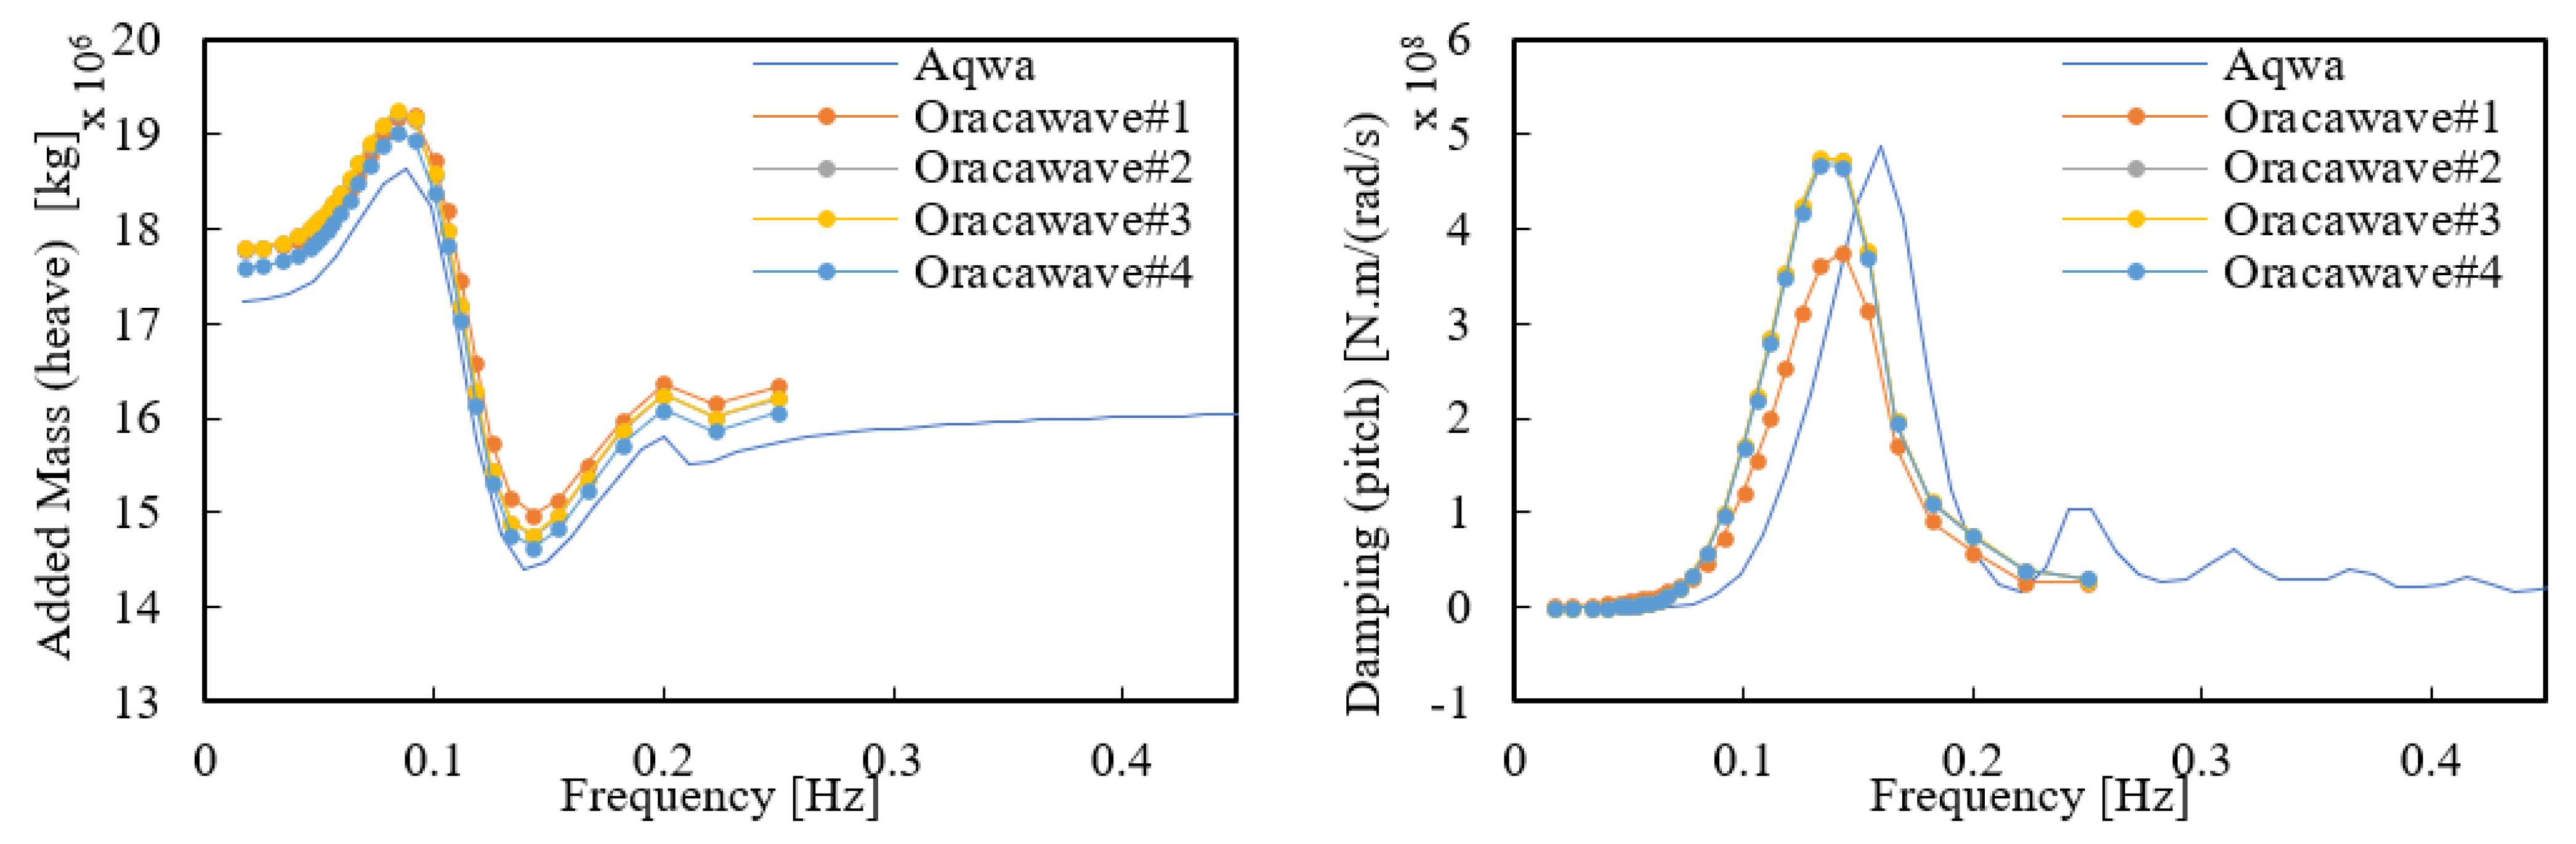
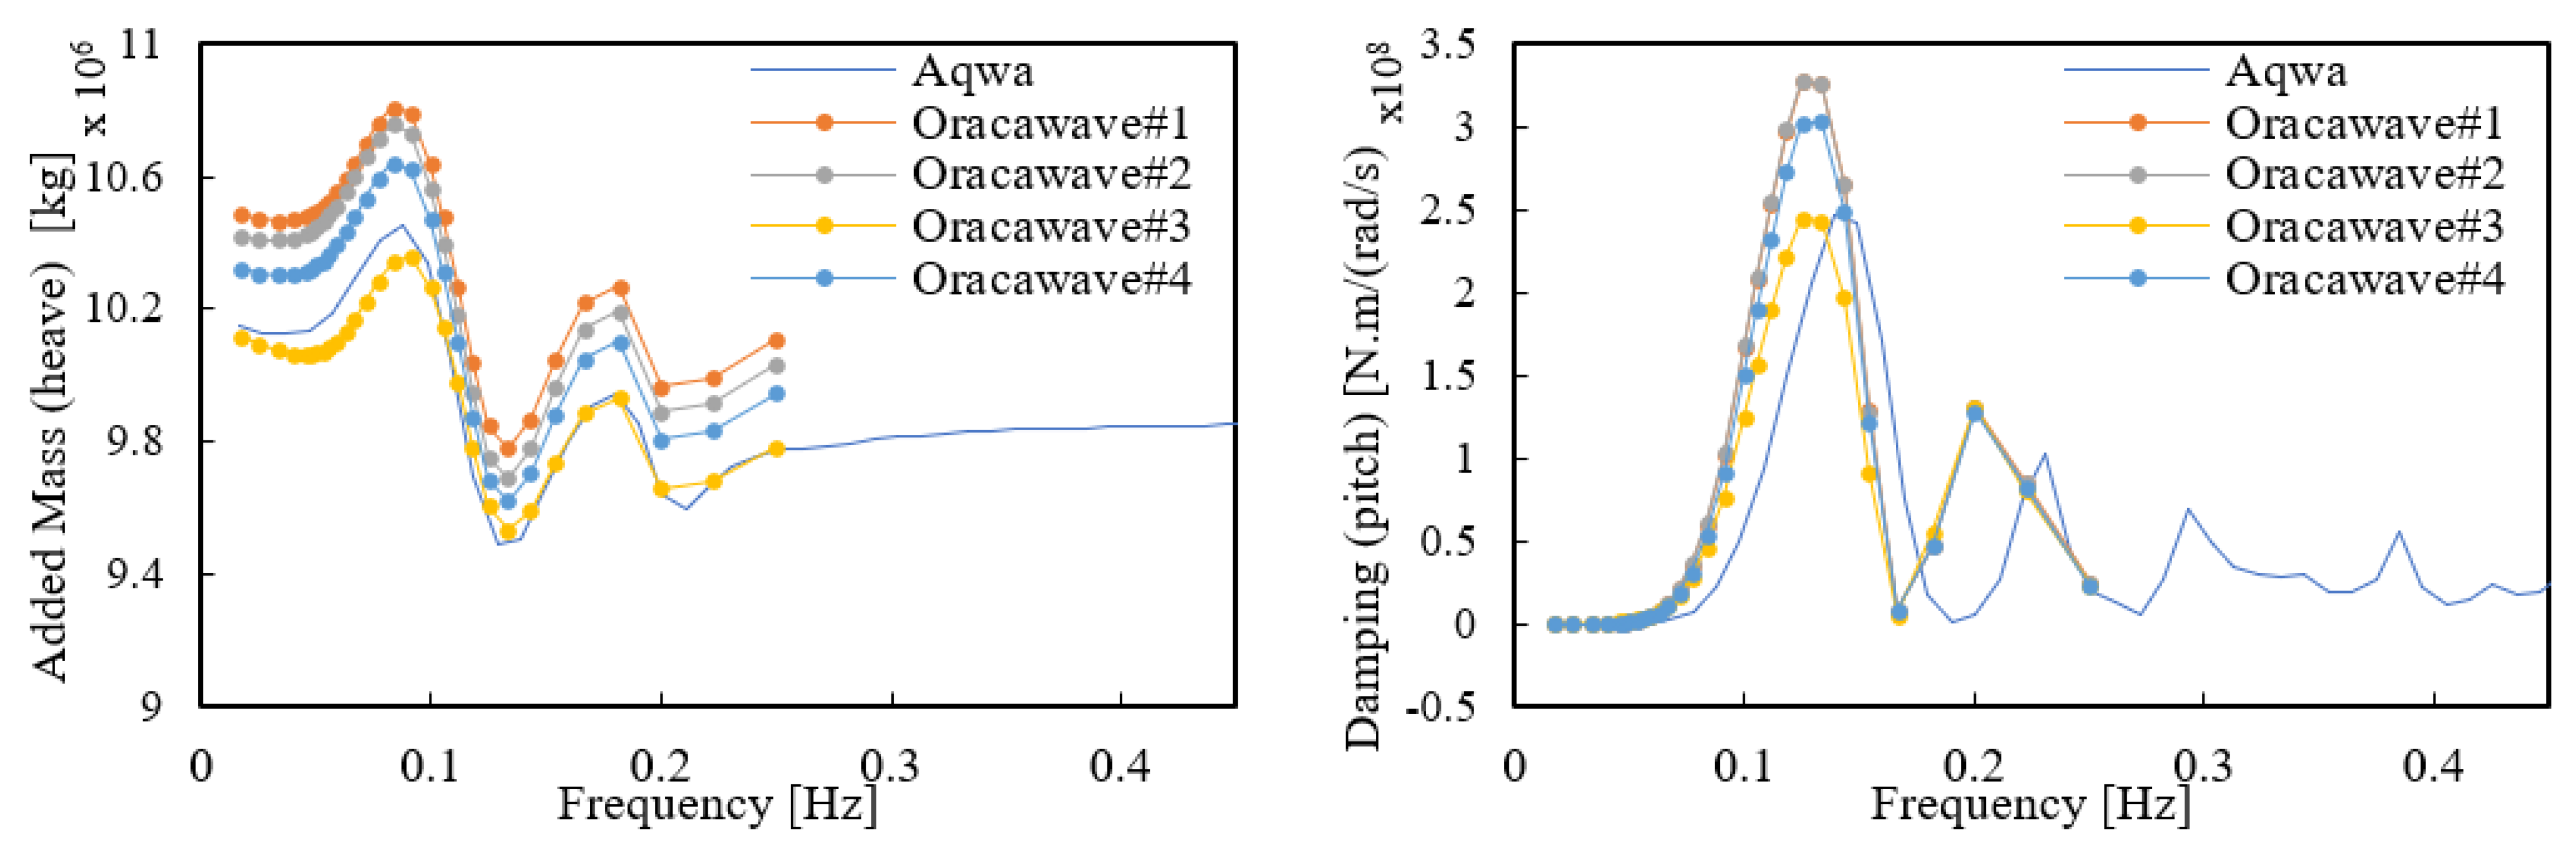
As for the grid size, the platform was constructed with a finer grid as the number went up from #1 to #4. In the case of AQWA, because there was negligible difference in the diffraction result values for each grid size, only one grid result was used in this paper. In the case of three columns as Figure 14, the added mass value for the peak was predicted to be low overall according to the wave cycle using the rough mesh size. However, the added mass values for different mesh sizes were confirmed to match, having almost no difference. The added mass derived through AQWA, which was lower than Orcawave, was generally confirmed. In the case of damping, the damping value for pitch was low in Orcawave analysis with rough mesh, while the other mesh size showed no difference in value. AQWA was derived with damping values entirely off-set to the right, while peak values had mostly similar values to Orcaflex.
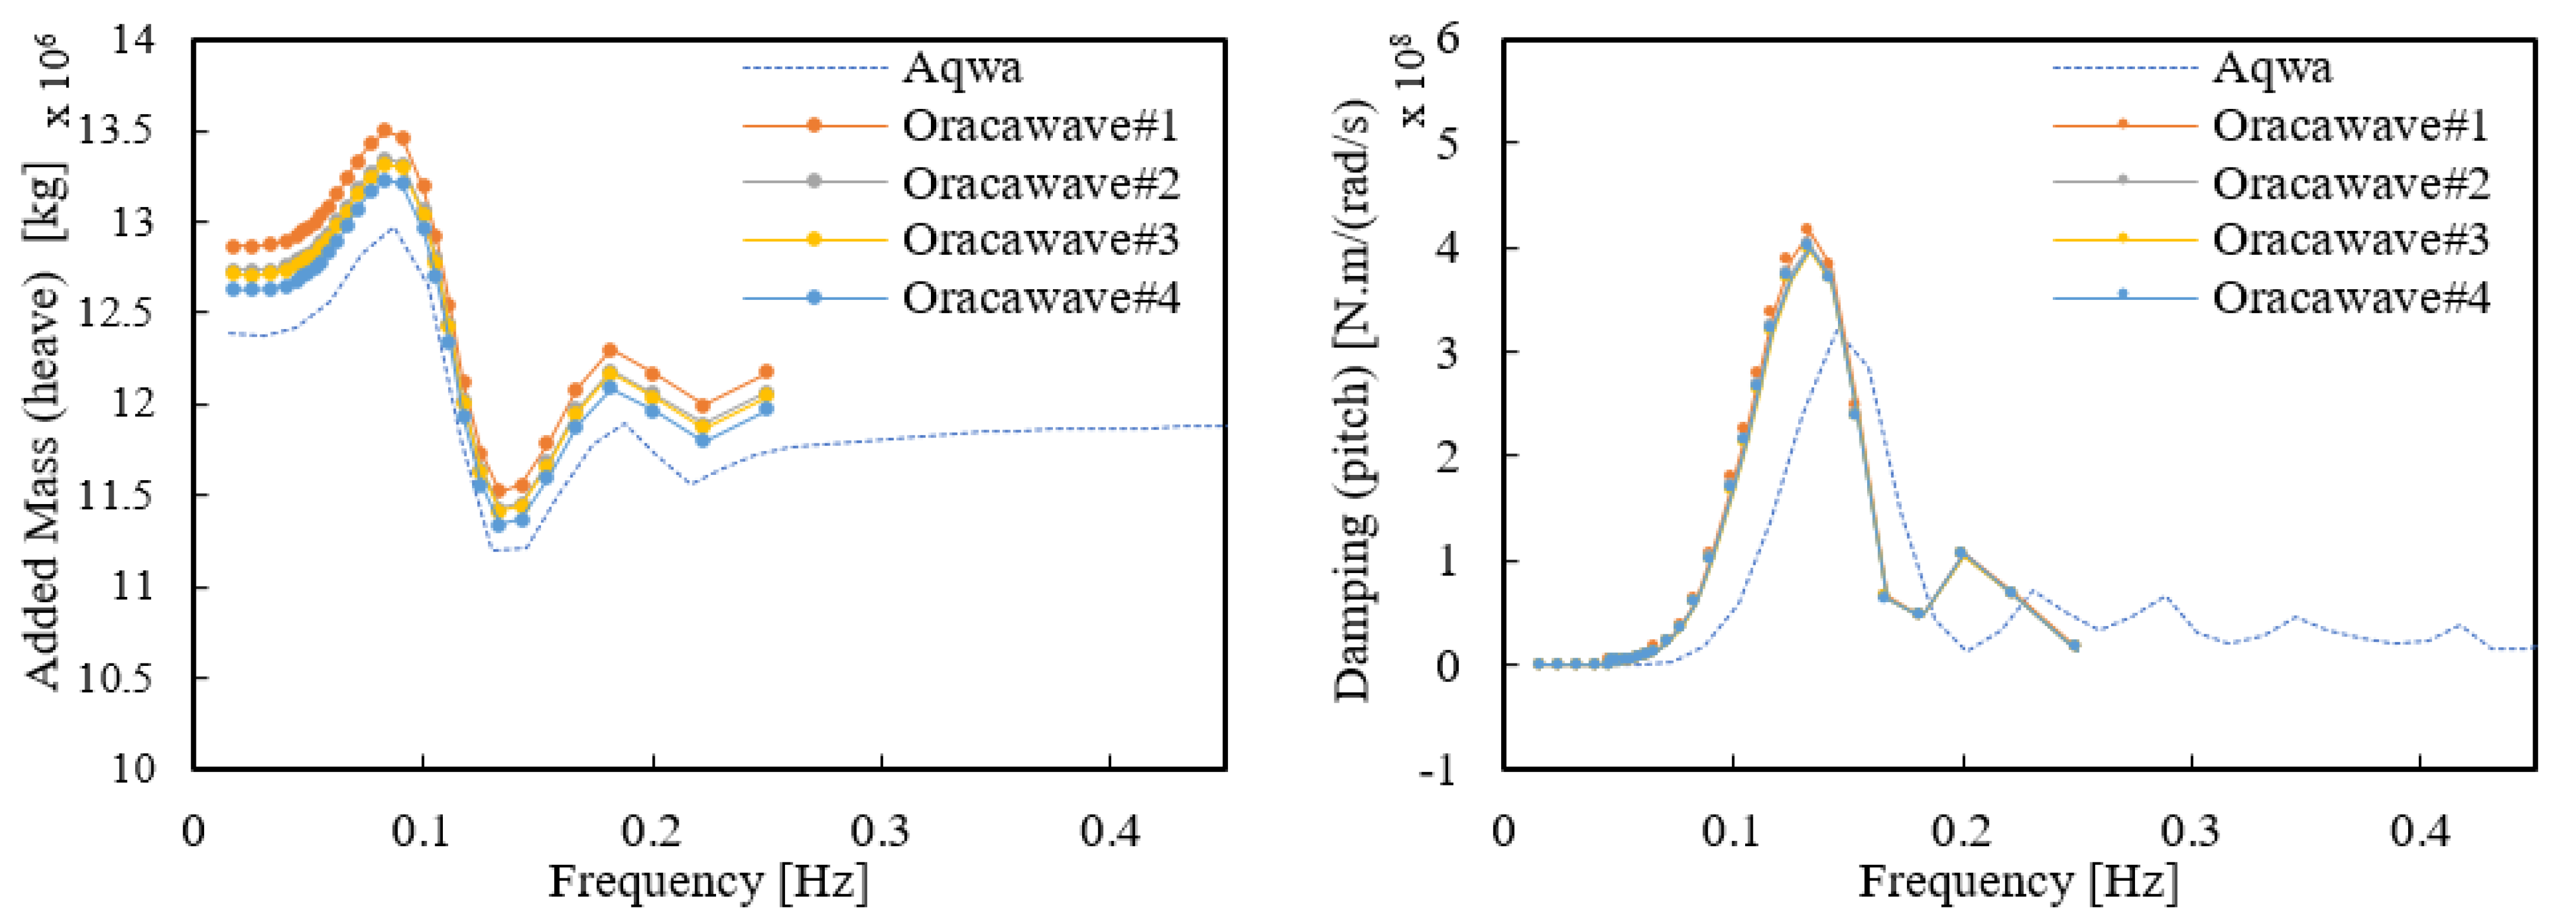
In the case with four columns as Figure 15, as the number of grids increased every diffraction characteristic decreased according to wave frequency in the diffraction analysis performed using Orcawave. The added mass value derived through AQWA was found to be slightly lower than the Orcawave result for the largest number of grids. In the case of damping, there was no significant difference with the Orcawave results value according to the mesh size; however, the AQWA results for the pitch damping value were found to have an offset similar to the case with three columns, and in the case of peak value it was lower than Orcawave.
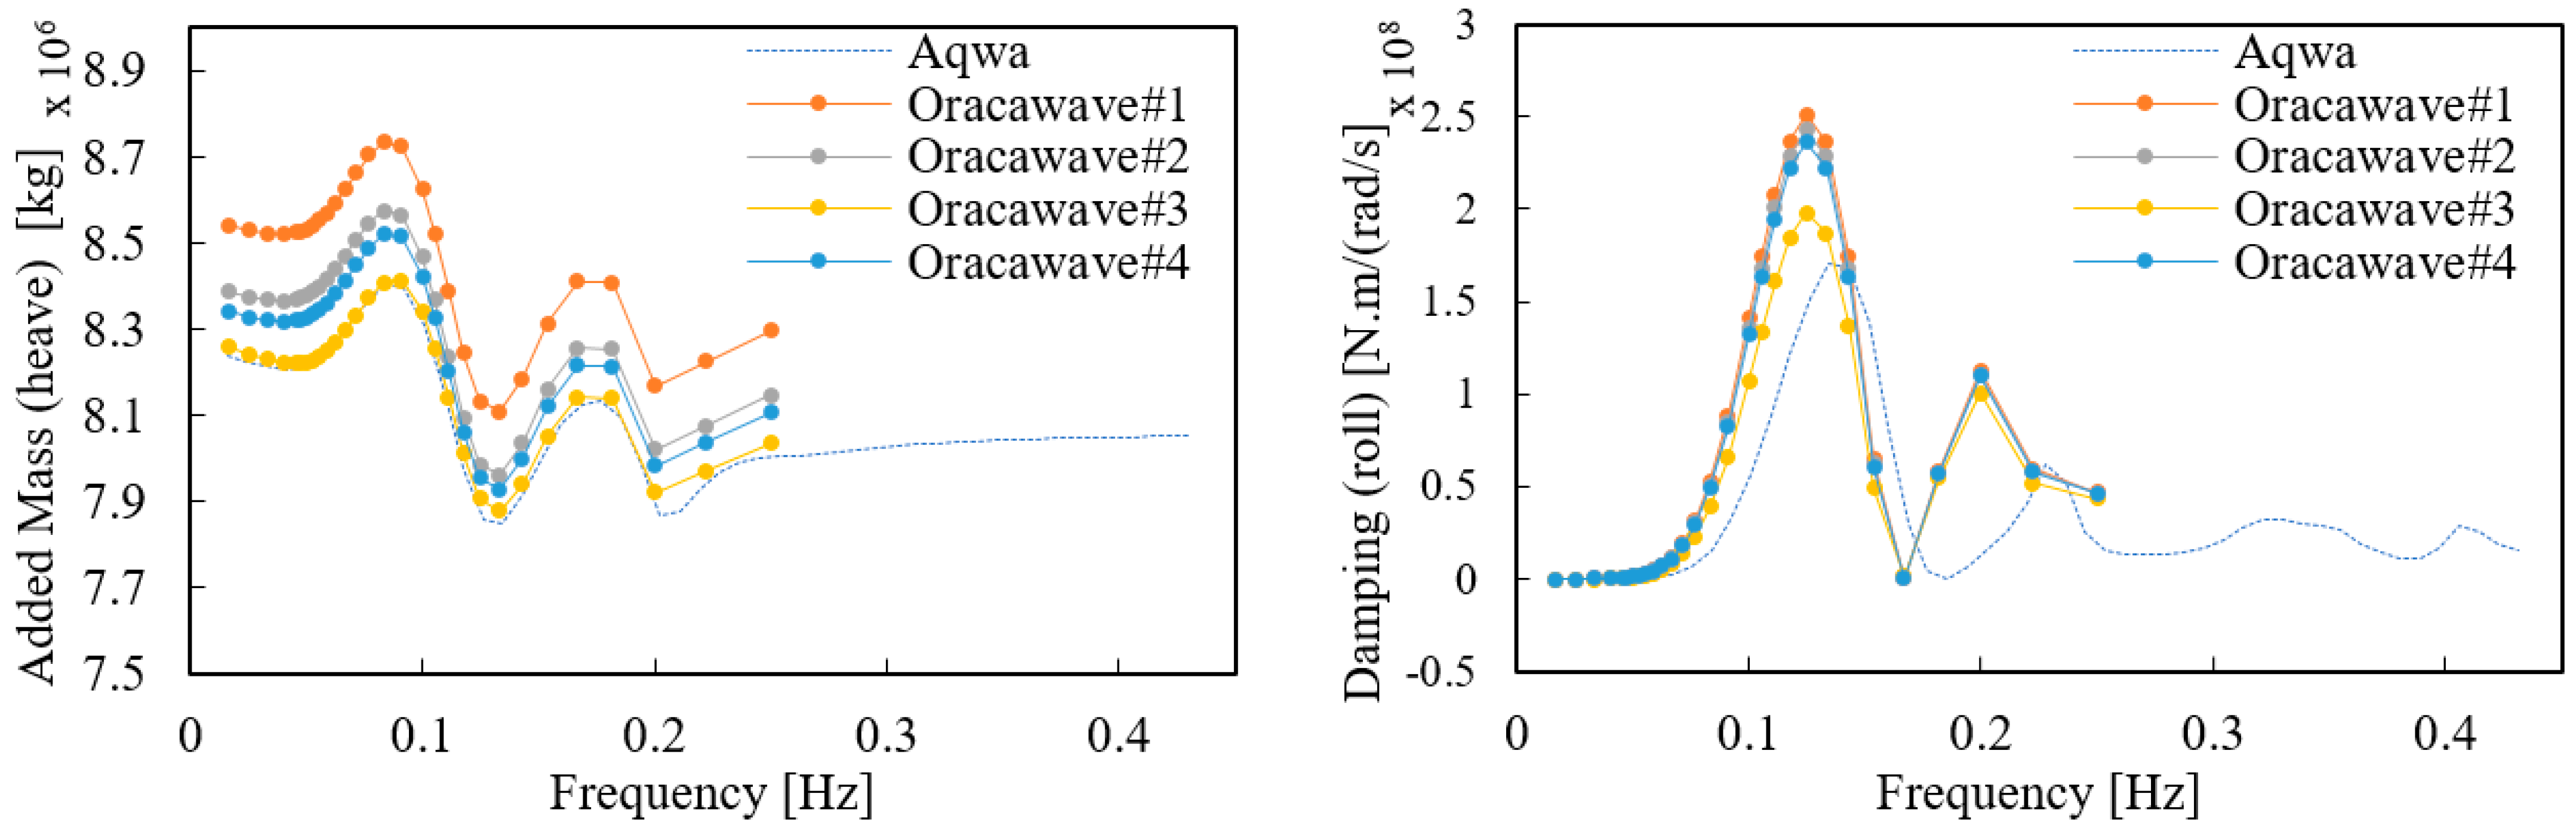
In the case of five columns as Figure 16, the added mass value for heave did not show a trend of convergence when the number of grids was increased similar to previous platforms. As the number of grids increased, the added mass value decreased overall, although the trend was not confirmed in #4 and most of the value was higher than in #3. The tendency to grid convergence was confirmed up to Orcawave #3, and when comparing the added mass value for heave it can be seen that the results for Orcawave #3 and the AQWA result value were quite similar. In the case of damping, there was little difference in value of #1 and #2, while the peak value was relatively lower than #3 and higher than #4. Although the peak value in #3 had an offset result, it can be confirmed that after calculation it was found to be significantly similar to the peak value derived from AQWA.
In the case with six columns as Figure 17, similar to the five column platform the added mass value for the wave cycle seemed to decrease overall as the number of grids increased; however, the trend was not confirmed in #4 and the overall value was higher than in #3. The trend toward grid convergence was confirmed up to Orcawave #3, and it can be seen that the added mass value for the peak was similar to the AQWA result. Similarly, when compared with the previous result in #3 the peak value was relatively low and then high again at #4. The peak value in #3 had offset results as a whole, although compared to other values it can be seen that it was relatively similar to the peak value derived from AQWA.
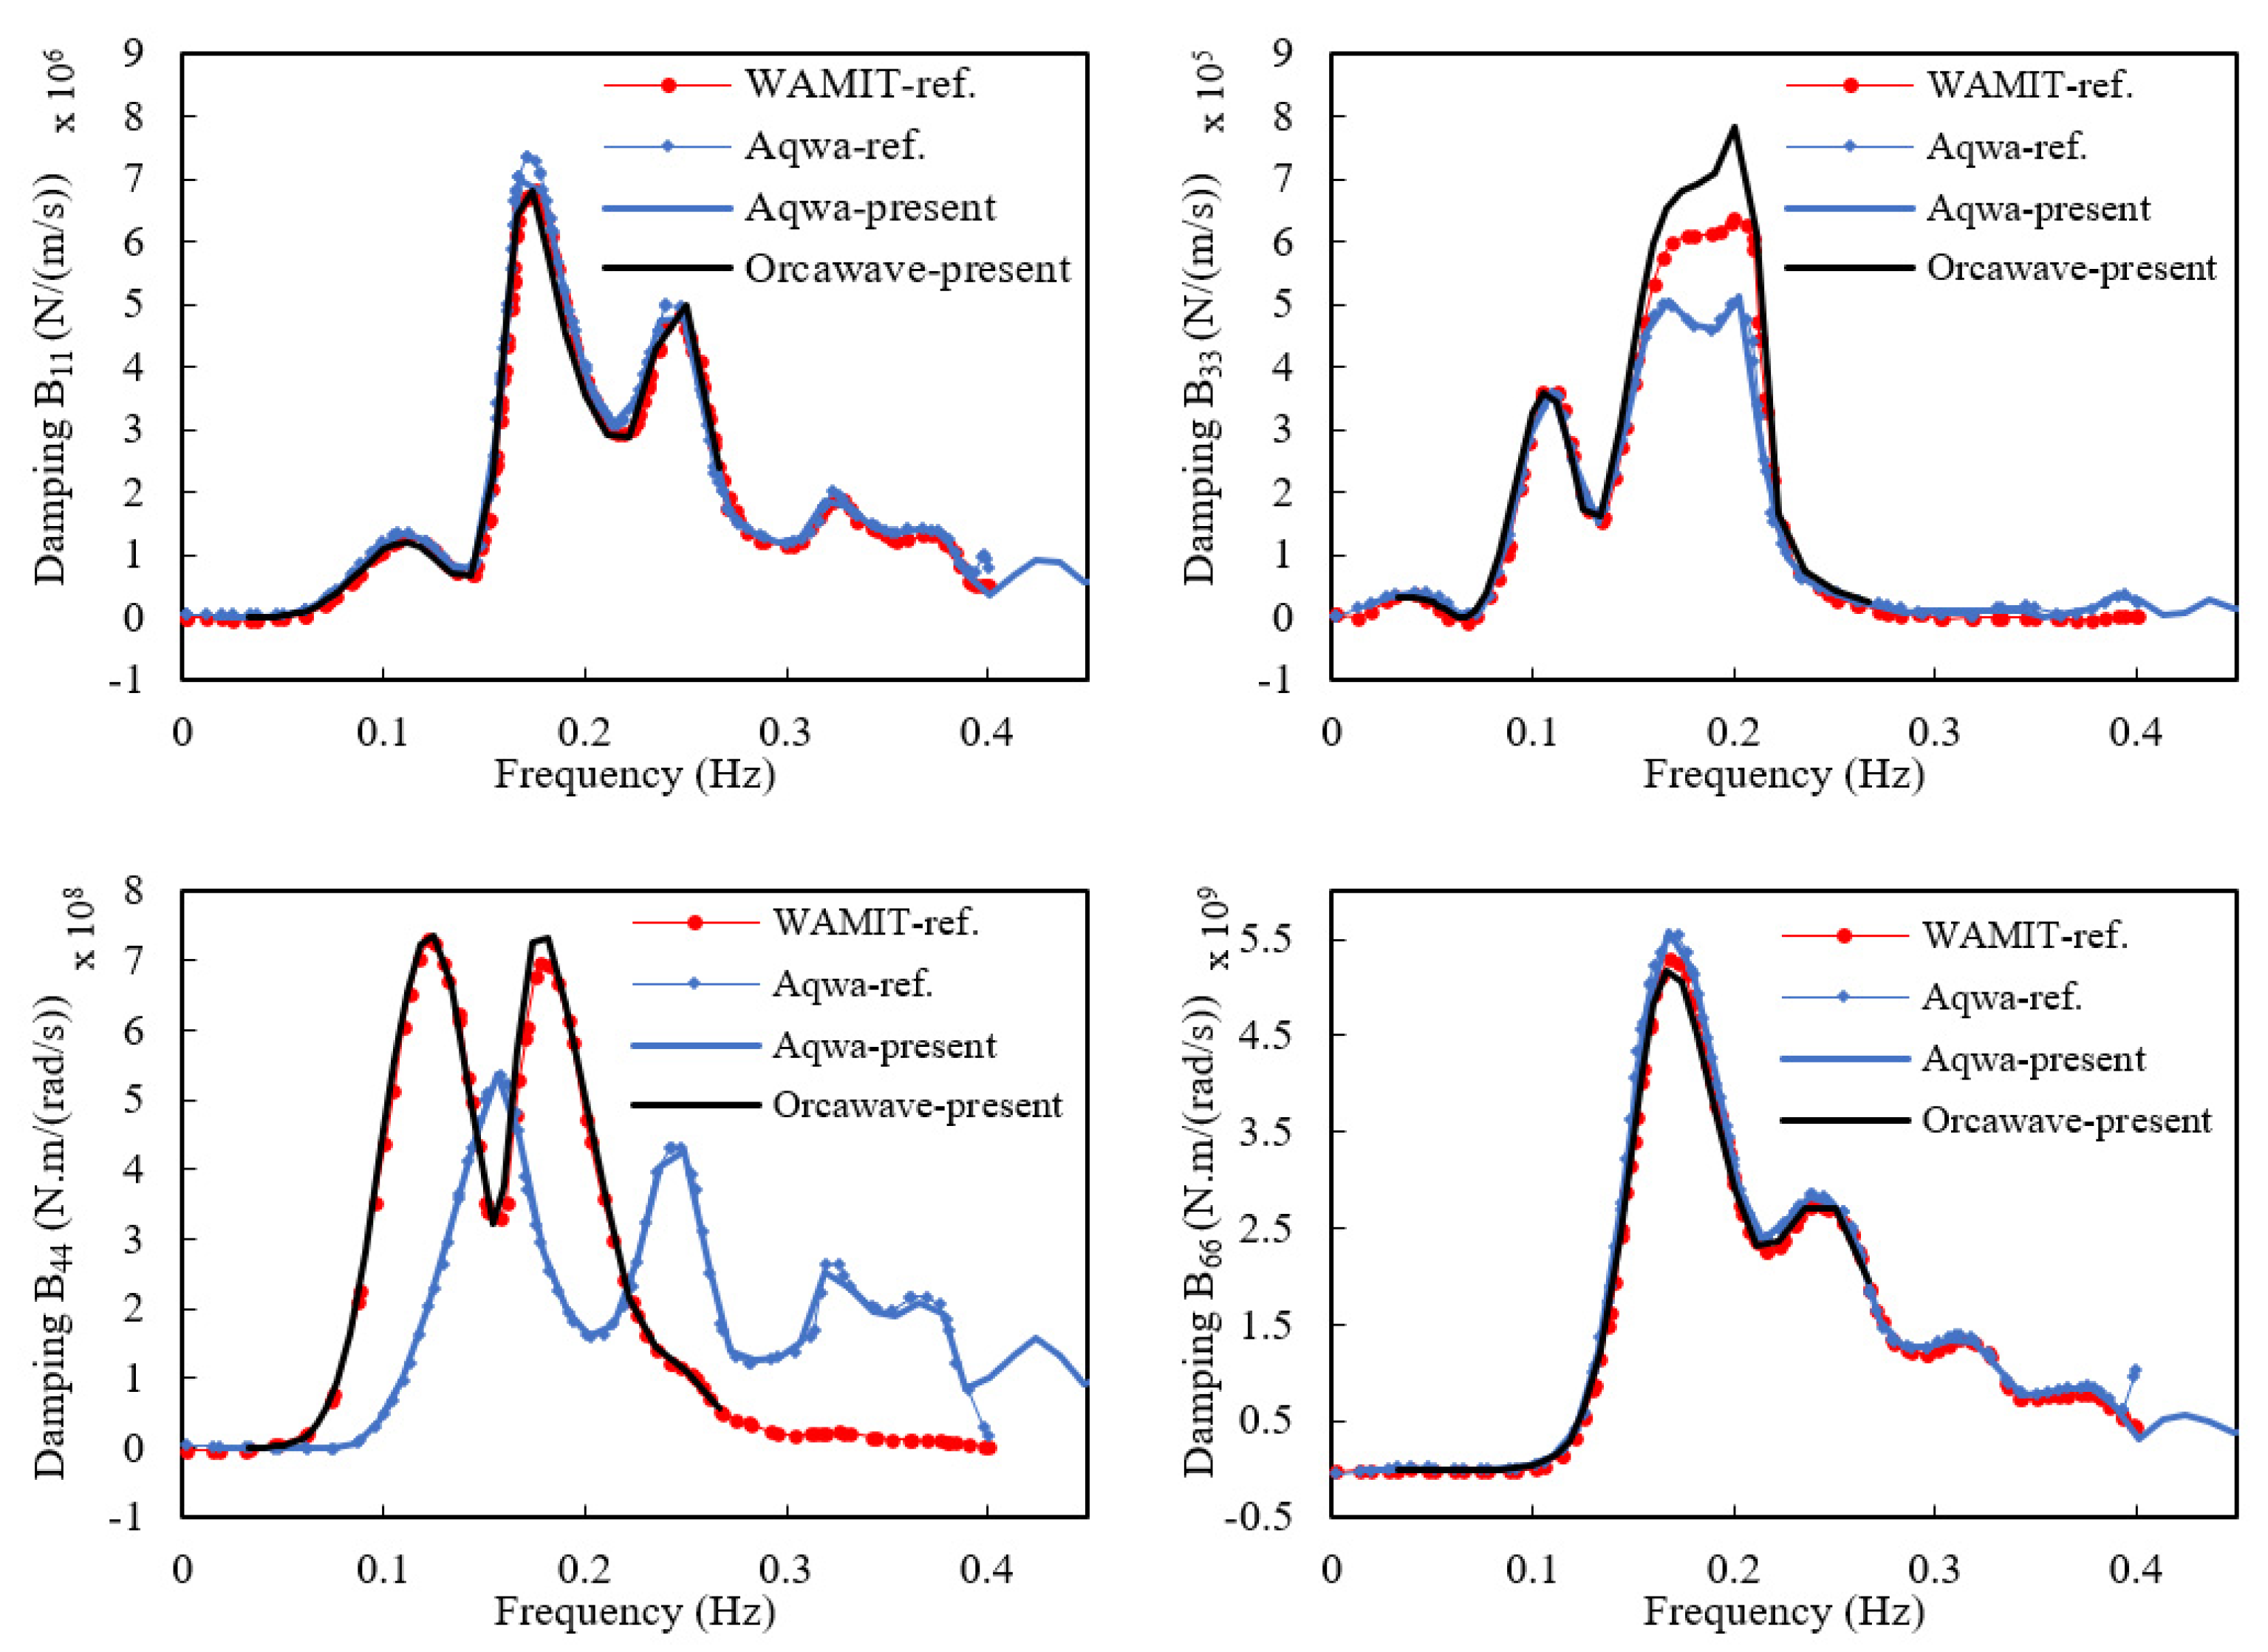
In the case of AQWA, the diffraction analysis results for heave, pitch, and roll are somewhat different from Orcawave due to differences in analysis techniques; the diffraction results obtained from Orcawave and WAMIT for OC4 platforms are discussed in the previous chapter, and their offset characteristics with AQWA here show similar behavior.
Only one result was used in AQWA because the lattice sensitivity depending on the platform shape was not large. In Orcawave, however, there was a case where the lattice sensitivity was largely dependent on the platform shape. Therefore, for platform diffraction the converged Orcawave result was used as platform characteristic data for platforms with lower grid sensitivity as the number of grids increased, while for platforms with high grid sensitivity the AQWA result was used as platform characteristic data.

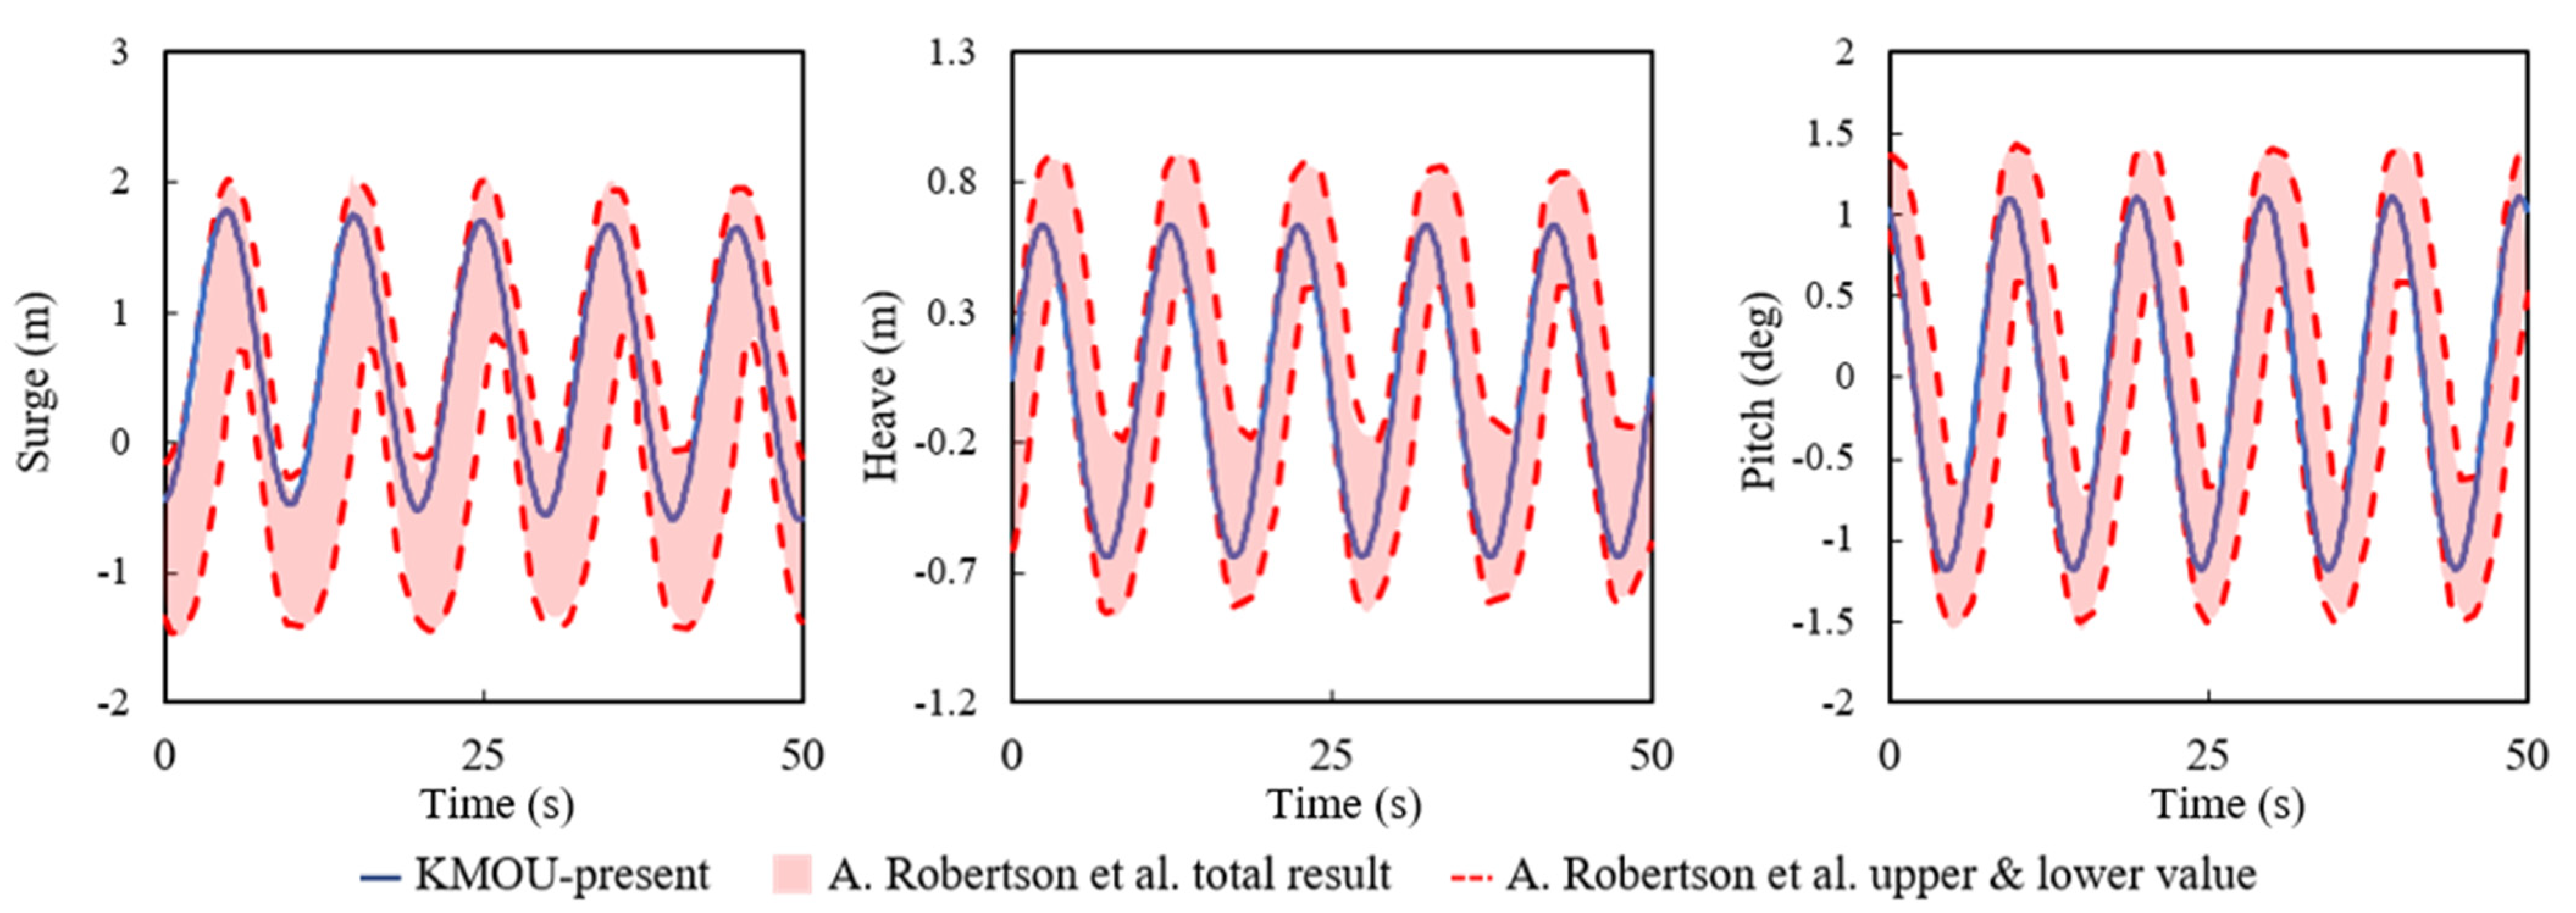
5.5. Fully Coupled Simulation

Figure 18, Figure 19 and 
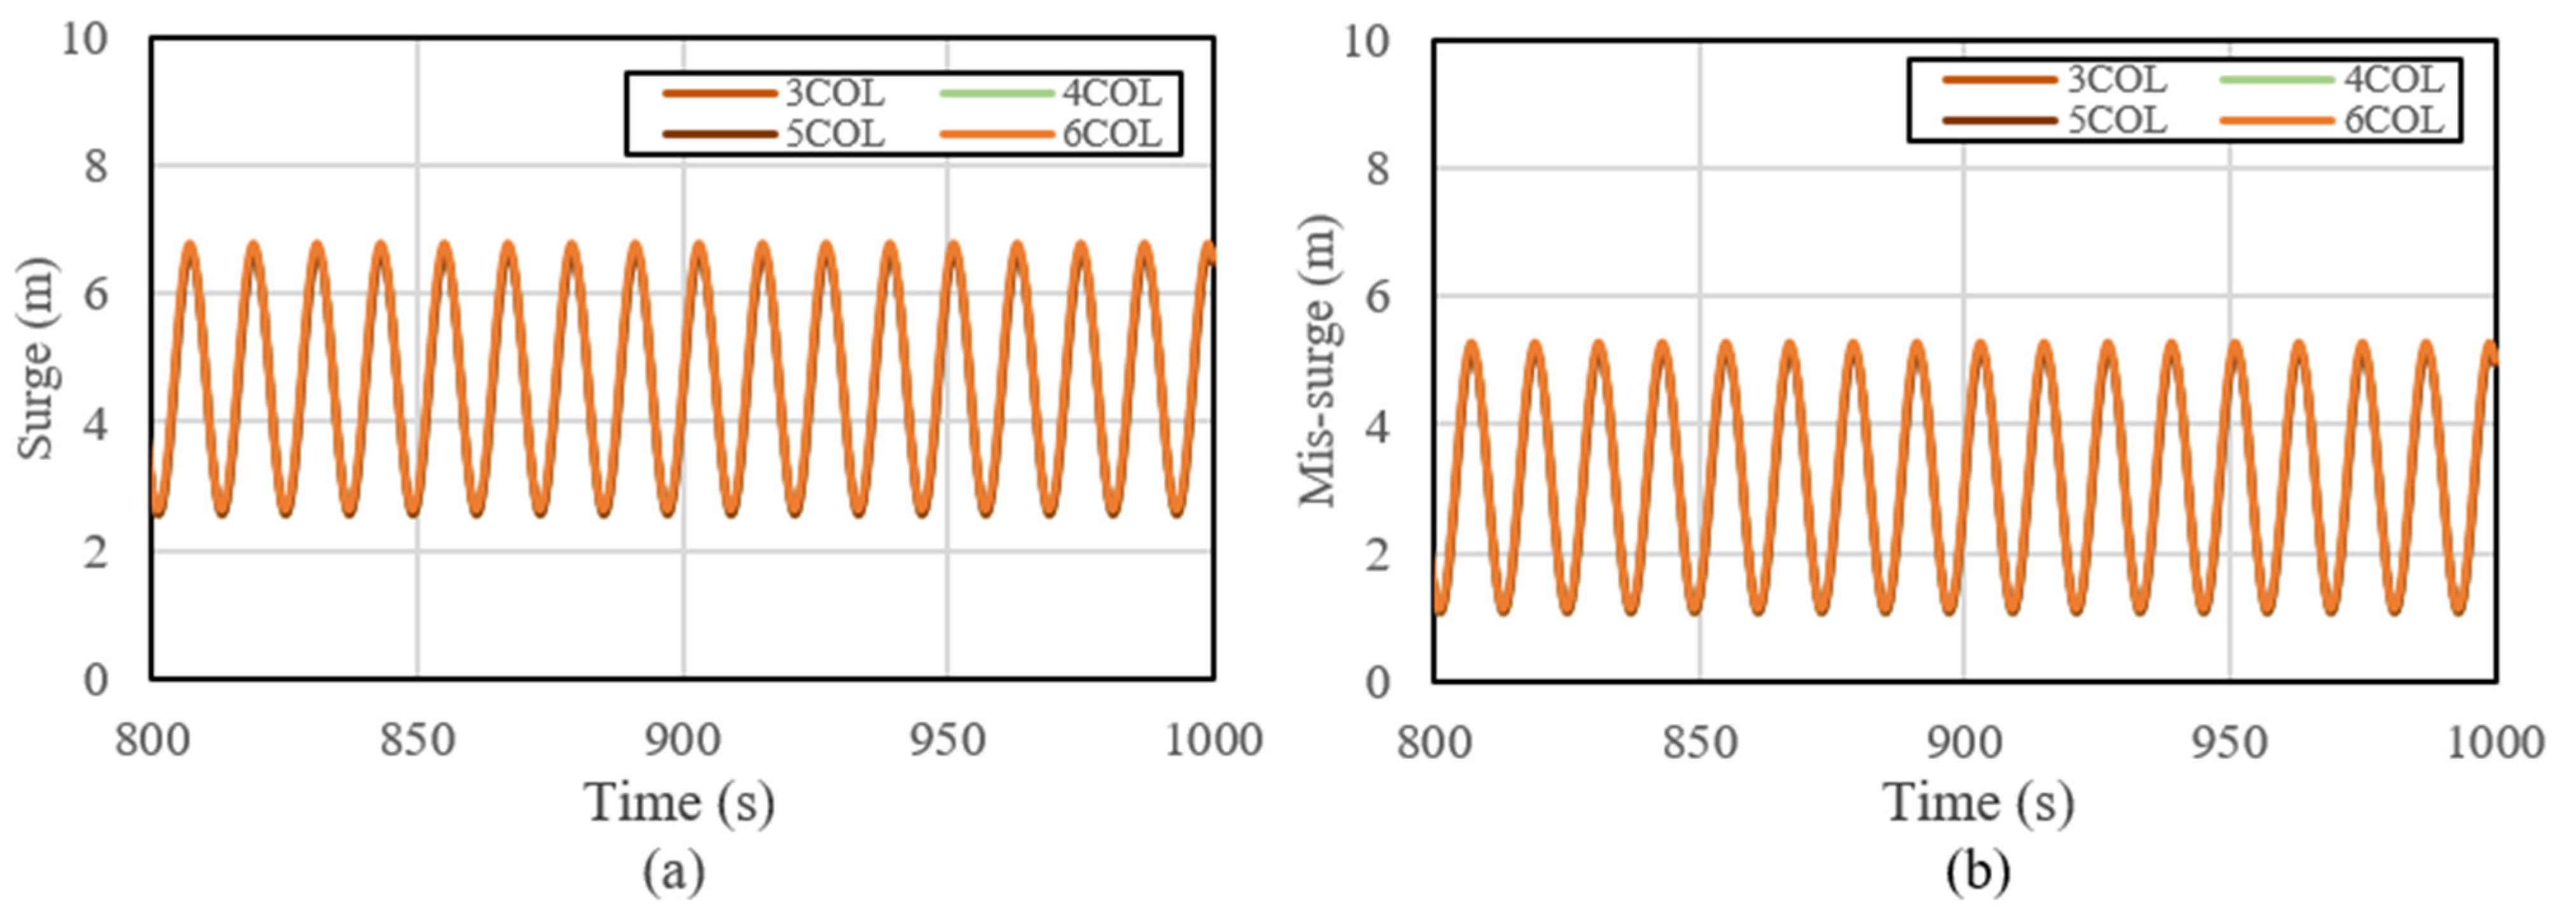
Figure 20 show the fully-coupled simulation results under the most critical environmental conditions. Figure 18a, Figure 19a and Figure 20a show the platform motion results simulated under a regular wave with a wave height of 7.4 m, wave period of 12 s, wind speed of 23.1 m/s, and the direction of waves and wind aligned. Figure 18b, Figure 19b and Figure 20b show the platform motion results simulated under a regular wave with a wave height of 7.4 m, wave period of 12 s, wind speed of 20 m/s, and the direction of waves and wind misaligned. Figure 18 shows the surge motion results for four different types of platforms. From this figure, it can be seen that the different types of platform had almost the same surge motion under both aligned and misaligned environment conditions. 
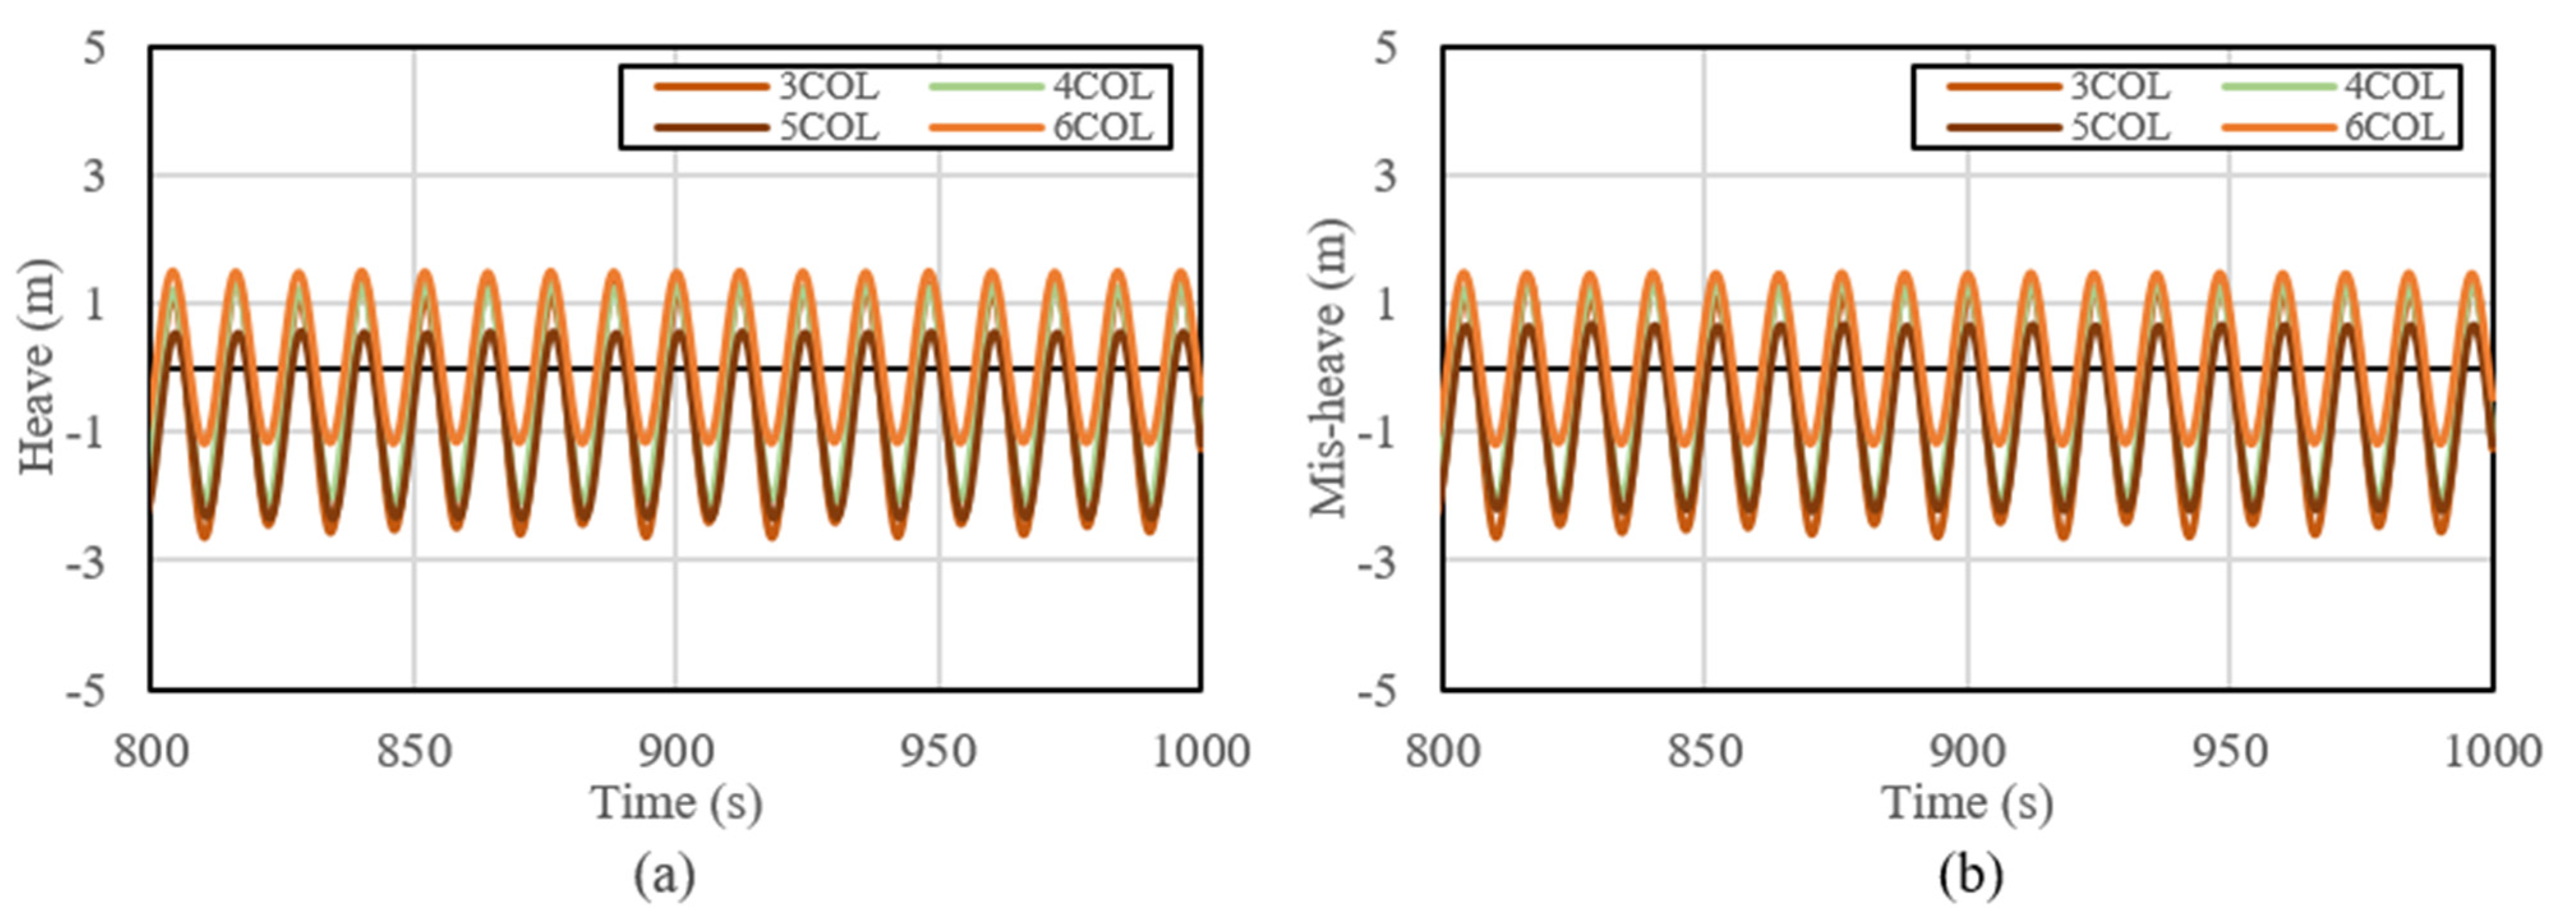
Figure 19 shows the heave motion results. In the case of heave motion, a slightly different minimum and maximum were confirmed depending on the platform type. The three-column platform’s maximum heave value was 1.3 m, and the minimum heave value was −2.6 m. The four-column platform’s maximum heave was 1.3 m, and the minimum heave value was −2.1m. The five-column platform’s maximum heave was 0.5 m, and the minimum heave value was −2.3. The six-column platform’s maximum heave was 1.5 m, and the minimum heave value was −1.2 m. Considering the average value, the six-column platform moved the least and the three-column platform moved the most. For amplitude, the six-column platform’s amplitude was the least at 2.7 m and the three-column platform’s amplitude was the highest at 4 m. 
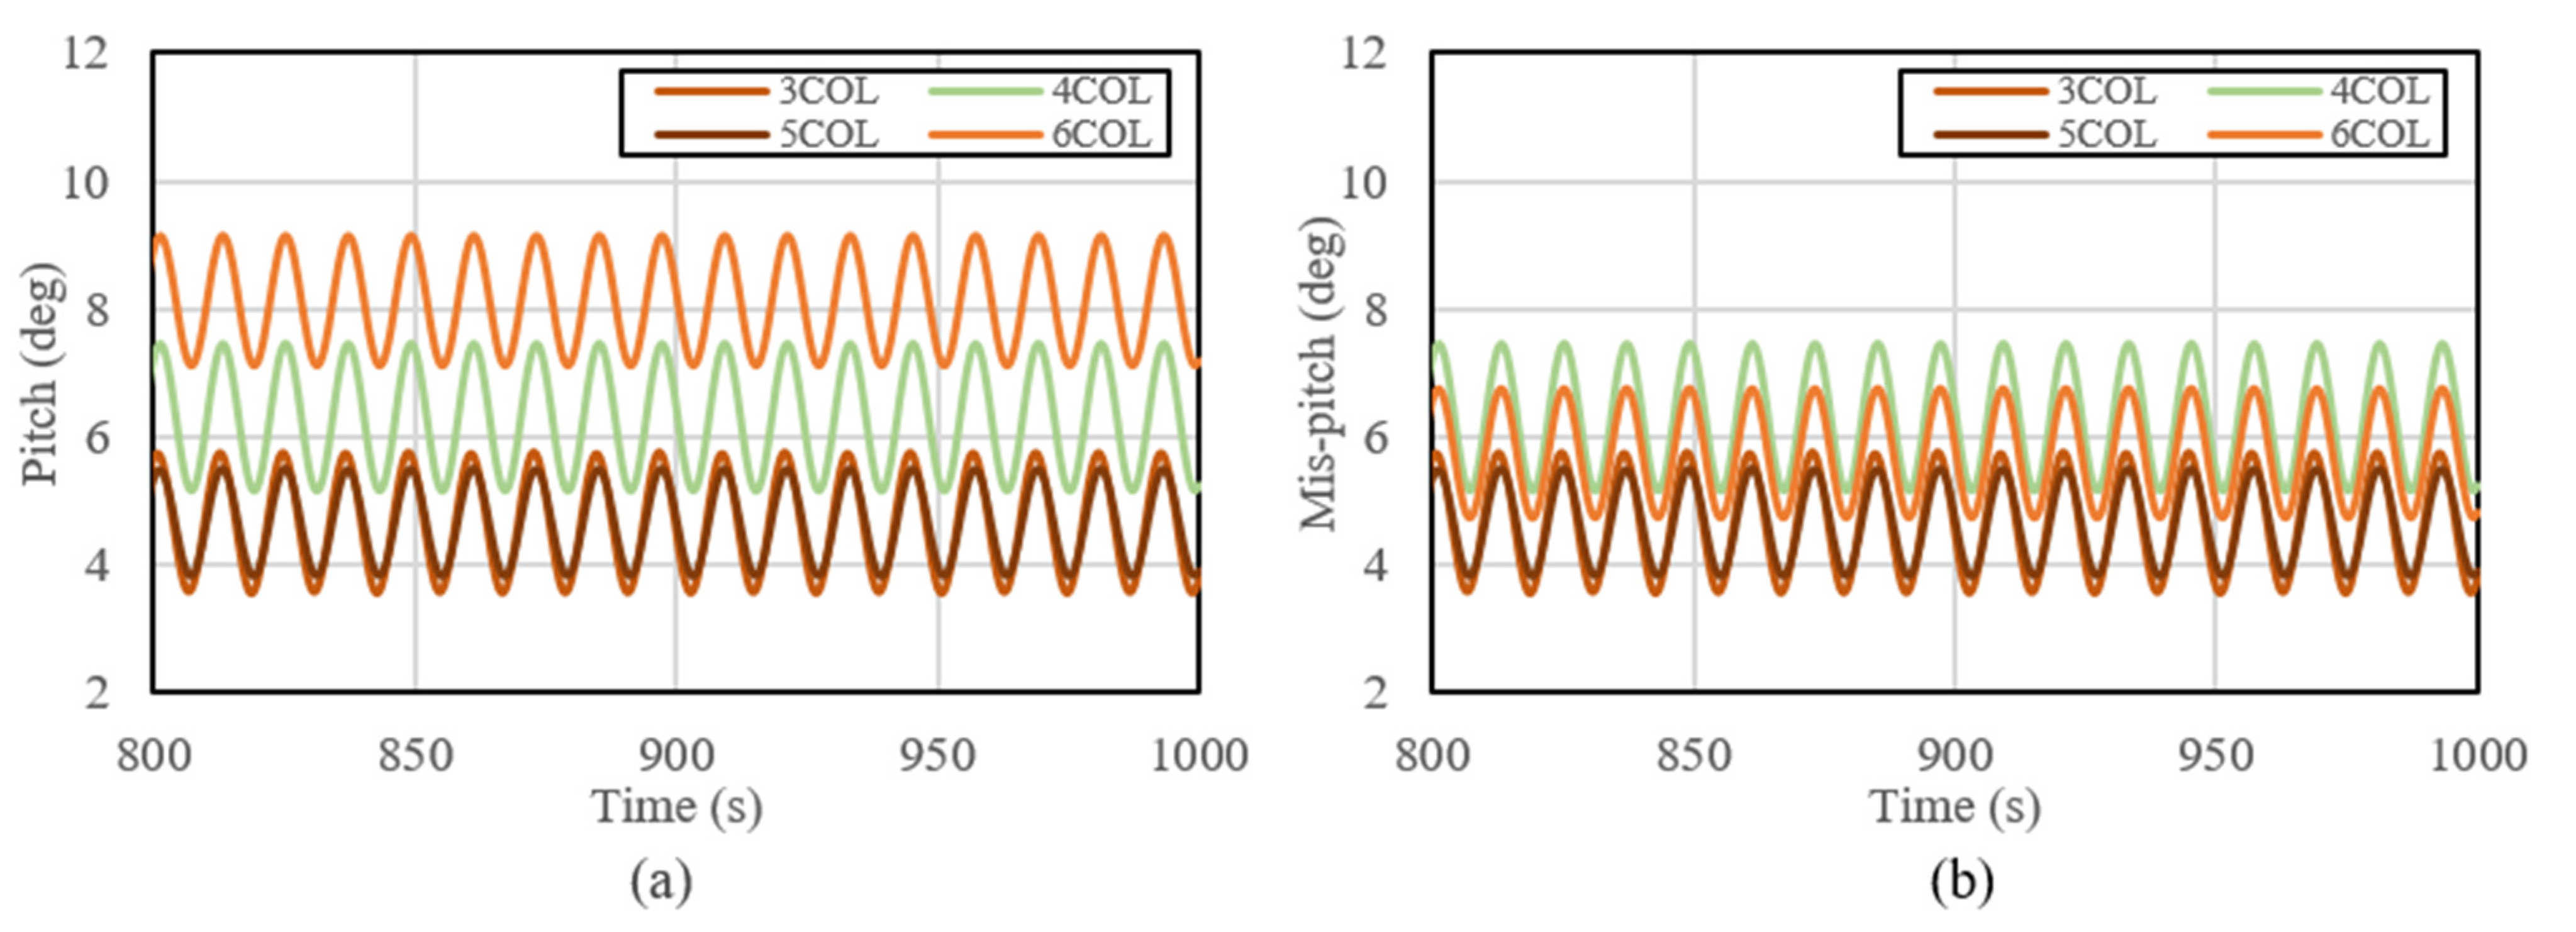
Figure 20 shows the platform pitch motion results. Contrary to the above two results, the motion was different between the aligned and misaligned environmental conditions. In aligned conditions all platforms’ pitch motion amplitude was almost the same, although the averages were different depending on the platforms. In the cases with three and five columns the platform was the most stable, while the six-column platform was the most unstable. In misaligned conditions, all platforms’ pitch motion was almost the same as in the aligned conditions, except for the six-column platform. In case of the six-column platform, the average was more stable compared to the four-column platform.
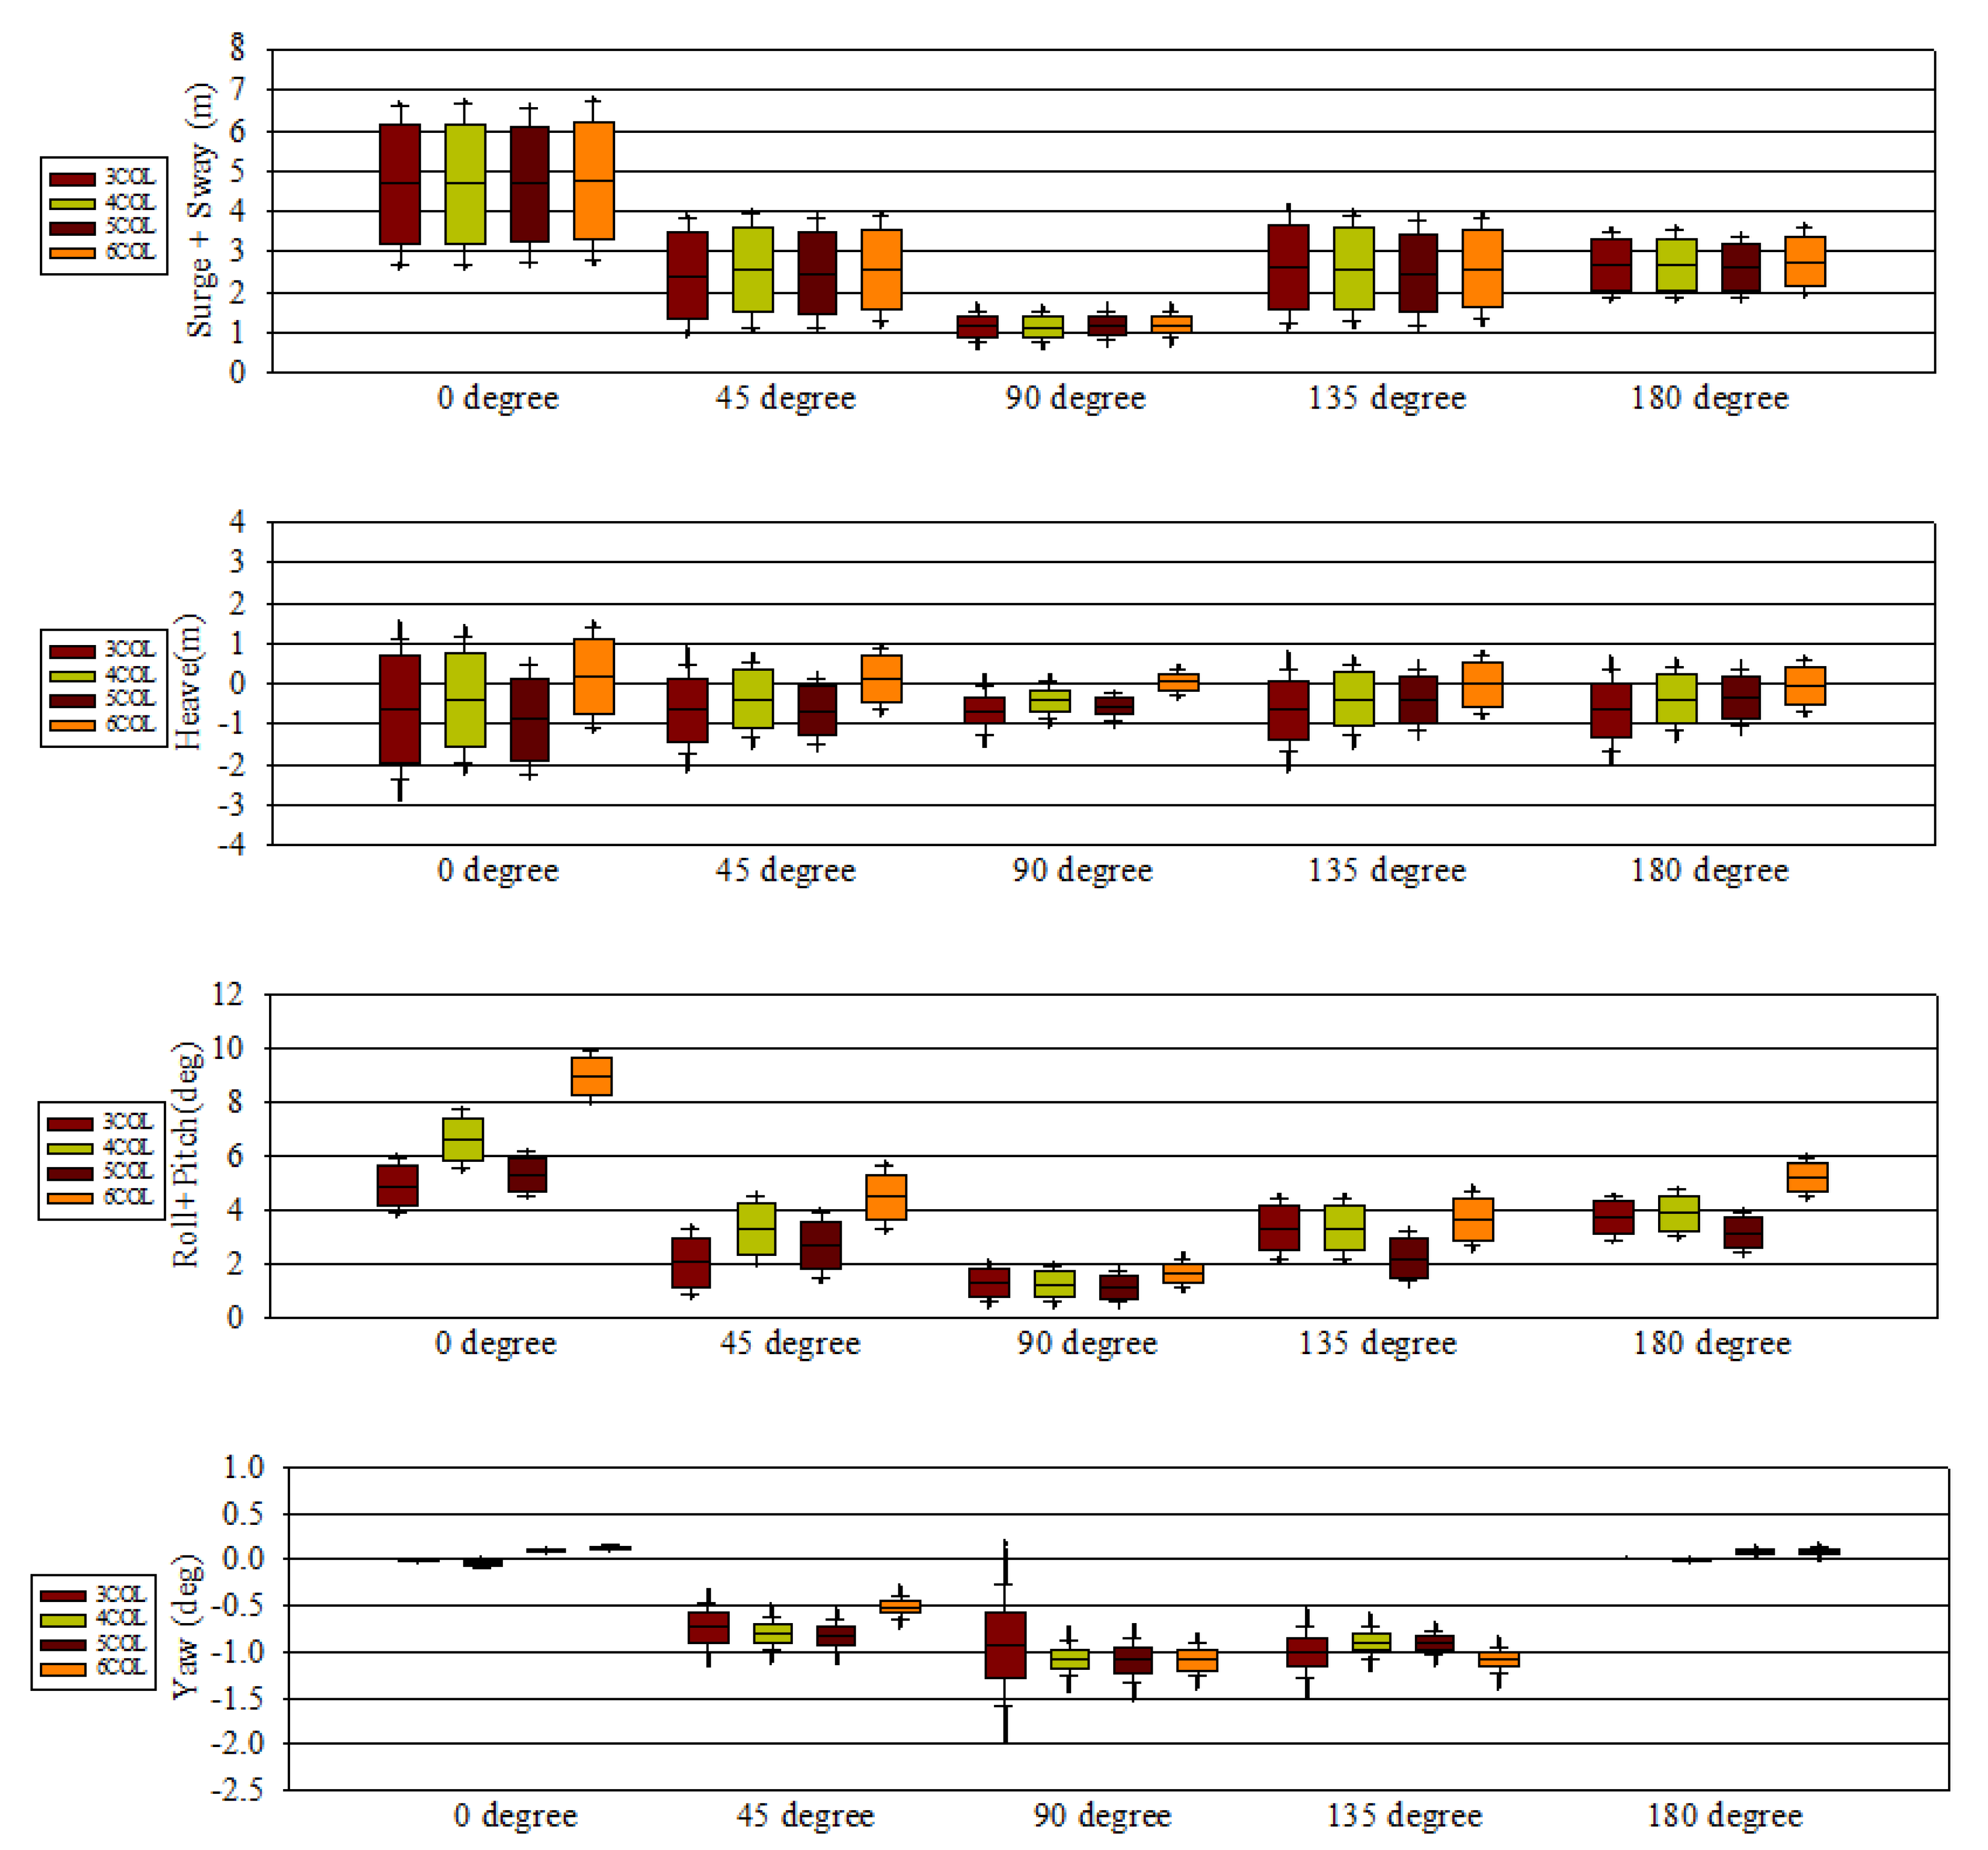
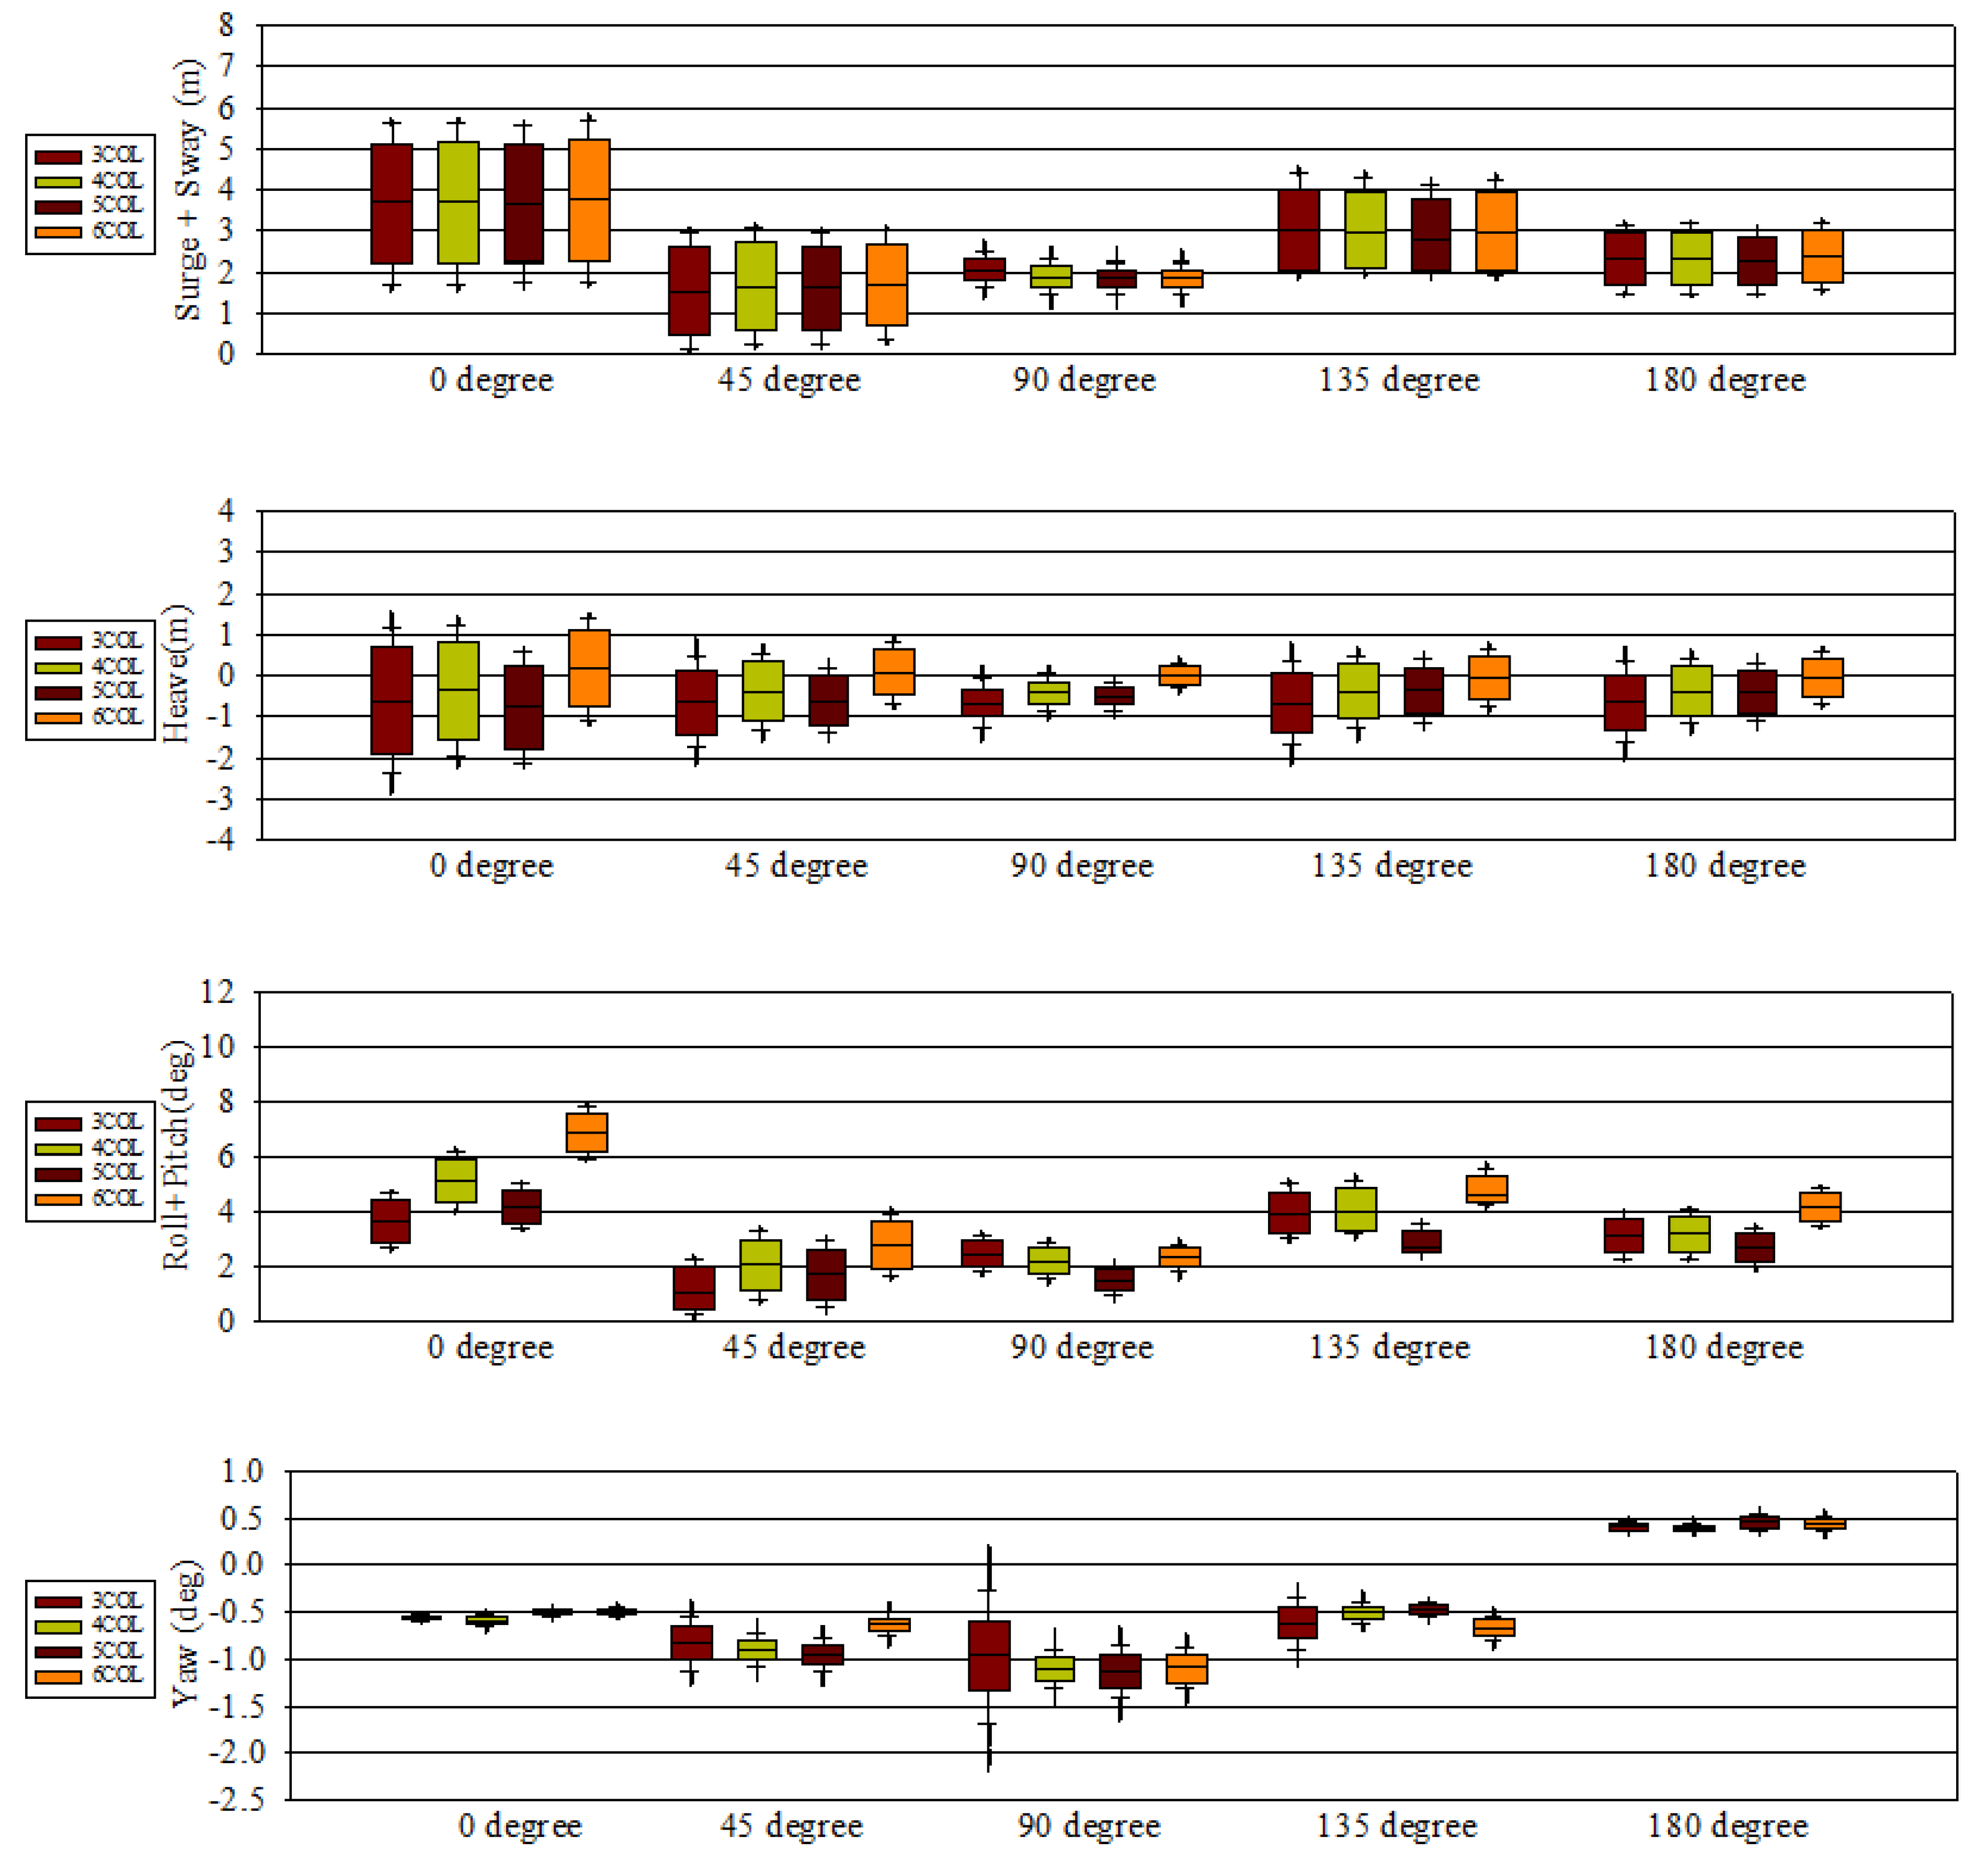
Figure 21 and Figure 22 show the platform motion response conducted for five wind angles at 45-degree intervals from 0 degree to 180 degrees. Each graph identifies four types of values in total in order to analyze the stability of the platform, namely, surge + sway, heave, roll + pitch, and yaw. In addition, for a more intuitive analysis the results for each angle for all platform shapes are provided. The reason for the analysis of surge and sway is that wind and waves from different angles affect the platform differently. In order to analyze the displacement value for each angle, the surge and sway values were added as absolute values. In the case of heave, the absolute value was not taken into account, roll + pitch applied the same method as surge + sway, and yaw applied the same method as heave. The analysis was largely classified into two categories. One was an alignment in which the directions of waves and wind coincide, and the other a misalignment in which the directions of waves and wind do not coincide. Figure 22 shows the analysis of the environment in which the wind direction and the wave direction coincide, while Figure 21 shows the analysis of the environmental conditions in which the difference between wind and wave direction is 22.5 degree. In Figure 22, the wind direction is the same as in Figure 21; the analysis was conducted under extreme environmental conditions in which waves were generated by twisting 22.5 degree clockwise on an early basis. These results can be explained by the order of alignment and misalignment.
For surge + heave, there was no overall difference in platform shape and the largest range of behavior was found in all platforms from 0 degrees to about 2.5 m to 6.5 m, followed by a similar range and average values at 45 degrees and 135 degrees; the average value was similar, and the range of behavior was more stable. The smallest range of behavior was 90 degrees, the absolute sum of surge + sway was about 1 degree on all platforms, and the maximum and minimum range of behavior was confirmed to be within 1 degree.
In the case of heave, the overall average value was confirmed to be 0 to −1 m, and the largest movement was confirmed at 0 degree same as surge + sway. Comparing by platform, it was confirmed that at 0 degrees the six-column platform had the closest average value to 0 and the range of behavior was stable. In other wind and wave angles, the average value of the six-column platform was closest to 0, and its behavior was confirmed to be more stable compared to the other platforms.
In the case of roll + pitch, the behavior range of the six-column platform was similar to or less than that of other platforms, although the average slope was the largest. In particular, the average slope was 9 degrees from 0 degrees, 3–4 degrees larger than the average slope of other platforms. Regardless of the platform, the roll + pitch angle was the largest at 0 degrees, of which the three-column platform and the five-column platform had a similar average slope and the five-column platform was more stable considering the maximum and minimum values. The case with five columns was stable compared to other platforms at different wind and wave angles.
In the case of yaw, as compared to other behaviors small behaviors appeared between −2 degrees and 1 degree in all directions. However, while other behaviors showed a stable appearance at 90 degrees the most unstable yaw behavior was confirmed at 90 degrees. In particular, the case with three columns showed the most unstable behavior of all the platforms, and in other platforms similar movements were confirmed with the same wave and wind direction.
When analyzing the misalignment conditions, in the case of surge + sway the most unstable movement was confirmed at 0 degrees regardless of the shape of the platform; no significant difference in stability was confirmed for any platform. In the case of heave, the most unstable movement was confirmed at 0 degrees. In terms of stability, the case with six columns showed good movement with all wind and wave direction, and the average value was close to 0.
The most unstable behavior was confirmed at 0 degrees in the case of roll + pitch, and the average slope was found to be the most unstable at about 7 degrees, especially in the case with six columns. Overall, there was no significant difference in the range of platform behavior by platform, and stable behavior was shown with the overall wind and wave angles in the case with three columns.
In the case of yaw it was confirmed that the overall behavior of the three-column platform was the most unstable, especially at 90 degrees. On the other hand, it was confirmed that the behavior ranges of the platforms with four, five, and six columns were stable.

6. Conclusions

Both alignment and misalignment showed the most unstable movement at 0 degrees as a whole. This may be somewhat due to the characteristics of the platform; however, the main reason is that the environmental condition are more harsh than with other angles. In the case of alignment, there was no significant difference by platform in surge + sway, and the most stable behavior, in the case with six columns, was confirmed for heave; there was no significant difference compared to the other platforms. On the other hand, in roll + pitch the platform with six columns showed considerably unstable movements compared to the other platforms, which all showed similar movements. Yaw led to the most unstable movement among the platforms, −0.5 to −1.25 degrees with a range of 90 degrees in the case with three columns, although this value was not large. In addition, it showed behavior in a small range in other directions; all other platforms were similarly stable. In the case of misalignment, there was no significant difference between platforms in surge + sway and heave, although in roll + pitch the case with six columns was found to be unstable compared to the other platforms, which all showed similar behavior. In the case of yaw, the case with three columns showed the most unstable movement among platforms from 90 degrees to −0.5 to −1.25 degrees, although this value caused no critical movement; all other platforms showed stable overall behavior.
In this study, various platforms were designed according to their number of columns and stability analyses was performed. The results showed no significant differences in stability according to the number of columns. The reason for the tendency towards stability according to the number of columns not being clearly confirmed is considered to be due to the following reasons. Because the number of platforms was changed while maintaining the same amount of materials used, the center of gravity gradually approached sea level as the number of columns increased. As a result, the center of gravity was different for each platform, and as the number of columns increased the center of gravity was increasingly high. As the behavior of the platform has a great influence on the number of columns as well as on the center of gravity, it is confirmed that there is no tendency towards stability according to the number of columns, for complex reasons. In this study, because the analysis was performed while parking the turbine under extreme conditions it is judged that future studies are needed on the stability of the platform in the operating state.

Author Contributions

Conceptualization, Y.-H.L. and H.-S.Y.; methodology, H.-S.Y., A.A. and D.S.E.; software, H.-S.Y., A.A. and D.S.E.; validation, H.-S.Y. and D.S.E.; formal analysis, A.A., W.T., D.S.E. and Y.-H.L.; investigation and data curation H.-S.Y., W.T. and A.A.; writing—original draft preparation, H.-S.Y.; writing—review and editing, D.S.E., W.T., A.A. and Y.-H.L.; visualization, D.S.E. and H.-S.Y.; supervision, H.-S.Y. and Y.-H.L.; project administration, H.-S.Y. All authors have read and agreed to the published version of the manuscript.

Funding

This research was supported by Korea Institute of Energy Technology Evaluation and Planning (KETEP) grant funded by the Korean government (MOTIE) (20213000000030)—Development of disconnectable mooring system for A MW class floating offshore wind turbine.

Data Availability Statement

This data presented in this study are available on request from the corresponding author.

Conflicts of Interest

The authors declare no conflict of interest.

Abbreviation

RNARotor Nacelle Assembly
Symbols
A mDistance between columns
B mBase ballast tank part height
C mDeck width
t mDeck thickness
H mplatform height
R mColumn radius(outer)
r mColumn radius(inner)
D mDraft
N c -Number of column
W P kgPlatform weight
W S kgOC4 platform weight (platform only, except ballast water, tower and RNA)
ρ p kg / m 3 Material density used in platform

References

  1. Sala, O.E.; Chapin, F.S., III; Armesto, J.J.; Berlow, E.; Bloomfield, J.; Dirzo, R.; Huber-Sanwald, E.; Huenneke, L.F.; Jackson, R.B.; Kinzig, A.; et al. Global Biodiversity Scenarios for the Year 2100. Science 2000, 287, 1770–1774. [Google Scholar] [CrossRef] [PubMed]
  2. Mazdiyasni, O.; AghaKouchak, A. Substantial increase in concurrent droughts and heatwaves in the United States. Proc. Natl. Acad. Sci. USA 2015, 112, 11484–11489. [Google Scholar] [CrossRef] [PubMed] [Green Version]
  3. Lehmann, J.; Rillig, M. Distinguishing variability from uncertainty. Nat. Clim. Chang. 2014, 4, 153. [Google Scholar] [CrossRef]
  4. Grossiord, C.; Buckley, T.N.; Cernusak, L.A.; Novick, K.A.; Poulter, B.; Siegwolf, R.T.W.; Sperry, J.S.; McDowell, N.G. Plant responses to rising vapor pressure deficit. New Phytol. 2020, 226, 1550–1566. [Google Scholar] [CrossRef] [PubMed] [Green Version]
  5. Gray, S.B.; Dermody, O.; Klein, S.P.; Locke, A.; McGrath, J.M.; Paul, R.E.; Rosenthal, D.M.; Vera, U.R.; Siebers, M.H.; Strellner, R.; et al. Intensifying drought eliminates the expected benefits of elevated carbon dioxide for soybean. Nat. Plants 2016, 2, 16132. [Google Scholar] [CrossRef] [PubMed]
  6. Karimi, M.; Hall, M.; Buckham, B.; Crawford, C. A multi-objective design optimization approach for floating offshore wind turbine support structures. J. Ocean Eng. Mar. Energy 2017, 3, 69–87. [Google Scholar] [CrossRef]
  7. Brommundt, M.; Krause, L.; Merz, K.; Muskulus, M. Mooring System Optimization for Floating Wind Turbines using Frequency Domain Analysis. Energy Procedia 2012, 24, 289–296. [Google Scholar] [CrossRef] [Green Version]
  8. Benassai, G.; Campanile, A.; Piscopo, V.; Scamardella, A. Optimization of Mooring Systems for Floating Offshore Wind Turbines. Coast. Eng. J. 2015, 57, 1550021. [Google Scholar] [CrossRef] [Green Version]
  9. Ikoma, T.; Tan, L.; Moritsu, S.; Aida, Y.; Masuda, K. Motion characteristics of a barge-type floating vertical-axis wind turbine with moonpools. Ocean Eng. 2021, 230, 109006. [Google Scholar] [CrossRef]
  10. Tan, L.; Ikoma, T.; Aida, Y.; Masuda, K. Mean Wave Drift Forces on a Barge-Type Floating Wind Turbine Platform with Moonpools. J. Mar. Sci. Eng. 2021, 9, 709. [Google Scholar] [CrossRef]
  11. Allen, C.K.; Goupee, A.J.; Dagher, H.J.; Viselli, A.M. Validation of Global Performance Numerical Design Tools Used for Design of Floating Offshore Wind Turbines; American Society of Mechanical Engineers: New York, NY, USA, 2015. [Google Scholar]
  12. Robertson, A.; Jonkman, J.; Vorpahl, F.; Popko, W.; Qvist, J.; Frøyd, L.; Chen, X.; Azcona, J.; Uzunoglu, E.; Guedes Soares, C.; et al. Offshore Code Comparison Collaboration Continuation within IEA Wind Task 30: Phase II Results Regarding a Floating Semisubmersible Wind System; American Society of Mechanical Engineers: New York, NY, USA, 2014. [Google Scholar]
  13. Zhou, S.; Müller, K.; Li, C.; Xiao, Y.; Cheng, P.W. Global sensitivity study on the semisubmersible substructure of a floating wind turbine: Manufacturing cost, structural properties and hydrodynamics. Ocean Eng. 2021, 221, 108585. [Google Scholar] [CrossRef]
  14. Heaton, C.; Heffernan, D. Orcina Project 1429 Orcawave Validation Report; Orcina Ltd.: Ulverston, UK, 2020; pp. 9–13. [Google Scholar]
  15. Lin, Y.; Yang, C. Hydrodynamic Simulation of the Semi-Submersible Wind Float by Investigating Mooring Systems in Irregu-lar Waves. Appl. Sci. 2020, 10, 4267. [Google Scholar] [CrossRef]
  16. Bussemakers, P.J.M. Validation of Aero-Hydro-Servo-Elastic Load and Motion Simulations in Bhawc/Orcaflex for The Hywind Scotland Floating Offshore Wind Farm; NTNU: Trondheim, Norway, 2020. [Google Scholar]
  17. Jonkman, J.; Butterfield, S.; Musial, W.; Scott, G. Definition of a 5-MWReference Wind Turbine for Offshore System Development; Technical Report NREL/TP-500-38060; National Renewable Energy Laboratory: Golden, CO, USA, 2009.
Figure 1. Workflow of the present simulation.
Energies 15 01653 g001
Figure 2. Diffraction analysis technique validation result (added mass).
Energies 15 01653 g002
Figure 3. Diffraction analysis technique validation result (damping).
Energies 15 01653 g003
Figure 4. Fully coupled technique validation result (regular wave, H = 6 m, T = 10 s).
Energies 15 01653 g004
Figure 5. Comparison of different types of input wind spectrum.
Energies 15 01653 g005
Figure 6. Fully coupled technique validation result (Turbulent (IEC Kaimal) model, V = 11.4 m/s, Irregular Hs = 6 m, Tp = 10 s).
Energies 15 01653 g006
Figure 7. Ulsan sea area used for simulated platform stability analysis.
Energies 15 01653 g007
Figure 8. Name of the part and the parameters of the designed platform.
Energies 15 01653 g008
Figure 9. Column radius selection procedure.
Energies 15 01653 g009
Figure 10. Sketch of three-column platform floating wind turbine system: (a) front view of three-column platform; (b) top view of three-column platform; (c) isometric view of three-column floating wind turbine system.
Energies 15 01653 g010
Figure 11. Sketch of four-column platform floating wind turbine system: (a) front view of four-column platform; (b) top view of four-column platform; (c) isometric view of four-column floating wind turbine system.
Energies 15 01653 g011
Figure 12. Sketch of five-column platform floating wind turbine system: (a) front view of five-column platform; (b) top view of five-column platform; (c) isometric view of five-column floating wind turbine system.
Energies 15 01653 g012
Figure 13. Sketch of six-column platform floating wind turbine system: (a) front view of six-column platform; (b) top view of six-column platform; (c) isometric view of six-column floating wind turbine system.
Energies 15 01653 g013
Figure 14. Three-column platform hydrodynamic result (heave and pitch).
Energies 15 01653 g014
Figure 15. Four-column platform hydrodynamic result (heave and pitch).
Energies 15 01653 g015
Figure 16. Five-column platform hydrodynamic result (heave and pitch).
Energies 15 01653 g016
Figure 17. Six-column platform hydrodynamic result (heave and roll).
Energies 15 01653 g017
Figure 18. Surge results for different types of platforms ((a): direction of waves and wind aligned; (b): direction of waves and wind misaligned).
Energies 15 01653 g018
Figure 19. Heave results for different types of platforms ((a): direction of waves and wind aligned; (b): direction of waves and wind misaligned).
Energies 15 01653 g019
Figure 20. Pitch results for different types of platforms ((a): direction of waves and wind aligned; (b): direction of waves and wind misaligned).
Energies 15 01653 g020
Figure 21. Alignment case stability analysis results using fully-coupled simulation.
Energies 15 01653 g021
Figure 22. Misalignment case stability analysis results using fully-coupled simulation.
Energies 15 01653 g022
Table 1. Reference platform structural properties.
Platform mass (including ballast water, tower, RNA)1.347 × 10⁷ kg
CM location below SWL13.46 m
Platform roll inertia about CM6.827 × 109 kg-m2
Platform pitch inertia about CM6.827 × 109 kg-m2
Platform yaw inertia about CM1.226 × 1010 kg-m2
Table 2. Met-Ocean Information.
LatitudeLongitudeDepth [m]
Ulsan sea area 35 ° 45 0   N 129 ° 45 00.0   E 200
Table 3. Load case using ten-year period extreme sea state case.
Wave-DirHs [m]Tp [s]Wind-DirWind-Vel [m/s]
Case01N6.511.3N21.2
NNE23.1
NNW17.6
Case02NNE7.412NNE23.1
NE20
N21.2
Case03NE6.111NE20
ENE16.8
NNE23.1
Case04ENE5.610ENE16.8
E15.2
NE20
Case05E4.89.3E15.2
ESE16.1
ENE16.8
Case06ESE3.58.6ESE16.1
SE17.2
E15.2
Case07SE3.89SE17.2
SSE18
ESE16.1
Case08SSE5.110.2SSE18
SSE18.6
SE17.2
Case09S6.410.6S18.6
SSW18.3
SSE18
Case10SSW5.29.6SSW18.3
SW16.1
S18.6
Case11SW2.97.9SSW18.3
SW16.1
S18.6
Case12WSW38.1WSW15.1
W17.1
SW16.1
Case13W3.28.3W17.1
WNW18.8
WSW15.1
Case14WNW3.28.3WNW18.8
NW18.9
W17.1
Case15NW3.88.9NW18.9
NNW17.6
WNW18.8
Case16NNW4.39.4NNW17.6
N21.2
NW18.9
Table 4. Platform geometry information.
SymbolUnit3CP4CP5CP6CP
PRM28.8728.2728.92528.8
AM50403428.8
Bm5555
Cm108.47.46.6
tm0.060.060.060.06
Hm32323232
Rm54.23.73.3
Draftm20202020
Table 5. Number of column factor along with α f .
N c α f [ d e g ]
315
40
5−9
6−15
Table 6. Platform properties.
PropertiesUnit3CP4CP5CP6CP
Platform masskg10,774,66010,006,3209,506,5508,770,500
Ballast masskg6,296,7015,480,0384,908,4424,210,174
Center of massm0.0135−0.0361−0.06460.0748
m0000
m−8.2792−7.7646−7.3385−6.5382
Table 7. 3CP inertia about objective’s center of mass.
Roll [kg-m2]Pitch [kg-m2]Yaw [kg-m2]
Roll [kg-m2]7,873,034,00001,364,109,000
Pitch [kg-m2]07,873,216,0000
Yaw [kg-m2]1,364,109,00006,173,251,000
Table 8. 4CP inertia about objective’s center of mass.
Roll [kg-m2]Pitch [kg-m2]Yaw [kg-m2]
Roll [kg-m2]7,510,412,00001,313,705,000
Pitch [kg-m2]08,315,060,0000
Yaw [kg-m2]1,313,705,00006,358,741,000
Table 9. 5CP inertia about objective’s center of mass.
Roll [kg-m2]Pitch [kg-m2]Yaw [kg-m2]
Roll [kg-m2]7,429,104,00001,331,743,000
Pitch [kg-m2]06,336,570,0000
Yaw [kg-m2]1,331,743,00006,538,849,000
Table 10. 6CP inertia about objective’s center of mass.
Roll [kg-m2]Pitch [kg-m2]Yaw [kg-m2]
Roll [kg-m2]7,391,877,00001,310,260,000
Pitch [kg-m2]08,375,042,0000
Yaw [kg-m2]1,210,260,00006,538,145,000
Publisher’s Note: MDPI stays neutral with regard to jurisdictional claims in published maps and institutional affiliations.

