1. Introduction
A case study approach was chosen to identify the determinants affecting energy consumption in the Saudi residential building sector. In conjunction with site visits, a literature review explored the theoretical and evidential context. Secondly, the topographical, geographical, and climate factors impacting energy consumption in residential buildings were explored, using the chosen building focusing on one climatic zone within Saudi Arabia.
In 2014, KSA was ranked among the 10 countries with the highest energy consumption per capita [
1] and was also ranked as one of the 10 most CO
2-emitting countries in the world [
2]. Despite the forward-looking strategies that seek to build sustainability into Saudi energy policies, the Saudi energy market is in a state of flux; it must deal with the comparatively elevated cost of alternative energy sources, compete with environmentally friendly products, and engage in raising public awareness of the need to be more energy efficient while managing the public’s expectation of cheap energy [
3]. The residential building stock, mostly constructed at a time when cheap energy resources were taken to be inexhaustible, has created a deep-rooted energy wastage problem [
4]. According to the State Minister of Energy Affairs, Abdulaziz Bin Salman, in 2015, 70% of buildings lacked thermal insulation [
5].
Although the rise in the cost of energy has raised awareness of the need for energy efficiency, and respondents to a survey of Jeddah householders reported their biggest problem was how to lower electricity costs by lowering energy consumption, 80% of 396 respondents stated their comfortable temperature range was 19–24 °C and most would not accept temperatures above 25 °C [
6]. Although the high subsidies that have kept energy prices low are now being withdrawn, their residual effect has been to discourage investment and research into energy efficiency measures [
3]. The government has reduced the subsidies and plans, by 2025, to permit international market forces to set the price for energy and water. To cushion the impact of removing the subsidies, the state will continue to provide support—of an average 1000 Riyal per month—to low income families [
7].
Before air conditioning had become the norm, basic passive principles of thermal comfort were applied to homes in Saudi Arabia. Well ventilated houses, up to five or more stories tall, gave protection from solar heat. Narrow streets and alleys provided shading throughout most of the day. Walls with high thermal mass served a dual purpose of storing heat for cooler periods and "storing coolness" for hot periods [
8]. Many years before it was proven in a study by Ghiai et al. [
9], home owners understood the importance of the correlation between energy consumption, thermal comfort, and the window-to-wall ratio (WWR). In their study of the ratio, Ghiai et al. indicated that it has a significant effect on a building’s energy consumption and confirmed that its maximum impact occurs in a southerly aspect in hot and dry climates.
Oil revenues in the mid-1950s marked Saudi Arabia’s first period of rapid economic growth. The outcome of dramatic increases in prosperity and input from ARAMCO’s architects and engineers was modern designs for villa-style houses [
10], which became a standard pattern for the urban development of the state [
11].
Government assistance—free plots of land and interest-free loans—made it possible to build more and bigger houses [
12], in a modern grid pattern and villa style [
13]. The traditional enclosed private courtyard was supplanted by a building surrounded by open space and exposed to the climate. Some aspects of traditional house design were discarded; the building envelope became magnified, and the aspect of shade and protection from the elements was arguably sacrificed to the prestige of owning a large home with large rooms set in a private plot.
Seventy years on, with the validation by science of climate change, sustainability has become a watch-word across social and economic disciplines. Between 1984 and 2004, against a background of a mean annual increase of 2% in primary energy consumption and 1.8% in CO
2 emissions, the Intergovernmental Panel on Climate Change raised public awareness concerning the environmental implications of energy usage, and increased research into energy consumption in buildings. Esbati et al. [
14] singled out the optimization of energy consumption in homes as one of the pillars of realizing sustainable development. This goal has taken on added significance because the Saudi economy cannot fully reap the benefits of globalization while applying protectionist policies to limited fossil fuel resources. Fuel subsidies are being gradually eliminated in Saudi Arabia and Iran [
9].
Methods and strategies that successfully reduce traditionally high energy consumption in residential buildings have become an invaluable aspect of forward-looking national energy planning. Esbati et al. [
14] argue that accounting for “the smallest details” can significantly impact the consumption of energy in a building and, by extension, help reduce national consumption. Similar to the home builders of the 1940s, Esbati et al. [
14] point out that the “orientation and the location of the building,” the location of peripheral spaces such as courtyards, and relatively inexpensive thermal insulation methods using phase-change material improve a building’s energy efficiency. Esbati et al. [
14] emphasize modifications in house design to meet the demands of a housing market, which, by the complete removal of subsidies in 2025, is likely to reward energy efficiency. Felimban et al. support the need, reflected in this research, to formulate a set of “architectural redesign and retrofitting parameters for self-sustainable buildings” [
6].
Efficient energy optimization can be achieved by using energy storage materials in the outer walls of the buildings. Esbati et al.’s. [
14], study used phase-change material (PCM) as thermal insulation by incorporating them within layers of the walls and the ceiling. In place of the passive reduction in cooling load provided by compact materials and low ratios of building surface to volume described above, Esbati et al. [
14] researched the use of phase-change material to optimize energy efficiency by using energy storage materials in a buildings’ outer wall. They illustrated the efficacy of deploying phase change materials (PCMs) in building envelopes and showed how they reduce heating/cooling loads.
Taleb [
15] researched the efficacy of applying passive cooling strategies to improve thermal performance and to reduce energy consumption in residential buildings in the hot arid climate of Dubai. Energy simulation software tested eight passive cooling strategies. Taleb emphasized the importance of well-designed envelopes for cooling air movement and informed orientation decisions complimented by suitable landscaping and roof insulation in the form of green roofing. Energy saving wind towers provided fresh air as a low carbon ventilation system; these measures combined to reduce the cooling load by 9%.
As the government adapts fiscal policy to reduce energy subsidies, and economic policy permits market forces to establish energy price equilibria, the construction industry may respond by altering the size and layout of residential homes. Consumers in turn will adapt their consumption patterns in the face of more expensive electricity and look for passive thermal strategies to save money. The construction industry may be pushed to examine the characteristics of a specific area’s climate and respond by providing passive solar climate design types. More compact, well designed building envelopes may be combined at the design phase with judicious investment in materials with a high thermal mass. The outcome may be price inflation for the cost of newly built homes. As the market gains greater sway in fixing the true market cost of goods, consumers will be motivated to demand improved quality in building design and materials. In the long run, as consumers in well insulated homes are able to reduce energy consumption and save on their bills, CO2 emissions will decrease, and the government will have saved energy resources.
In 2010, the Saudi Energy Efficiency Center was set up in response to high levels of domestic oil consumption. Altogether, 28% of all energy used in the country is consumed by the building sector, making it the second-highest energy-consuming sector after industry. Collectively, the two sectors (buildings and industry), along with transportation, make up 96% of domestic energy use. Buildings consume 75% of electrical energy, and 70% of this demand is specifically for air-conditioning [
16]. The findings of this study may be relevant to achieving reductions in energy consumption by targeting existing buildings [
17]. Felimban et al. point out that poor thermal building design is a consequence of subsidized energy bills and the expectation of affordable AC units [
6]. Improving existing buildings can be achieved by enhancing their thermal properties and then applying active retrofit measures on a case-by-case basis.
If Felimban et al.’s prediction that Saudi consumers will not accept an energy solution that requires indoor temperatures to be set above 25 ◦C is accurate, then the energy retrofitting of existing dwellings may represent an incremental solution for reducing energy consumption. Krarti et al. [
18] evaluate the benefits of energy retrofit programs. Their analysis indicates that retrofit programs for existing KSA housing stock are cost-effective and offer a range of economic, environmental, and social benefits. To be effective—Krartia et al. estimate a reduction in annual electricity consumption of up to 50%—they must be targeted and take account of housing type (large villa, small apartment, etc.) as well as their vintage and location.
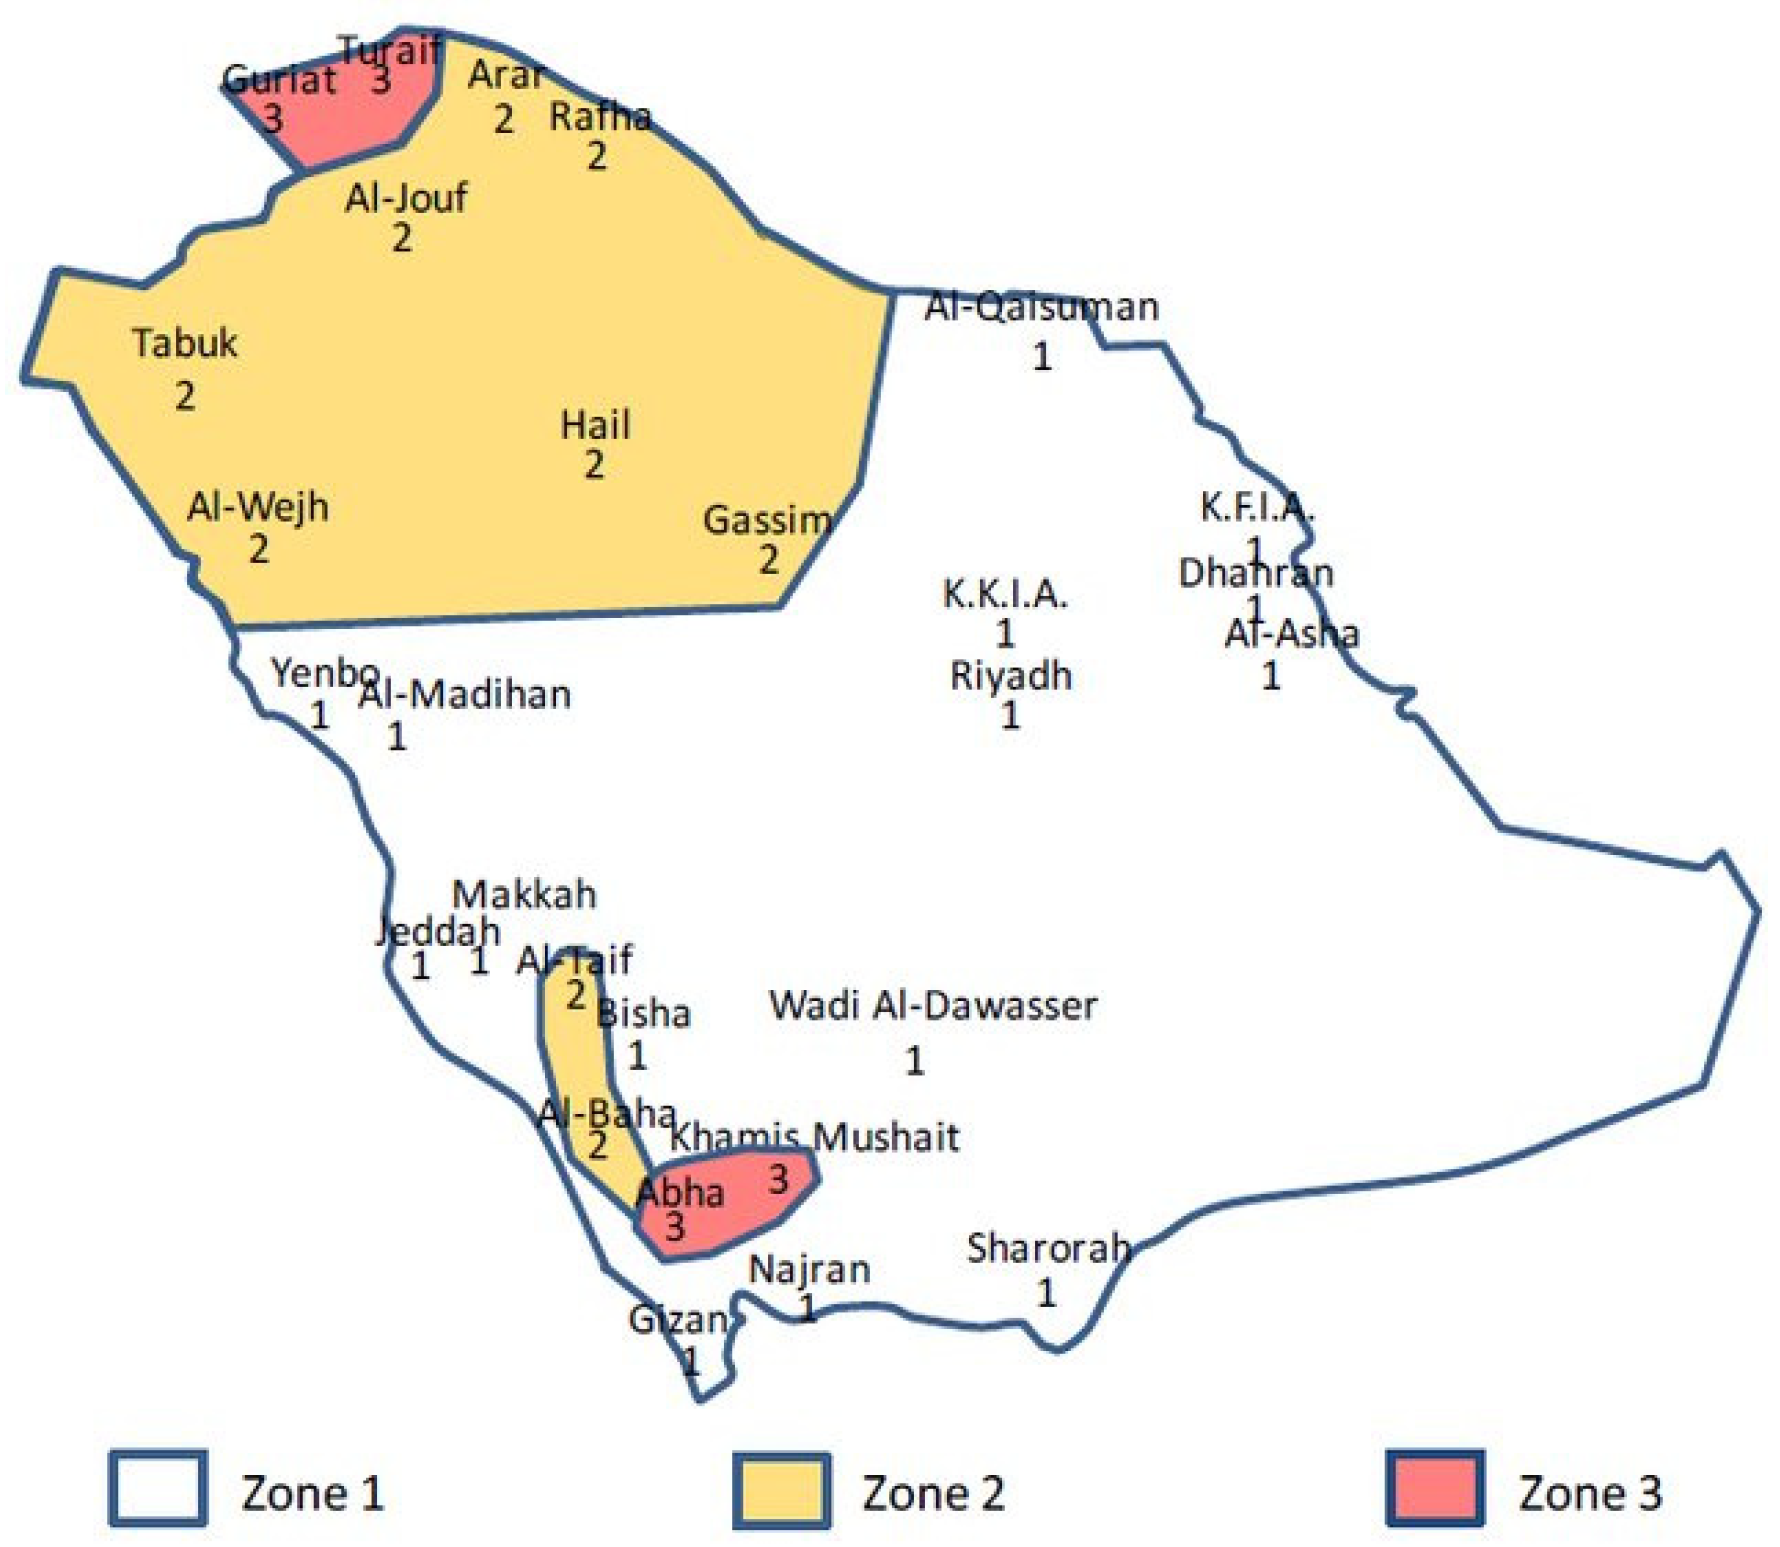
In 2018, regulatory building codes and the classification of violations were issued by the National Committee for the Saudi Building Code (SBC). The building regulations specify minimum requirements for designing and constructing energy-efficient low-rise residential buildings. Of particular focus are the maximum thermal transmittance U-values for residential building envelopes, including roofs, external walls, ground floors, as well as types of glazing, depending on climatic conditions (
Table 1) [
19]. Buildings are placed under three climatic zones based on location (
Figure 1).
Building energy performance is determined by the building size and location, envelope design, air-conditioning and lighting system design, occupancy patterns, and meteorological and topographical conditions. The building envelope in particular has a significant impact on the energy performance of residential buildings. Heat flow is affected by the characteristics of the building materials, wherein an appropriate building design lessens the heating and cooling requirements [
20,
21]. Efficiently designed envelopes greatly improve thermal performance, particularly for envelope-load-dominated buildings, the opposite of the closely packed traditional dwellings of the 1950s described above. The low thermal mass of modern homes makes them vulnerable to outdoor conditions [
22]. A variety of strategies will reduce the use of air-conditioning, including reduced glazed areas, greater levels of thermal mass, and naturally ventilated buildings. Other architectural features influence the interior environment and energy consumption, including external shading devices, double-skin facades, the glazing type, resistive insulation, green roof systems, and the orientation of the building [
23].
Modeling and measuring are two approaches used for examining the thermal performance of a building. Though the shortcomings of modeling can be overcome by calculating indoor temperatures, this process is costly and time-consuming and is therefore rarely used [
24]. When calculating human health risk and thermal comfort, indoor temperatures must be estimated. This is a necessary step also because of their relation to energy consumption within the created environment [
25,
26].
The main aim of this research is to assess the indoor thermal performance of a residential building in Makkah, Saudi Arabia, and to make recommendations for improvements. The primary focus is on lowering the dependence on mechanical cooling systems. The design strategies and building materials used in the construction of the house are reviewed to identify those most suitable for the climate zone in Makkah in particular and in the country in general. The research objectives presented below were developed to achieve these research aims.
2. Methodology
The interior environmental conditions in the case studies building were monitored by measuring selected thermal environmental variables during two major fieldwork sessions, using instruments and computer modelling for both summer and winter periods. The physical measurements and computer modelling findings were verified using the calculated root mean square error (RMSE) and normalized mean bias error (NMBE) methods, wherein the results should lie between ±30% and ±10%, in respect of a model with hourly figures as per ASHRAE guidelines [
27]. The next stage required the identification of methods to improve building fabrics, which could be incorporated into innovative design plans for energy efficient residential buildings. The current study employed thermal analysis software (TAS) to identify residential building materials suitable for hot climates [
28]. The house was constructed in 2008 and is located in the Alsharaya District east of Makkah (
Table 2).
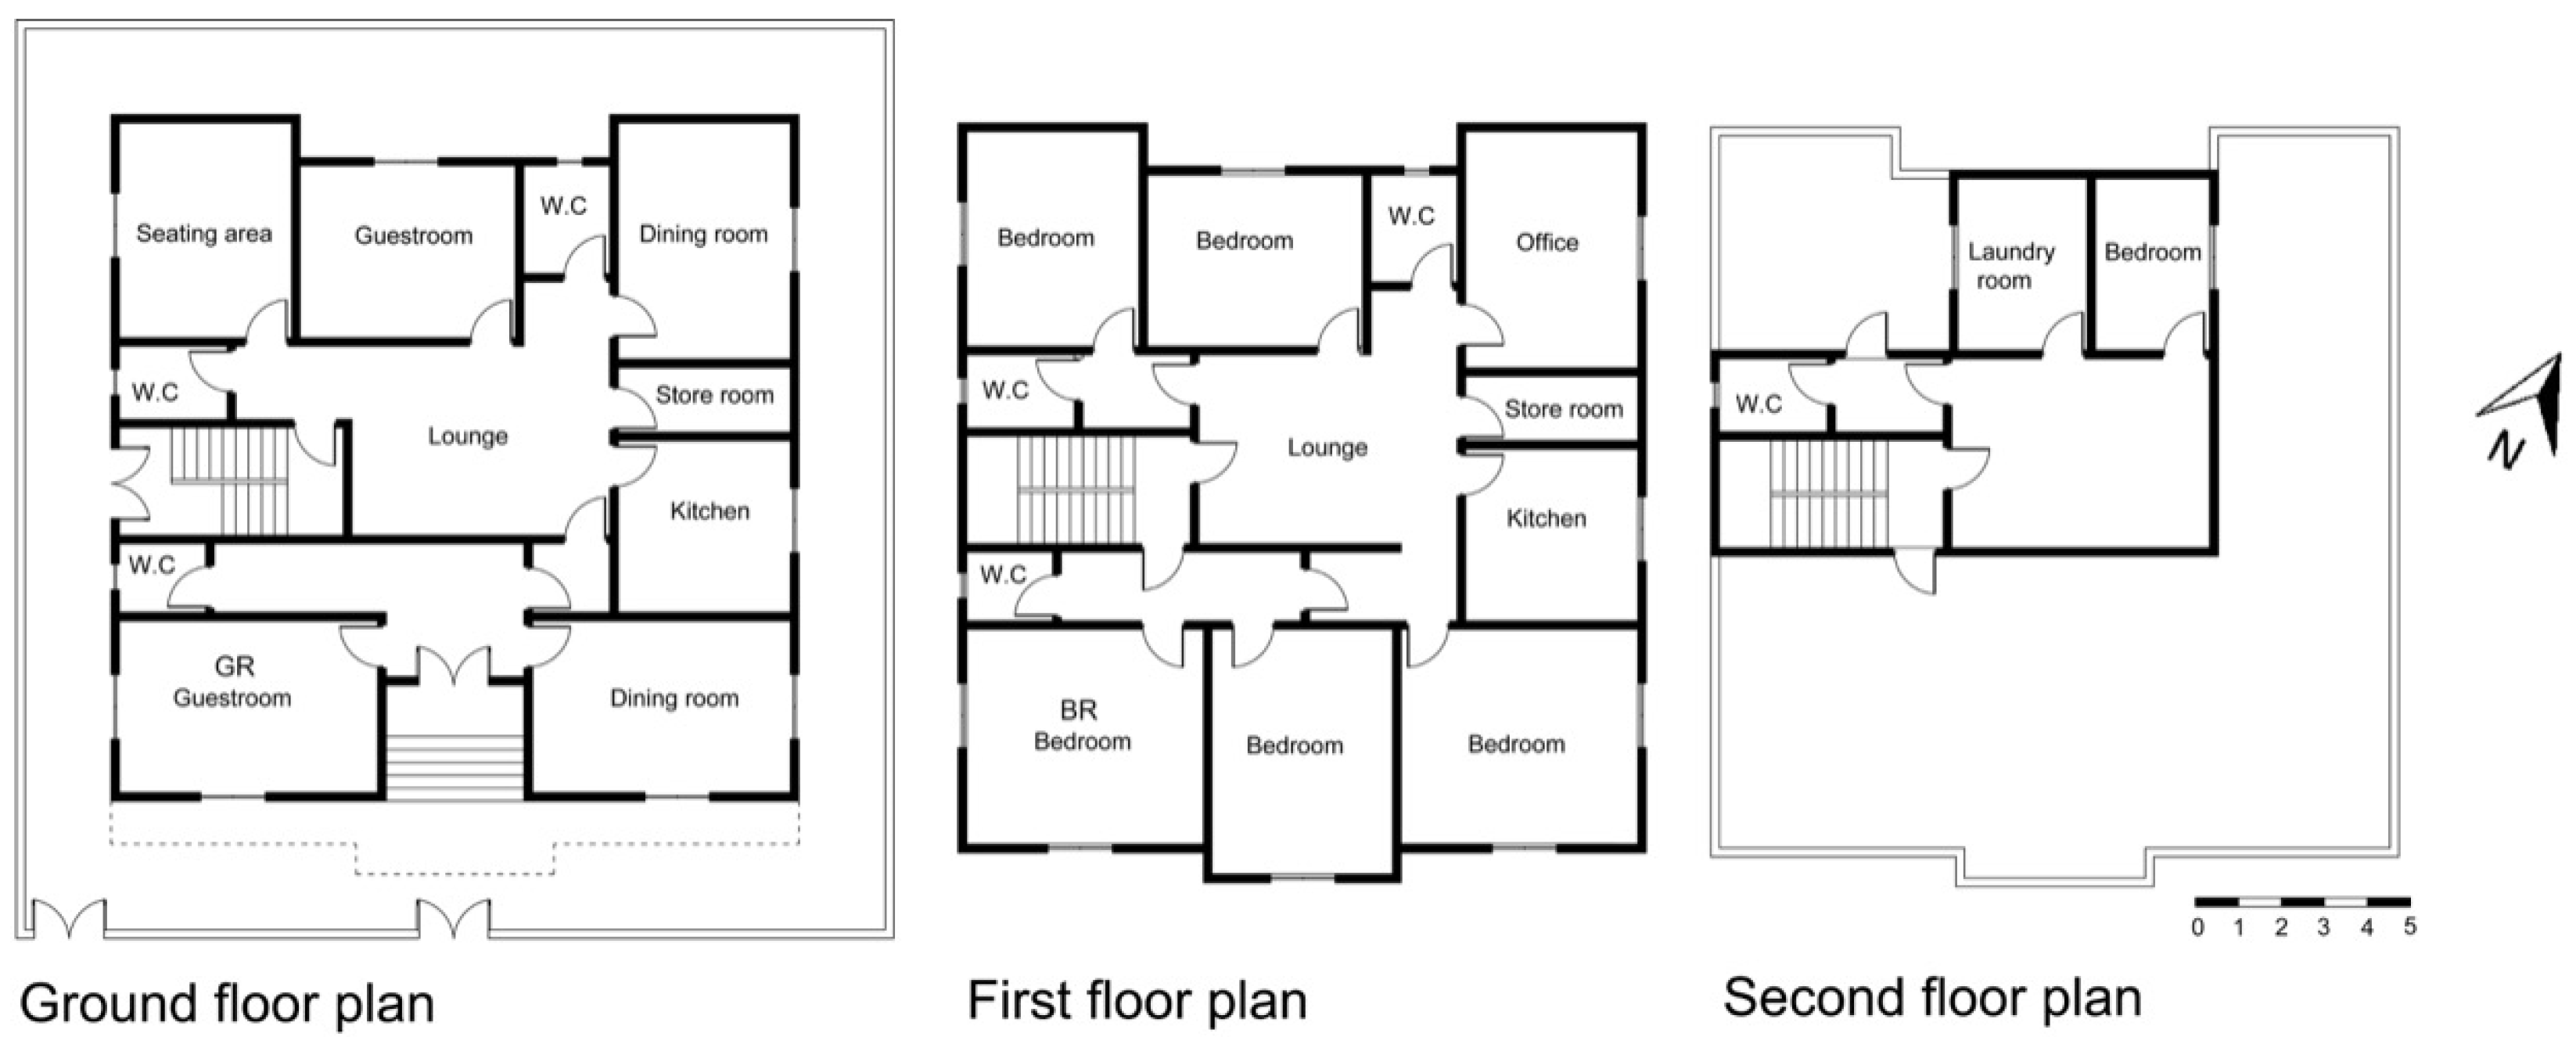
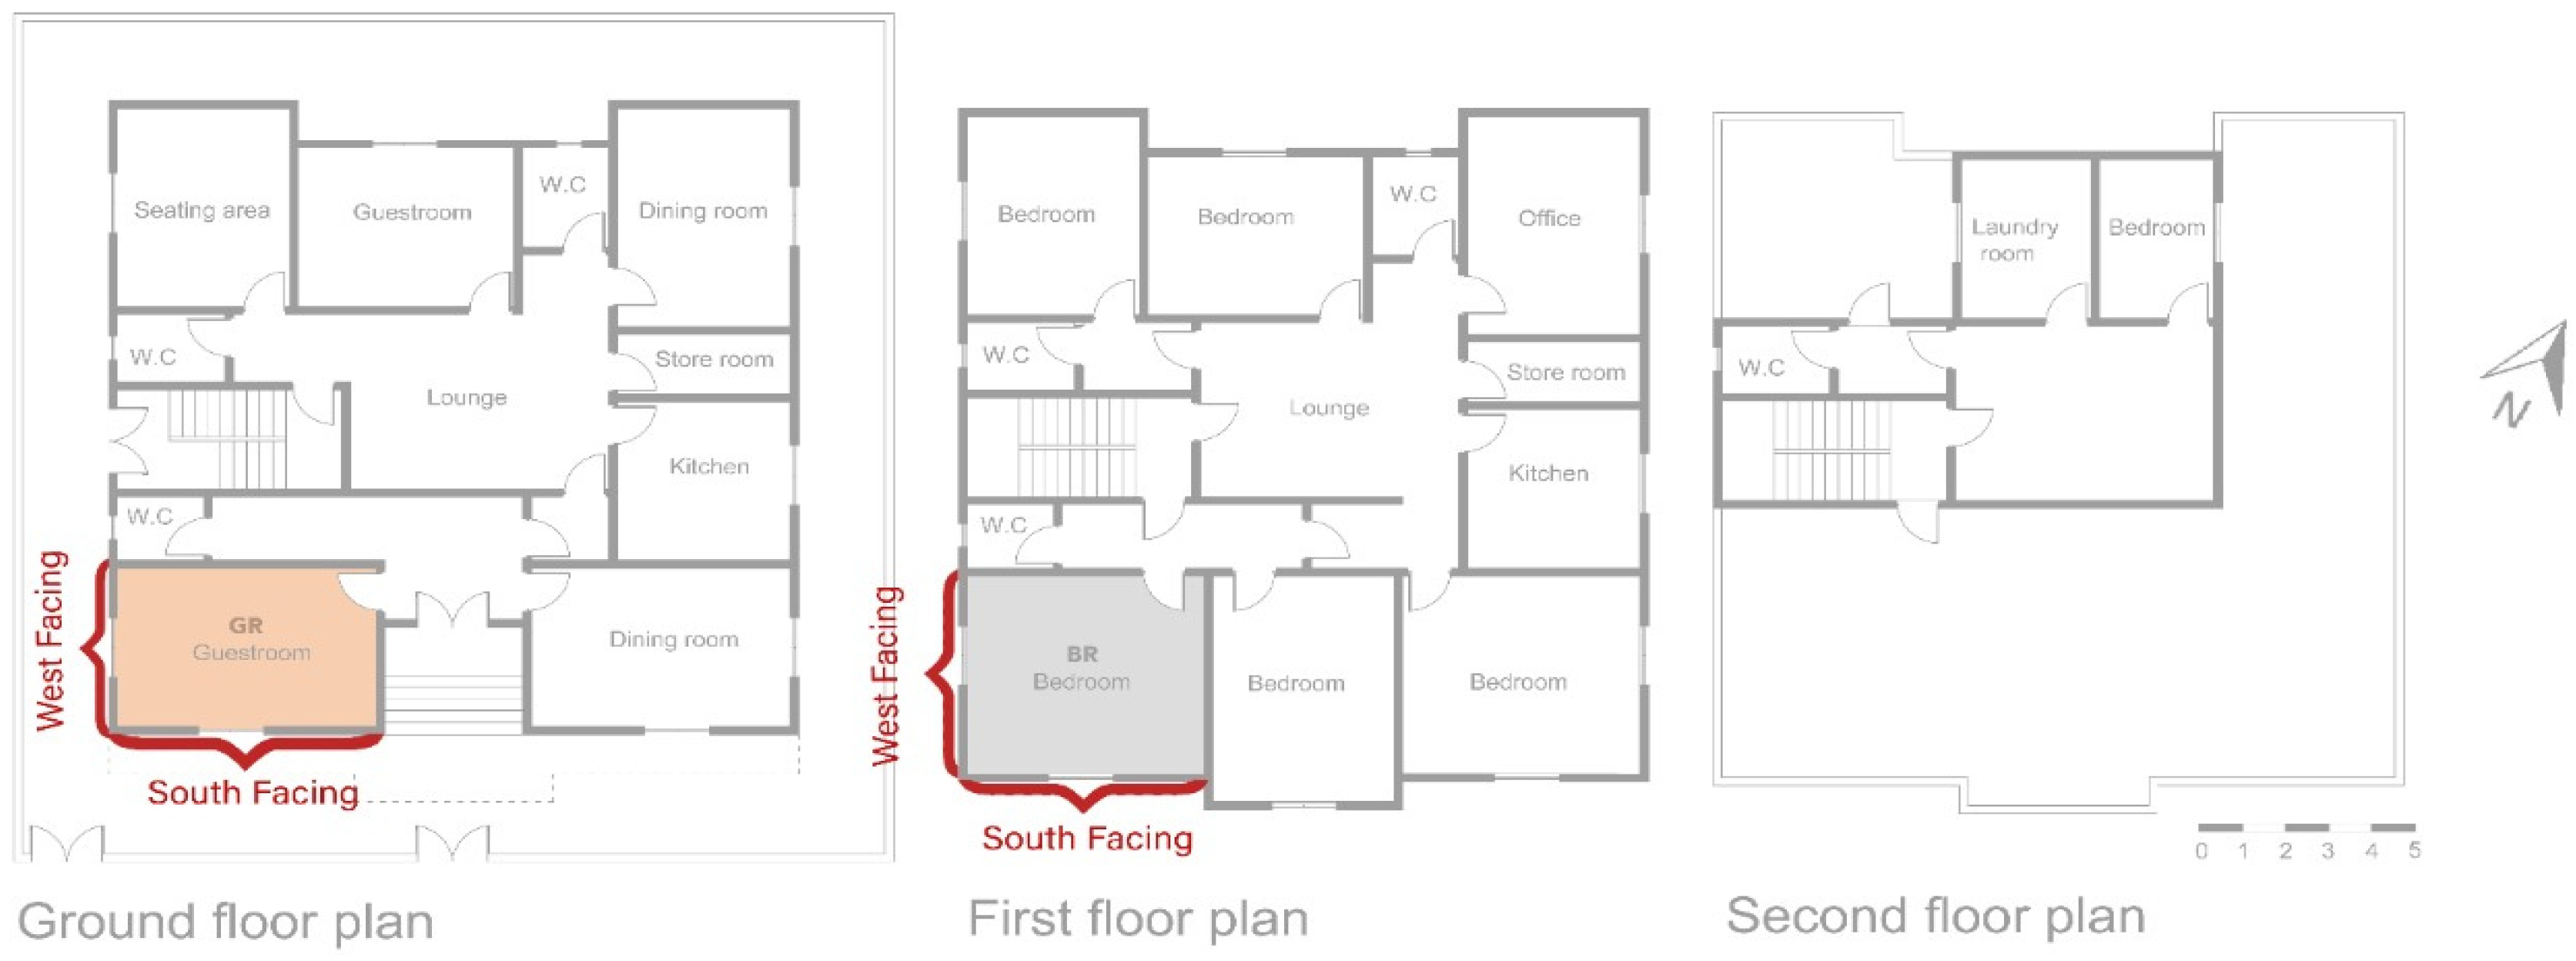
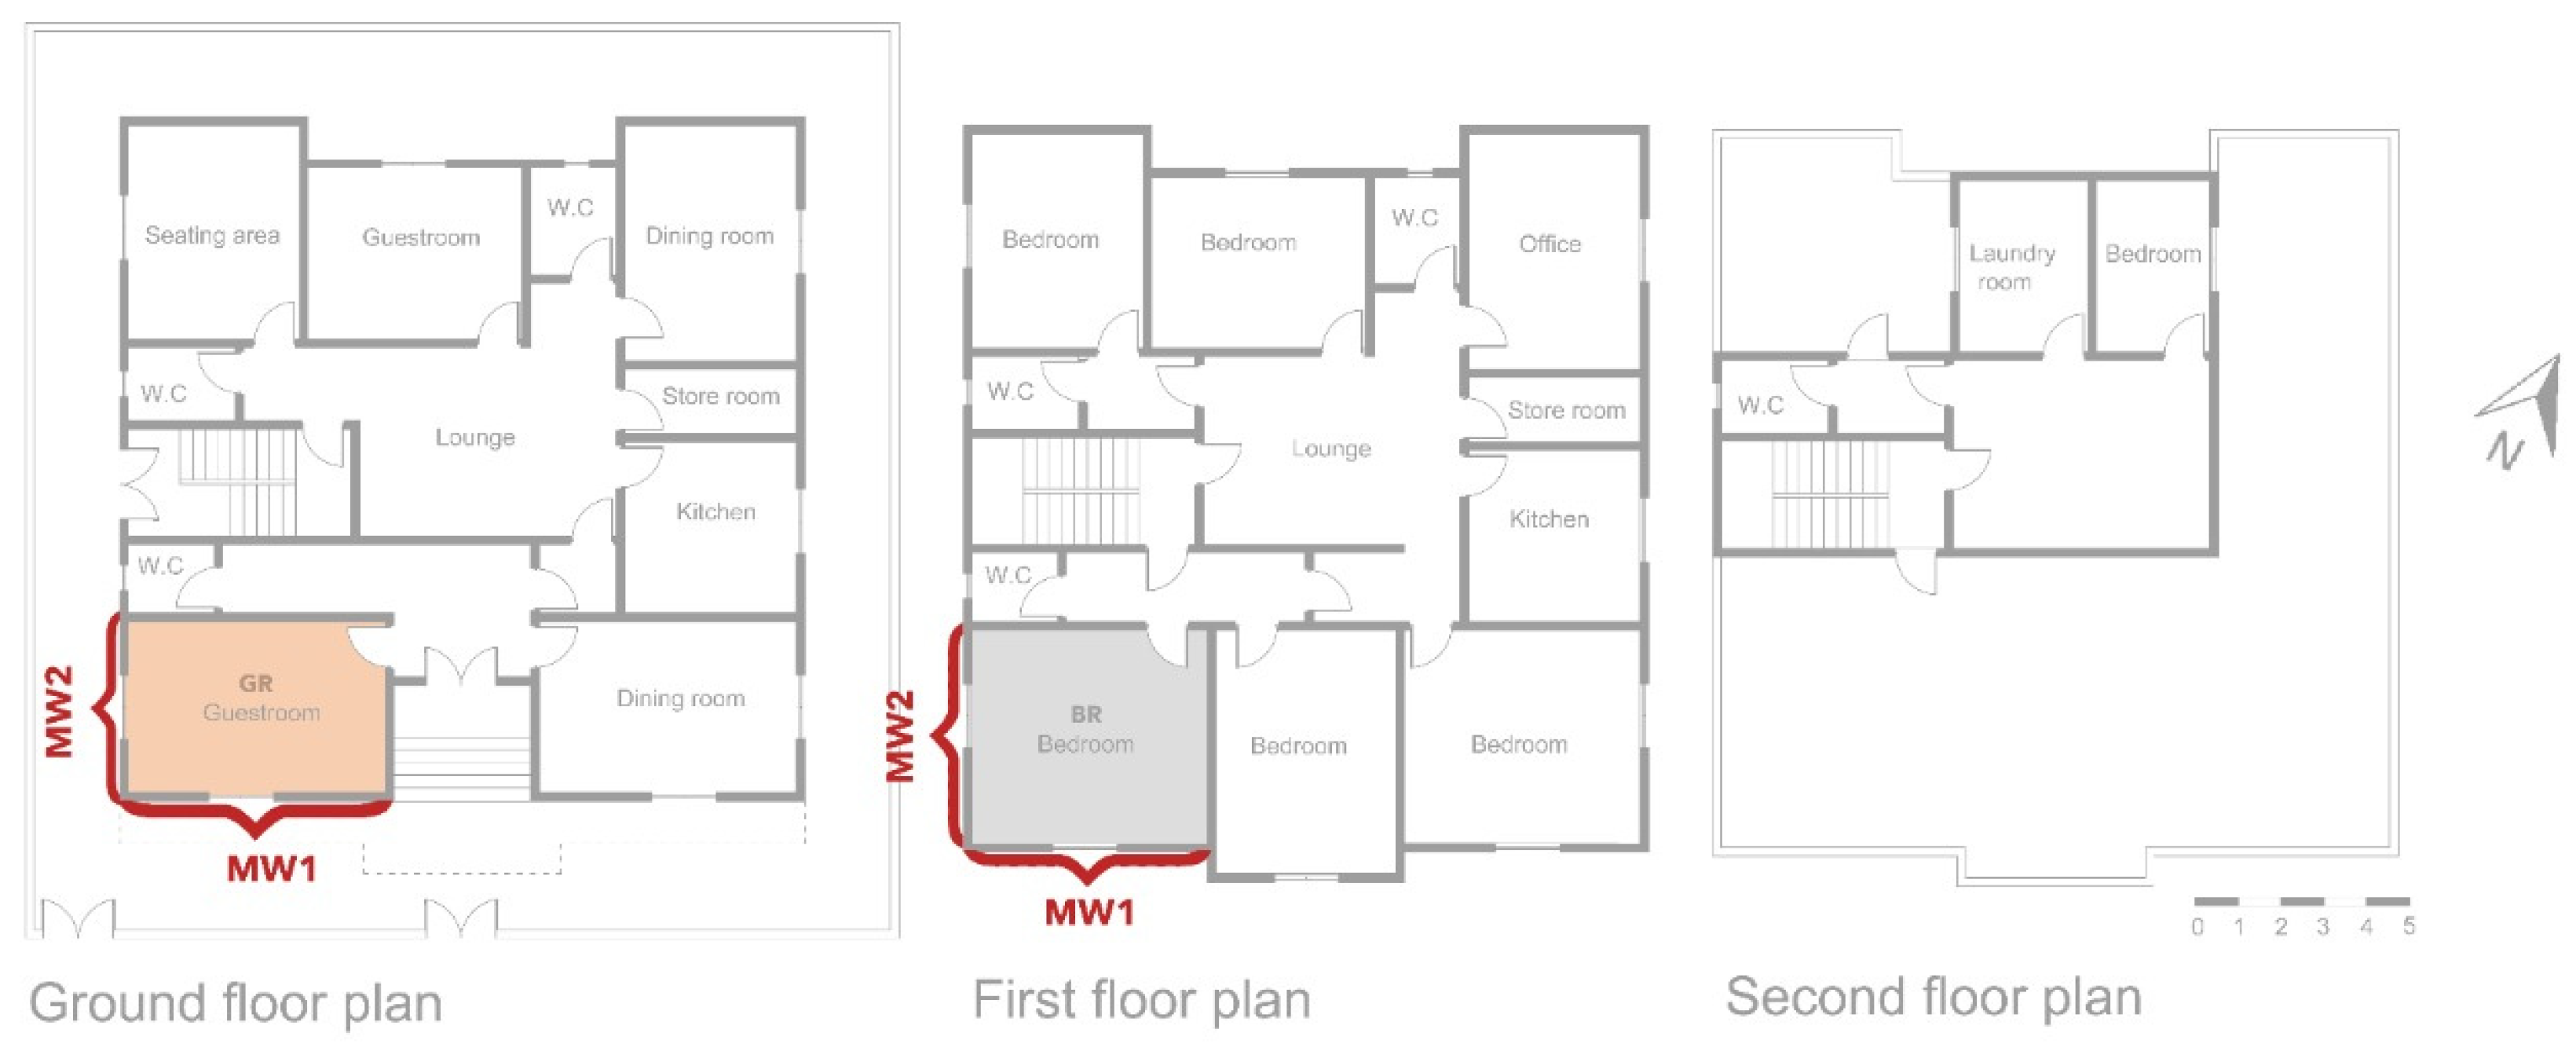
The architectural drawings for the house in Makkah show two entrances on the ground floor—a rarely used guest entrance in the front and a frequently used occupant entrance to the side. The ground-floor plans show a male guest bathroom, a female guest bathroom, two dining rooms, one occupant bathroom, one bedroom, one kitchen, and one storage room. This is a typical house layout in the KSA. The first-floor plans encompass an en-suite master bedroom, four additional bedrooms, a storage room, two more bathrooms, and a family seating area in the center. The second floor has a housekeeper’s bedroom, bathroom, and laundry room, which cover less than 30% of the floor area. The remaining 70%+ of the second-floor floor space does not have defined rooms, as KSA regulations state that houses may only have two built-up floors (i.e., ground and first floors) with only a few third-floor (i.e., second-floor) rooms (
Figure 2).
The building examined in this research utilized the same construction materials throughout.
Table 3 below depicts these materials as per the official construction plans. Most existing residential buildings are constructed with the same or similar building fabrics. For example, walls used are either red hollow concrete block or hollow concrete block. It can be seen that their U value is quite high, as they lack thermal insulation, compared with the values demonstrated in
Table 1.
This study was located in the Makkah climatic zone, characterized by extremely hot summers and warm winters. Knowledge of the climate is vital for improving the structural energy performance. The following section presents the related climate data in graph form.
2.1. Air Temperature
Year-round, the temperature ranges between 20 and 42 °C. The hot season lasts from May to September, and the winter season lasts from December to February, with average monthly temperatures of 36 and 25 °C, respectively, for the two seasons [
29].
2.2. Solar Radiation
The seasons vary substantially regarding the average daily incidence of solar radiation, with an average daily solar radiation of 7.3–8 kWh/m
2 during the summer and 4.7–5.4 kWh/m
2 in winter. Makkah has between 11 and 13 h of sunlight in a 24 h period, varying according to the season [
30].
2.3. Humidity
The average monthly relative humidity is roughly 60% in winter and 40% in summer [
29].
2.4. Precipitation
Precipitation does not occur frequently, but when it does occur in winter, it can reach a maximum of 22 mm. The annual average is 101 mm [
31].
2.5. Wind
Makkah’s location in a mountain valley gives it a yearly average wind speed of 1.4 m/s, ranging from 1.1 to 1.6 m/s [
29].
The specific tools used were chosen based on various properties, including reputation, cost, availability, features, accuracy, and accessories (see
Table 4 for the instruments used and their data).
A building’s thermal performance is affected by several variables, such as design parameters, the quality of materials, the climate, and inside activity. These variables can be examined using a variety of analysis tools, from thermal modeling programs to simpler approaches involving steady-state calculations or more complicated offerings that employ advanced calculation methods for a dynamic thermal response.
The house simulations were analyzed, and the measurements collated to validate the simulation and related measurement outcomes, and to help pinpoint problems with current residential buildings. Additionally, this step could boost the thermal performance of the building by recommending several energy efficiencies.
The thermal analysis software used to model the building—EDSL TAS version 9.4.2 produced by Environmental Design Solutions Limited—was used to simulate thermal performance. Primarily, the software evaluates environmental performance and energy consumption. To simulate the thermal performance of a structure, TAS takes a vital approach closely tied with dynamic simulation. In this way, the building’s thermal state is tracked across several hourly snapshots, offering the user an in-depth view of the structure’s performance throughout a 12-month period. In turn, the modeling process is clarified, as the user comprehends the building model’s different thermal processes [
28].
The software configured the thermal simulation and authenticated the fieldwork’s physical measurements. For the simulated energy model to accept the calculated root-mean-square error (RMSE) and normalized mean bias error (NMBE), each of these should be within ±30 and ±10%, respectively, for a model involving hourly figures using ASHRAE guidelines [
27]. This research used hourly temperature readings and estimated RMSE as well as NMBE. The recorded data were categorized in terms of winter or summer, and the values of the entire monitored temperature range were calculated for the monitored hours.
3. Result
3.1. Environmental Internal Condition (Monitored)
This section describes various internal aspects of the selected building affecting thermal comfort levels. It highlights several variables, including the indoor and outdoor dry bulb temperatures; floor, roof, and external wall surface inner temperatures; outdoor solar heat gain; and air velocity. All these variables were monitored using the equipment introduced in the previous section. In particular, air temperature is the most significant ambient factor affecting thermal comfort levels, leading to the use of air-conditioning to control indoor climate conditions. This section considers the existing internal environmental condition, as illustrated by the results obtained from the measurements taken during the field study.
This study used tools to measure environmental properties; site-monitoring data were analyzed to rate the design strategies of the case-study building and to establish indoor thermal performance. Most of the data collected were made up of indoor air temperature values from data loggers recording every 15 min. Hourly averages were then displayed across four days for both winter and summer. The loggers were positioned in the middle of the two rooms, at 1 to 2 m above floor level, and set in locations away from direct solar radiation and other heat sources. This analysis aimed to establish whether and how indoor air temperature was related to the building materials’ properties. The intention was to investigate the thermal performance of the house, and so two rooms were investigated during the 2018 winter and summer seasons. The durations of the indoor air temperature (IAT) monitoring periods were 74 and 71 consecutive hours in the winter and summer periods, respectively. In other words, the total number of IAT measurements collected amounted to 580 values across the two seasons—296 values in winter and 284 values in summer. This allowed for prevailing patterns to emerge in the absence of an A/C system for the two selected rooms.
In the course of this monitoring, specific environmental on-site variables were recorded. Spot measurements of the indoor air temperature (IAT), outdoor air temperature (OAT), globe temperature (GT), surface temperature of the internal floor (FIST), surface temperature of the internal roof (RIST), internal surface temperature of external walls (ISTEW), outdoor solar radiation, and outdoor air velocity were taken in specific areas relative to the case study building. Certain rooms were selected in the building for coherence for one day in winter and one day in summer, with three appointed measurement times: 9:00 a.m., 12:00 p.m., and 3:00 p.m.. Using these specific times, minimum and maximum temperatures were recorded, thus denoting the extremes of the outdoor conditions, and how the internal conditions were affected. The building envelope properties were analyzed using this spot data regarding the thermal performance of the building. Finally, measurements of the surface temperature of the internal floor (FIST) and surface temperature of the internal roof (RIST) were assessed to predict the amount of heat conducted through the ground floor and roof, respectively. Twelve spots were measured, and then an average was taken for each surface at the three appointed times in the chosen rooms in the case study building.
3.1.1. Indoor Air Temperature (Continuous Test)
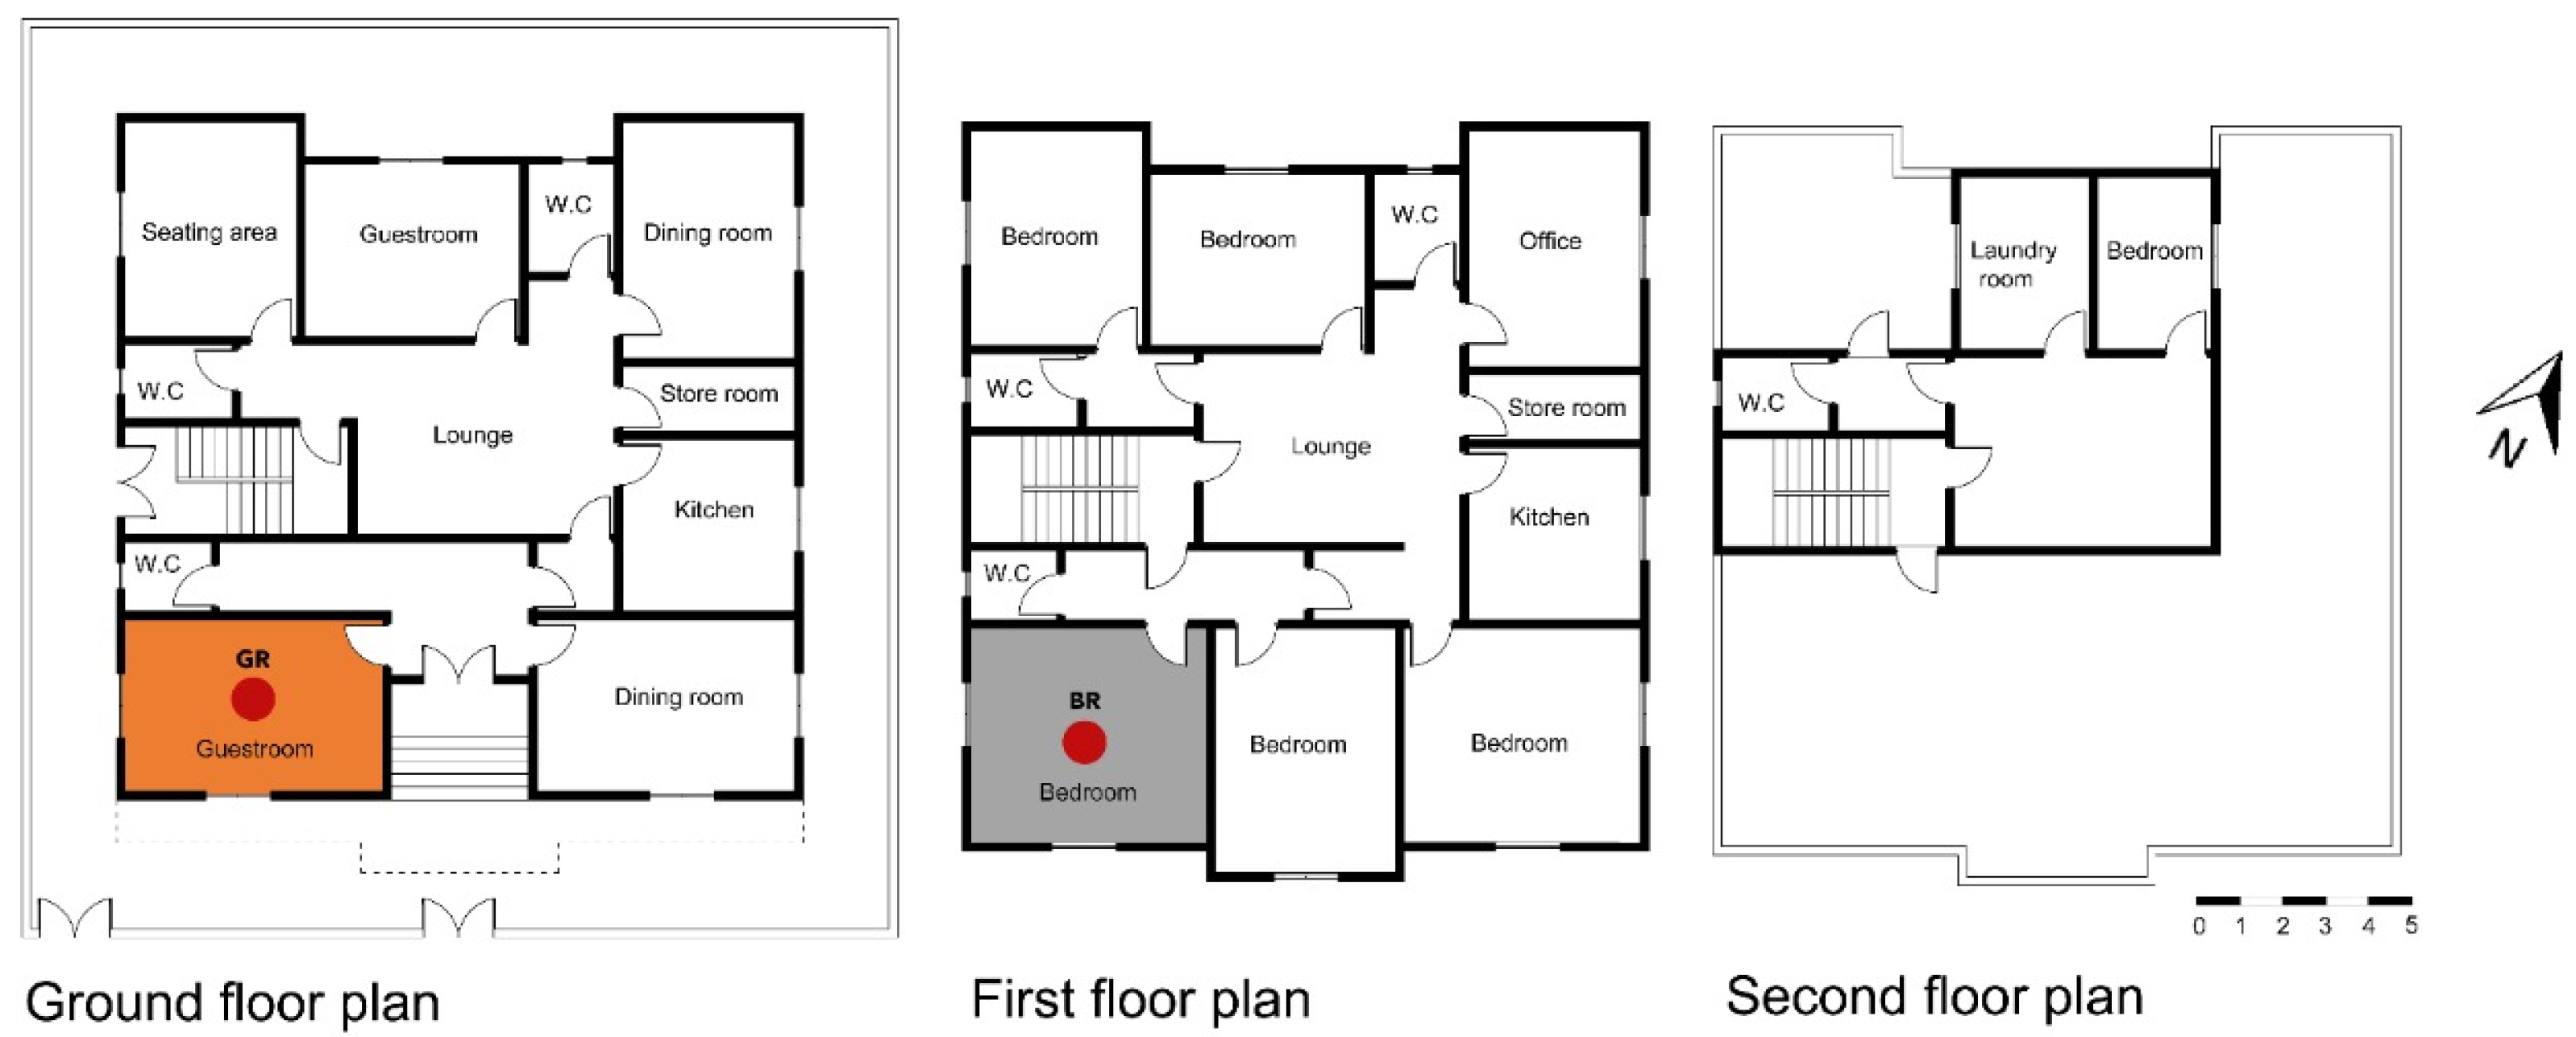
All the monitored rooms were free running in the course of the monitoring, allowing the surfaces to act freely and naturally, and the two rooms had no internal heat gain. The floor area of the ground-floor guest room (GR) is 23.2 m
2. The slightly larger first-floor bedroom (BR) has a floor area of 26.8 m
2. The bedroom is situated directly above the guest room; both have double external walls facing south and west. The bedroom is exposed to the outdoors via the roof. Both rooms have two single glazed windows with external shutters to block solar heat gain. Using World Weather Online, external temperature data were obtained from a weather station located nearby at a small airport east of Makkah (OEMK) [
32]. Temperature data loggers were positioned at two locations in the building for data collection purposes (
Figure 3).
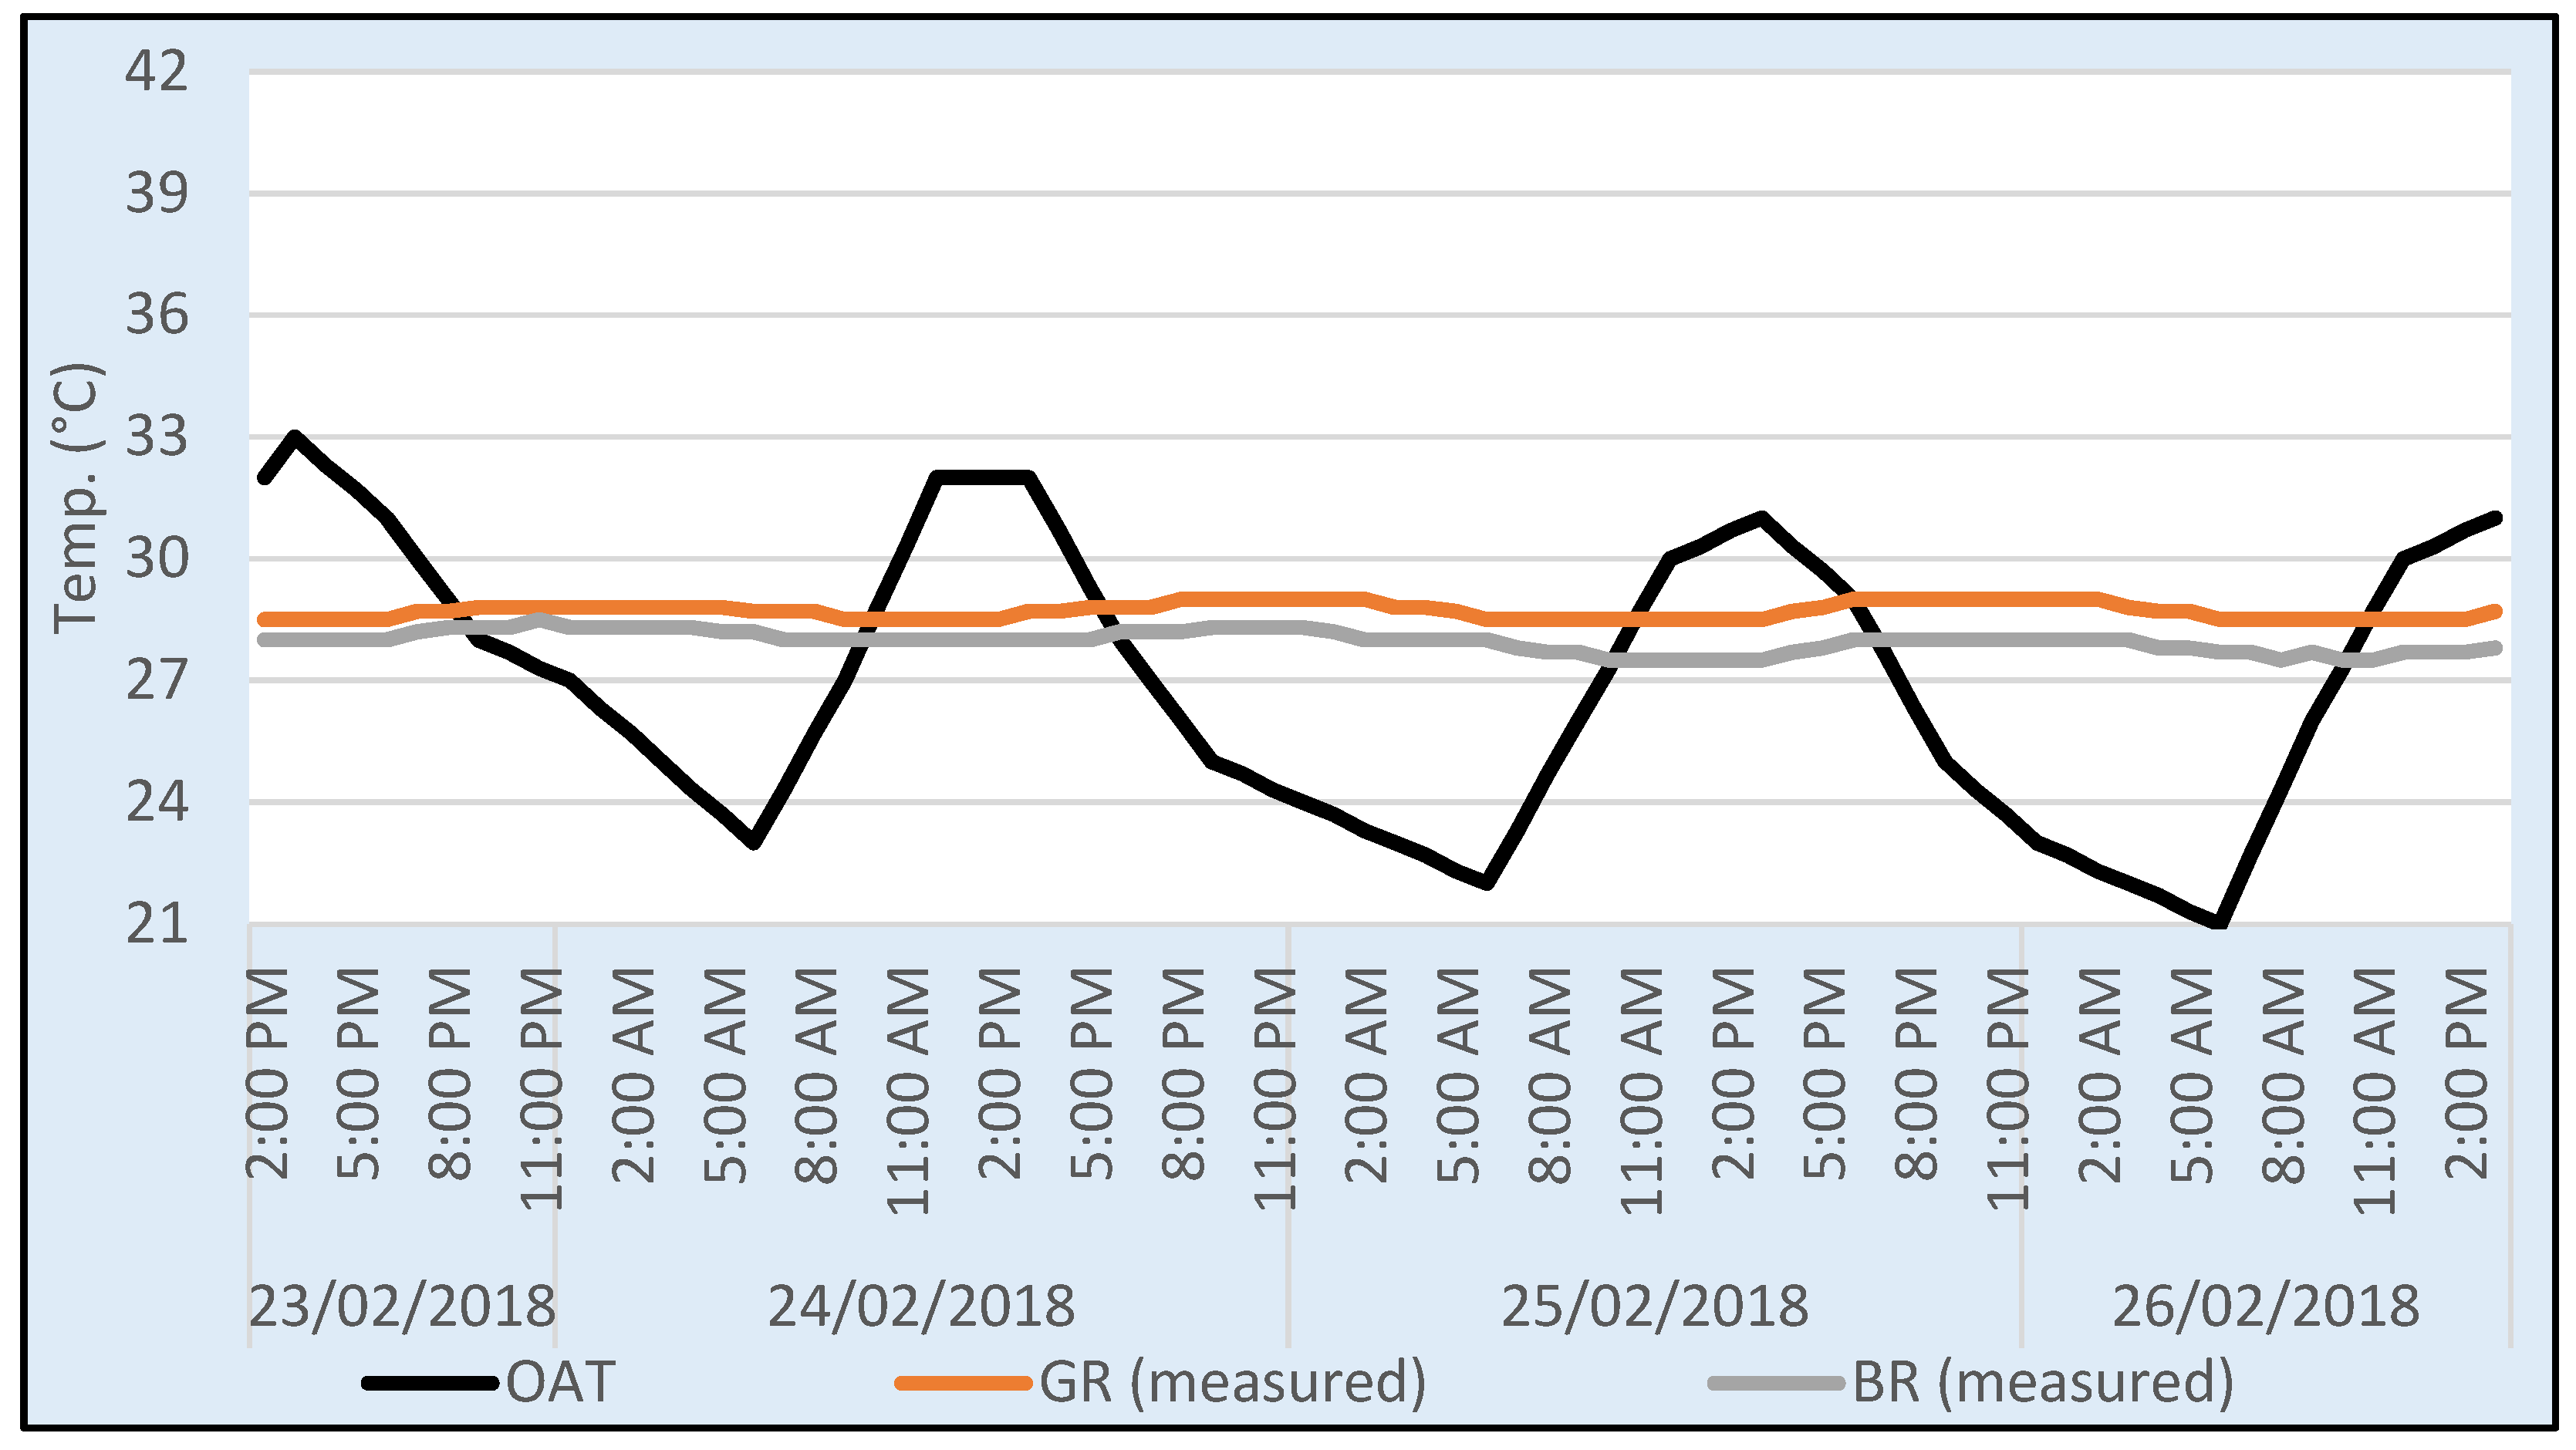
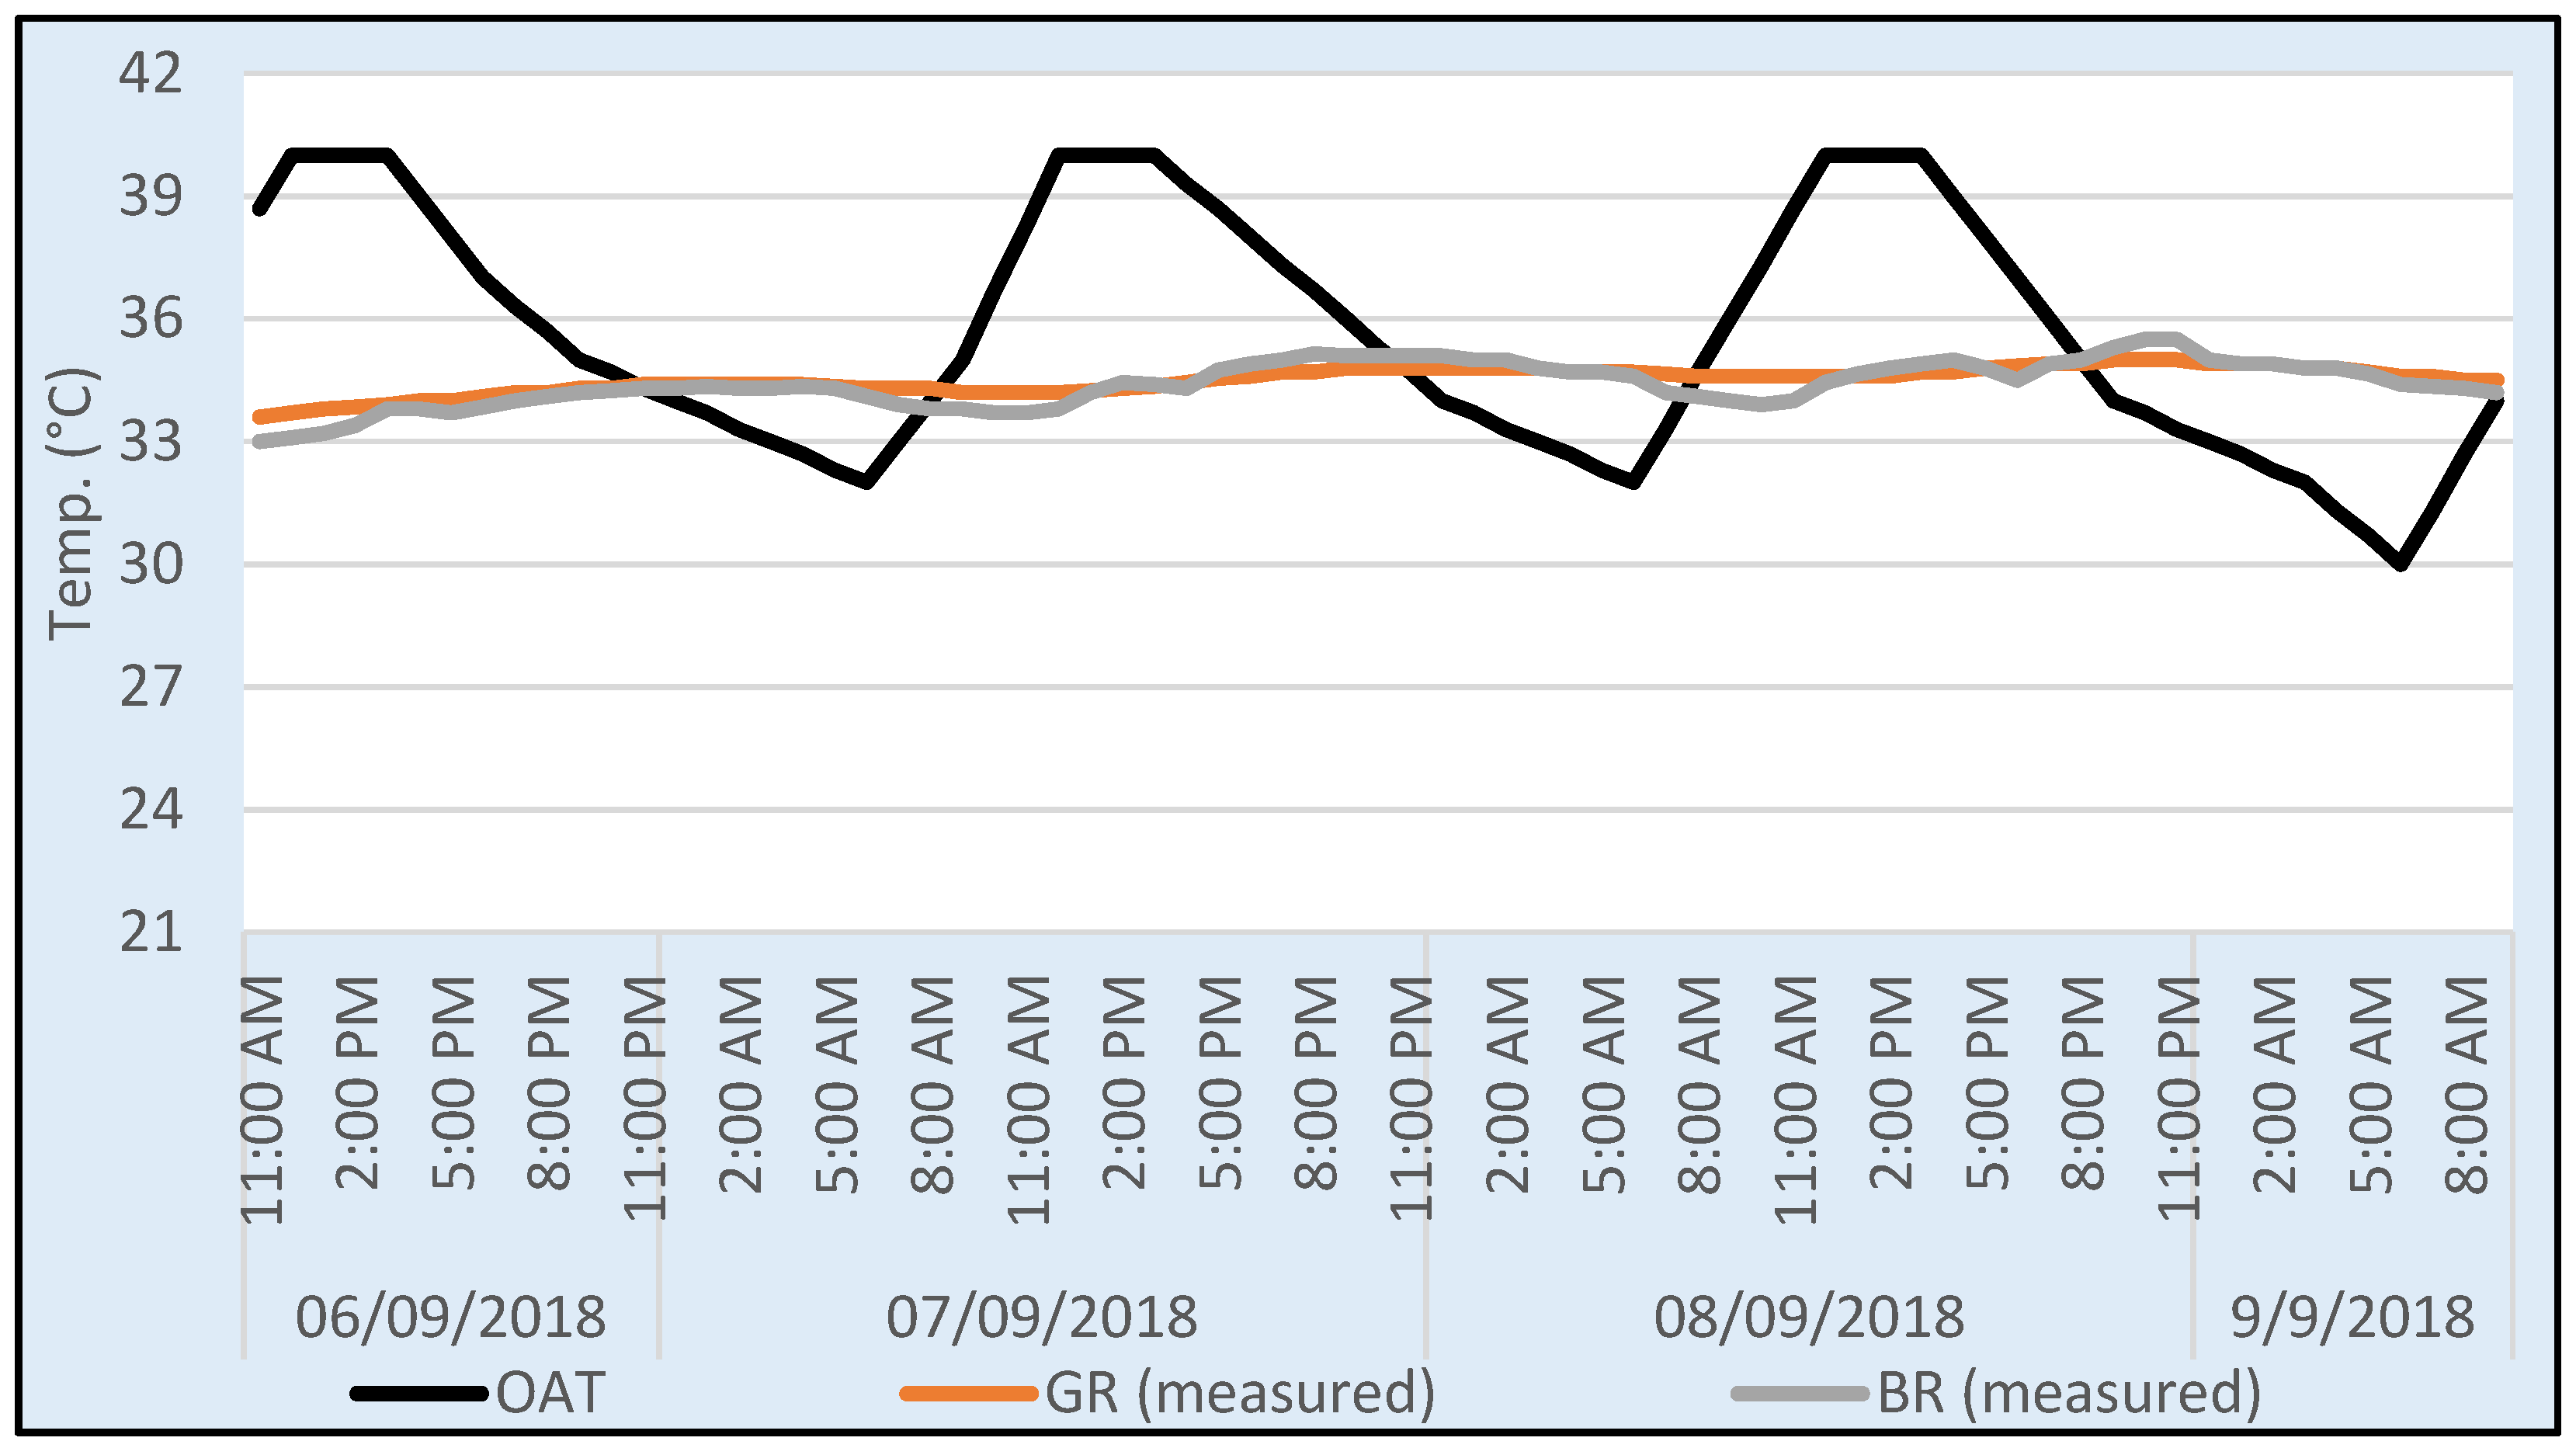
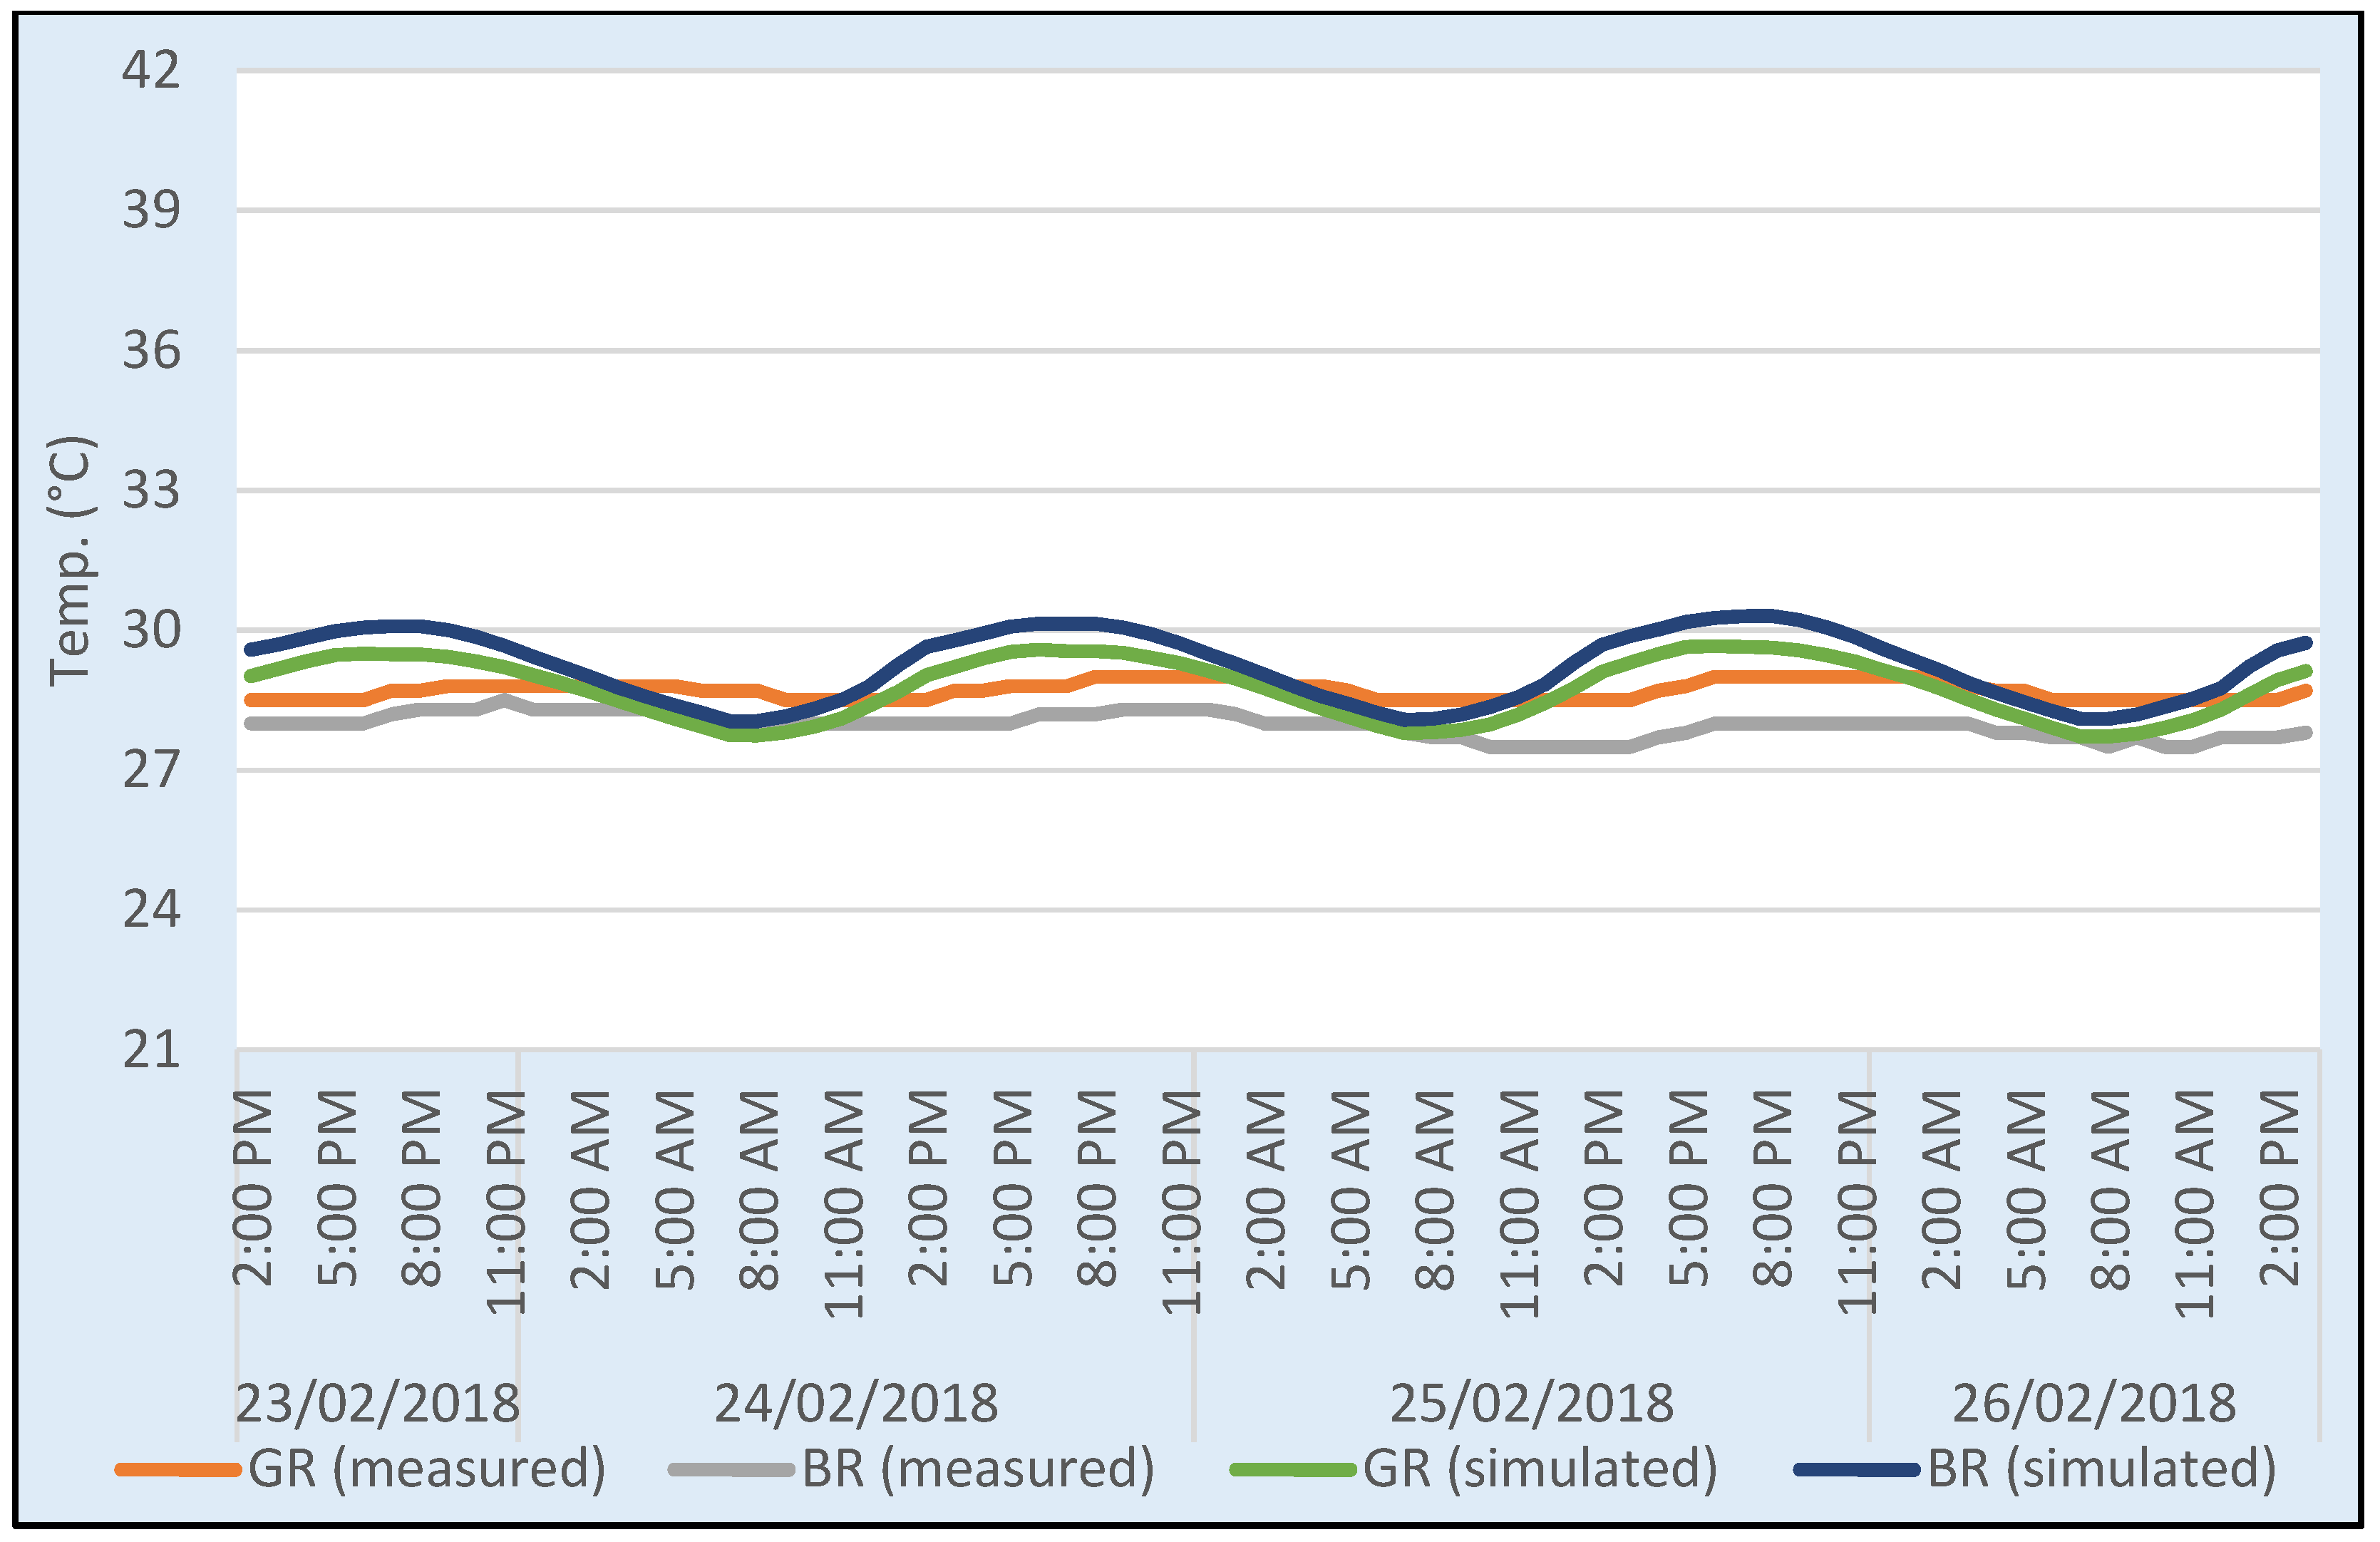
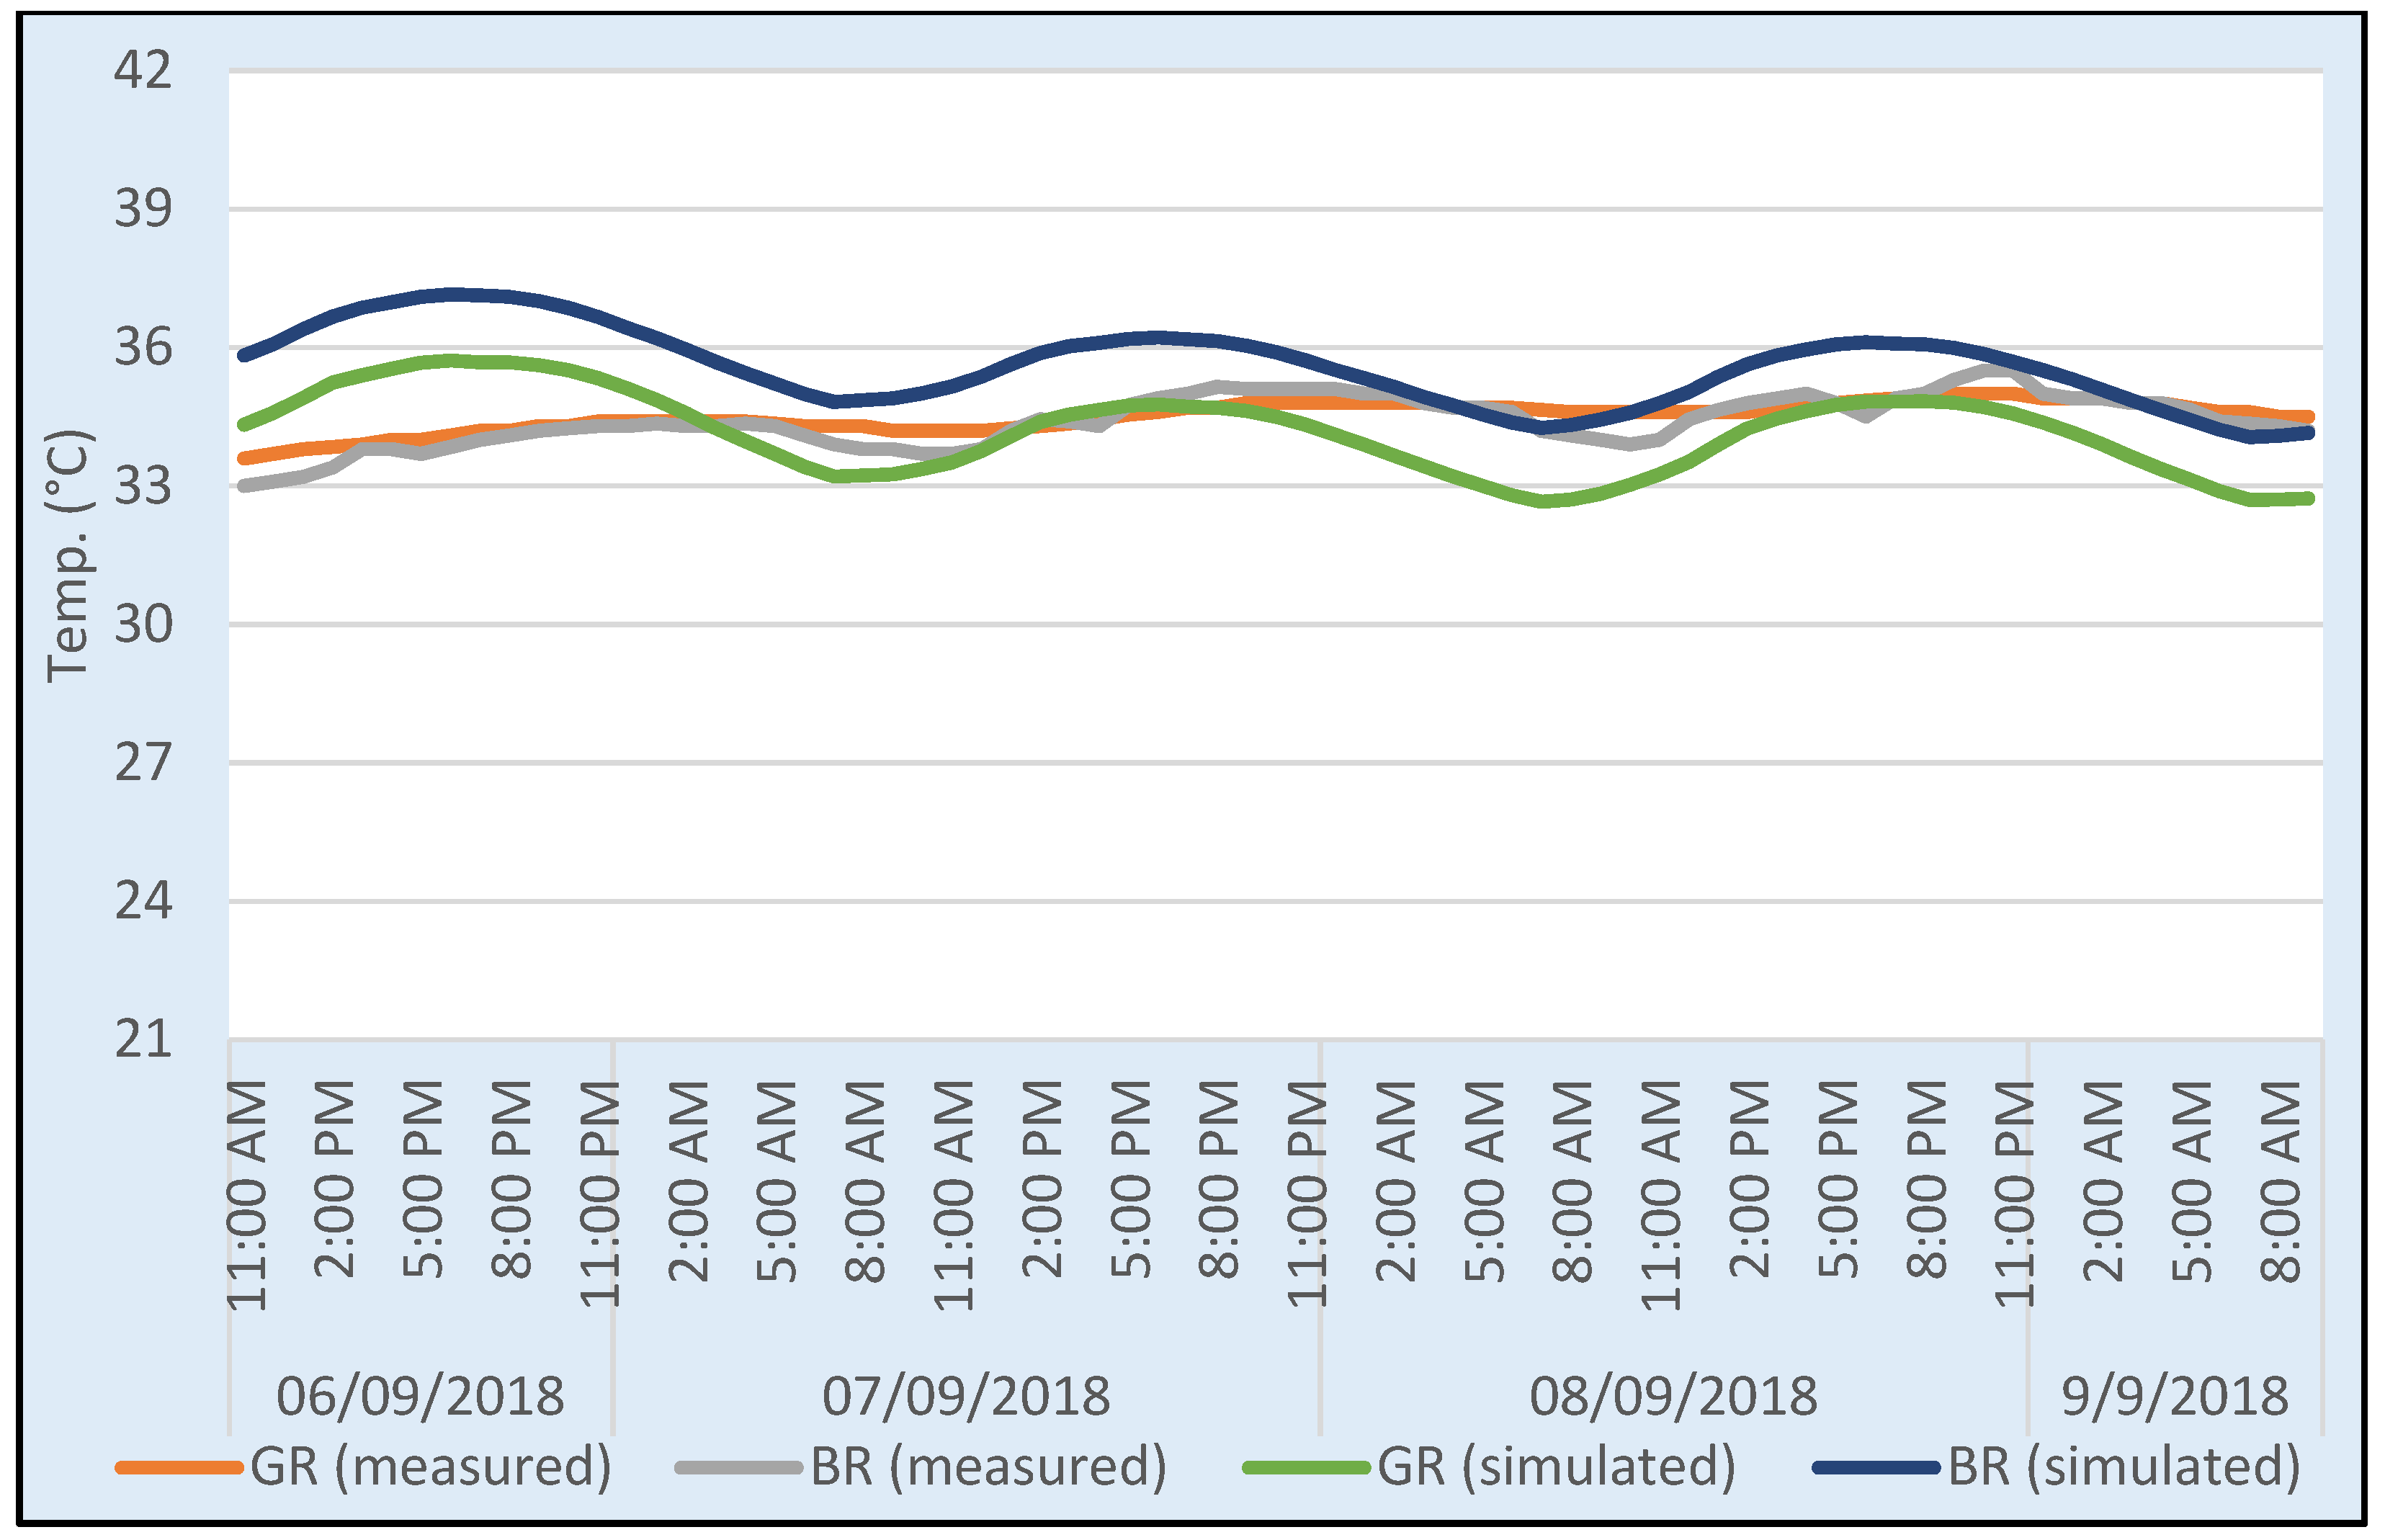
The air-temperature was monitored, and the data were analyzed with respect to indoor thermal conditions. A summary of the main recorded data is presented in
Figure 4 for winter days and in
Figure 5 for summer days.
Regarding winter, a review of the recorded data indicated that the outdoor air temperature (OAT) ranged between 21 and 33 °C. Typically, the OAT peaked in the afternoon (11:00 a.m. to 4:00 p.m.), with the lower temperatures recorded during the early morning period (2:00 to 8:00). The diurnal OAT—the difference between the daily maximum and minimum temperatures—ranged from 9 to 10 °C. Indoors, the temperatures for the two rooms ranged between 27.5 and 29 °C, and the difference between them was minor (1 °C). The lowest indoor air temperature (IAT) was recorded in the bedroom (BR) in the late morning and early afternoon of 25 February, and in the early morning of 26 February, whereas the highest IAT was recorded in the guest room (GR) from around sunset until after midnight on 24 and 25 February. Unlike the significant temperature fluctuations recorded outdoors, steady conditions were observed in both rooms, which had diurnal temperature swings of around 1 °C.
Regarding summer, a review of the recorded data indicated that the OAT ranged between 30 and 40 °C. Typically, the OAT peaked in the afternoon (11:00 a.m. to 5:00 p.m.), with the lower temperatures recorded during the early morning period (12:00 a.m. to 9:00 a.m.). Furthermore, the diurnal OAT was 8 °C. Indoors, the temperature for the two rooms ranged between 33 and 35.5 °C, and the difference between them was minor (2.5 °C). The lowest indoor air temperature (IAT) was recorded in the bedroom (BR) in the late morning period of 6 September, whereas the highest IAT was recorded in the bedroom (BR) on 7 September from after sunset until midnight. Unlike the significant temperature fluctuations recorded outdoors, steady conditions were observed in both rooms, which had diurnal temperature swings of around 1 °C.
Overall, the variation of the IAT was limited and constant. This constancy was attributed to the hot, arid climate conditions, considered to be one of the main reasons for not achieving greater variation in IAT. Finally, internal temperatures in both summer and winter exceeded the upper temperature limit of the thermal comfort level as set out by the SBC.
3.1.2. Environmental Variables (Spot Measurements)
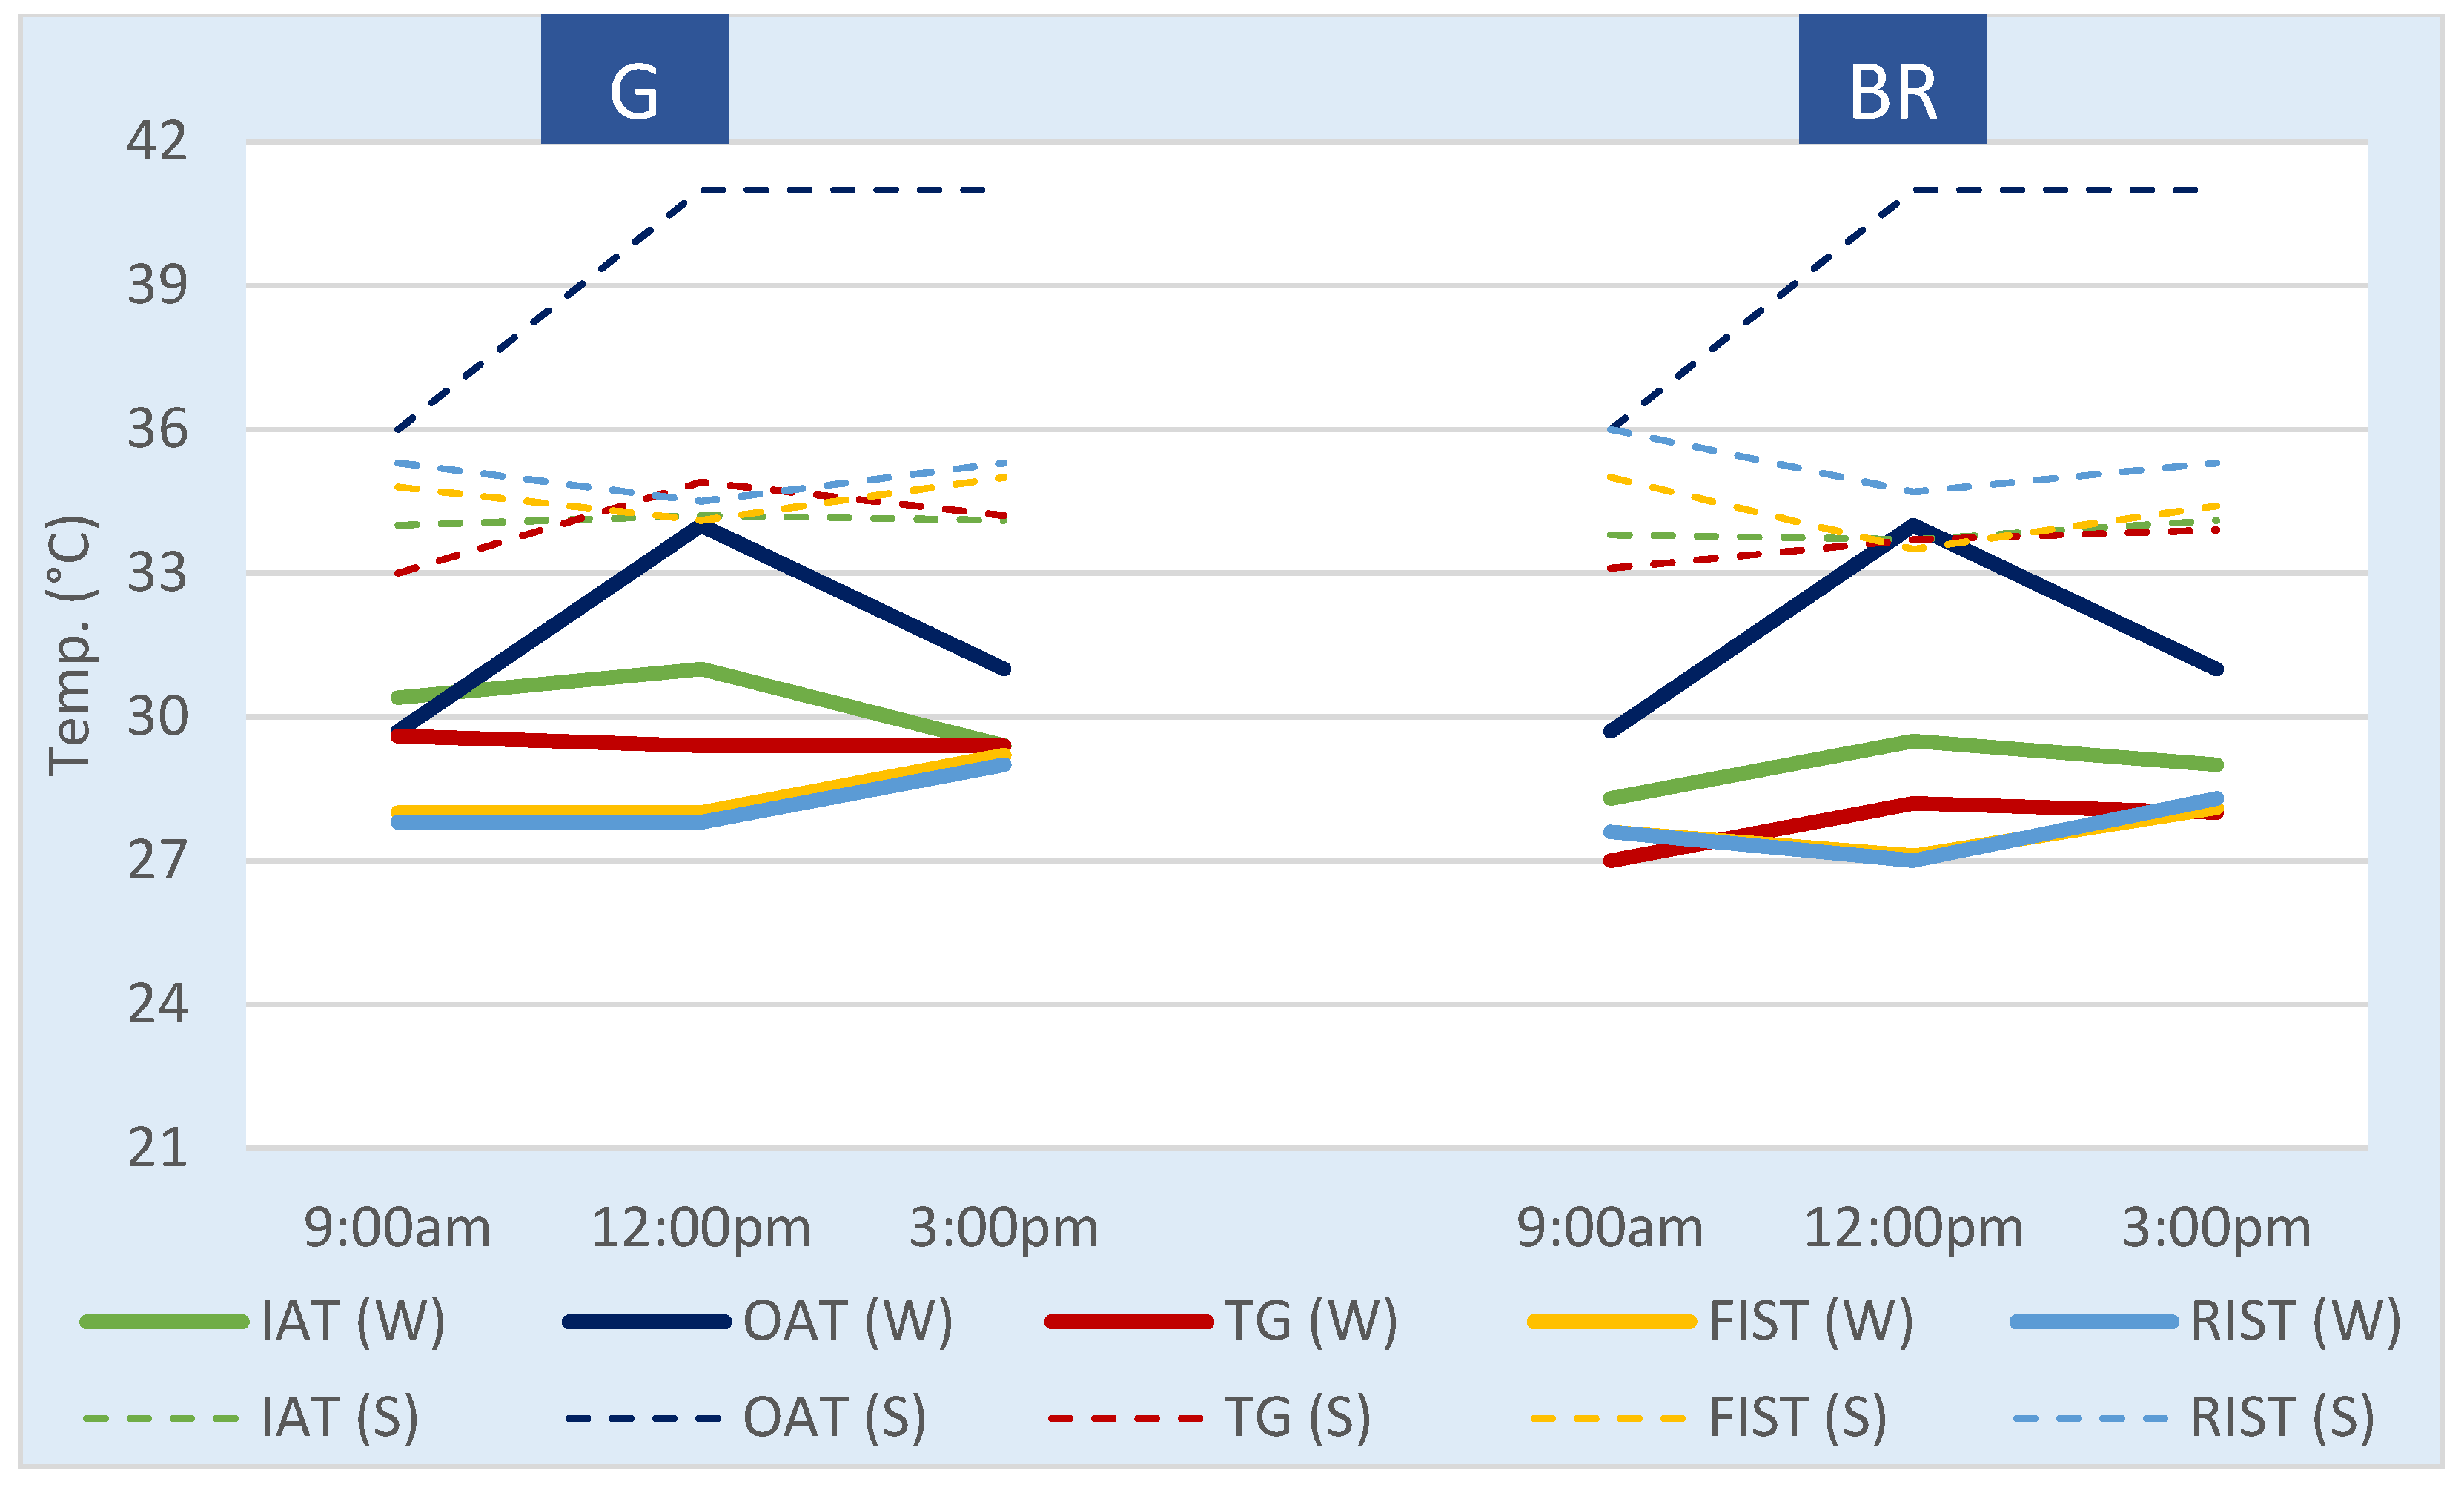
Spot indoor/outdoor air temperature, floor/roof indoor surface temperature, and globe temperature readings were recorded (see
Figure 6). Additionally, outdoor observations and measurements were taken (see
Table 5) to establish the extent of the impact of the building envelope characteristics on variations in indoor temperature.
On 26 February 2018, the winter outdoor air temperature rose by more than 4 °C by midday, compared with the first measurement taken, and dropped to 31 °C by around 3:00 p.m., due to partly cloudy sky conditions later in the afternoon. The indoor air temperature (IAT) for the guest room (GR) showed a consistent level at around 30.5 °C in the ground-floor room at 9:00 a.m. and 12:00 p.m., while by 3:00 p.m., the IAT dropped by 1 °C, which was consistent with the drop in the OAT. The globe temperature (GT) had a strong correlation with the IAT, but it was around 1 °C less than the IAT. The floor and roof internal surface temperatures (FIST and RIST) were identical at all times; at 9:00 a.m. and 12:00 p.m. they were 27.8 °C, and both of them rose by 1.2 °C by 3:00 p.m.. FIST and the surface temperature of the bedroom ceiling were more than 3 °C lower than IAT at 9:00 a.m. and 12:00 p.m., but at 3:00 p.m., all the variables, including GT, had the same temperature (29 °C). For the bedroom (BR), the IAT followed the same pattern as the OAT, where it rose from 28 °C in the morning to 29.5 °C in the afternoon, then dropped to 29 °C later in the afternoon. The globe temperature followed the IAT, but it was around 1 °C less than the IAT. The floor and roof internal surface temperatures were nearly identical at all times, including at 9:00 a.m. (27.5 °C) and 12:00 p.m. (27 °C), and they both rose by 1 °C by 3:00 p.m.. The surface temperature of the internal floor (FIST) and surface temperature of the internal roof (RIST) were 3 °C lower than the IAT at 12:00 p.m., but at 9:00 a.m. and 3:00 p.m., they were slightly lower than the IAT.
In summer, there was a noticeable variation in the temperatures compared with winter. This is comprehensible owing to the OAT swing. The outdoor air temperature rose by 5 °C by 12:00 p.m. and 3:00 p.m. compared with the first measurement taken at 9:00 a.m. because of the afternoon’s high-intensity solar radiation. The two rooms had quite similar patterns for all the variables. The single most striking observation to emerge from the data comparison was that the bedroom ceiling was 2.3 °C higher than the IAT at 9:00 a.m. and the same as the OAT, and then continued to be higher than the other indoor variables at 12:00 and 15:00 due to the vertical position of the sun. The surface temperature of the bedroom ceiling (RIST) was higher at 9:00 a.m. compared with the other two times in the afternoon because of the thermal mass of the roof construction, which absorbed and stored heat during the day, then released it at night when it became cooler.
In summary, the bedroom had a slight decrease for all the variables compared with the guest room, probably because the rooms adjacent to the guest room were freely running, while the corridor and rooms close to the bedroom were air-conditioned. The surface temperature of the guest room floor and the surface temperature of the bedroom ceiling increased later in the afternoon in the two rooms, despite the indoor and outdoor temperatures, due to the massive amount of heat transferred during the daytime through the two external walls in both rooms and from the roof in the bedroom.
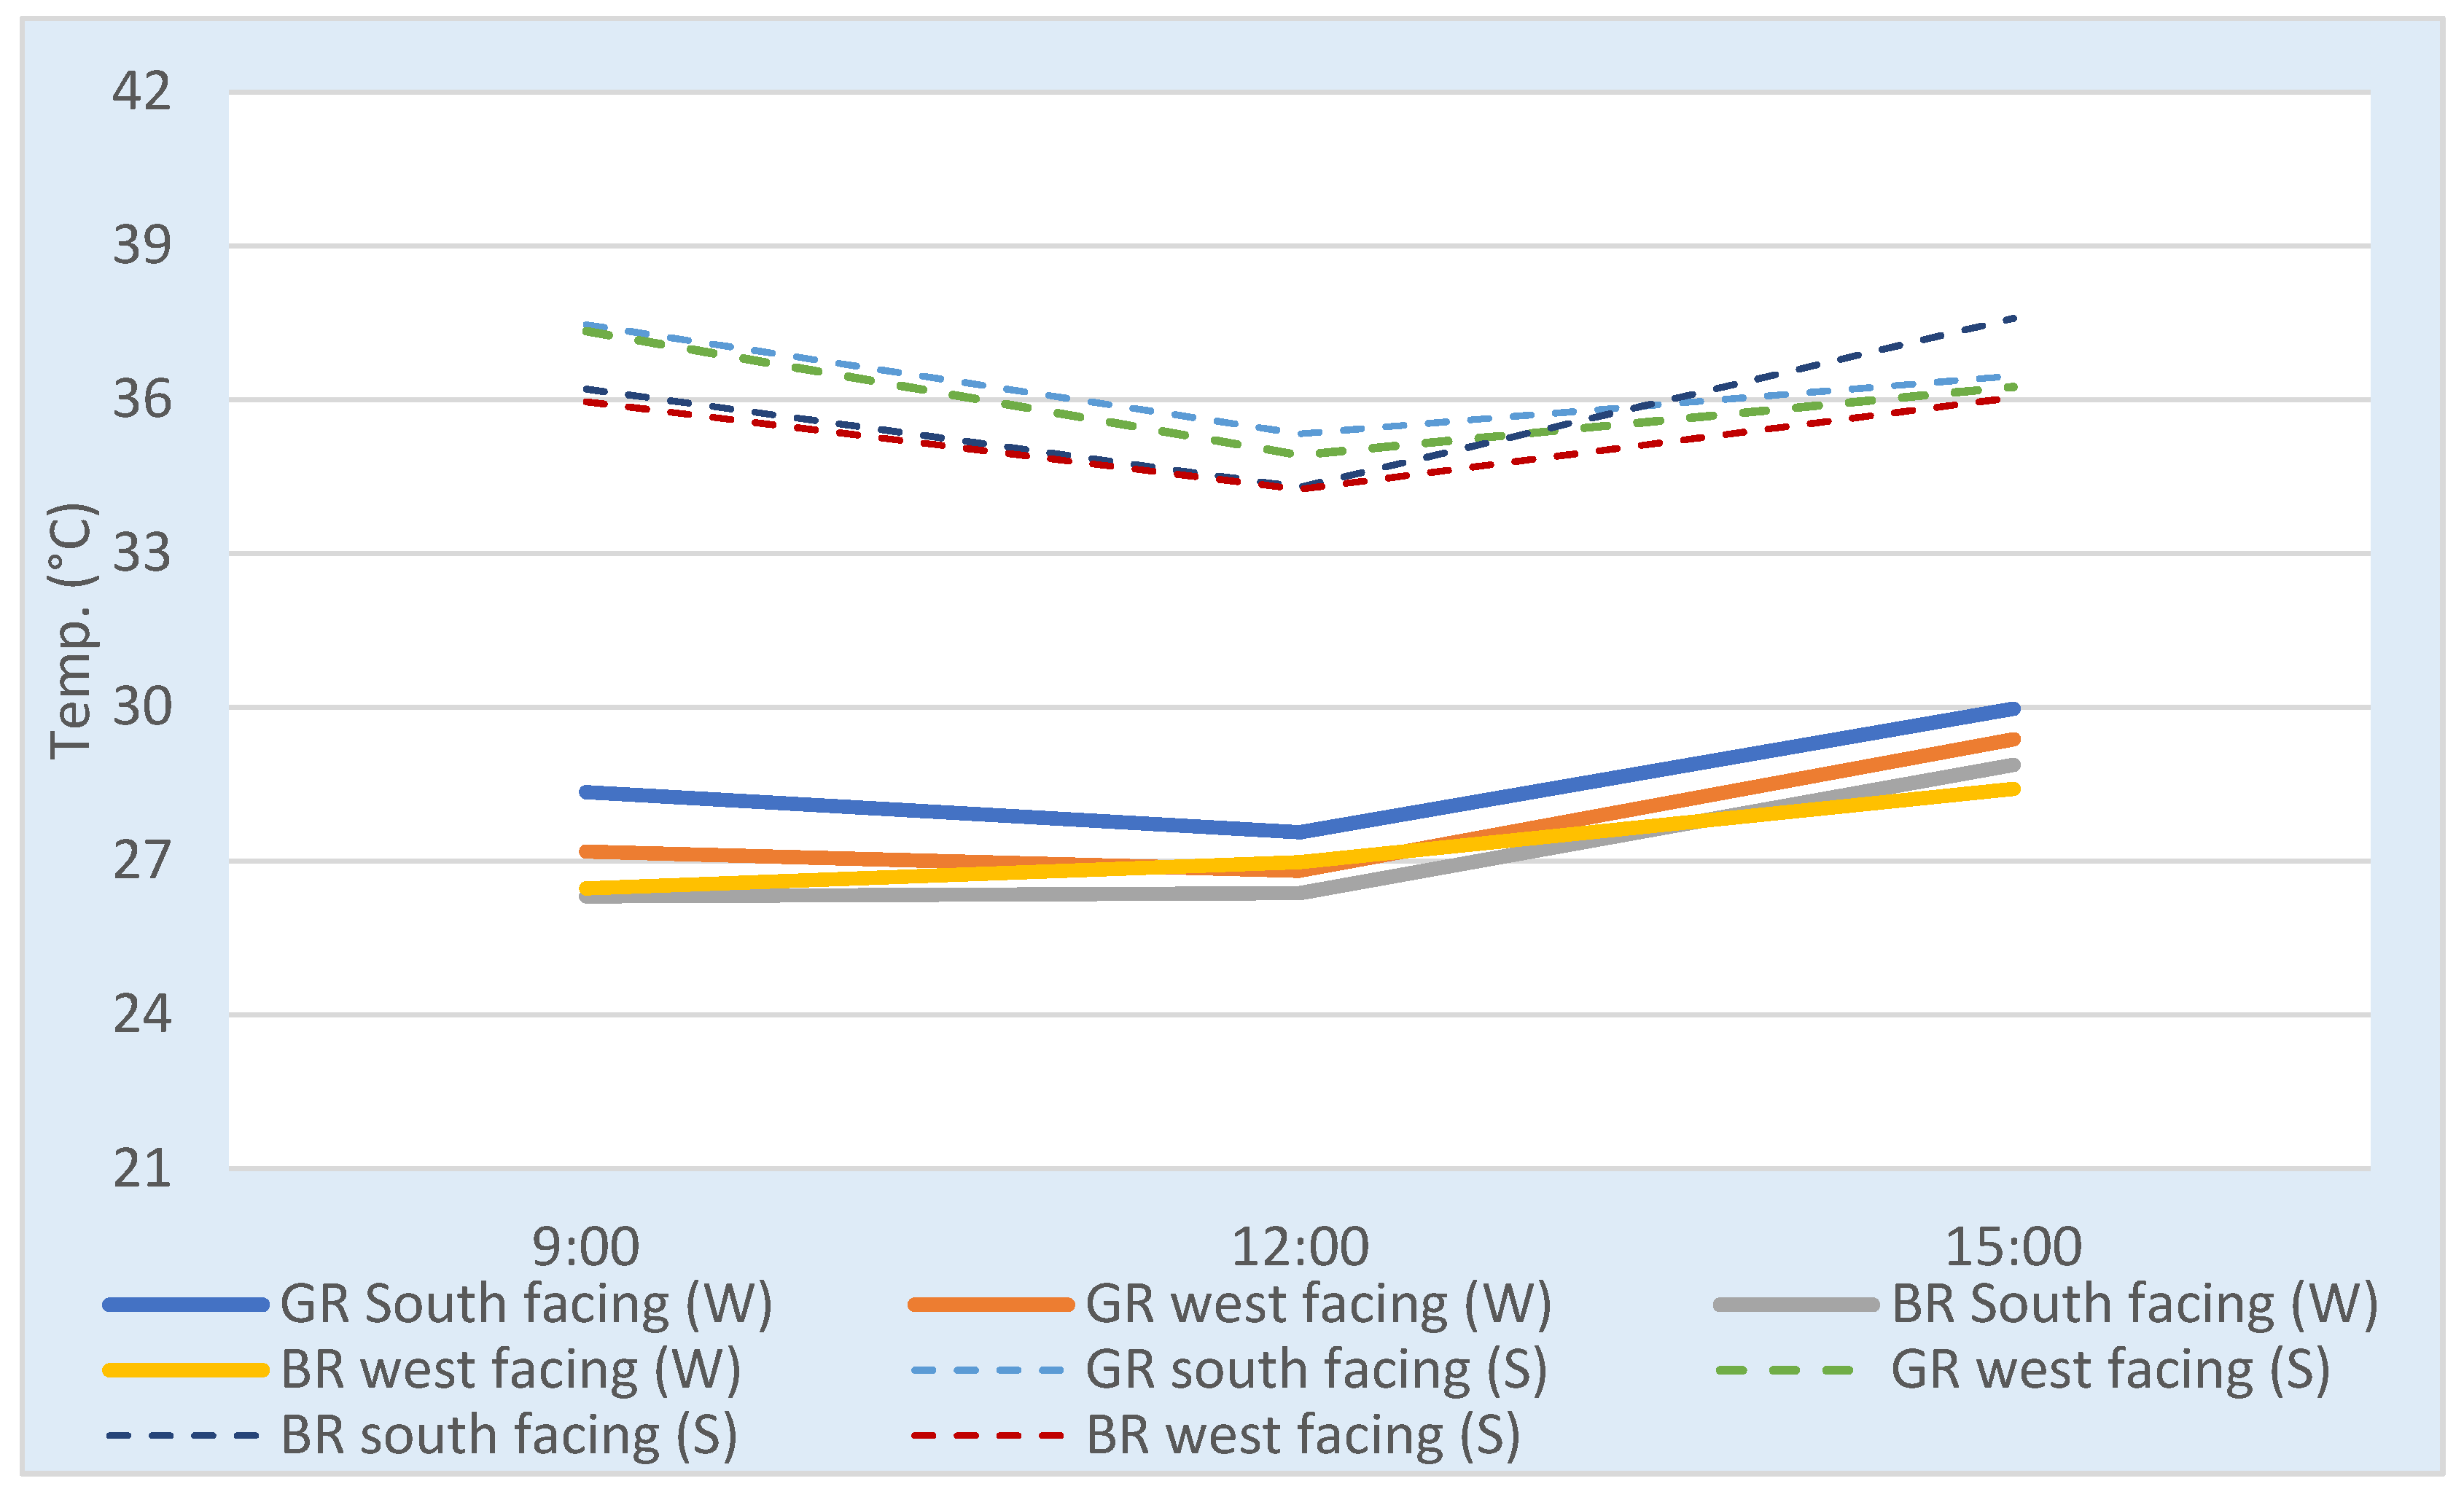
Measurements of the inner surface temperature of external walls (ISTEW) were used to predict the amount of heat conducted through the external wall (opaque element). Four levels and 12 points for each wall were selected for appropriate coverage. The average temperature for every hour is shown in
Figure 7. Four external walls of the two selected rooms were identified for surface temperature measurements to collect the data (
Figure 8).
In winter, the inside wall surface temperature for walls facing south and west of the guest room (GR) rose by about 1.5 °C by 15:00 compared with the measurements taken at 9:00. The rise in the inside wall surface temperature was expected, as the outdoor air temperature, which increased significantly from early morning due to the high intensity of solar radiation, was always higher than the indoor surface temperature. Both walls followed a similar trend with averages of 26.5, 26.5, and 28.5 °C for the times 9:00, 12:00, and 15:00, respectively.
In summer, there were also similarities in how both walls performed in the two rooms, as at 9:00, the internal surface temperature of external walls (ISTEW) was similar to the measurements taken at 15:00, but at 12:00, the temperature was 2 °C lower. The ISTEW was the highest measured environmental variable because the southerly and westerly orientation exposed them to high-intensity solar radiation.
3.2. Environmental Internal Condition Using Thermal Analysis Software
This section details the second phase of the evaluation of thermal conditions within the residential building. TAS was used to test the impact of the existing floor, roof, and external walls on the indoor air temperature, heat conduction, and cooling usage. Exploring thermal trends was intended to predict thermal conditions within the residential building and to investigate alternative arrangements to improve indoor thermal environments within an energy-efficient house. TAS is complex software, and it was necessary to simplify the model to obtain the required output. Thus, the building was modelled and simulated to reflect conditions when the physical measurements were taken (free running and without internal gain). Then, the thermal performance of the house during winter and summer was assessed. Additionally, comparisons between the fieldwork results and the computer modeling results were conducted and discussed. The findings related to heat conduction through the external building materials were also presented. The accurate measurement of heat flow through the walls and roof can be used to optimize the envelope characteristics based on a combination of materials with the most effective insulation and the building’s geometry. However, it is important to replicate the climate conditions and the building and system characteristics [
21].
For the simulated energy model to be acceptable, calculations of the root-mean-square error (RMSE) and normalized mean bias error (NMBE) should be in the range of 30 and 10%, respectively, for a model that employs hourly figures based on ASHRAE guidelines [
27]. This study recorded hourly dry bulb temperatures, which represent a measure of air temperature. It is called the dry bulb temperature because the thermometer bulb is dry to avoid variations in the recorded temperature caused by the moisture content of the air. While calculating both the RMSE and the NMBE, two methods were used: the first method divided the recorded data into winter and summer periods, while the second calculated the values of all the monitored temperatures during the total monitored hours. The heat conduction of external opaque materials was analyzed to assist with the identification of improvements to the house’s envelope, because a building’s exposed surfaces will influence internal conditions, as revealed through the fieldwork. Heat flow through surfaces was simulated separately by TAS through surface filter outputs. This was utilized to analyze the thermal performance of various building elements, where the heat flow was calculated for external opaque surfaces, i.e., walls, roofs, and floors. Lastly, heat conduction and solar heat gain acted as a bridge in this research between the measurement and the improvement elements to determine how external building materials behave thermally. The cooling load was also predicted in the house, and an investigation of the parameters that could affect the cooling load, such as floor level, was conducted. The analysis results are presented and discussed in detail. Then, the results presented in this section were later applied to identify the optimal material modification.
3.2.1. Dry Bulb Temperature
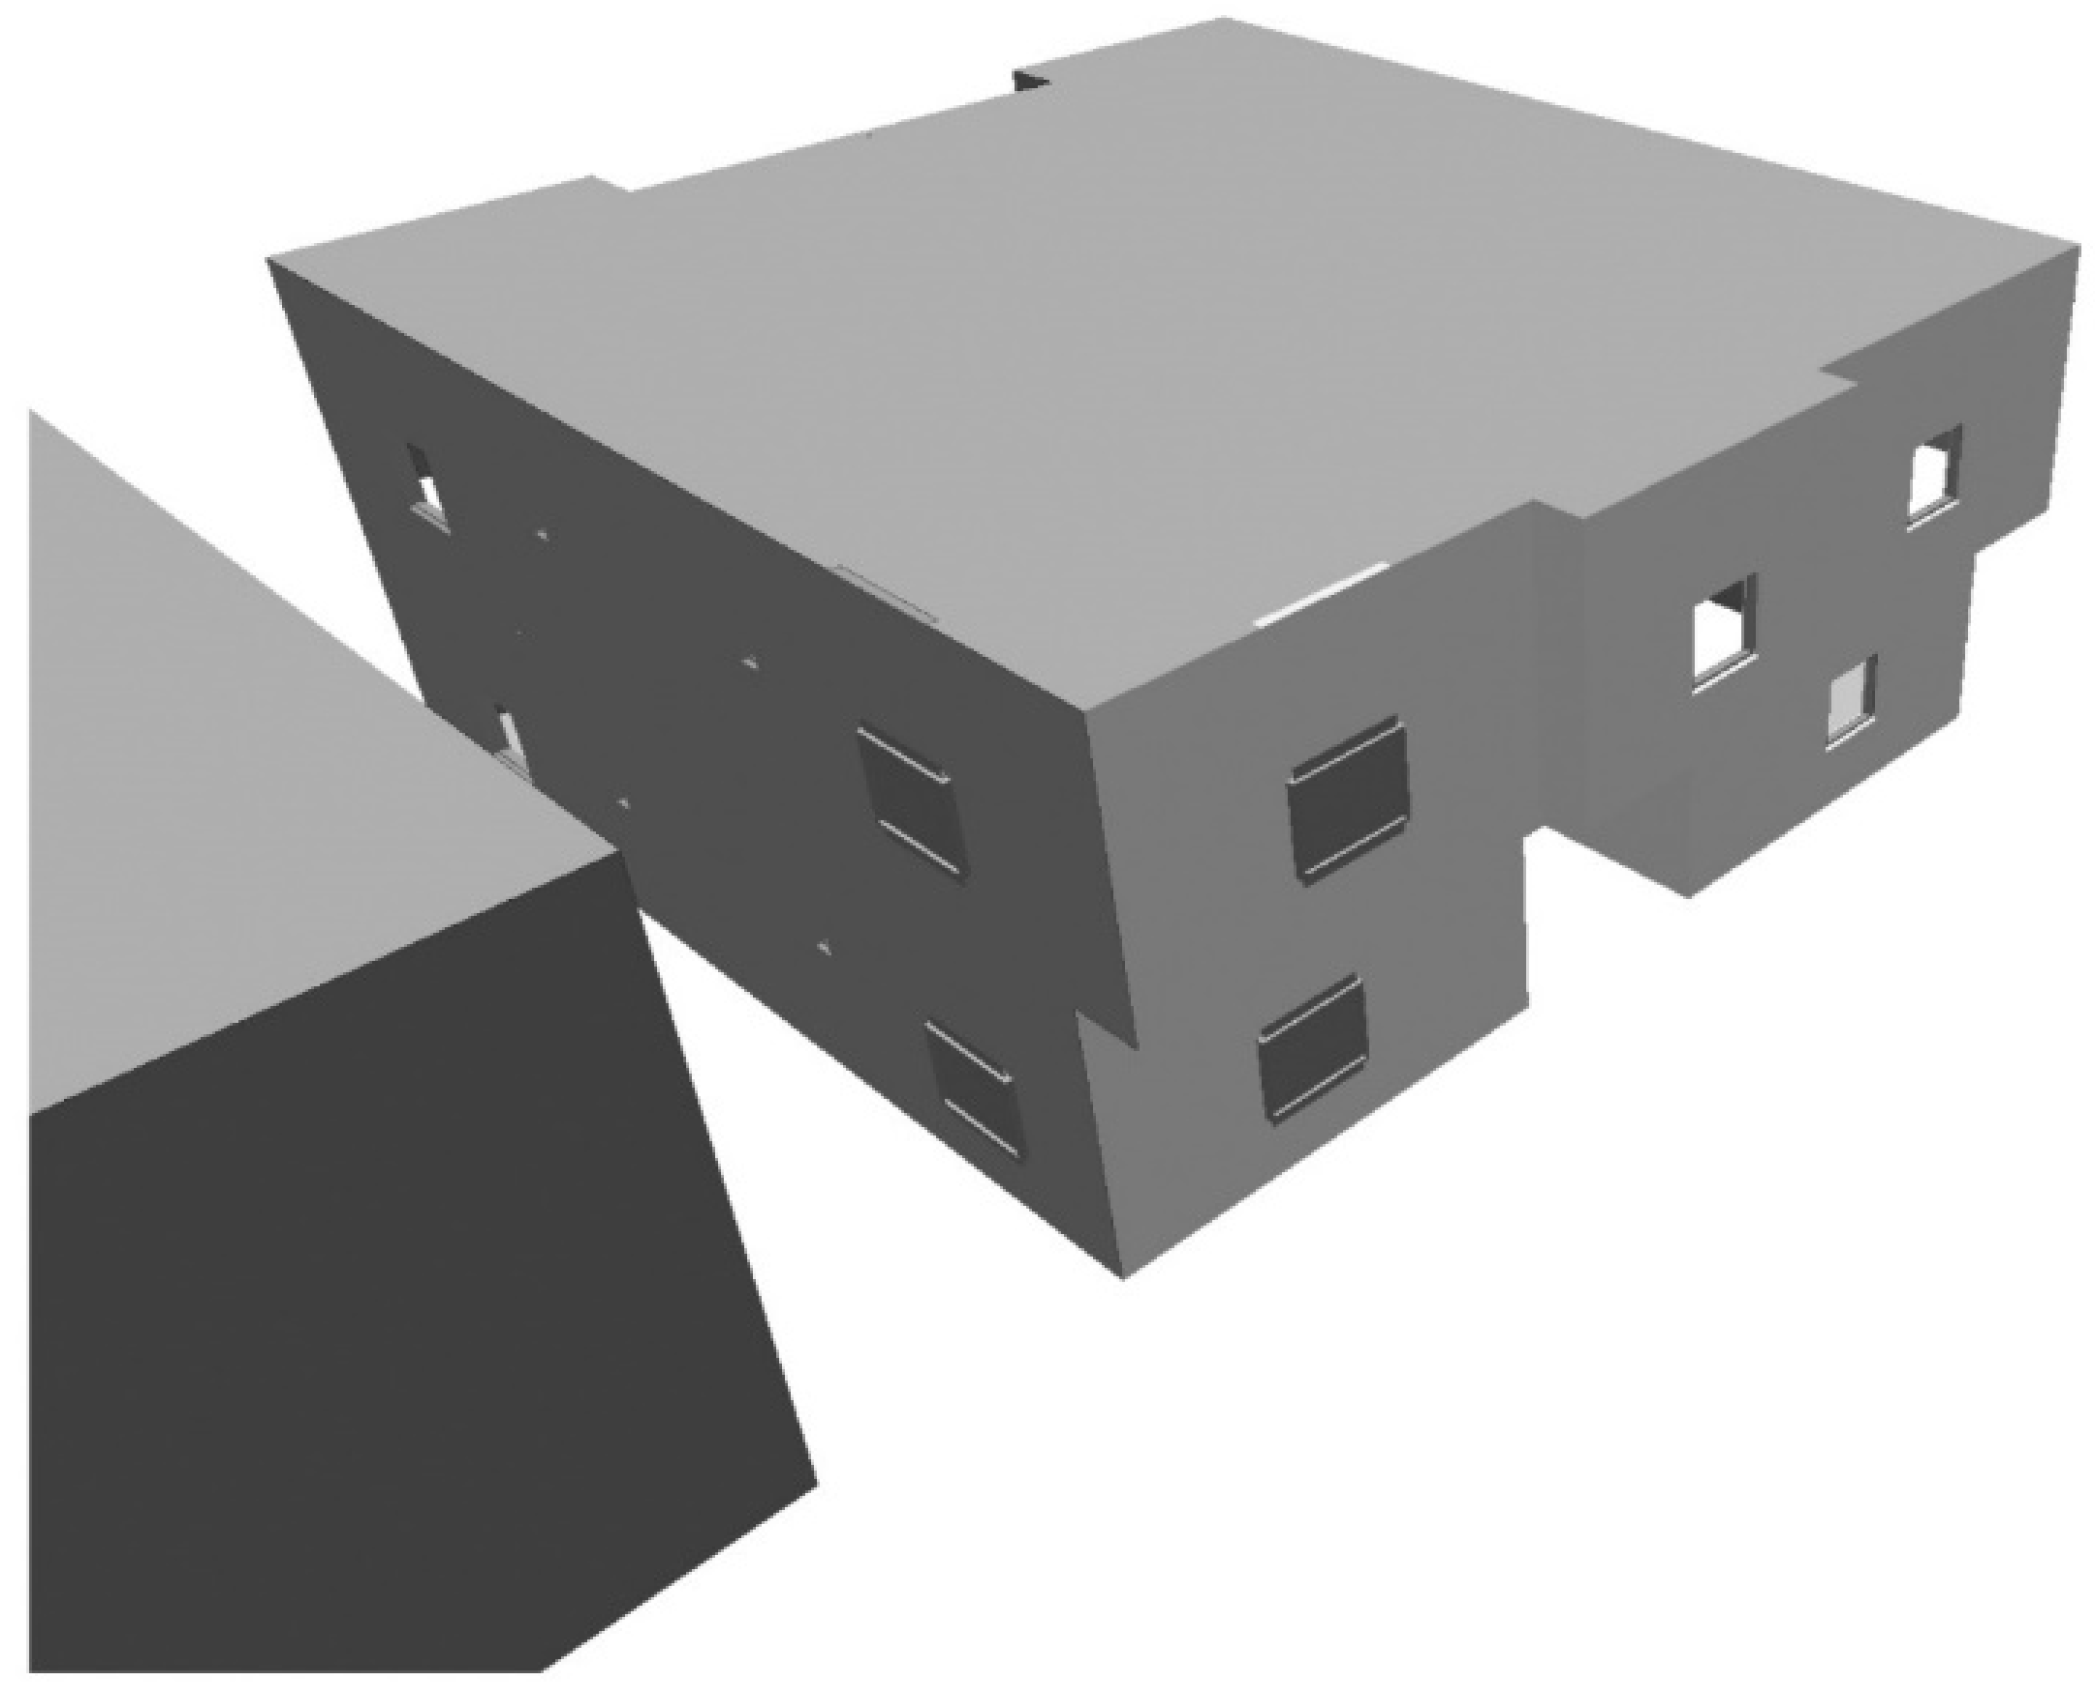
The same rooms chosen for the fieldwork were chosen here for the same days and hours. The case study building was modeled (
Figure 9) using thermal analysis software (EDSL TAS version 9.4.2) [
28].
The calibration results displayed very similar dry bulb temperature behaviors for the guest room and bedroom (see
Figure 10 and
Figure 11). A total of 580 values was taken, and an average of indoor air temperature was analyzed. In winter, the peaks and troughs were the same for the first two days with slightly high temperatures. In summer, the peaks and troughs were the same with relatively high temperatures on the first day; however, they were around 1 °C higher on the second and third days in the bedroom (BR). The reason for plotting the simulated results in this way was to verify and calibrate the analytical work. The root-mean-square error (RMSE) percentage and normalized mean bias error (NMBE) percentage were calculated, and the results appear in
Table 6. The NMBE was lower than the 10% limit, and the RMSE was lower than the 30% limit set by ASHRAE. It was therefore safe to suggest that the simulated results were within the acceptable range.
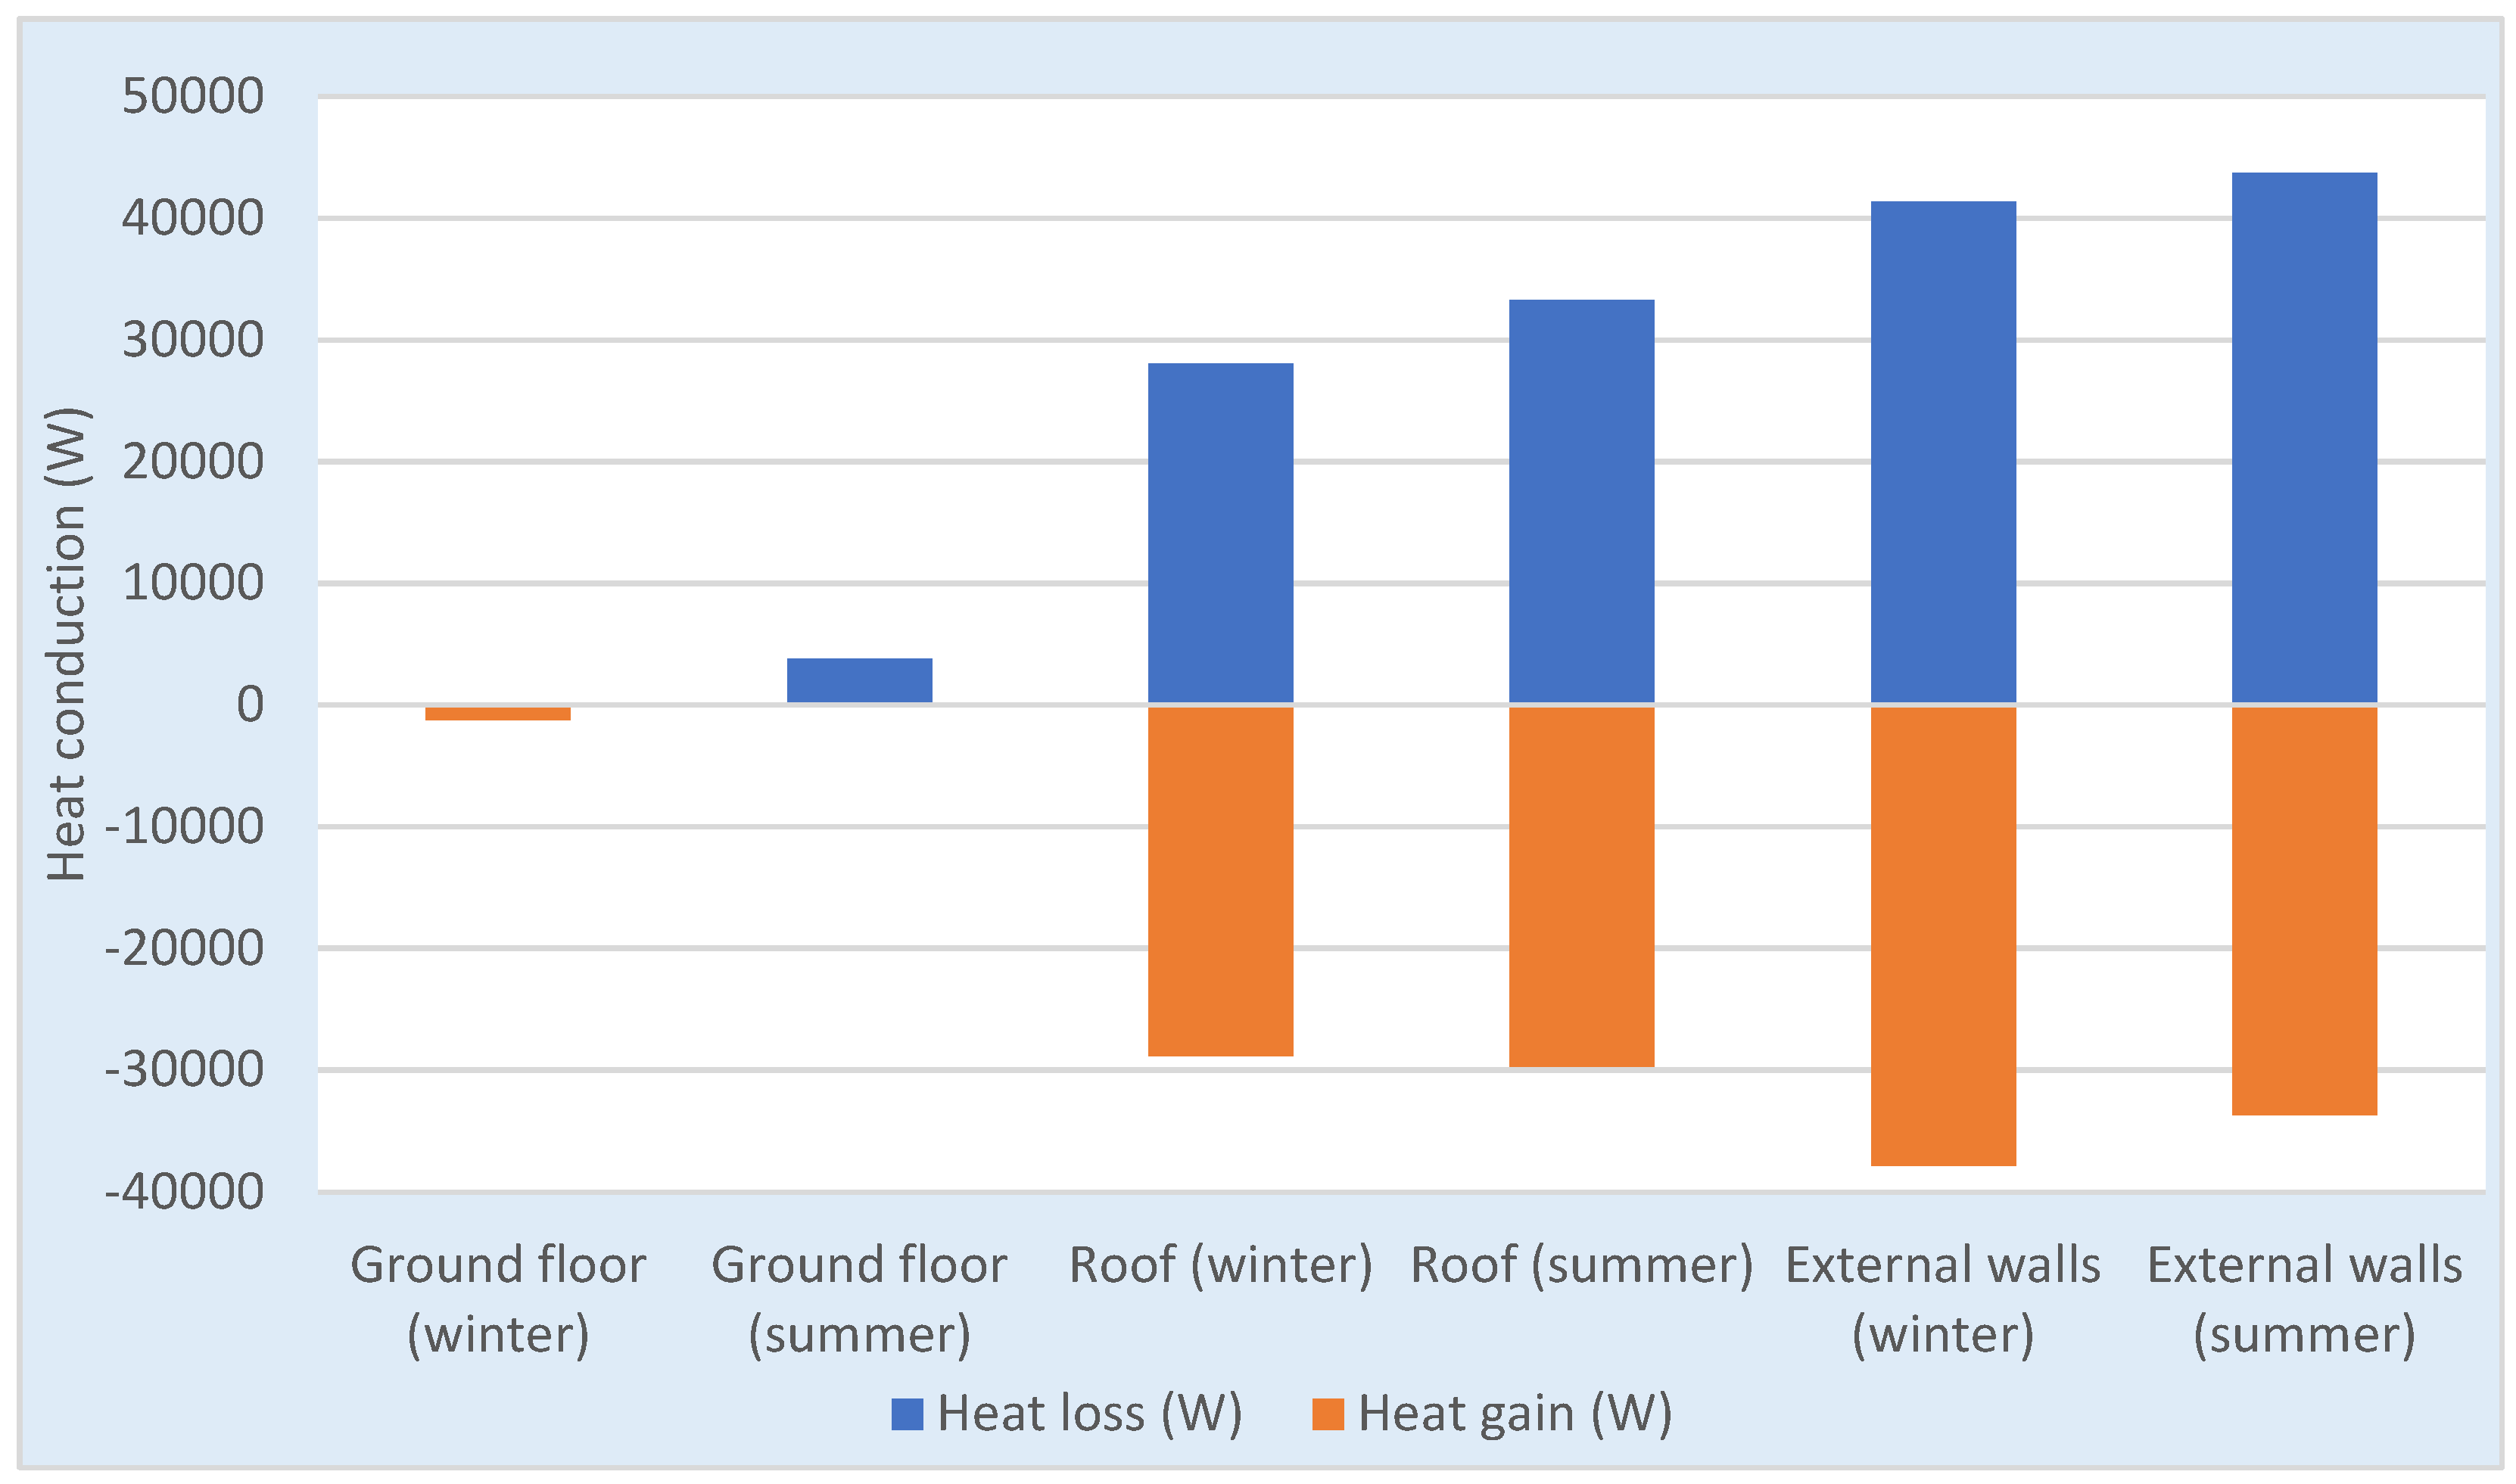
3.2.2. Heat Conduction through Materials
Figure 12 illustrates the heat loss/gain through the floor, roof, and external wall components in the ground floor guest room and first floor bedroom on summer and winter days. The heat loss/gain through the guest room floor components showed relatively small amounts of heat gain and loss. In winter, the heat gain through the floor occurred constantly, whilst remaining stable. This means that the internal surface floor temperature of the guest room was lower than the external surface floor temperature because in winter, the ground temperature is higher than the external air temperature. The heat flow through the floor differs between summer and winter, as heat loss in summer through floors takes place. This can be explained by the summer temperature of the ground being lower than the external air temperature.
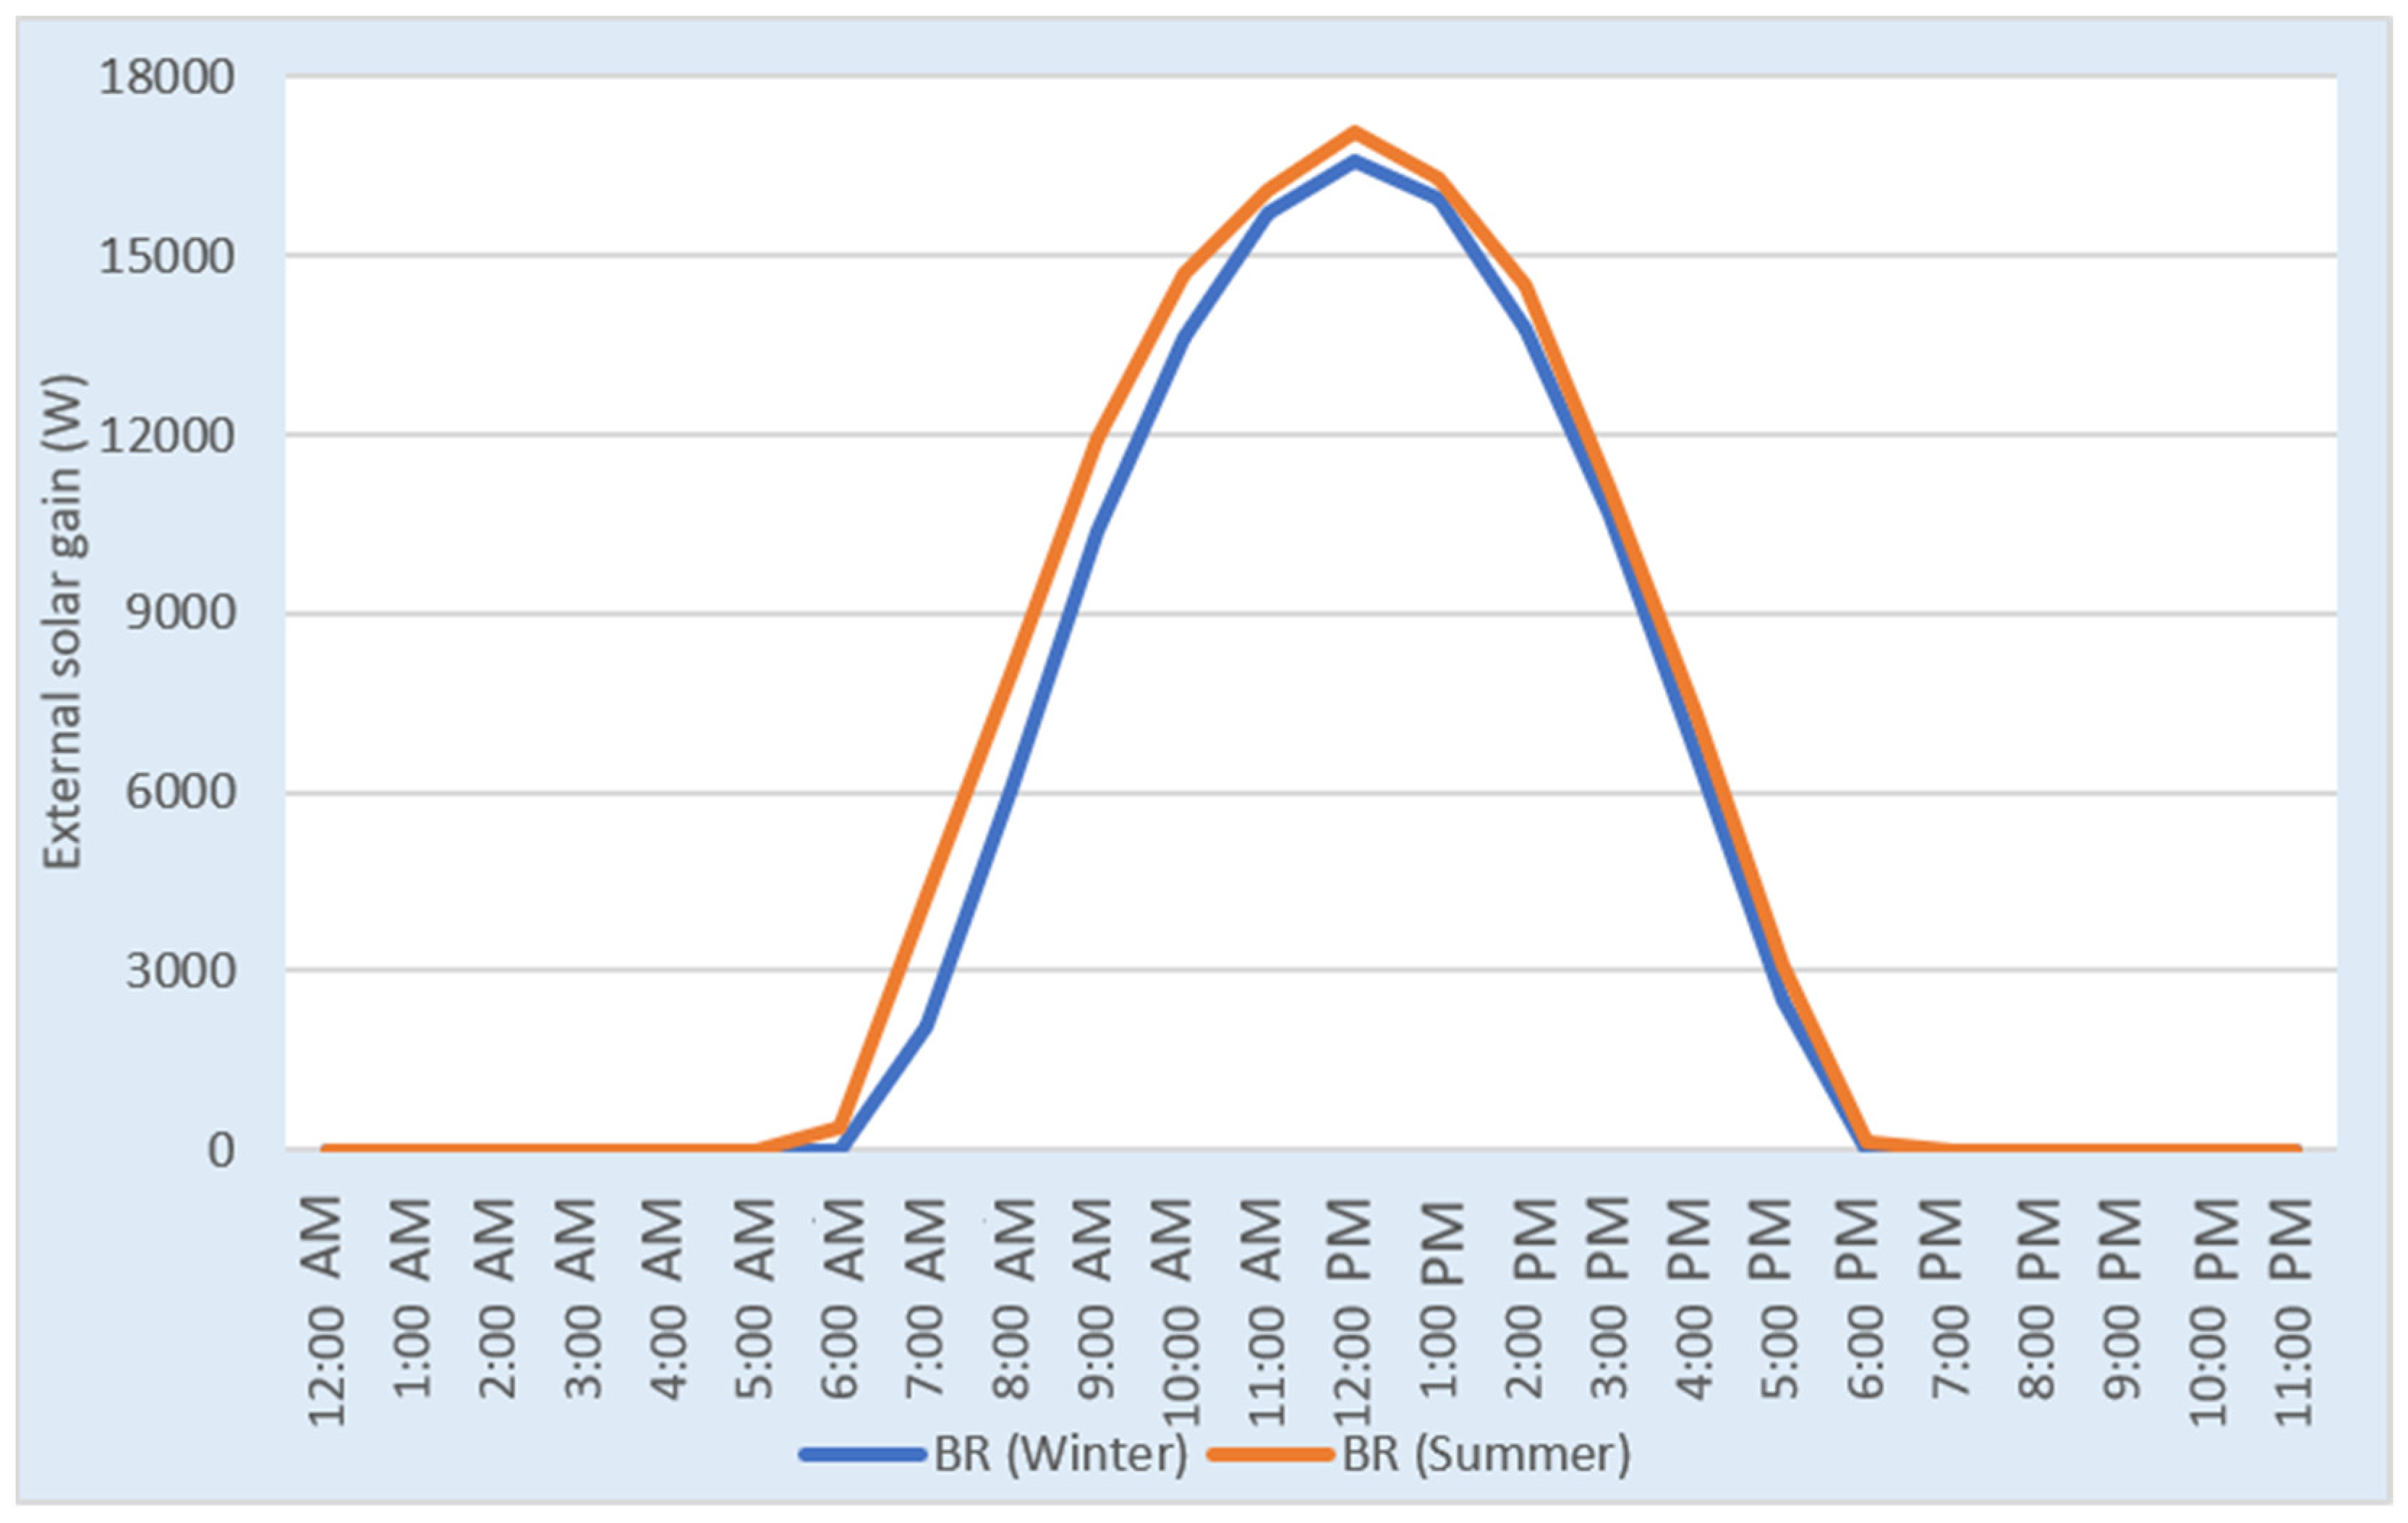
During both a summer and a winter day, there were relatively large heat gain and heat losses through the roof component in the first-floor bedroom, through its exposure to the outdoors. Heat gain through the roof commenced in the morning, as the roof was exposed to solar radiation, and ended later in the afternoon; then heat loss took place as the outside temperature fell in both winter and summer. The external solar gains in both seasons were similar and started to significantly increase early in the morning to reach their peak at 12:00 (
Figure 13). A positive correlation was found between TAS and the monitored variables. As stated in
Section 3.1, the bedroom ceiling had the second highest inner surface temperature amongst the temperature of all other surfaces measured.
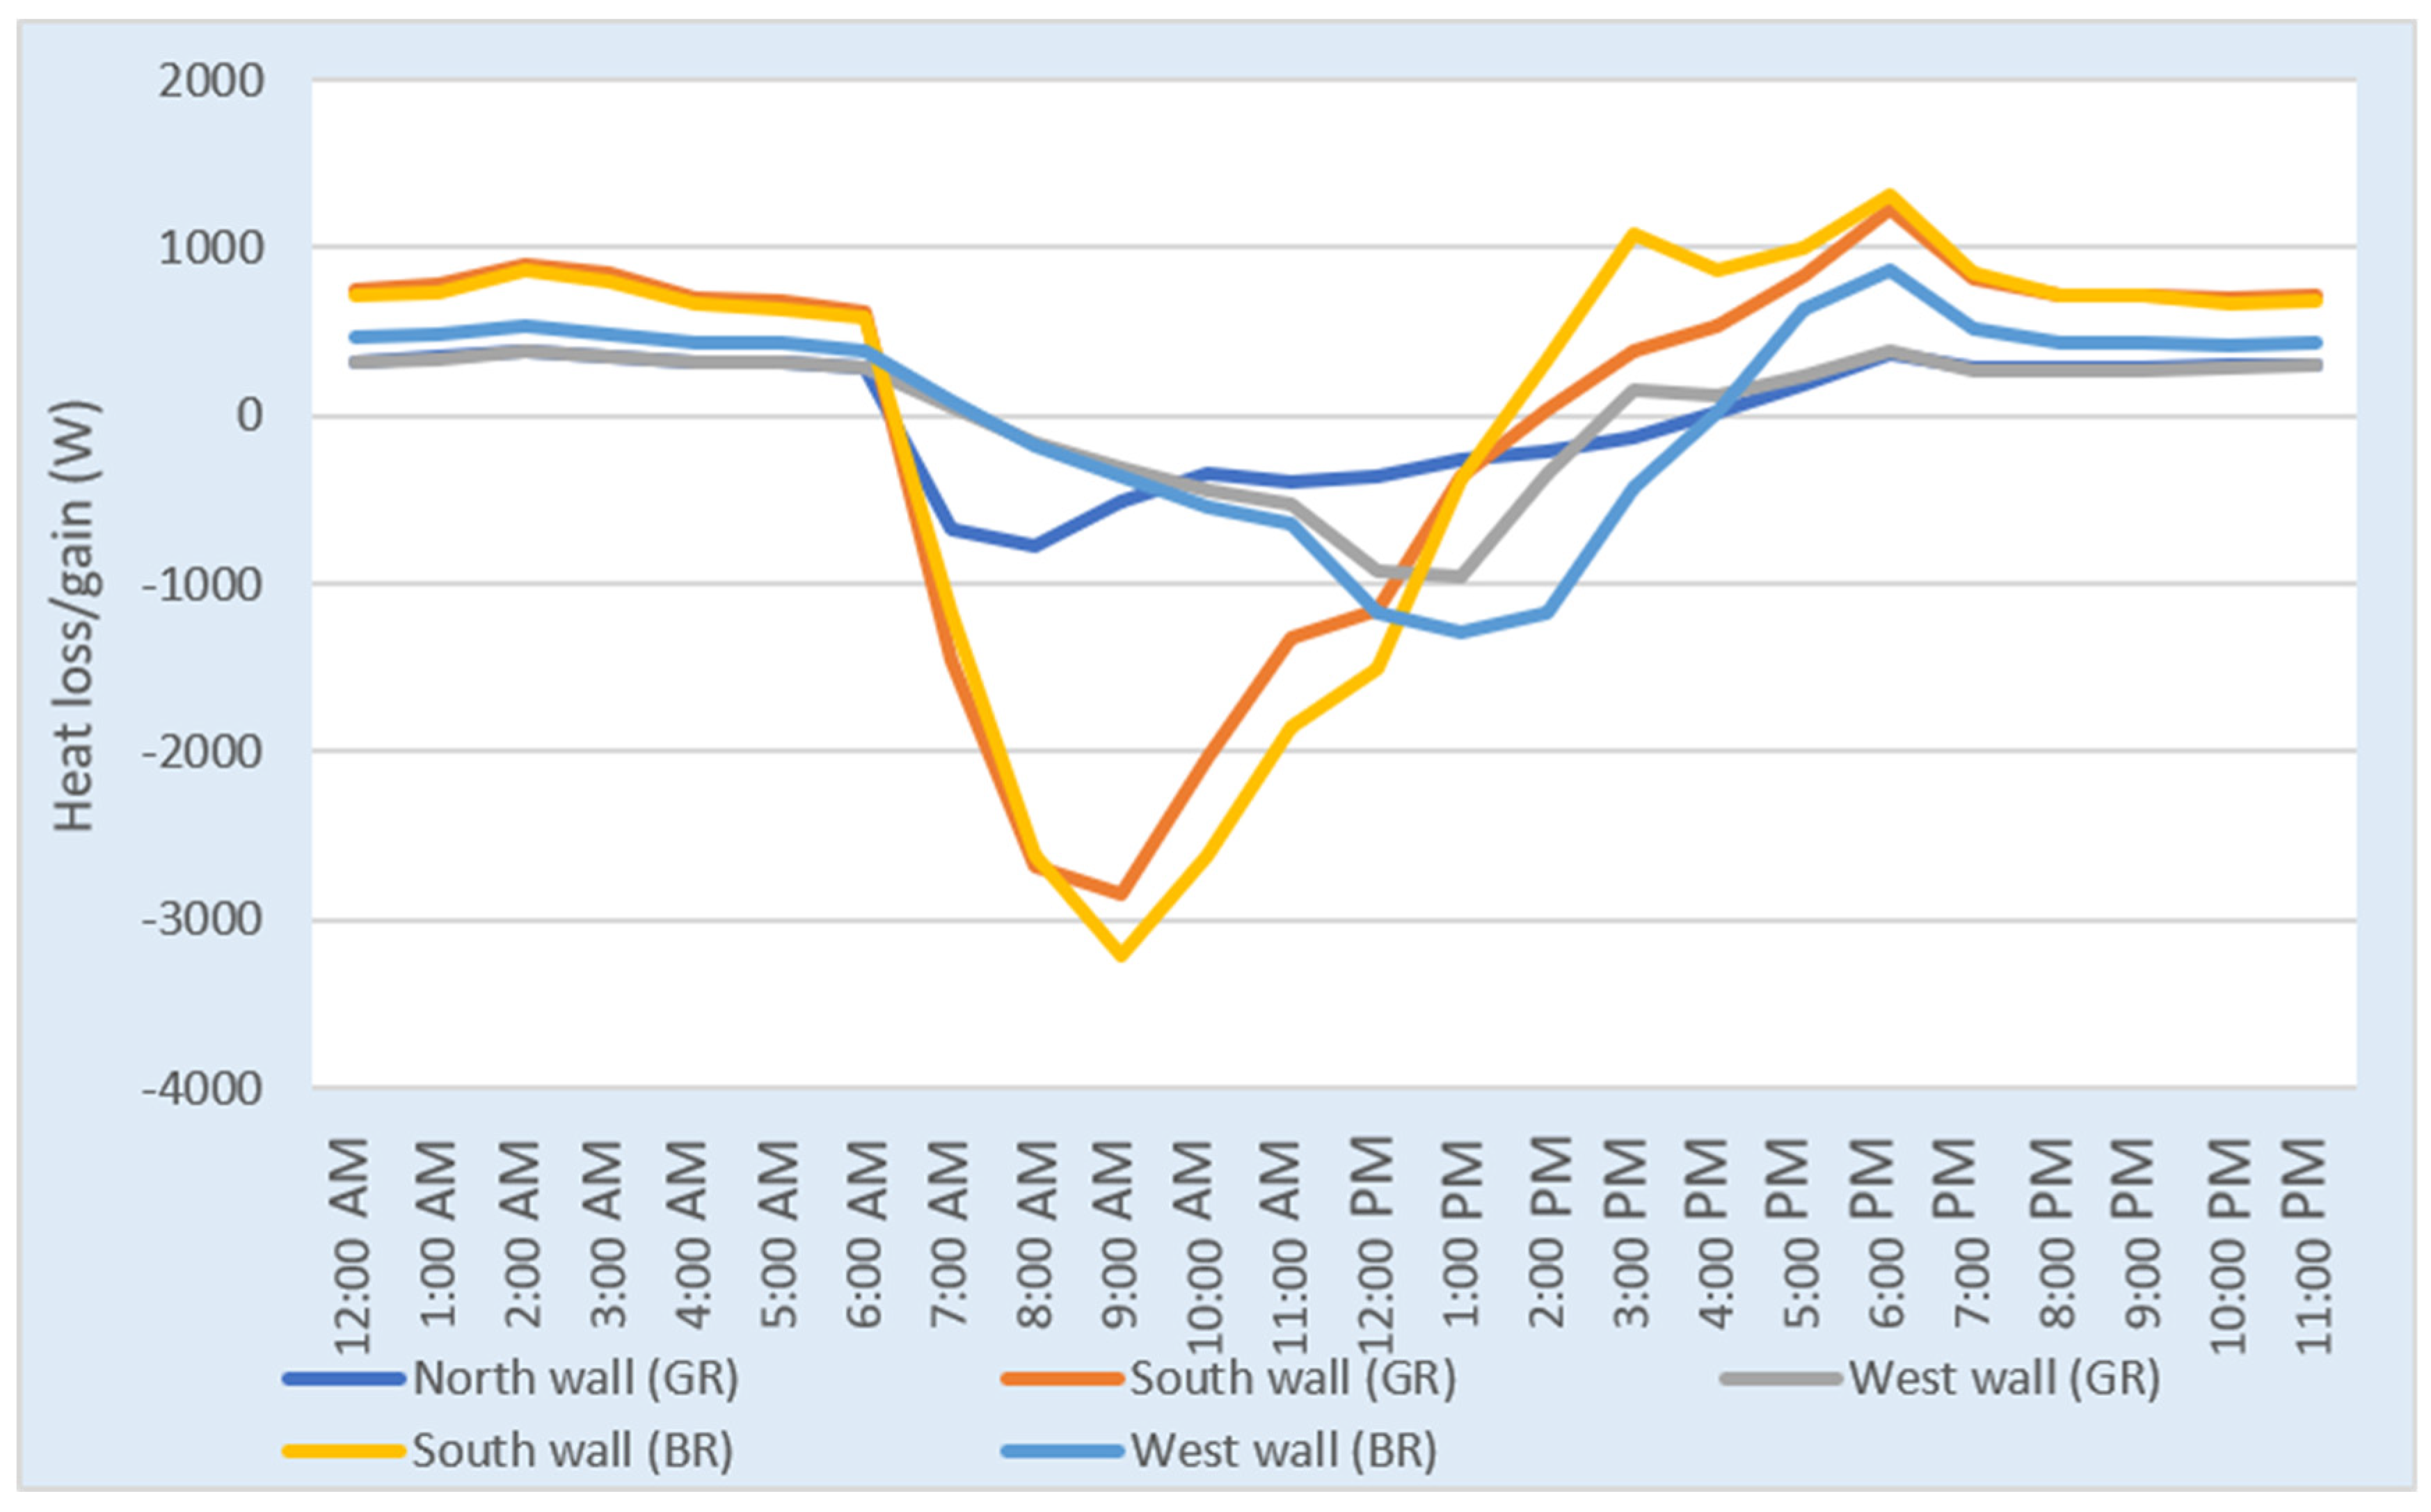
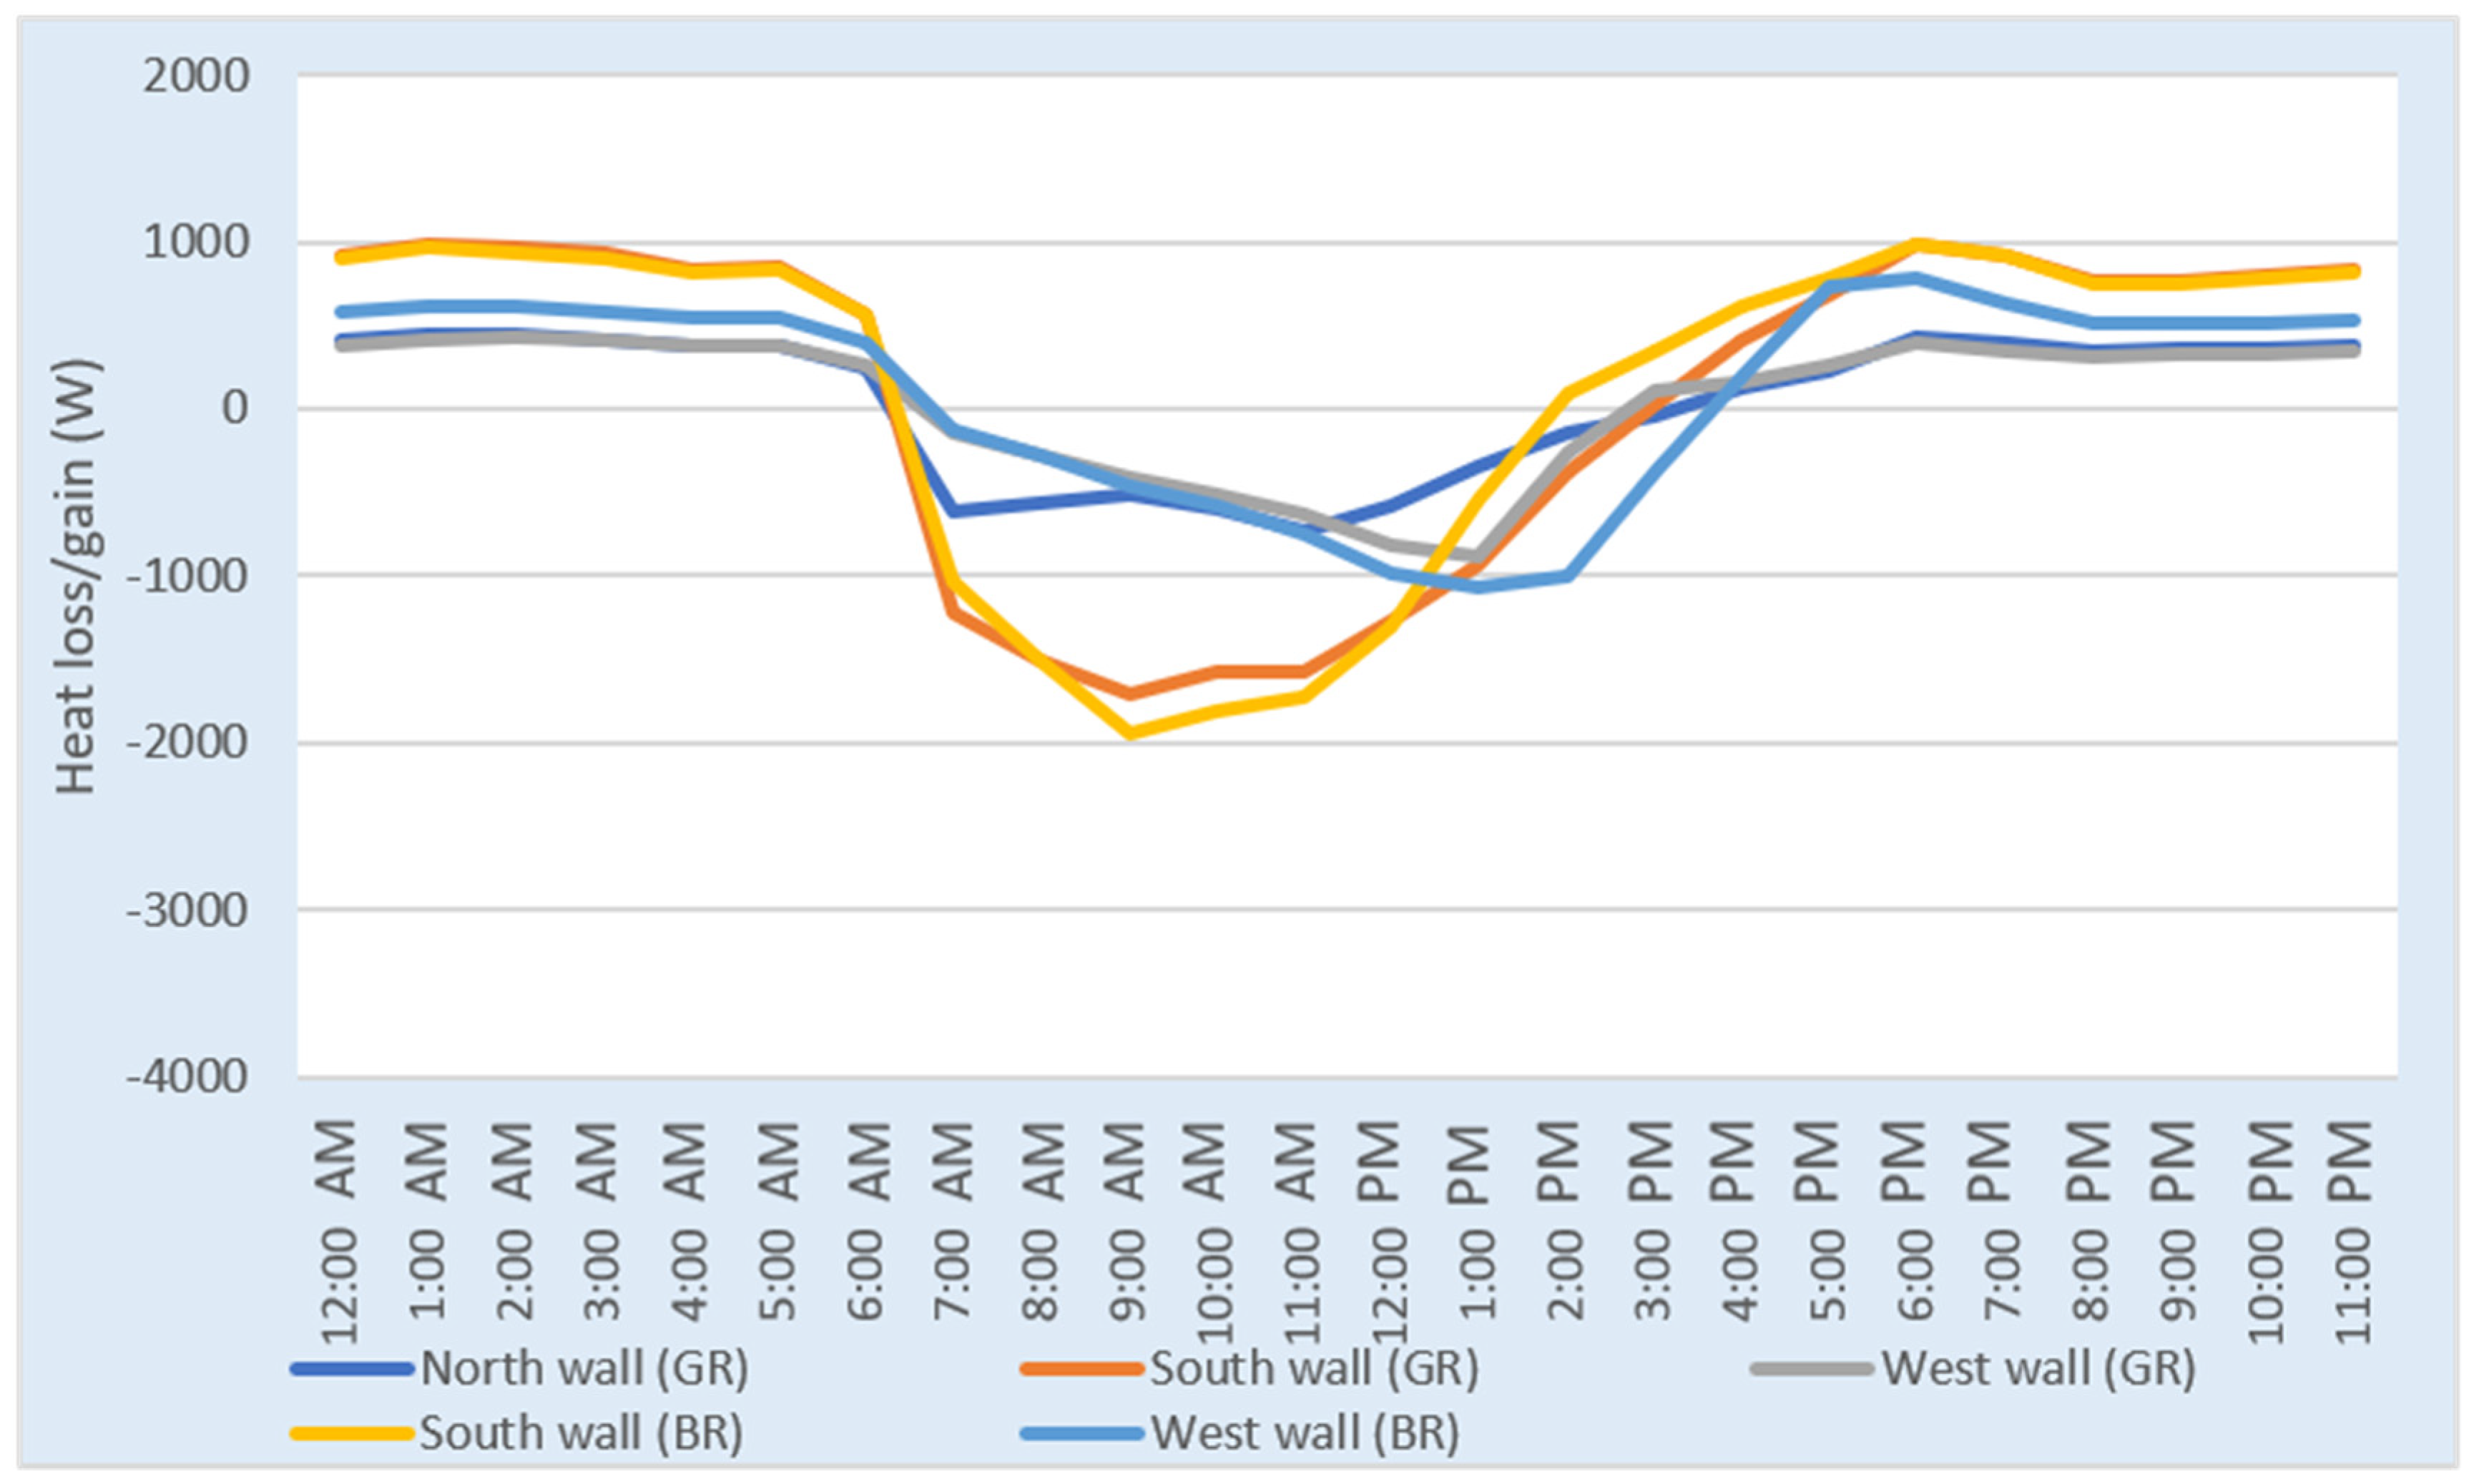
Finally, the external wall components in the guest room and bedroom on both a summer and a winter day showed larger amounts of heat gain and loss compared with all the other building components. This is shown in detail in
Figure 14 and
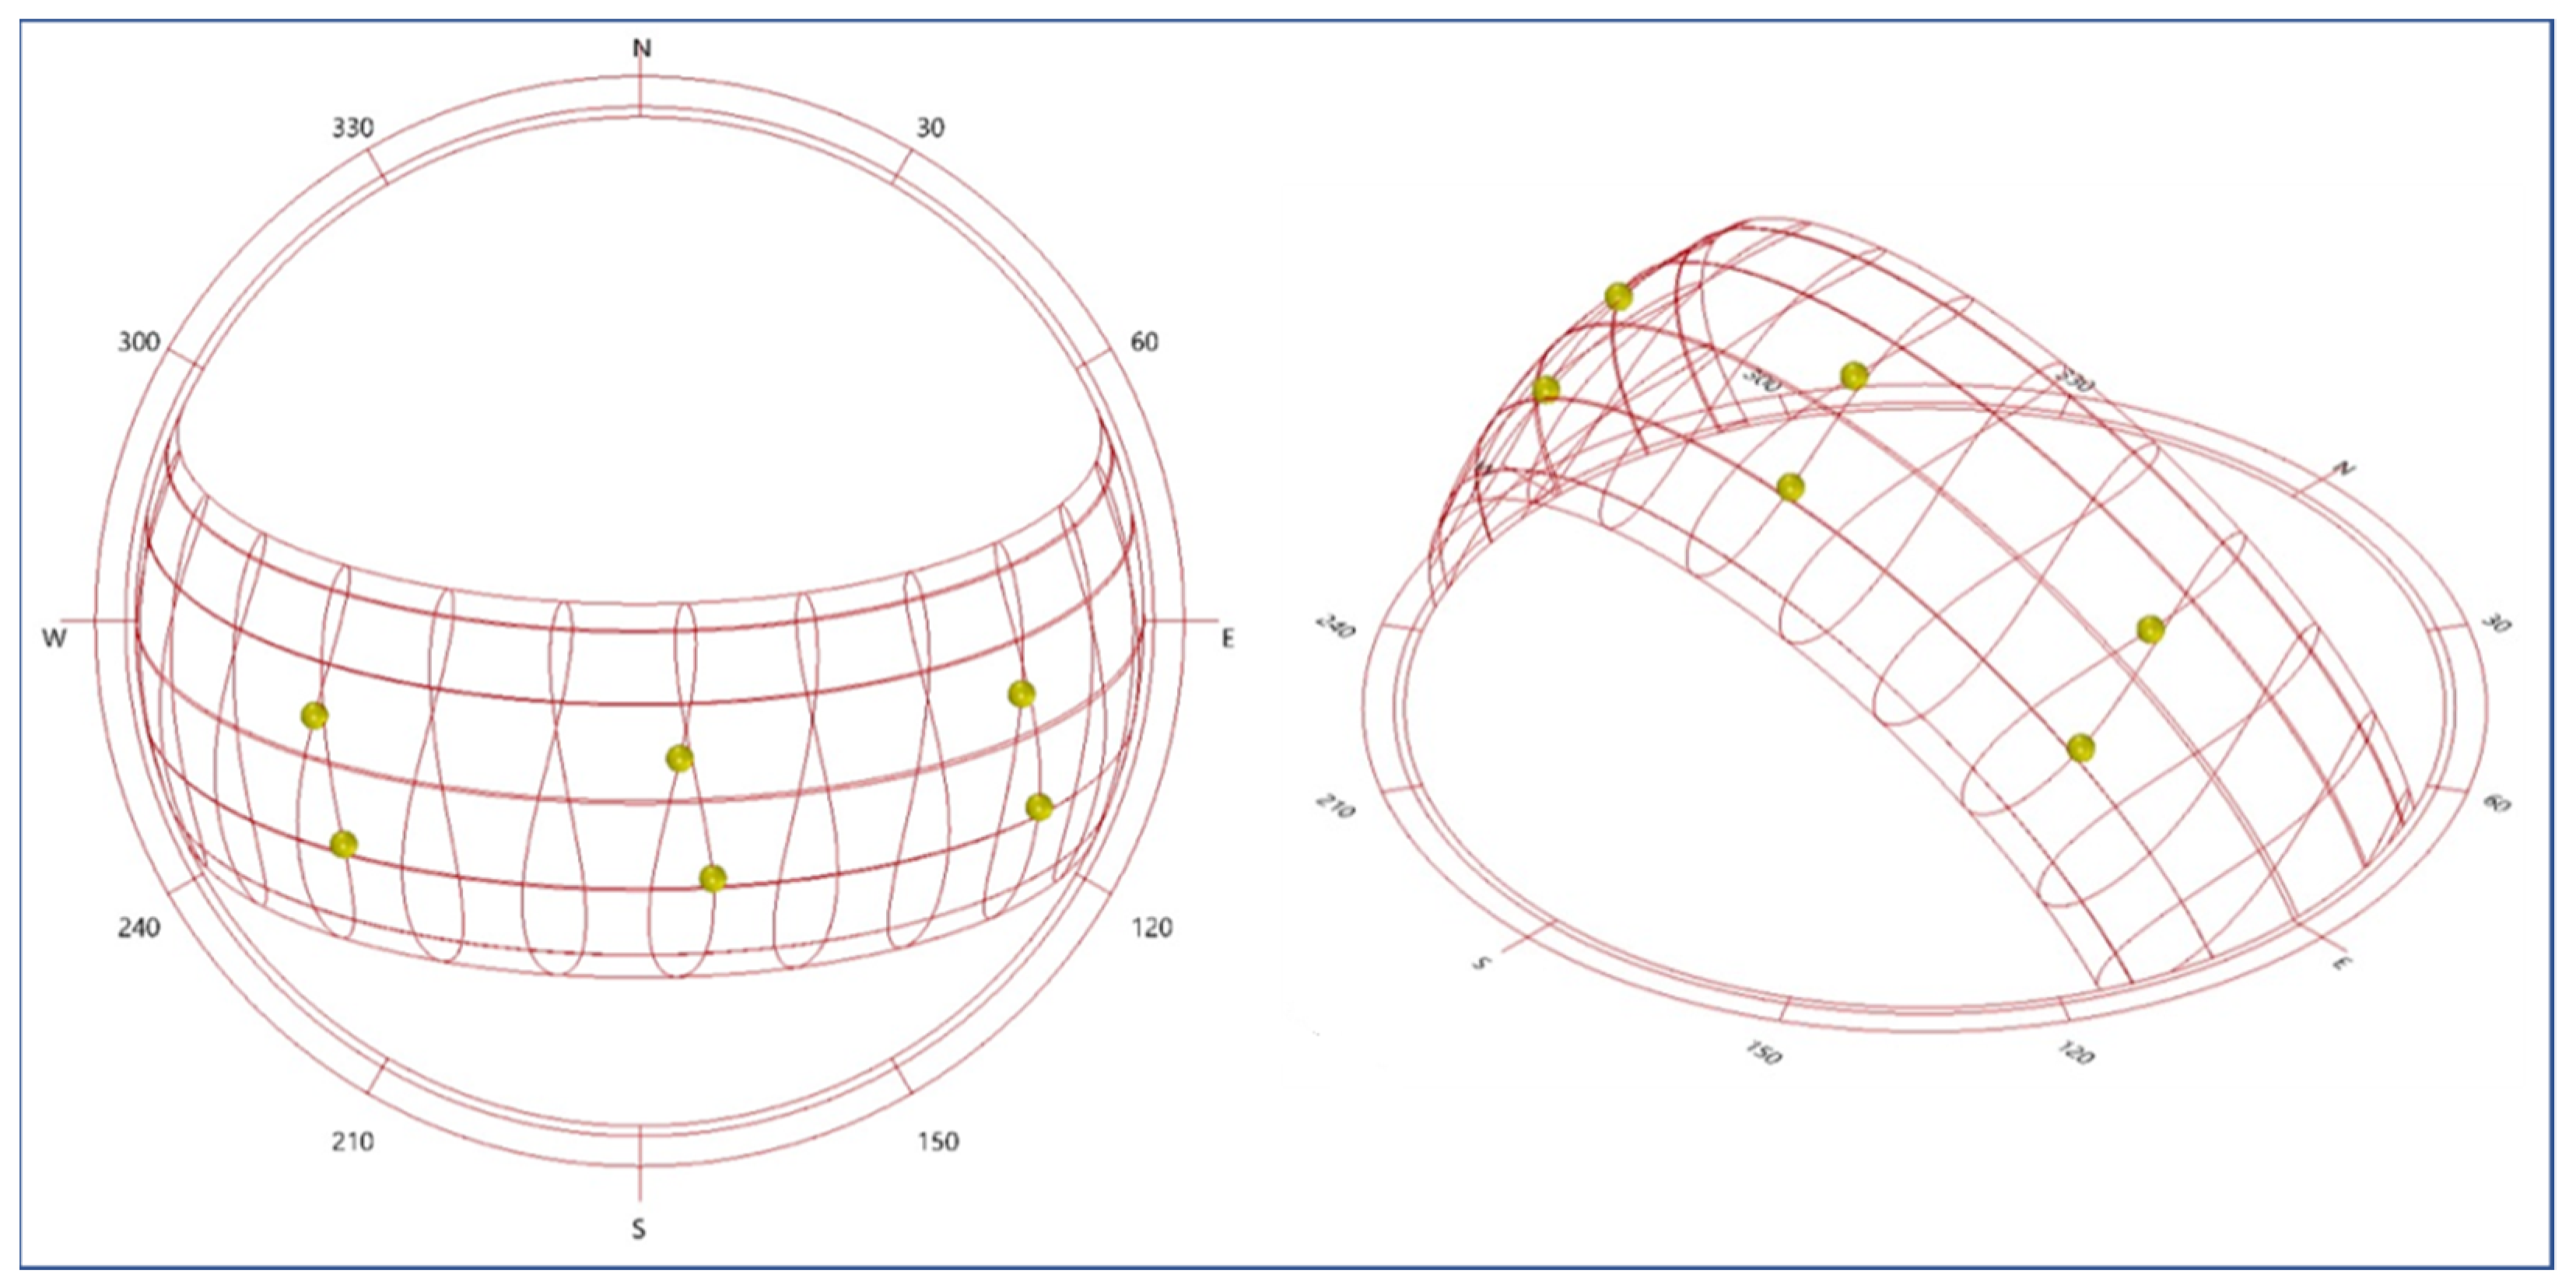
Figure 15, which illustrate the heat loss/gain through every external wall component in the guest room and bedroom. In winter, the thermal analysis revealed that heat gain through the walls increased gradually from early in the morning, reaching its peak at midday for the south-facing walls, then decreased and ended later in the afternoon. In summer, the trend of heat conduction through walls was similar to that in winter. The heat conduction in the external walls was greater in winter than in summer. This was attributed to the lower angle of the sun, which enabled direct radiation to reach the external walls at an orthogonal angle. This resulted in a massive amount of heat conduction through the external wall, which possibly led to an increase in the indoor temperature and other measured variables. To confirm this, the sun path diagram of Makkah for the two days chosen for the fieldwork and the simulation, which represented winter and summer (26 February and 7 September), at the three set times (9:00, 12:00, and 15:00), is presented in
Figure 16. The results produced using Grasshopper software [
33] support the claim that the solar angle in winter had a 15° lower altitude. The altitude angles for all six readings were taken manually from the software and are presented in
Table 7.
Furthermore, the south-facing, compared to the north- and west-facing walls in both rooms, encountered maximum heat gain via conduction during the daytime and maximum heat loss later in the evening. A positive correlation was found between TAS and the monitored variables. As presented in
Section 3.1, the south-facing walls had slightly higher inner surface temperatures than the west-facing walls in both rooms. In both summer and winter, there was major heat conduction through the roof. However, the heat conduction was much less in external walls when considering opaque surfaces only.
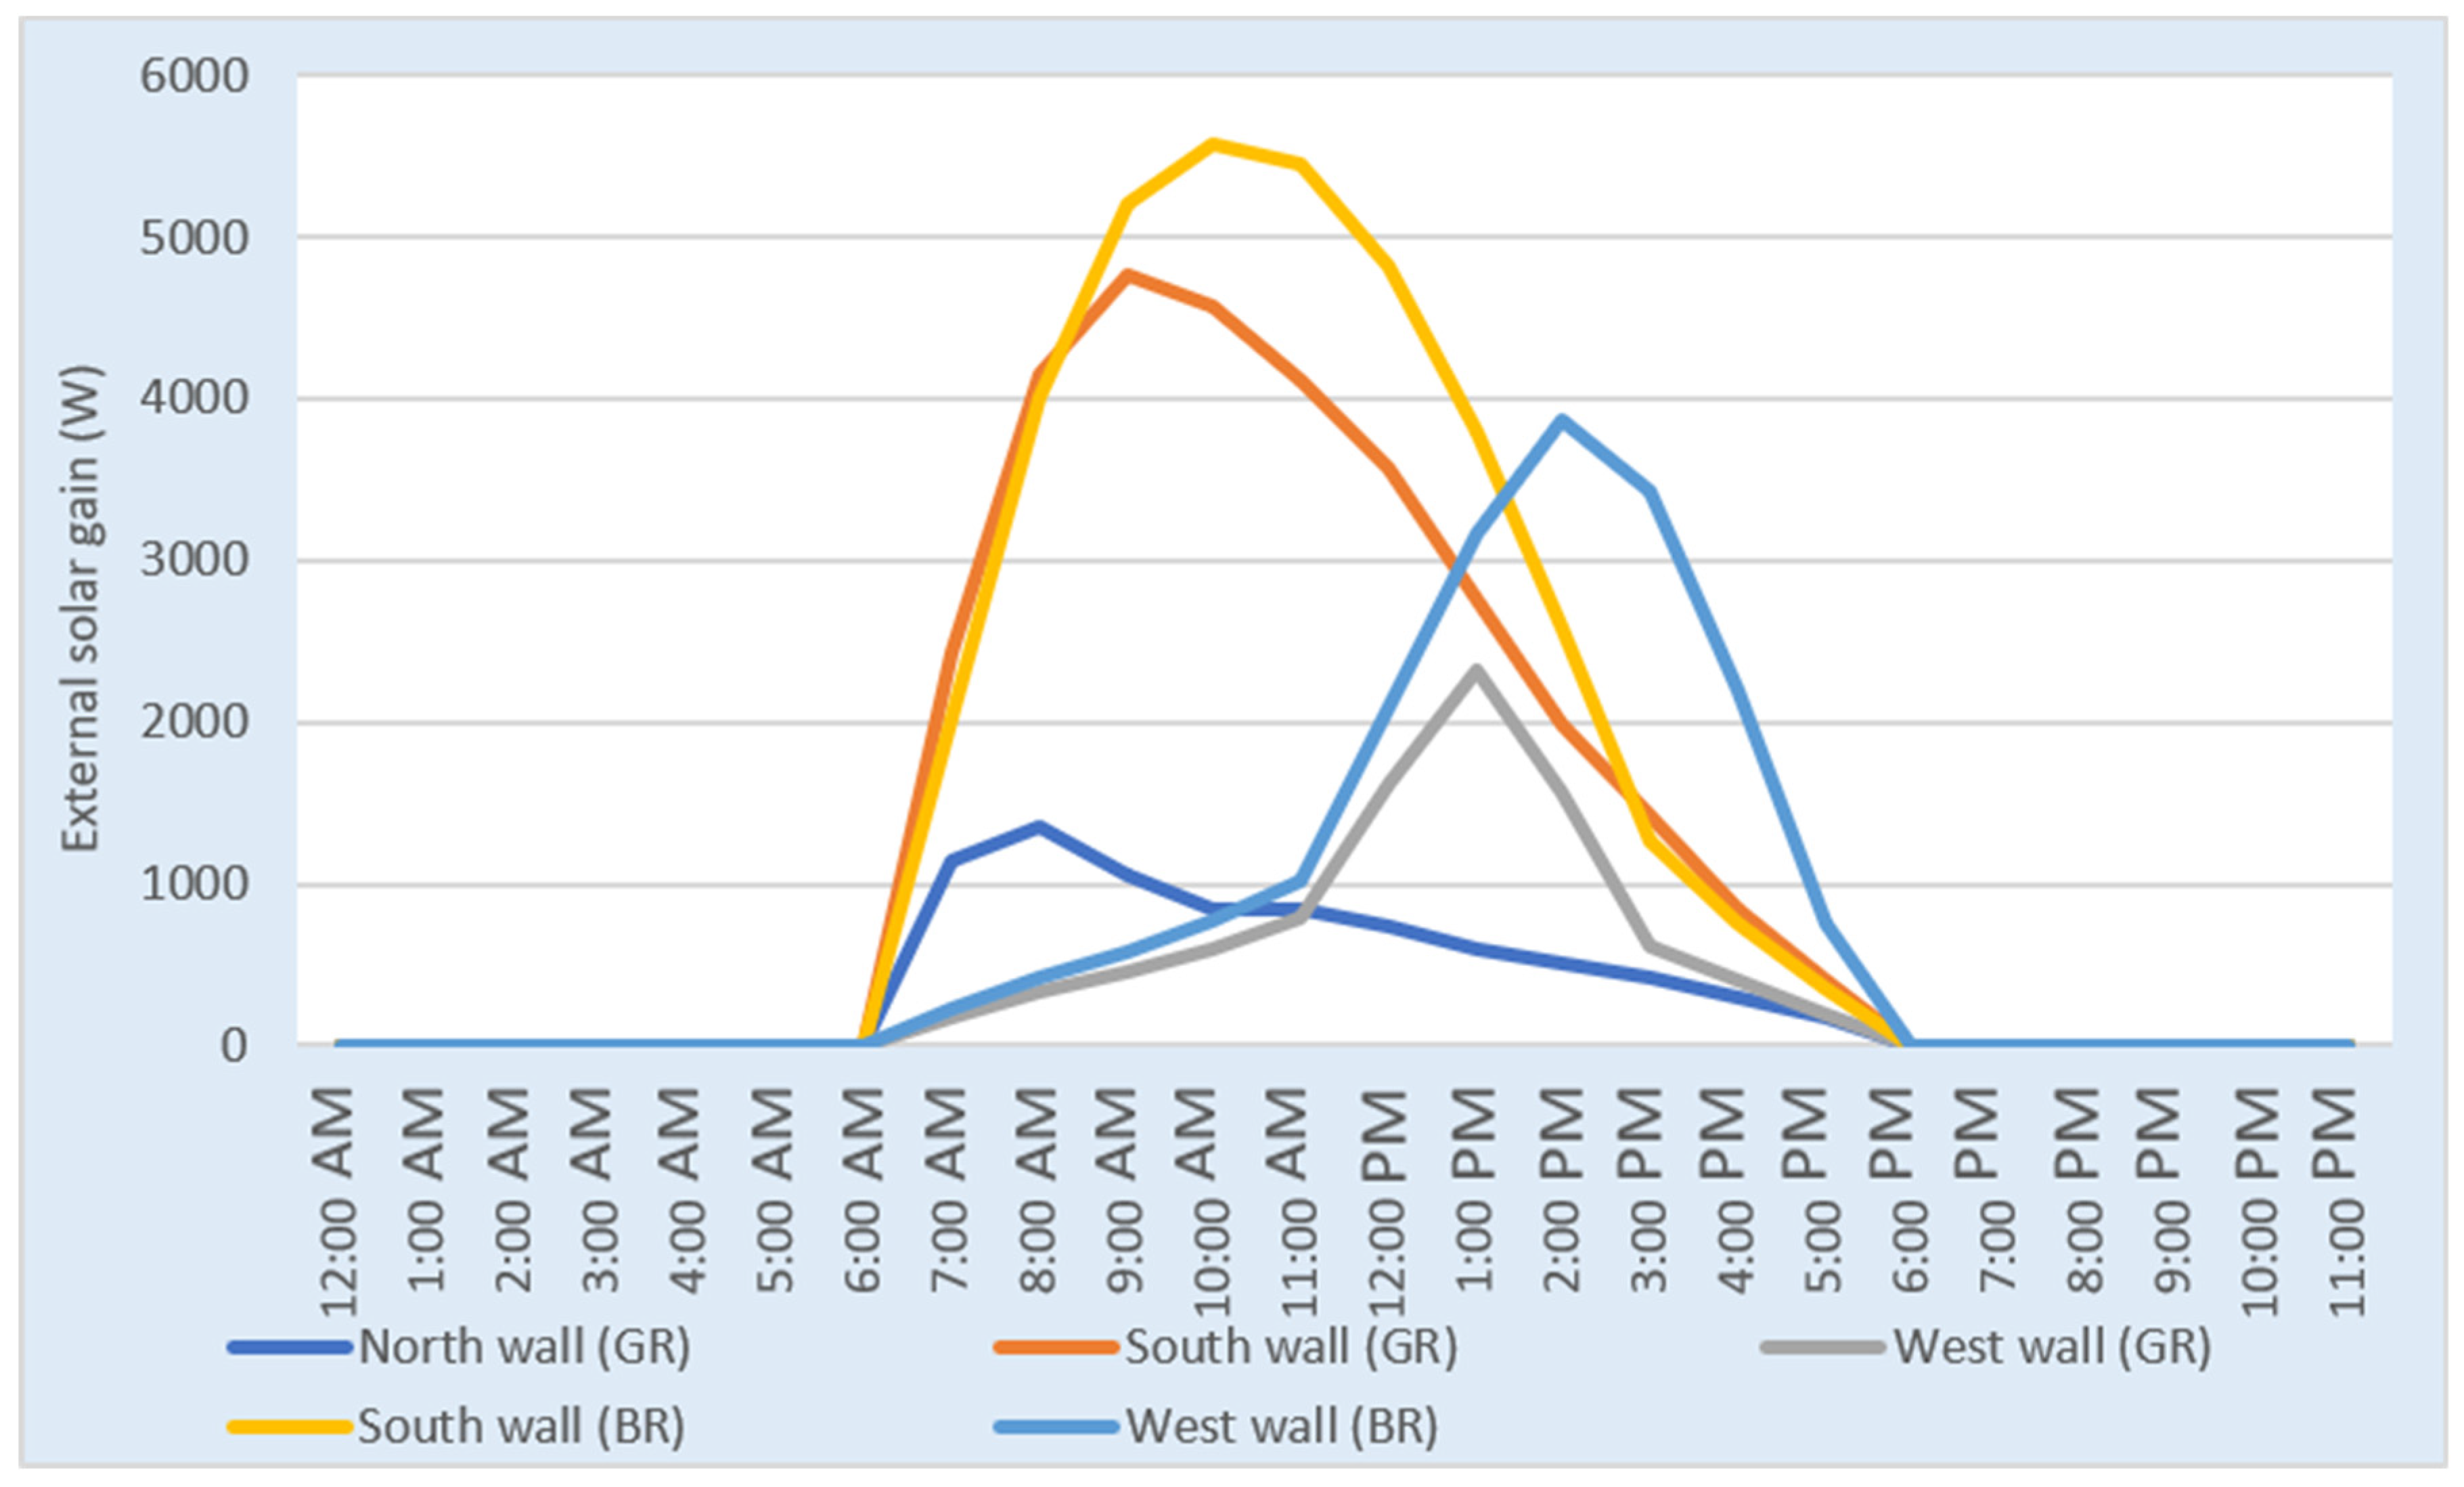
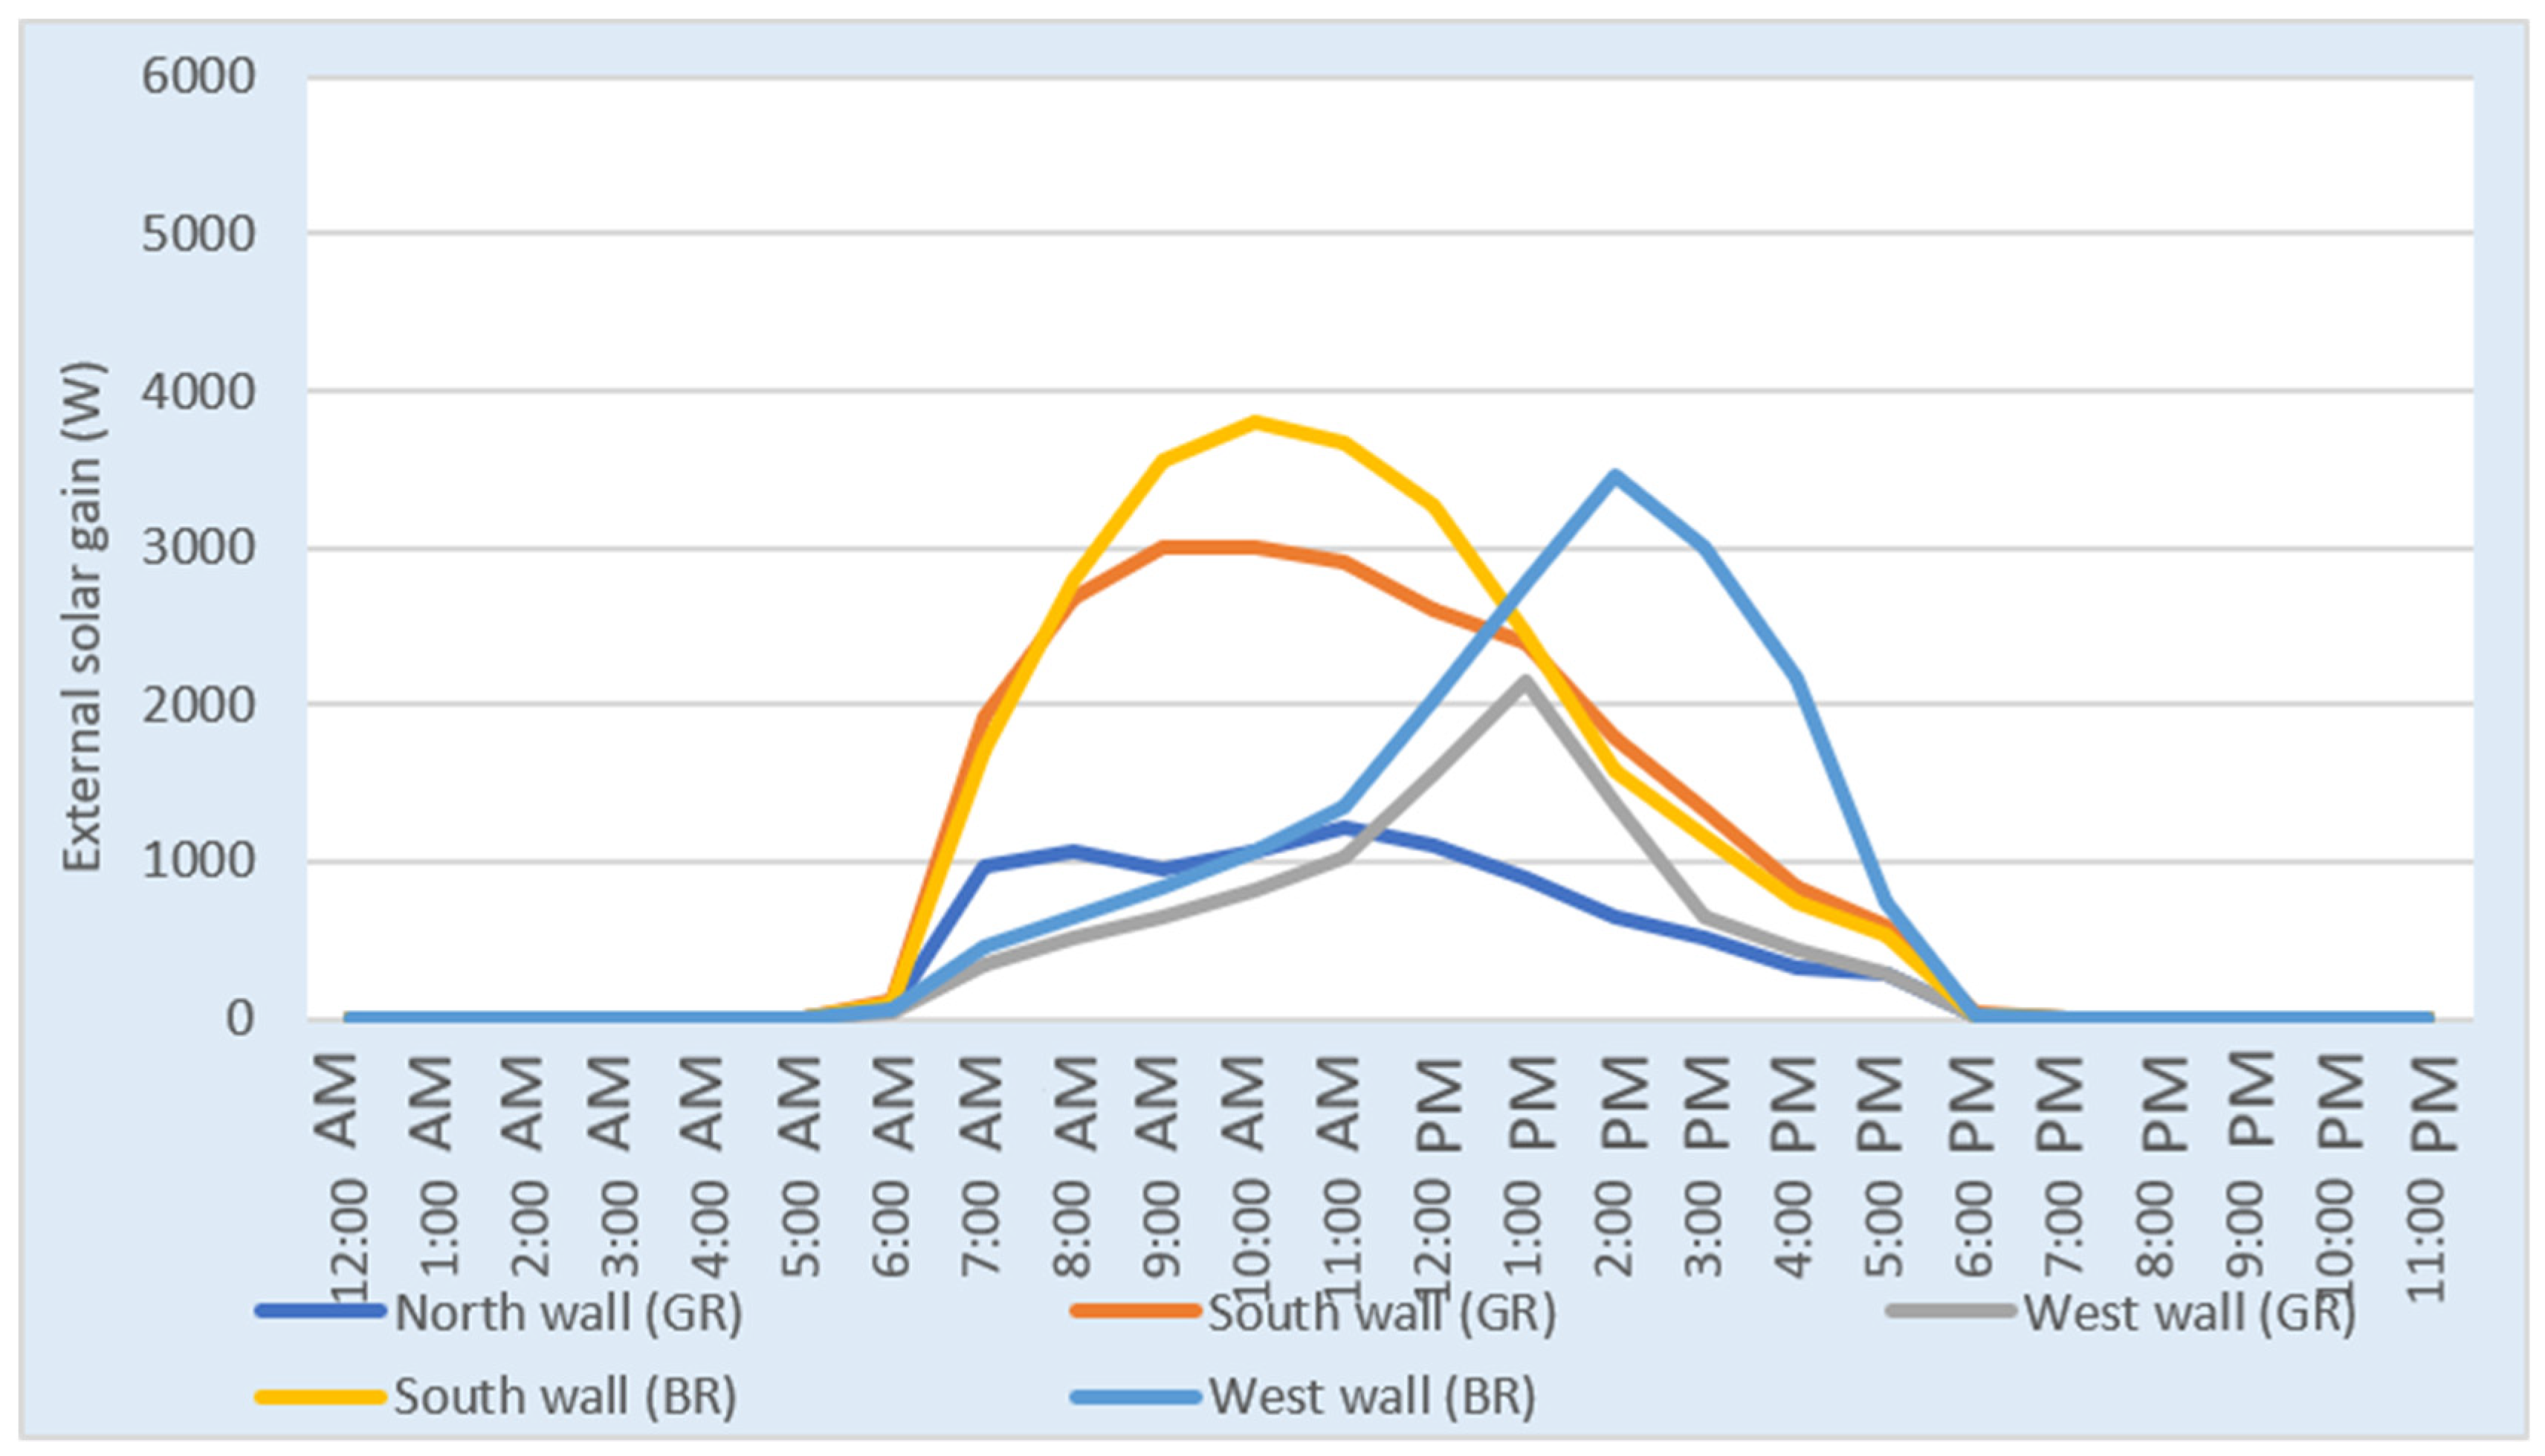
Finally, the external solar gain via the external walls followed the same pattern of the heat conduction in both seasons, as the south walls were exposed to more solar gain. In addition, the bedroom’s solar gain was slightly higher due to its location on the first floor compared with the guest room on the ground floor (see
Figure 17 and
Figure 18).
3.2.3. Comparison of the Cooling Load Benchmark
One aim of this study was to obtain a clearer picture of how various materials on the building envelope affect the cooling load and therefore optimize the related measures to reduce energy consumption in residential buildings.
Thermal loads take into account the dwelling’s construction, insulation, orientation, and compactness. How these loads are achieved depend on how builders combine floors, walls, ceilings, and roofs. The finding that the building’s windows are its most adaptable feature is supported by Ghiai et al. [
9]. They can be adjusted for placement, size, shading, and overshadowing, which opens a variety of choices for best performance.
Lower thermal loads indicate that less heating and cooling are required to maintain thermal comfort. The Saudi Building Code suggests that thermal comfort is achievable by setting the air-conditioning at 21.1 °C in winter and 23.9 °C in summer [
19]. However, the Saudi Energy Efficiency Center recommends a wider choice of A/C thermostat settings between 23 and 25 °C [
16]. In this study, the thermostat was set at 25 °C because of the implied savings in the cooling load compared with any lower indoor air-conditioning temperature. Cooling was assumed to be available year-round, mainly to quantify the effect of energy efficiency measures on the cooling load in the chosen building.
The average annual cooling load of the Makkah house was 182.7 kWh/m
2/y, similar to those of Alaboud and Gadi [
34] at 175 kWh/m
2/y and to those of Alaboud and Gadi [
35] at 181.5 kWh/m
2/y.
3.3. Suggested Building Envelope Improvement Using Thermal Analysis Software
This section investigates how improvements to house envelopes can improve the indoor thermal environment. This approach was taken for two reasons. The first was that the material loss/gain greatly influences thermal performance. The fieldwork data collection and the thermal simulation indicated that heat loss and gain occurred especially via walls and roofs, the most influential factors affecting indoor thermal performance, and leading to higher cooling loads in summer and winter. The second reason is that the quality of the building’s materials must meet the more stringent Saudi Building Code standards for new buildings to be enforced by mid-2021.
In this study, TAS was used to assess different proposed external house components, including walls, roofs, and floors. The proposed materials were simulated separately, and the potential improvement to the indoor thermal environment throughout the year was investigated by altering each element separately. Afterward, combinations of the proposed components were simulated to predict the cooling load reduction.
The market supplies many types of insulation materials with different insulating properties. In this study, only one type of insulation—polyethylene board—was applied to the proposed building materials for comparison. Polyethylene board has very low thermal conductivity (0.025 W/m.K) and is approved by Saudi Standards for use in all types of buildings.
3.3.1. Proposed Construction Layers of External Walls
To identify the best-case external wall which can improve the indoor thermal performance and achieve the lowest all year-round cooling load, various types and thickness of walls were proposed and simulated. The annual cooling load was estimated with the implementation of the proposed walls and compared with the base case of the existing walls. For the walls, thermal insulation was proposed because of its ability to control heat flow through the walls in both directions. Using thermal insulation could be applied in both winter and summer, after the roof and walls were found to be the most permeable surfaces. Heat gain through walls was highest followed by heat gain through the roof, as revealed by the thermal analysis of the house. The effectiveness of the proposed walls was tested and simulated for the whole year to establish the best case in relation to cooling load reduction. In view of the thermal analysis of the house in Makkah, three walls with different insulation thicknesses were proposed for the TAS simulation, where rooms IW1 to IW3 represent walls incorporating the thickness of thermal insulation materials. The simulation of the various proposed walls was aimed to stand for the different thermal performances using each type of wall insulation. Furthermore, descriptions for the proposed walls and the simulation results are provided in
Table 8, explaining their layers, thicknesses, U-values, and thermal conductances. Additionally, existing external walls of the house in Makkah are presented in
Figure 19.
The existing walls; the main elevation and side elevation (MW1, MW2): MW1 was only applied on the main elevation, while MW2 was applied on external side elevations. This wall is commonly used in most Saudi residential buildings. It incorporates 20 mm internal plastering, 200 mm red hollow concrete block, 20 mm external rendering, and external painting.
First case (MW2): The external and internal finishing used in MW2 was applied in all the proposed walls. Simply, the stone in the main elevation was removed and replaced by external painting.
Walls with thermal insulation (IW1 to IW3): Three types of the proposed walls incorporated cavity polyurethane board with different thicknesses (20 mm, 60 mm, and 100 mm). The highlighted wall had a U-value slightly less than the maximum value set by the SBC for Makkah’s climate.
The energy savings of the proposed external walls was measured to estimate the annual cooling load, assuming that the house in Makkah had air conditioning. The upper temperature for cooling was set at 25 °C.
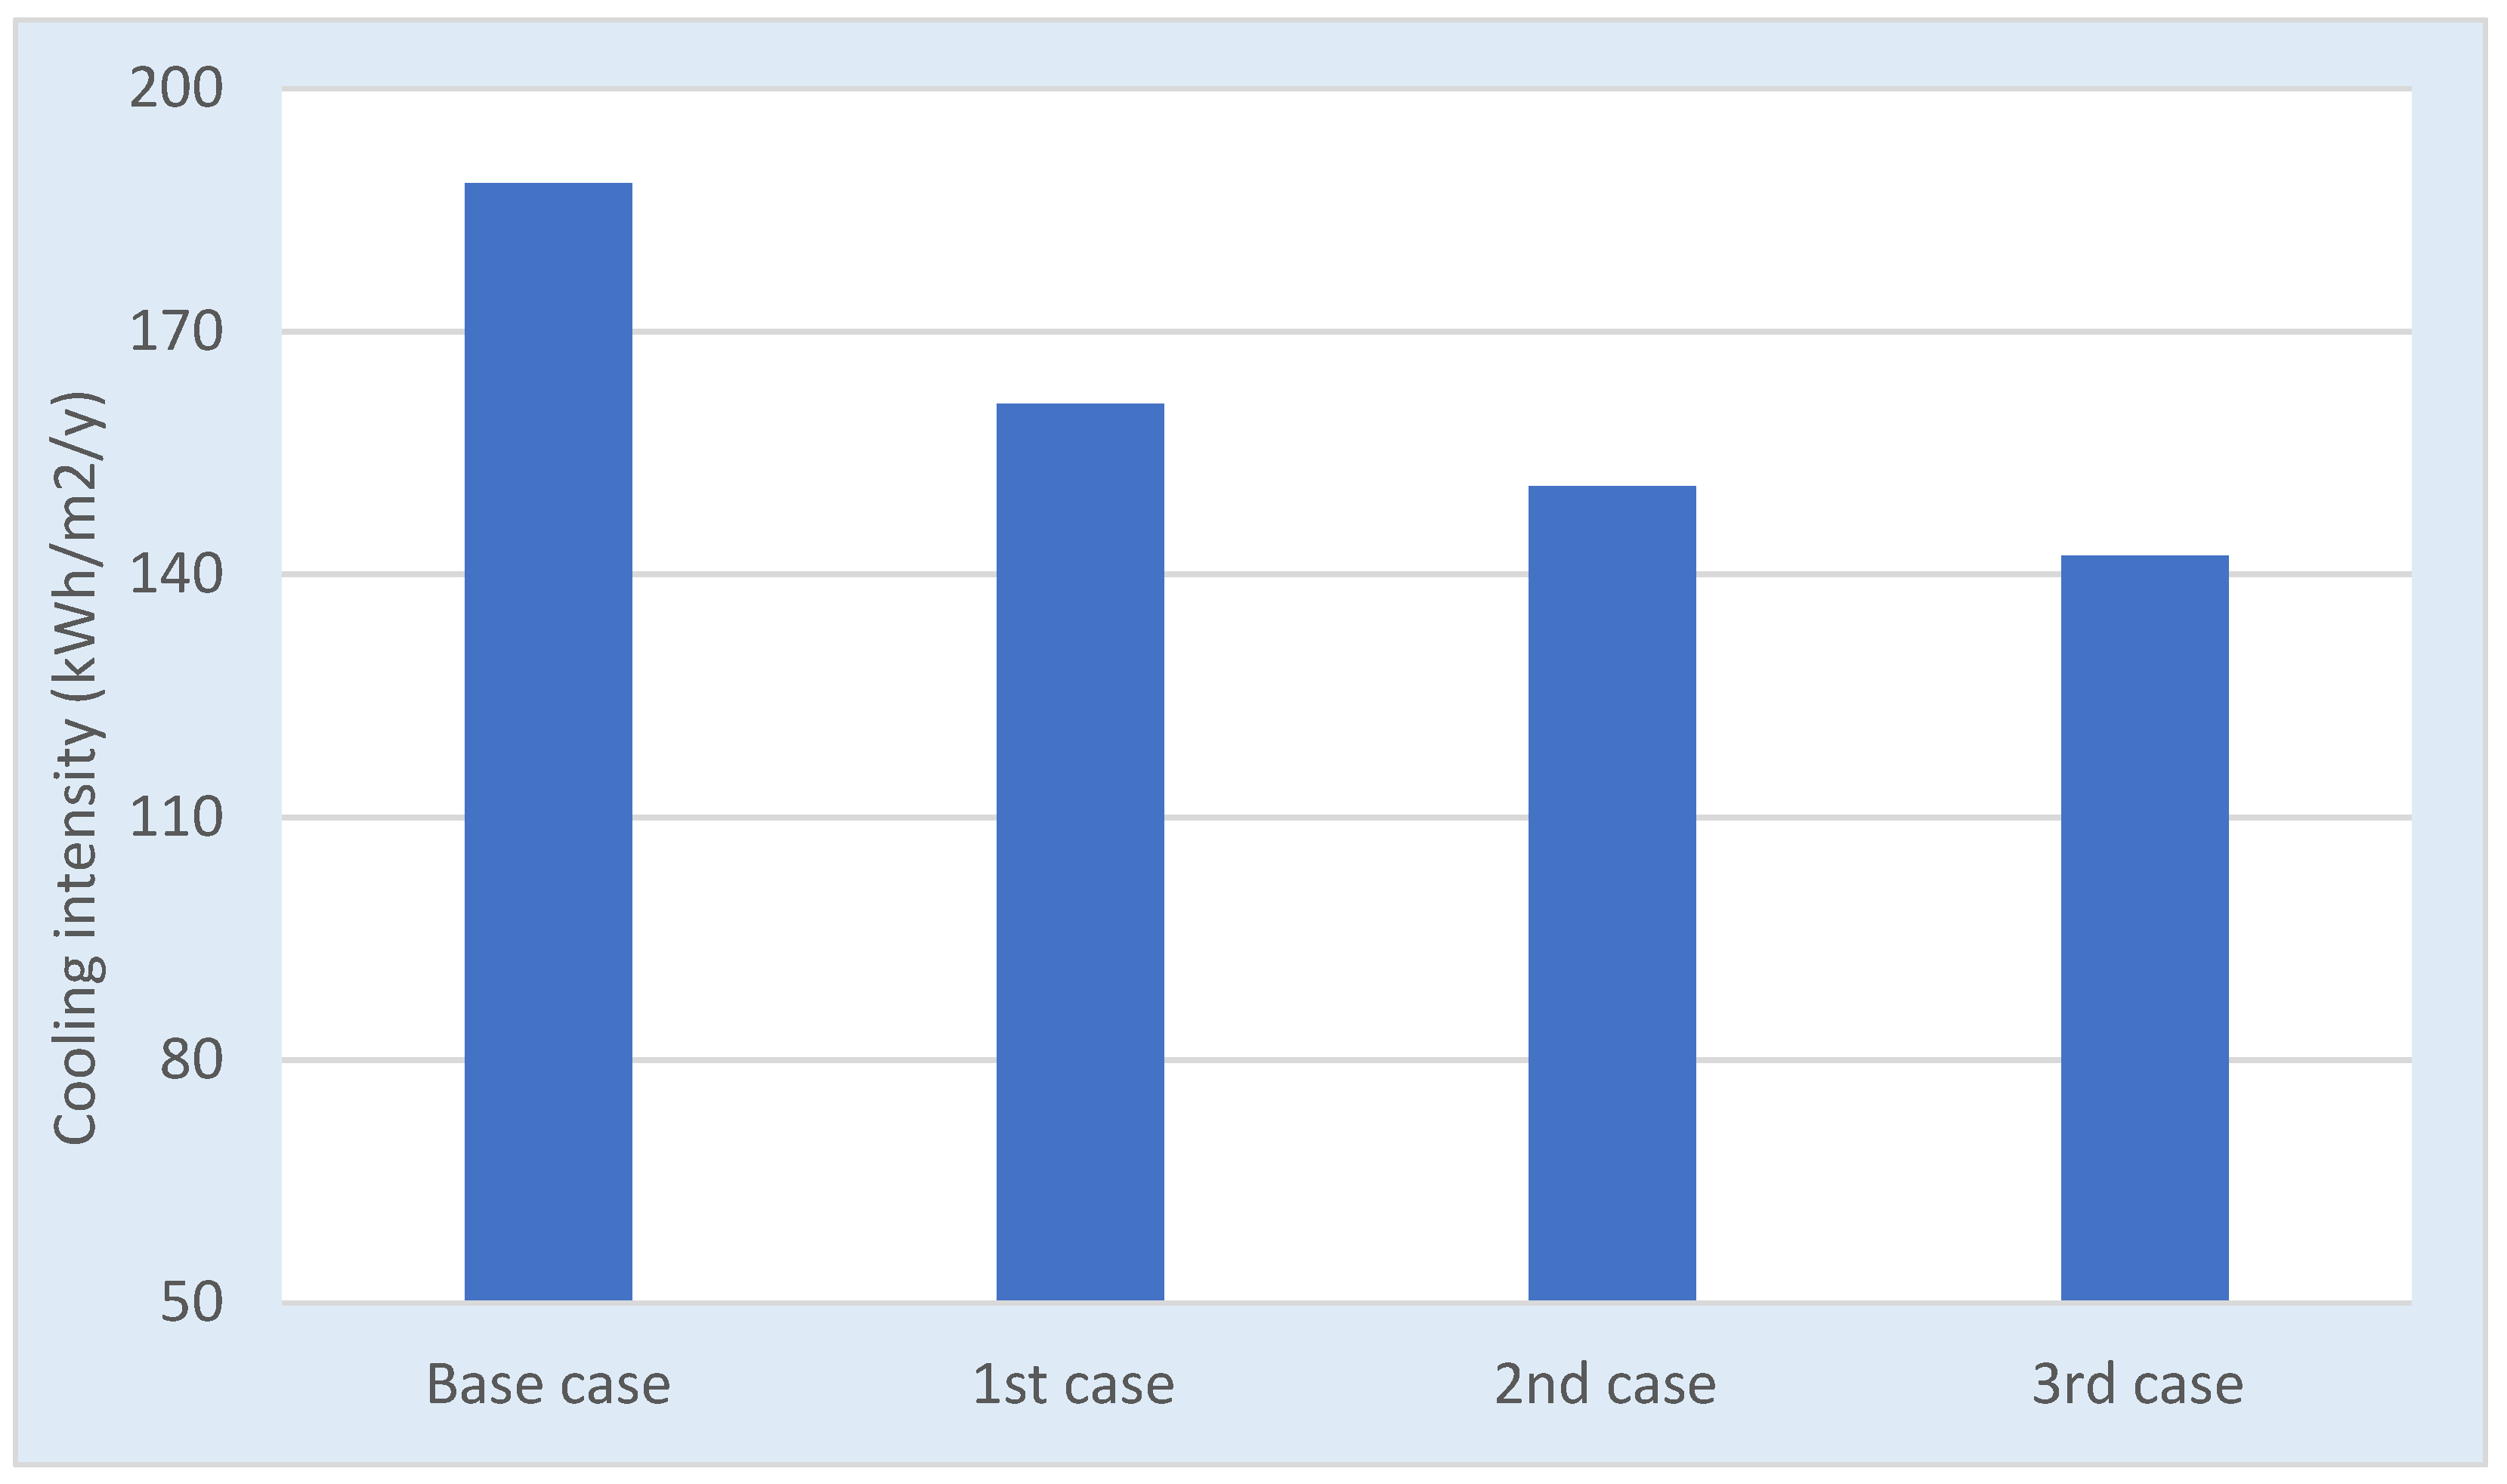
Figure 20 tabulates the annual cooling of the various walls in each case for both rooms in the Makkah house.
Table 9 provides the percentage of cooling load savings compared with the existing walls.
The results showed that by implementing the proposed walls (second case to fourth case), potential cooling load savings of 23.7%, 33.1%, and 36.2% were achieved in IW1, IW2, and IW3, respectively. However, there was small possible savings in the cooling loads in the first case at 3.1%. The results were obtained by incorporating insulation materials with various thicknesses—20 mm to 100 mm—to achieve a possible decrease in cooling load the whole year. Overall, greater reduction in cooling load was attained by using thicker insulation material with low thermal conductance. Using 100 mm insulation material in IW3 achieved the highest savings in cooling load. However, increasing the thickness of the insulation materials is subject to the law of diminishing returns. Beyond a certain point, increasing insulation thickness has a diminished impact on cooling load savings. To compare between the three insulated walls, IW1 had a potential savings of 23.7% compared to the base case, while IW2 had a potential savings of 12.3% compared to IW1; finally, IW3 had a potential savings of 4.5% compared to IW2. Consequently, IW2 was chosen to improve the indoor thermal environment for its potential savings of the cooling load and because it complied with the required Saudi building standards walls’ U-value for the house in Makkah.
3.3.2. Proposed Construction Layers of Roof
To identify the best-case proposed roof that can improve the indoor thermal performance and achieve the lowest all year-round cooling load, various types and thicknesses of roofs were proposed and simulated. The annual cooling load was estimated with the implementation of the various proposed roofs and then compared with the base case roof. Heat gain through roof was the second highest in the Makkah house. In addition, heat gain through the roof in summer and winter was higher than the heat lost via the roof. Therefore, various types of roofs, with lower thermal conductance than the existing roof, were proposed to minimize the heat gain. The use of additional thermal insulation was proposed for the roof.
Table 10 sets out the proposed roofs, explaining their layers, thicknesses, U-values, and thermal conductance.
The existing roof (MR1) is a common roof type used in most residential buildings. It incorporates 50 mm internal gypsum board with internal plaster and painting, 300 mm reinforced concrete slab, 170 mm sand, cement mortar, and terrazzo tile. The external and internal finishing used in MR1 was applied in all the proposed roofs.
Roofs with thermal insulation (IR1 to IR3): Three types of the proposed roofs incorporated cavity polyurethane board with different thicknesses (25 mm, 50 mm, and 100 mm). The highlighted roof was the one with a little less U-value than the maximum value required by the SBC for Makkah’s climate.
The energy savings of the proposed roofs was measured for the Makkah house to estimate the annual cooling load. The Makkah house was assumed to have air conditioning. The upper temperature for cooling was set at 25 °C.
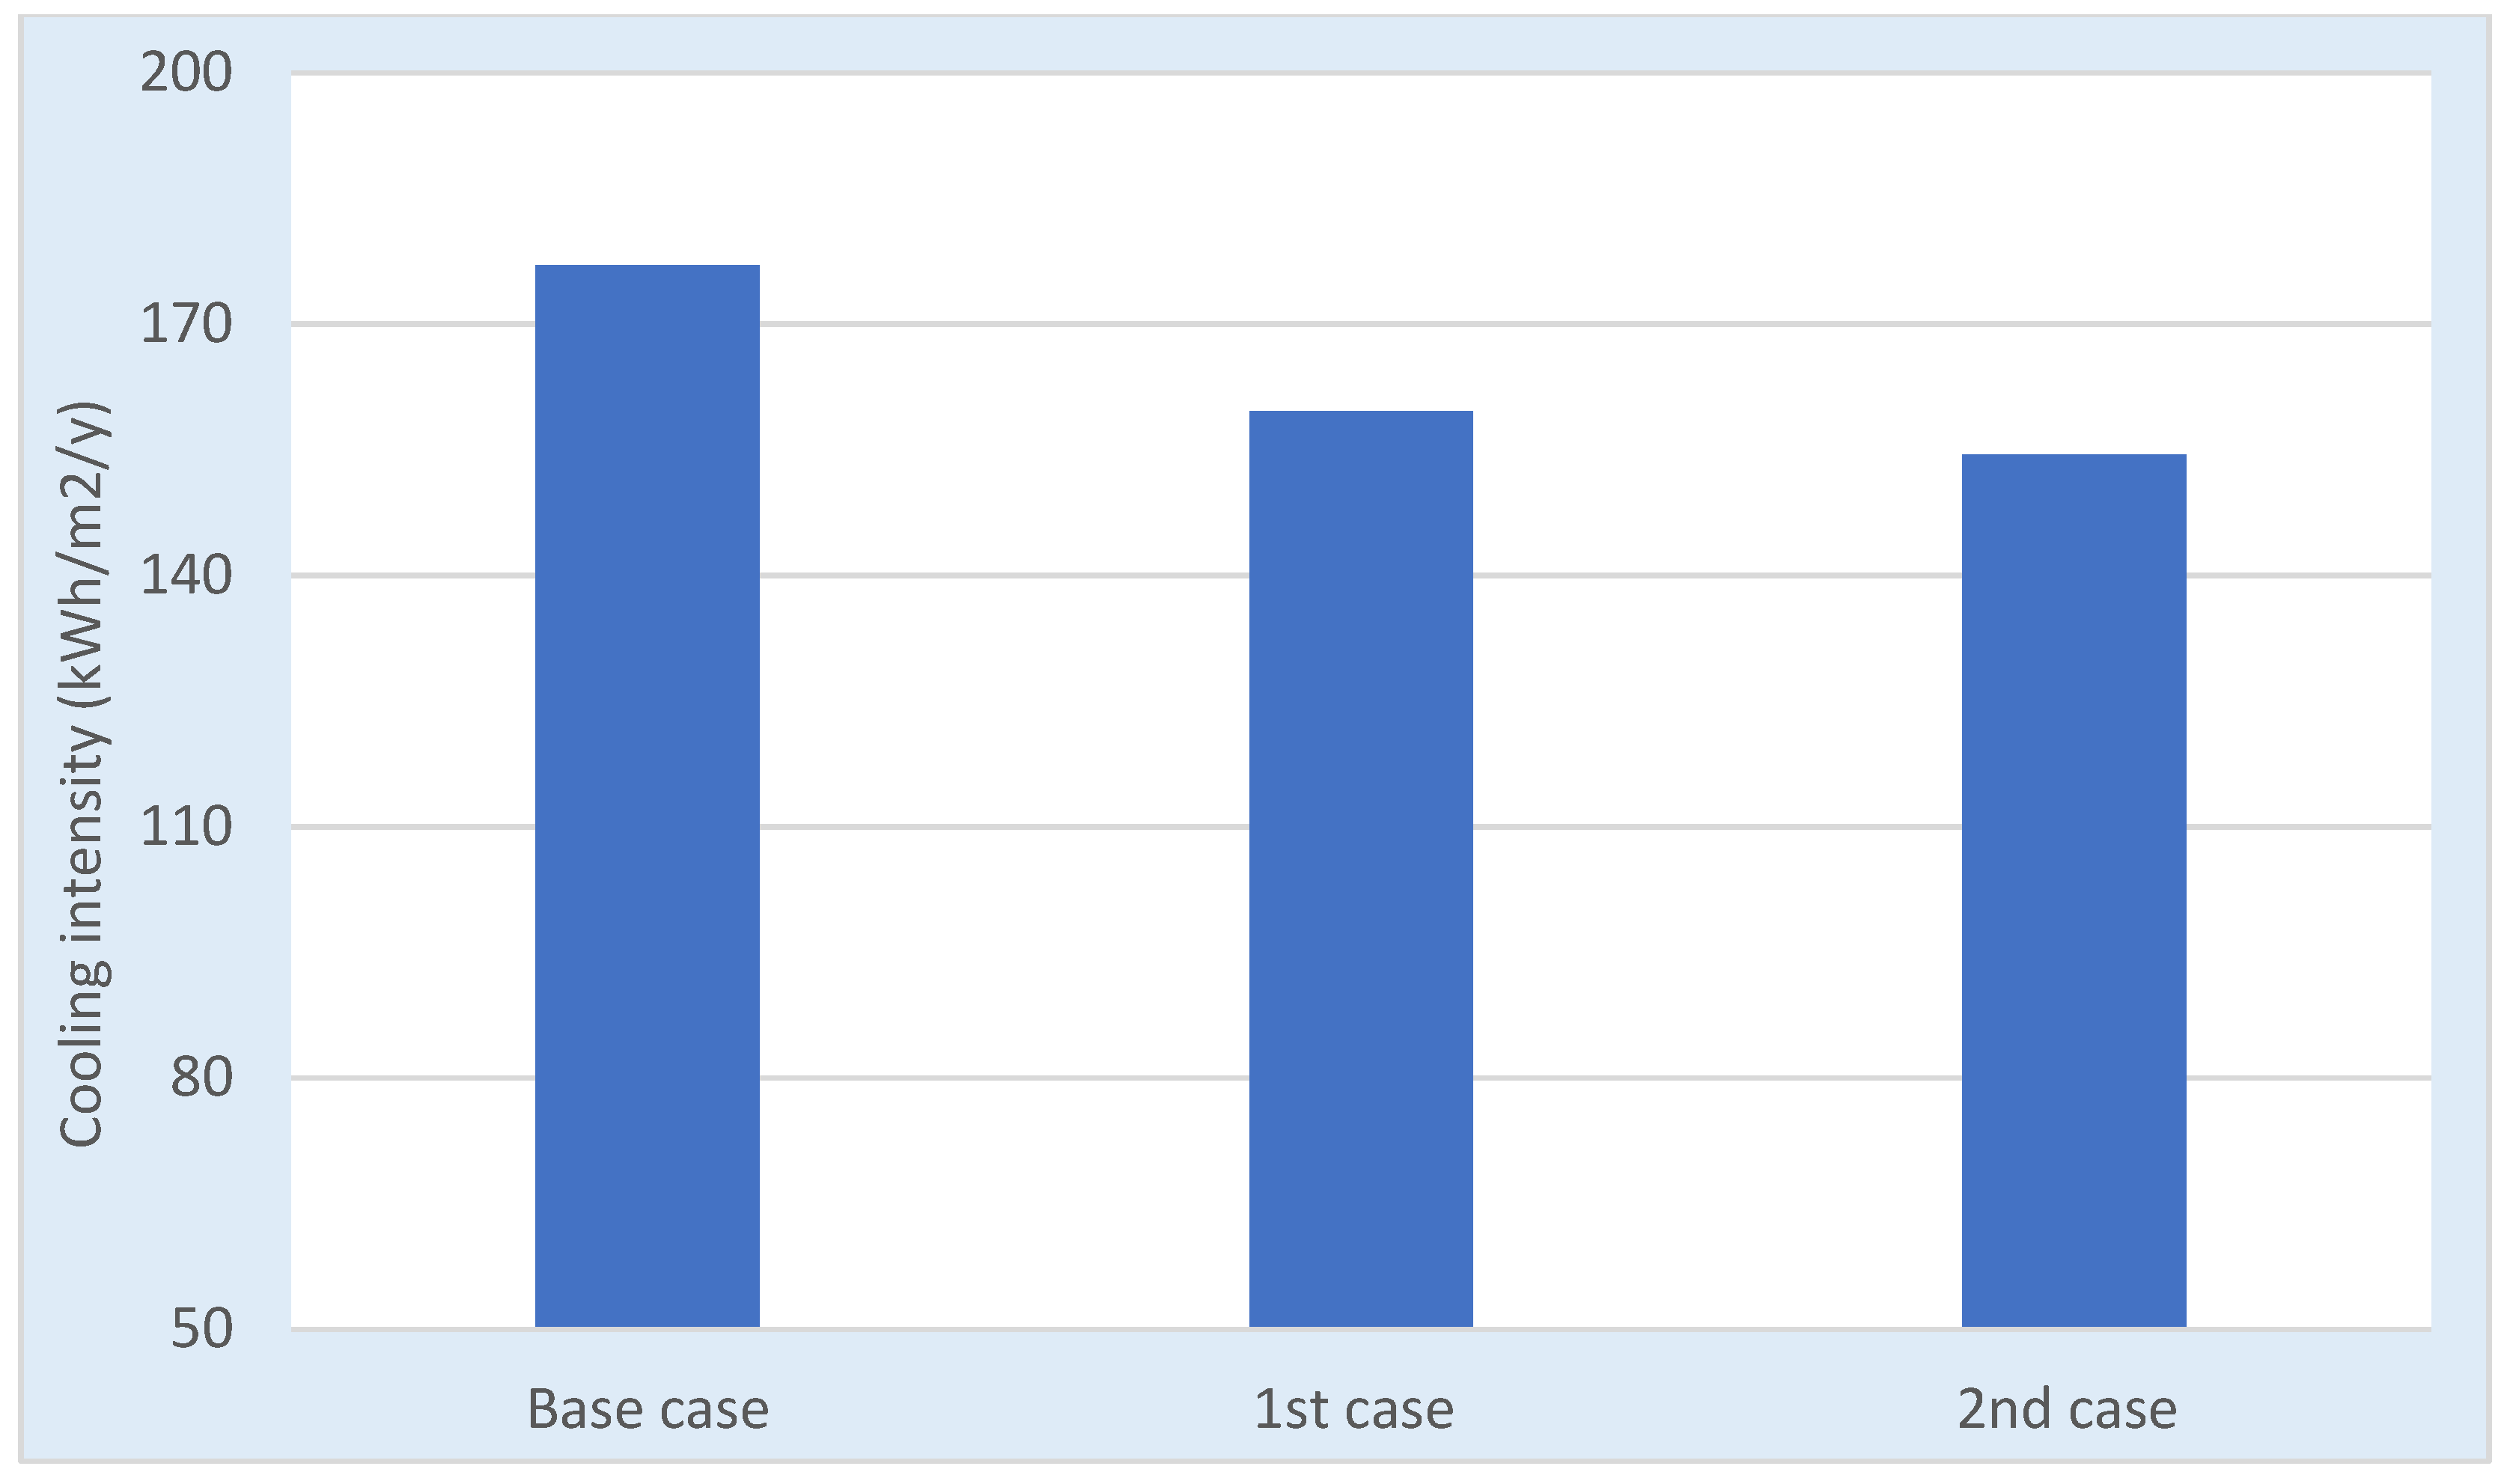
Figure 21 sets out the reduction in the annual cooling load achieved using the permutations the various roofs in each case for only the bedroom in the first floor in the house in Makkah.
Table 11 tabulates the percentage of cooling load savings compared with the existing roof.
Only the bedroom was chosen for simulation as it was on the first floor and exposed to solar radiation. The results show that by implementing the insulated proposed roofs (first case to third case), the potential savings in the cooling loads of 14.4%, 19.8%, and 24.4 % were achieved in IR1, IR2, and IR3, respectively. The results revealed that by incorporating insulation materials with various thicknesses from 25 mm to 100 mm, a possible decrease in cooling load could be obtained the whole year. Overall, a greater decrease in cooling load was attained with greater thickness of the insulation material, which had very low thermal conductance. Therefore, the highest savings in cooling load was achieved by using 100 mm insulation material in IR3.
Additionally, increasing the thickness of the insulation materials had a notable impact on cooling load savings. To compare between the three insulated roofs, IR1 had potential savings of 14.4 % compared to the base case, while IR2 had potential savings of 6.3% compared to IR1; finally, IR3 had potential savings of 5.7% compared to IR2. Consequently, IR3 was chosen to improve indoor thermal environment for its savings potential of the cooling load and because it complied with the required roof U-value by Saudi building standards for the house in Makkah.
3.3.3. Proposed Construction Layers of Floors
Two types of ground floors were proposed and simulated to improve the indoor thermal performance and achieve the lowest cooling load all year. The annual cooling load was estimated when the various proposed ground floors were implemented and compared with the base case of the existing floor. Heat gain through the ground floors on a summer day was lower than heat loss, but heat gain on a winter day was higher than heat loss. There was zero heat loss through the ground floor on a winter day. Therefore, ground floors with various thicknesses and lower thermal conductance than the base ground floor were proposed to minimize heat loss in summer and heat gain in winter.
Table 12 provides the proposed ground floors explaining their layers, thicknesses, U-values, and thermal conductance.
The ground floor (MF1) in Makkah is a commonly used floor type in most residential buildings. It is constructed from terrazzo tiles fixed on 150 mm cement mortar and sand, which are bedded on 300 mm plain concrete.
Ground floors with thermal insulation (IF1 and IF2): two types of the proposed floors incorporated cavity polyurethane board with respective thicknesses of 30 mm and 60 mm. The highlighted ground floor was the one with a little less U-value than the maximum value set by the SBC for Makkah’s climate.
The energy savings delivered by the proposed ground floors was calculated to estimate the annual cooling load. The assumption was that the Makkah house has air conditioning. The upper temperature for cooling was set at 25 °C.
Figure 22 sets out the annual cooling achieved by implementing the ground floor permutations in only the ground floor guest room.
Table 13 provides the percentage of cooling load savings compared with the existing roof in MF1.
Only the guestroom was chosen because it is on the ground floor. The results show that by implementing the insulated proposed floor (first case and second case), the potential savings in cooling load were 9.9% and 12.8%, achieved in IF1 and IF2, respectively. A possible reduction in cooling load could be obtained all year round by varying the thicknesses of insulation materials from 30 mm to 60 mm. The thicker the insulation material (low thermal conductance), the greater the reduction in cooling load. Therefore, the largest savings was achieved by using 60 mm insulation material in IF2. Therefore, increasing the thickness of the insulation materials beyond 60 mm incurs a diminishing savings on cooling load. To compare between the two insulated ground floors, IF1 had potential savings of 9.9% compared to the base case, while IF2 had a potential savings of 3.2% compared to IF1. Consequently, IF1 was chosen to improve the indoor thermal environment for its savings potential of the cooling load and because it complied with the ground floor U-value set by Saudi building standards.
3.3.4. Proposed Combination of Building Materials
Combinations of the various proposed walls, roofs, and ground floors were selected and simulated to identify the overall indoor thermal performance to achieve the lowest cooling load throughout the year. The annual cooling load was estimated by implementing various combinations of materials and comparing them to a base model of existing materials. The house envelope’s potential cooling savings were calculated. Explanations for the selected combinations, the simulation results, and the percentage of cooling load savings compared with the materials in place are provided in
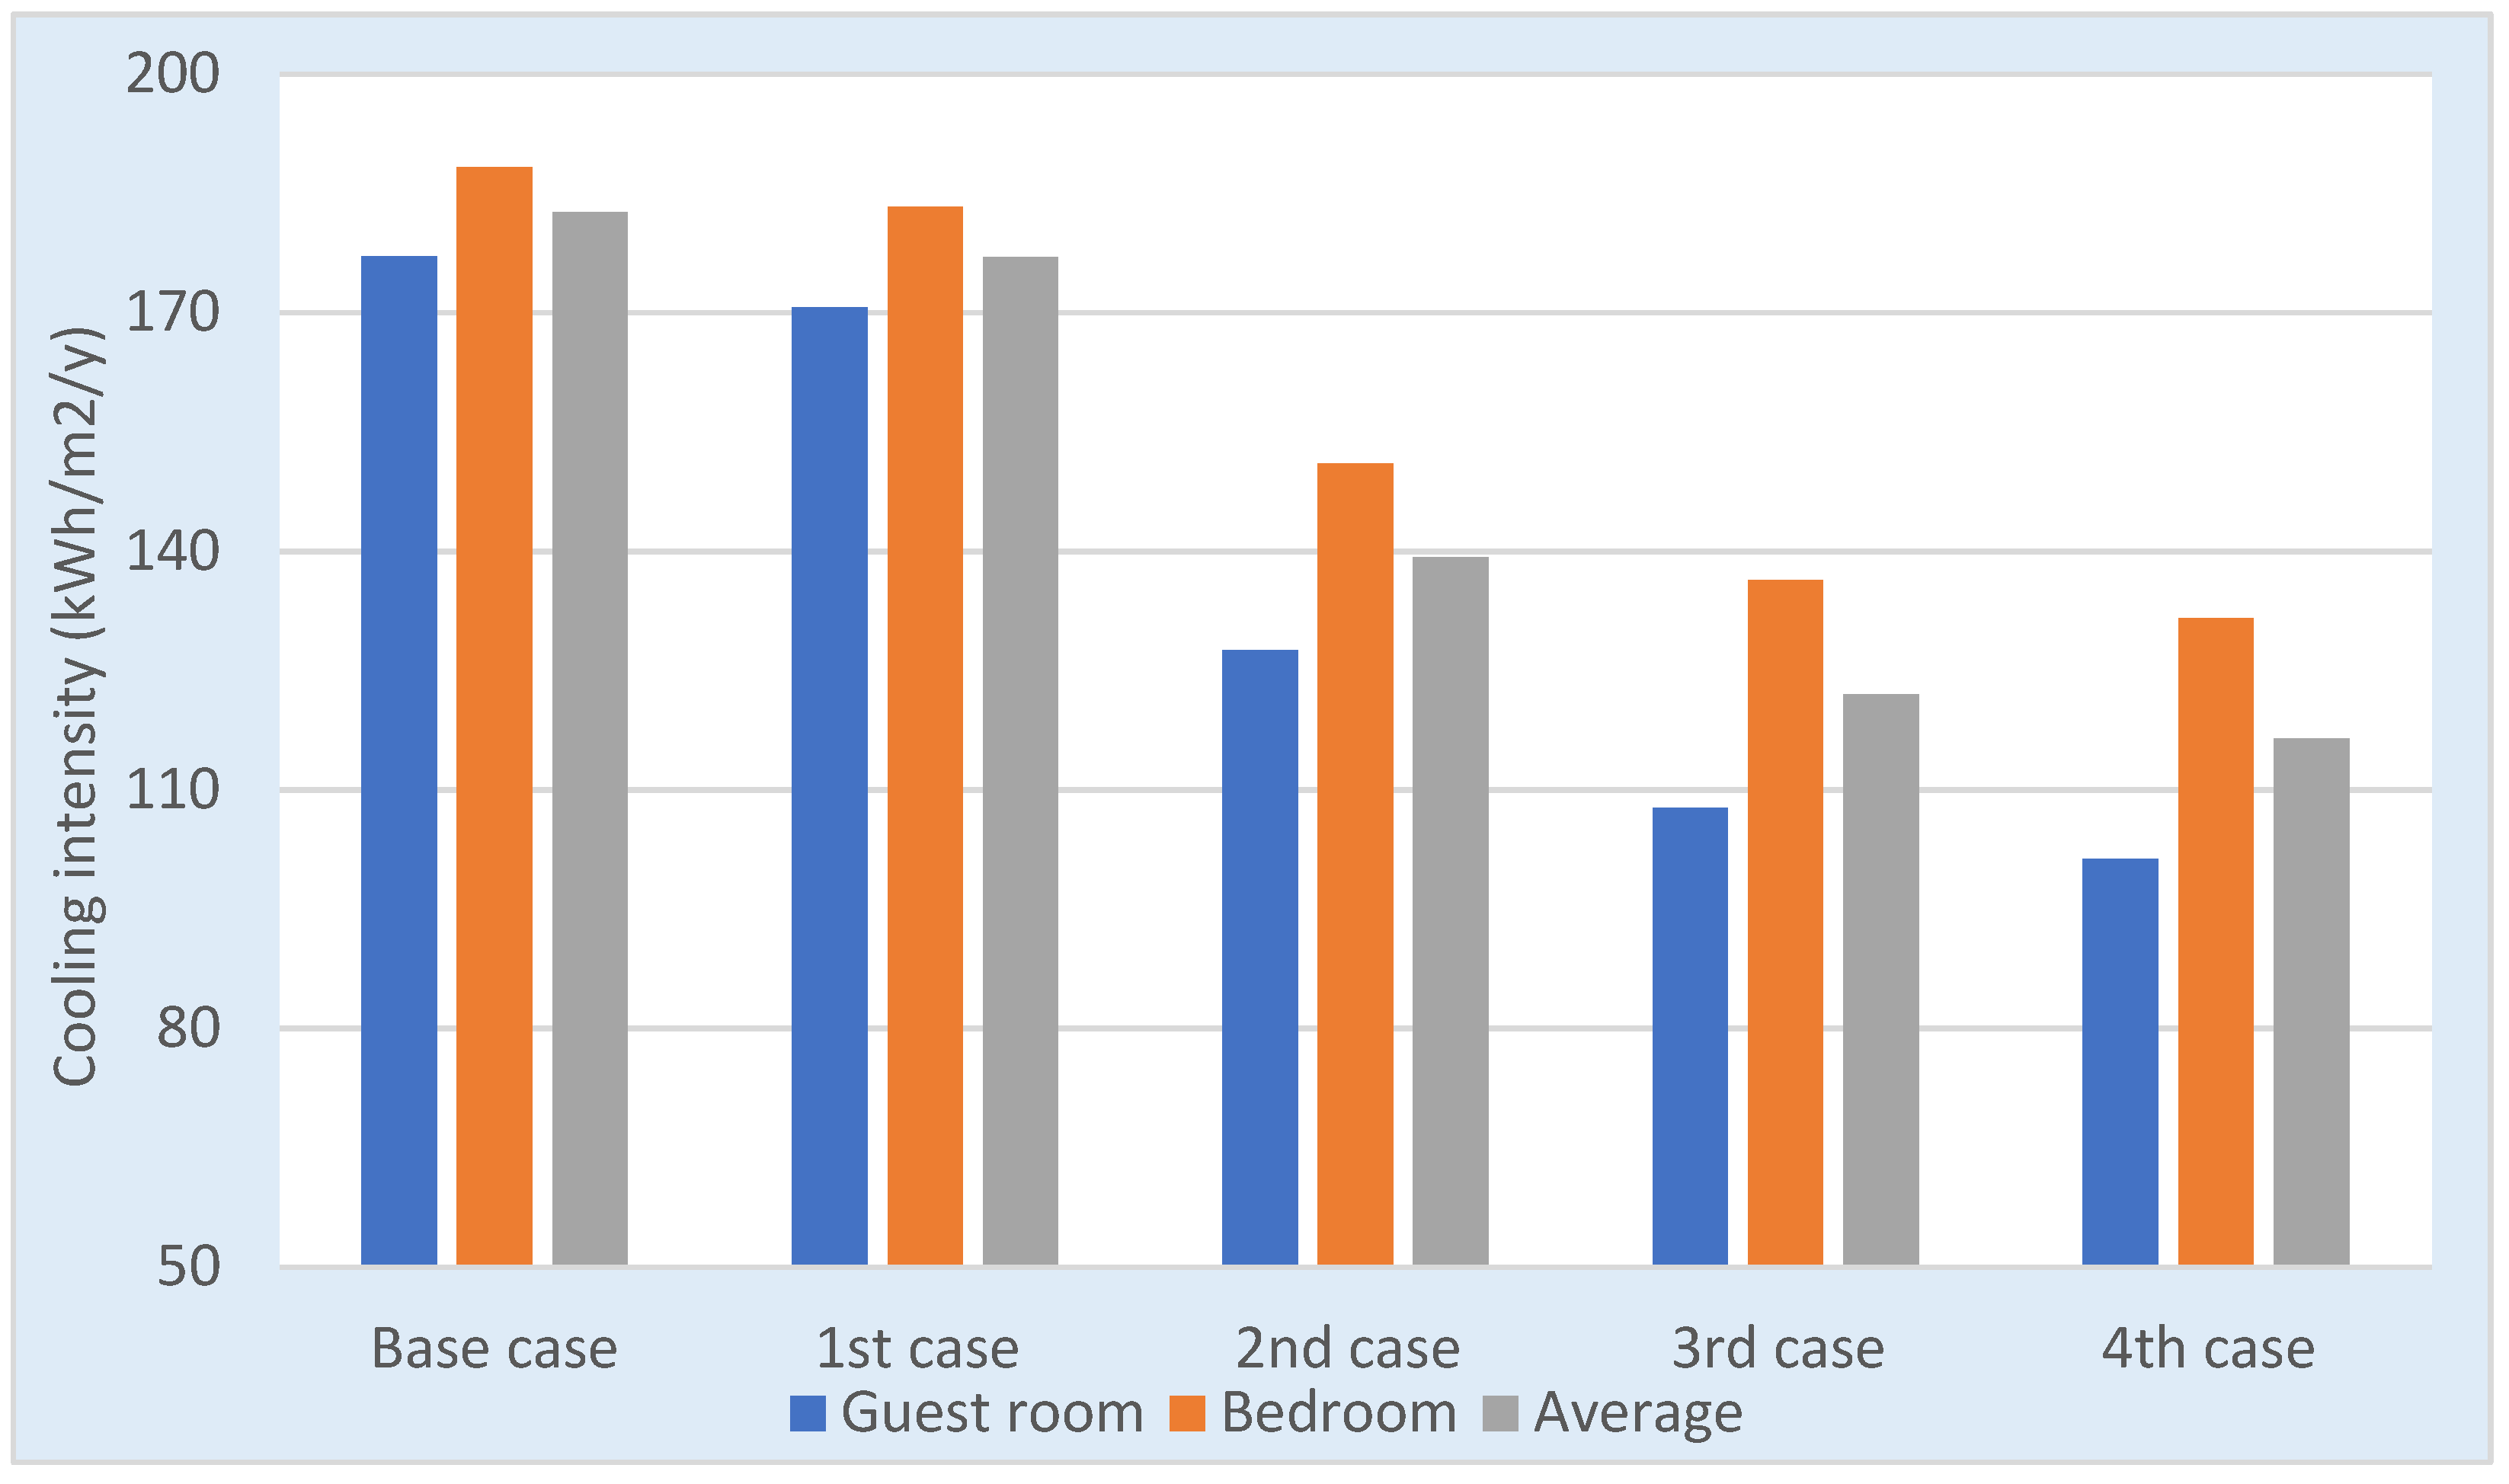
Table 14. One proposed floor, one proposed wall, and one of the proposed roofs were selected to form two combinations of materials. The first case was a combination of the proposed roof and walls but without the proposed floor, while the second case (best case) was a combination of the proposed roof, walls, and floor. The selection was based on the annual potential improvement in cooling load.
The cooling savings of the proposed material combinations were measured to estimate the annual cooling load, where the house was assumed to have air-conditioning. The upper temperature was set at 25 °C.
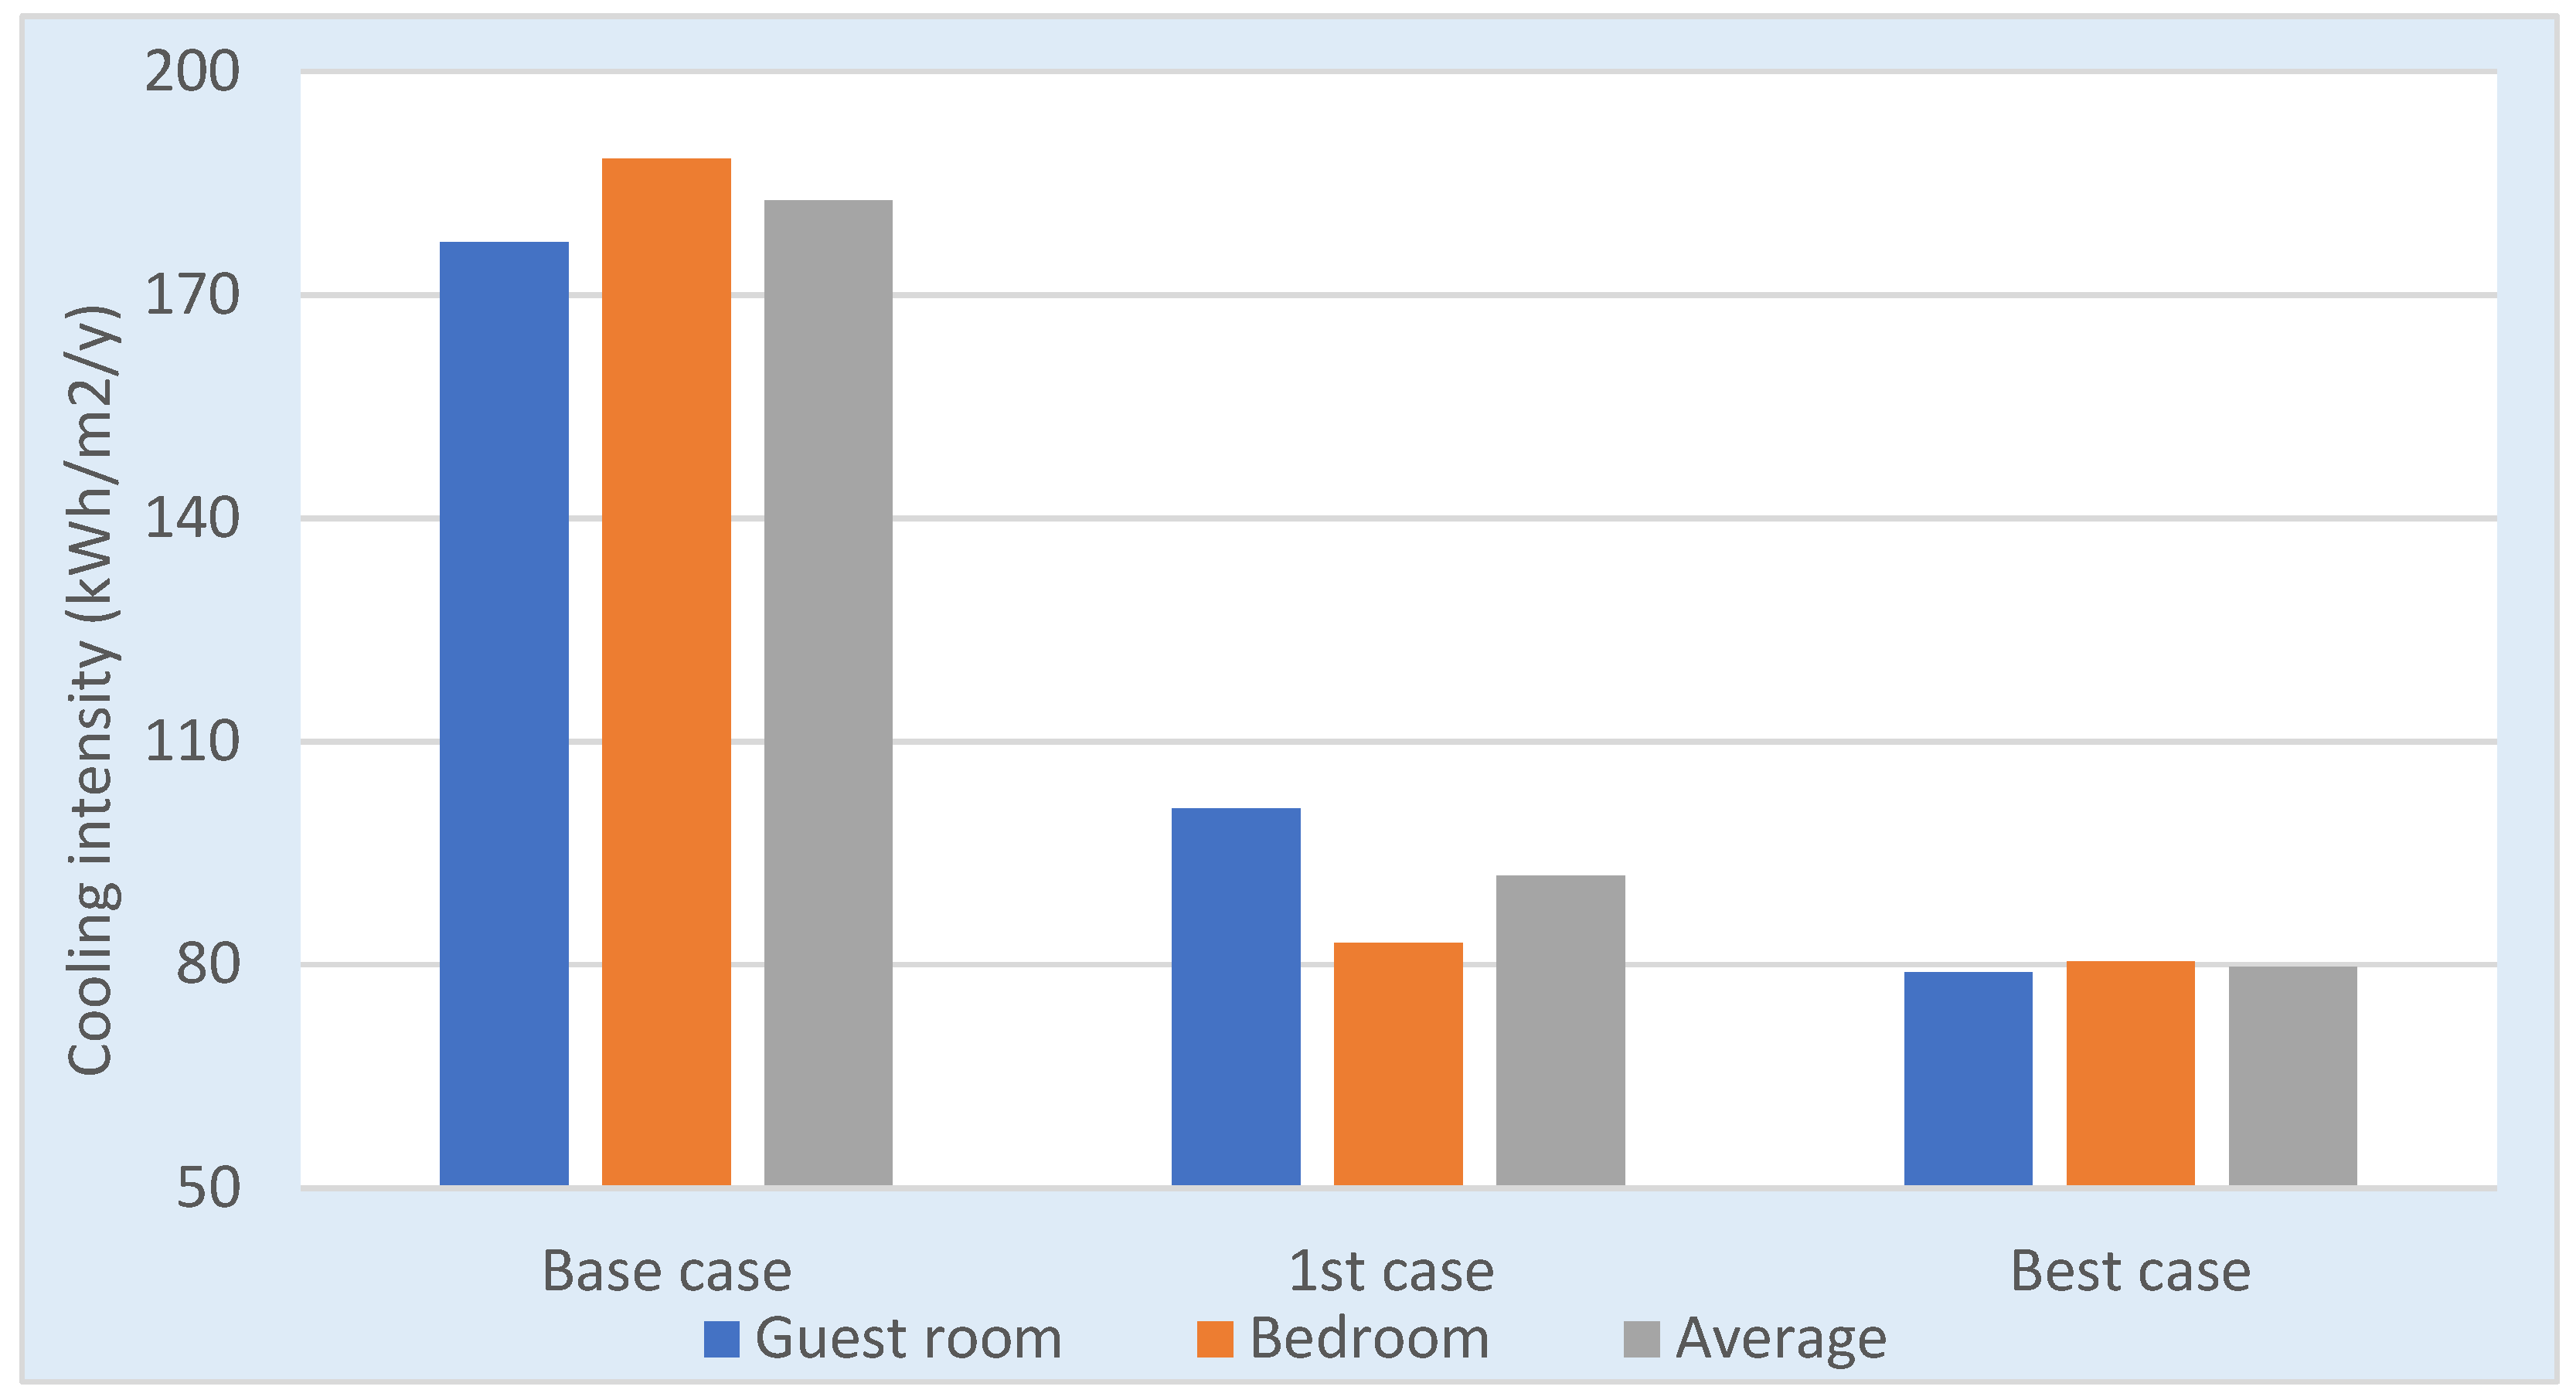
Figure 23 provides the annual cooling load with the implementation of the various combinations of materials in the two rooms. The results revealed that the material combination in MC1 produced a potential savings of 49.7% in the cooling load, while MC2 achieved the best case with a reduction of 56.4%.
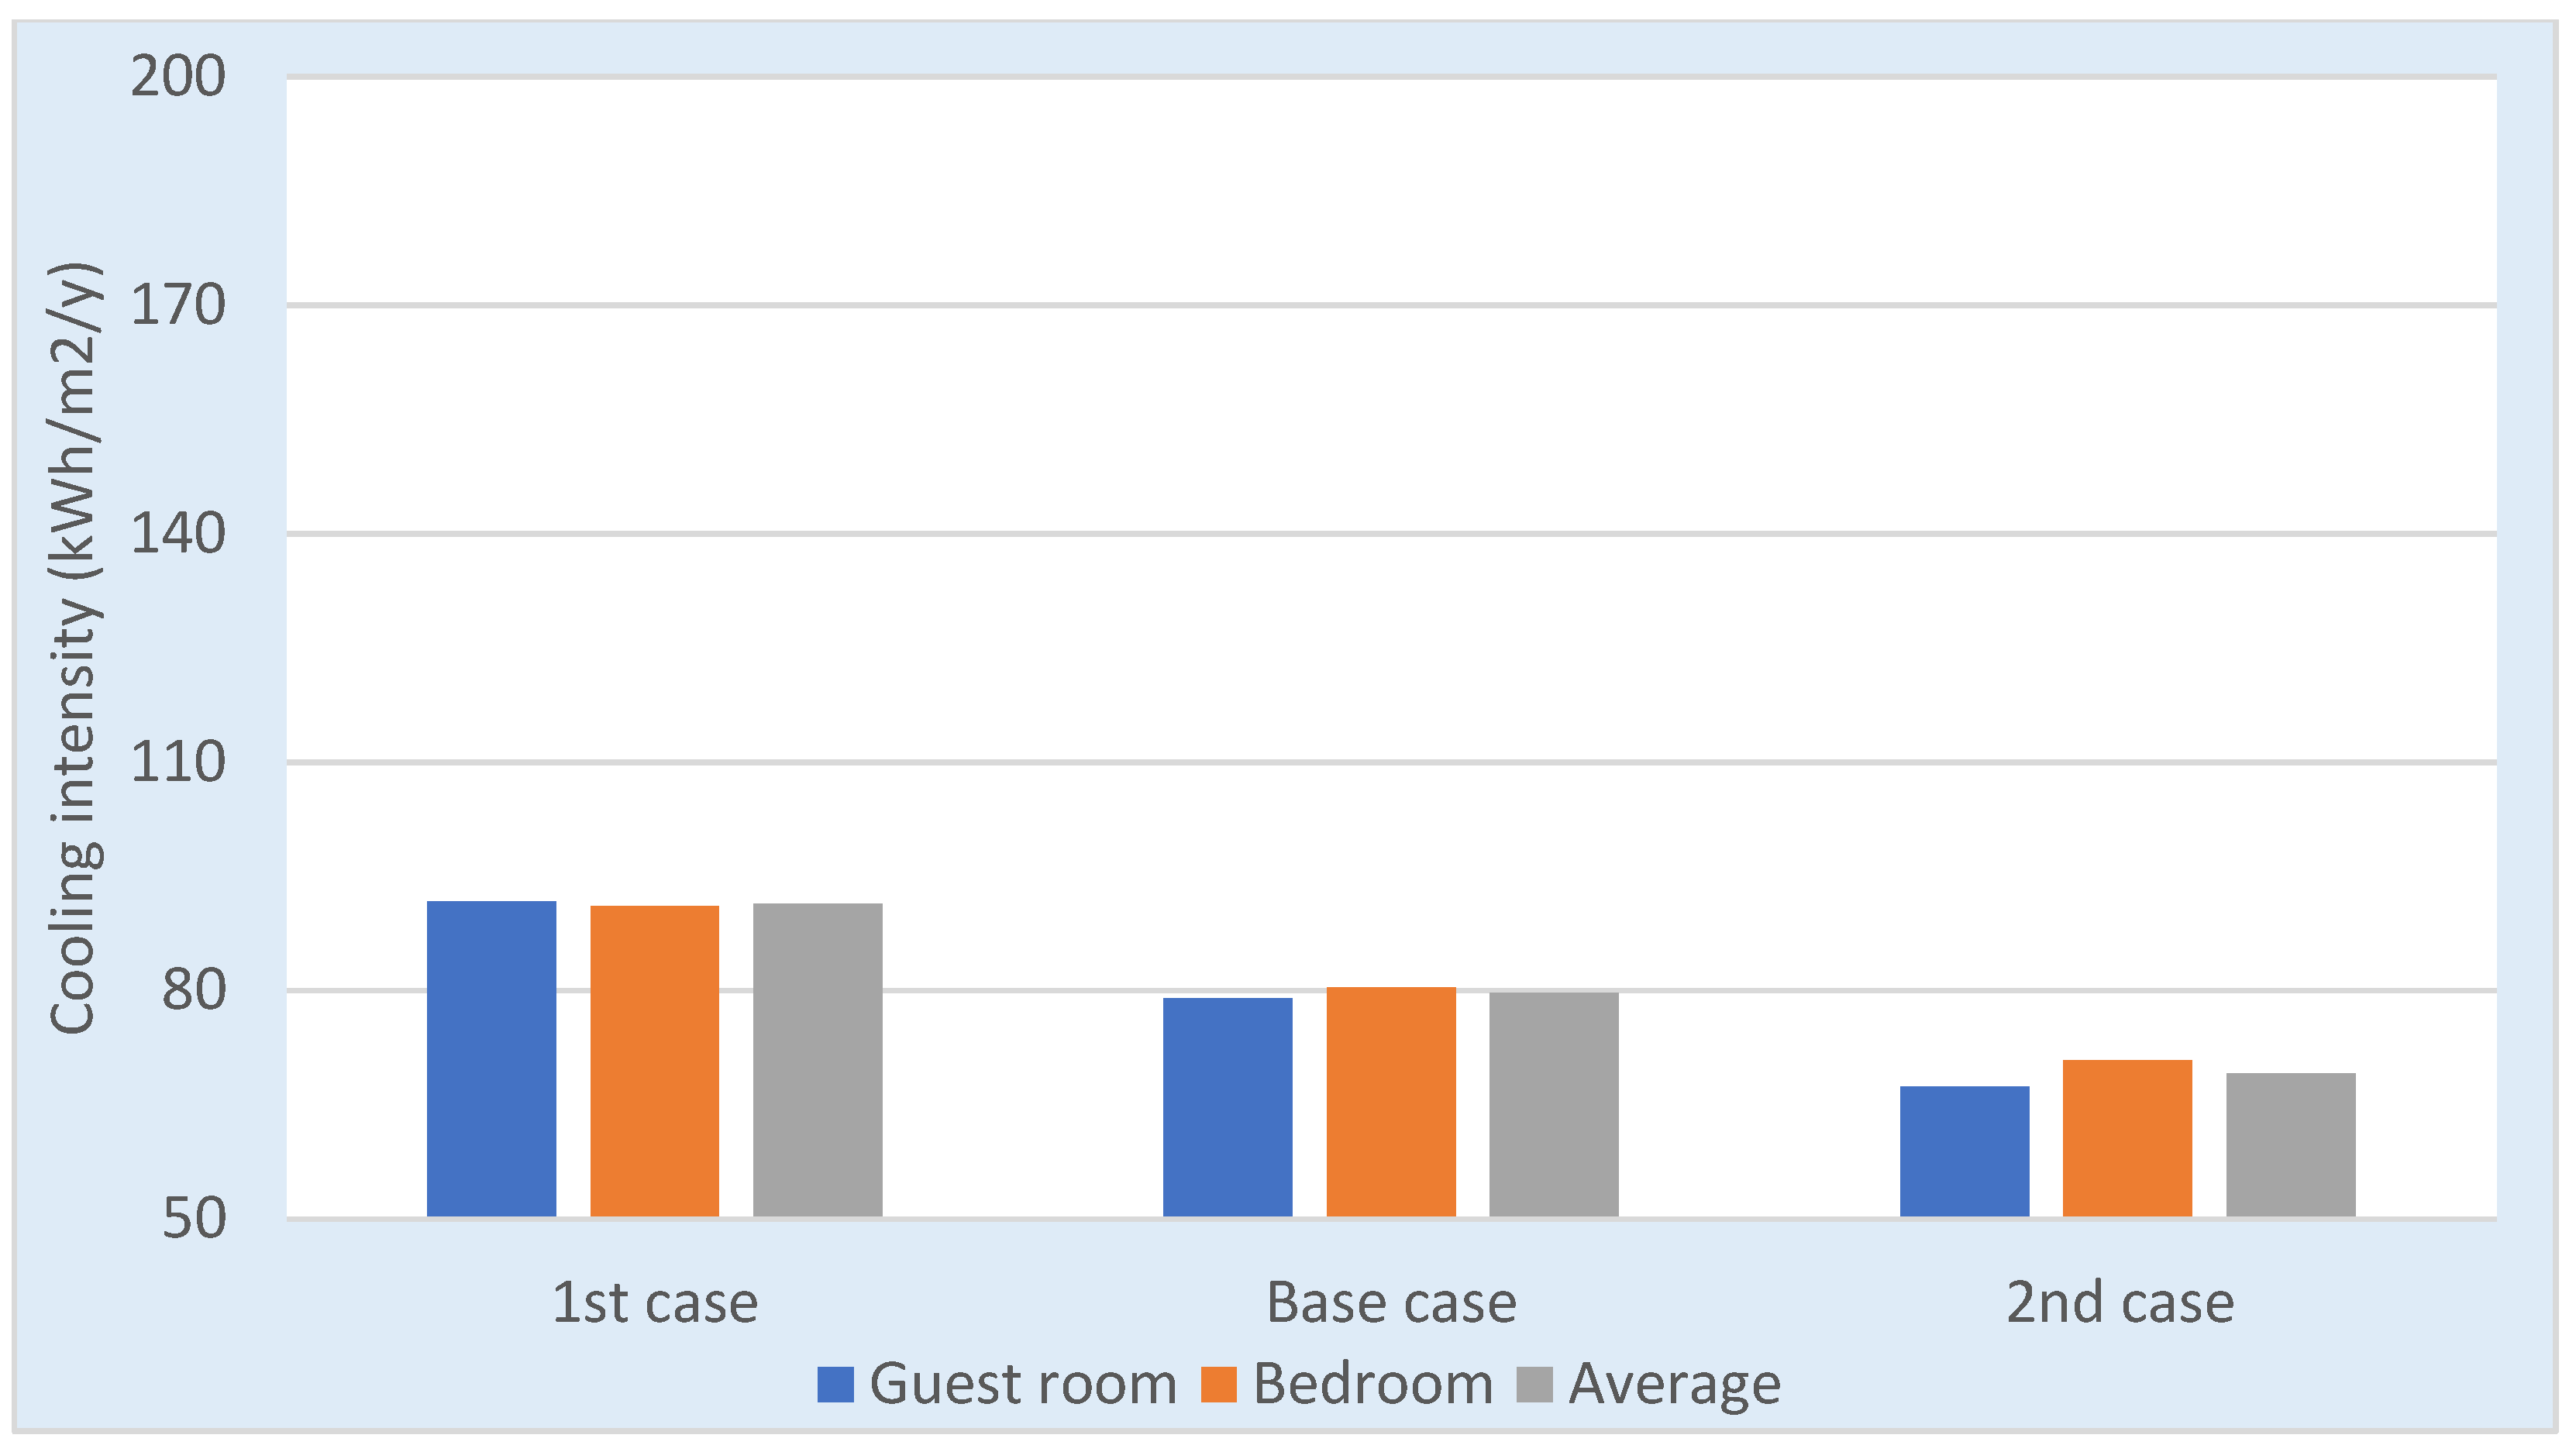
As the outdoor temperature falls below 25 °C at night, nighttime ventilation was proposed for the studied rooms. The annual cooling load was estimated when applying the night ventilation whenever the outside temperature was less than 25 °C, along with the implementation of the best case recommended material combinations. The best case was compared with the ventilation strategy to estimate the potential percentage reduction in cooling load (see
Table 15). The results revealed a slight potential cooling load reduction of 6.5% by applying nighttime ventilation with the best case (see
Figure 24).
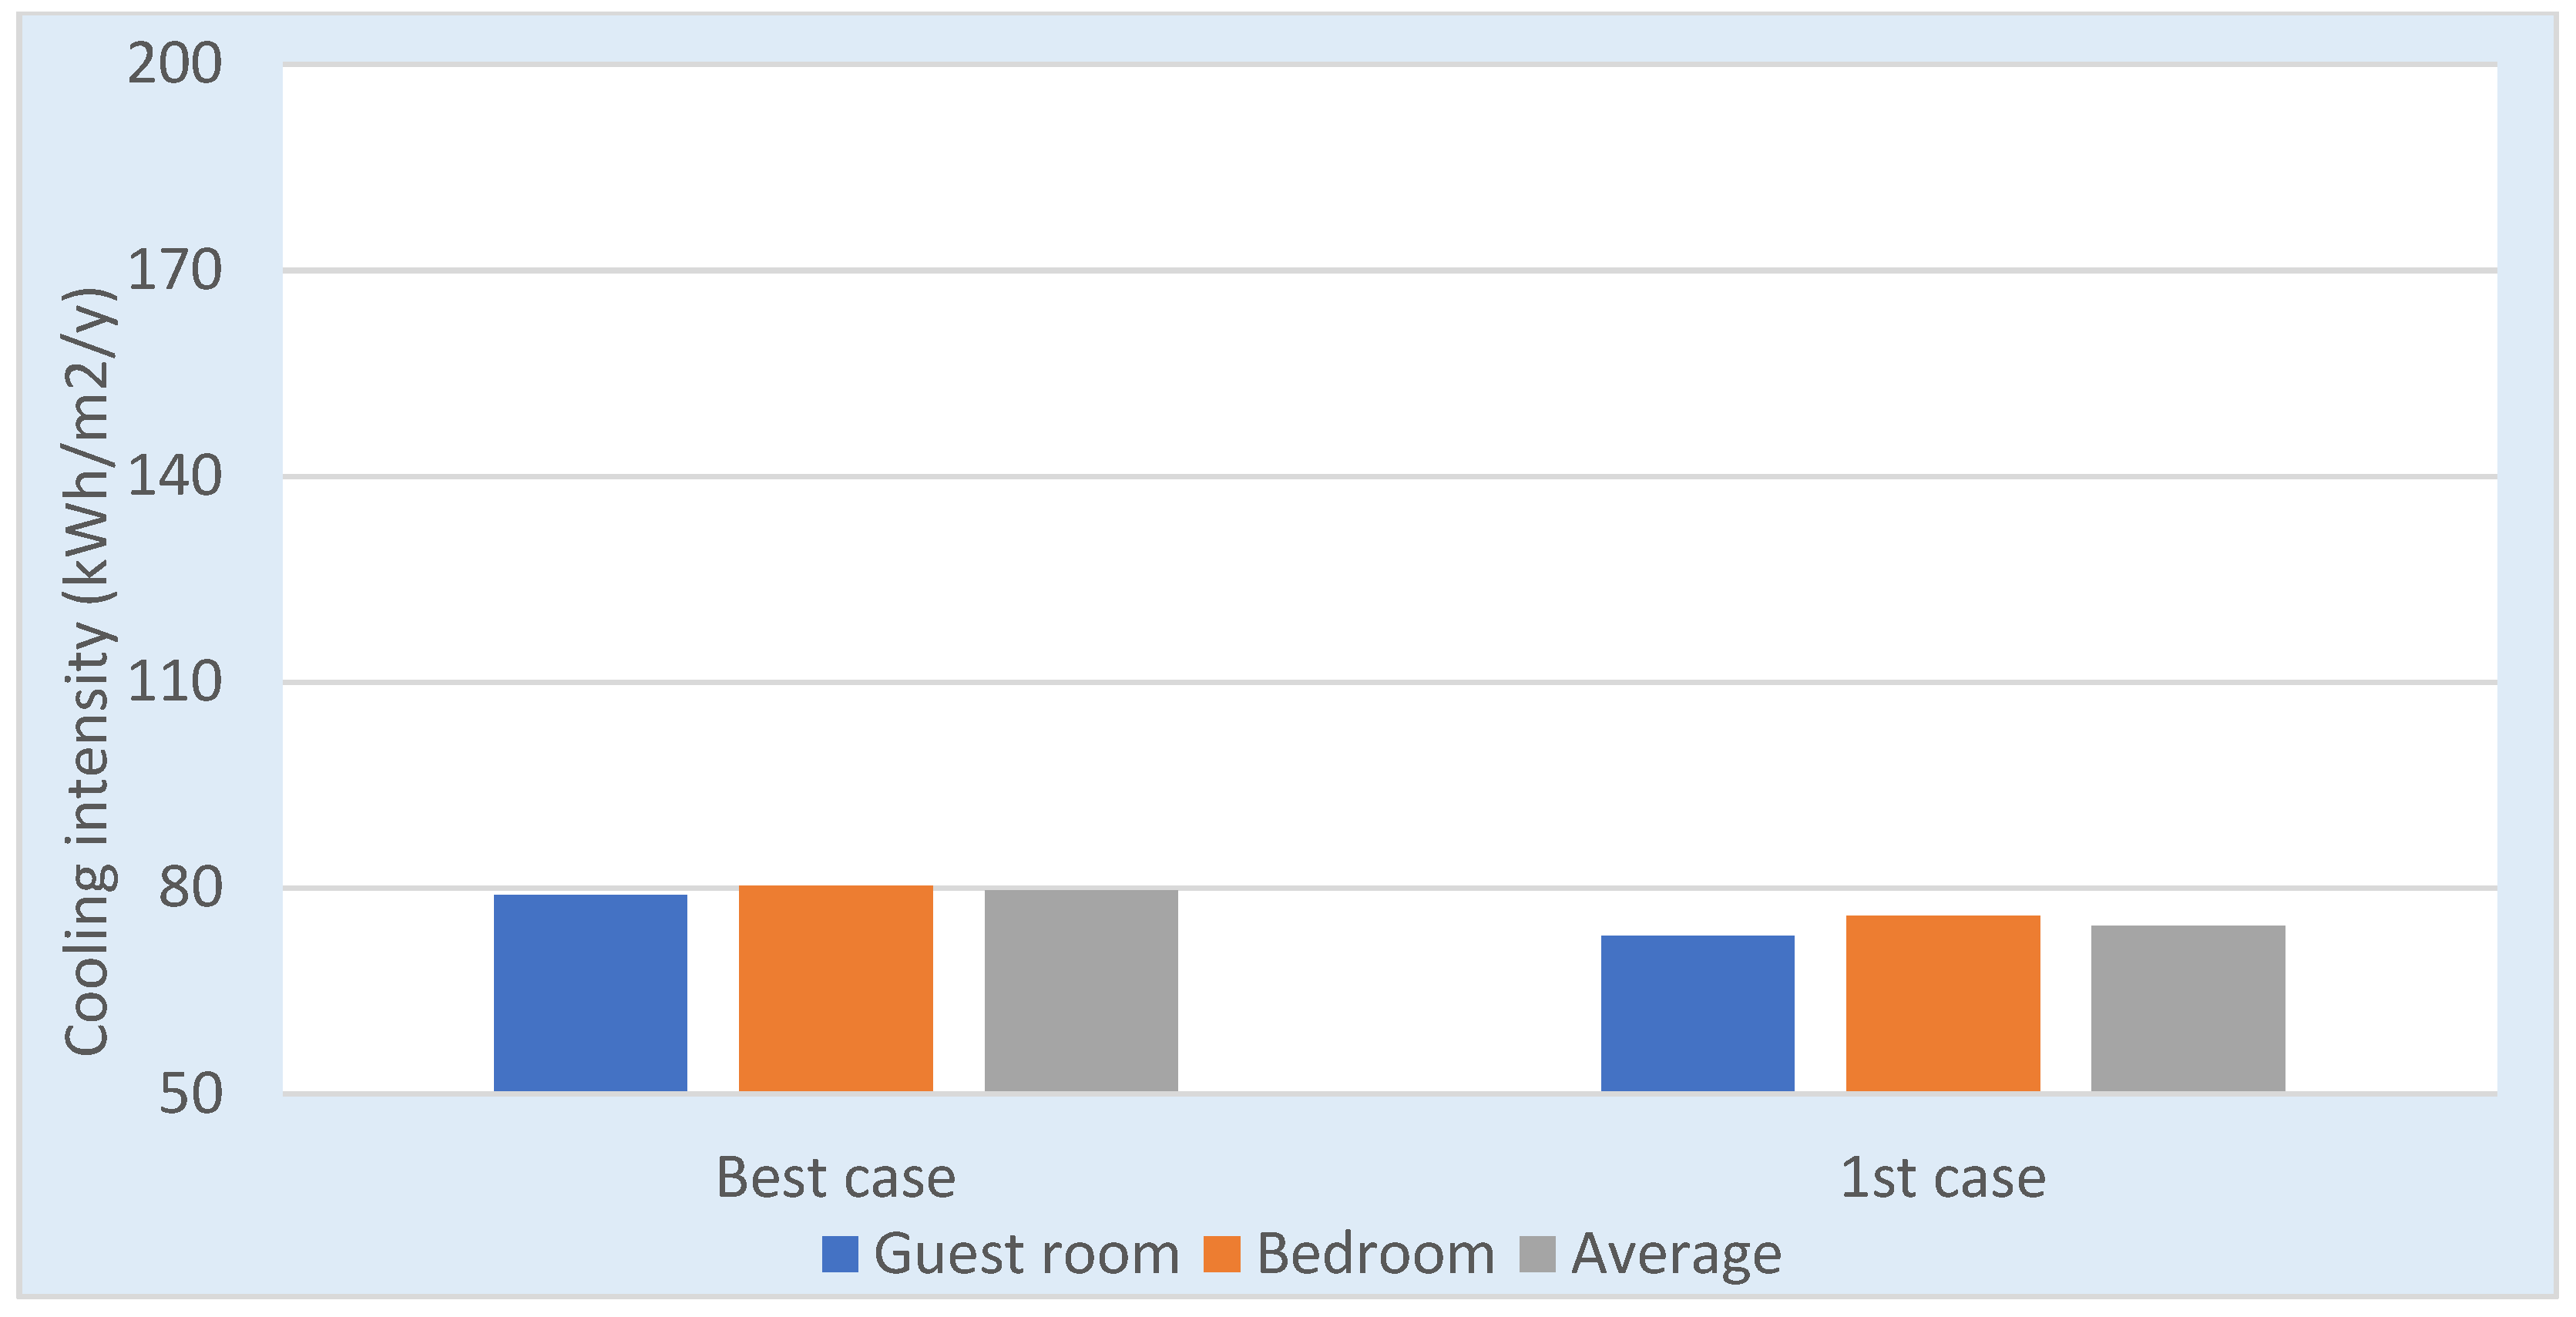
The potential cooling load savings by raising the A/C thermostat setting was proposed for the studied rooms. The annual cooling load was estimated when applying the different temperatures, along with the use of the most recommended material combination (best case), with the thermostat set at 25 °C. The potential reduction in the percentage of the cooling load when comparing the conditions in the best case with the different degrees can be seen in
Table 16. Raising the A/C thermostat setting from 23.9 to 25 °C revealed a potential 12.8% reduction in cooling load, while noticeable reductions of 13.2 and 24.4% in the cooling load were also achieved when raising the temperature to 26 °C compared with the best and first cases, respectively (see
Figure 25).
4. Conclusions
A key aim of this work has been to assess the indoor thermal performance of a low-rise residential building in Makkah and to identify alternative materials that could be used to improve its energy efficiency. A wide range of factors determine energy efficiency in residential buildings, including economic issues such as the choice of inexpensive poor-quality construction materials linked to the expectation of the unrestricted use of cheap A/C, non-compliance with or the erratic enforcement of building regulations, and fiscal policy such as subsidized electricity prices. Several barriers have slowed the pace of change: the uneven enforcement of less than stringent green building codes amidst a construction boom to meet the demands of a youthful population, the artificially cheap cost of electricity, and limited awareness of green building practices. Increased awareness of the impact of climate change and the withdrawal of subsidies may influence socially determined notions of thermal comfort, which vary from one person to another and indeed, from one generation to another. The thermal efficiency of the examined surfaces and the thermal indoor conditions that require further improvements were identified. Once analyzed, different materials were suggested for use in the house that could improve the indoor thermal environment. Once again, physical measurements were recorded to monitor the indoor thermal environment, and computer modeling explored thermal performance; areas for improvement were identified. Thermal analysis software (TAS) was then used to simulate, analyze, model, and modify the house. Several appropriate combinations were recommended based on the potential reduction in the energy required for cooling. When the proposed combination of materials was applied, the potential maximum annual decrease in the cooling load was 56.4%. Consequently, the intensity of the proposed annual cooling was 79.7 kWh/m2/y. It is thus advised that other techniques be used to improve the indoor thermal performance of houses, including adjusting the A/C thermostat settings, nighttime ventilation, and upgrading of the building materials.
In this research, the use of nighttime ventilation to improve the indoor thermal performance was assessed, and the findings indicated that nighttime ventilation could generate reductions in the annual cooling load of 6.5%. Lastly, an assessment was carried out of alternating the thermostat points of the A/C, and the findings indicated that increasing the thermostat setting by 1 °C could generate potential reductions in the cooling load of 13.2%.


