
Predicting Gasoline Vehicle Fuel Consumption in Energy and Environmental Impact Based on Machine Learning and Multidimensional Big Data

Abstract
:1. Introduction
2. Literature Review
2.1. Fuel Consumption Forecasting Models
2.2. Machine Learning-Based Fuel Consumption Prediction
2.3. Factors Related to Fuel Consumption Prediction
3. Materials and Methods
3.1. Data
3.1.1. Fuel Consumption Data and Vehicle Factors
3.1.2. Driving Behavior Factors
3.1.3. Environment Factors
3.2. Model Selection and Criteria
4. Results
4.1. Training and Test Results
4.2. Models Comparison
5. Discussion
6. Conclusions
Author Contributions
Funding
Institutional Review Board Statement
Informed Consent Statement
Acknowledgments
Conflicts of Interest
References
- Tietge, U.; Mock, P.; Franco, V.; Zacharof, N. From laboratory to road: Modeling the divergence between official and real-world fuel consumption and CO2 emission values in the German passenger car market for the years 2001–2014. Energy Policy 2017, 103, 212–222. [Google Scholar] [CrossRef]
- Zeng, I.Y.; Tan, S.; Xiong, J.; Ding, X.; Li, Y.; Wu, T. Estimation of real-world fuel consumption rate of light-duty vehicles based on the records reported by vehicle owners. Energies 2021, 14, 7915. [Google Scholar] [CrossRef]
- Zhao, X.; Ma, X.; Chen, B.; Shang, Y.; Song, M. Challenges toward carbon neutrality in China: Strategies and countermeasures. Resour. Conserv. Recycl. 2022, 176, 105959. [Google Scholar] [CrossRef]
- Pavlovic, J.; Marotta, A.; Ciuffo, B. CO2 emissions and energy demands of vehicles tested under the NEDC and the new WLTP type approval test procedures. Appl. Energy 2016, 177, 661–670. [Google Scholar] [CrossRef]
- Chen, K.; Zhao, F.; Liu, X.; Hao, H.; Liu, Z. Impacts of the new worldwide light-duty test procedure on technology effectiveness and china’s passenger vehicle fuel consumption regulations. Int. J. Environ. Res. Public Health 2021, 18, 3199. [Google Scholar] [CrossRef]
- Liu, Y.; Xu, Y.; Li, M.; Qin, K.; Yu, H.; Zhou, H. Feasibility study of using WLTC for fuel consumption certification of Chinese light-duty vehicles. In Proceedings of the SAE International WCX World Congress Experience 2018, Detroit, MI, USA, 10–12 April 2018; pp. 1–8. [Google Scholar]
- Duarte, G.; Gonçalves, G.; Farias, T. Analysis of fuel consumption and pollutant emissions of regulated and alternative driving cycles based on real-world measurements. Transp. Res. Part D Transp. Environ. 2016, 44, 43–54. [Google Scholar] [CrossRef]
- Luján, J.M.; Garcia, A.; Monsalve-Serrano, J.; Martínez-Boggio, S. Effectiveness of hybrid powertrains to reduce the fuel consumption and NOx emissions of a Euro 6d-temp diesel engine under real-life driving conditions. Energy Convers. Manag. 2019, 199, 111987. [Google Scholar] [CrossRef]
- Wang, Y.; Hao, C.; Ge, Y.; Hao, L.; Tan, J.; Wang, X.; Zhang, P.; Wang, Y.; Tian, W.; Lin, Z. Fuel consumption and emission performance from light-duty conventional/hybrid-electric vehicles over different cycles and real driving tests. Fuel 2020, 278, 118340. [Google Scholar] [CrossRef]
- Karagöz, Y. Analysis of the impact of gasoline, biogas and biogas+ hydrogen fuels on emissions and vehicle performance in the WLTC and NEDC. Int. J. Hydrog. Energy 2019, 44, 31621–31632. [Google Scholar] [CrossRef]
- Redsell, M.; Lucas, G.; Ashford, N. Factors affecting car fuel consumption. Proc. Inst. Mech. Eng. Part D J. Automob. Eng. 1993, 207, 1–22. [Google Scholar] [CrossRef]
- Kashinath, K.; Mustafa, M.; Albert, A.; Wu, J.; Jiang, C.; Esmaeilzadeh, S.; Azizzadenesheli, K.; Wang, R.; Chattopadhyay, A.; Singh, A. Physics-informed machine learning: Case studies for weather and climate modelling. Philos. Trans. R. Soc. A 2021, 379, 20200093. [Google Scholar] [CrossRef] [PubMed]
- Wickramanayake, S.; Bandara, H.D. Fuel consumption prediction of fleet vehicles using machine learning: A comparative study. In Proceedings of the 2016 Moratuwa Engineering Research Conference (MERCon), Moratuwa, Sri Lanka, 5–6 April 2016; pp. 90–95. [Google Scholar]
- Van Mierlo, J.; Maggetto, G.; Van de Burgwal, E.; Gense, R. Driving style and traffic measures-influence on vehicle emissions and fuel consumption. Proc. Inst. Mech. Eng. Part D J. Automob. Eng. 2004, 218, 43–50. [Google Scholar] [CrossRef]
- Perrotta, F.; Parry, T.; Neves, L.C. Application of machine learning for fuel consumption modelling of trucks. In Proceedings of the 2017 IEEE International Conference on Big Data (Big Data), Boston, MA, USA, 11–14 December 2017; pp. 3810–3815. [Google Scholar]
- Rahman, A.; Smith, A.D. Predicting fuel consumption for commercial buildings with machine learning algorithms. Energy Build. 2017, 152, 341–358. [Google Scholar] [CrossRef]
- Zhou, M.; Jin, H.; Wang, W. A review of vehicle fuel consumption models to evaluate eco-driving and eco-routing. Transp. Res. Part D Transp. Environ. 2016, 49, 203–218. [Google Scholar] [CrossRef]
- Heywood, J.B. Internal Combustion Engine Fundamentals. McGraw-Hill Education: New York, NY, USA, 2018. [Google Scholar]
- Parlak, A.; Islamoglu, Y.; Yasar, H.; Egrisogut, A. Application of artificial neural network to predict specific fuel consumption and exhaust temperature for a diesel engine. Appl. Therm. Eng. 2006, 26, 824–828. [Google Scholar] [CrossRef]
- Togun, N.; Baysec, S. Genetic programming approach to predict torque and brake specific fuel consumption of a gasoline engine. Appl. Energy 2010, 87, 3401–3408. [Google Scholar] [CrossRef]
- Silva, C.; Farias, T.; Frey, H.C.; Rouphail, N.M. Evaluation of numerical models for simulation of real-world hot-stabilized fuel consumption and emissions of gasoline light-duty vehicles. Transp. Res. Part D Transp. Environ. 2006, 11, 377–385. [Google Scholar] [CrossRef]
- Ziółkowski, J.; Oszczypała, M.; Małachowski, J.; Szkutnik-Rogoż, J. Use of Artificial Neural Networks to Predict Fuel Consumption on the Basis of Technical Parameters of Vehicles. Energies 2021, 14, 2639. [Google Scholar] [CrossRef]
- Togun, N.K.; Baysec, S. Prediction of torque and specific fuel consumption of a gasoline engine by using artificial neural networks. Appl. Energy 2010, 87, 349–355. [Google Scholar] [CrossRef]
- Jahirul, M.; Saidur, R.; Masjuki, H.H. Application of artificial neural network to predict brake specific fuel consumption of retrofitted cng engine. Int. J. Mech. Mater. Eng. 2009, 4, 249–255. [Google Scholar]
- Hjellvik, M.A.; Ratnayake, R.C. Machine learning based approach to predict short-term fuel consumption on mobile offshore drilling units. In Proceedings of the 2019 IEEE International Conference on Industrial Engineering and Engineering Management (IEEM), Macao, China, 15–18 December 2019; pp. 1067–1073. [Google Scholar]
- Syahputra, R. Application of neuro-fuzzy method for prediction of vehicle fuel consumption. J. Theor. Appl. Inf. Technol. 2016, 86, 138–150. [Google Scholar]
- Yao, Y.; Zhao, X.; Liu, C.; Rong, J.; Zhang, Y.; Dong, Z.; Su, Y. Vehicle fuel consumption prediction method based on driving behavior data collected from smartphones. J. Adv. Transp. 2020, 2020. [Google Scholar] [CrossRef]
- Ping, P.; Qin, W.; Xu, Y.; Miyajima, C.; Takeda, K. Impact of driver behavior on fuel consumption: Classification, evaluation and prediction using machine learning. IEEE Access 2019, 7, 78515–78532. [Google Scholar] [CrossRef]
- Li, Y.; Tang, G.; Du, J.; Zhou, N.; Zhao, Y.; Wu, T. Multilayer perceptron method to estimate real-world fuel consumption rate of light duty vehicles. IEEE Access 2019, 7, 63395–63402. [Google Scholar] [CrossRef]
- Dror, M.B.; Qin, L.; An, F. The gap between certified and real-world passenger vehicle fuel consumption in China measured using a mobile phone application data. Energy Policy 2019, 128, 8–16. [Google Scholar] [CrossRef]
- Wu, T.; Han, X.; Zheng, M.M.; Ou, X.; Sun, H.; Zhang, X. Impact factors of the real-world fuel consumption rate of light duty vehicles in China. Energy 2020, 190, 116388. [Google Scholar] [CrossRef]
- Zhou, B.; Zhang, S.; Wu, Y.; Ke, W.; He, X.; Hao, J. Energy-saving benefits from plug-in hybrid electric vehicles: Perspectives based on real-world measurements. Mitig. Adapt. Strateg. Glob. Change 2018, 23, 735–756. [Google Scholar] [CrossRef]
- Ahn, K.; Rakha, H. The effects of route choice decisions on vehicle energy consumption and emissions. Transp. Res. Part D Transp. Environ. 2008, 13, 151–167. [Google Scholar] [CrossRef]
- Greenwood, I.; Dunn, R.; Raine, R. Estimating the effects of traffic congestion on fuel consumption and vehicle emissions based on acceleration noise. J. Transp. Eng. 2007, 133, 96–104. [Google Scholar] [CrossRef]
- Ostrouchov, N. Effect of cold weather on motor vehicle emissions and fuel economy. In Proceedings of the SAE International 1978 Automotive Engineering Congress and Exposition, Detroit, MI, USA, 27 February–3 March 1978; pp. 1–16. [Google Scholar]
- He, C.R.; Maurer, H.; Orosz, G. Fuel consumption optimization of heavy-duty vehicles with grade, wind, and traffic information. J. Comput. Nonlinear Dyn. 2016, 11. [Google Scholar] [CrossRef] [Green Version]
- Pekula, N.; Kuritz, B.; Hearne, J.; Marchese, A.; Hesketh, R. The effect of ambient temperature, humidity, and engine speed on idling emissions from heavy-duty diesel trucks. SAE Transac. 2003, 112, 148–158. [Google Scholar]
- Sriwilai, A.; Pattaraprakorn, W.; Chutiprapat, V.; Sansilah, C.; Bhasaputra, P. The study on the effect of electric car to energy consumption in Thailand. In Proceedings of the 2016 13th International Conference on Electrical Engineering/Electronics, Computer, Telecommunications and Information Technology (ECTI-CON), Chiang Mai, Thailand, 28 June–1 July 2016; pp. 1–5. [Google Scholar]
- Ben-Chaim, M.; Shmerling, E.; Kuperman, A. Analytic modeling of vehicle fuel consumption. Energies 2013, 6, 117–127. [Google Scholar] [CrossRef]
- Joumard, R.; Jost, P.; Hickman, J. Influence of instantaneous speed and acceleration on hot passenger car emissions and fuel consumption. SAE Tech. Paper 1995, 950928. [Google Scholar] [CrossRef]
- Ericsson, E. Independent driving pattern factors and their influence on fuel-use and exhaust emission factors. Transp. Res. Part D Transp. Environ. 2001, 6, 325–345. [Google Scholar] [CrossRef]
- El-Shawarby, I.; Ahn, K.; Rakha, H. Comparative field evaluation of vehicle cruise speed and acceleration level impacts on hot stabilized emissions. Transp. Res. Part D Transp. Environ. 2005, 10, 13–30. [Google Scholar] [CrossRef]
- Kamal, M.A.S.; Mukai, M.; Murata, J.; Kawabe, T. Ecological vehicle control on roads with up-down slopes. IEEE Trans. Intell. Transp. Syst. 2011, 12, 783–794. [Google Scholar] [CrossRef]
- Barth, M.; Boriboonsomsin, K.; Vu, A. Environmentally-friendly navigation. In Proceedings of the 2007 IEEE Intelligent Transportation Systems Conference, Bellevue, WA, USA, 30 September–3 October 2007; pp. 684–689. [Google Scholar]
- Biggs, D. ARFCOM: Models for Estimating Light to Heavy Vehicle Fuel Consumption; ARRB Transport Research Ltd.: Vermont, SA, Australia, 1988. [Google Scholar]
- Renouf, M. Prediction of the Fuel Consumption of Heavy Goods Vehicles by Computer Simulation; Transport and Road Research Lab.: Crowthorne, UK, 1979. [Google Scholar]
- Sanchez, M.; Cano, J.-C.; Kim, D. Predicting traffic lights to improve urban traffic fuel consumption. In Proceedings of the 2006 6th International Conference on ITS Telecommunications, Chengdu, China, 21–23 June 2006; pp. 331–336. [Google Scholar]
- Gao, Y.; Liu, Z.; Li, R.; Shi, Z. Long-term impact of China’s returning farmland to forest program on rural economic development. Sustainability 2020, 12, 1492. [Google Scholar] [CrossRef] [Green Version]
- Agarap, A.F. Deep Learning Using Rectified Linear Units (RELU). arXiv 2018, arXiv:1803.08375. [Google Scholar]
- Masters, T. Practical Neural Network Recipes in C++; Morgan Kaufmann: Burlington, MA, USA, 1993. [Google Scholar]
- Ying, X. An overview of overfitting and its solutions. J. Phys. Conf. Ser. 2019, 1168, 022022. [Google Scholar] [CrossRef]
- Zou, F.; Shen, L.; Jie, Z.; Zhang, W.; Liu, W. A sufficient condition for convergences of adam and rmsprop. In Proceedings of the IEEE/CVF Conference on Computer Vision and Pattern Recognition, Long Beach, CA, USA, 16–17 June 2019; pp. 11127–11135. [Google Scholar]
- Christoffersen, P.; Jacobs, K. The importance of the loss function in option valuation. J. Financ. Econ. 2004, 72, 291–318. [Google Scholar] [CrossRef] [Green Version]
- Chai, T.; Draxler, R.R. Root mean square error (RMSE) or mean absolute error (MAE)? Arguments against avoiding RMSE in the literature. Geosci. Model Dev. 2014, 7, 1247–1250. [Google Scholar] [CrossRef] [Green Version]
- Ke, G.; Meng, Q.; Finley, T.; Wang, T.; Chen, W.; Ma, W.; Ye, Q.; Liu, T.-Y. Lightgbm: A highly efficient gradient boosting decision tree. Adv. Neural Inf. Processing Syst. 2017, 30, 3146–3154. [Google Scholar]
- Hooker, J.N. Optimal driving for single-vehicle fuel economy. Transp. Res. Part A Gen. 1988, 22, 183–201. [Google Scholar] [CrossRef]
- Evans, L. Driver behavior effects on fuel consumption in urban driving. In Proceedings of the Human Factors Society Annual Meeting, Los Angeles, CA, USA, 1 October 1978; pp. 437–442. [Google Scholar]
- Haworth, N.; Symmons, M. Driving to reduce fuel consumption and improve road safety. In Proceedings of the Australasian Road Safety Research, Policing and Education Conference, Melbourn, VIC, Australia, 18–20 November 2001. [Google Scholar]
- Wang, J.; Rakha, H.A. Fuel consumption model for conventional diesel buses. Appl. Energy 2016, 170, 394–402. [Google Scholar] [CrossRef]
- Walnum, H.J.; Simonsen, M. Does driving behavior matter? An analysis of fuel consumption data from heavy-duty trucks. Transp. Res. Part D Transp. Environ. 2015, 36, 107–120. [Google Scholar] [CrossRef]
- Plotkin, S.E. European and Japanese fuel economy initiatives: What they are, their prospects for success, their usefulness as a guide for US action. Energy Policy 2001, 29, 1073–1084. [Google Scholar] [CrossRef]
- Rahimi-Gorji, M.; Ghajar, M.; Kakaee, A.-H.; Ganji, D.D. Modeling of the air conditions effects on the power and fuel consumption of the SI engine using neural networks and regression. J. Braz. Soc. Mech. Sci. Eng. 2017, 39, 375–384. [Google Scholar] [CrossRef]
- Ehsani, M.; Ahmadi, A.; Fadai, D. Modeling of vehicle fuel consumption and carbon dioxide emission in road transport. Renew. Sustain. Energy Rev. 2016, 53, 1638–1648. [Google Scholar] [CrossRef]
- Fontaras, G.; Zacharof, N.-G.; Ciuffo, B. Fuel consumption and CO2 emissions from passenger cars in Europe–Laboratory versus real-world emissions. Prog. Energy Combust. Sci. 2017, 60, 97–131. [Google Scholar] [CrossRef]


| Feature | Record 0 | Record 1 | Record 2 | Record 3 |
|---|---|---|---|---|
| User ID | 02194194 | 70192504 | 40468960 | 74150957 |
| City | Dali | Yangshan | Tianjin | Wuhan |
| Time | March 2013 | March 2014 | March 2015 | March 2016 |
| Brand Name | FORTHING | BYD | TOYOTA | HAVAL |
| Series Name | JOYEAR | BYD G6 | E’Z | HAVAL H2 |
| Version Year | 2010 | 2012 | 2014 | 2016 |
| Engine | 1.5 L/120 ps/L4 | 2.0 L/140 ps/L4 | 1.8 L/140 ps/L4 | 1.5 T/150 ps/L4 |
| Gearbox | MT-5 | MT-5 | E-CVT | AMT-6 |
| refConsumption (L/100 km) | 7.2 | 8.3 | 7.4 | 9 |
| realConsumption (L/100 km) | 6.4 | 9.1 | 8.9 | 8.2 |
| Engine Displacement (ED) | ||||||
|---|---|---|---|---|---|---|
| ED ≤ 0.8 L | 0.8 L < ED ≤ 1.6 L | 1.6 L < ED ≤ 2.5 L | 2.5 L < ED ≤ 4.0 L | ED > 4.0 L | ||
| Standard deviation | Ref Consumption (L/100 km) | 0.486 | 0.778 | 1.211 | 1.270 | 0.582 |
| Real Consumption (L/100 km) | 1.021 | 1.512 | 2.115 | 2.306 | 2.245 | |
| Min | Ref Consumption (L/100 km) | 5.700 | 1.600 | 2.000 | 7.600 | 11.100 |
| Real Consumption (L/100 km) | 4.429 | 0.829 | 1.350 | 6.278 | 12.352 | |
| Max | Ref Consumption (L/100 km) | 6.700 | 9.800 | 12.300 | 15.700 | 13.200 |
| Real Consumption (L/100 km) | 10.815 | 16.915 | 20.379 | 20.675 | 20.214 | |
| P25 | Ref Consumption (L/100 km) | 5.700 | 5.900 | 7.100 | 9.900 | 13.200 |
| Real Consumption (L/100 km) | 5.082 | 6.846 | 8.207 | 11.029 | 14.119 | |
| Median | Ref Consumption (L/100 km) | 6.700 | 6.400 | 7.800 | 10.400 | 13.200 |
| Real Consumption (L/100 km) | 5.454 | 7.738 | 9.501 | 12.657 | 15.655 | |
| Mean | Ref Consumption (L/100 km) | 6.301 | 6.459 | 7.794 | 10.608 | 13.038 |
| Real Consumption (L/100 km) | 5.728 | 7.888 | 9.598 | 12.701 | 15.773 | |
| P75 | Ref Consumption (L/100 km) | 6.700 | 6.900 | 8.600 | 11.000 | 13.200 |
| Real Consumption (L/100 km) | 5.974 | 8.774 | 10.889 | 14.178 | 17.059 | |
| Observation | 113 | 116,302 | 53,788 | 866 | 13 | |
| Dimensions | Questions |
|---|---|
| Car use frequency | Q1. Do you drive when the trip is less than 5 km? Q2. Do you always consider alternatives such as buses, subways, or bicycles instead of driving by yourself? |
| Fuel economy consciousness | Q1. Do you avoid using equipment that increases fuel consumption such as air conditioners and high-power car appliances as much as possible? Q2. Are you used to leaving anything such as sneakers, ball bags, and spare barbecue oil in the trunk? Q3. What is your attitude towards the maintenance, tire pressure, and car deposition condition of your car? Q4. Will you turn off the engine if the expected idle time is more than 3 min? Q5. Would you consider finding out the reason and adjusting your driving habits if you knew you were getting more gas mileage than your friends? Q6. Will you pay attention to the traffic situation to avoid possible traffic jams in advance? |
| Driving skill | Q1. What do you think of your parking skills? Q2. What do you think of your driving skills? |
| Driving speed | Q1. Do you overspeed a lot on the highway? Q2. What is your general approach in the traffic?Q3. What is the average speed of your driving? |
| Driving habit | Q1. What is your general strategy for intersection with red traffic light? Q2. What kind of road conditions have you been driving with in the past year? Q3. Do you tend to pedal to the ground when starting or accelerating? Q4. How do you drive when you find that you have to slow down in the 100 m ahead on the road? Q5. Imagine that you are driving, the green light is on, and the road ahead is empty, while one kilometer away is the destination where you have to pull over; how do you drive? |
| Age | |||||
|---|---|---|---|---|---|
| Gender | 18–25 | 26–35 | 36–45 | 45+ | Total |
| Male | 3035 | 14,360 | 4910 | 1270 | 23,575 |
| Female | 85 | 361 | 104 | 24 | 574 |
| Total | 3120 | 14,721 | 5014 | 1294 | 24,149 |
| Dimensions | Min | Max | P50 | Mean |
|---|---|---|---|---|
| Car frequency | 2.0 | 8.0 | 5.0 | 4.7 |
| Fuel economy consciousness | 6.0 | 28.0 | 20.0 | 19.6 |
| Driving skill | 2.0 | 8.0 | 6.0 | 5.7 |
| Driving speed | 3.0 | 13.0 | 9.0 | 9.3 |
| Driving habit | 6.0 | 19.0 | 16.0 | 15.9 |
| Environment Factors | Unit |
|---|---|
| Average pressure | 0.1 hPa |
| Average temperature | 0.1 °C |
| Average temperature anomaly | 0.1 °C |
| Mean relative humidity | 1% |
| Average wind speed | 0.1 m/s |
| Maximum wind direction | azimuth |
| Extreme maximum wind direction | azimuth |
| Average precipitation | 0.1 mm |
| Daily precipitation ≥ 0.1 mm days | 1 day |
| Sunshine time | 0.1 h |
| Road grade | ° |
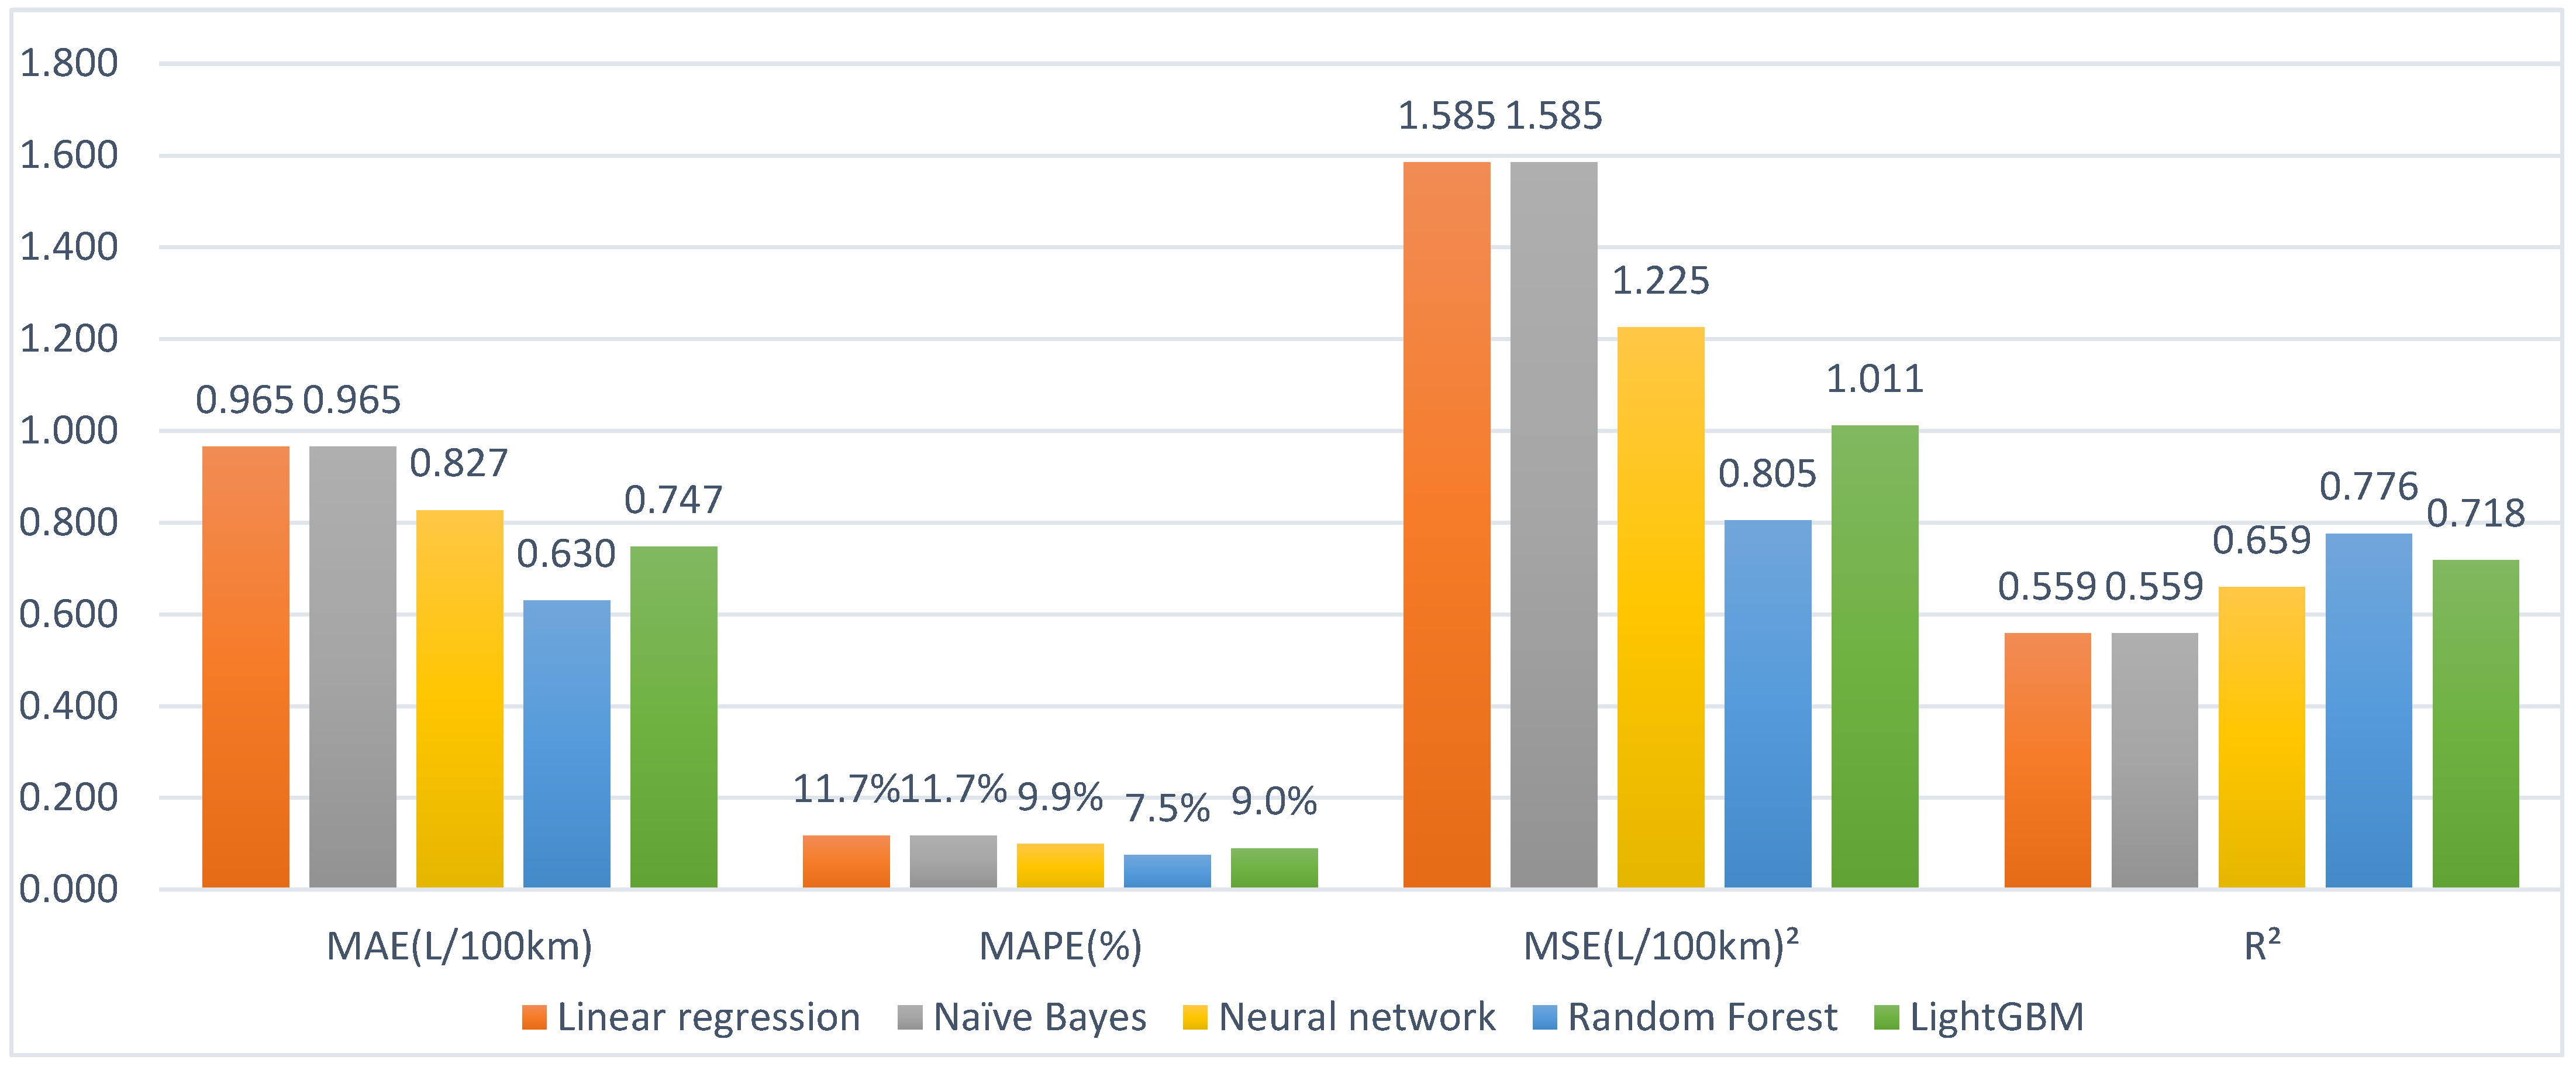
| Model | Training Data | Testing Data | ||||||
|---|---|---|---|---|---|---|---|---|
| MAE | MAPE | MSE | R2 | MAE | MAPE | MSE | R2 | |
| RefConsumption | 1.650 | 24.2% | 4.276 | −2.234 | 1.654 | 24.2% | 4.322 | −2.288 |
| Linear regression | 0.959 | 11.7% | 1.550 | 0.558 | 0.965 | 11.7% | 1.585 | 0.559 |
| Naïve Bayes | 0.959 | 11.7% | 1.550 | 0.558 | 0.965 | 11.7% | 1.585 | 0.559 |
| Neural network | 0.800 | 9.6% | 1.146 | 0.674 | 0.827 | 9.9% | 1.225 | 0.659 |
| Random forest | 0.245 | 2.9% | 0.127 | 0.964 | 0.630 | 7.5% | 0.805 | 0.776 |
| LightGBM | 0.701 | 8.5% | 1.876 | 0.750 | 0.747 | 9.0% | 1.011 | 0.718 |
| Model | Engine Displacement (ED) | |||||
|---|---|---|---|---|---|---|
| ED ≤ 0.8 L | 0.8 L < ED ≤ 1.6 L | 1.6 L < ED ≤ 2.5 L | 2.5 L < ED ≤ 4.0 L | ED > 4.0 L | ||
| Linear regression | Predicted value | 7.258 | 7.813 | 8.868 | 10.187 | 14.853 |
| Deviation 1 | 26.413% | 0.225% | 0.164% | 3.396% | 4.566% | |
| Naïve Bayes | Predicted value | 7.257 | 7.813 | 8.868 | 10.188 | 14.854 |
| Deviation | 26.401% | 0.225% | 0.164% | 3.401% | 4.561% | |
| Neural network | Predicted value | 6.019 | 7.969 | 9.015 | 9.900 | 14.822 |
| Deviation | 2.726% | 1.485% | 1.596% | 1.730% | 8.557% | |
| Random forest | Predicted value | 5.851 | 7.851 | 8.872 | 9.874 | 15.690 |
| Deviation | 0.138% | 0.025% | 0.014% | 0.222% | 1.979% | |
| LightGBM | Predicted value | 5.743 | 7.842 | 8.872 | 12.491 | 15.721 |
| Deviation | 1.975% | 0.140% | 0.137% | 0.345% | 3.013% | |
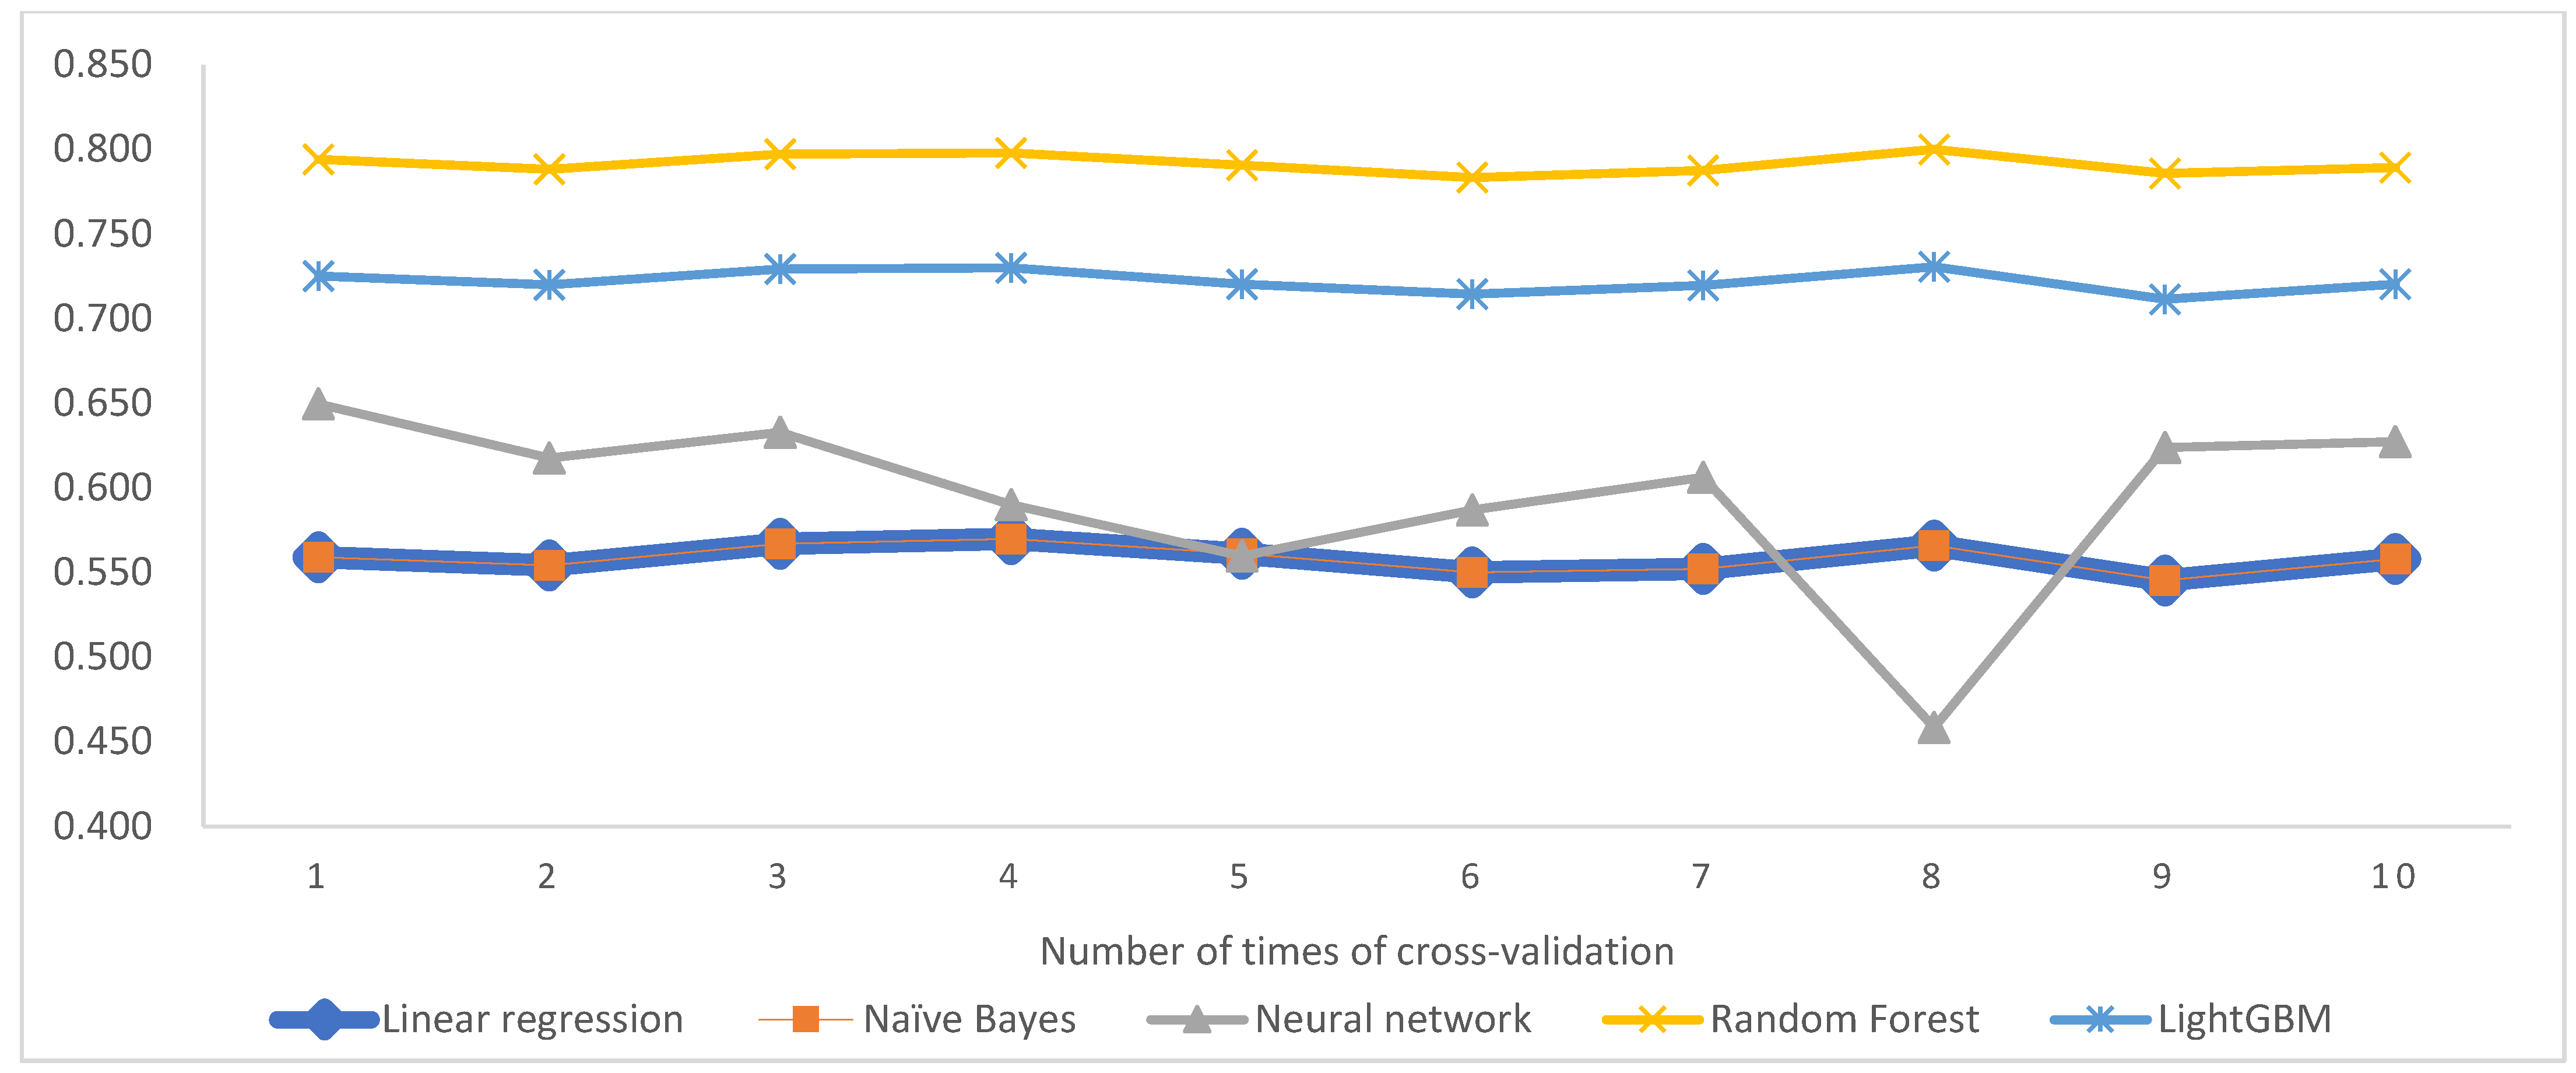
| Model | Average Cross Validation Score |
|---|---|
| Linear regression | 0.5583183 |
| Naïve Bayes | 0.5583183 |
| Neural network | 0.5952532 |
| Random forest | 0.7913839 |
| LightGBM | 0.7221006 |
Publisher’s Note: MDPI stays neutral with regard to jurisdictional claims in published maps and institutional affiliations. |
© 2022 by the authors. Licensee MDPI, Basel, Switzerland. This article is an open access article distributed under the terms and conditions of the Creative Commons Attribution (CC BY) license (https://creativecommons.org/licenses/by/4.0/).
Share and Cite
Yang, Y.; Gong, N.; Xie, K.; Liu, Q. Predicting Gasoline Vehicle Fuel Consumption in Energy and Environmental Impact Based on Machine Learning and Multidimensional Big Data. Energies 2022, 15, 1602. https://doi.org/10.3390/en15051602
Yang Y, Gong N, Xie K, Liu Q. Predicting Gasoline Vehicle Fuel Consumption in Energy and Environmental Impact Based on Machine Learning and Multidimensional Big Data. Energies. 2022; 15(5):1602. https://doi.org/10.3390/en15051602
Chicago/Turabian StyleYang, Yushan, Nuoya Gong, Keying Xie, and Qingfei Liu. 2022. "Predicting Gasoline Vehicle Fuel Consumption in Energy and Environmental Impact Based on Machine Learning and Multidimensional Big Data" Energies 15, no. 5: 1602. https://doi.org/10.3390/en15051602
APA StyleYang, Y., Gong, N., Xie, K., & Liu, Q. (2022). Predicting Gasoline Vehicle Fuel Consumption in Energy and Environmental Impact Based on Machine Learning and Multidimensional Big Data. Energies, 15(5), 1602. https://doi.org/10.3390/en15051602