
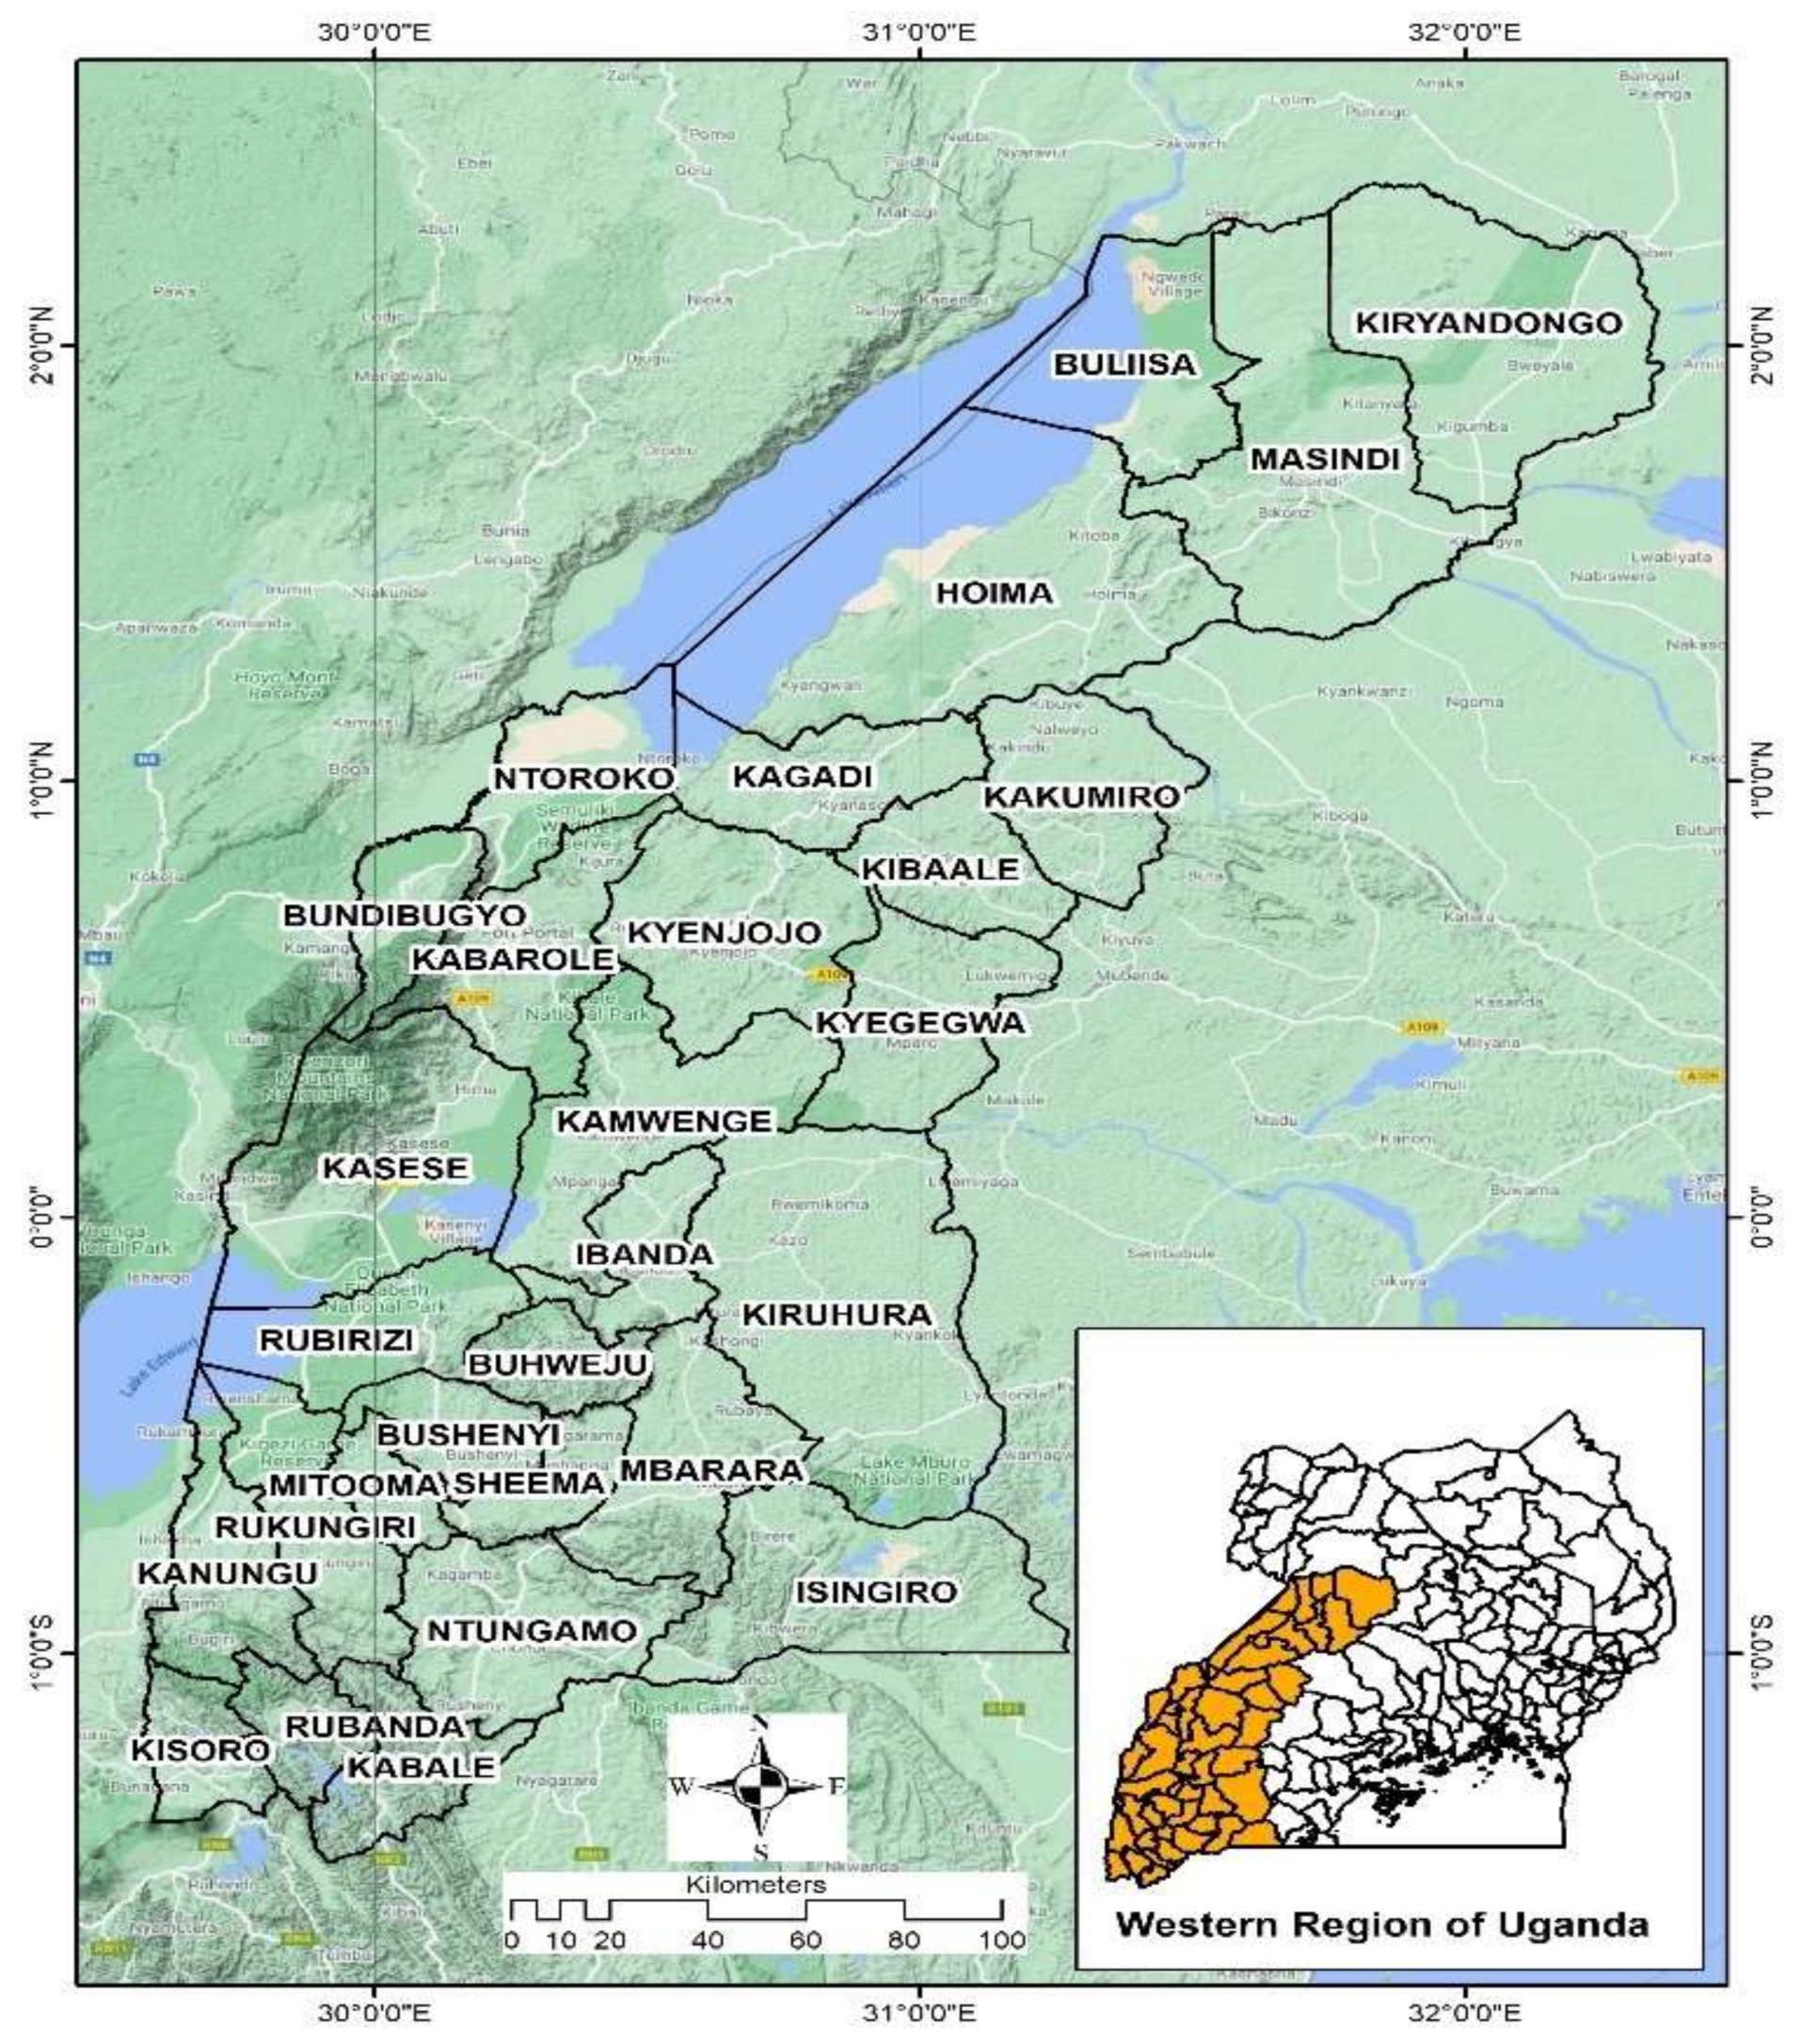
Assessment of Suitable Areas for Smart Grid of Power Generated from Renewable Energy Resources in Western Uganda

 ,
,  ,
,
Abstract
1. Introduction
2. Uganda Energy Situation
3. Data Sources and Siting Criteria
3.1. Data Sources
3.2. Siting Criteria
3.2.1. Economic Criteria
3.2.2. Environmental Criteria
3.2.3. Technical Criteria
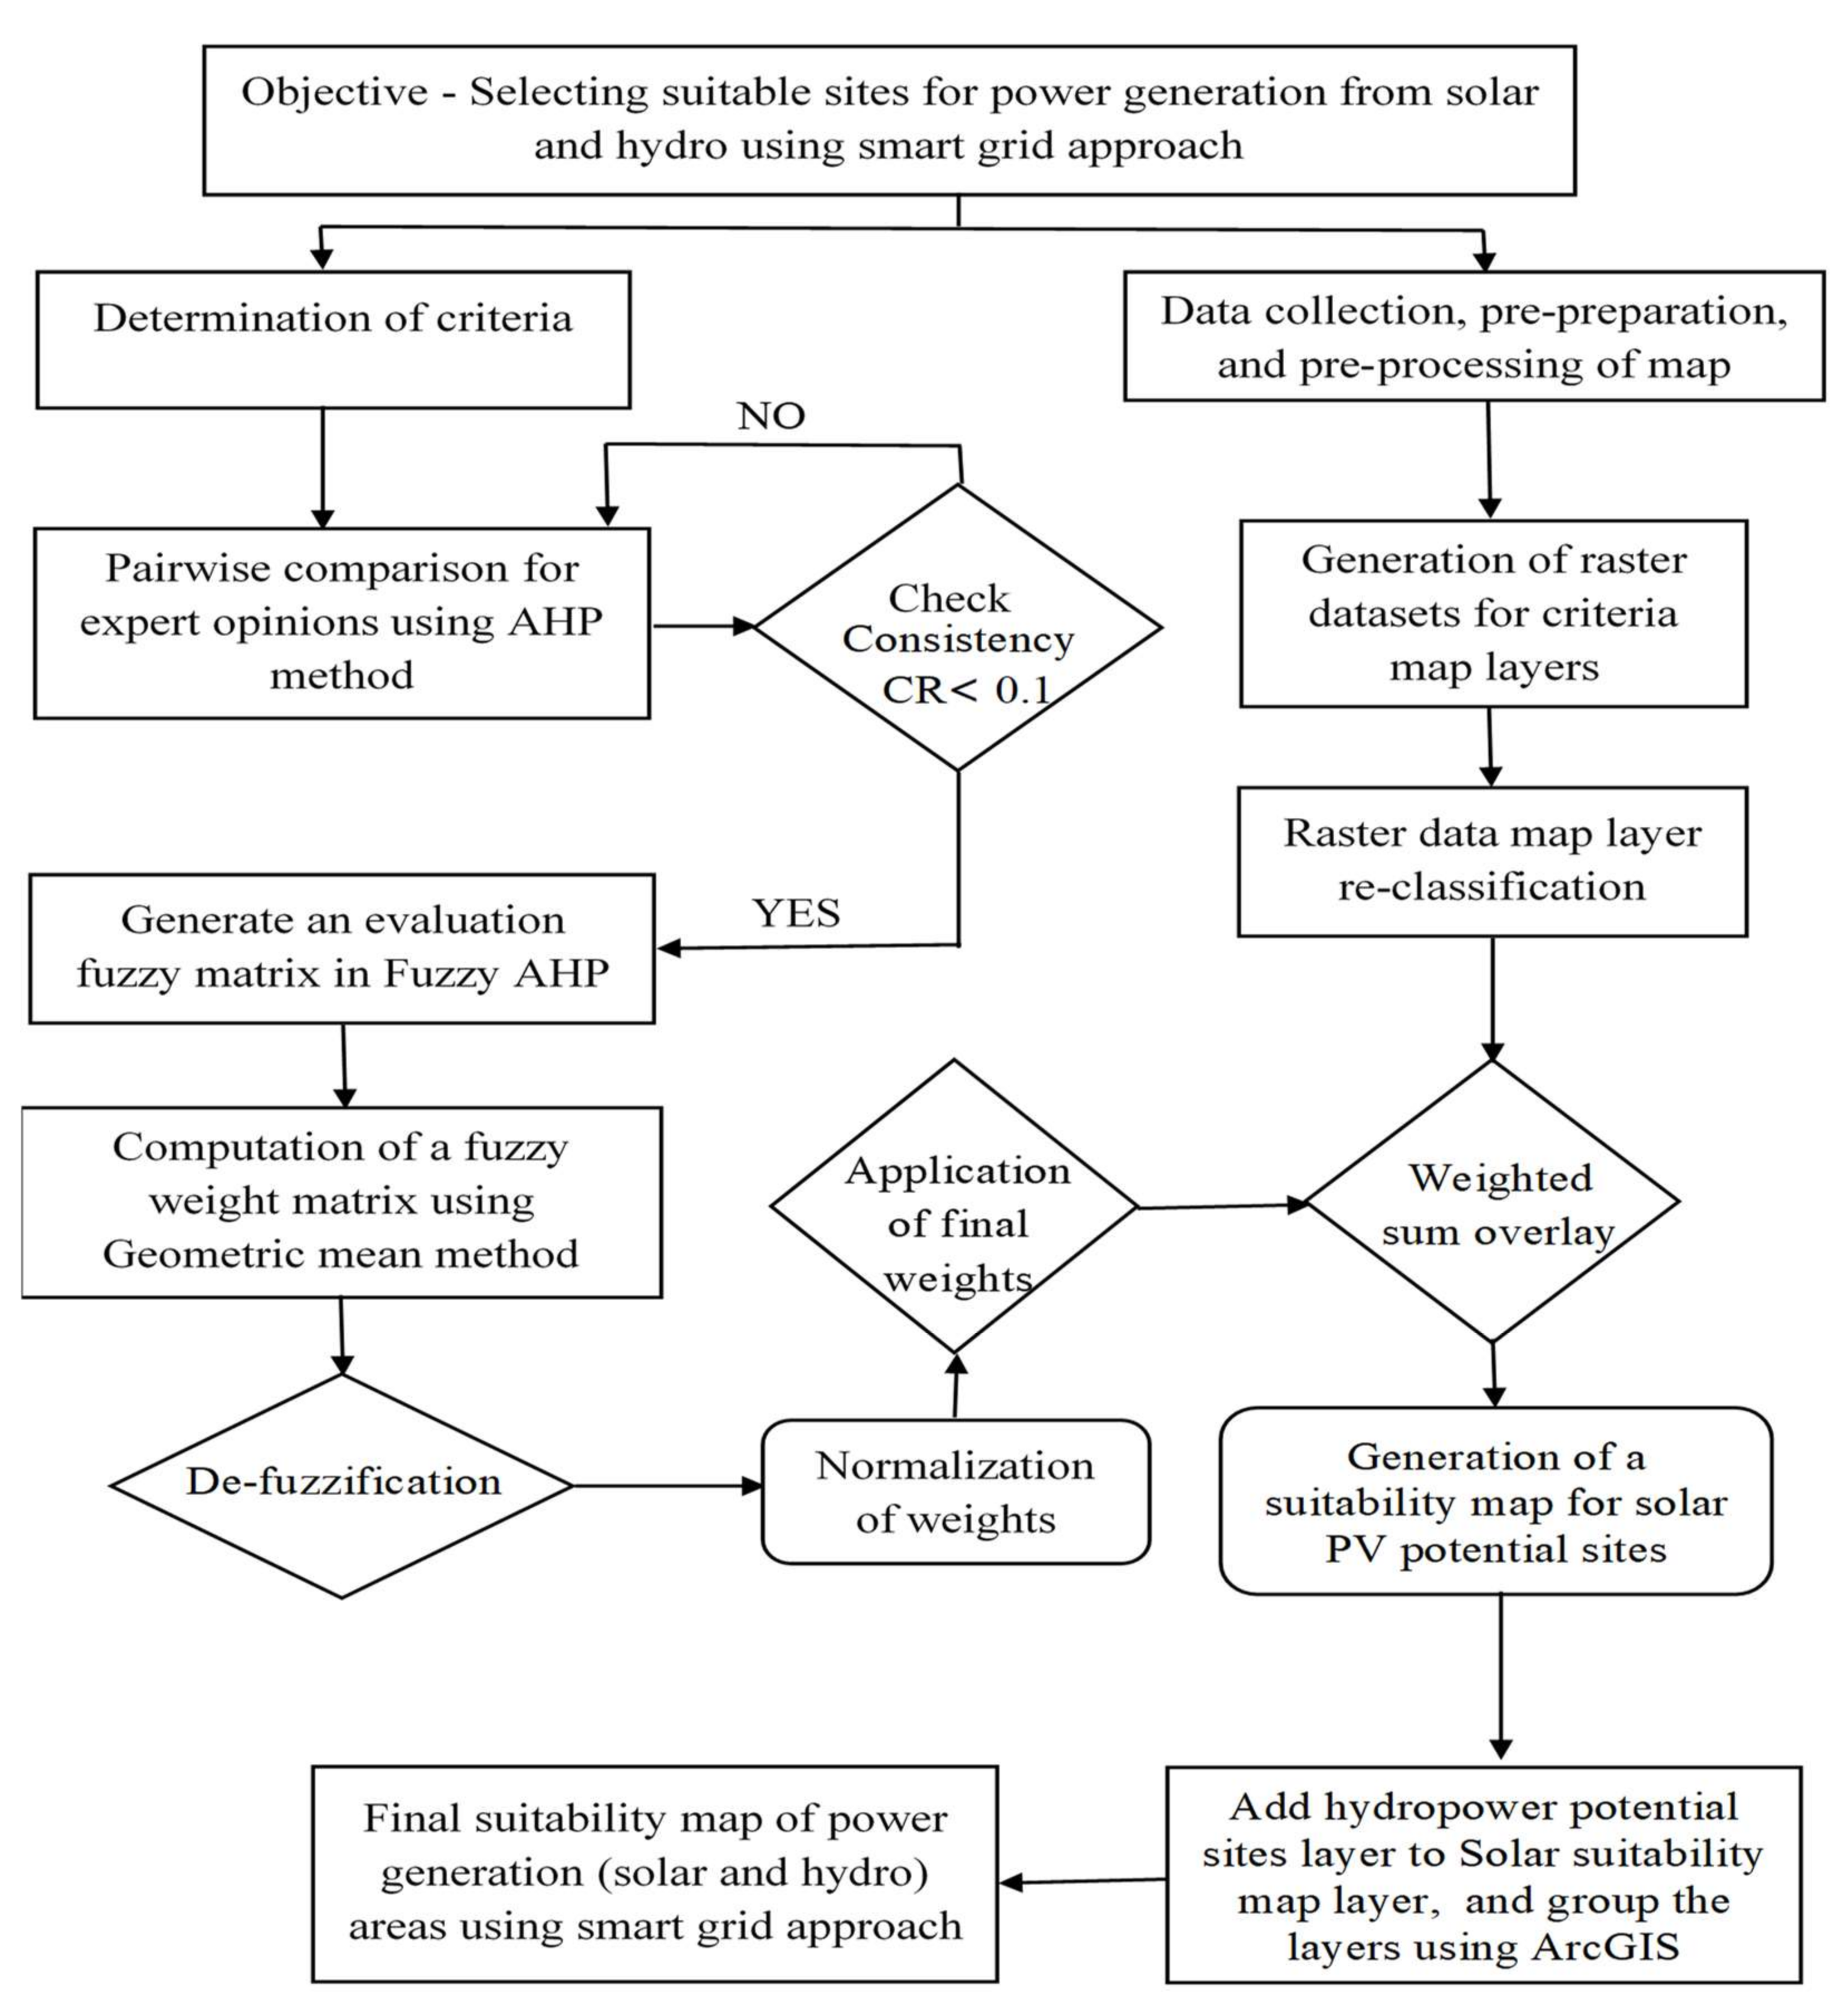
4. Methodology
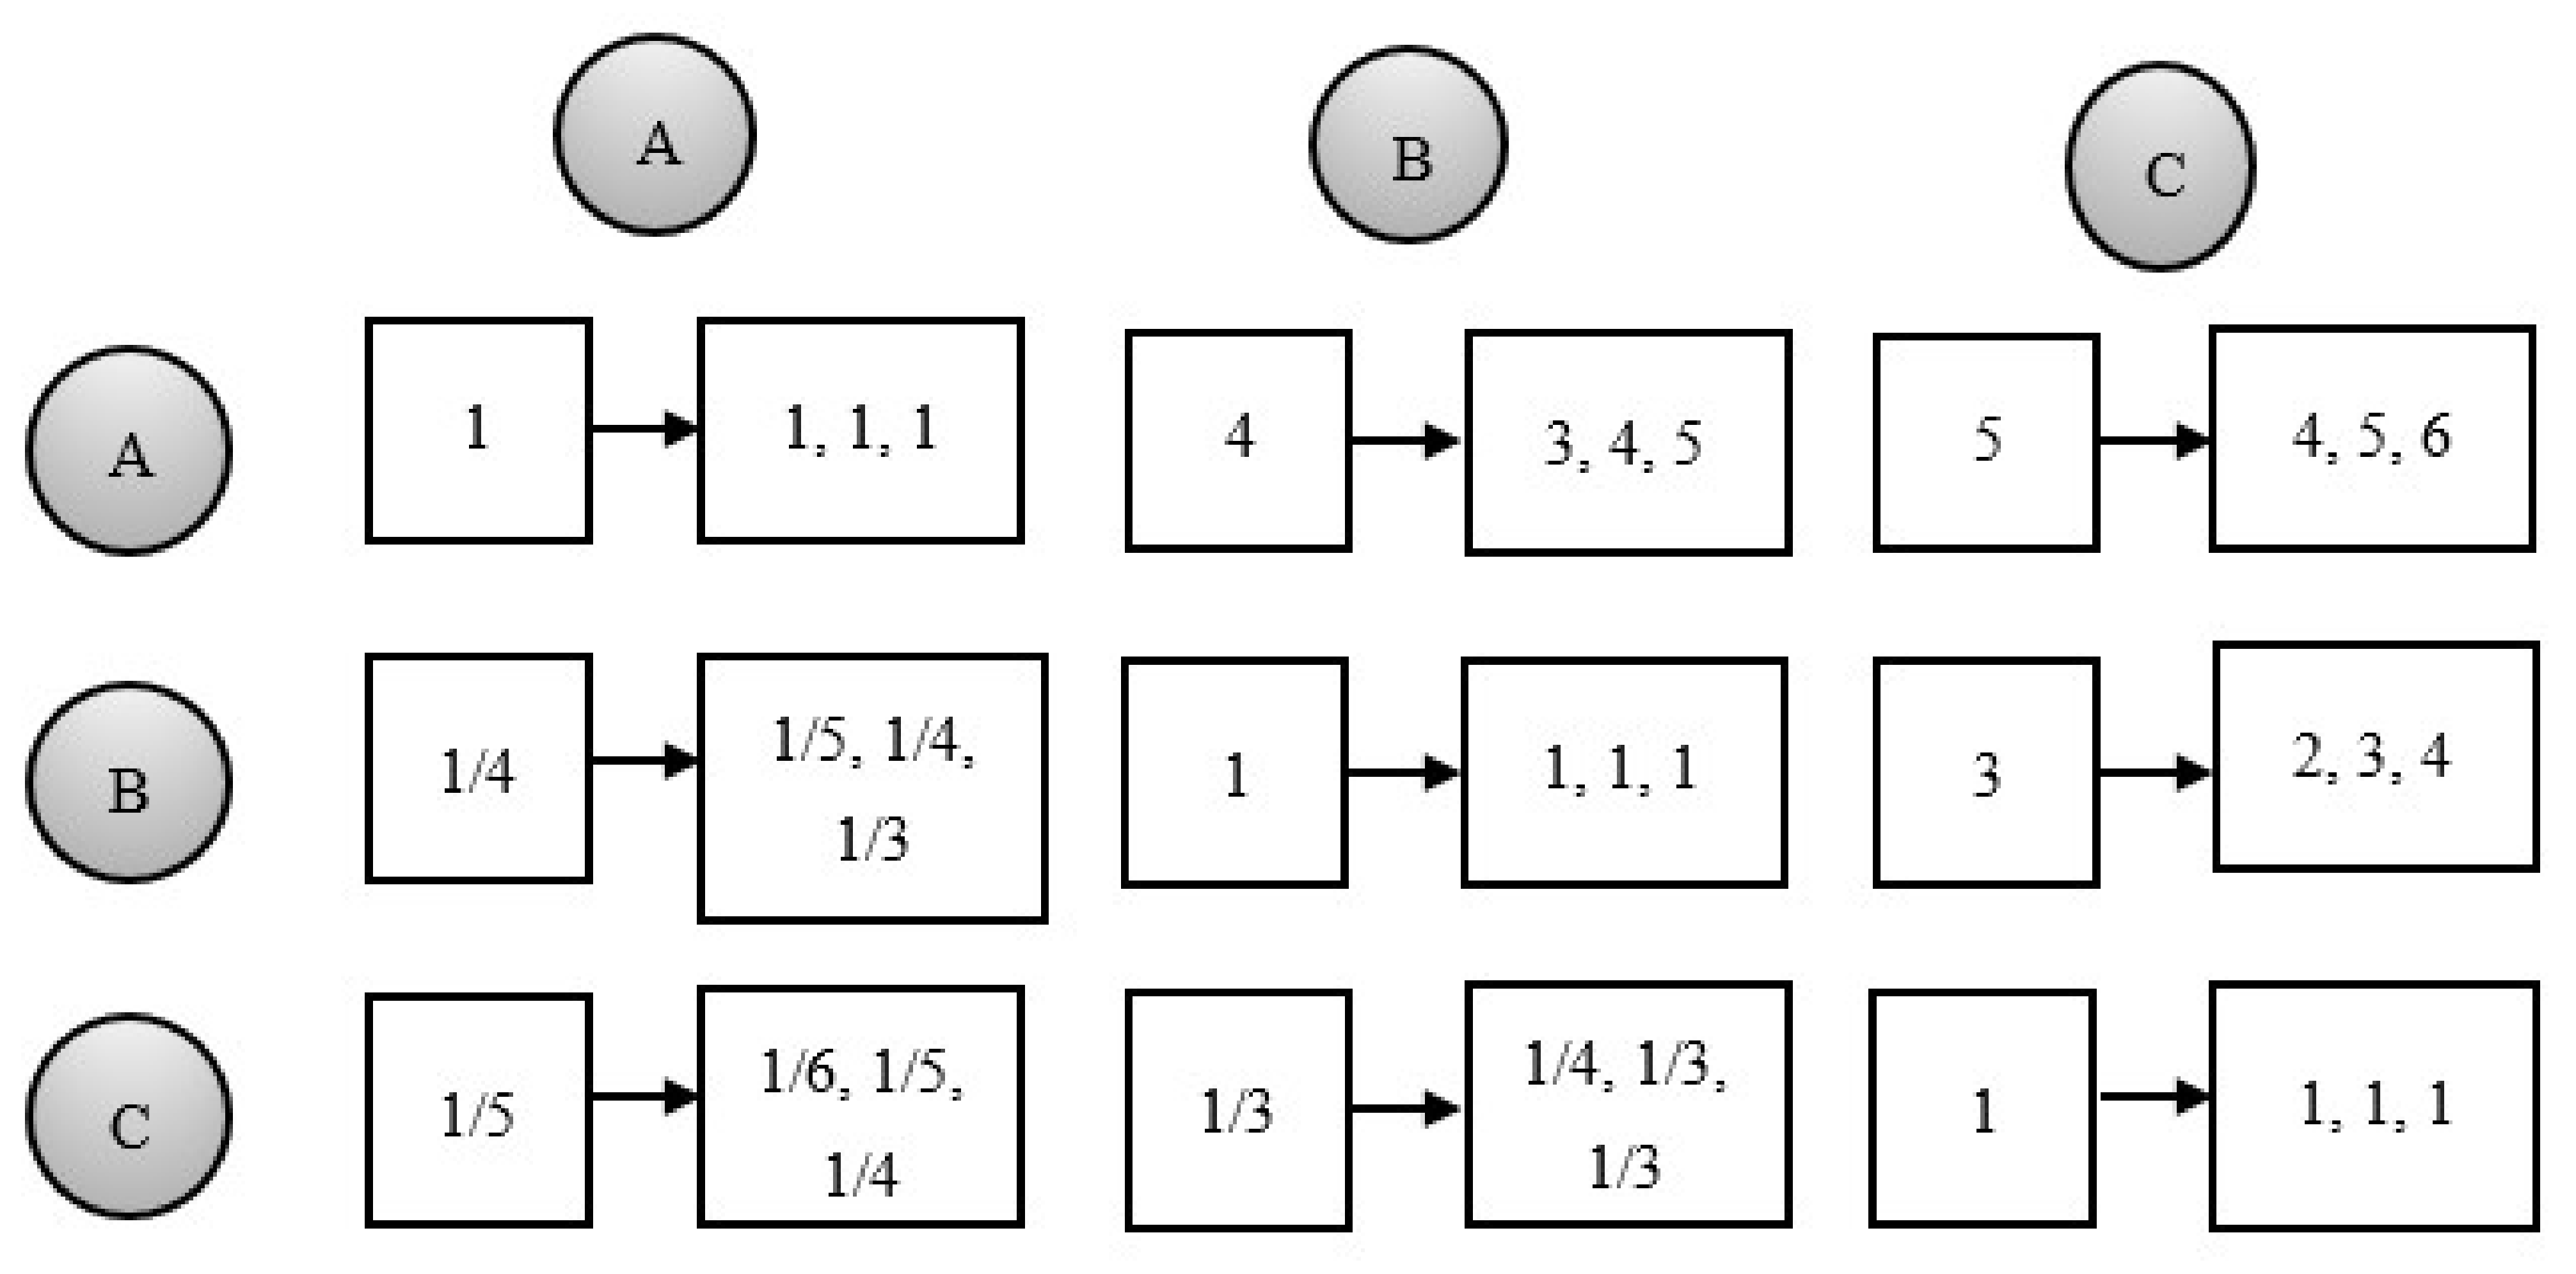
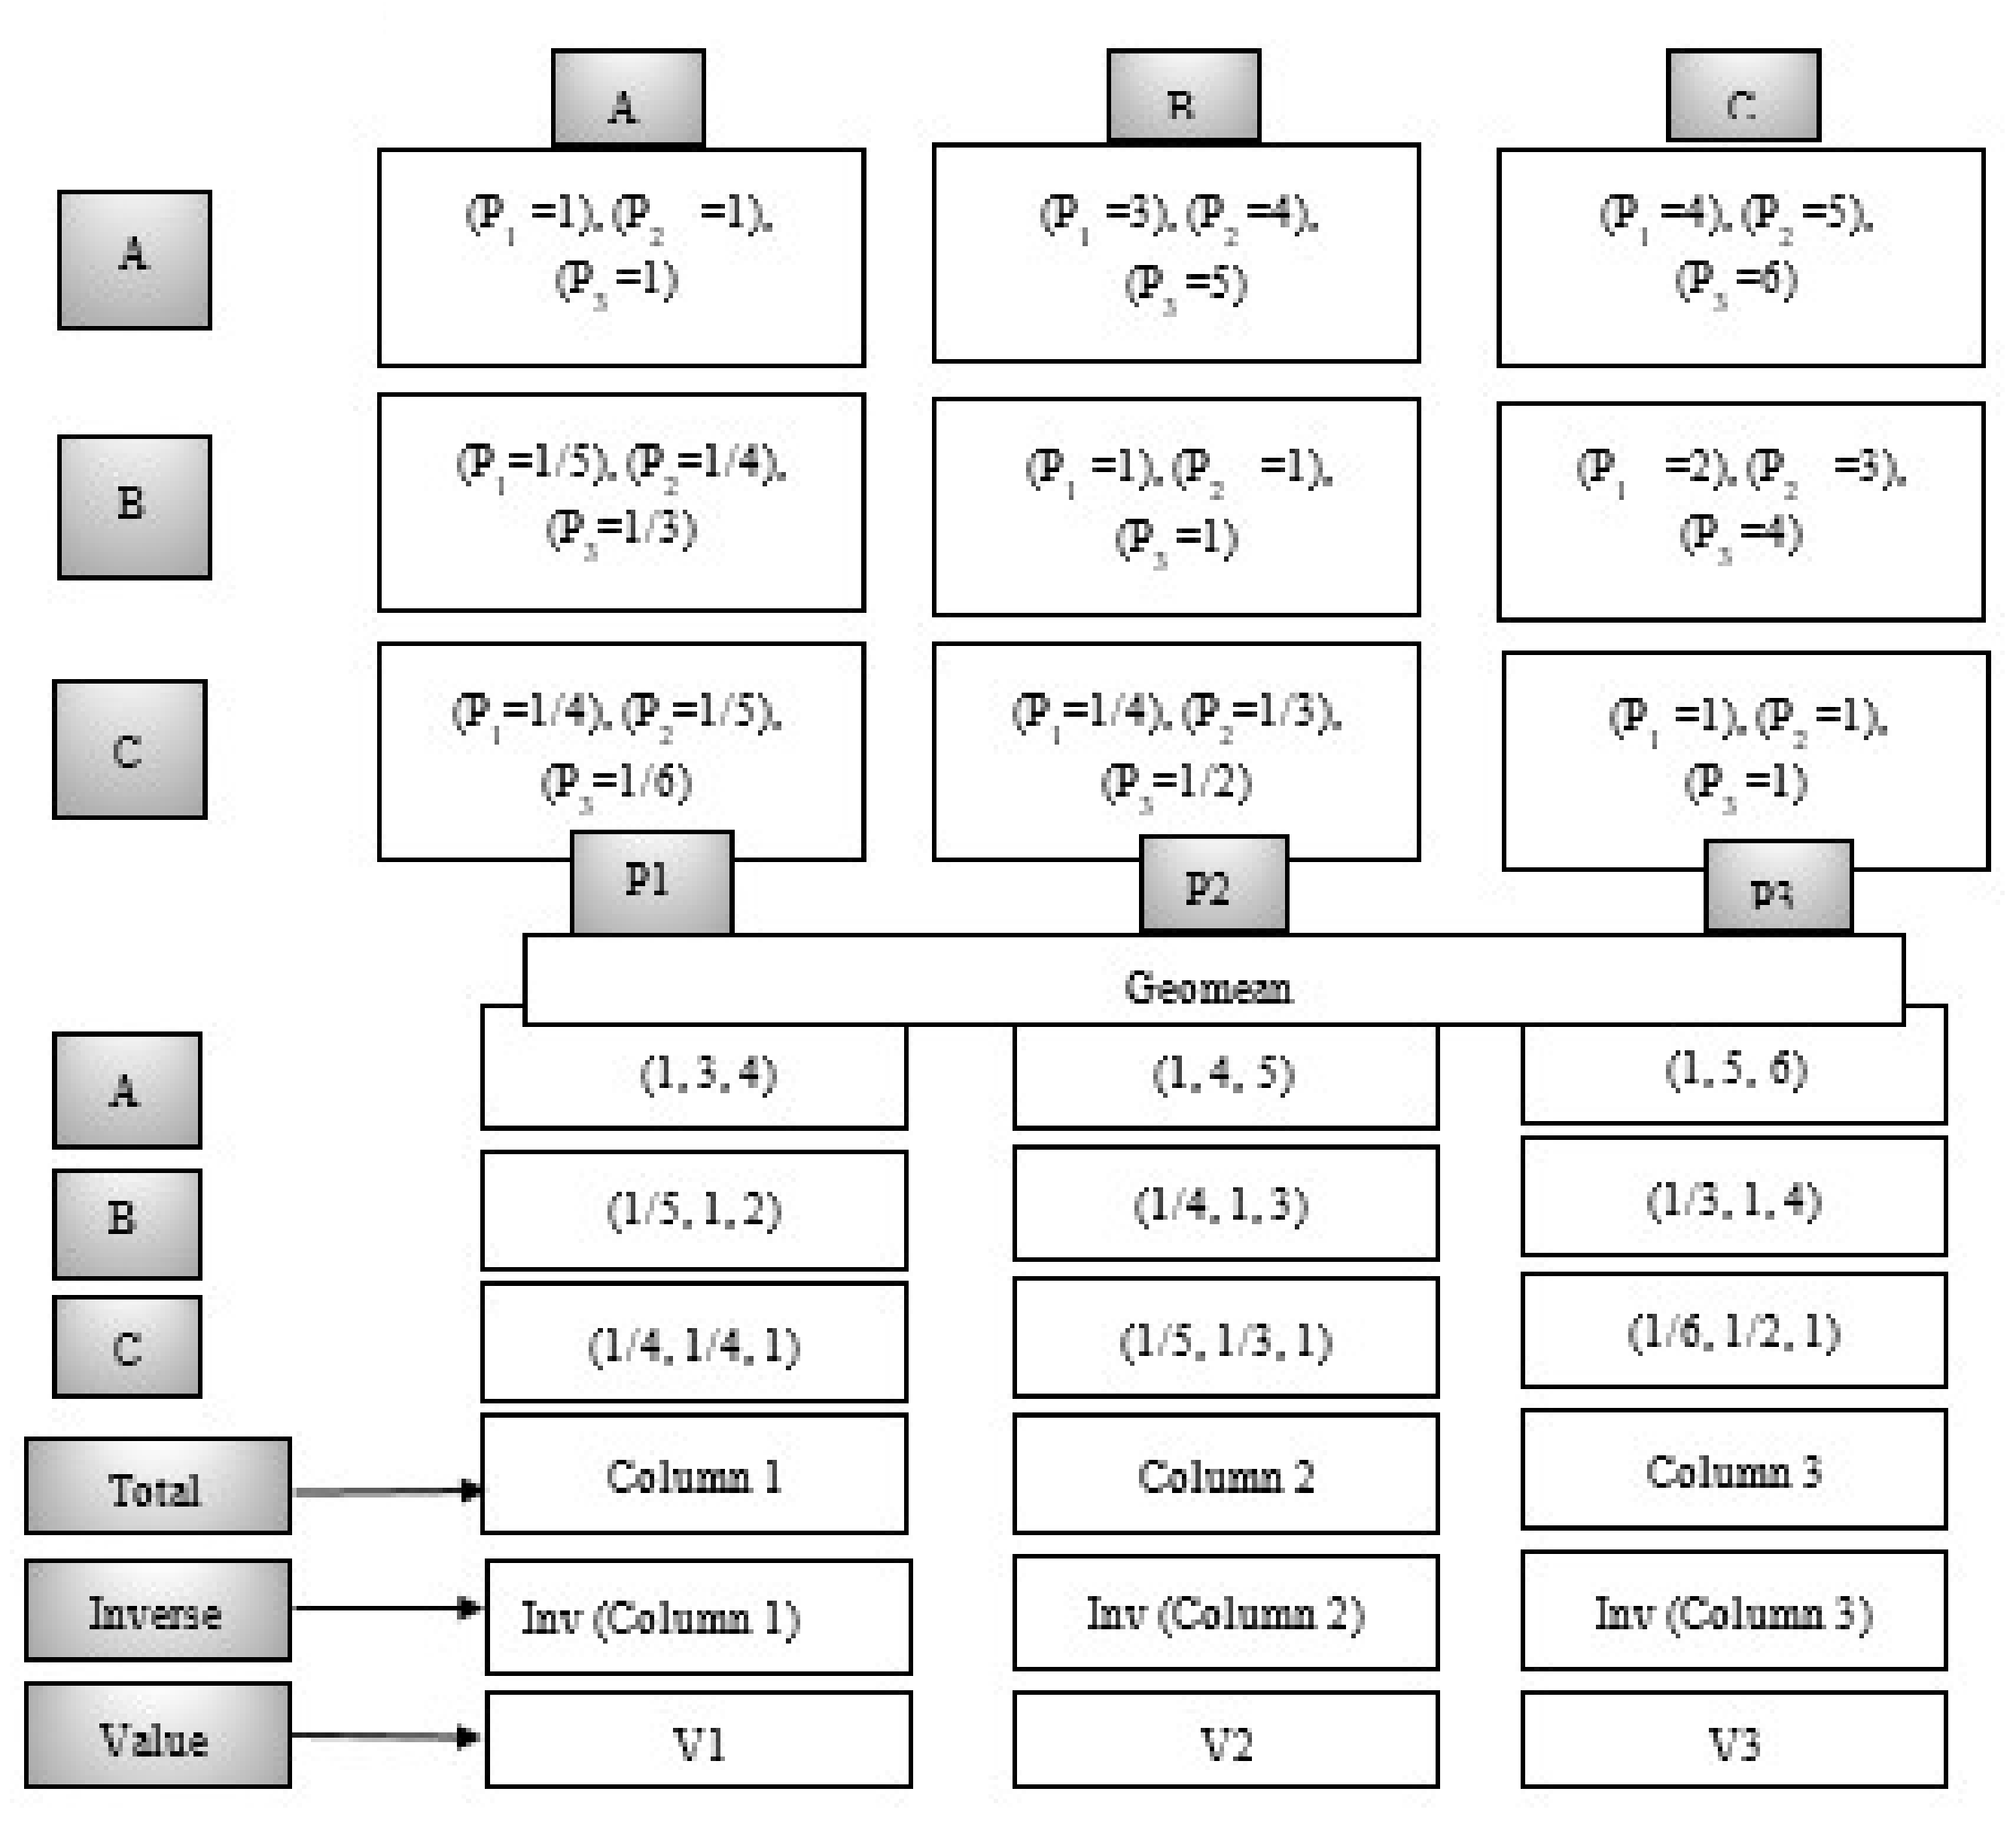
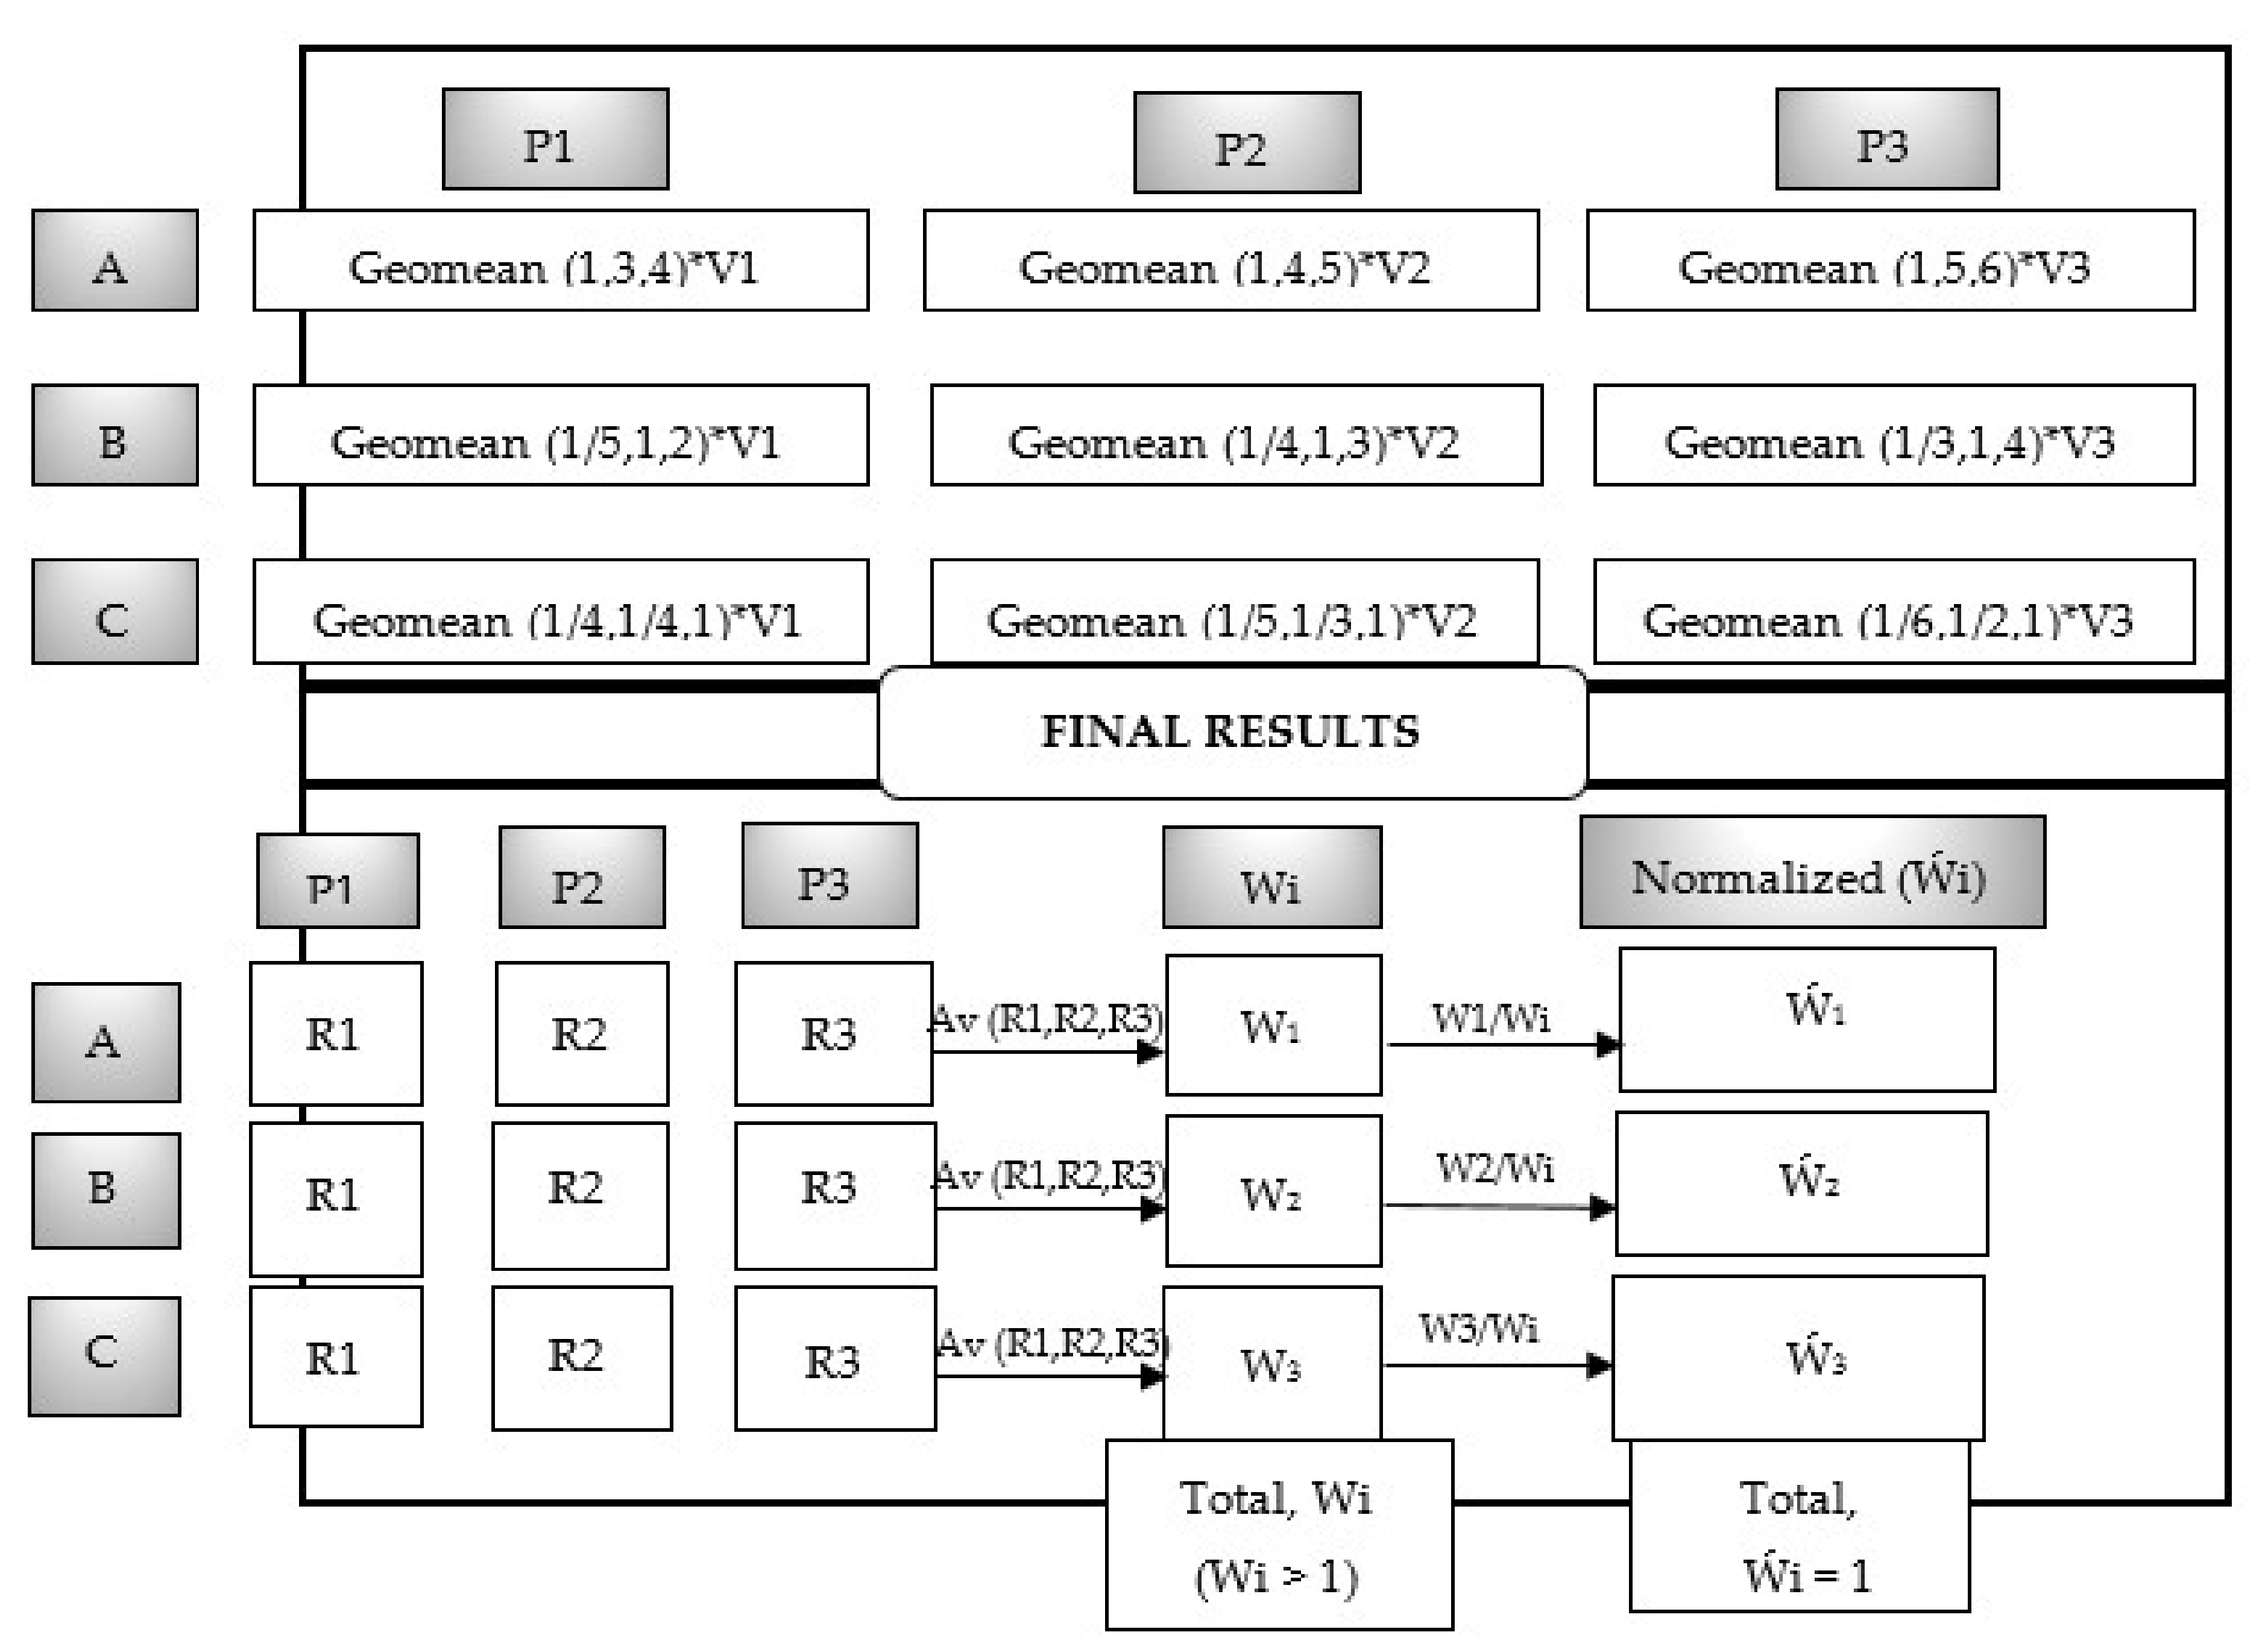
Fuzzy Analytic Hierarchy Process (Fuzzy AHP)
5. Results and Discussion
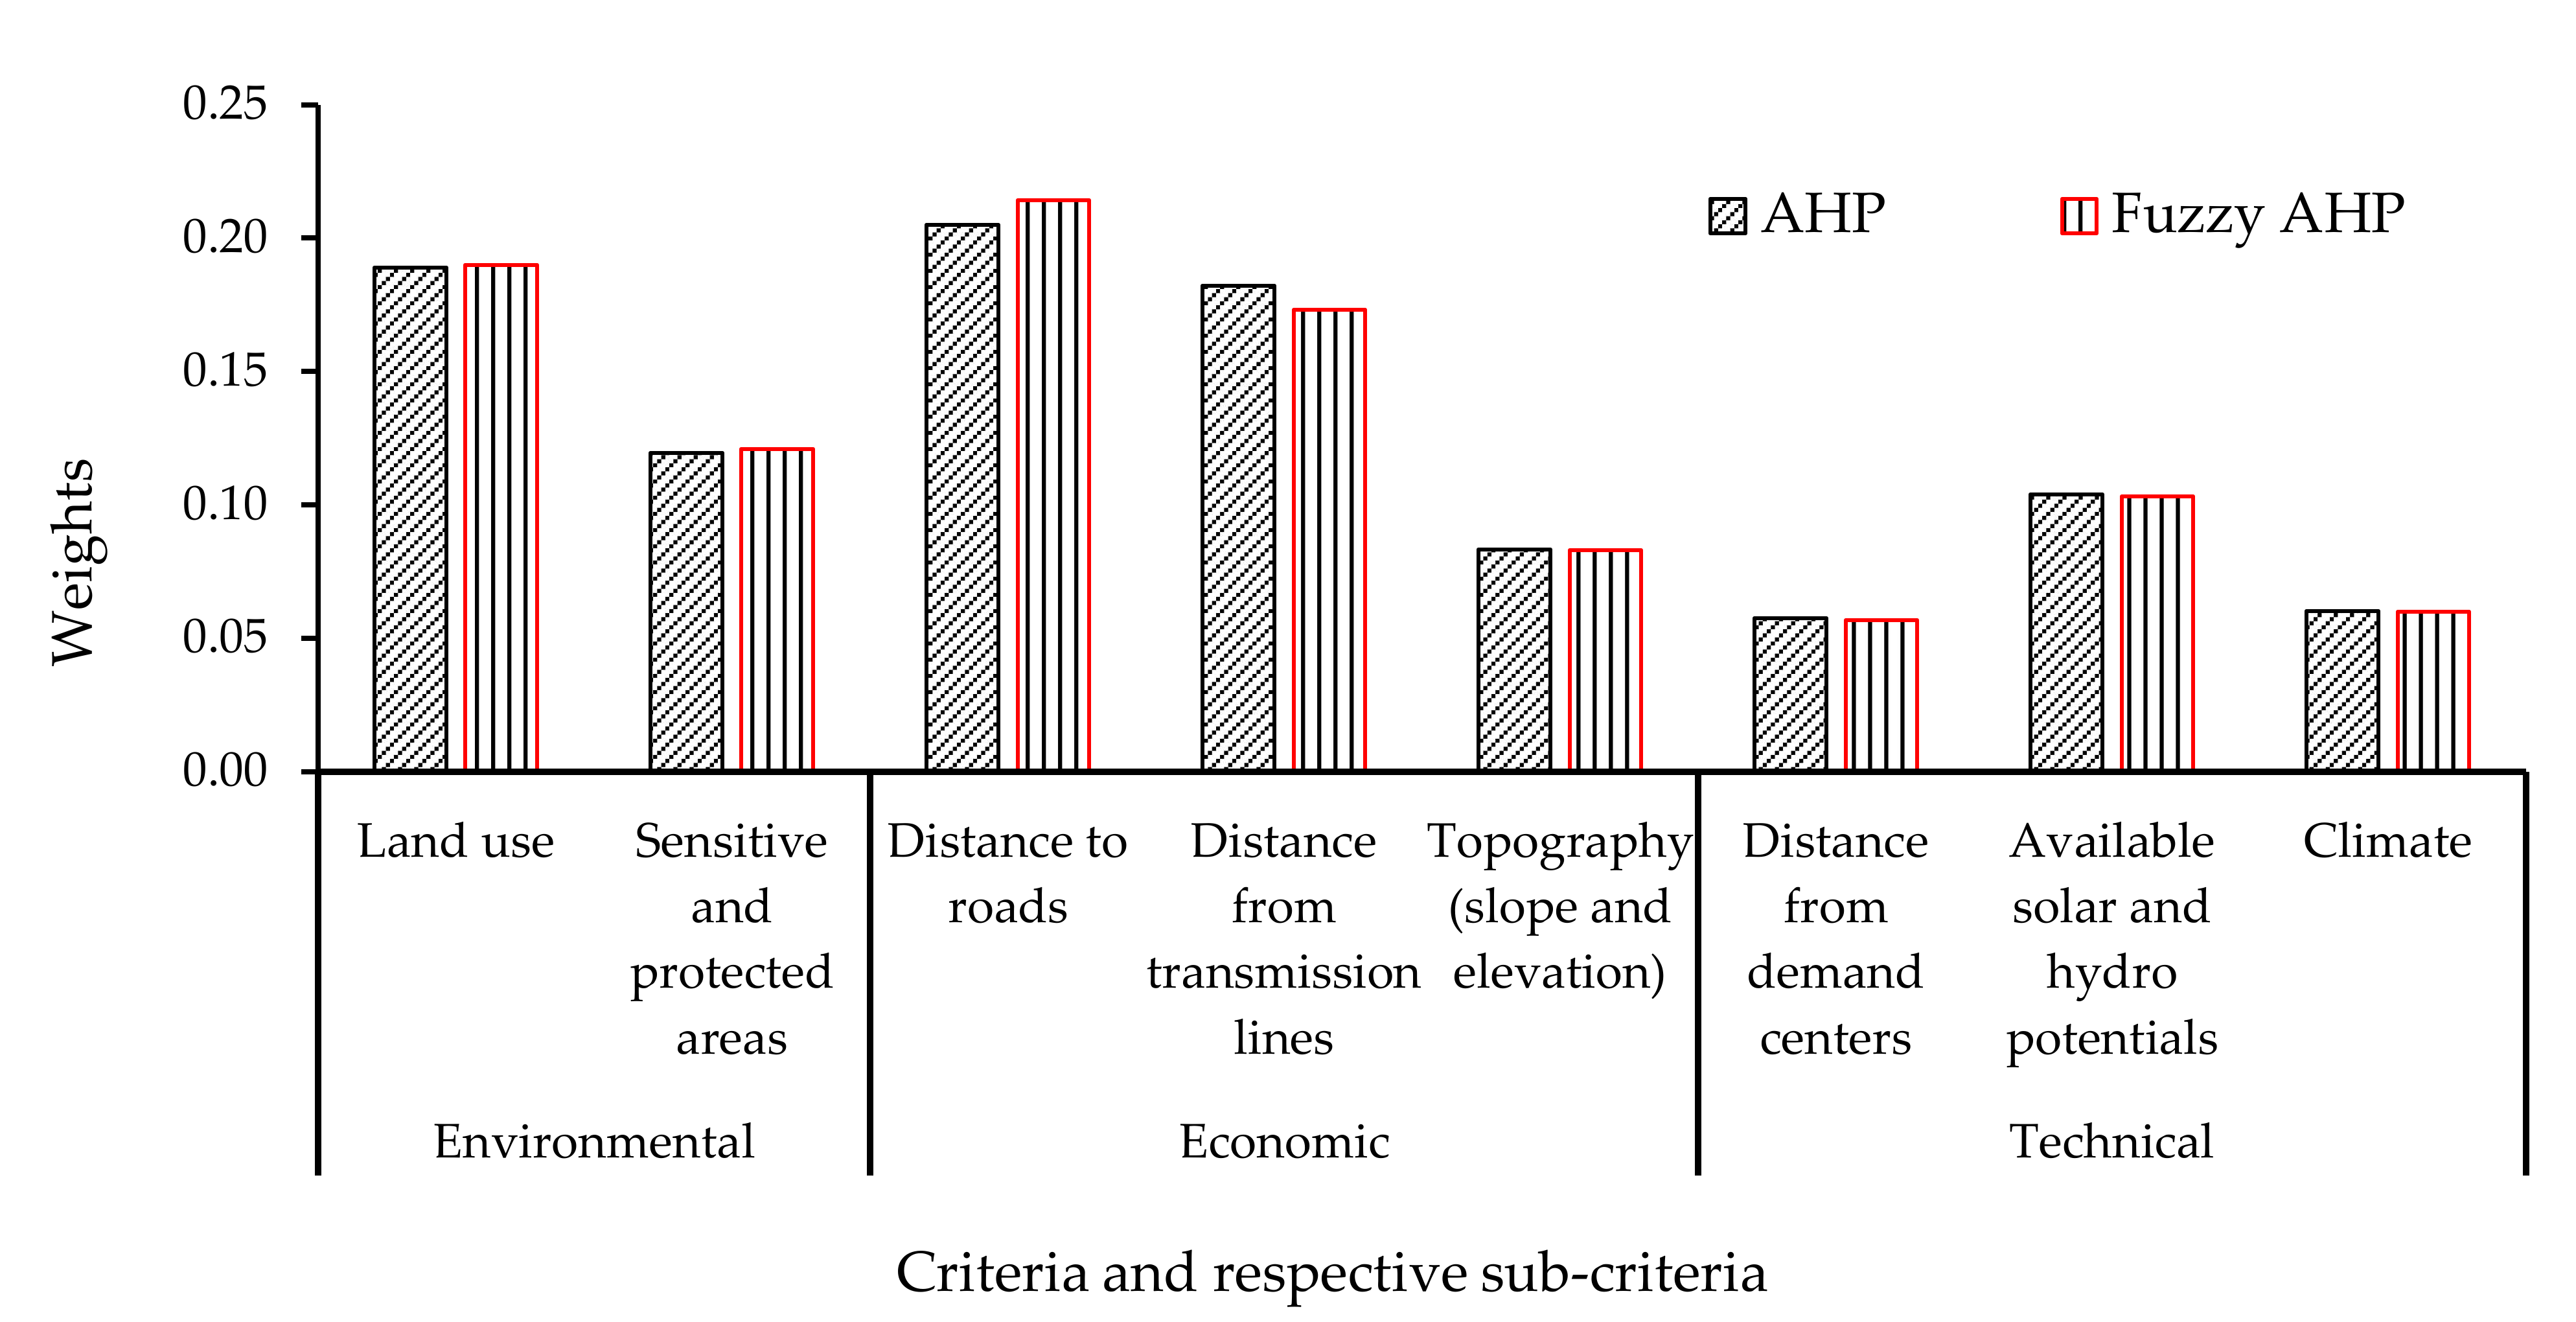
5.1. Parameter Weight Calculation Results
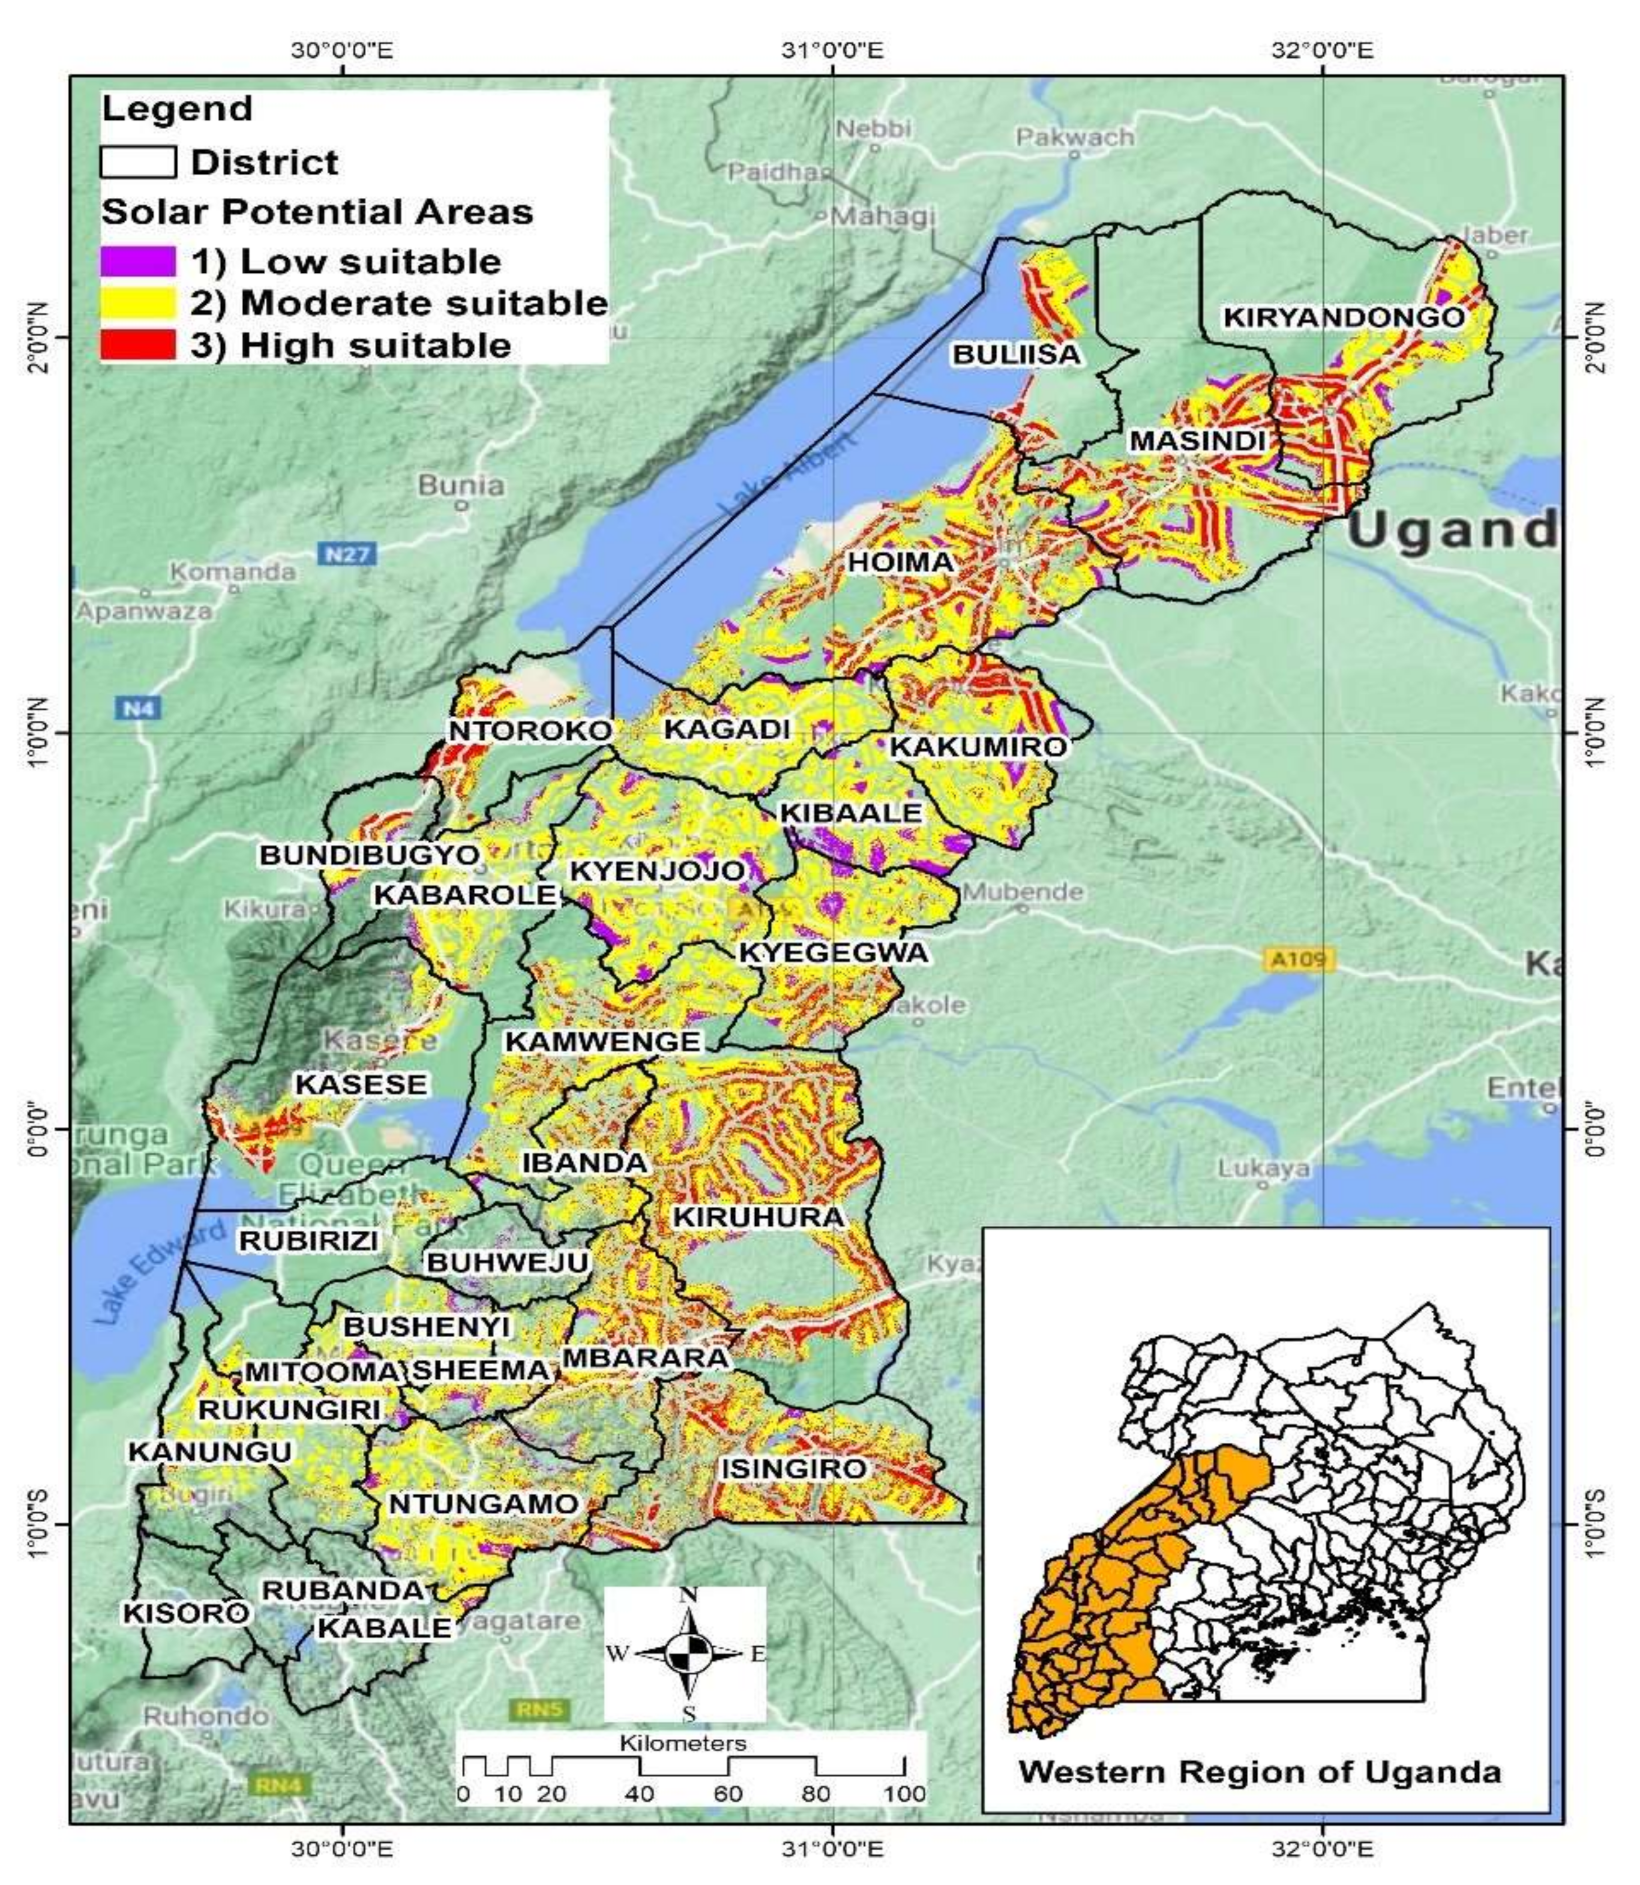
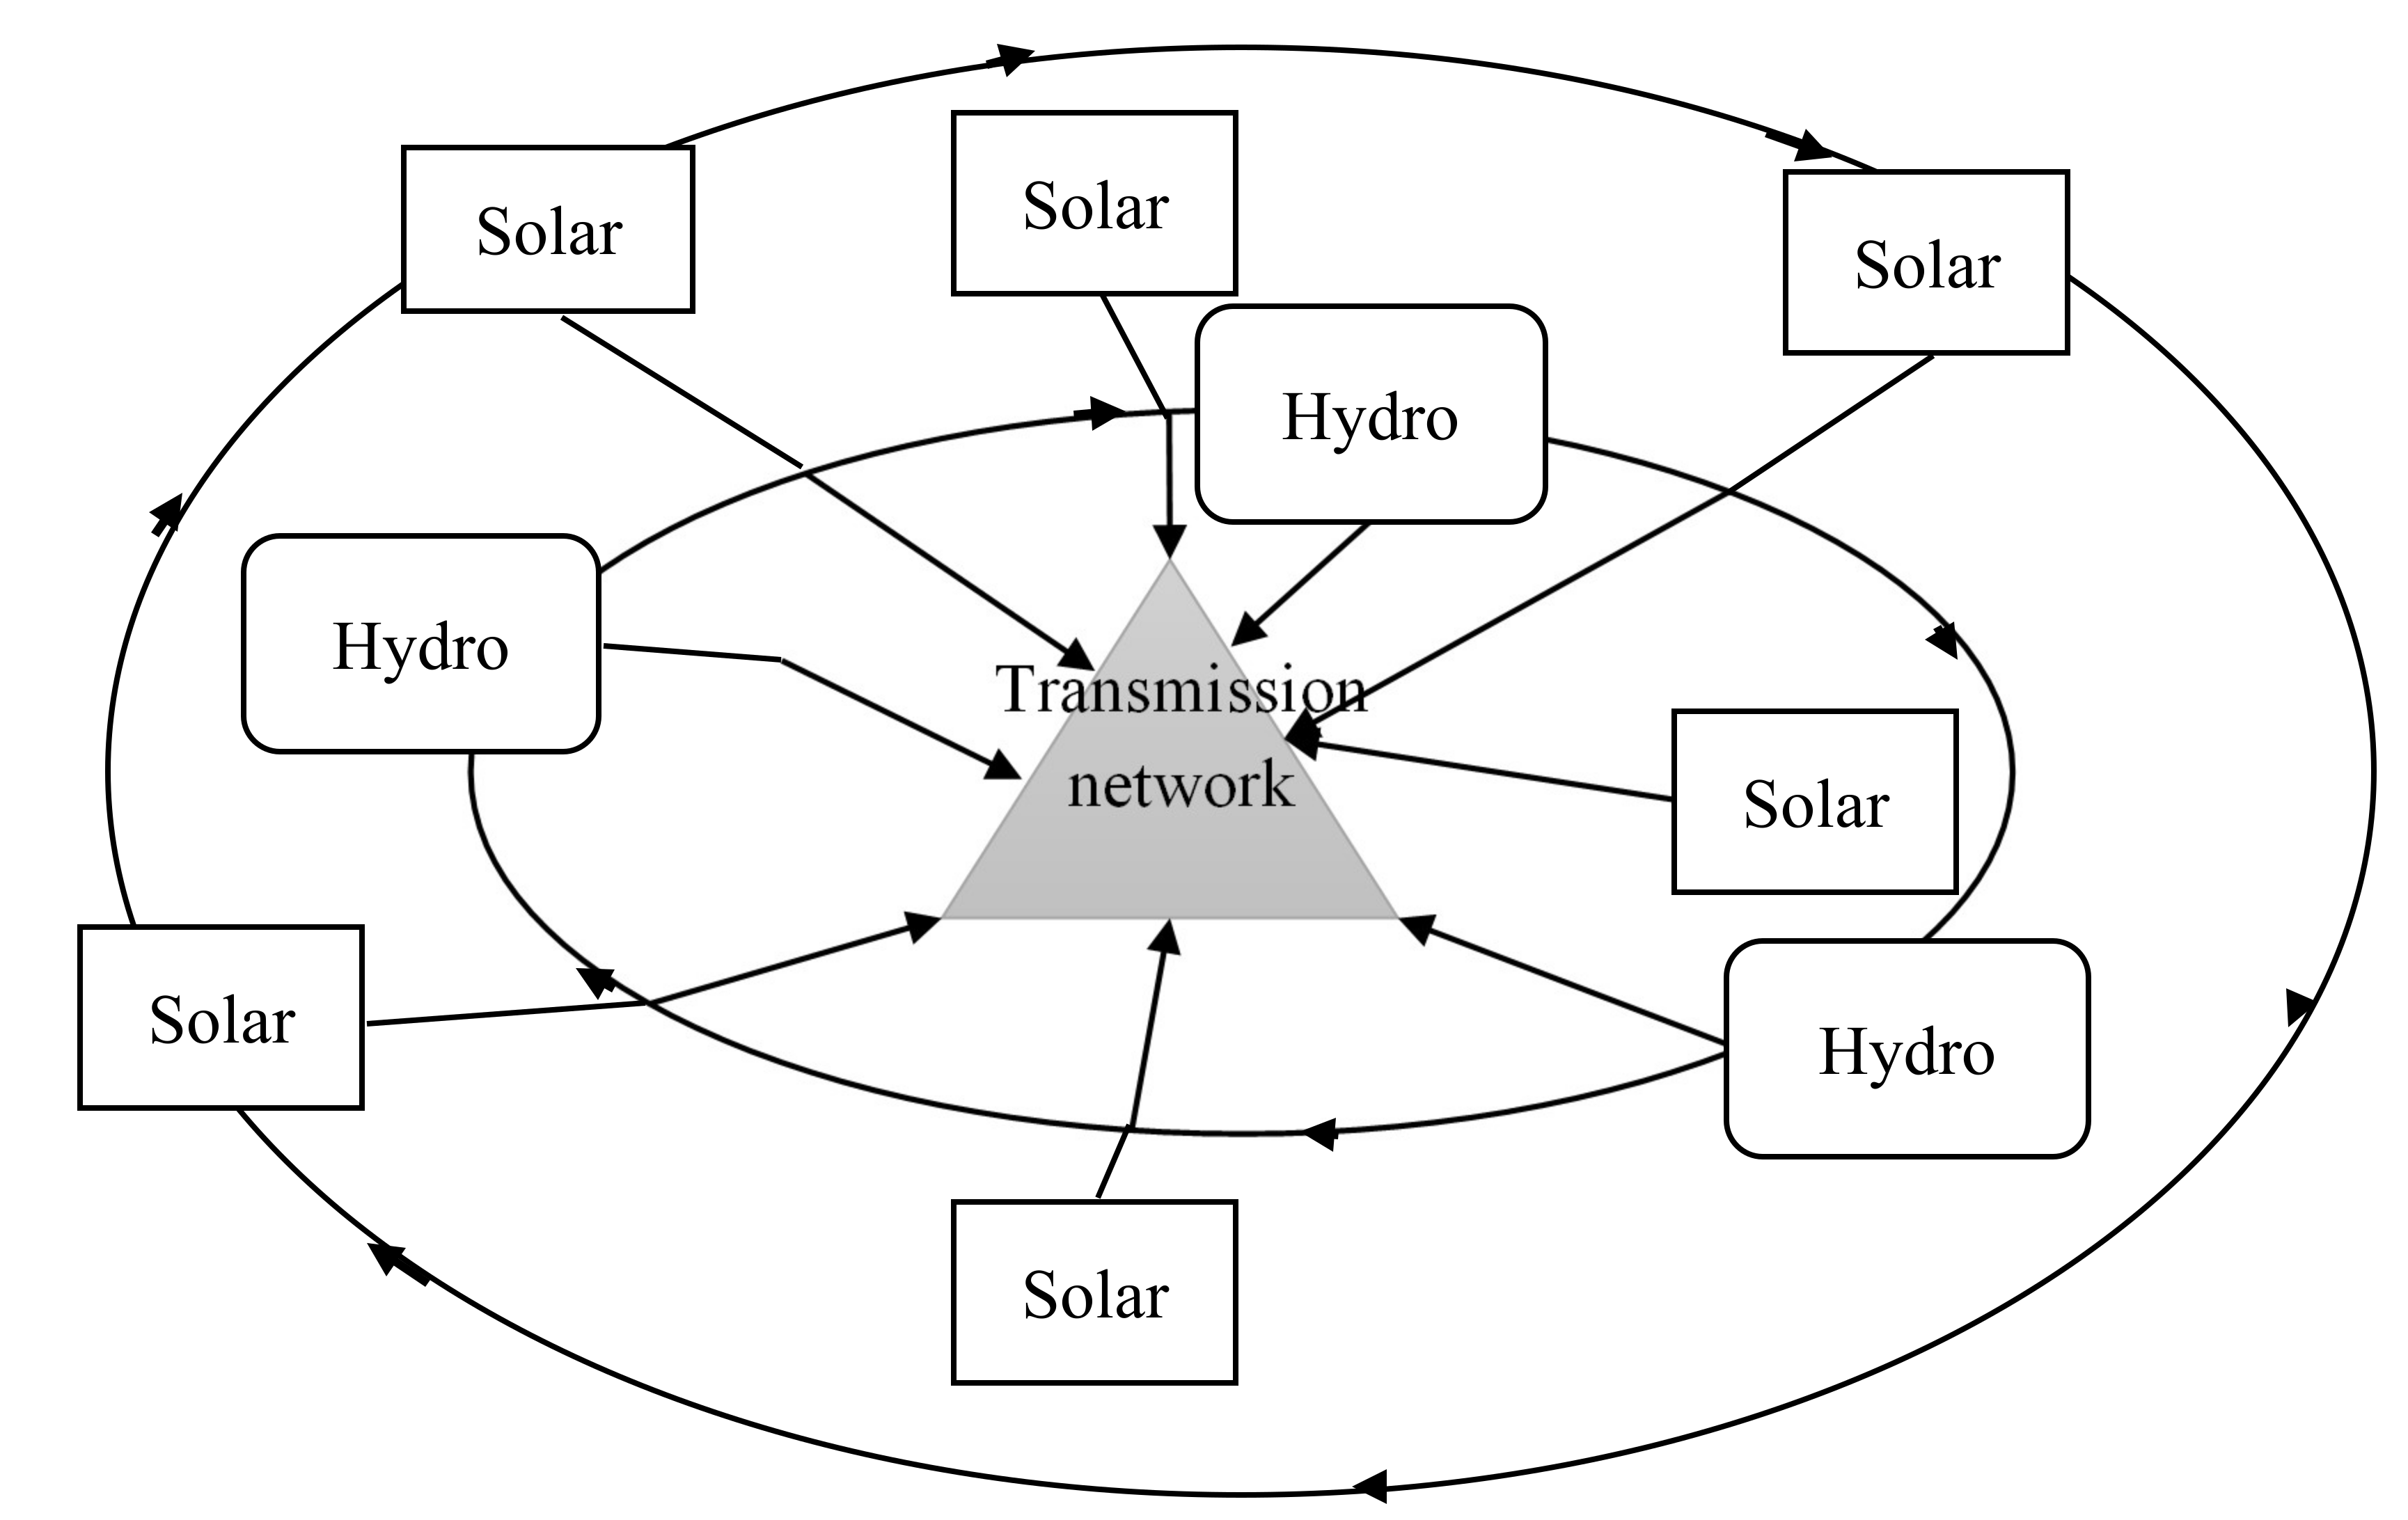
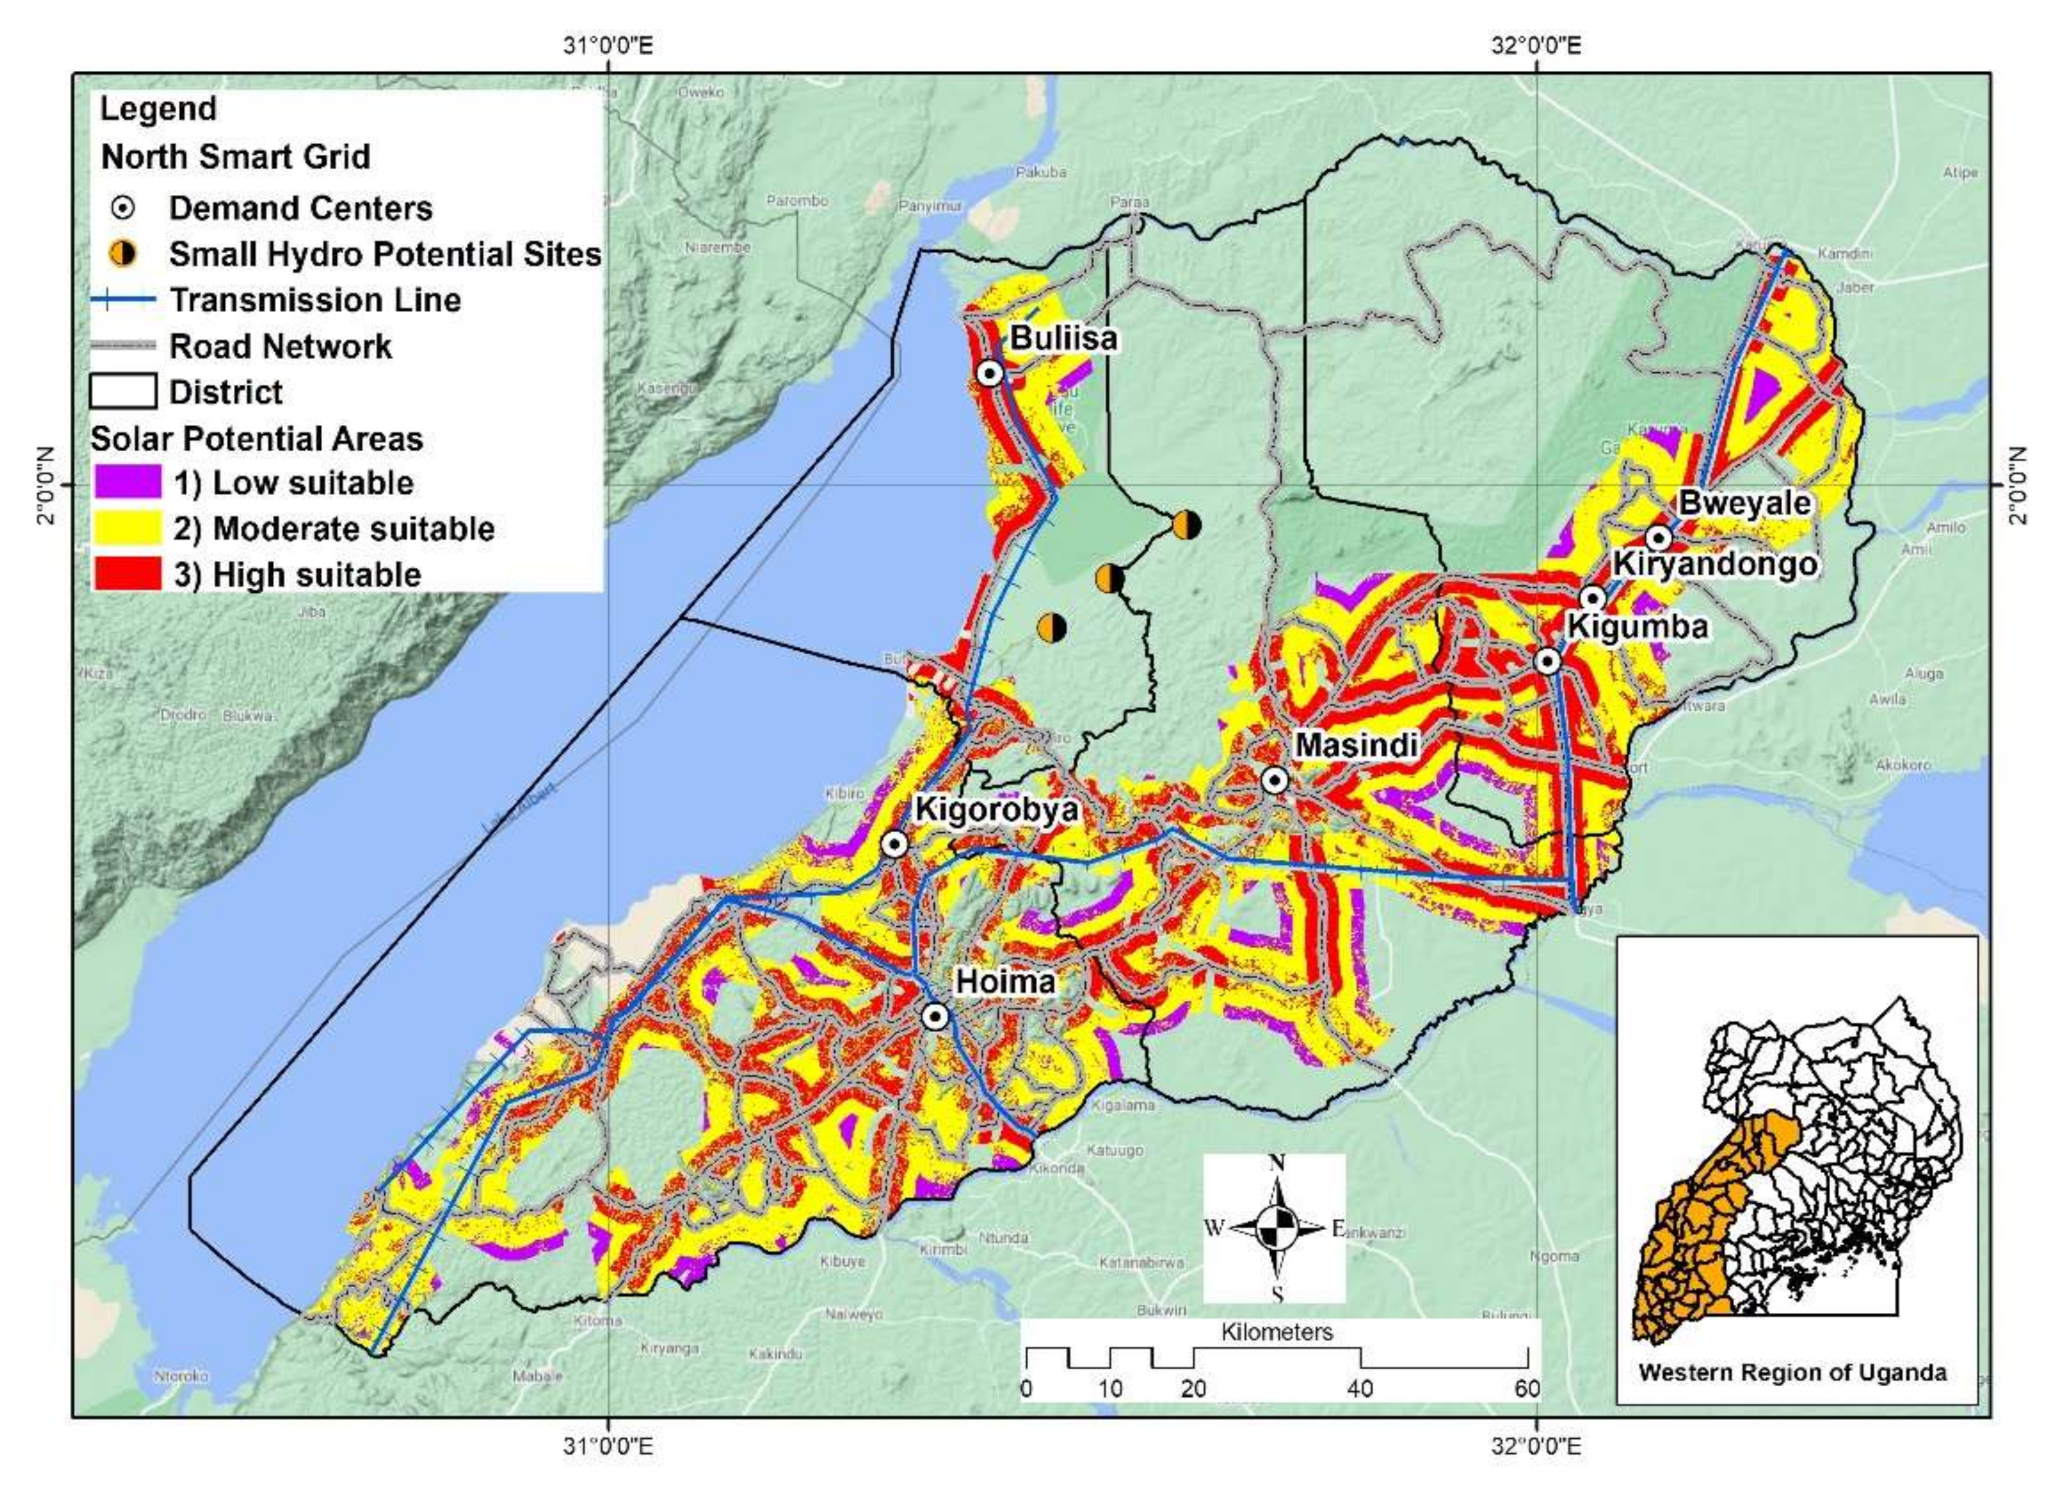
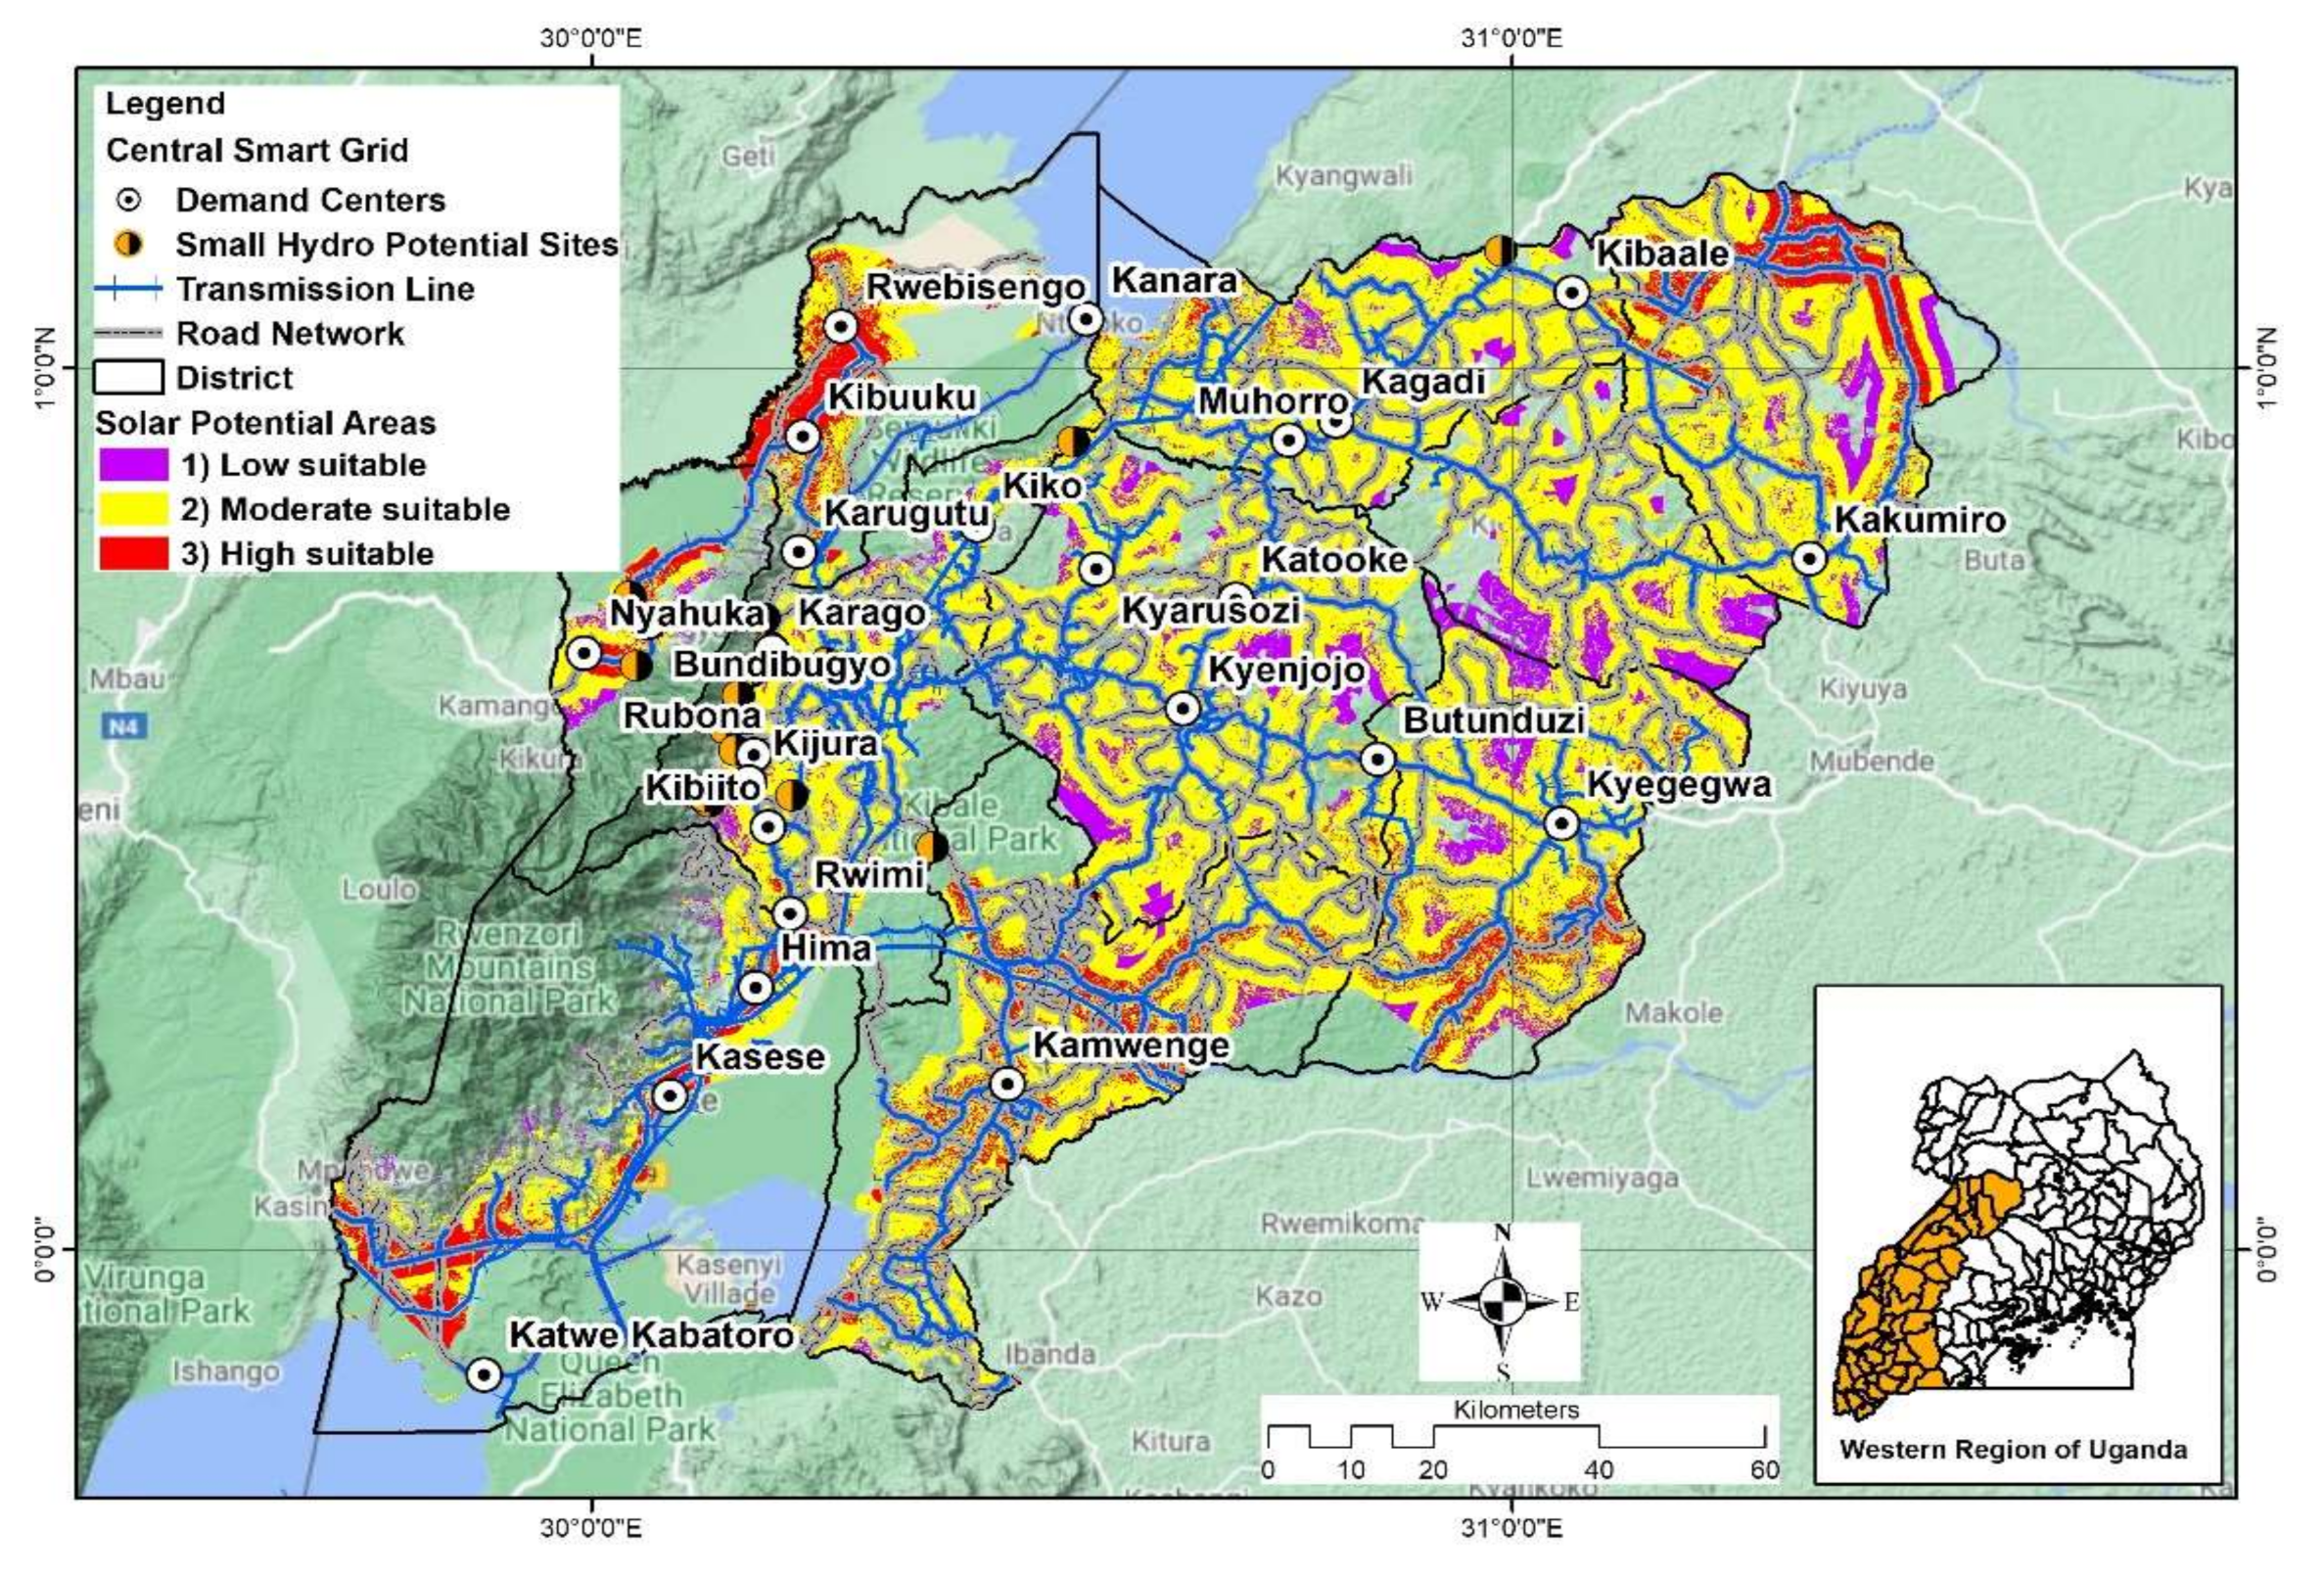
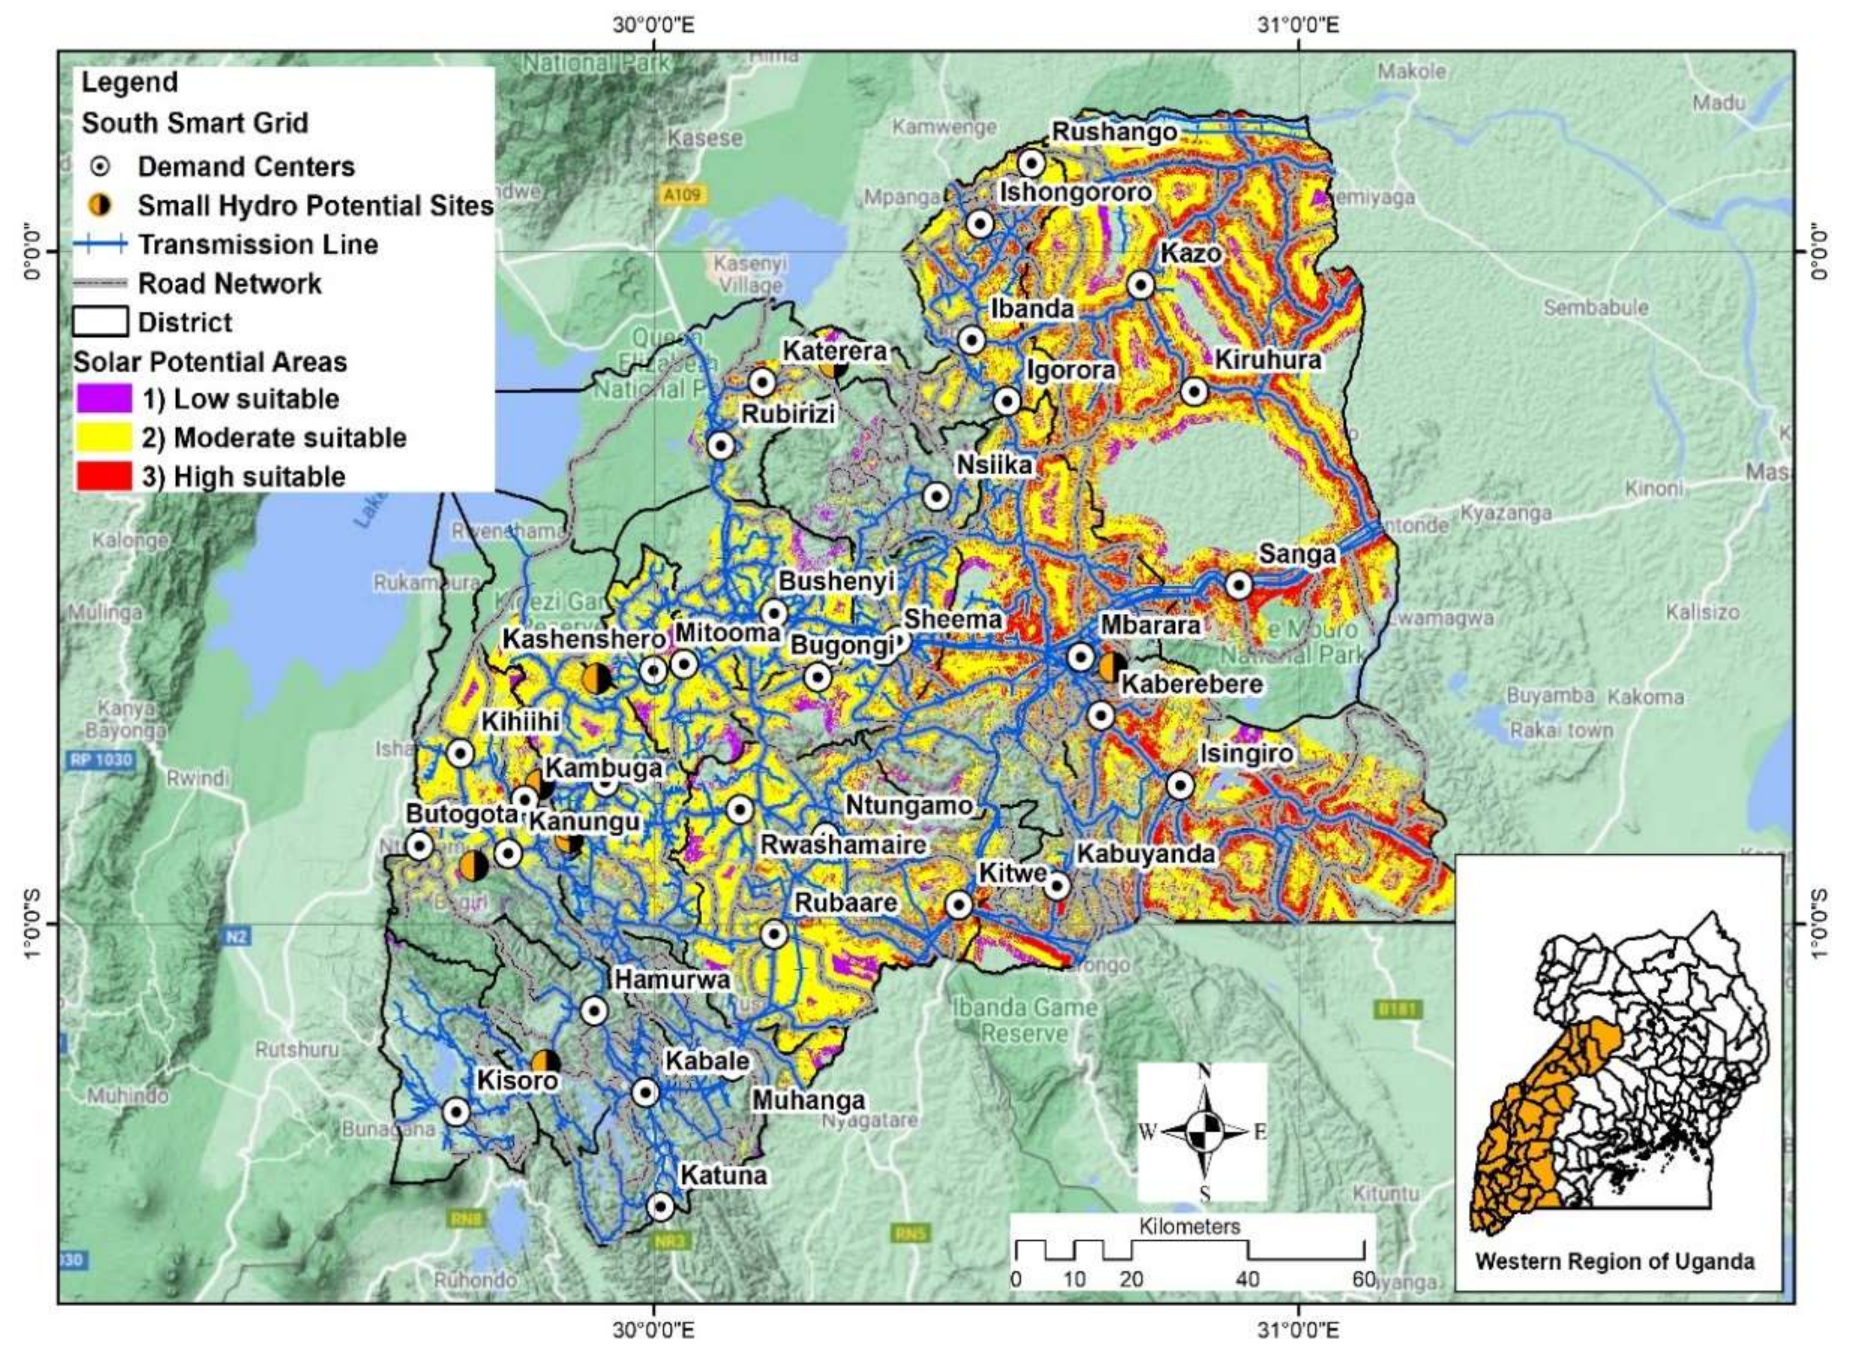
5.2. Smart Grid Suitable Sites
5.3. Study Results for Future Challenges
6. Conclusions
Author Contributions
Funding
Institutional Review Board Statement
Informed Consent Statement
Data Availability Statement
Acknowledgments
Conflicts of Interest
Appendix A

| Variables | Format | Data source |
|---|---|---|
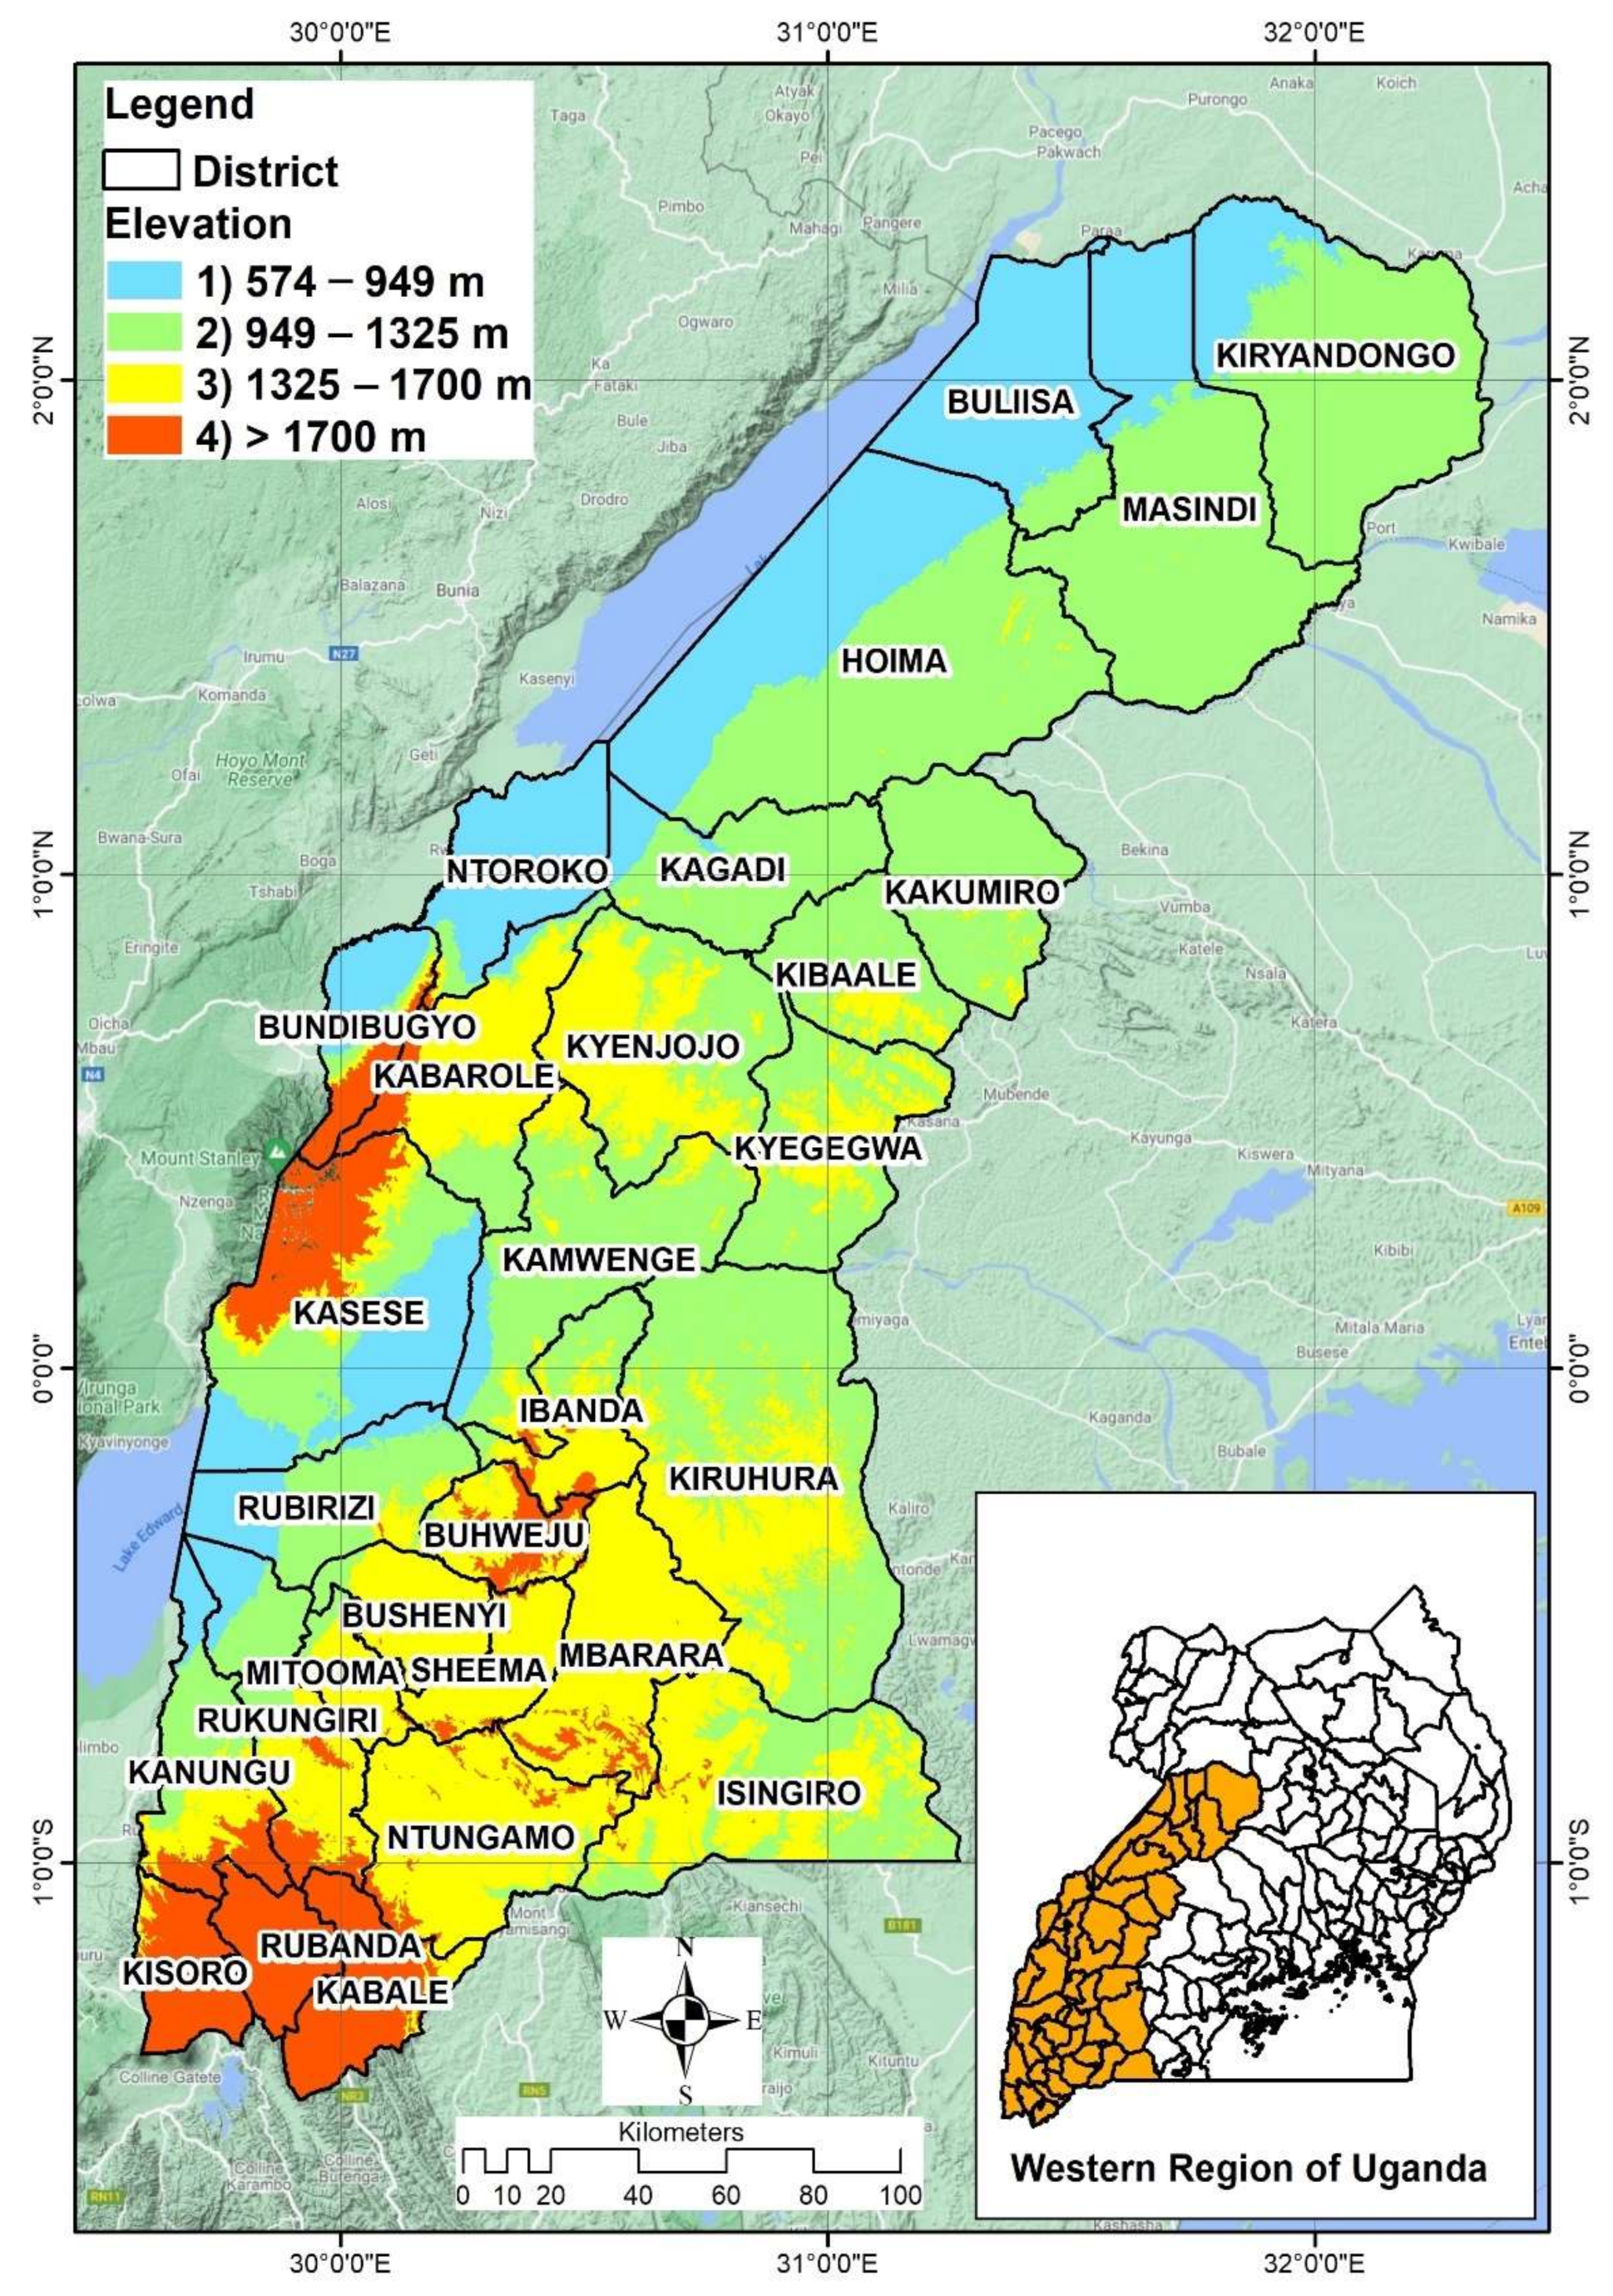
| Topography (DEM, Elevation) | Raster | U.S. Geological Survey (USGS) [61] |
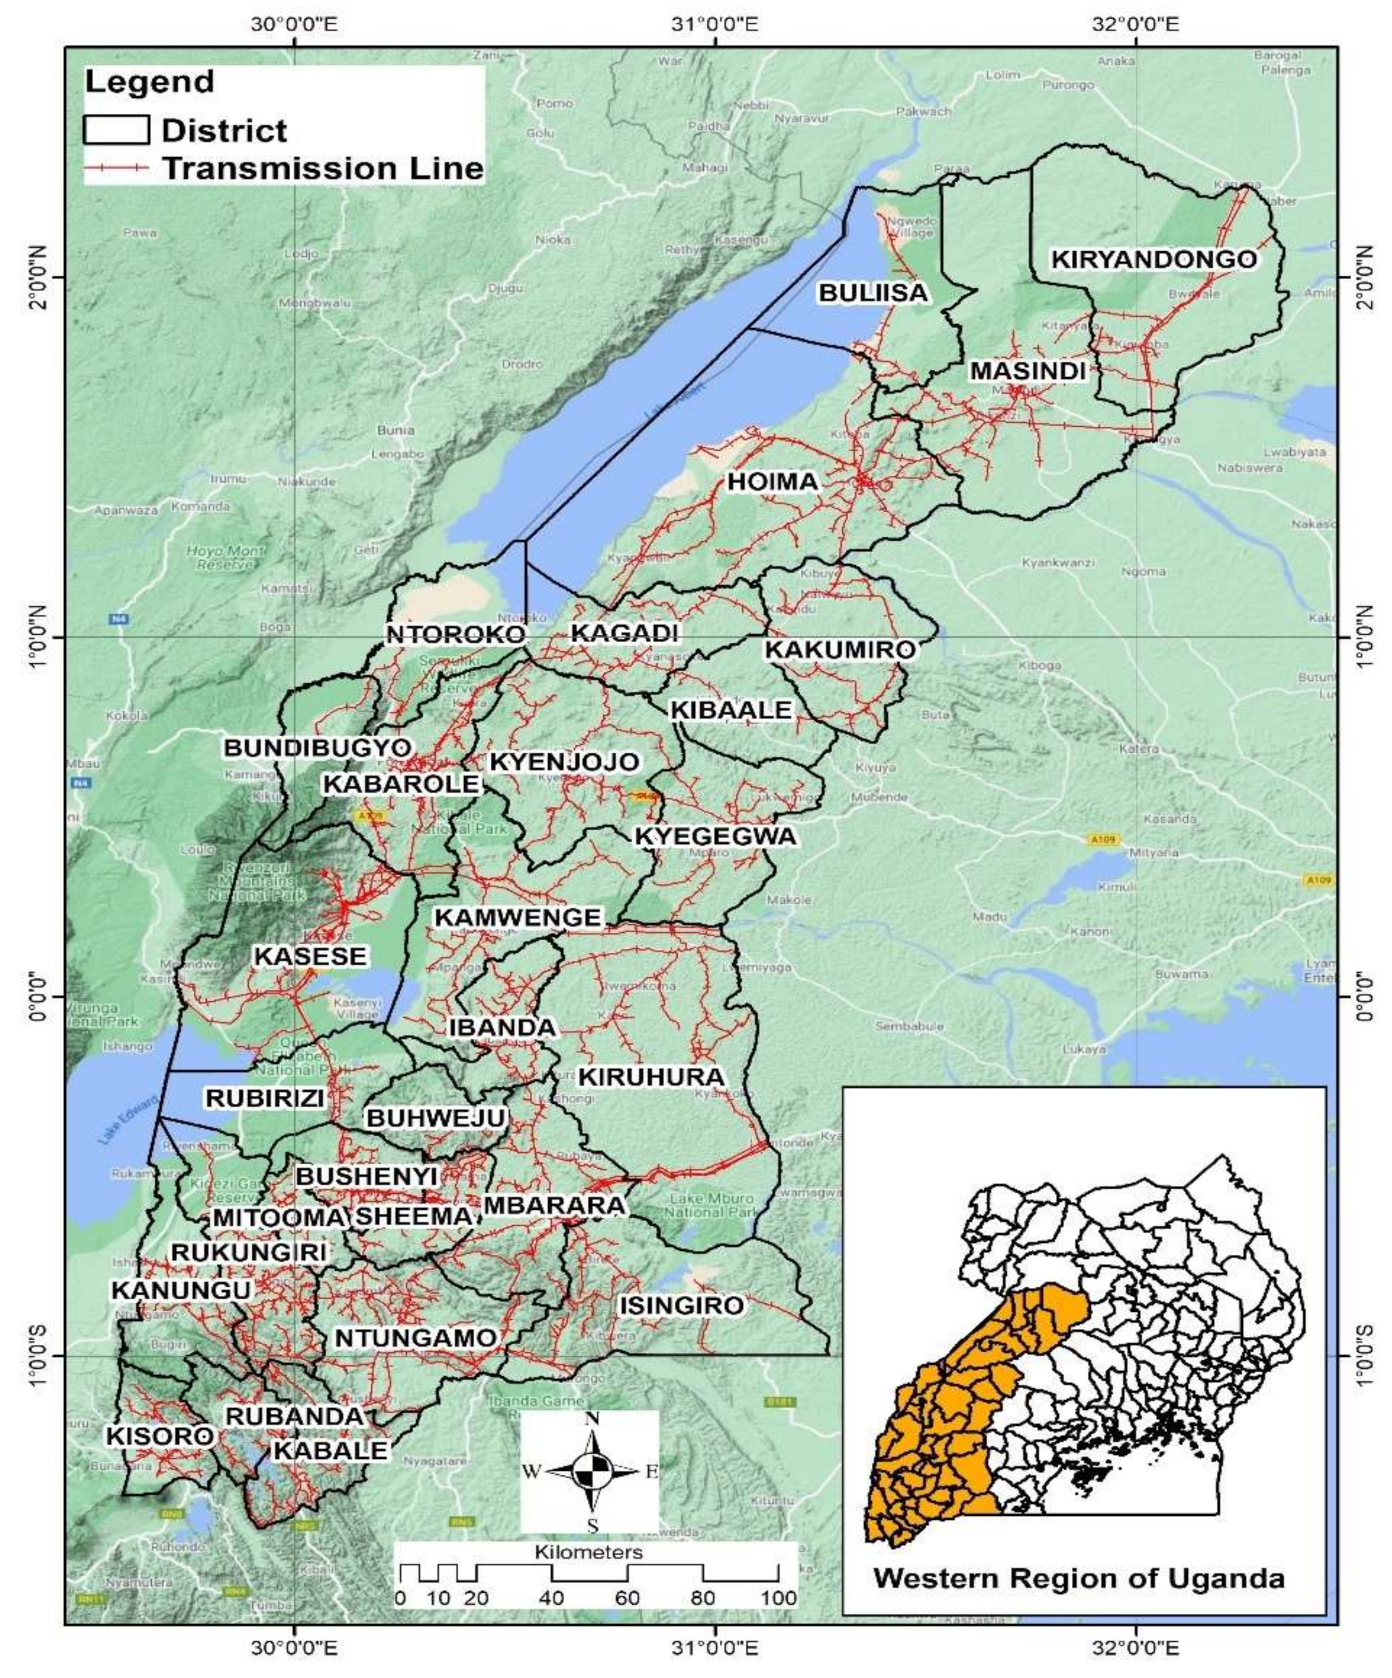
| Transmission lines | Shapefile | Energydata.info [62] |
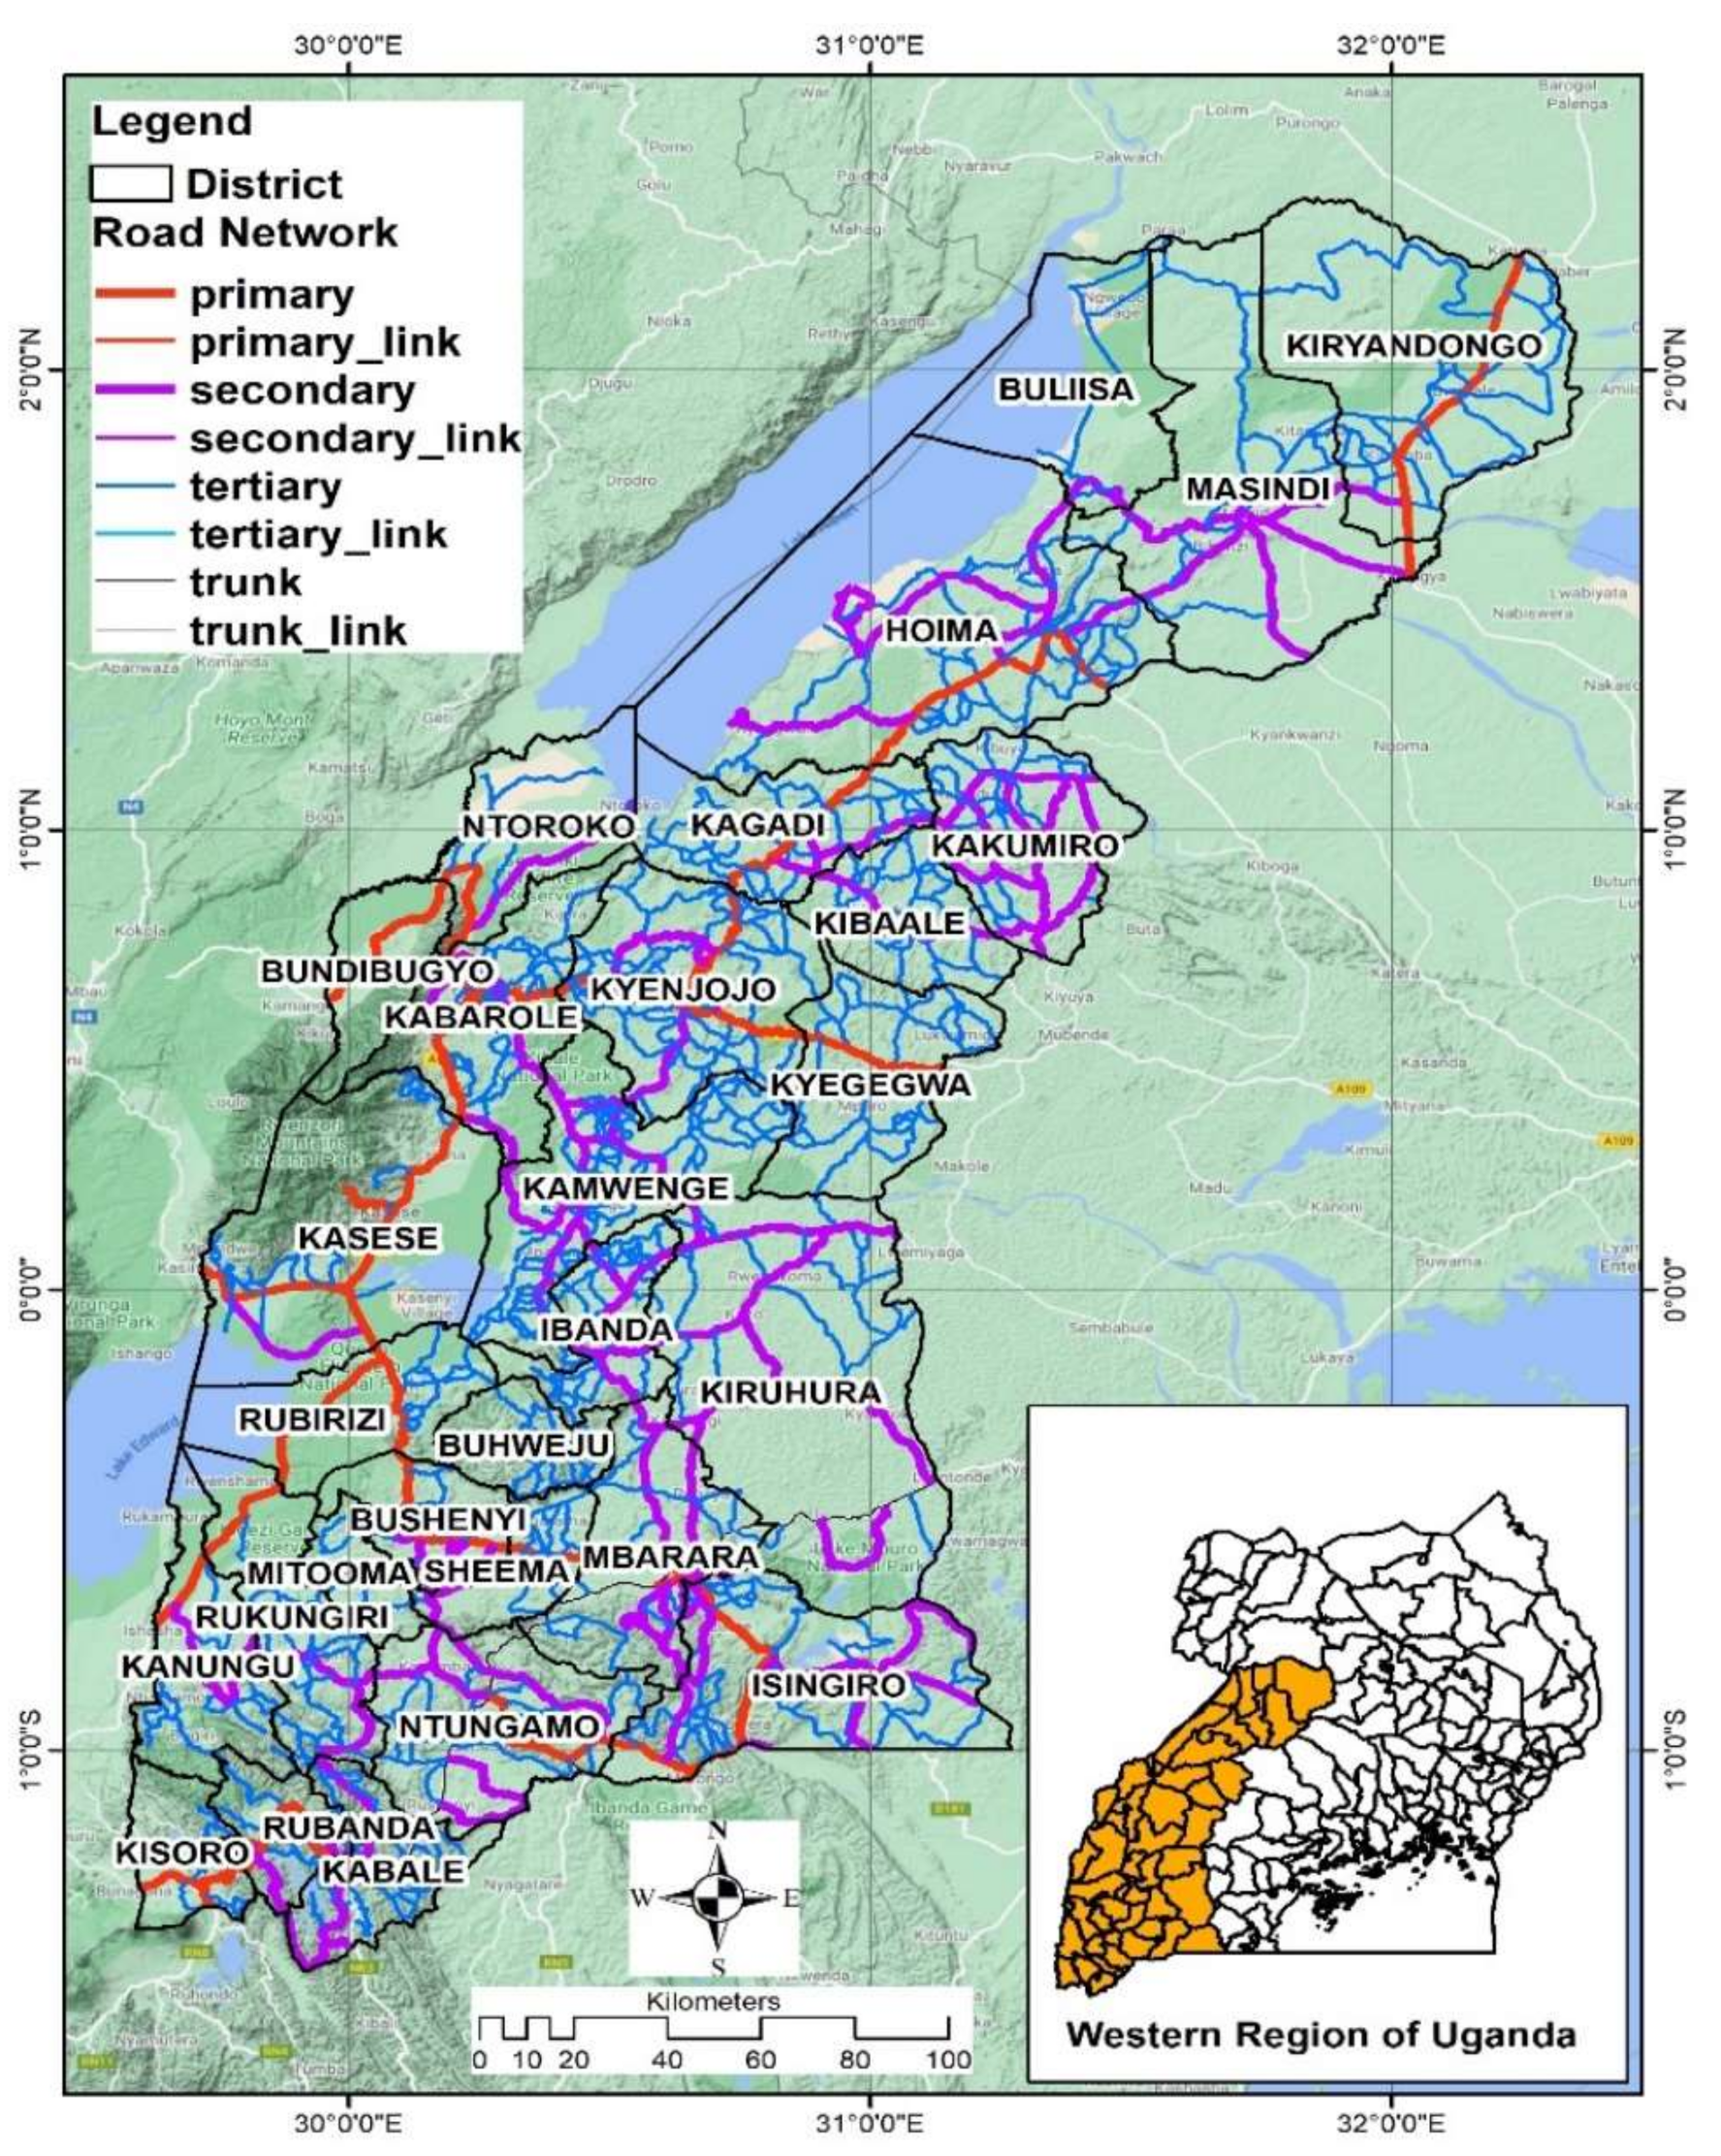
| Roads | Shapefile | World Food Geospatial data portal (WFPGeoNode) [63] |
| Land use | Shapefile | Servir Global Portal [64] |
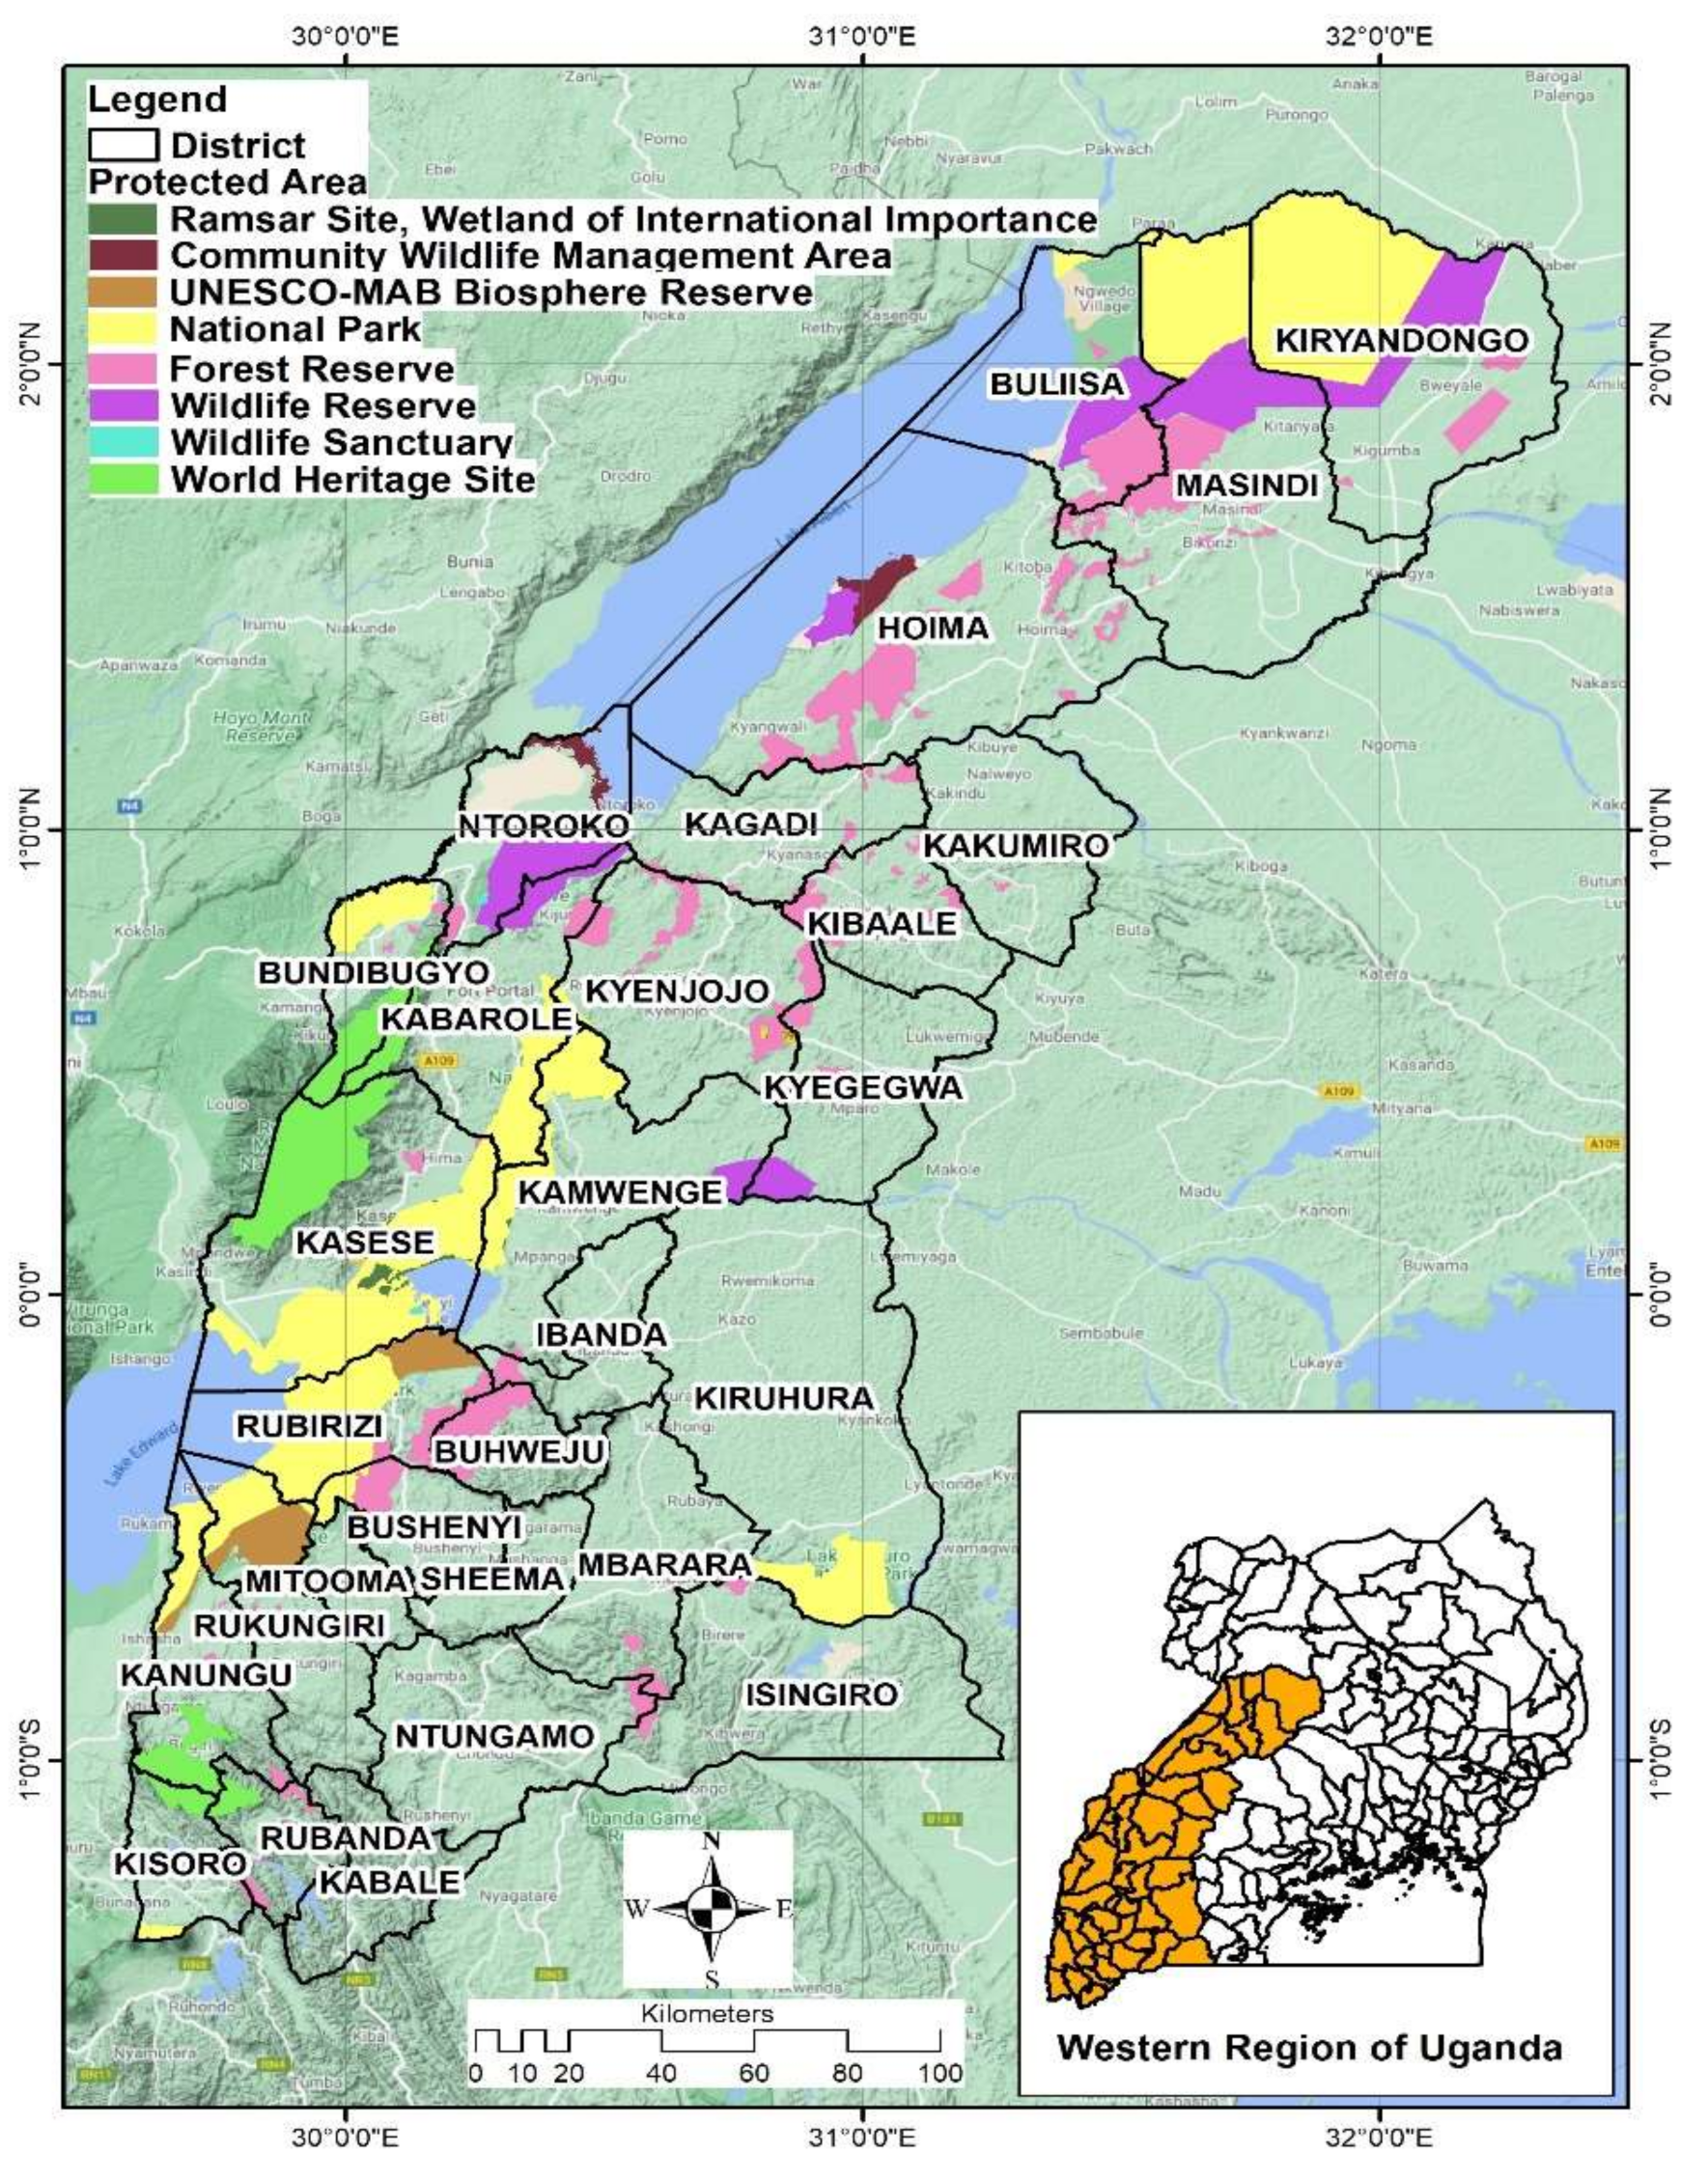
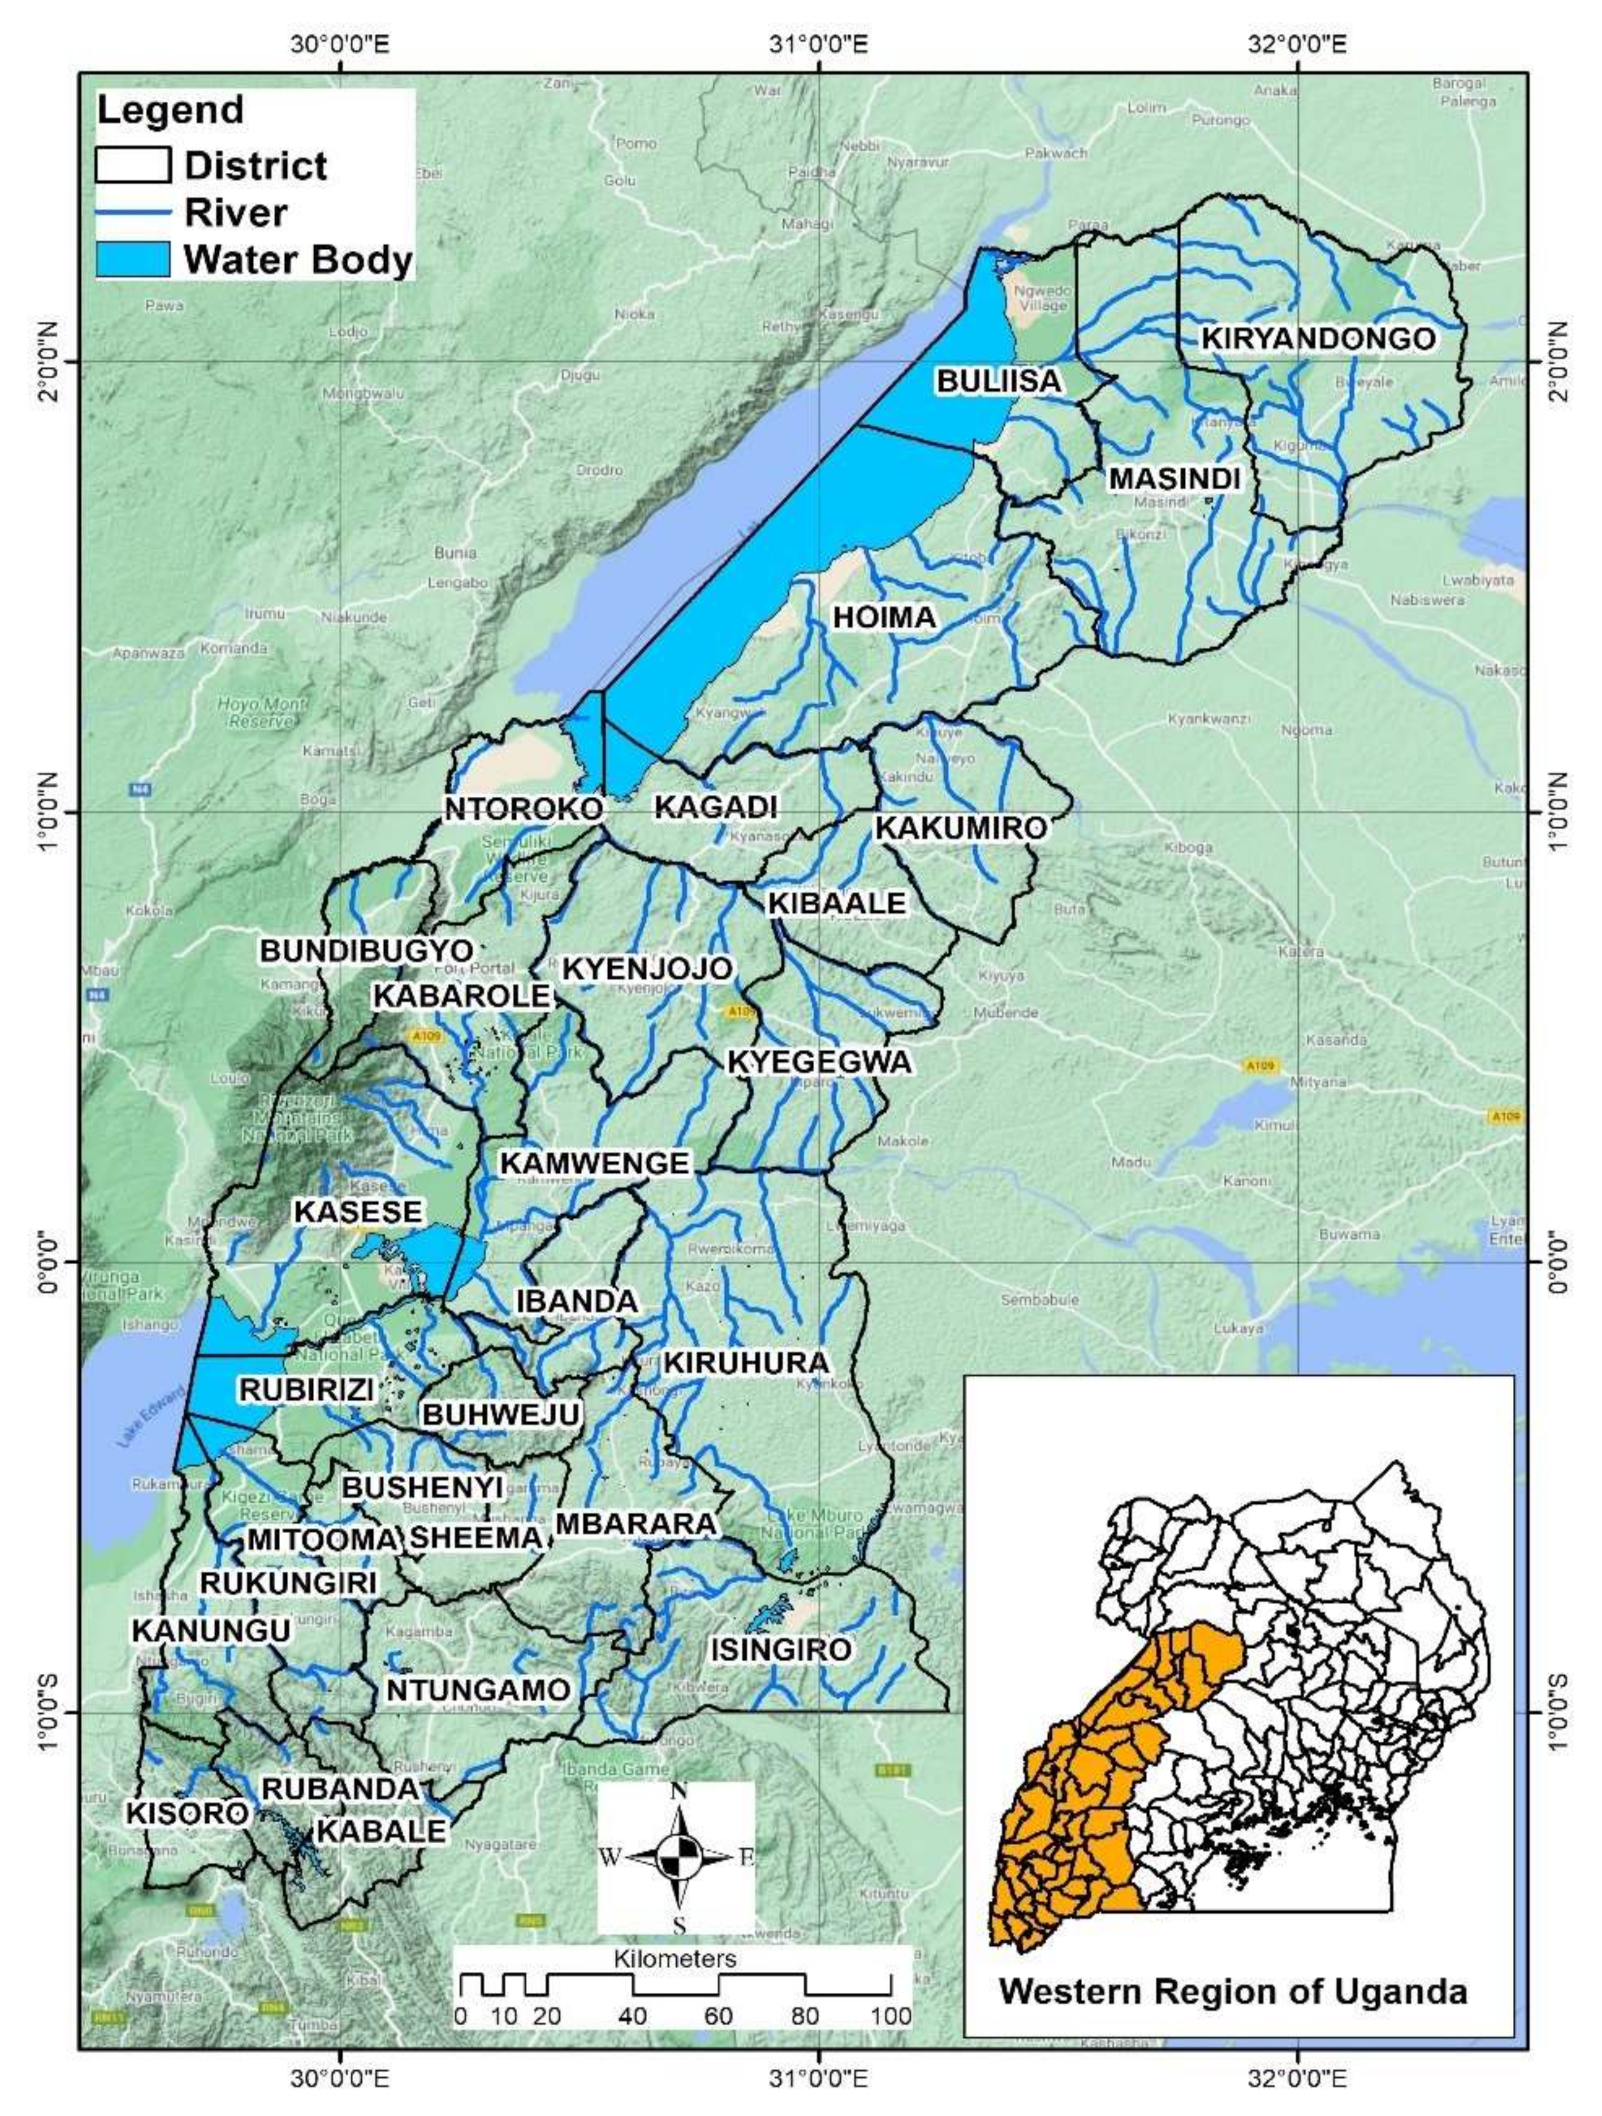
| Sensitive and protected areas | Shapefile | World Resources Institute Portal, Diva GIS [65,66] |
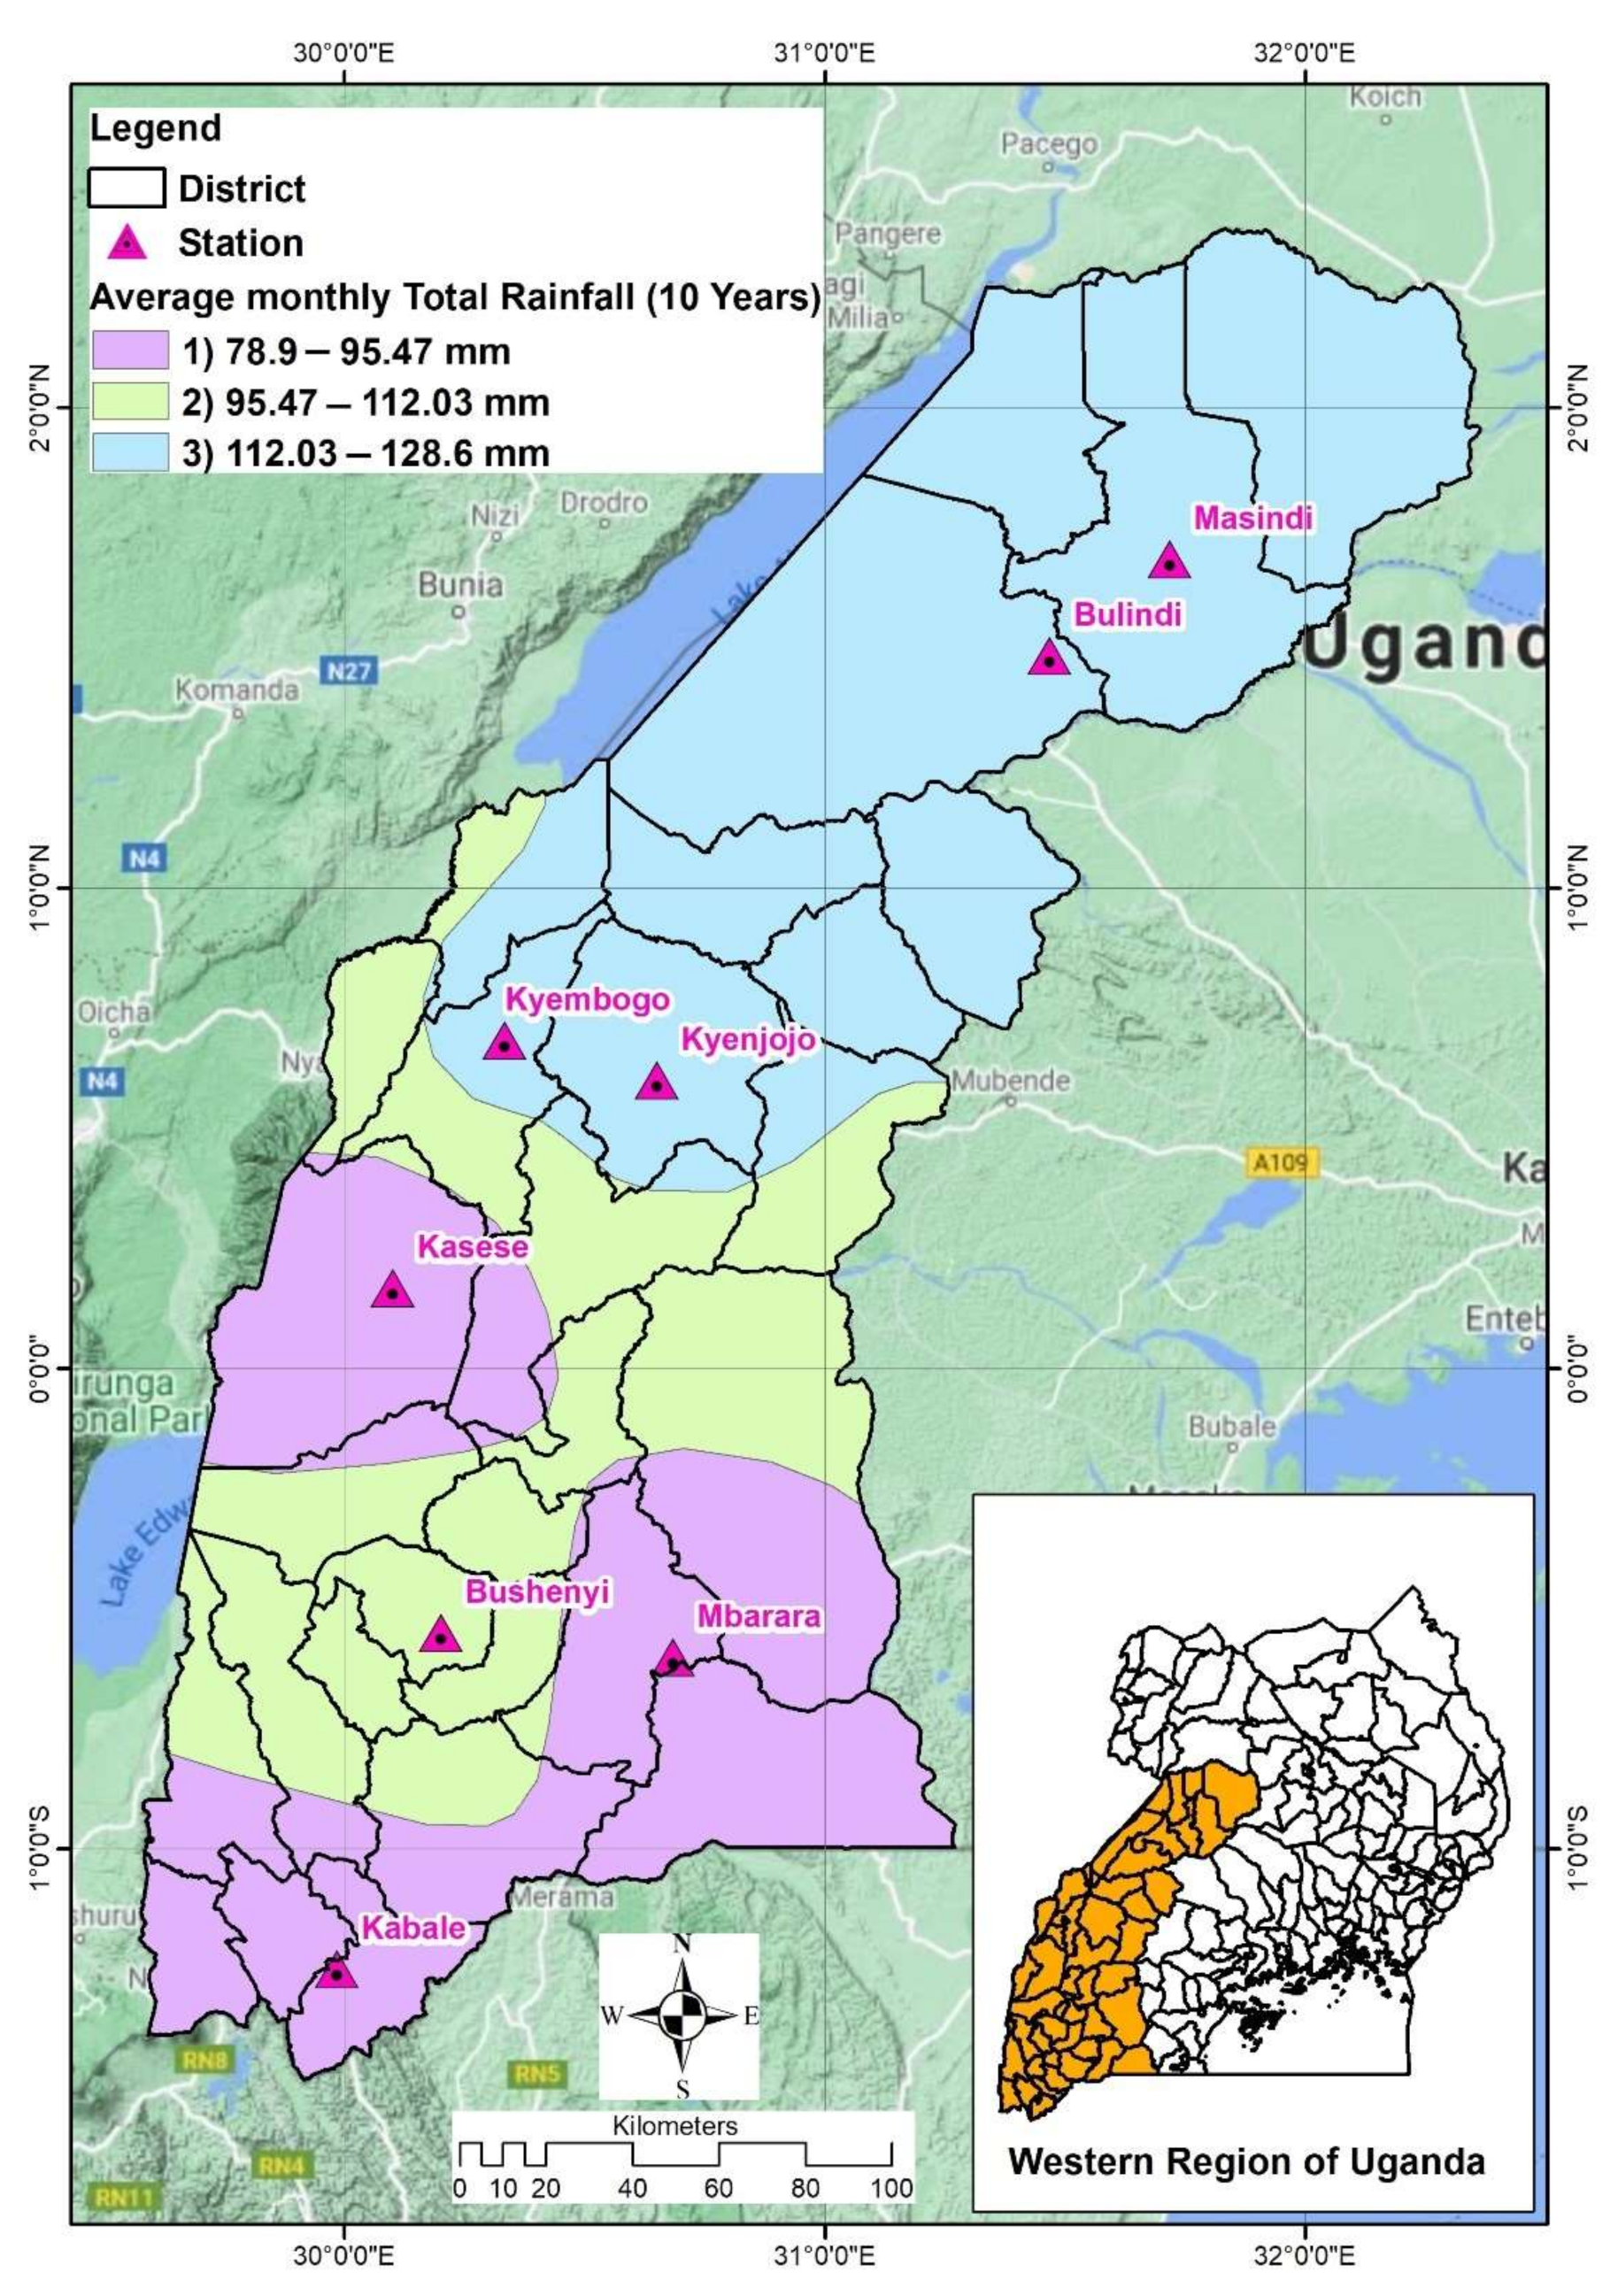
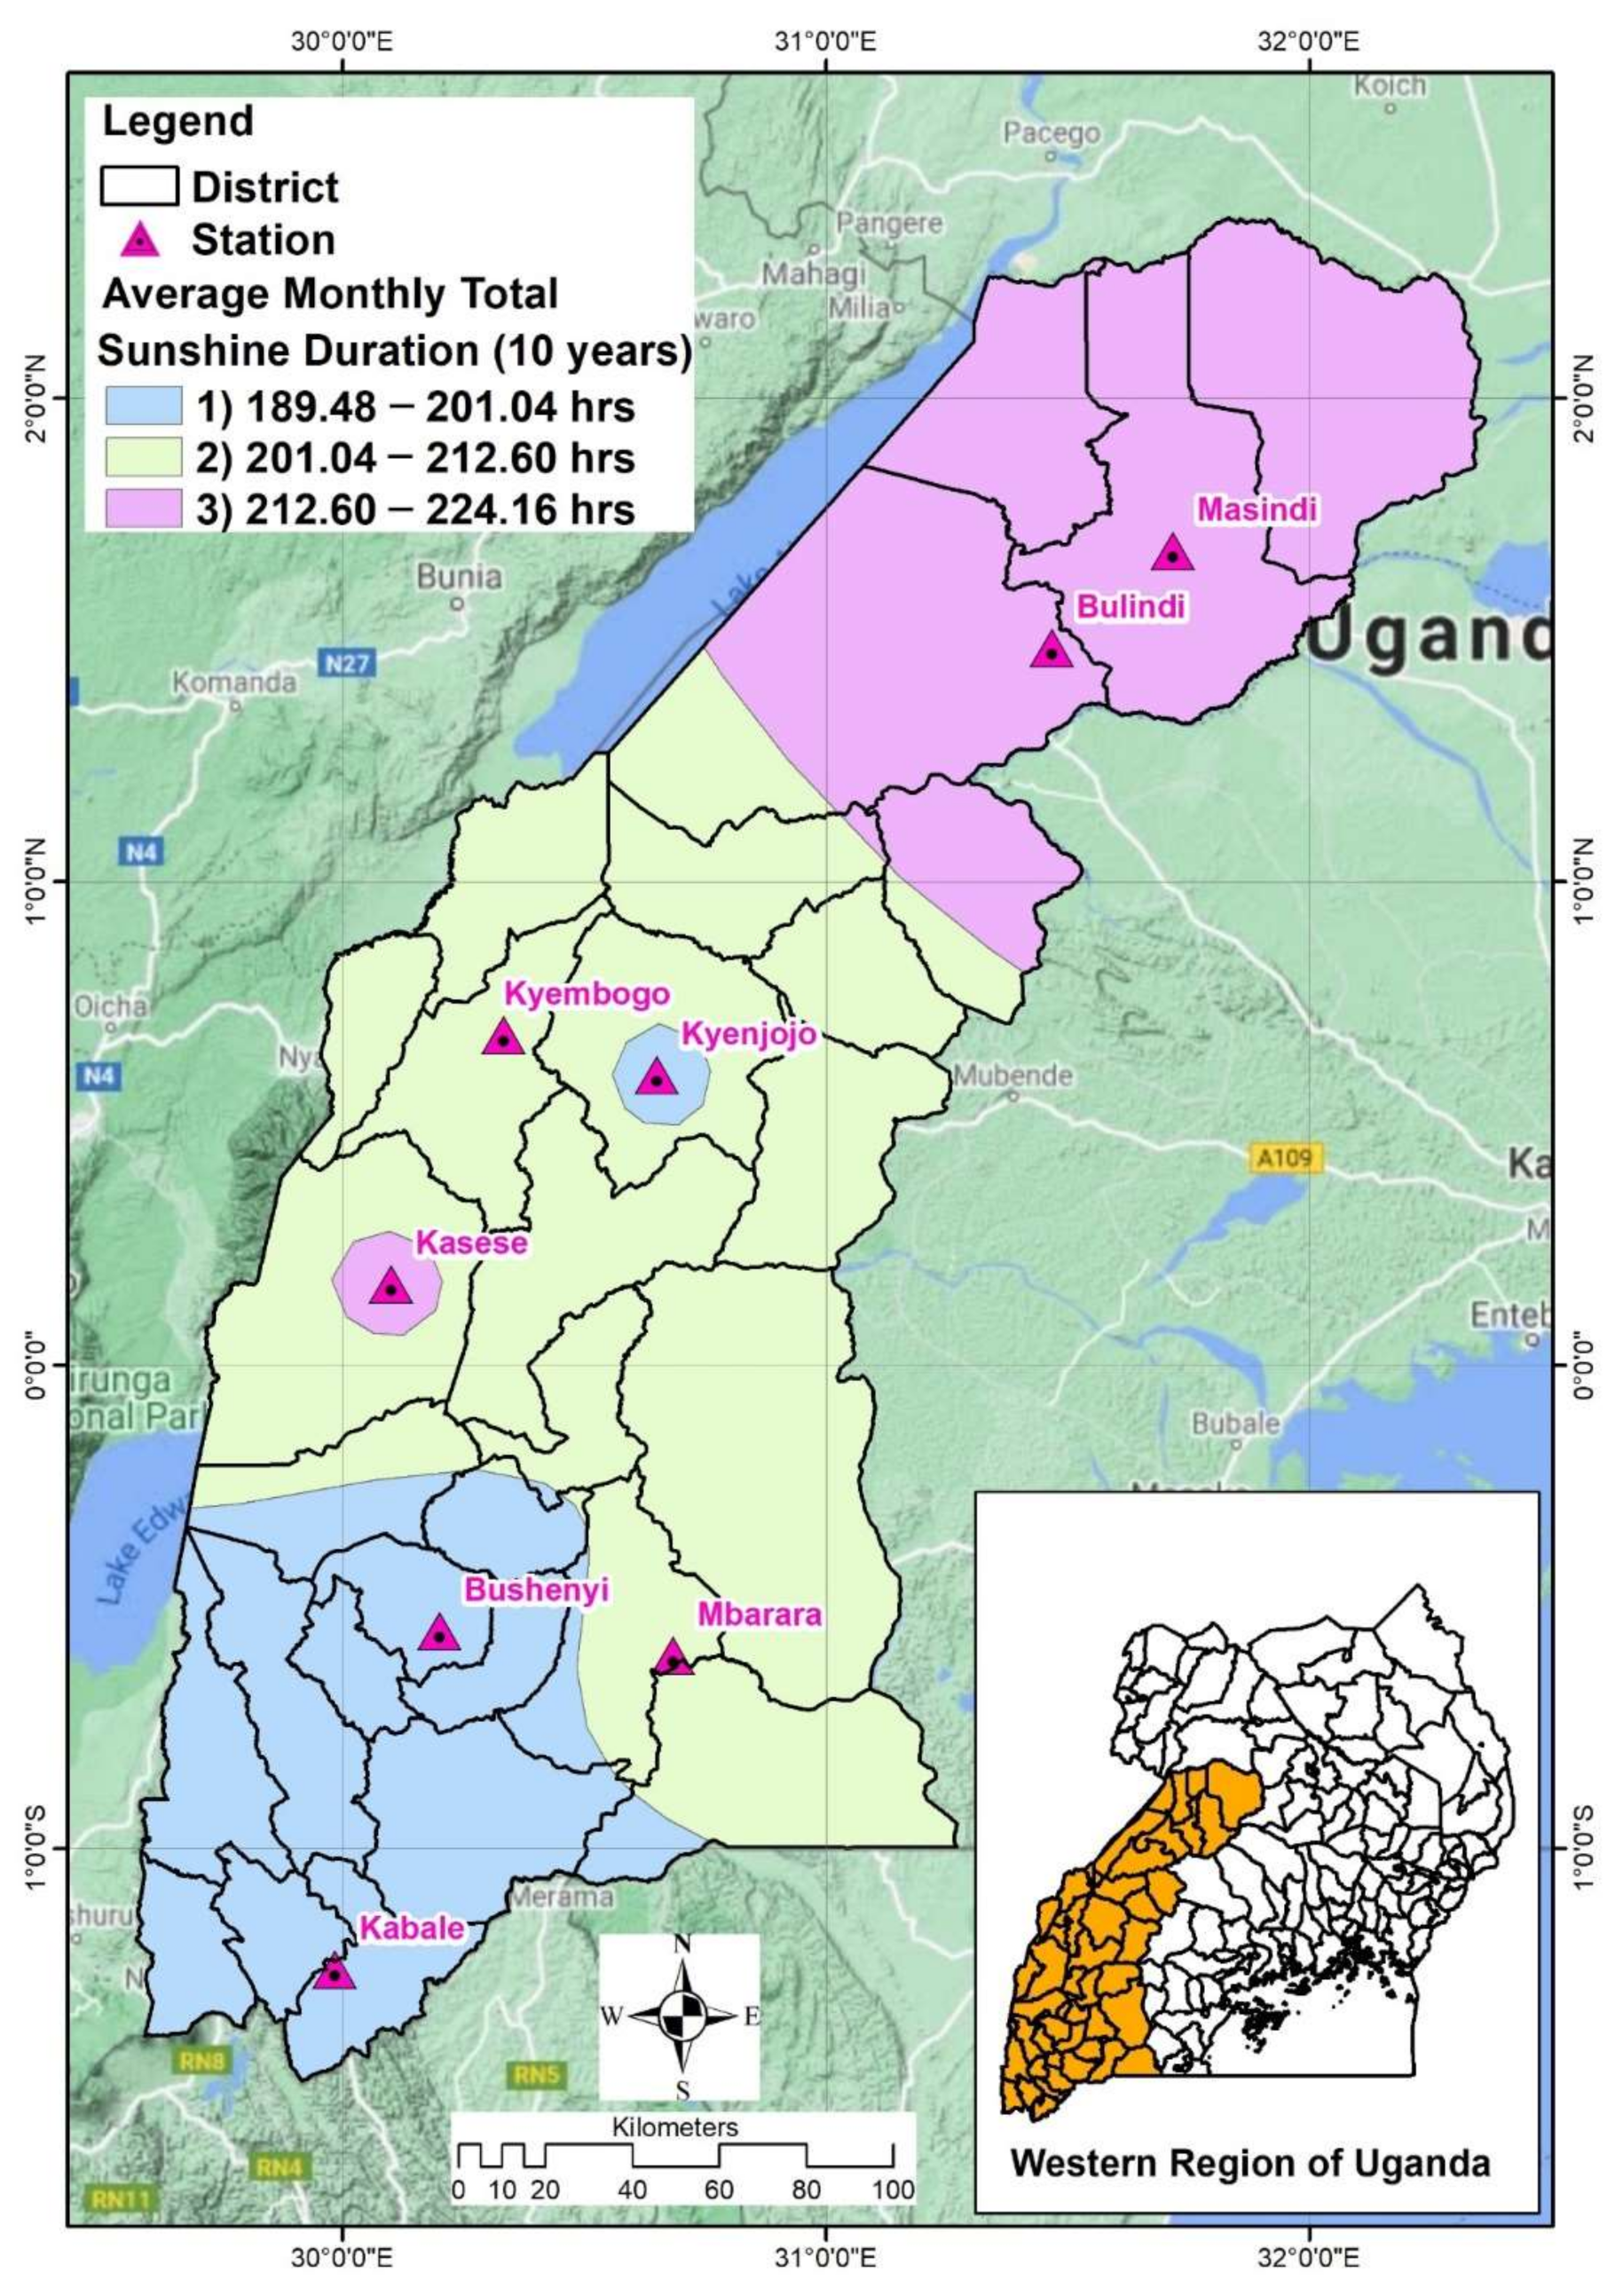
| Climate (rainfall and sunshine) | Excel converted to shapefile | Uganda National Meteorological Authority |
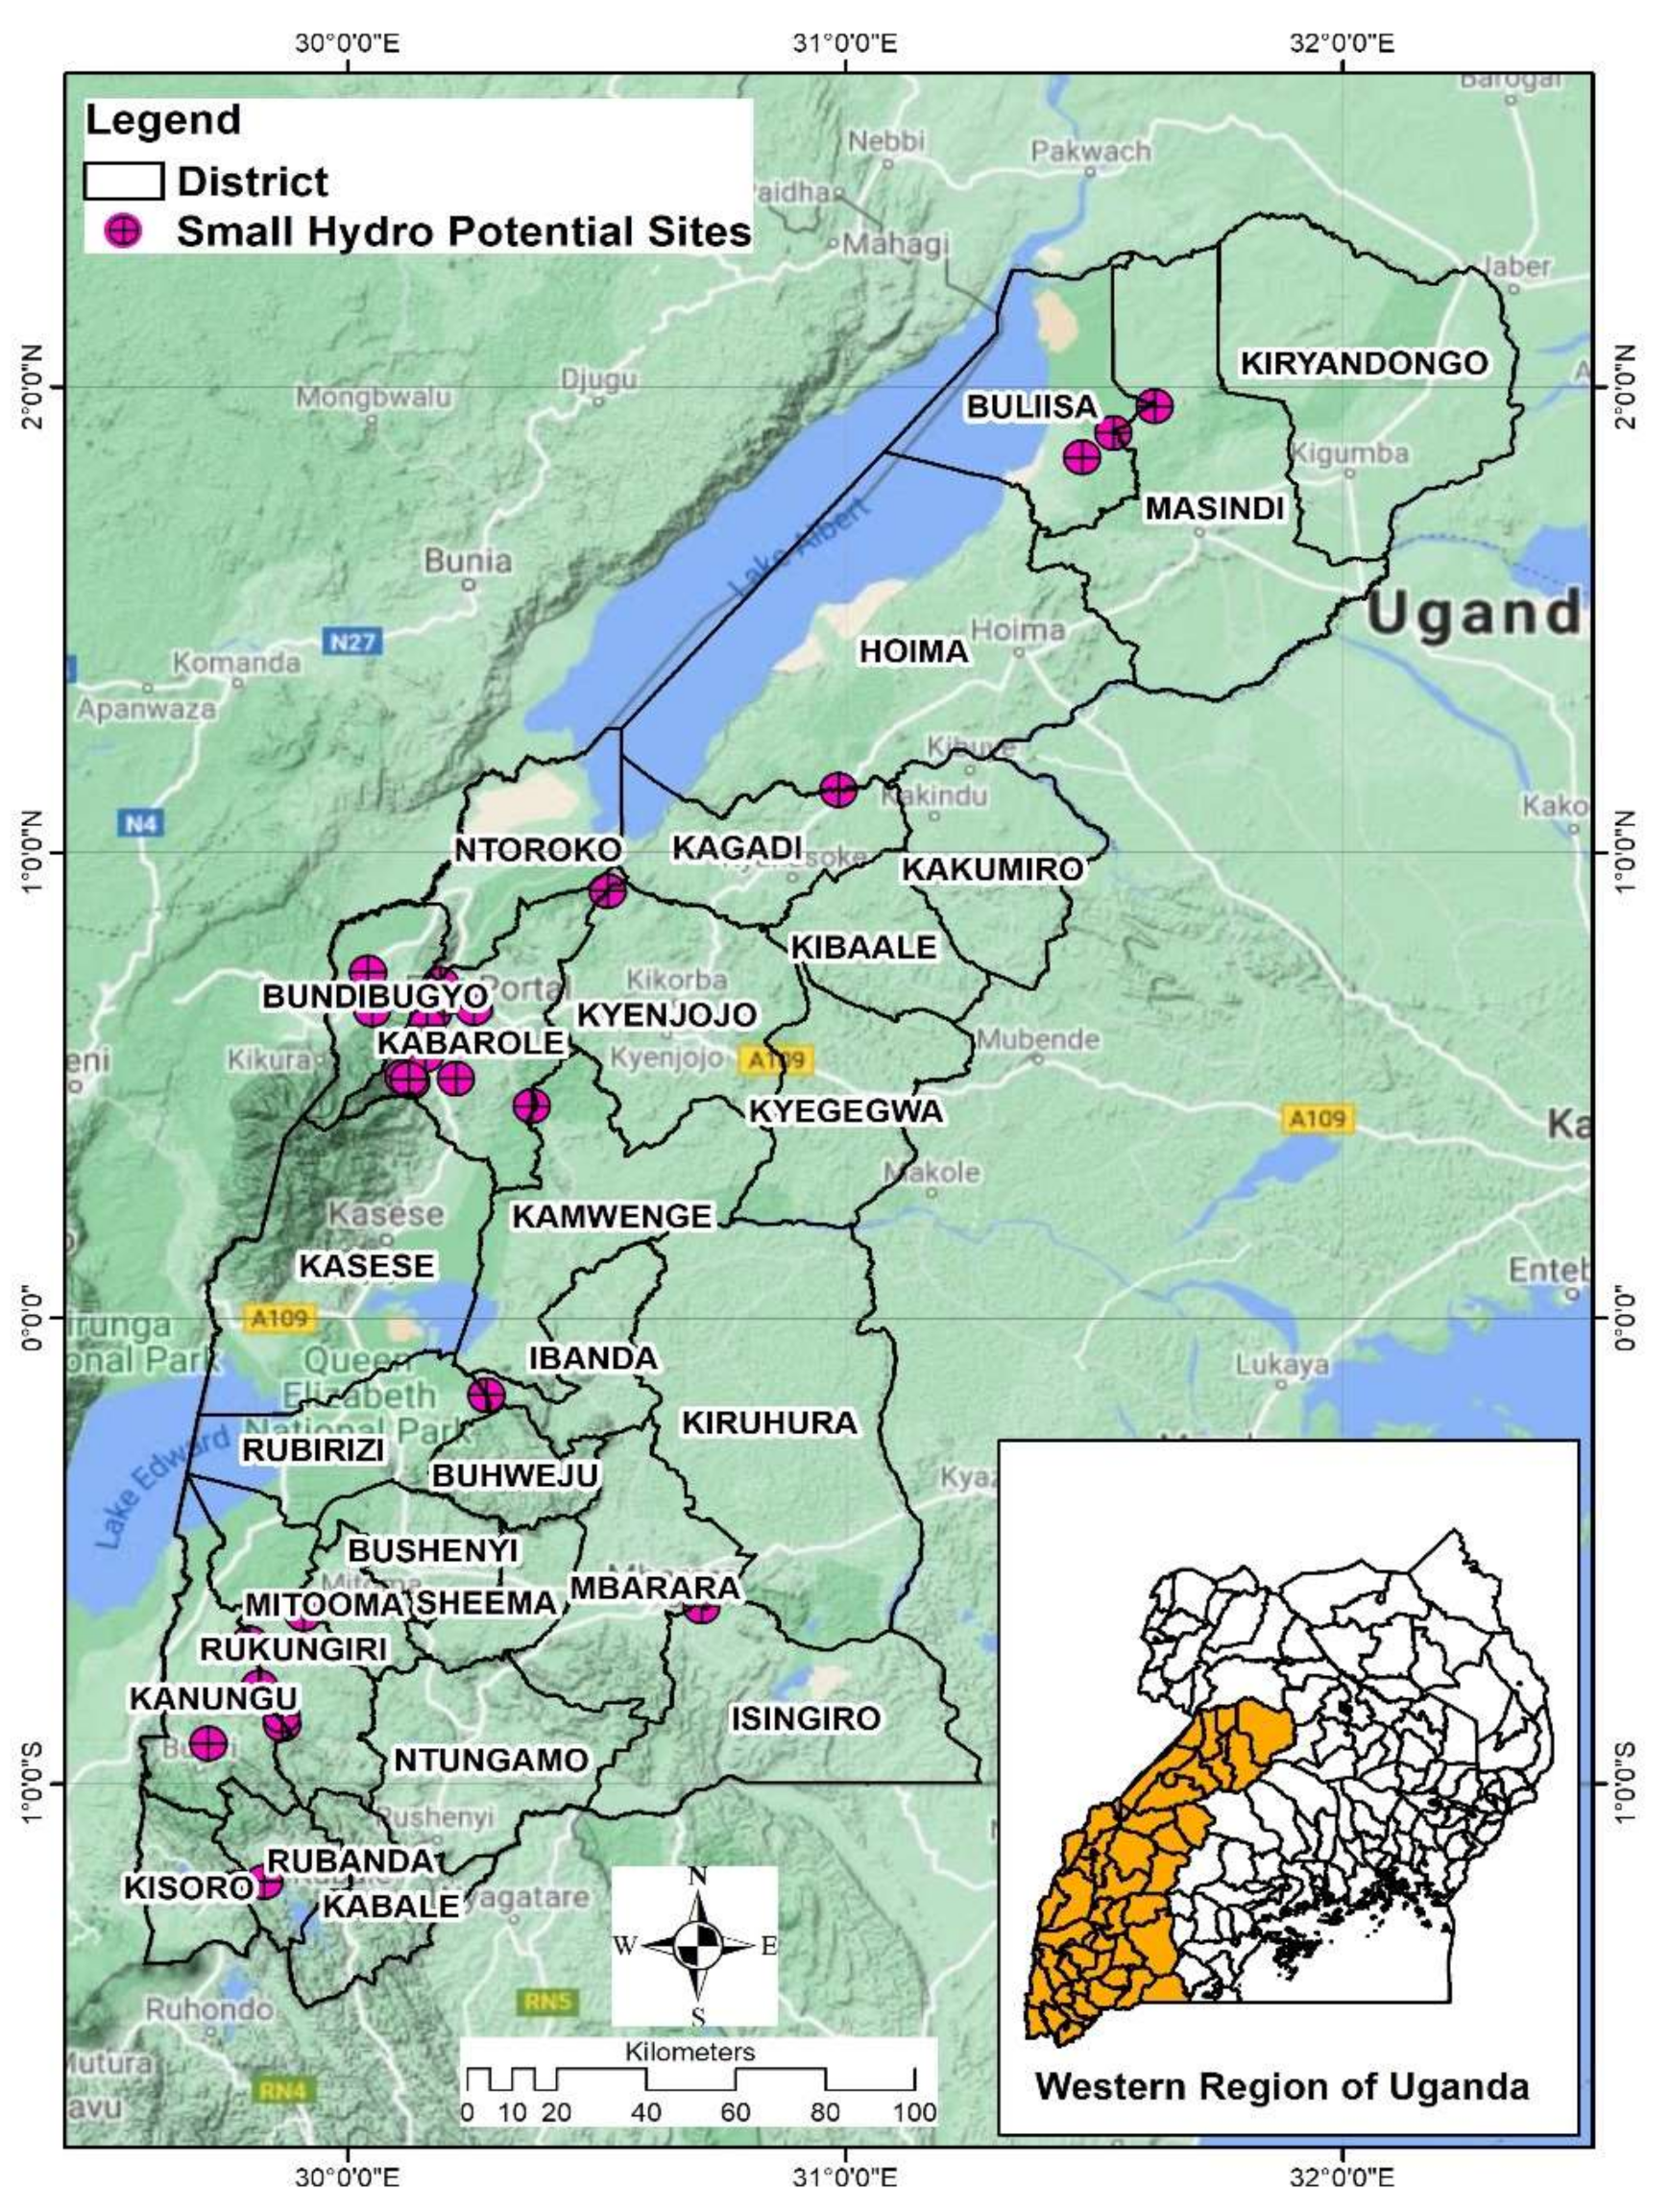
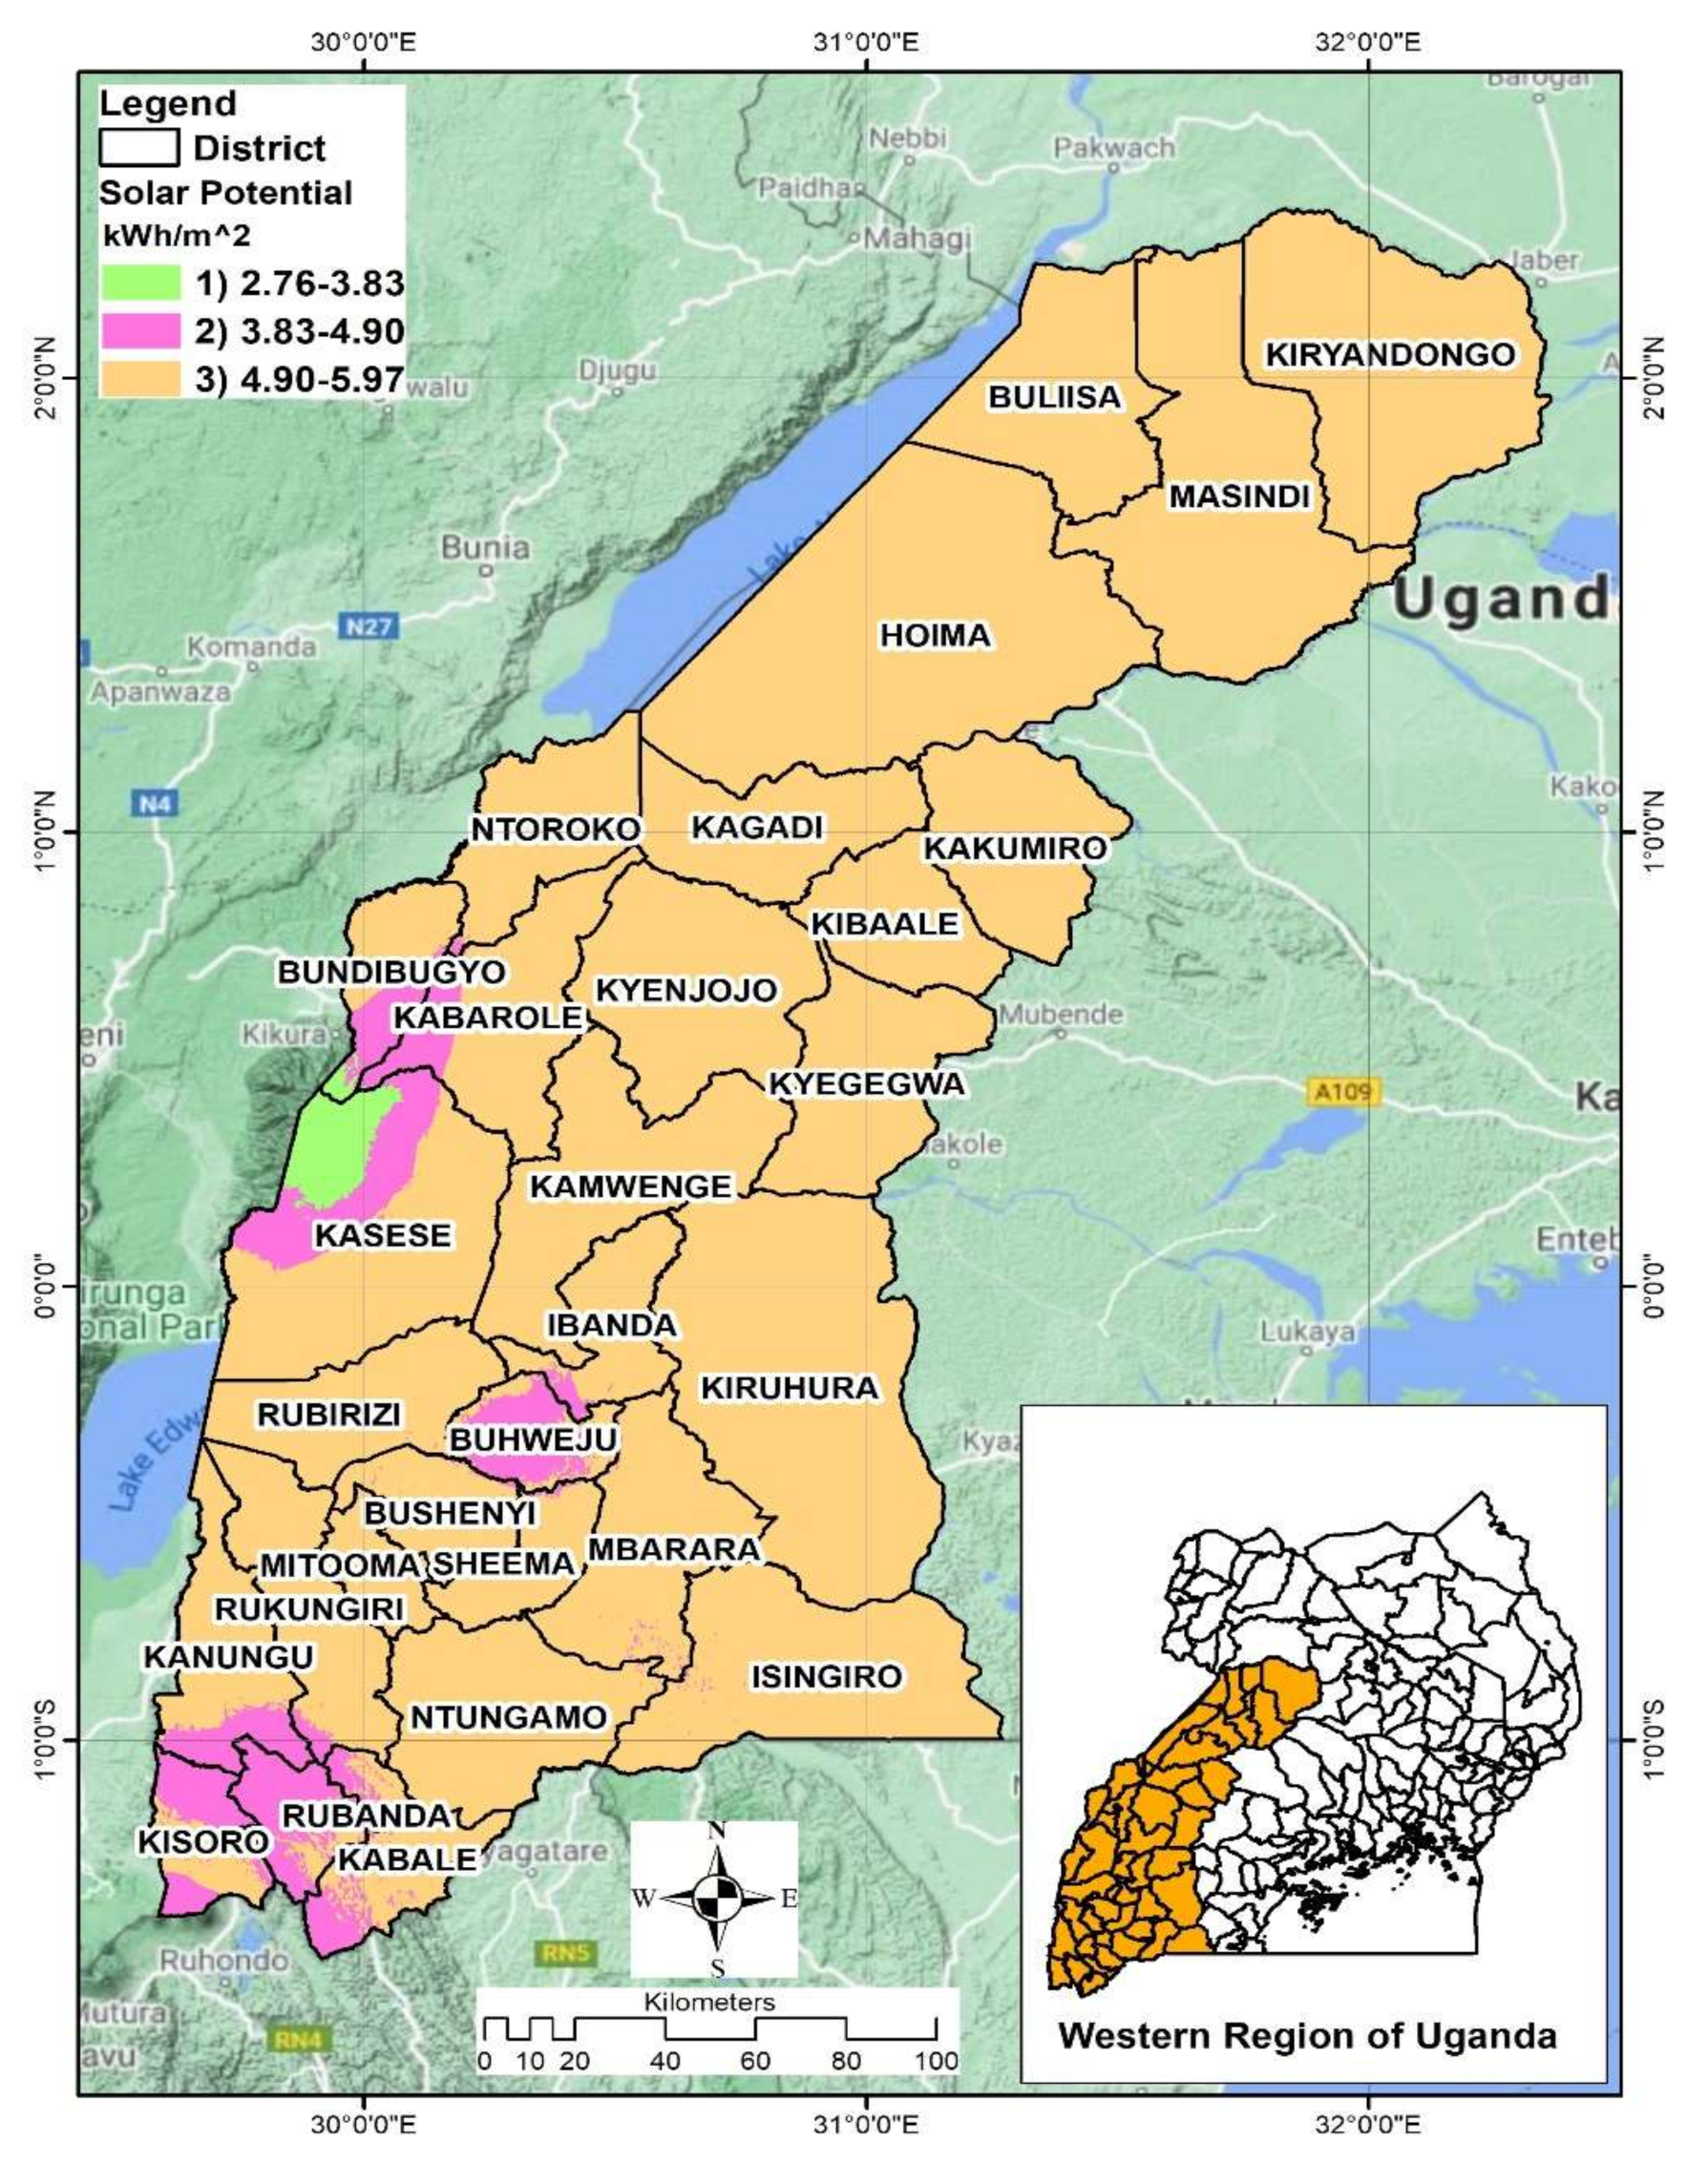
| Solar GHI Hydro potential | Raster Shapefile | Global Solar Atlas [67] Ministry of Energy and Mineral Development, MEMD. |
| Demand centers | Shapefile | Energy Sector GIS Working Group, Uganda [68] |
| Intensity of Importance | Judgement Description | Explanation |
|---|---|---|
| 1 | Equal importance | Equal contribution of two elements to the objective |
| 3 | Weak dominance | The judgement of one element slightly preferred over another |
| 5 | Strong dominance | The judgment of one element strongly dominant over another |
| 7 | Demonstrated dominance | The judgement of one element very strongly preferred over another |
| 9 | Absolute dominance | The judgement of one element extremely preferred over another and is the highest |
| 2,4,6,8 | Intermediate values | Representative of compromises between the preferences in weights 1, 3, 5, 7 and 9. |
| Intensity of Importance | Judgement Description | Fuzzy Triangular Numbers |
|---|---|---|
| 1 | Equal importance | (1,1,1) |
| 3 | Weak dominance | (2,3,4) |
| 5 | Strong dominance | (4,5,6) |
| 7 | Demonstrated dominance | (6,7,8) |
| 9 | Absolute dominance | (9,9,9) |
| 2 | Intermediate values | (1,2,3) |
| 4 | (3,4,5) | |
| 6 | (5,6,7) | |
| 8 | (7,8,9) |
Appendix B


Appendix C
| District | Low Suitability | Moderate Suitability | High Suitability | |
|---|---|---|---|---|
| Buhweju | Area (ha) | 1873.55 | 2797.26 | 282.18 |
| Megawatts | 1338.25 | 1998.05 | 201.56 | |
| Buliisa | Area (ha) | 915.93 | 16,664.43 | 13,946.25 |
| Megawatts | 654.24 | 11,903.16 | 9961.61 | |
| Bundibugyo | Area (ha) | 3117.92 | 9151.06 | 4907.81 |
| Megawatts | 2227.08 | 6536.47 | 3505.58 | |
| Bushenyi | Area (ha) | 2003.28 | 23,253.33 | 1000.87 |
| Megawatts | 1430.92 | 16,609.52 | 714.91 | |
| Hoima | Area (ha) | 15,640.76 | 110,920.51 | 52,561.05 |
| Megawatts | 11,171.97 | 79,228.94 | 37,543.61 | |
| Ibanda | Area (ha) | 2245.71 | 34,687.26 | 9568.37 |
| Megawatts | 1604.08 | 24,776.62 | 6834.55 | |
| Isingiro | Area (ha) | 6562.03 | 73,587.96 | 51,058.29 |
| Megawatts | 4687.16 | 52,562.83 | 36,470.21 | |
| Kabale | Area (ha) | 1026.69 | 4381.34 | 371.63 |
| Megawatts | 733.35 | 3129.53 | 265.45 | |
| Kabarole | Area (ha) | 4751.83 | 47,253.81 | 1429.35 |
| Megawatts | 3394.16 | 33,752.72 | 1020.97 | |
| Kagadi | Area (ha) | 6107.65 | 71,984.02 | 3134.24 |
| Megawatts | 4362.61 | 51,417.15 | 2238.74 | |
| Kakumiro | Area (ha) | 10,504.77 | 78,174.32 | 20,054.71 |
| Megawatts | 7503.41 | 55,838.80 | 14,324.79 | |
| Kamwengye | Area (ha) | 2988.46 | 76,884.49 | 18,227.76 |
| Megawatts | 2134.62 | 54,917.49 | 13,019.83 | |
| Kanungu | Area (ha) | 2266.52 | 29,999.31 | 1890.96 |
| Megawatts | 1618.95 | 21,428.08 | 1350.69 | |
| Kasese | Area (ha) | 2170.33 | 20,346.38 | 12,324.15 |
| Megawatts | 1550.24 | 14,533.13 | 8802.97 | |
| Kibaale | Area (ha) | 16,852.73 | 45,150.19 | 232.08 |
| Megawatts | 12,037.66 | 32,250.14 | 165.77 | |
| Kiruhura | Area (ha) | 20,465.71 | 152,024.11 | 75,025.33 |
| Megawatts | 14,618.37 | 108,588.65 | 53,589.52 | |
| Kiryandongo | Area (ha) | 6805.21 | 56,459.57 | 33,555.54 |
| Megawatts | 4860.86 | 40,328.26 | 23,968.24 | |
| Kisoro | Area (ha) | 220.19 | - | - |
| Megawatts | 157.28 | - | - | |
| Kyegegwa | Area (ha) | 15,397.38 | 82,490.76 | 11,791.89 |
| Megawatts | 10,998.13 | 58,921.97 | 8422.78 | |
| Kyenjojo | Area (ha) | 20,475.86 | 105,410.24 | 1158.63 |
| Megawatts | 14,625.61 | 75,293.03 | 827.59 | |
| Masindi | Area (ha) | 15,431.51 | 74,998.09 | 49,478.41 |
| Megawatts | 11,022.50 | 53,570.07 | 35,341.72 | |
| Mbarara | Area (ha) | 4568.28 | 52,833.17 | 26,722.70 |
| Megawatts | 3263.06 | 37,737.98 | 19,087.65 | |
| Mitooma | Area (ha) | 4707.96 | 22,013.87 | 649.99 |
| Megawatts | 3362.83 | 15,724.19 | 464.28 | |
| Ntoroko | Area (ha) | 762.95 | 16,166.07 | 15,316.09 |
| Megawatts | 544.96 | 11,547.19 | 10,940.06 | |
| Ntungamo | Area (ha) | 7959.78 | 79,131.91 | 10,997.03 |
| Megawatts | 5685.56 | 56,522.79 | 7855.02 | |
| Rubanda | Area (ha) | 78.84 | 0.48 | - |
| Megawatts | 56.31 | 0.34 | - | |
| Rubirizi | Area (ha) | 923.74 | 6654.63 | 1439.57 |
| Megawatts | 659.82 | 4753.31 | 1028.27 | |
| Rukungiri | Area (ha) | 2009.41 | 34,093.07 | 1421.17 |
| Megawatts | 1435.29 | 24,352.19 | 1015.12 | |
| Sheema | Area (ha) | 2819.13 | 22,400.34 | 3557.40 |
| Megawatts | 2013.67 | 16,000.24 | 2541.00 | |
References
- Dranka, G.G.; Ferreira, P. Towards a smart grid power system in Brazil: Challenges and opportunities. Energy Policy 2019, 136, 111033. [Google Scholar] [CrossRef]
- You, C.; Kim, J. Optimal design and global sensitivity analysis of a 100% renewable energy sources based smart energy network for electrified and hydrogen cities. Energy Convers. Manag. 2020, 223, 113252. [Google Scholar] [CrossRef]
- Abrishambaf, O.; Lezama, F.; Faria, P.; Vale, Z. Towards transactive energy systems: An analysis on current trends. Energy Strat. Rev. 2019, 26, 100418. [Google Scholar] [CrossRef]
- Worighi, I.; Maach, A.; Hafid, A.; Hegazy, O.; Van Mierlo, J. Integrating renewable energy in smart grid system: Architecture, virtualization and analysis. Sustain. Energy Grids Netw. 2019, 18, 100226. [Google Scholar] [CrossRef]
- Dkhili, N.; Eynard, J.; Thil, S.; Grieu, S. A survey of modelling and smart management tools for power grids with prolific distributed generation. Sustain. Energy Grids Netw. 2019, 21, 100284. [Google Scholar] [CrossRef]
- Butt, O.M.; Zulqarnain, M.; Butt, T.M. Recent advancement in smart grid technology: Future prospects in the electrical power network. Ain Shams Eng. J. 2020, 12, 687–695. [Google Scholar] [CrossRef]
- Alaqeel, T.A.; Suryanarayanan, S. A fuzzy Analytic Hierarchy Process algorithm to prioritize Smart Grid technologies for the Saudi electricity infrastructure. Sustain. Energy Grids Netw. 2018, 13, 122–133. [Google Scholar] [CrossRef]
- Jegen, M.; Philion, X.D. Smart grid development in Quebec: A review and policy approach. Renew. Sustain. Energy Rev. 2018, 82, 1922–1930. [Google Scholar] [CrossRef]
- Hiteva, R.; Watson, J. Governance of interactions between infrastructure sectors: The making of smart grids in the UK. Environ. Innov. Soc. Transit. 2019, 32, 140–152. [Google Scholar] [CrossRef]
- Klaimi, J.; Rahim-Amoud, R.; Merghem-Boulahia, L.; Jrad, A. A novel loss-based energy management approach for smart grids using multi-agent systems and intelligent storage systems. Sustain. Cities Soc. 2018, 39, 344–357. [Google Scholar] [CrossRef]
- Dileep, G. A survey on smart grid technologies and applications. Renew. Energy 2019, 146, 2589–2625. [Google Scholar] [CrossRef]
- Zhang, Y.; Chen, W.; Gao, W. A survey on the development status and challenges of smart grids in main driver countries. Renew. Sustain. Energy Rev. 2017, 79, 137–147. [Google Scholar] [CrossRef]
- Asaad, M.; Ahmad, F.; Alam, M.S.; Sarfraz, M. Smart grid and Indian experience: A review. Resour. Policy 2019, 74, 101499. [Google Scholar] [CrossRef]
- Hossain, M.; Madlool, N.; Rahim, N.; Selvaraj, J.; Pandey, A.K.; Khan, A.F. Role of smart grid in renewable energy: An overview. Renew. Sustain. Energy Rev. 2016, 60, 1168–1184. [Google Scholar] [CrossRef]
- Stephenson, J.; Ford, R.; Nair, N.; Watson, N.; Wood, A.; Miller, A. Smart grid research in New Zealand—A review from the GREEN Grid research programme. Renew. Sustain. Energy Rev. 2018, 82, 1636–1645. [Google Scholar] [CrossRef]
- Fuselli, D.; De Angelis, F.; Boaro, M.; Squartini, S.; Wei, Q.; Liu, D.; Piazza, F. Action dependent heuristic dynamic programming for home energy resource scheduling. Int. J. Electr. Power Energy Syst. 2013, 48, 148–160. [Google Scholar] [CrossRef]
- Jiang, L.; Low, S. Real-time demand response with uncertain renewable energy in smart grid. In Proceedings of the 49th Annual Allerton Conference on Communication, Control, and Computing (Allerton), Monticello, IL, USA, 28–30 September 2011; pp. 1334–1341. [Google Scholar] [CrossRef]
- Lurwan, S.M.; Idrees, M.O.; Ahmed, G.B.; Lay, U.S.; Mariun, N. GIS-based optimal site selection for installation of large-scale smart grid-connected photovoltaic (PV) power plants in Selangor, Malaysia. Am. J. Appl. Sci. 2017, 14, 174–183. [Google Scholar] [CrossRef][Green Version]
- Islam, M.A.; Hasanuzzaman; Rahim, N.A.; Nahar, A.; Hosenuzzaman, M. Global renewable energy-based electricity generation and smart grid system for energy security. Sci. World J. 2014, 2014, 197136. [Google Scholar] [CrossRef]
- Prasad, J.; Samikannu, R. Barriers to implementation of smart grids and virtual power plant in sub-saharan region—focus Botswana. Energy Rep. 2018, 4, 119–128. [Google Scholar] [CrossRef]
- Fashina, A.; Mundu, M.; Akiyode, O.; Abdullah, L.; Sanni, D.; Ounyesiga, L. The drivers and barriers of renewable energy applications and development in Uganda: A review. Clean Technol. 2018, 1, 9–39. [Google Scholar] [CrossRef]
- Bhamidipati, P.L.; Haselip, J.; Elmer Hansen, U. How do energy policies accelerate sustainable transitions? Unpacking the policy transfer process in the case of GETFiT Uganda. Energy Policy 2019, 132, 1320–1332. [Google Scholar] [CrossRef]
- Daki, H.; El Hannani, A.; Aqqal, A.; Haidine, A.; Dahbi, A. Big Data management in smart grid: Concepts, requirements and implementation. J. Big Data 2017, 4, 13. [Google Scholar] [CrossRef]
- Shao, M.; Han, Z.; Sun, J.; Xiao, C.; Zhang, S.; Zhao, Y. A review of multi-criteria decision making applications for renewable energy site selection. Renew. Energy 2020, 157, 377–403. [Google Scholar] [CrossRef]
- Al Garni, H.Z.; Awasthi, A. Solar PV power plant site selection using a GIS-AHP based approach with application in Saudi Arabia. Appl. Energy 2017, 206, 1225–1240. [Google Scholar] [CrossRef]
- Baseer, M.; Rehman, S.; Meyer, J.; Alam, M. GIS-based site suitability analysis for wind farm development in Saudi Arabia. Energy 2017, 141, 1166–1176. [Google Scholar] [CrossRef]
- Erbaş, M.; Kabak, M.; Özceylan, E.; Çetinkaya, C. Optimal siting of electric vehicle charging stations: A GIS-based fuzzy Multi-Criteria Decision Analysis. Energy 2018, 163, 1017–1031. [Google Scholar] [CrossRef]
- Kaya, I.; Çolak, M.; Terzi, F. A comprehensive review of fuzzy multi criteria decision making methodologies for energy policy making. Energy Strat. Rev. 2019, 24, 207–228. [Google Scholar] [CrossRef]
- Okoboi, G.; Mawejje, J. Electricity peak demand in Uganda: Insights and foresight. Energy Sustain. Soc. 2016, 6, 29. [Google Scholar] [CrossRef]
- Twaha, S.; Ramli, M.A.; Murphy, P.M.; Mukhtiar, M.U.; Nsamba, H.K. Renewable based distributed generation in Uganda: Resource potential and status of exploitation. Renew. Sustain. Energy Rev. 2016, 57, 786–798. [Google Scholar] [CrossRef]
- NEA. The National Environment Act 2019 Act 5. Uganda Gaz. No. 10 2019, CXI, 1–178. [Google Scholar]
- E. Electricity Regulation Authority. Installed Electricity Capacity in Uganda. 2020. Available online: https://www.era.or.ug/index.php/stats/generation-statistics/installed-capacity (accessed on 11 June 2020).
- Avellino, O.W.K.; Mwarania, F.; Wahab, A.-H.A.; Aime, K.T. Uganda solar energy utilization: Current status and future trends. Int. J. Sci. Res. Publ. (IJSRP) 2018, 8. [Google Scholar] [CrossRef]
- Mukisa, N.; Zamora, R.; Lie, T.T. Feasibility assessment of grid-tied rooftop solar photovoltaic systems for industrial sector application in Uganda. Sustain. Energy Technol. Assess. 2019, 32, 83–91. [Google Scholar] [CrossRef]
- Watson, J.J.; Hudson, M.D. Regional Scale wind farm and solar farm suitability assessment using GIS-assisted multi-criteria evaluation. Landsc. Urban Plan. 2015, 138, 20–31. [Google Scholar] [CrossRef]
- Waewsak, J.; Ali, S.; Natee, W.; Kongruang, C.; Chancham, C.; Gagnon, Y. Assessment of hybrid, firm renewable energy-based power plants: Application in the southernmost region of Thailand. Renew. Sustain. Energy Rev. 2020, 130, 109953. [Google Scholar] [CrossRef]
- Kereush, D.; Perovych, I. Determining criteria for optimal site selection for solar power plants. Geomat. Landmanagement Landsc. 2017, 4, 39–54. [Google Scholar] [CrossRef]
- Ali, S.; Taweekun, J.; Techato, K.; Waewsak, J.; Gyawali, S. GIS based site suitability assessment for wind and solar farms in Songkhla, Thailand. Renew. Energy 2018, 132, 1360–1372. [Google Scholar] [CrossRef]
- Asakereh, A.; Soleymani, M.; Sheikhdavoodi, M.J. A GIS-based Fuzzy-AHP method for the evaluation of solar farms locations: Case study in Khuzestan province, Iran. Sol. Energy 2017, 155, 342–353. [Google Scholar] [CrossRef]
- Colak, E.H.; Memisoglu, T.; Gercek, Y. Optimal site selection for solar photovoltaic (PV) power plants using GIS and AHP: A case study of Malatya Province, Turkey. Renew. Energy 2019, 149, 565–576. [Google Scholar] [CrossRef]
- Tian, Y.; Zhang, F.; Yuan, Z.; Che, Z.; Zafetti, N. Assessment power generation potential of small hydropower plants using GIS software. Energy Rep. 2020, 6, 1393–1404. [Google Scholar] [CrossRef]
- Yousefi, H.; Hafeznia, H.; Yousefi-Sahzabi, A. Spatial site selection for solar power plants using a GIS-based boolean-fuzzy logic model: A case study of Markazi Province, Iran. Energies 2018, 11, 1648. [Google Scholar] [CrossRef]
- Sabo, M.L.; Mariun, N.; Hizam, H.; Mohd Radzi, M.A.; Zakaria, A. Spatial matching of large-scale grid-connected photovoltaic power generation with utility demand in Peninsular Malaysia. Appl. Energy 2017, 191, 663–688. [Google Scholar] [CrossRef]
- Giamalaki, M.; Tsoutsos, T. Sustainable siting of solar power installations in Mediterranean using a GIS/AHP approach. Renew. Energy 2019, 141, 64–75. [Google Scholar] [CrossRef]
- Nzotcha, U.; Kenfack, J.; Blanche Manjia, M. Integrated multi-criteria decision making methodology for pumped hydro-energy storage plant site selection from a sustainable development perspective with an application. Renew. Sustain. Energy Rev. 2019, 112, 930–947. [Google Scholar] [CrossRef]
- Environmental management in Uganda: A reflection on the role of NEMA and its effectiveness in implementing Environment Impact Assessment (EIA) of the Greater Kampala Metropolitan Area (GKMA). J. Adv. Res. Soc. Sci. Humanit. 2020, 5, 1–13. [CrossRef]
- Sabzehgar, R.; Amirhosseini, D.Z.; Rasouli, M. Solar power forecast for a residential smart microgrid based on numerical weather predictions using artificial intelligence methods. J. Build. Eng. 2020, 32, 101629. [Google Scholar] [CrossRef]
- Saaty, T.L.; Vargas, L.G. How to make a decision. Eur. J. Oper. Res. 1990, 48, 9–26. [Google Scholar] [CrossRef]
- Cajot, S.; Mirakyan, A.; Koch, A.; Maréchal, F. Multicriteria decisions in urban energy system planning: A review. Front. Energy Res. 2017, 5, 10. [Google Scholar] [CrossRef]
- Janjic, A.; Savic, S.; Janackovic, G.; Stankovic, M.; Velimirovic, L. Multi-criteria assessment of the smart grid efficiency using the fuzzy analytic hierarchy process. Facta Univ. -Ser. Electron. Energetics 2016, 29, 631–646. [Google Scholar] [CrossRef]
- Asakereh, A.; Omid, M.; Alimardani, R.; Sarmadian, F. Developing a GIS-based Fuzzy AHP Model for Selecting Solar Energy Sites in Shodirwan Region in Iran. Int. J. Adv. Sci. Technol. 2014, 68, 37–48. [Google Scholar] [CrossRef]
- Nyimbili, P.H.; Erden, T. GIS-based fuzzy multi-criteria approach for optimal site selection of fire stations in Istanbul, Turkey. Socio-Econ. Plan. Sci. 2020, 71, 100860. [Google Scholar] [CrossRef]
- Donegan, H.; Dodd, F. A note on Saaty’s random indexes. Math. Comput. Model. 1991, 15, 135–137. [Google Scholar] [CrossRef]
- Chaudhary, P.; Chhetri, S.K.; Joshi, K.M.; Shrestha, B.M.; Kayastha, P. Application of an Analytic Hierarchy Process (AHP) in the GIS interface for suitable fire site selection: A case study from Kathmandu Metropolitan City, Nepal. Socio-Econ. Plan. Sci. 2016, 53, 60–71. [Google Scholar] [CrossRef]
- Ayhan, M.B. A Fuzzy Ahp approach for supplier selection problem: A case study in a Gear motor company. Int. J. Manag. Value Supply Chain. 2013, 4, 11–23. [Google Scholar] [CrossRef]
- Hamal, S.; Senvar, O.; Vayvay, O. Selection of optimal renewable energy investment project via fuzzy ANP. Pressacademia 2018, 5, 224–233. [Google Scholar] [CrossRef]
- Buckley, J.J. Fuzzy Hierarchical Analysis. Fuzzy Sets Syst. 1985, 17, 33–247. [Google Scholar] [CrossRef]
- GET FiT Uganda Annual Report 2019: AIMS Mathematics; KFW Development Bank: Kampala, Uganda; MultiConsult Norge AS: Oslo, Norway, 2019; Volume 5, pp. i–v. [CrossRef]
- Yuan, W.; Liu, Z.; Su, C.; Wang, X. Photovoltaic capacity optimization of small and medium-sized hydro-photovoltaic hybrid energy systems considering multiple uncertainties. J. Clean. Prod. 2020, 276, 124170. [Google Scholar] [CrossRef]
- Álvarez, Ó.; Ghanbari, A.; Markendahl, J. A Comparative Study of Smart Grid Development in Developed and Developing Countries. In Proceedings of the 7th CMI Conference 2014: Mobile Communications in Developing Countries, Copenhagen, Denmark, 17–18 November 2014; pp. 17–18. [Google Scholar]
- Earth Explorer. 2020. Available online: https://earthexplorer.usgs.gov/ (accessed on 28 July 2020).
- Energy Data. 2020. Available online: https://energydata.info/ (accessed on 27 July 2020).
- WFPGeoNode. 2020. Available online: https://geonode.wfp.org/ (accessed on 1 August 2020).
- Eastern and Southern Africa. 2020. Available online: https://servirglobal.net/Regions/ESAfrica (accessed on 27 November 2020).
- WRI. Waterbodies in Uganda–Datasets–Data|World Resources Institute. 2020. Available online: https://datasets.wri.org/dataset/waterbodies-in-uganda (accessed on 12 August 2020).
- DIVA-GIS. Spatial Data. 2020. Available online: https://www.diva-gis.org/ (accessed on 1 August 2020).
- Global Solar Atlas. Solar Resource by Country. 2020. Available online: https://globalsolaratlas.info/global-pv-potential-study (accessed on 4 August 2020).
- Energy Sector GIS Working Group. 2020. Available online: http://www.energy-gis.ug/gis-data (accessed on 4 August 2020).


| Parameter | Ranges | Ranking |
|---|---|---|
| Distance from transmission lines (meters) | 500–2000 | 3 |
| 2000–5000 | 2 | |
| 5000–10,000 | 1 | |
| 500<, >10,000 | 0 | |
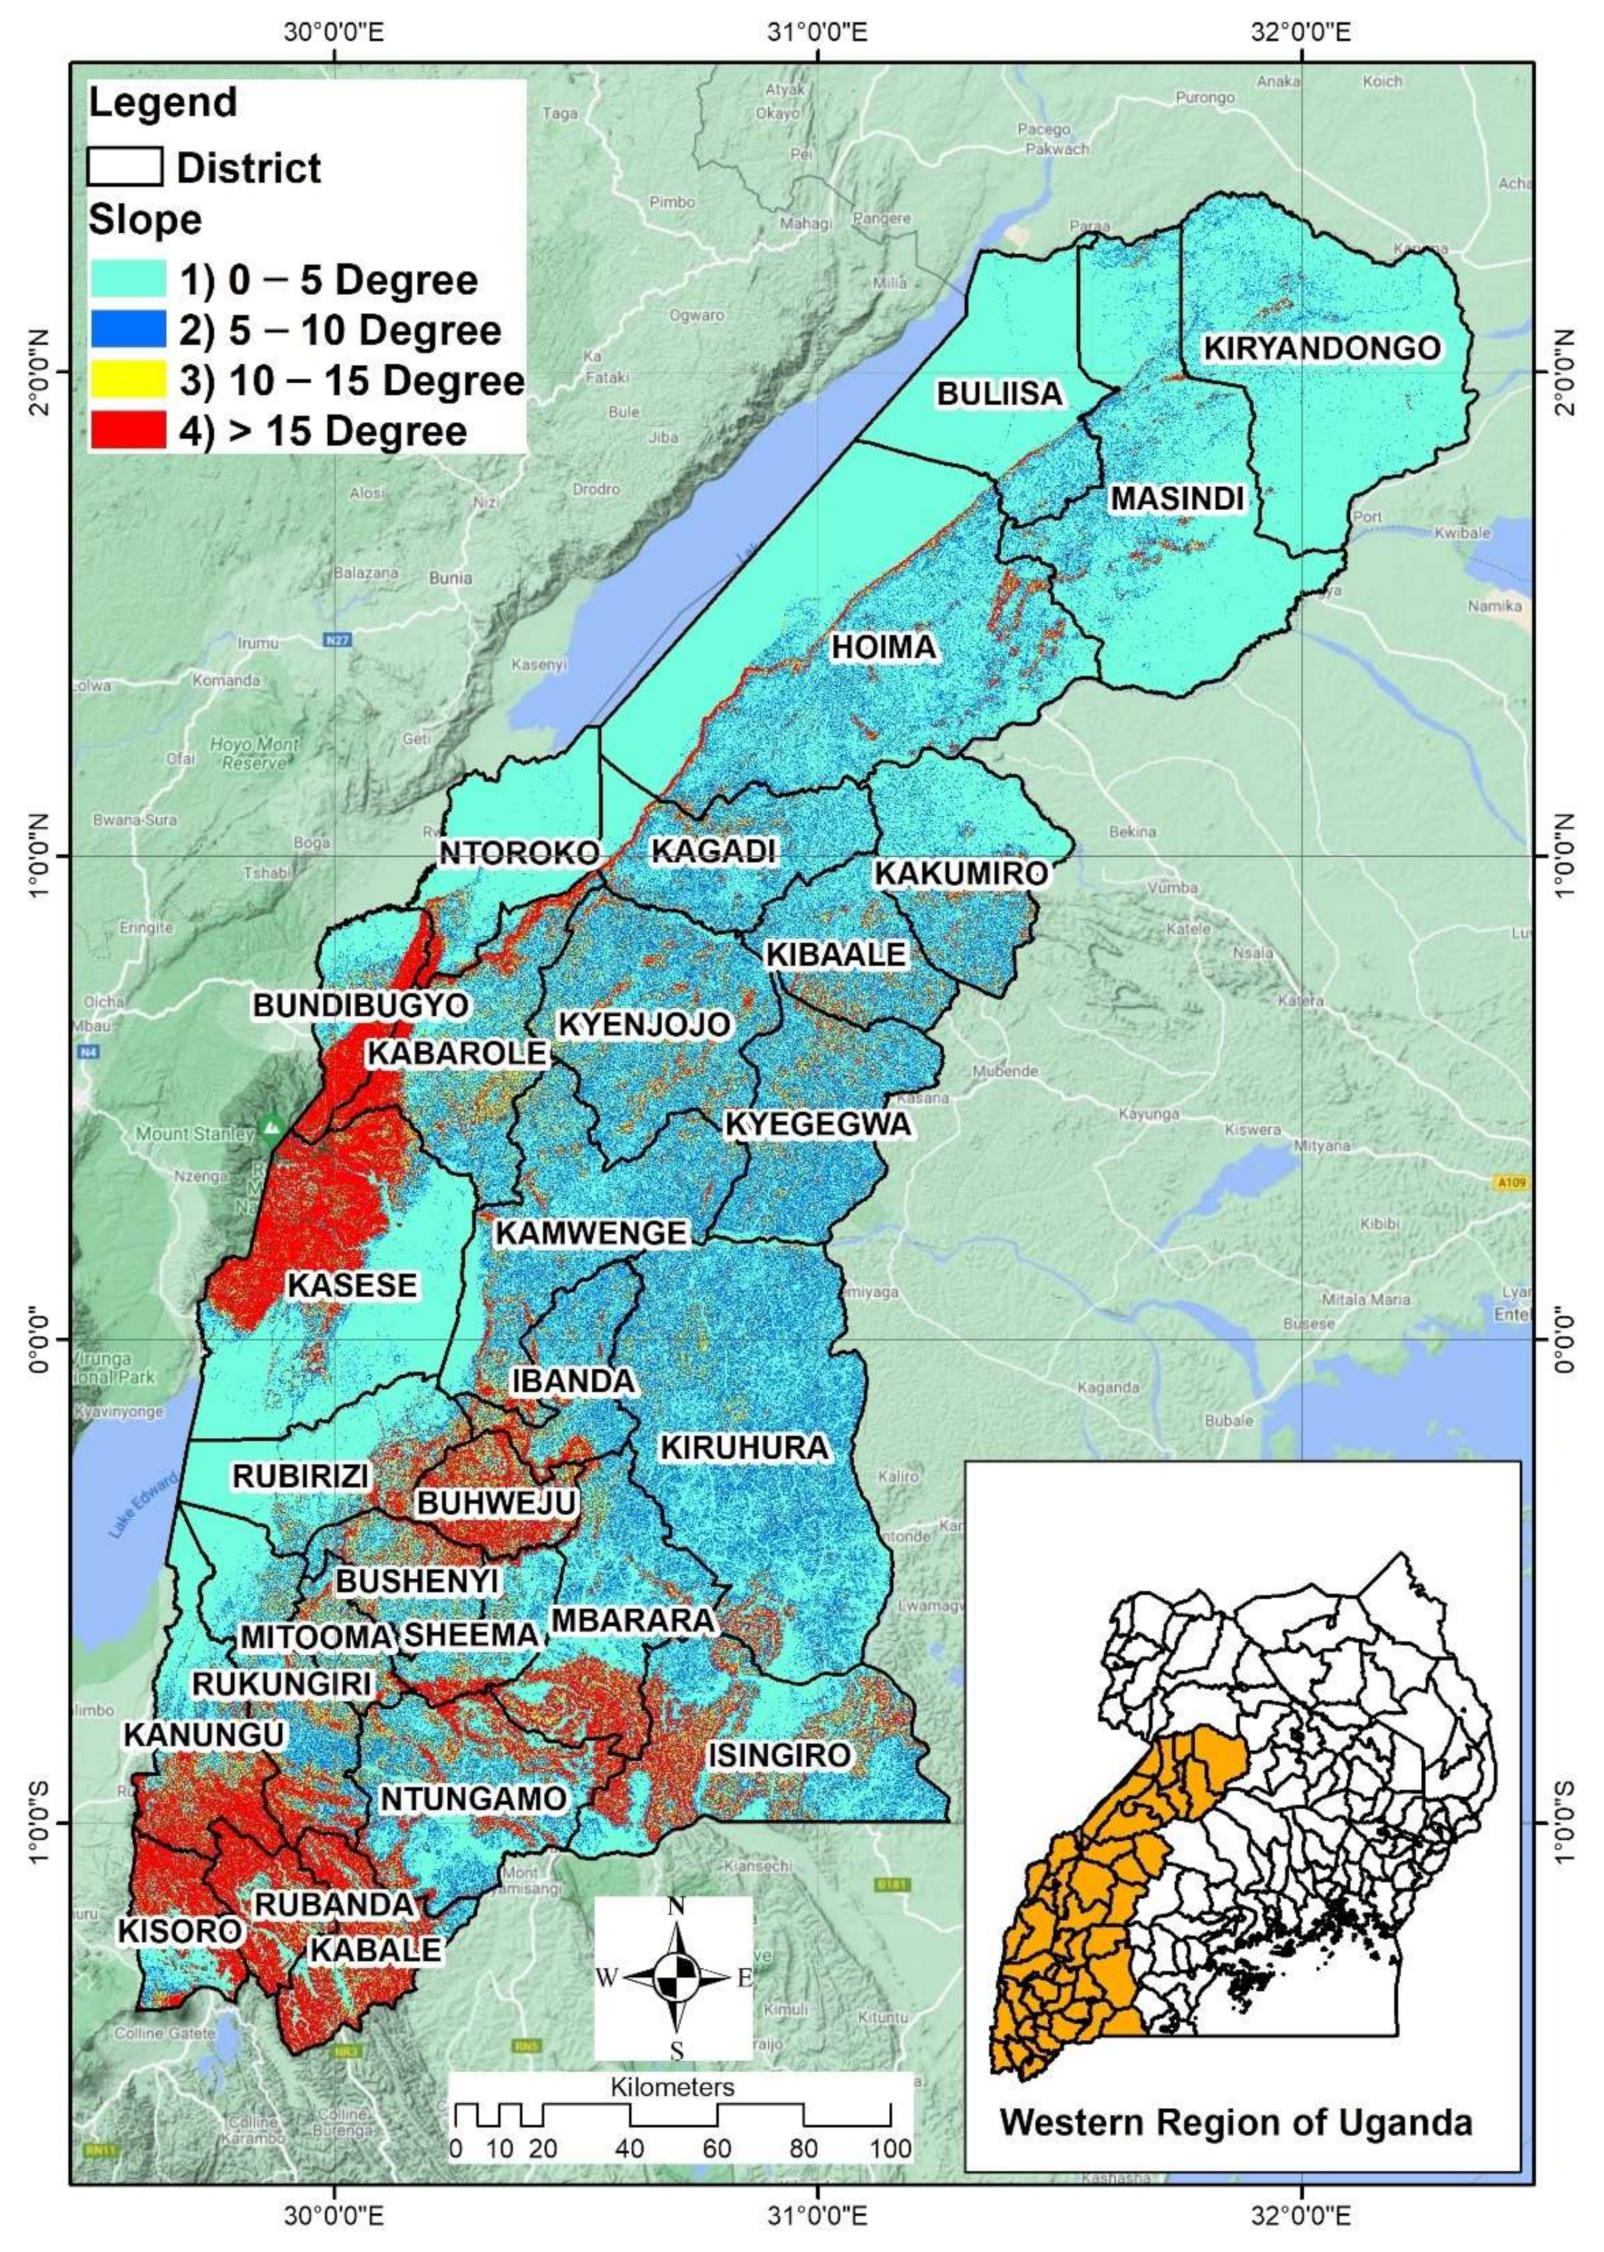
| Slope (degrees) | 0–5 | 3 |
| 5–10 | 2 | |
| 10–15 | 1 | |
| >15 | 0 | |
| Elevation (meters) | 574–947 | 3 |
| 949–1325 | 2 | |
| 1325–1700 | 1 | |
| >1700 | 0 | |
| Distance to roads (meters) | 500–2000 | 3 |
| 2000–3500 | 2 | |
| 3500–5000 | 1 | |
| 500<, >5000 | 0 | |
| Land use | Bare areas, grasslands | 3 |
| Shrub cover areas | 2 | |
| Croplands, lichen, mosses, tree cover areas | 1 | |
| Built-up areas, aquatic vegetation, regularly flooded | 0 | |
| Sensitive and protected areas | Excluded | Excluded |
| Distance to demand center (meters) | 500–1500 | 3 |
| 1500–2500 | 2 | |
| 2500–3500 | 1 | |
| 500<, >3500 | 0 | |
| Solar-GHI (kWh/m2) | 4.90–5.97 | 3 |
| 3.83–4.90 | 2 | |
| 2.76–3.83 | 1 | |
| Small hydro (MW) | Available data used | Available data used |
| Climate | Available data used | Available data used |
| N | 1 | 2 | 3 | 4 | 5 | 6 | 7 | 8 | 9 | 10 | 11 | 12 | 13 | 14 | 15 |
|---|---|---|---|---|---|---|---|---|---|---|---|---|---|---|---|
| RI | 0 | 0 | 0.58 | 0.90 | 1.12 | 1.24 | 1.32 | 1.41 | 1.45 | 1.49 | 1.51 | 1.53 | 1.56 | 1.57 | 1.59 |
| Criteria | AHP | Fuzzy AHP | CR | Difference (±) |
|---|---|---|---|---|
| Environmental | 0.308290 | 0.310541 | 0.0458 | 0.002252 |
| Economic | 0.470283 | 0.469979 | 0.000305 | |
| Technical | 0.221427 | 0.219480 | 0.001947 |
| Sub-Criteria | AHP | Fuzzy AHP | CR | Difference (±) |
|---|---|---|---|---|
| Distance from transmission lines | 0.182083 | 0.172938 | 0.009146 | |
| Topography (slope) | 0.083215 | 0.082858 | 0.0543 | 0.000358 |
| Topography (elevation) | 0.083215 | 0.082858 | 0.000358 | |
| Distance to roads | 0.204985 | 0.214183 | 0.009199 | |
| Land use | 0.188895 | 0.189720 | 0.0000 | 0.000825 |
| Sensitive and protected areas | 0.119395 | 0.120821 | 0.001427 | |
| Distance from demand centers | 0.057504 | 0.056688 | 0.000816 | |
| Available solar potential | 0.103789 | 0.103021 | 0.0516 | 0.000768 |
| Available small hydro potential | 0.103789 | 0.103021 | 0.000768 | |
| Climate | 0.060134 | 0.059771 | 0.000363 |
Publisher’s Note: MDPI stays neutral with regard to jurisdictional claims in published maps and institutional affiliations. |
© 2022 by the authors. Licensee MDPI, Basel, Switzerland. This article is an open access article distributed under the terms and conditions of the Creative Commons Attribution (CC BY) license (https://creativecommons.org/licenses/by/4.0/).
Share and Cite
Atwongyeire, J.R.; Palamanit, A.; Bennui, A.; Shakeri, M.; Techato, K.; Ali, S. Assessment of Suitable Areas for Smart Grid of Power Generated from Renewable Energy Resources in Western Uganda. Energies 2022, 15, 1595. https://doi.org/10.3390/en15041595
Atwongyeire JR, Palamanit A, Bennui A, Shakeri M, Techato K, Ali S. Assessment of Suitable Areas for Smart Grid of Power Generated from Renewable Energy Resources in Western Uganda. Energies. 2022; 15(4):1595. https://doi.org/10.3390/en15041595
Chicago/Turabian StyleAtwongyeire, Jane Rose, Arkom Palamanit, Adul Bennui, Mohammad Shakeri, Kuaanan Techato, and Shahid Ali. 2022. "Assessment of Suitable Areas for Smart Grid of Power Generated from Renewable Energy Resources in Western Uganda" Energies 15, no. 4: 1595. https://doi.org/10.3390/en15041595
APA StyleAtwongyeire, J. R., Palamanit, A., Bennui, A., Shakeri, M., Techato, K., & Ali, S. (2022). Assessment of Suitable Areas for Smart Grid of Power Generated from Renewable Energy Resources in Western Uganda. Energies, 15(4), 1595. https://doi.org/10.3390/en15041595