1. Introduction
Many historic buildings are currently changing their use, or at least expanding their functions to purposes for which they were not originally designed. This process requires a study that allows us to discern the effectiveness of such buildings for several functions they can provide, in addition to their primary function. Some examples range from the analysis of the acoustic characteristics of the building [
1,
2,
3] to the modeling of the indoor environmental conditions to allow for the preservation of heritage [
4,
5], or a deeper analysis to understand what the new function of the building would be, while trying to preserve its identity as much as possible [
6]. Focused on the analysis of indoor environmental conditions, the Milan Cathedral was analyzed in [
7]; the authors concluded that microclimate monitoring is essential for the assessment of the building state and that through these collected data, a simulation model can be built. Specifically, to understand whether a church can be used to store cultural heritage, the influence of the indoor microclimate was analyzed in [
8] during and after the restoration of artworks to understand the effects of the floor heating systems on the heritage. Similarly, [
9] presented an assessment of indoor climate for the Mogila Abbey (Poland) to predict the indoor microclimate conditions needed to preserve heritage pieces; the authors measured temperature, relative humidity (Hr), and carbon dioxide for about two years (March 2012 to April 2014). Cabeza et al. [
10] analyzed the strategies applied to a classification of historical buildings, analyzing the use of HVAC systems and renewable energy, such as solar and geothermal. Bonacina et al. [
11], presented a monitoring process over 20 years to understand the management of the indoor microclimate to design HVAC systems and evaluate their performances. Balocco et al. [
12] analyzed the introduction of HVAC to maintain optimal conditions. Through HVAC, it was possible to maintain 50% Hr. Levels for interior temperature conditions were: for the winter configuration, 18 °C (8–18 h) and 15 °C (19–7 h); for the summer configuration, 22 °C (8–18 h), 26 °C (19–2 h), and 24 °C. These conditions can be extrapolated to the case of air conditioning a space to contain works of art.
The use of simulation models to study historical buildings and specifically cathedrals is not widespread. Some approaches that use simulation to model buildings to understand their capabilities to preserve cultural heritage are reviewed in [
13,
14]. Interestingly, [
15] presents a multi-objective optimization methodology that guides managers of museums to improve artwork preservation using, in this case, a TRNSYS 17 model [
16], where the model becomes a key element to provide insights to the optimization solver. Monitoring and understanding the building through a model becomes a key element enabling analysis of the thermal performance, as well as validations [
17] to verify its suitability for containing historical pieces of art.
Heat capacity is known to play a very important role in maintaining the inside thermal conditions of a building. A building with a high thermal inertia envelope absorbs and stores energy in a way that prevents the indoor temperature from increasing rapidly. When the situation is reversed, and the temperature of the space is lower than that of the envelope, heat is relieved so that the temperature decreases slowly [
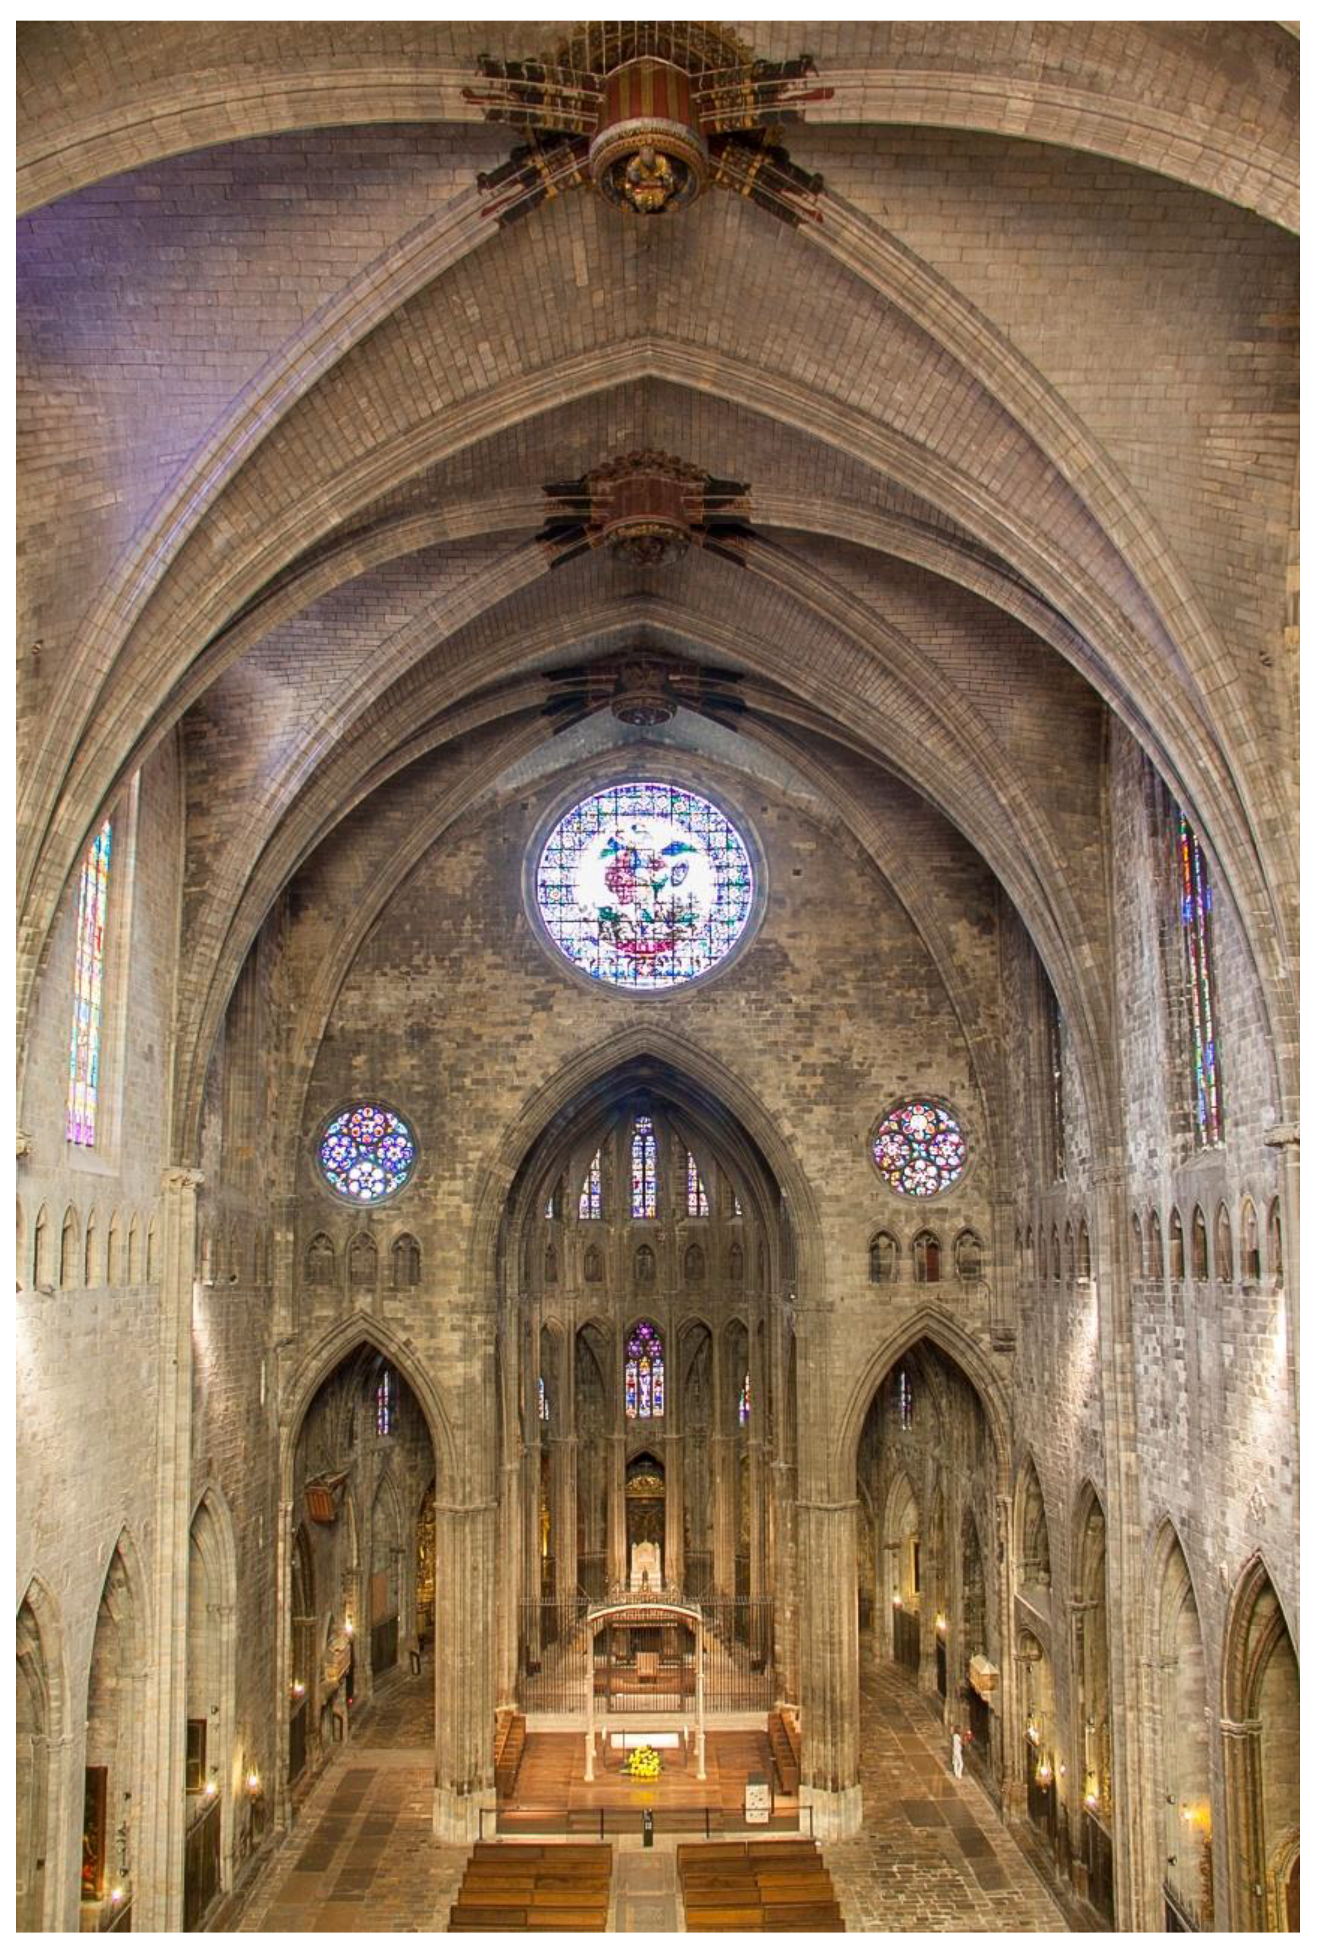
18]. As a result, the indoor environment has few variations, maintaining stability over time. The extent to which heat capacity affects the indoor thermal conditions of a building was studied in detail for a specific case. The case study was performed on a building with very high heat-capacity performance: the Girona Cathedral in Catalonia, Spain. The study was carried out over five years. The reason for choosing this building, apart from its architectural and historical features, is because it contains works of art that are sensitive to sudden changes in temperature and humidity. This study analyzed the variability of temperature and humidity within the building, allowing us to verify whether it is a favorable environment warranting conservation.
Indoor environmental conditions without sudden variations are of great importance for the conservation of artistic heritage. The Girona Cathedral has a stone enclosure that gives it the best characteristics for carrying out this study; in fact, the enclosure is made of a homogeneous and heavy material, without insulation. There is no indoor air conditioning, and internal activities do not have a significant effect on indoor environmental conditions. The 4. Methodology section details the characteristics of each construction element and the hypothesis used to make the model.
The study was carried out during the period from January 2011 to December 2016. Hourly data for each year are available for the outdoor temperature (°C), relative humidity (%), solar radiation (W/m²) [
19], and the temperature (°C) and humidity (%) inside the cathedral. Thanks to the data from different years, we could see how the same behavior was repeated year by year and how the indoor temperature curves varied depending on the external conditions.
At the same time, a computer model was realized based on the building-energy modeling engine EnergyPlus [
20,
21]. The modeled indoor temperatures were compared with the real temperatures to verify the feasibility of applying the computer model to other cases.
The results were analyzed on different time scales: monthly mean values, (Sections 0 to 0), daily values (0), and hourly values (0). This analysis allowed us to study specific behaviors and factors, such as the offset of average temperatures, the damping of the indoor temperature and humidity, and deviations between real data and the results of the model.
This study shows that from a thermal inertia perspective, a space can be maintained with constant and favorable temperature and humidity conditions to contain delicate elements, such as pieces of art, without having a conditioned space. Additionally, the comparison of the simulation results with the monitored data (solution validation) shows that through space modeling, using a simulation tool like Energy plus, one can obtain reliable previsions. The implementation of these kinds of simulation tool in museum warehouses, archives, or other spaces that must contain sensitive objects can improve their conditions without having to install an HVAC system and therefore without energy consumption.
2. Environmental Conditions for Pieces of Art
There are several criteria regarding the conservation measures that must be applied to a building [
12,
22,
23] that can be considered in this study. In our approach, we based our analysis on [
23]. In general, the materials comprising pieces of art are not directly affected by high or low temperatures or fluctuations in temperature, unless they are extreme (less than 10 °C, more than 30 °C). However, high temperatures, in combination with humidity, can favor the proliferation of fungi and insects on wood and other materials of organic origin, such as animal glues.
Relative humidity (Hr) can be a risk if it rises over 75%, drops to near 0%, or fluctuates considerably.
Table 1 details the effects of the fluctuation of relative humidity, depending on the kind of material. The most common materials are classified as medium sensitivity, such as furniture made with plywood; most oil paintings on canvas; most photographs; negatives and film; most magnetic records; and thin, well-adhered inks on parchment, such as deeds or gouache on paper. Therefore, a fluctuation of ±10% can be a good reference, as it causes little or no damage.
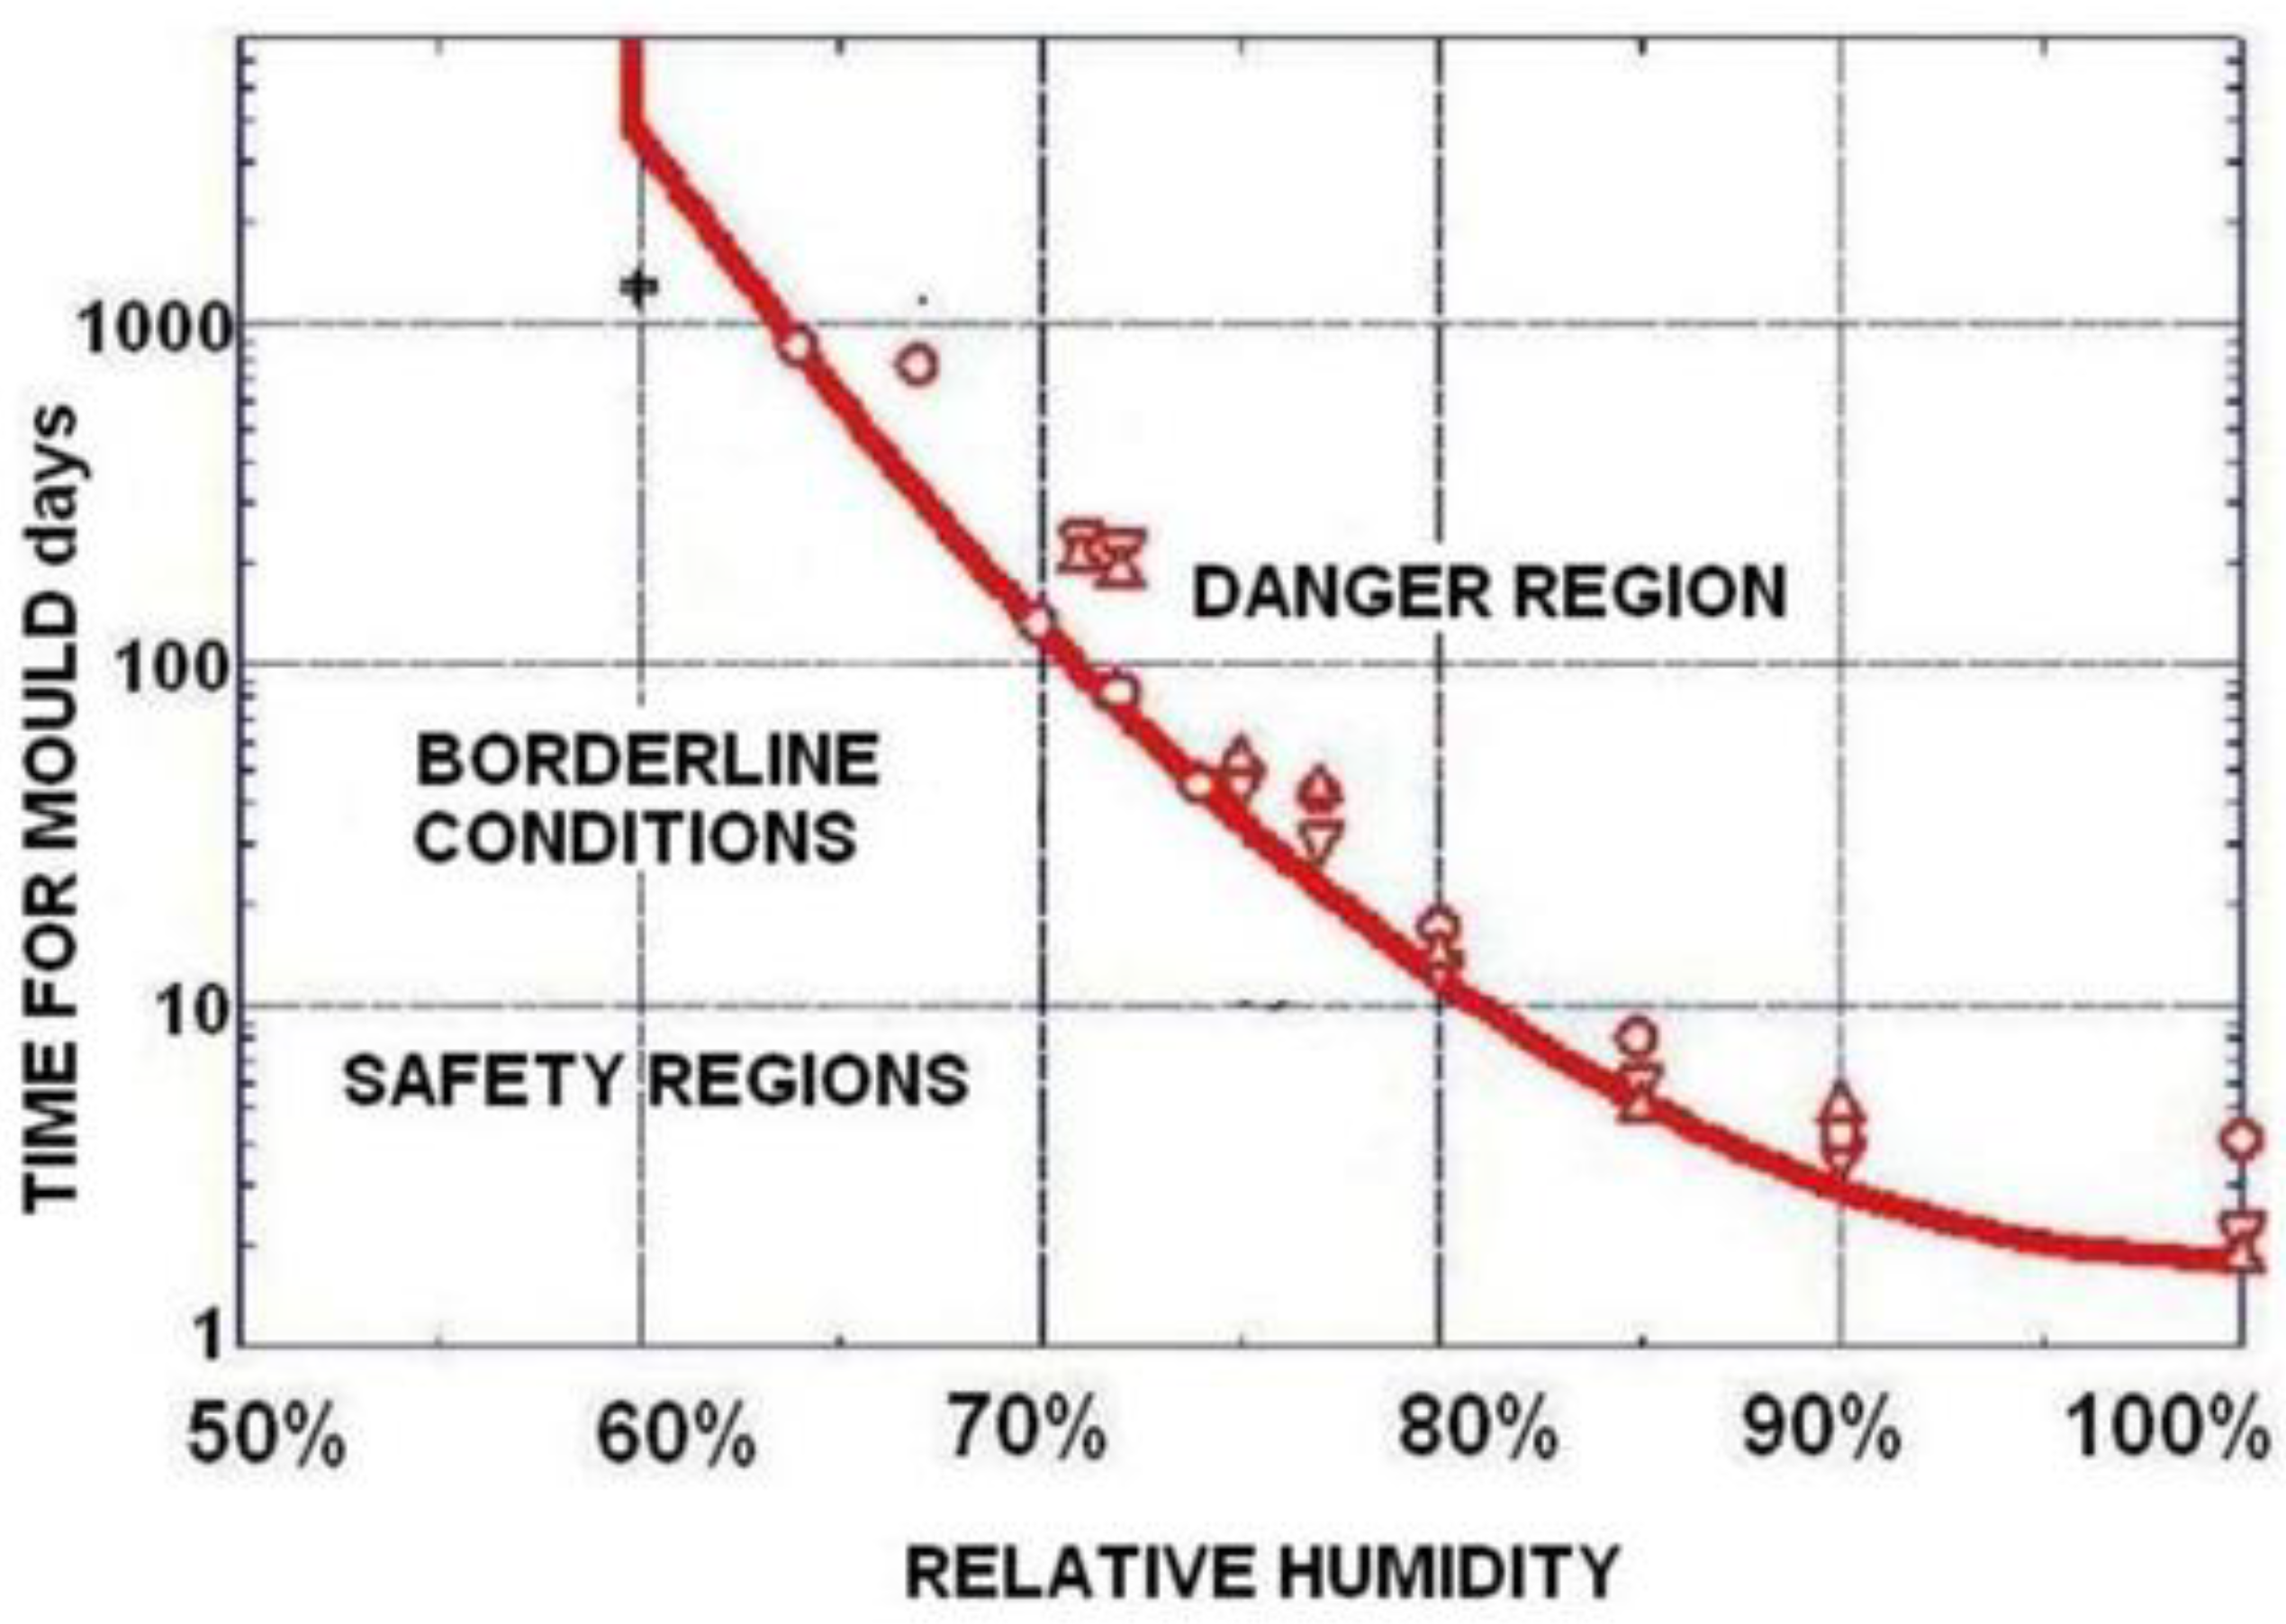
Relativity humidity greater than 75%, depending on the duration, can cause mold. See
Figure 1 to see the frontier that defines the effect (as an example, 100 days over 70% or 10 days over 80%). It should be noted that the effect is attenuated if, within the period, there are variations that cause the relative humidity to fall below these values.
4. Methodology
4.1. Enclosure
The envelope is made of “Girona stone”, a nummulitic limestone. Nummulitic limestone is made of cemented skeletons or shells of nummulites. Both the nummulites and the cement are calcareous. Nummulitic limestone is characteristic of the Eocene epoch, in the Tertiary period. The values of thermal characteristics of this material were extracted from the Spanish Building Technical Code [
26]. This catalog contains the values of thermal conductivity, density, and specific heat of different types of stones. The values are based on UNE-EN-ISO 10456 [
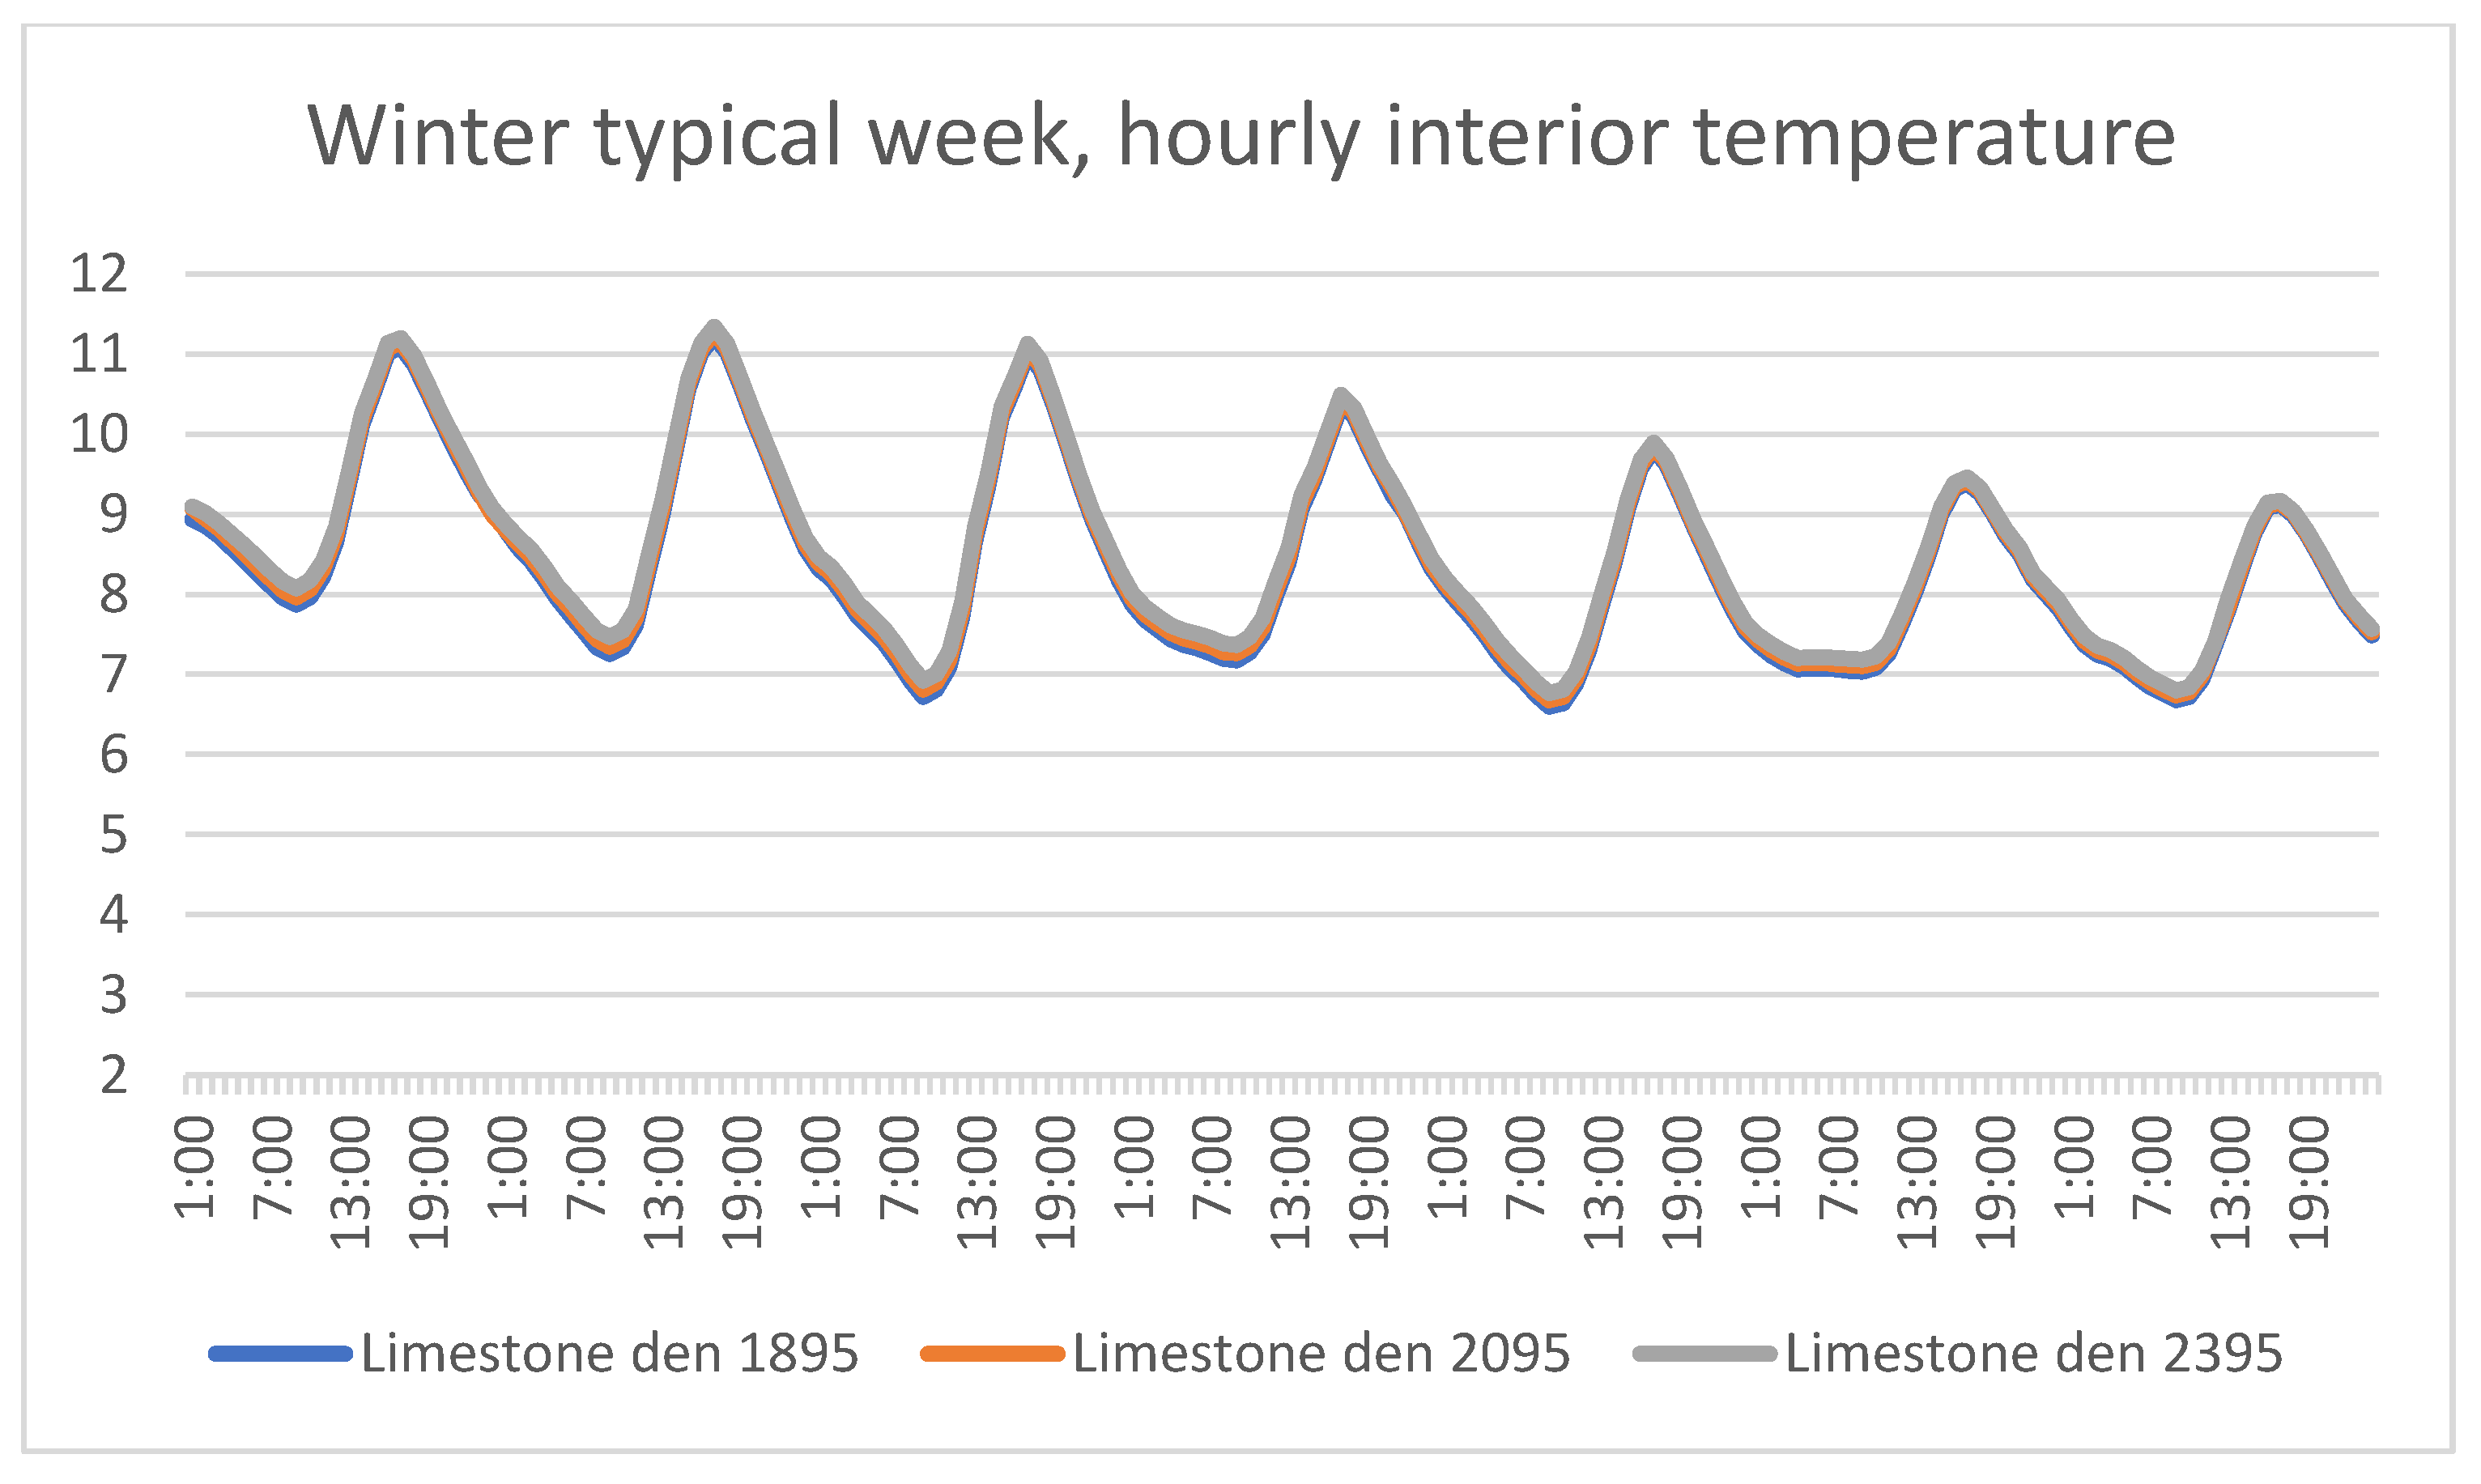
27]. The document shows the methods and conditions of calculation. We calculated the thermal behavior considering three kinds of limestone (
Table 2): extra hard, hard, and semi-hard limestone.
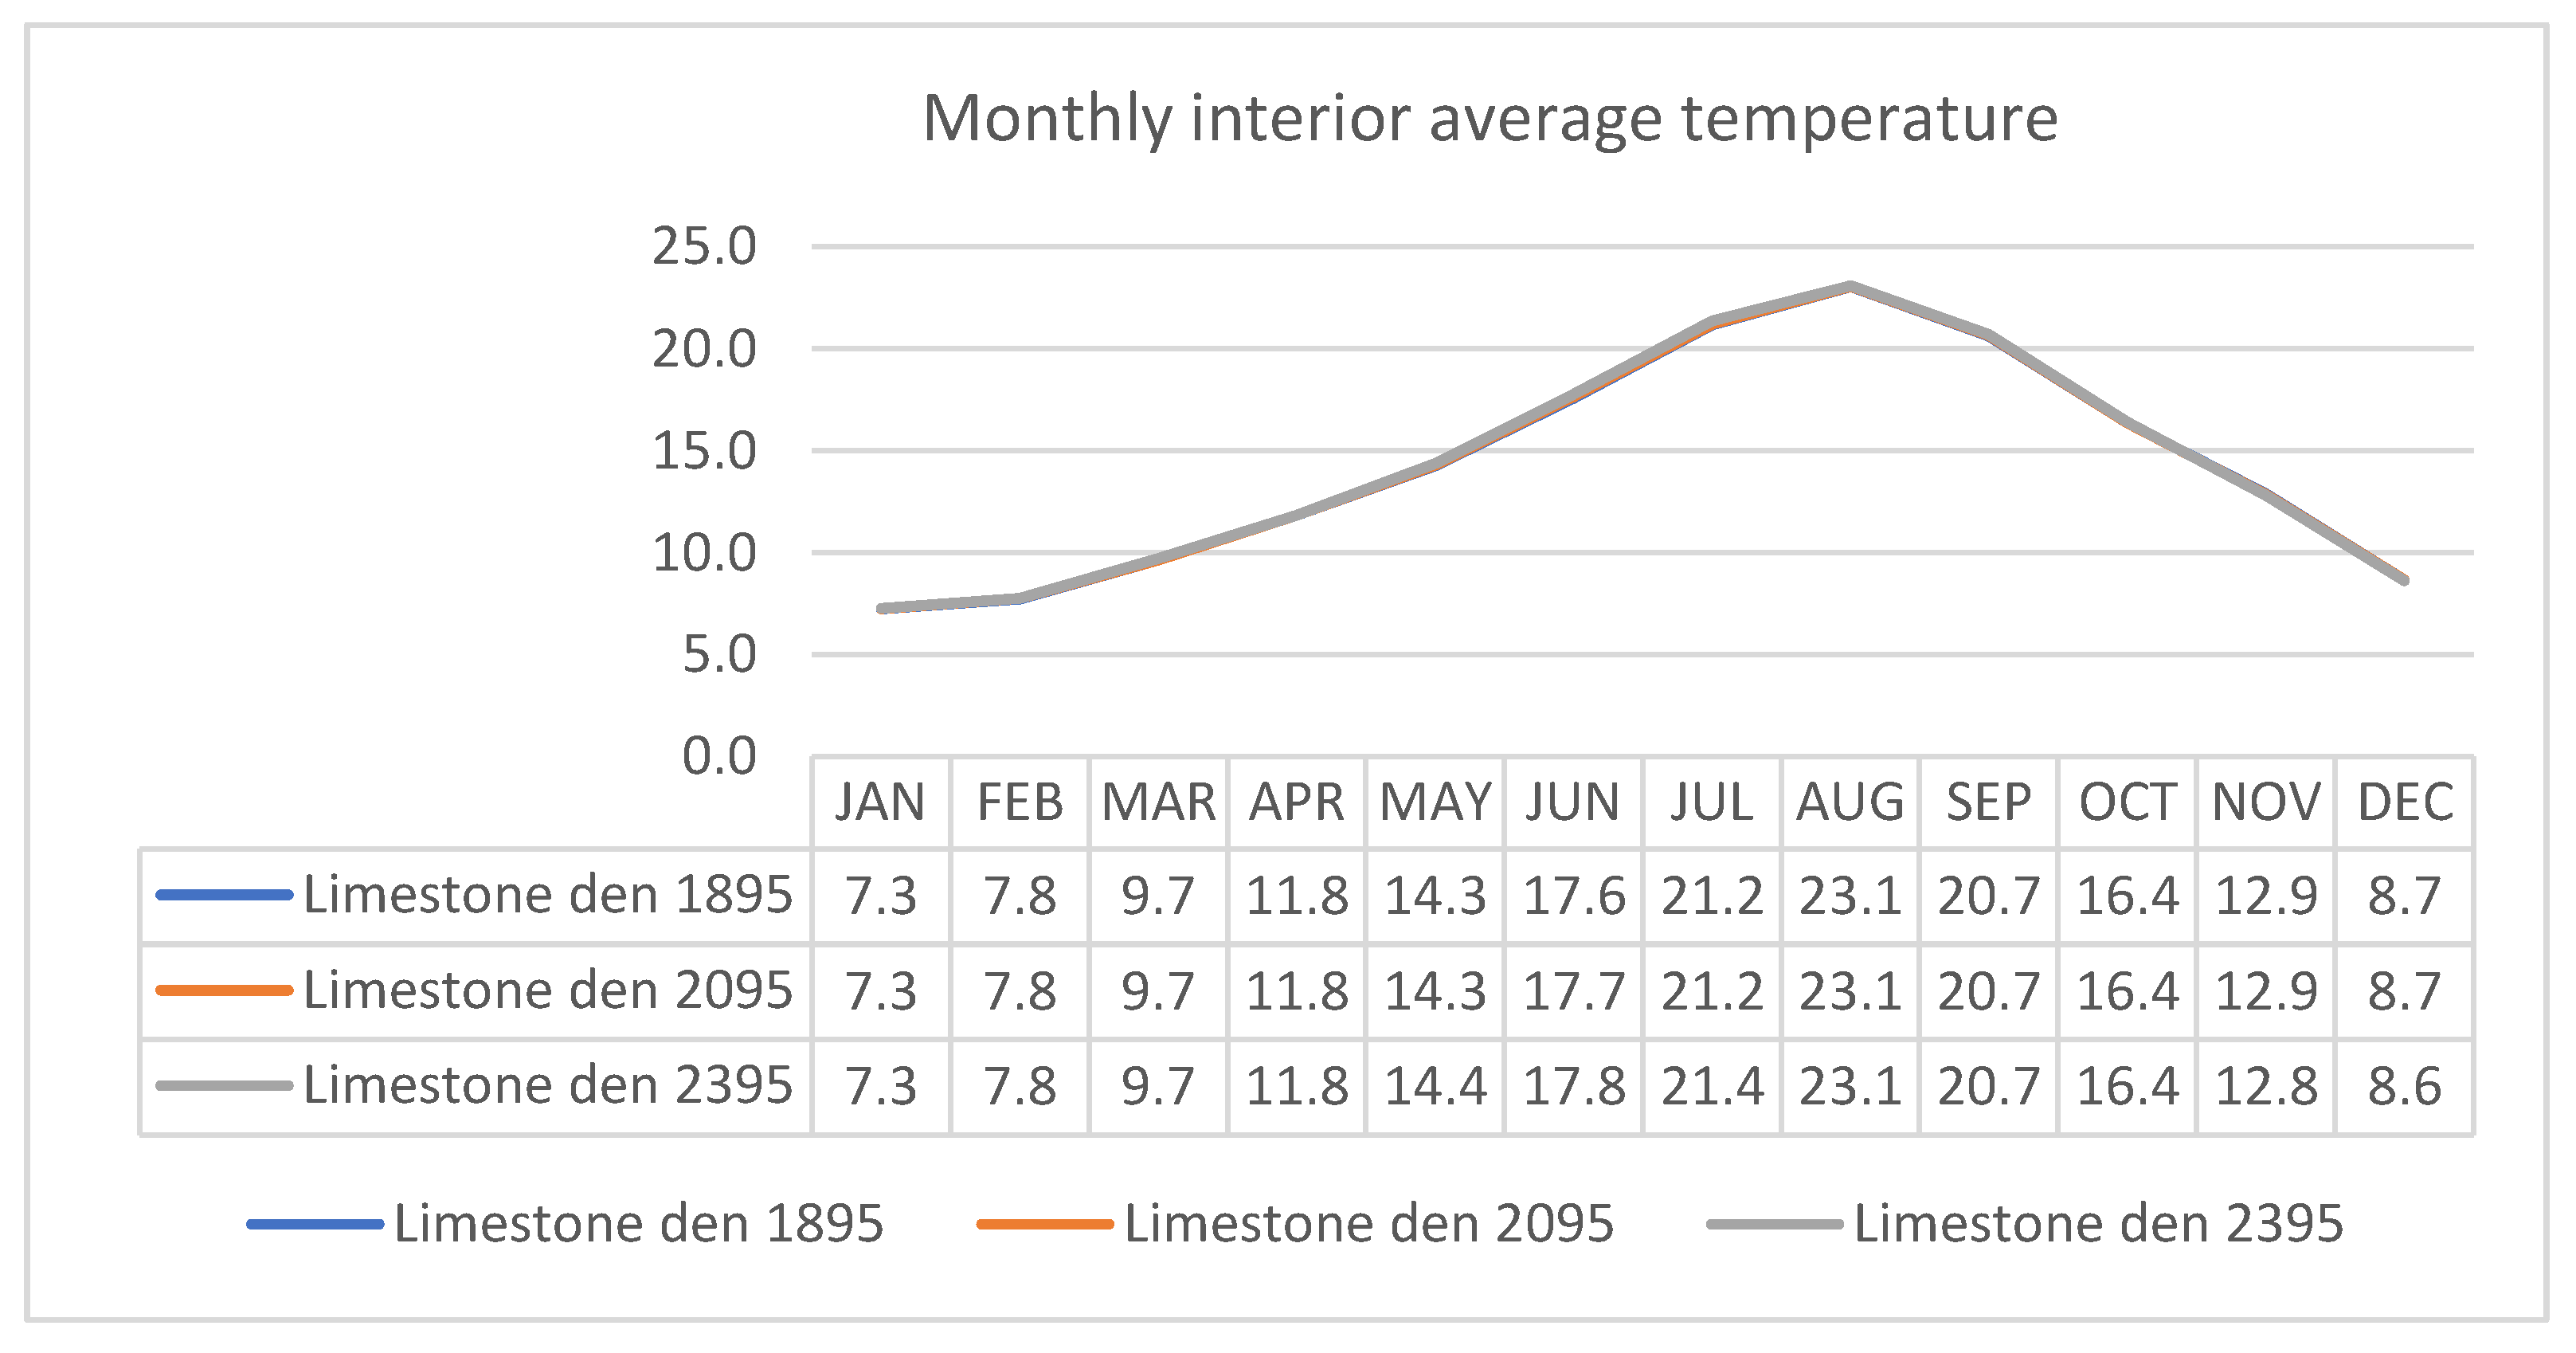
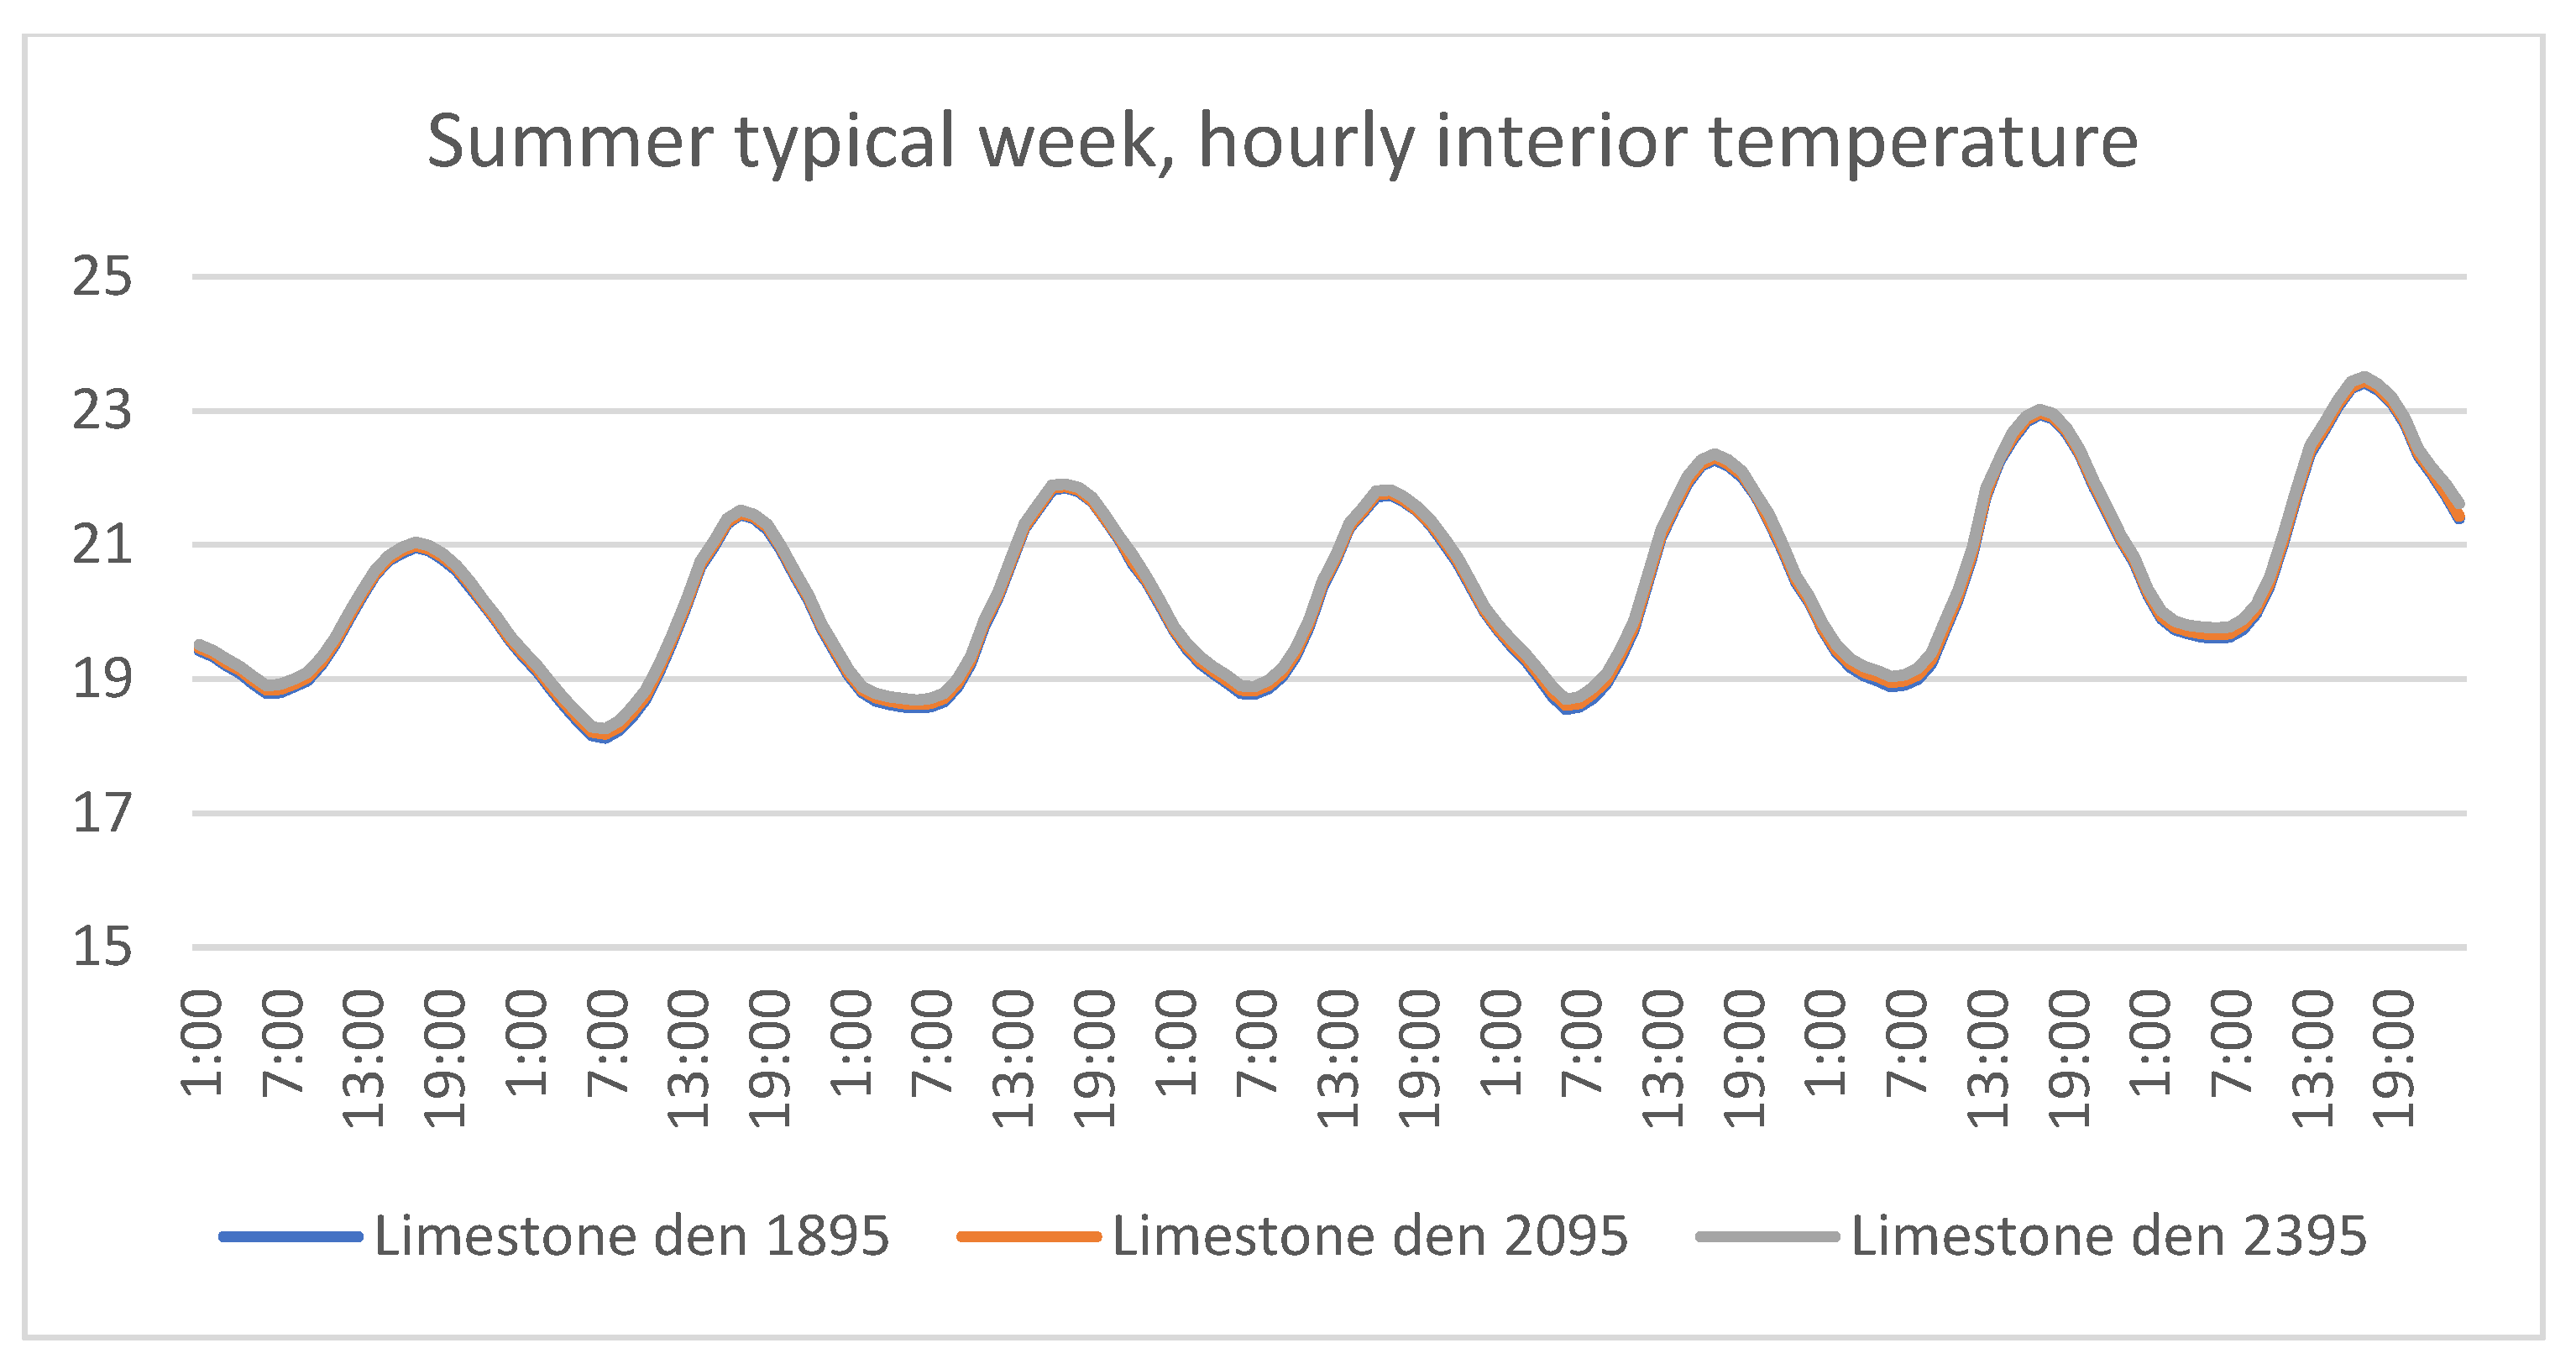
The results show that there are no appreciable differences between the three types of limestone. Therefore, when materials with very important thicknesses and high densities are used, variation in density does not have a significant influence on the calculations.
Figure 5 shows the monthly average interior air temperature of the model using the three limestones. We also compared the daily behavior for a typical week in summer and in winter (
Figure 6 and
Figure 7), and no significant differences were observed.
The walls of cathedrals are usually built with an inner wall and an outer wall. The central part of this structure is filled with construction debris and mortar. For this reason, semi-hard limestone (
Table 3) was chosen to be in the safety zone of the calculus for the value of density and therefore thermal inertia.
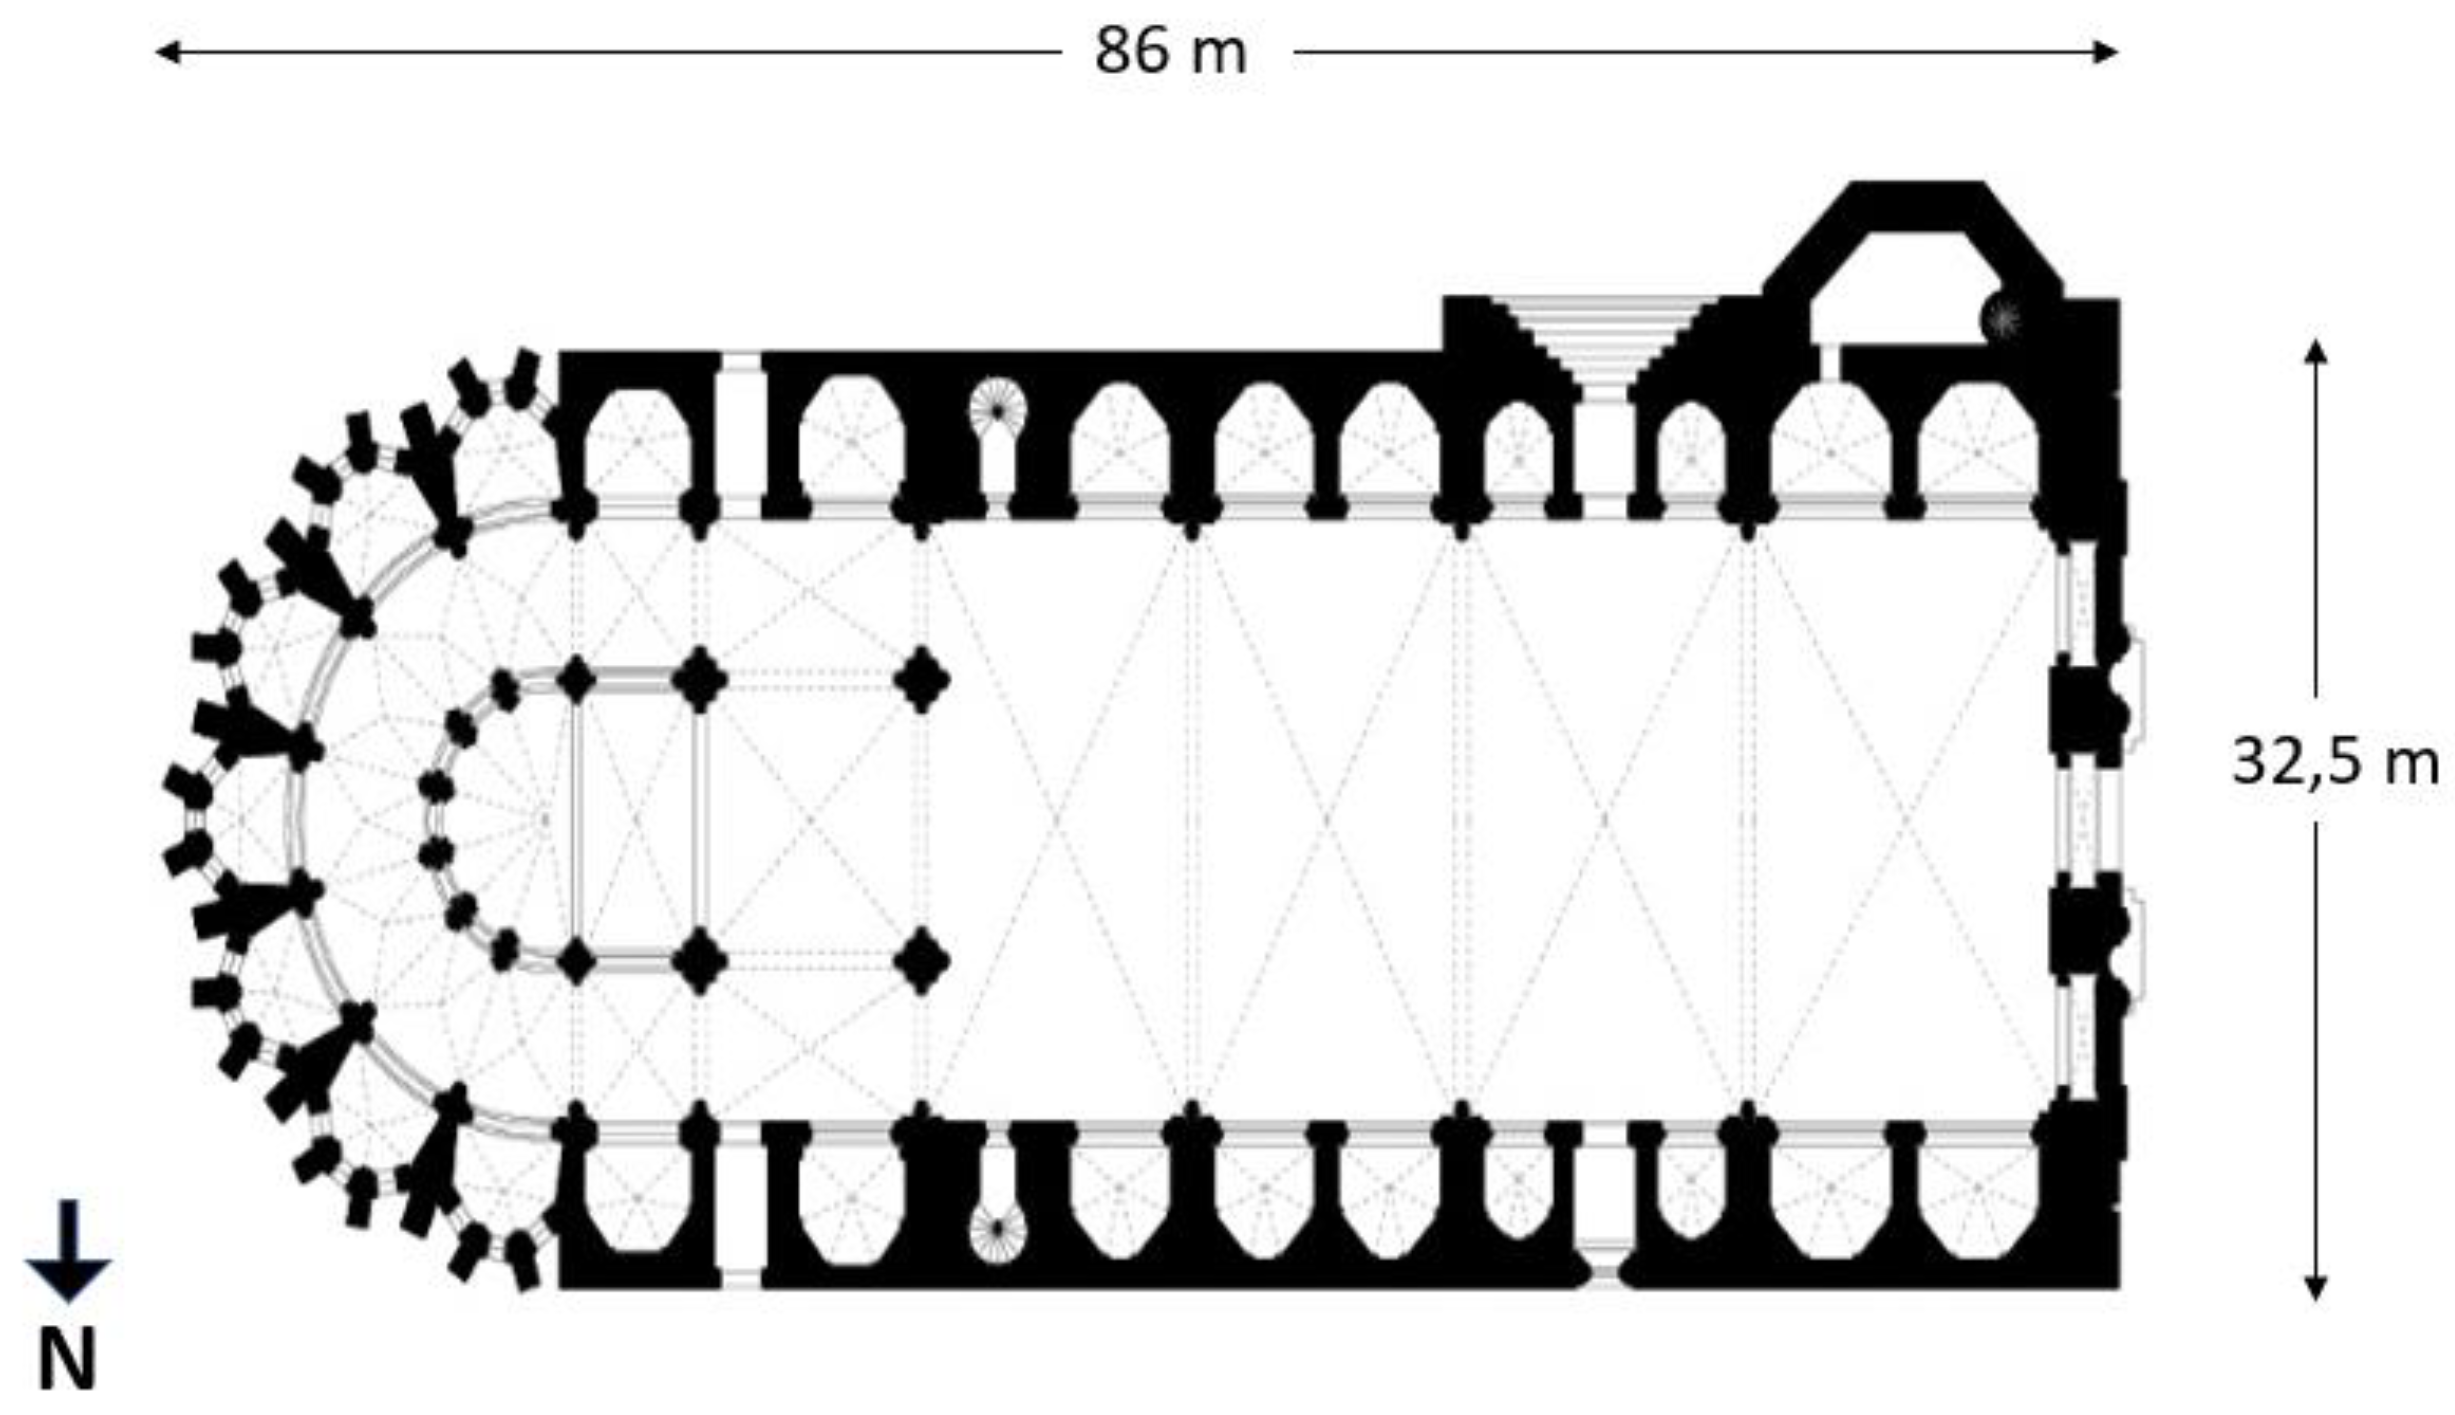
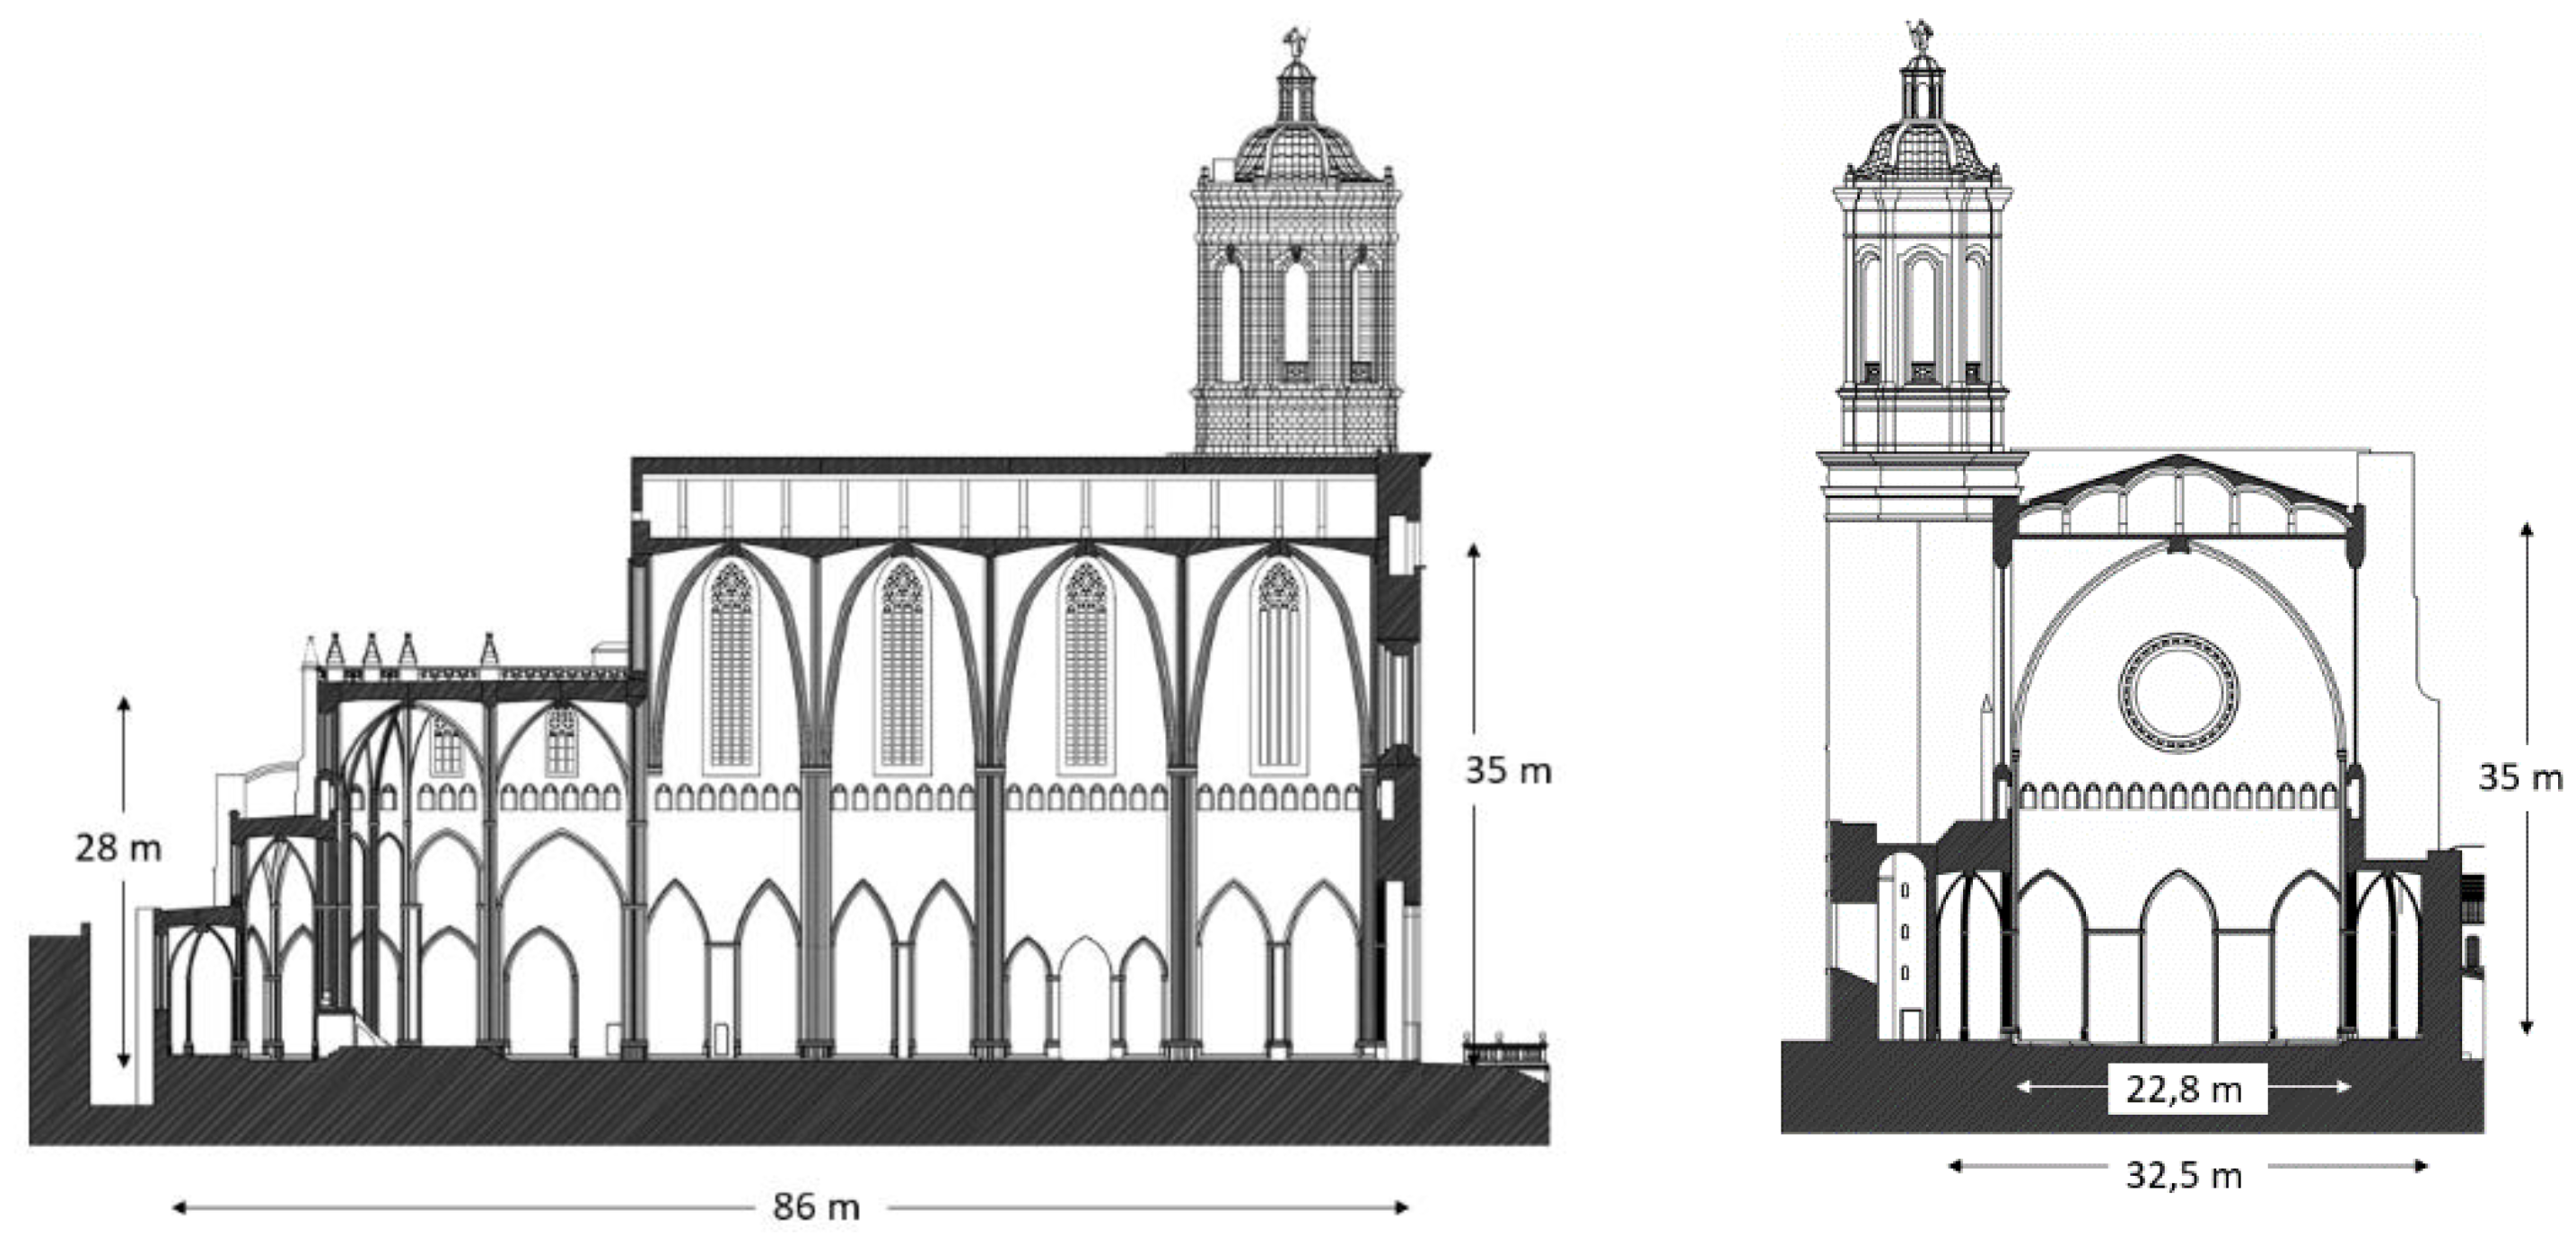
The walls of Girona Cathedral are 1 m or 1.2 m wide, depending on the location. The walls of the main façade and the bell tower are 2.5 m. wide. The vaults are made of stone with a ruffle. Above the vaults, there is a ventilated chamber and a tiled roof.
Dynamic calculations were performed according to EN13786 (Thermal performance of building components—Dynamic thermal characteristics—Calculation methods [
29]). The standard describes the thermal behavior of the elements of a building under variable environmental conditions; the thermal flux of temperature is considered to vary on one or two faces of the component. This standard assumes that component faces are subjected to sinusoidally varying temperature flows. The dynamic properties of thermal transfer under periodic thermal fluxes consider the heat accumulation of the component, the delay, and the damping of the wave when passing from one side to the other.
Table 4 shows the main characteristics of the enclosures. These values indicate a very stable behavior of indoor thermal conditions, as shown from the results.
4.2. Stained Glass
As is common in Gothic cathedrals, the openings are filled with large-format stained glass. In this building, glazed surfaces comprise 5.61% of the total surface area. Each stained-glass panel is composed of protective outer glass, a slightly ventilated air chamber, and the stained glass itself. The outer glass is colored, so it was considered to have a solar factor of 0.55, and the outer layer is translucent and was considered to have a solar factor of 0.75. These stained-glass windows also have a lead structure that represents 25% of the surface. With these parameters, the equivalent values of U g and TL were determined by obtaining these values, (
Table 5).
4.3. Interior Loads
The cathedral is open 361 days per year for 7 h/day and is visited by about 231,000 visitors annually. Therefore, this means that 614 people enter the cathedral every day, or 91 per hour. There are three spaces to visit: the museum, the cloister, and the cathedral’s nave. Visitors spend an average of 20 min in the cathedral’s nave, which means that there is an average of 30 people in the nave at a given time. The area of the nave is about 3000 m², so there is an occupancy of 100 m²/pers. In the interior, there is not another relevant load.
4.4. Ventilation/Infiltration
The infiltrations of this space mostly come through the doors and holes in the vaults. Proportionally, these elements represent a very small surface area relative to the entire surface of the envelope. There are three access doors to the nave. The door on the south and west façade faces directly outside, and the door on the north façade is bordered by an intermediate space where tickets are sold. The door of the west façade remains closed and is only opened for a few events during the year. The door of the South façade is open only during the hours of Mass. Other doors give access to the roofs and are only opened occasionally. With these conditions and the large volume of air of the nave, the air change rate is very low.
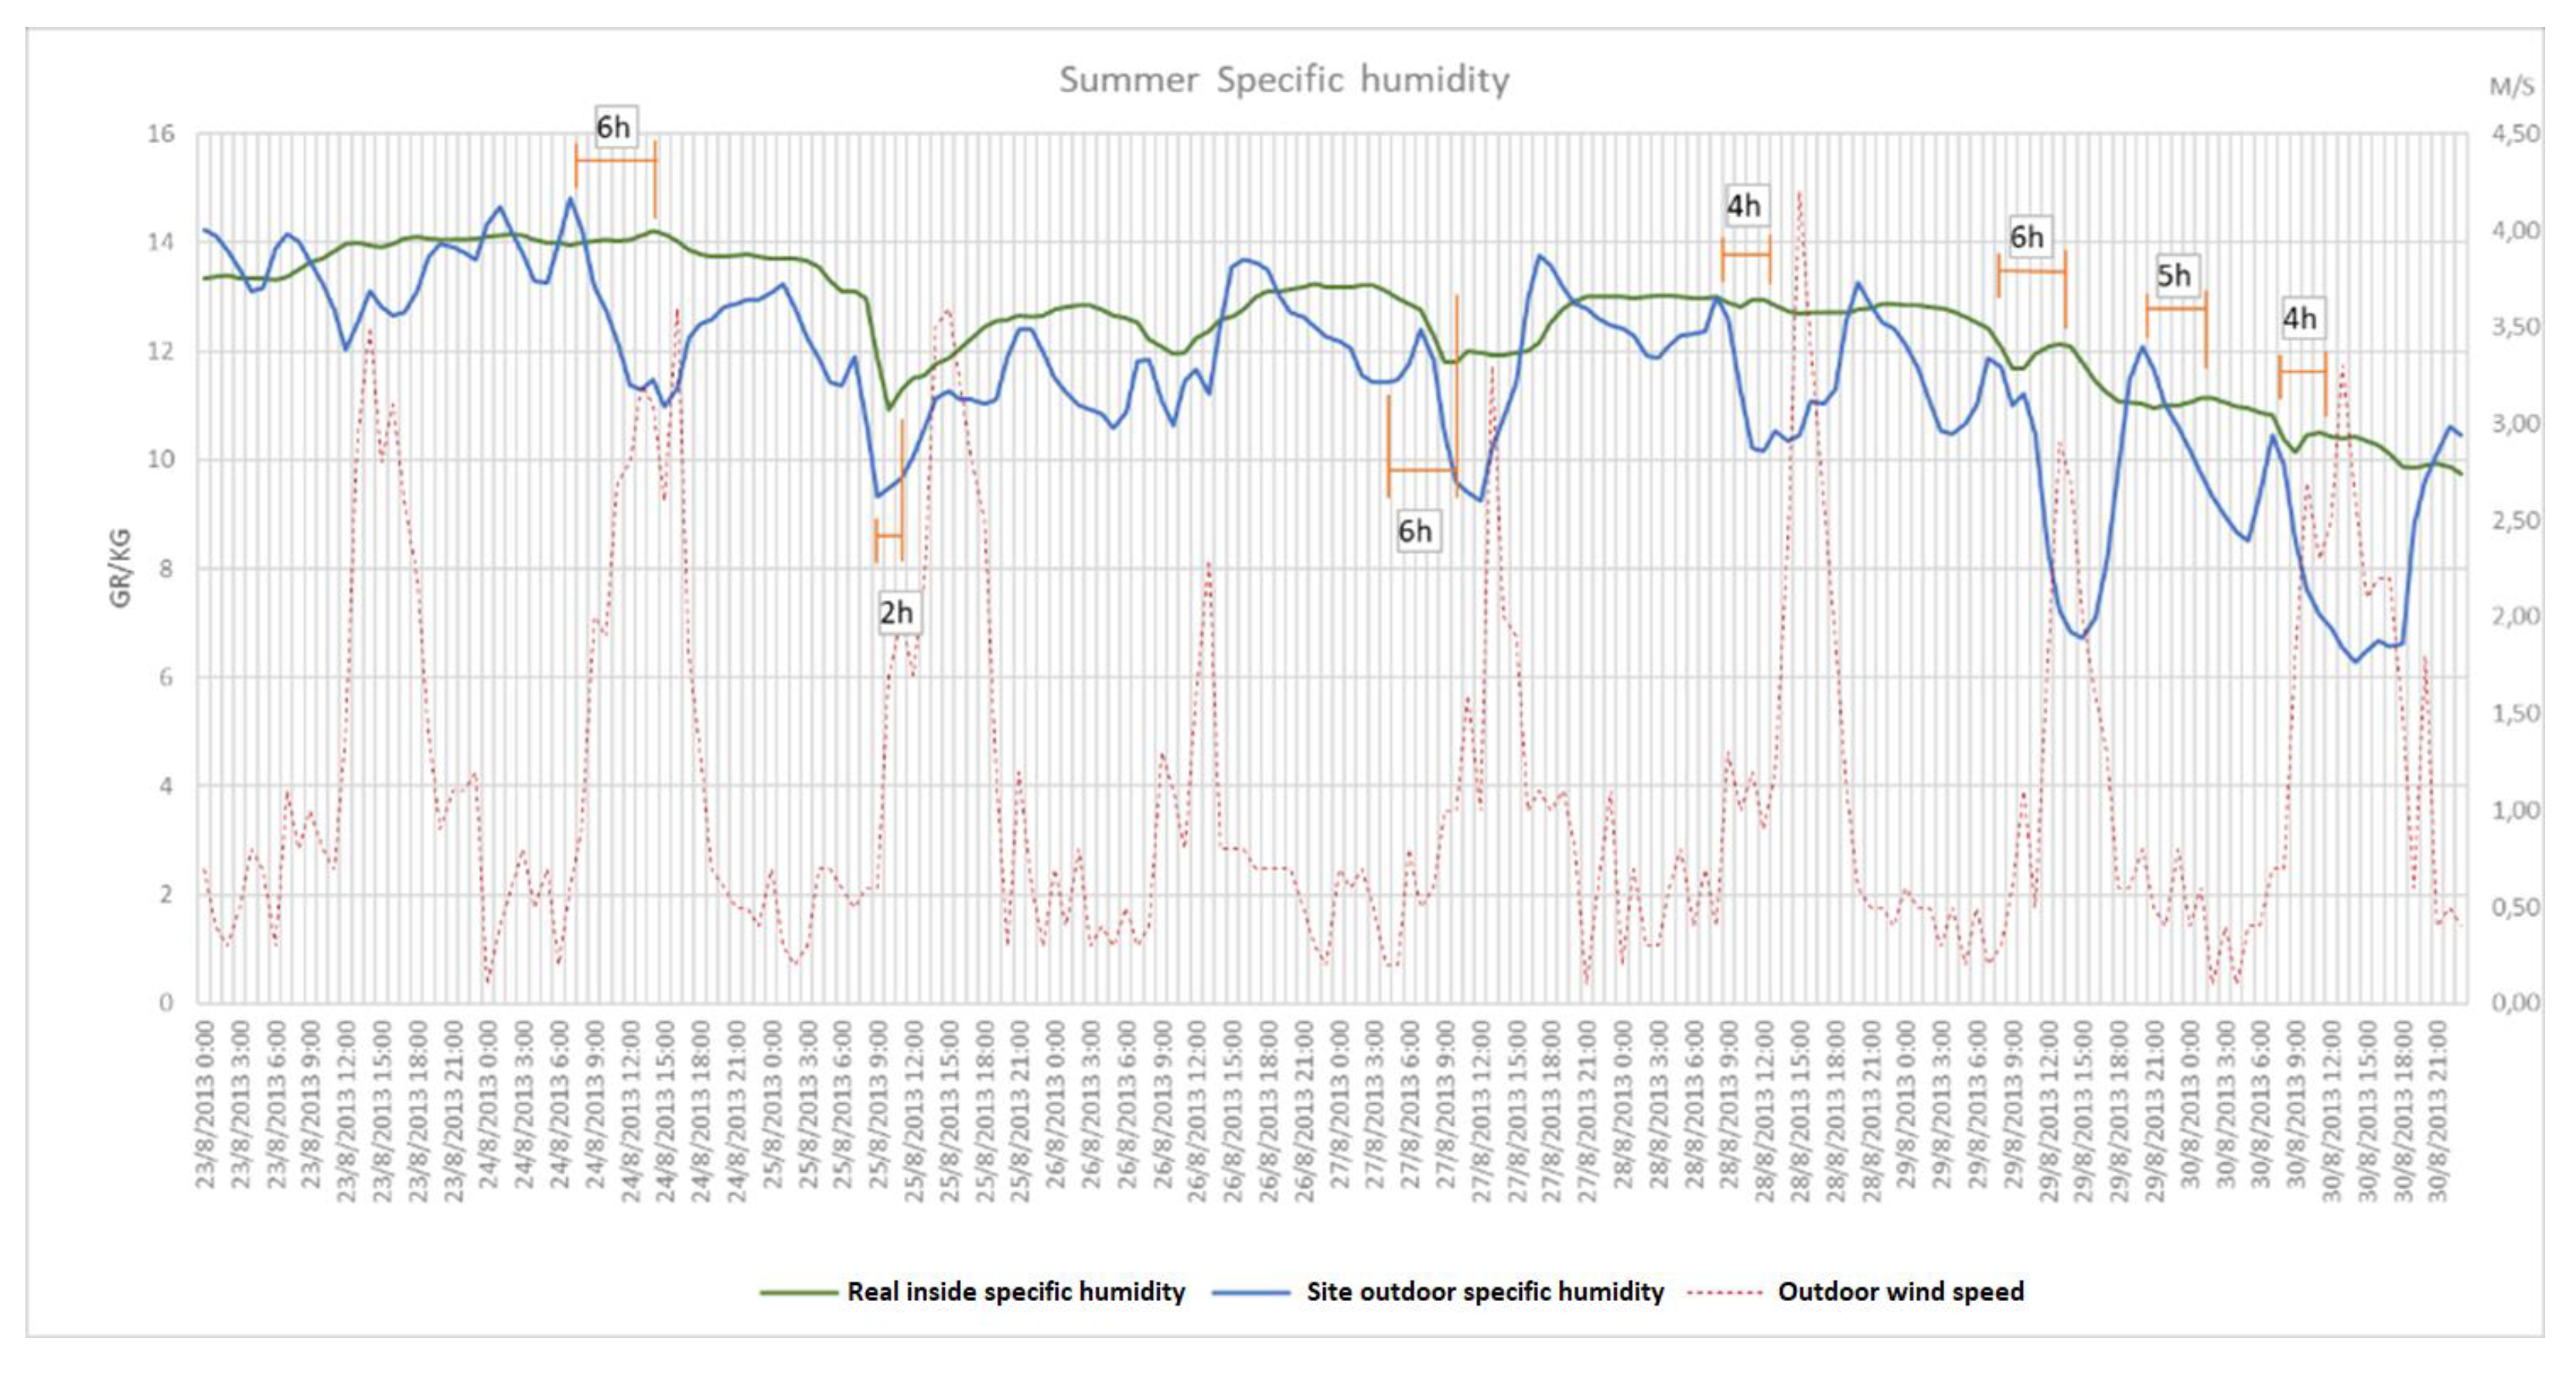
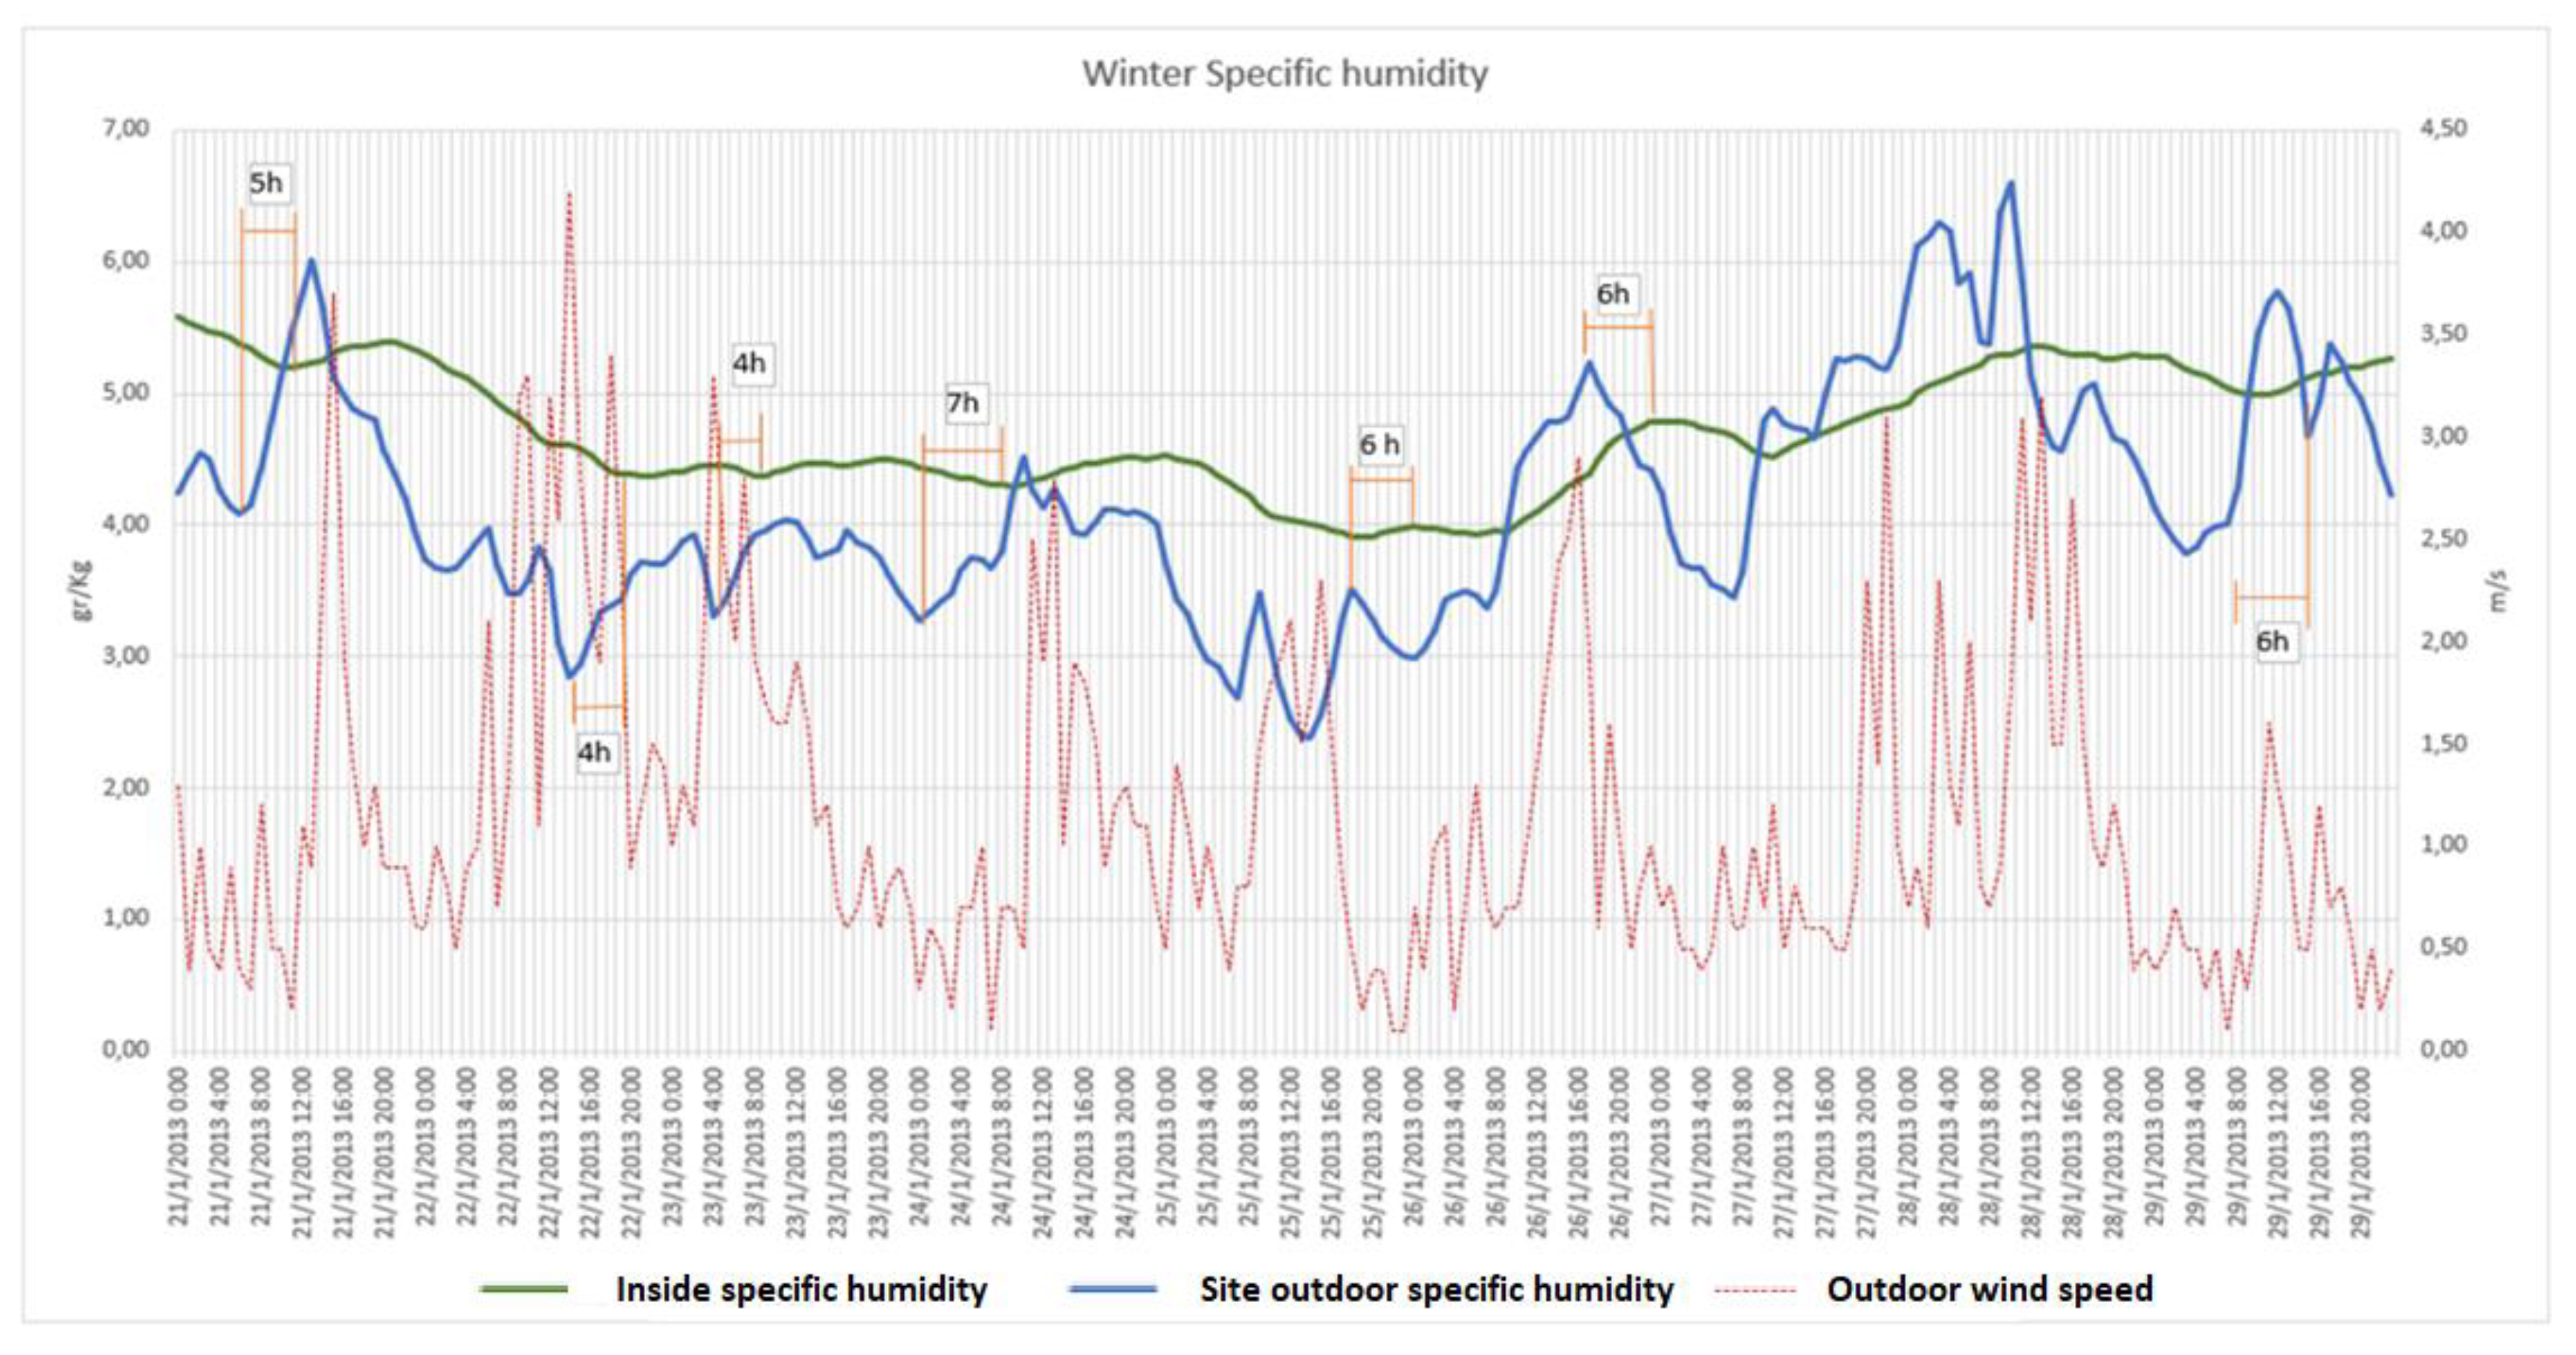
The air change rate was determined based on the study of the evolution of absolute humidity between inside and outside. As shown in
Figure 8 and
Figure 9, the maximums and minimums measured on the outside of the building are not seen inside until, in most cases, between 4 and 6 h have passed.
Therefore, 0.2 air changes per hour were applied to the model. This value was considered variable, depending on the wind speed and the difference between the indoor and outdoor temperatures, according Equation (1) and the coefficients of BLAST (building loads analysis and system thermodynamics).
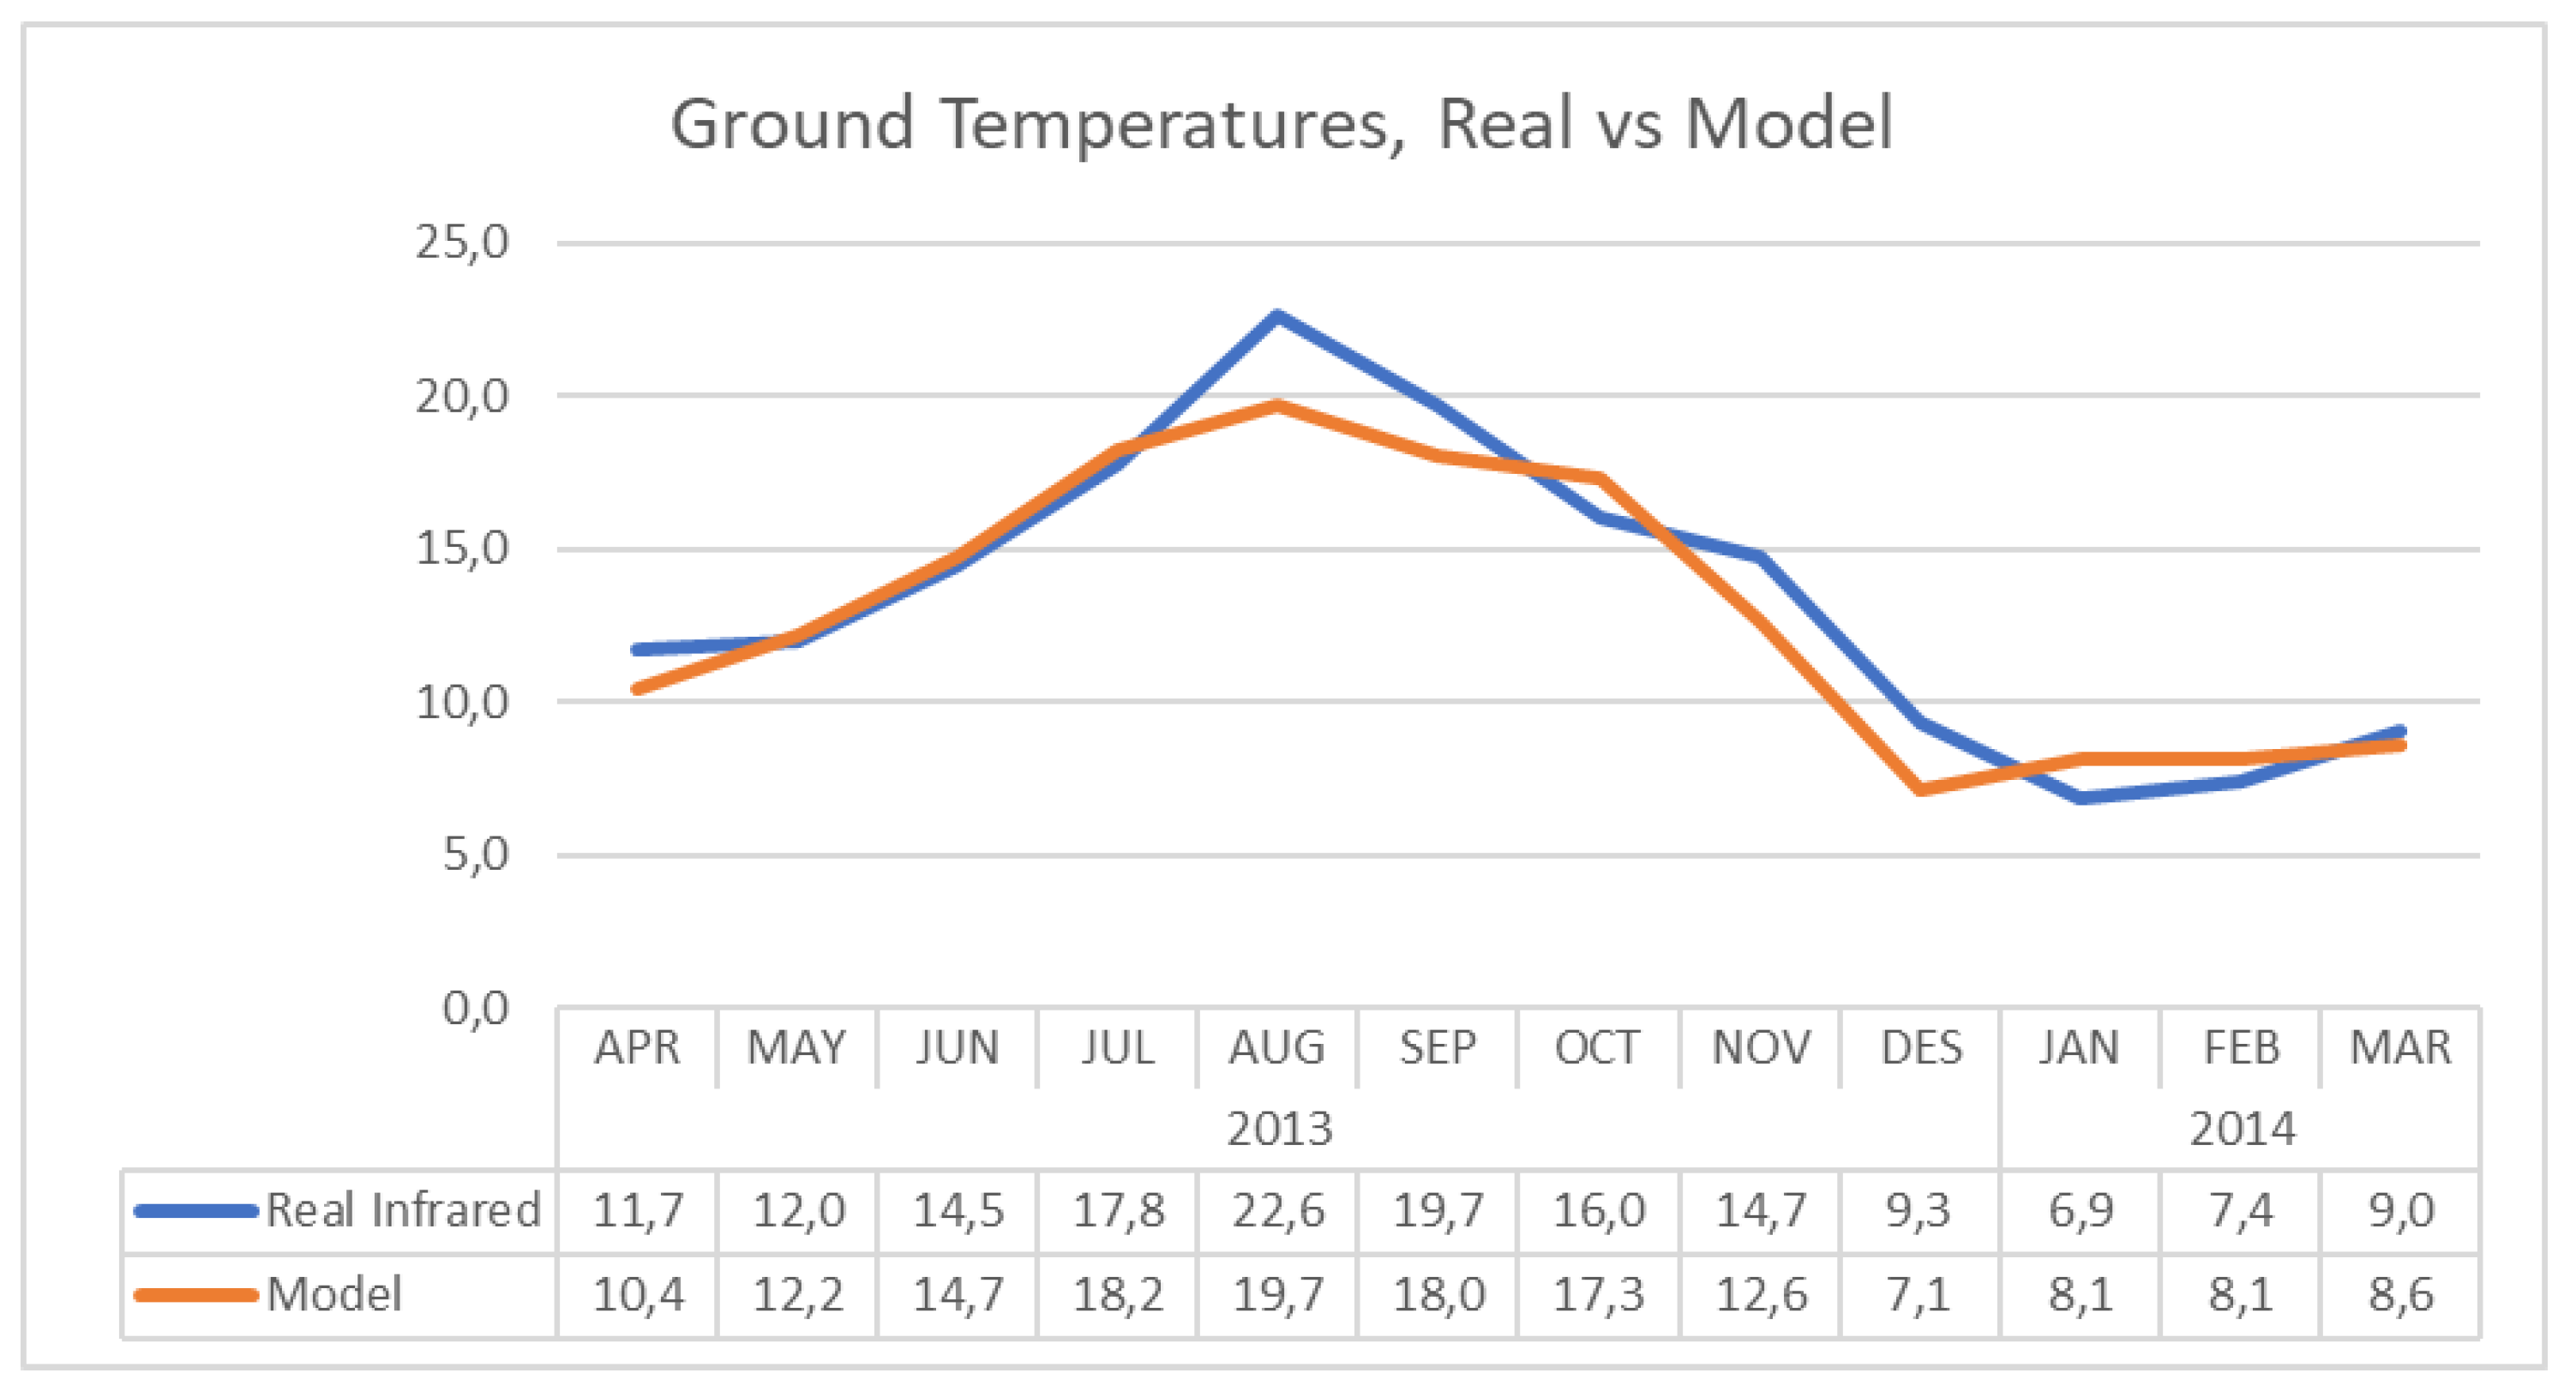
4.5. Ground Temperature
In this building, the temperature of the ground plays an important role in indoor thermal conditions. The temperatures that were considered are the results of applying the outside temperatures and conditions of the space and processing them with the slab utility of EnergyPlus.
Figure 10 shows the results. To obtain more accurate data, the calculation was performed with two consecutive years of the same climate file. In this way, the results consider the thermal inertia of the previous year. The calculation reveals that the most important difference between the two years is in the month of January; in the other months, the temperatures are equal.
From April 2013 to March 2014, the ground temperature was collected once a month with an infrared thermometer (TESTO 835 T1) [
30] in order to compare the real temperature to the model temperature. We followed a similar approach to the one used in [
31] to take measurements with the infrared thermometer. Specifically, data were collected according to EN 13187:1998 [
32] and the RESNET Interim Guidelines for Thermographic Inspections of Buildings [
33], as well as the manufacturer’s instructions [
30]. The value of emissivity inserted in the IR-camera ε-value was of (concrete/limestone mortar) 0.93, according the database of Testo Systems. In
Figure 11, we can see that the temperature curves are close to each other; the maximum difference is 2.9 °C in August.
4.6. Outdoor Weather Climate Data
Climate data for the calculation of the model were generated from the data collected at the Girona Meteorological Station of the Girona Meteorology Service (
https://www.meteo.cat/observacions/xema/dades?codi=XJ&dia=2022-02-14T20:00Z (accessed on 14 February 2022)). This Station is located in the same city (41°58′55.8″ N 2°48′19.9″ E), about 2.5 km far from the Cathedral. This station records the following parameters in intervals of thirty minutes: dry temperature (°C), relative humidity (%), global radiation on the horizontal plane (W/m²), precipitation (mm), wind direction, average speed (m/s), and maximum gust (m/s).
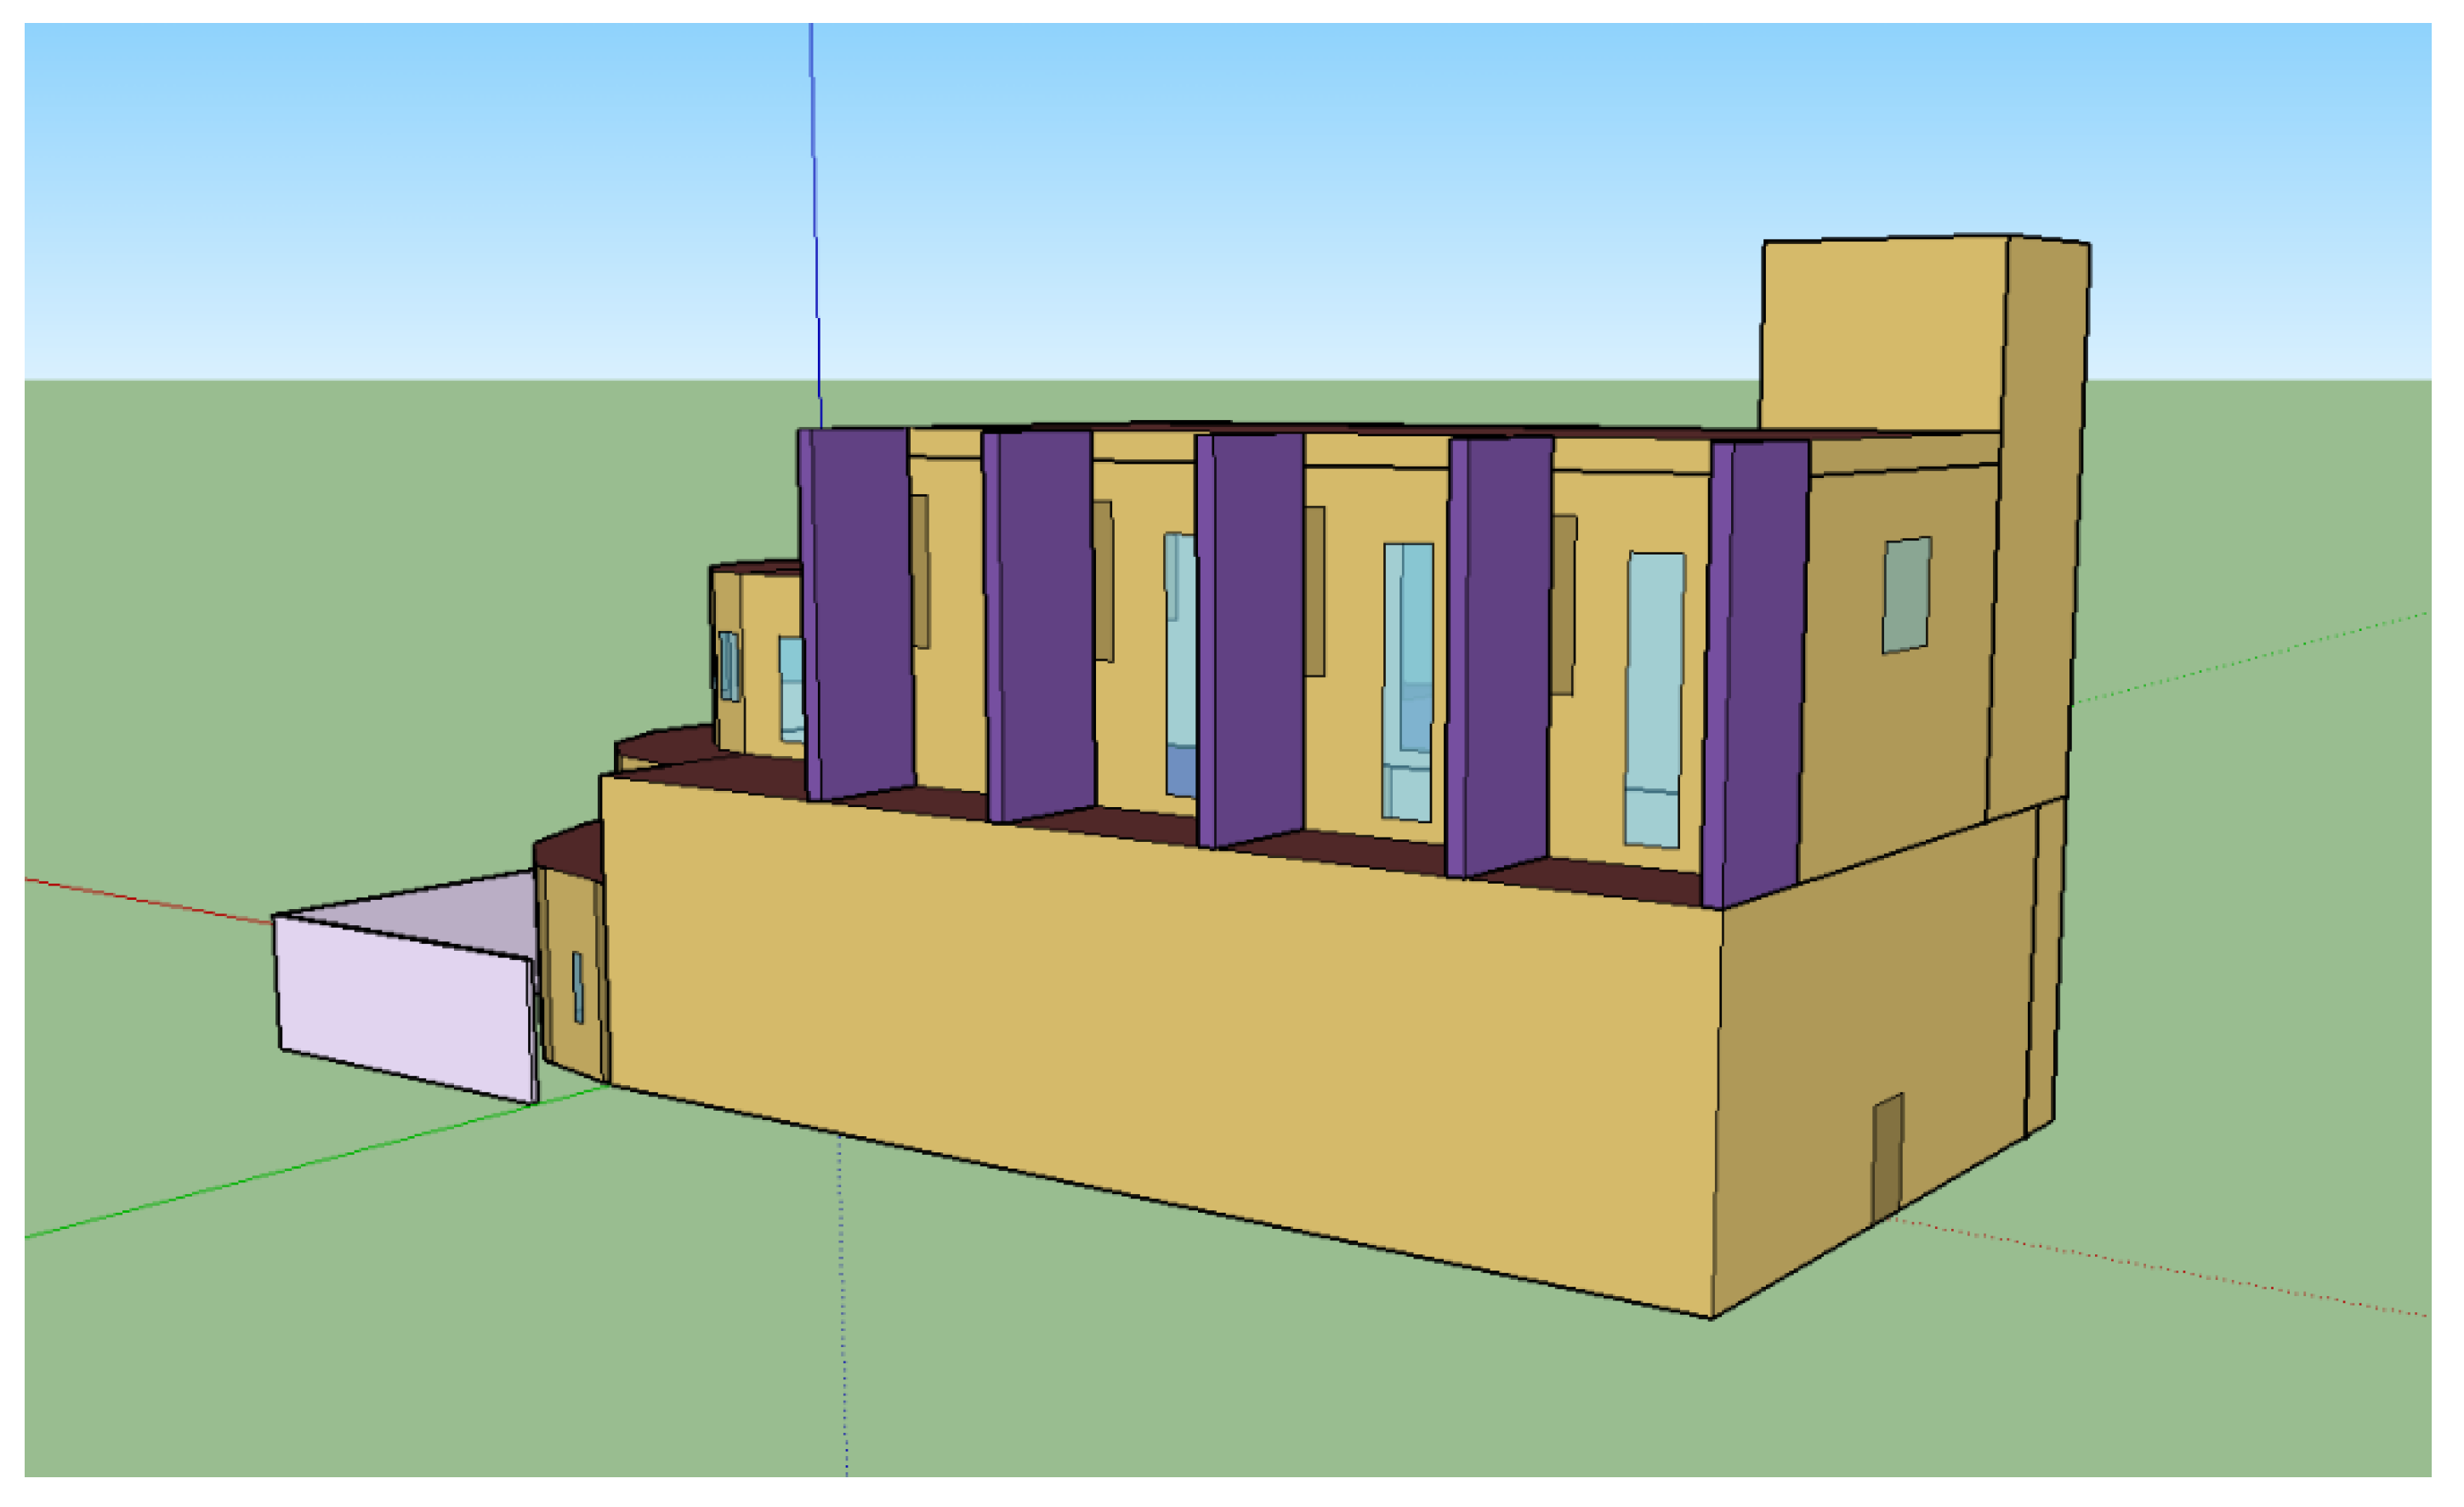
4.7. Simulation of the Energy Model
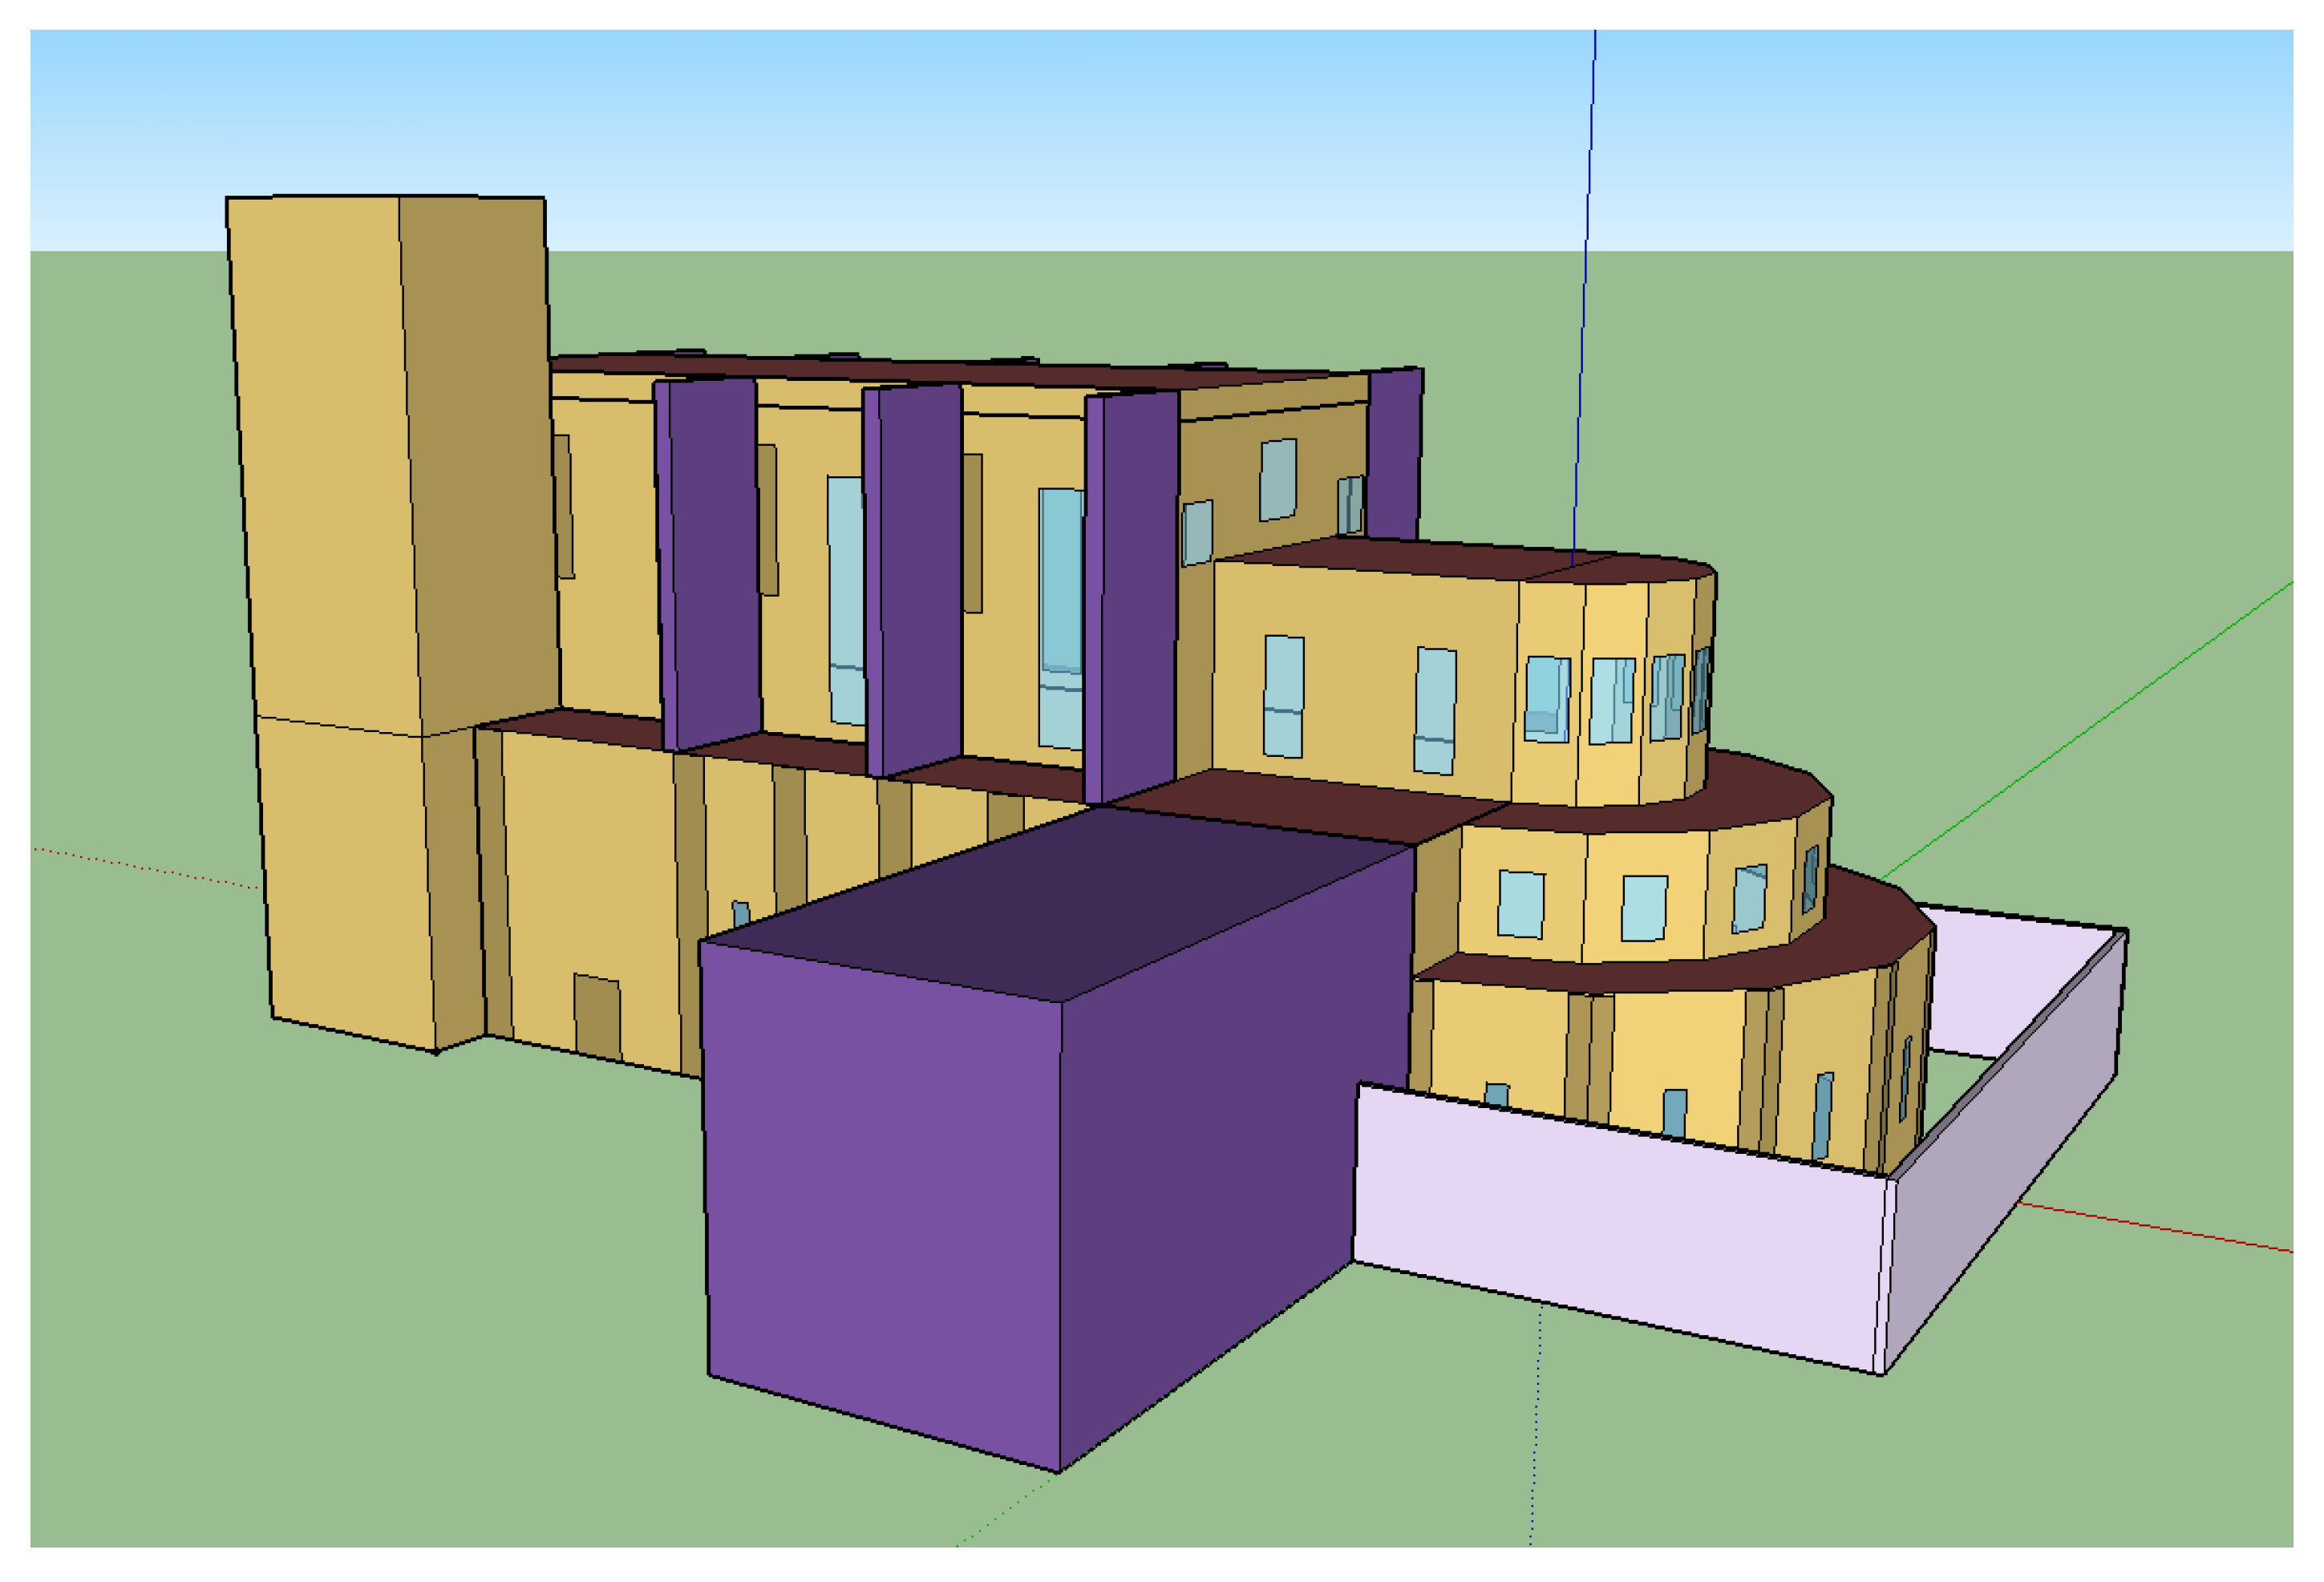
A 3D geometry model was done with SketchUp [
15], the properties of the materials and spaces were defined with OpenStudio [
34], and calculation was done with EnergyPlus version 9.4 [
20,
21]. The results are presented from figures and tables generated with a spreadsheet.
The geometry was obtained from the plans of the cathedral. The model was maximally simplified to speed up the calculation process, while, at the same time, maintaining maximum fidelity to reality. For this reason, three spaces were considered: the central nave (area analyzed), the ventilated roof above the central nave, and the tower. The shadows generated by the buttresses of the cathedral itself and the nearby buildings were also considered.
Figure 12 and
Figure 13 show some pictures of the 3D geometry model.
4.8. Data Collected from the Inside of the Nave
Indoor temperature and humidity data of the cathedral’s nave were collected with a TESTO 174H data logger [
35]. We adapted the temperature and humidity-monitoring method and the characteristics of the devices from [
36]. Data were registered with a digital thermometer powered by a battery (accuracy: ±0.5 °C in the range of measurement from −20 °C to +70 °C); relative humidity was measured with a capacitive hygrometer (accuracy: ±3% in the range of measurement from 2% to 98%). The technical features of the temperature sensors were in accordance with instrumental metrological characteristics recommended in EN 15758:2011 [
37] (accuracy of 0.5 °C between −20 °C and 60 °C), whereas the accuracy of the relative humidity of capacity sensors were in accordance with the requirement of 3% issued by EN 16242:2012 [
38]. The data were collected every hour. This rate was enough because the variation in temperature during a day was, at most, two degrees. Moreover, an hourly timetable was used to easily compare our measurement results with those provided by EnergyPlus.
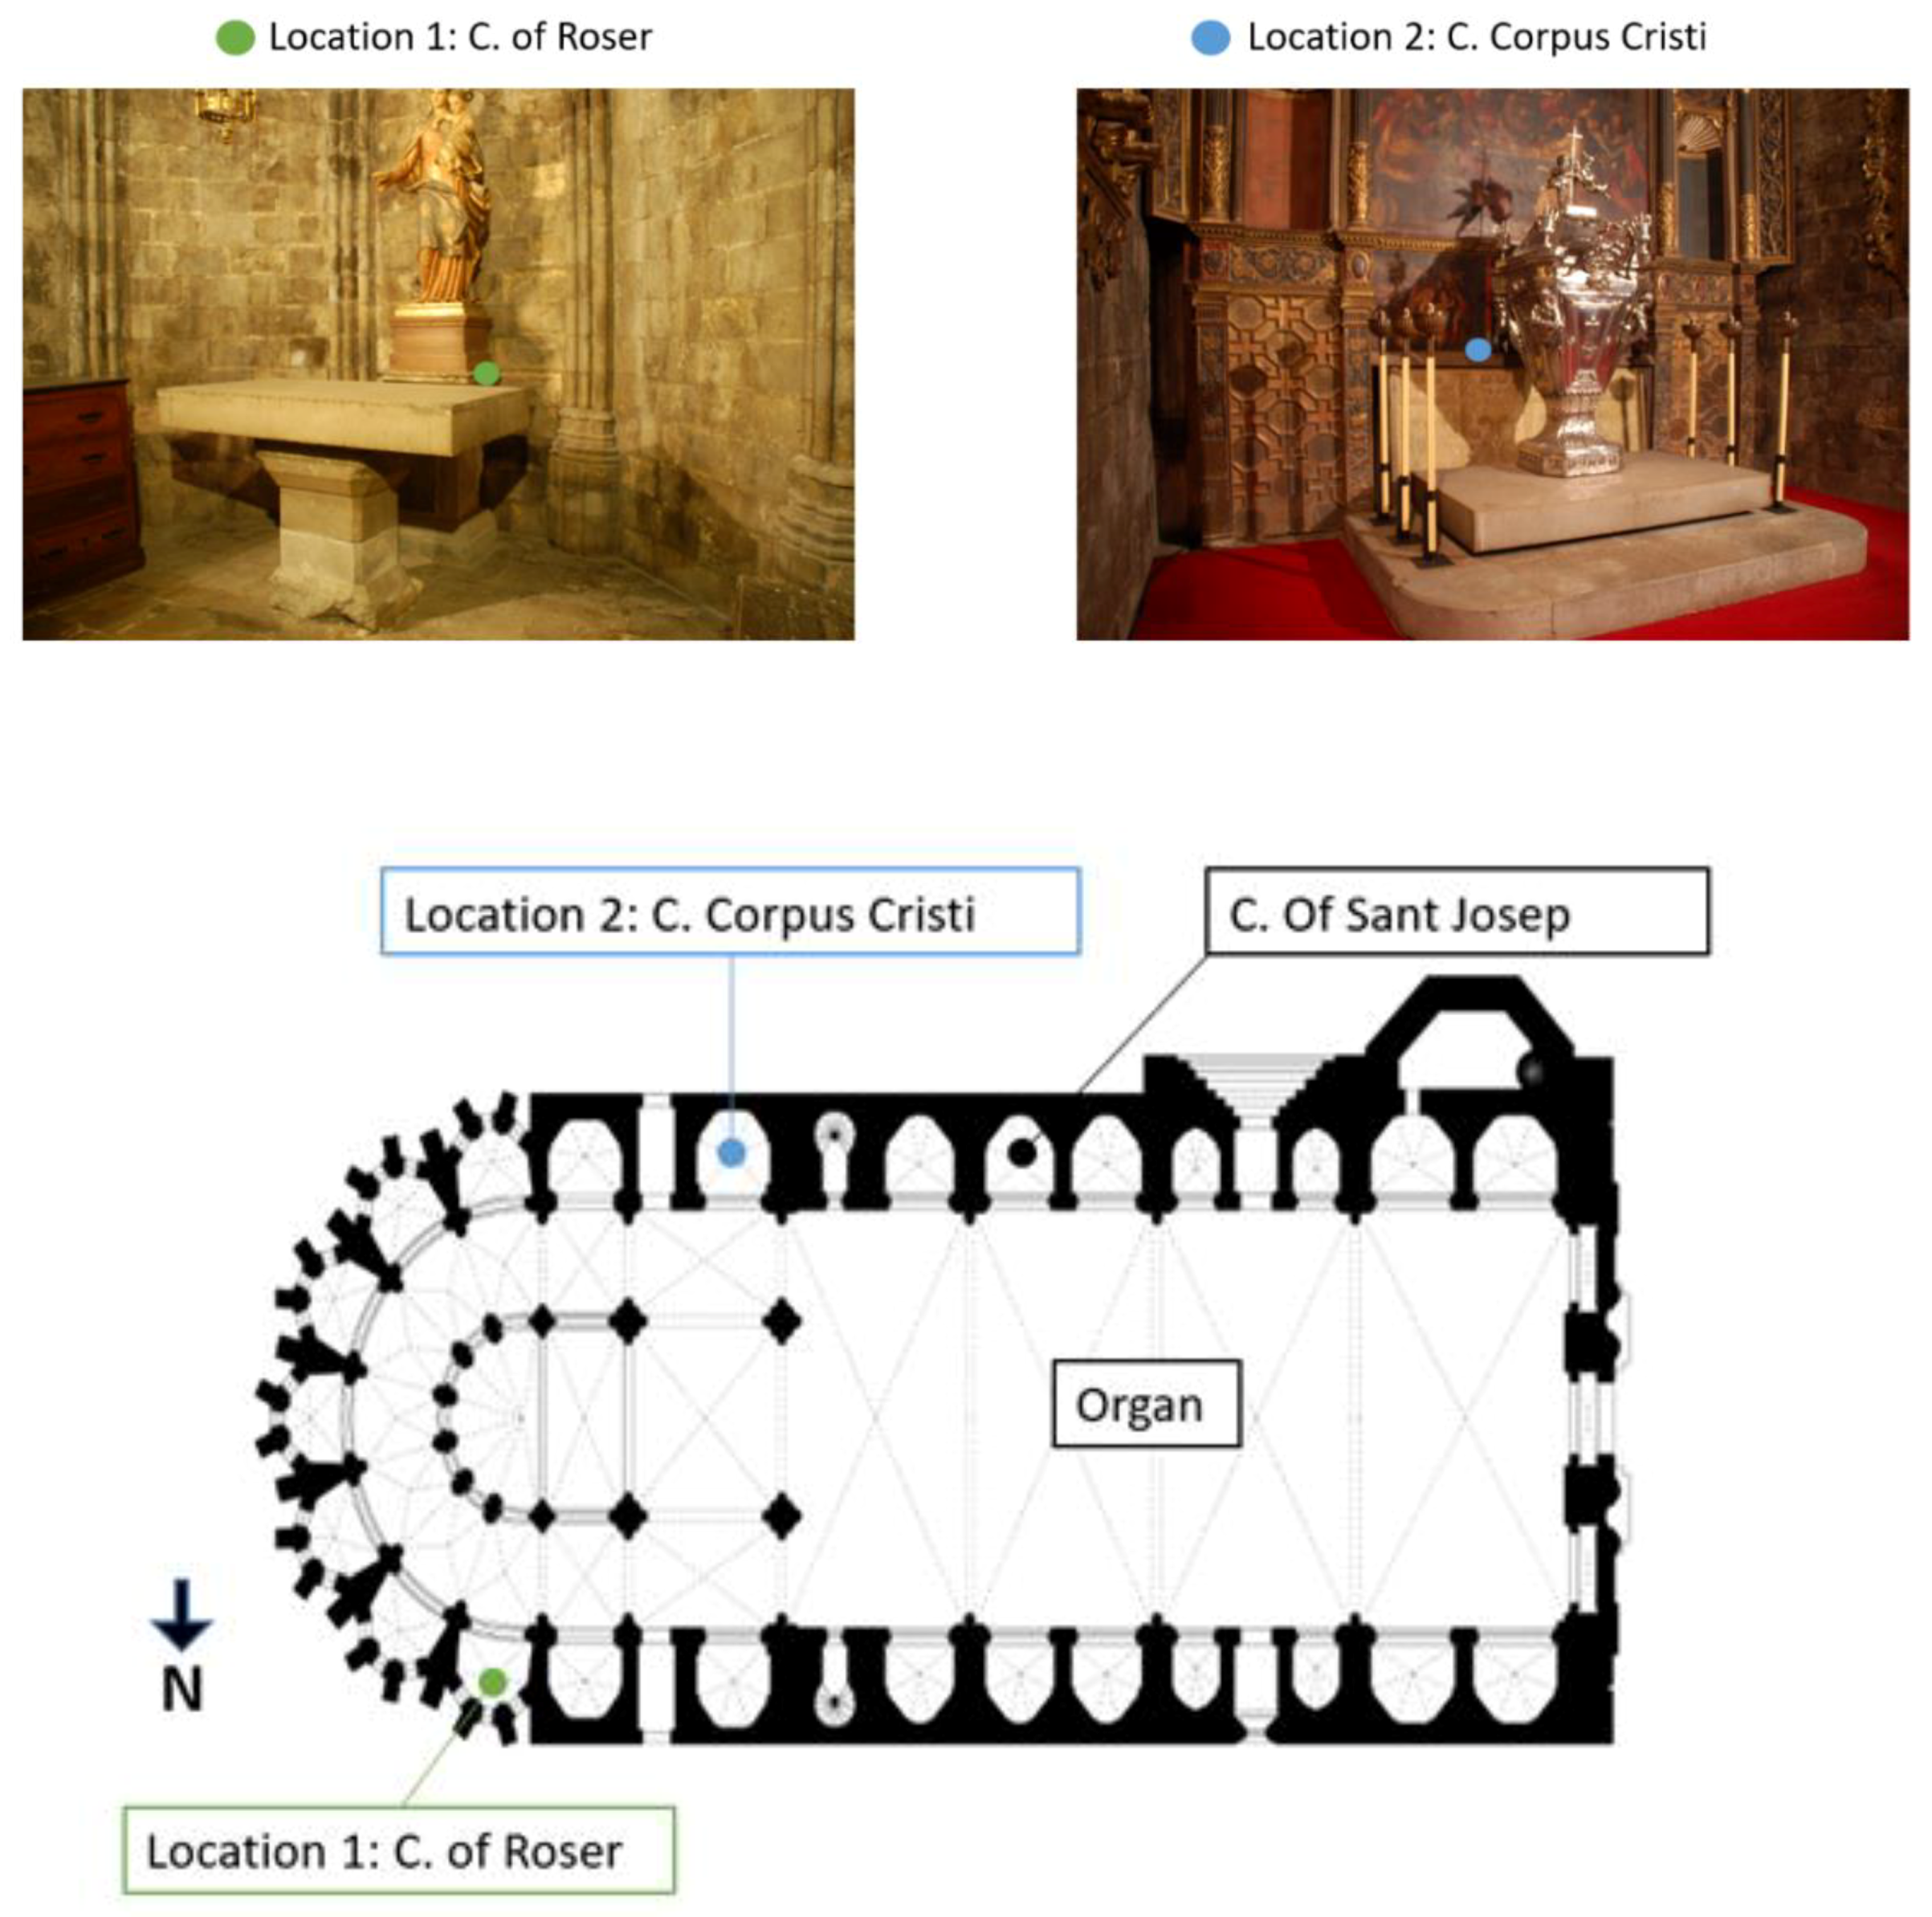
The data logger was installed in the Roser Chapel, which is located just on the north side of the altar, from 2011 to July of 2014, and then was not installed again until March of 2015. In March of 2015, the logger was installed again but in the south in the Corpus Christy Chapel to check for a change in the behavior of temperature curves. This implies that data were collected for the period of 2011–2016, except for the periods of the second semester of 2014 and January of 2015 due to a problem with the batteries of the data logger.
Figure 14 shows the position of probes in the monitoring campaign.
Before validating this probe, a small study was performed with two more probes simultaneously located in different zones of the nave in order to ensure that there could not be different behaviors. One was located in the center of the cathedral, where the organ was located, and the other was located in the chapel of Saint Josep on the opposite side. There were no substantial differences. The values obtained were very close: Less than half a degree of temperature difference and a maximum of 2% difference in relative humidity.
4.9. Data Processing
The outdoor temperature, relative humidity, and solar-radiation data of the Girona weather station were used for each year and hour, as well as the indoor temperature and relative humidity collected by the installed data logger. Theoretical indoor temperature was obtained from the EnergyPlus model simulation.
These are the series of data that were studied and compared. In order to facilitate the analysis of such a large amount of data, we worked with hourly data, as well as monthly and daily averages. This discrimination led to a better analysis of the results.
5. Results and Discussion
5.1. Comparison between Outdoor and Real Indoor Temperatures
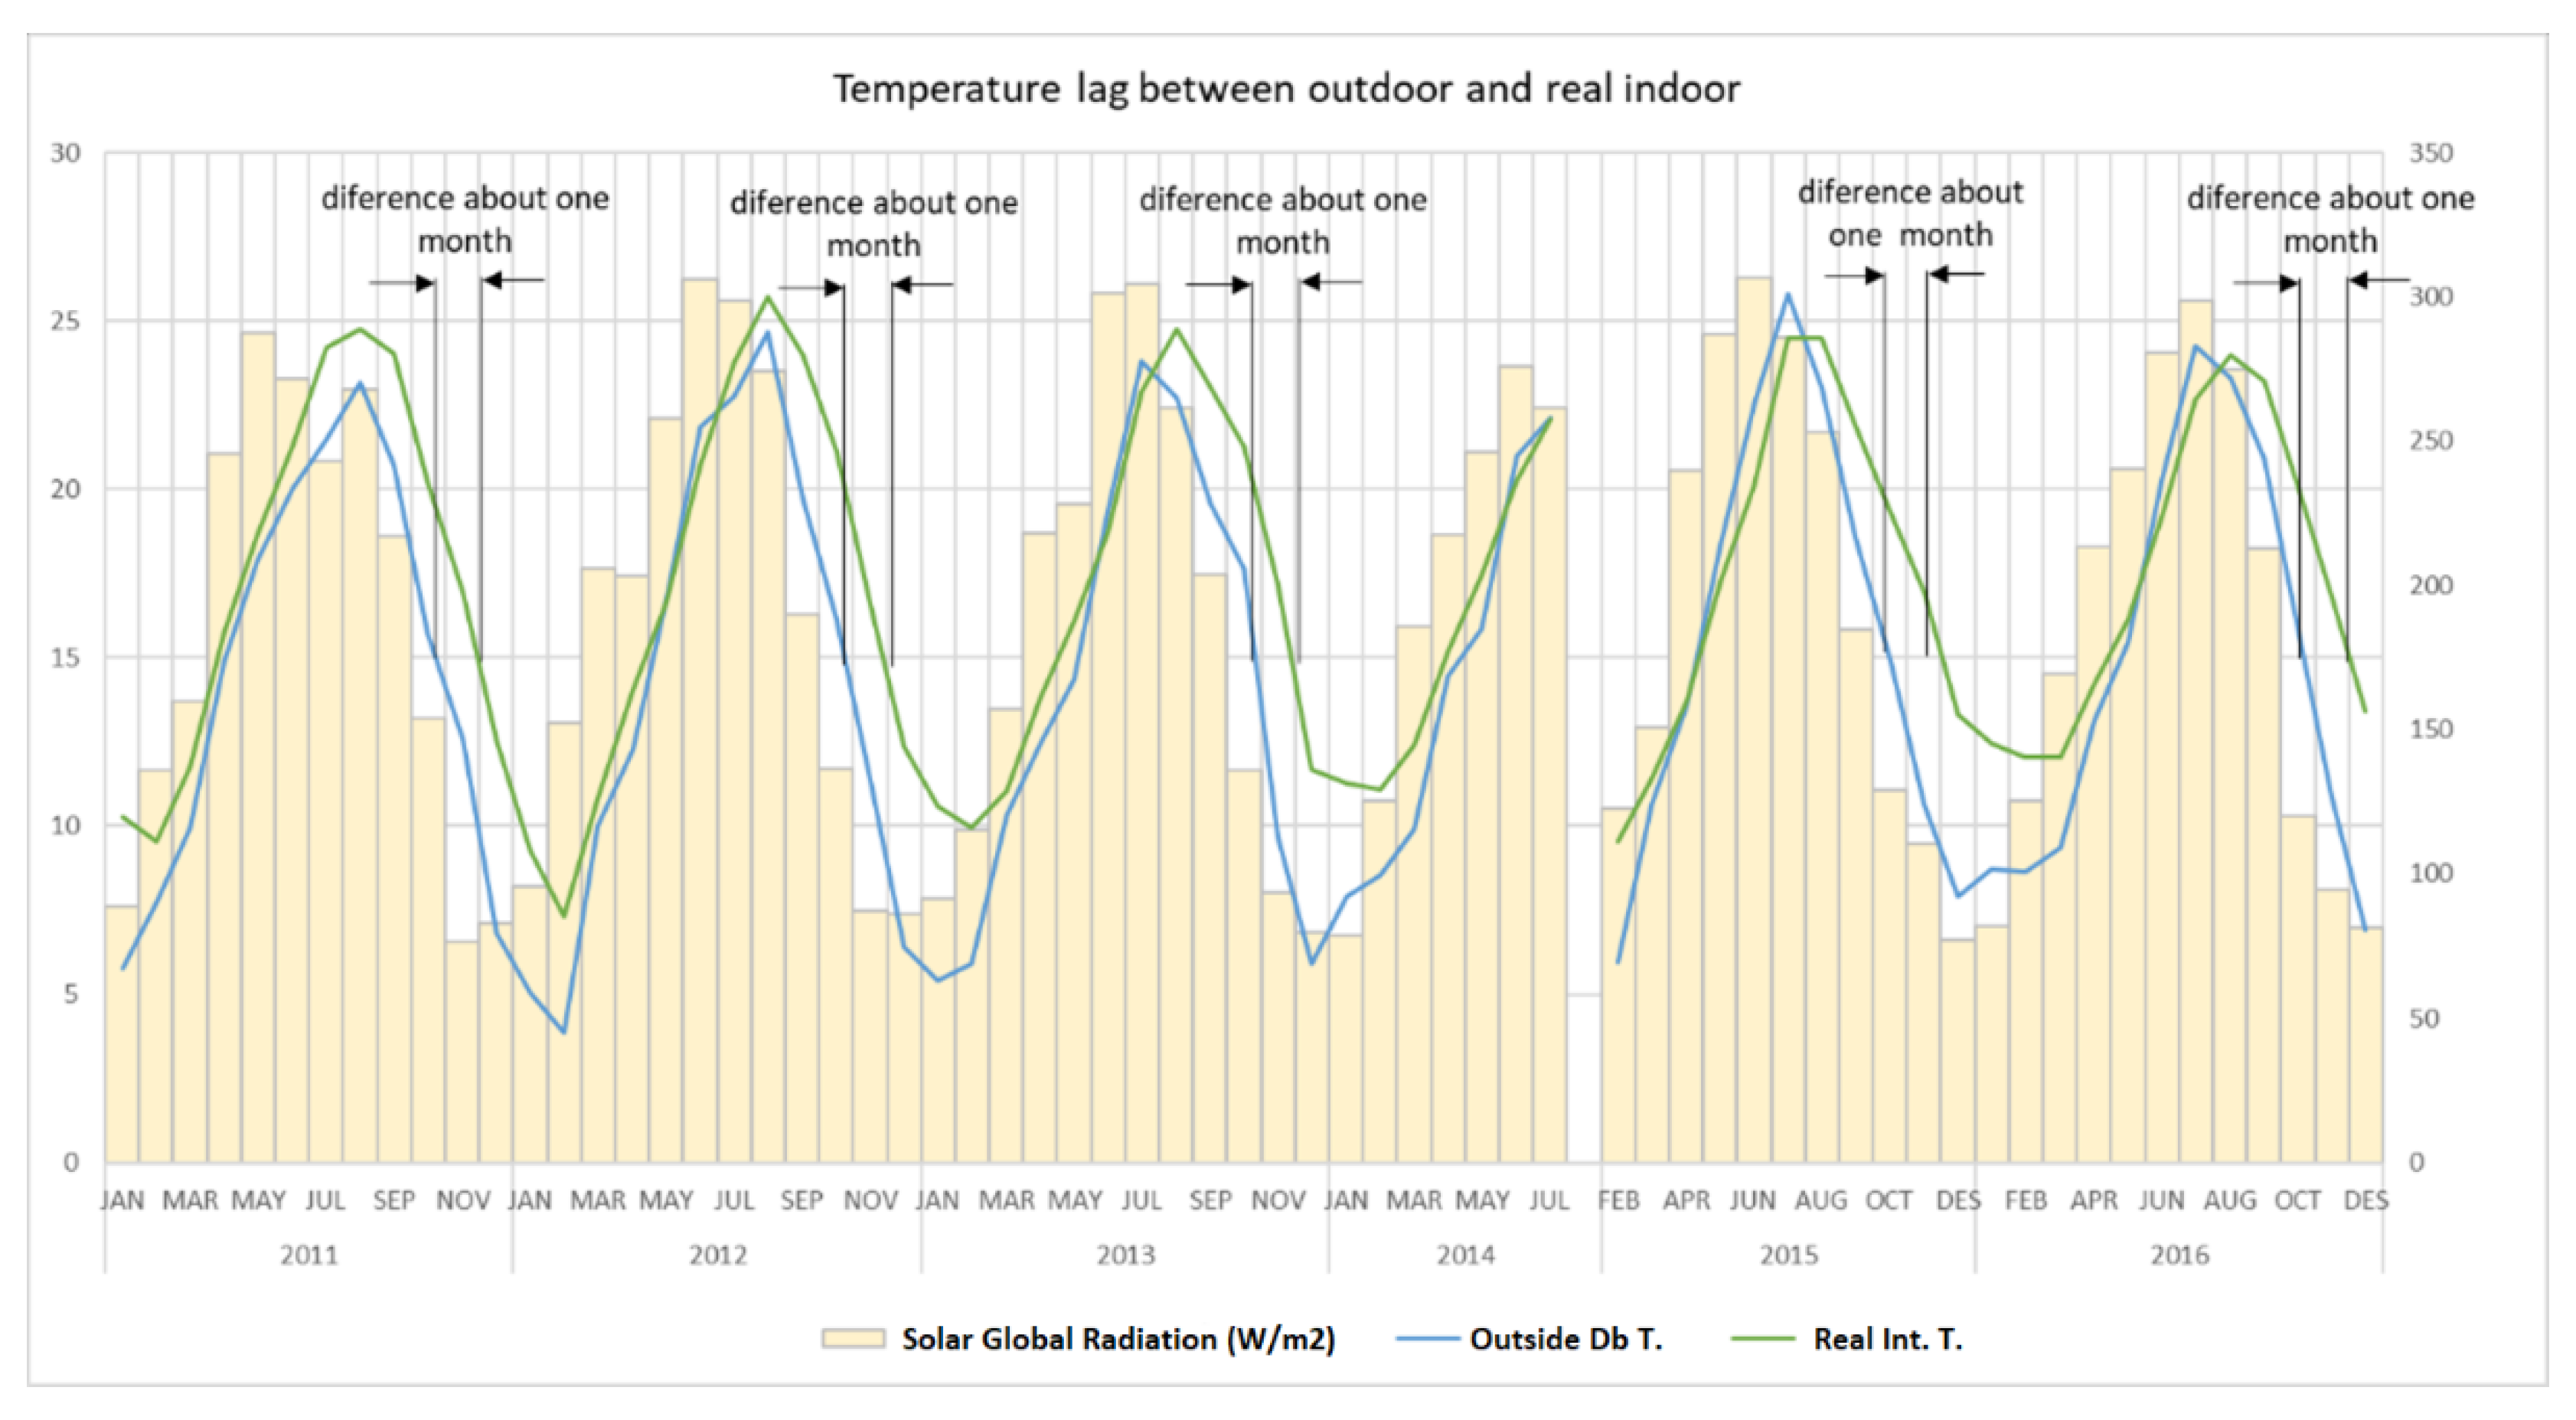
Comparing the outdoor temperatures with the indoor temperatures recorded by the indoor data logger, we see similar curves.
Due to the high heat capacity, it is reasonable to think that there is a lag between the average indoor and outdoor temperatures and that it is constant throughout the year.
In this case, we found that there is a one-month lag. However, this lag is only observed during the months of August until January and not throughout the year.
Figure 15 and
Table 6 show these conclusions.
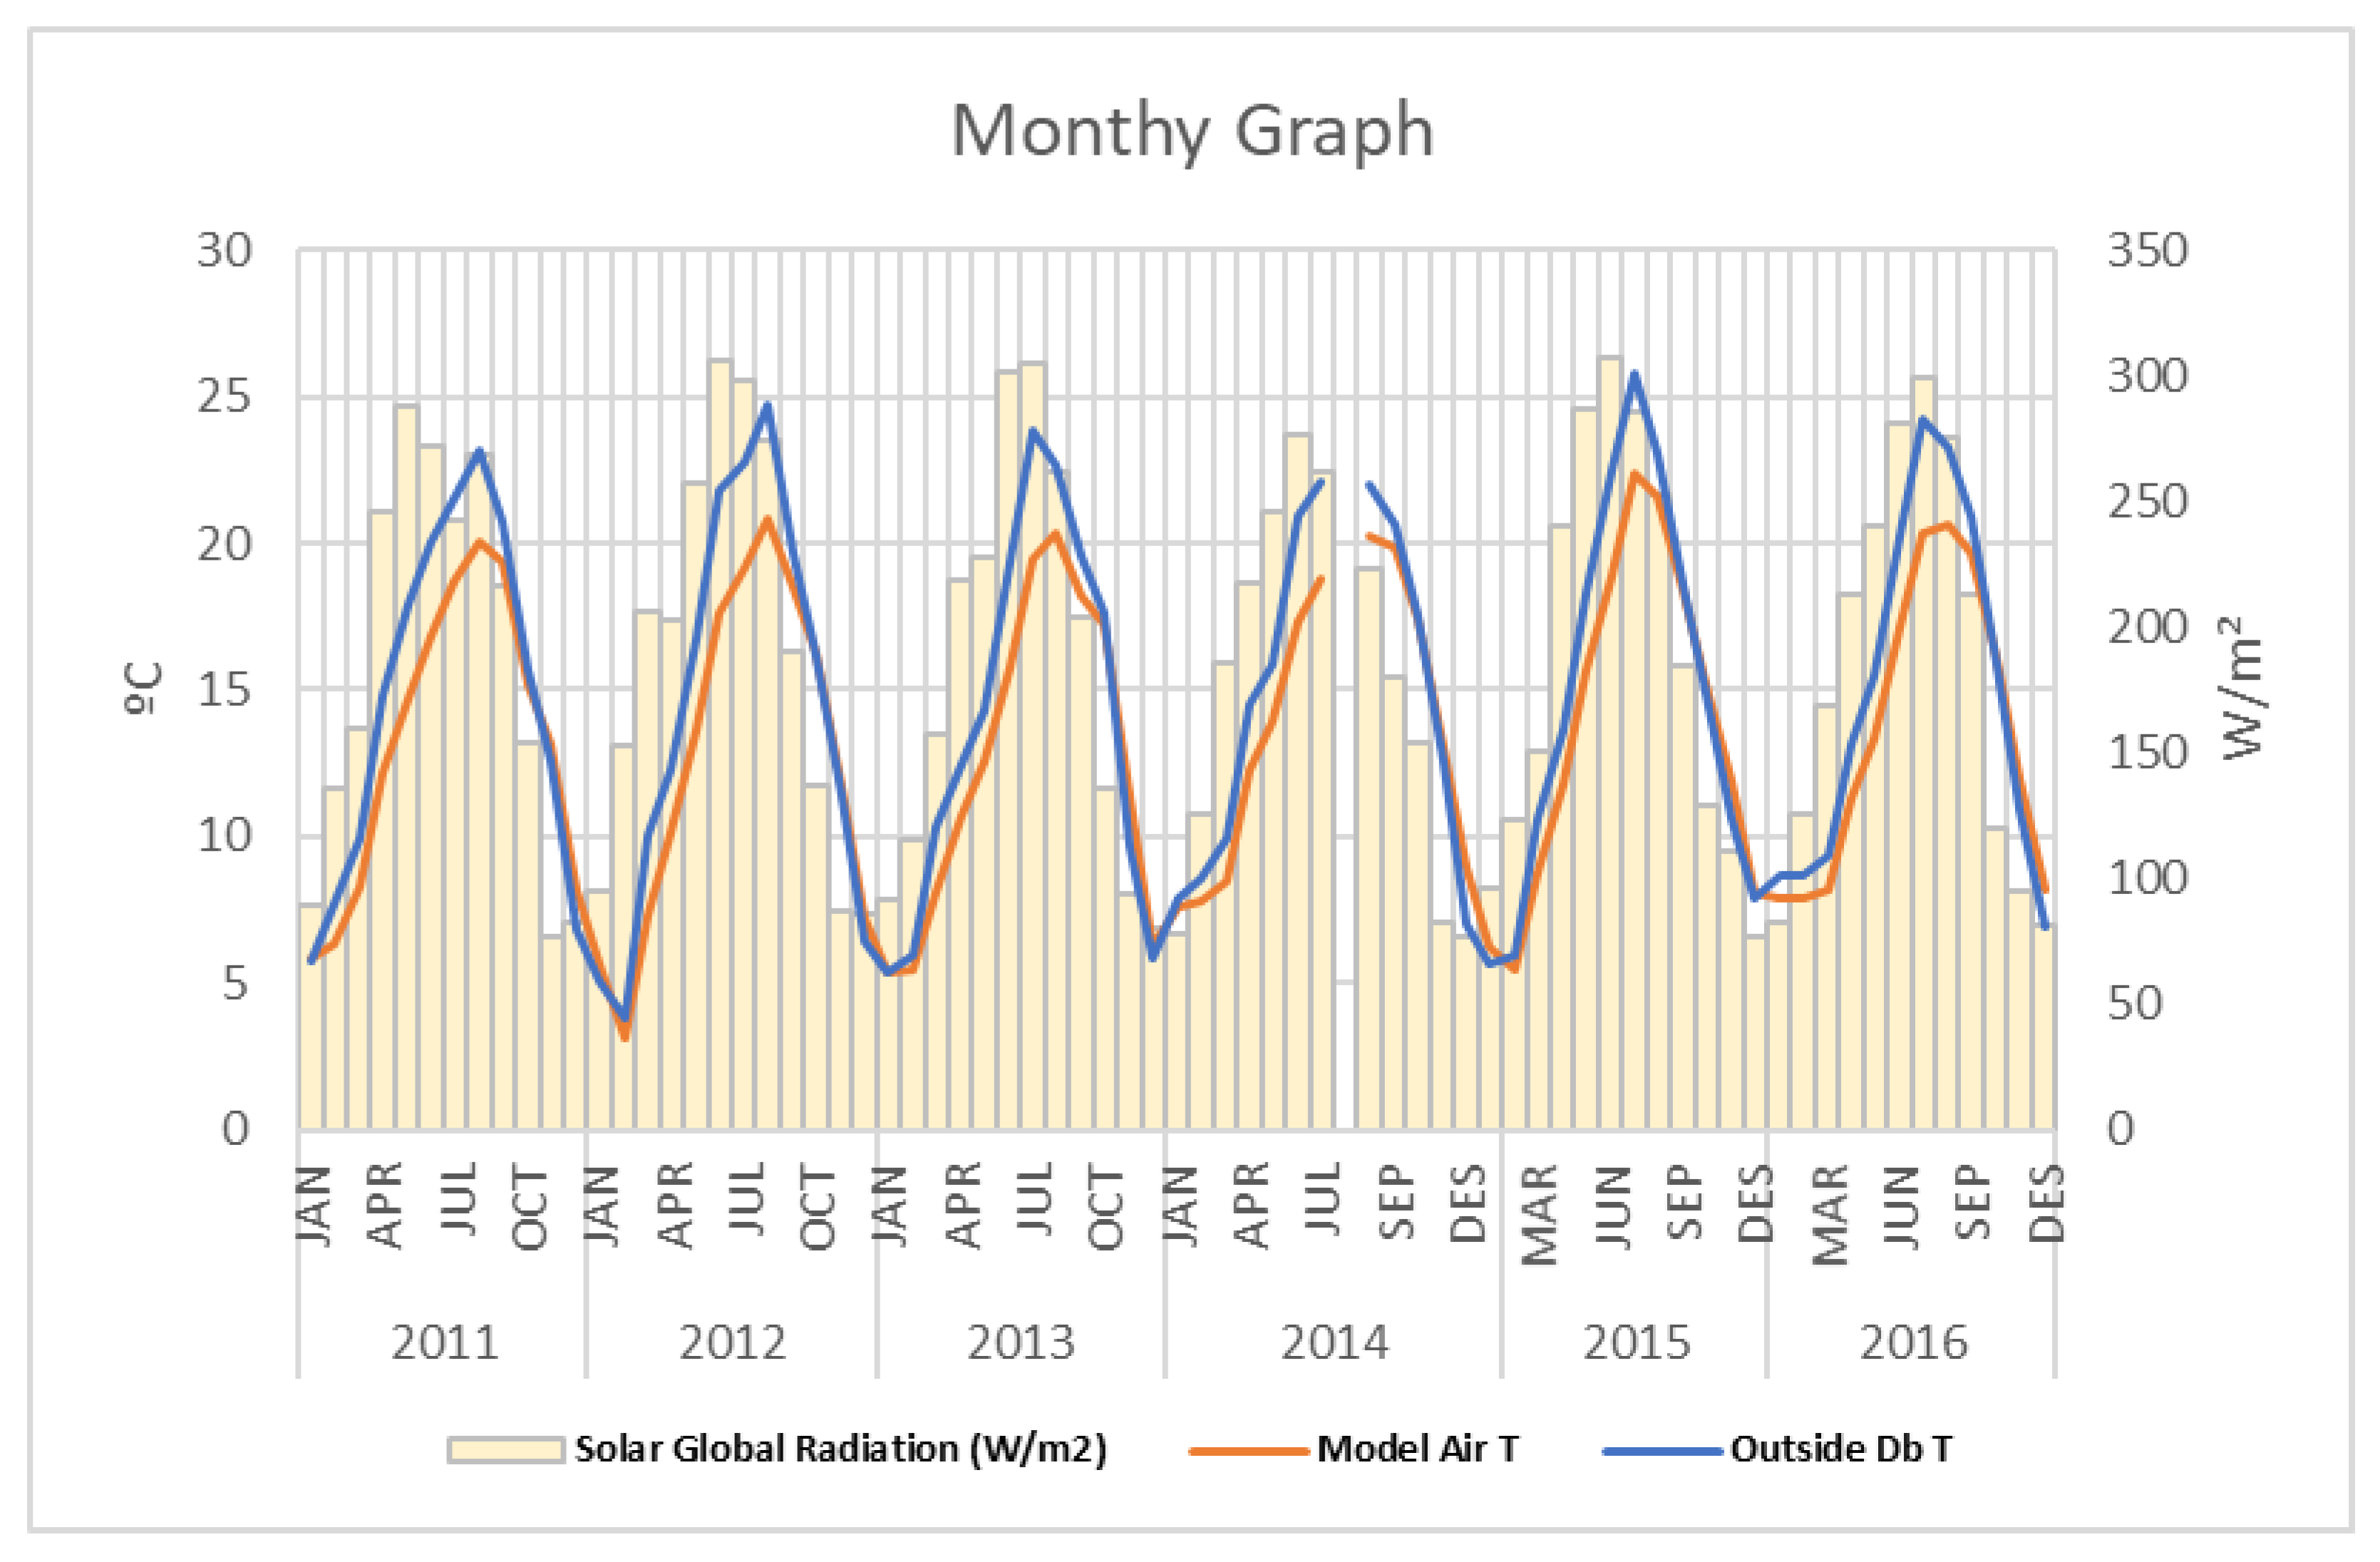
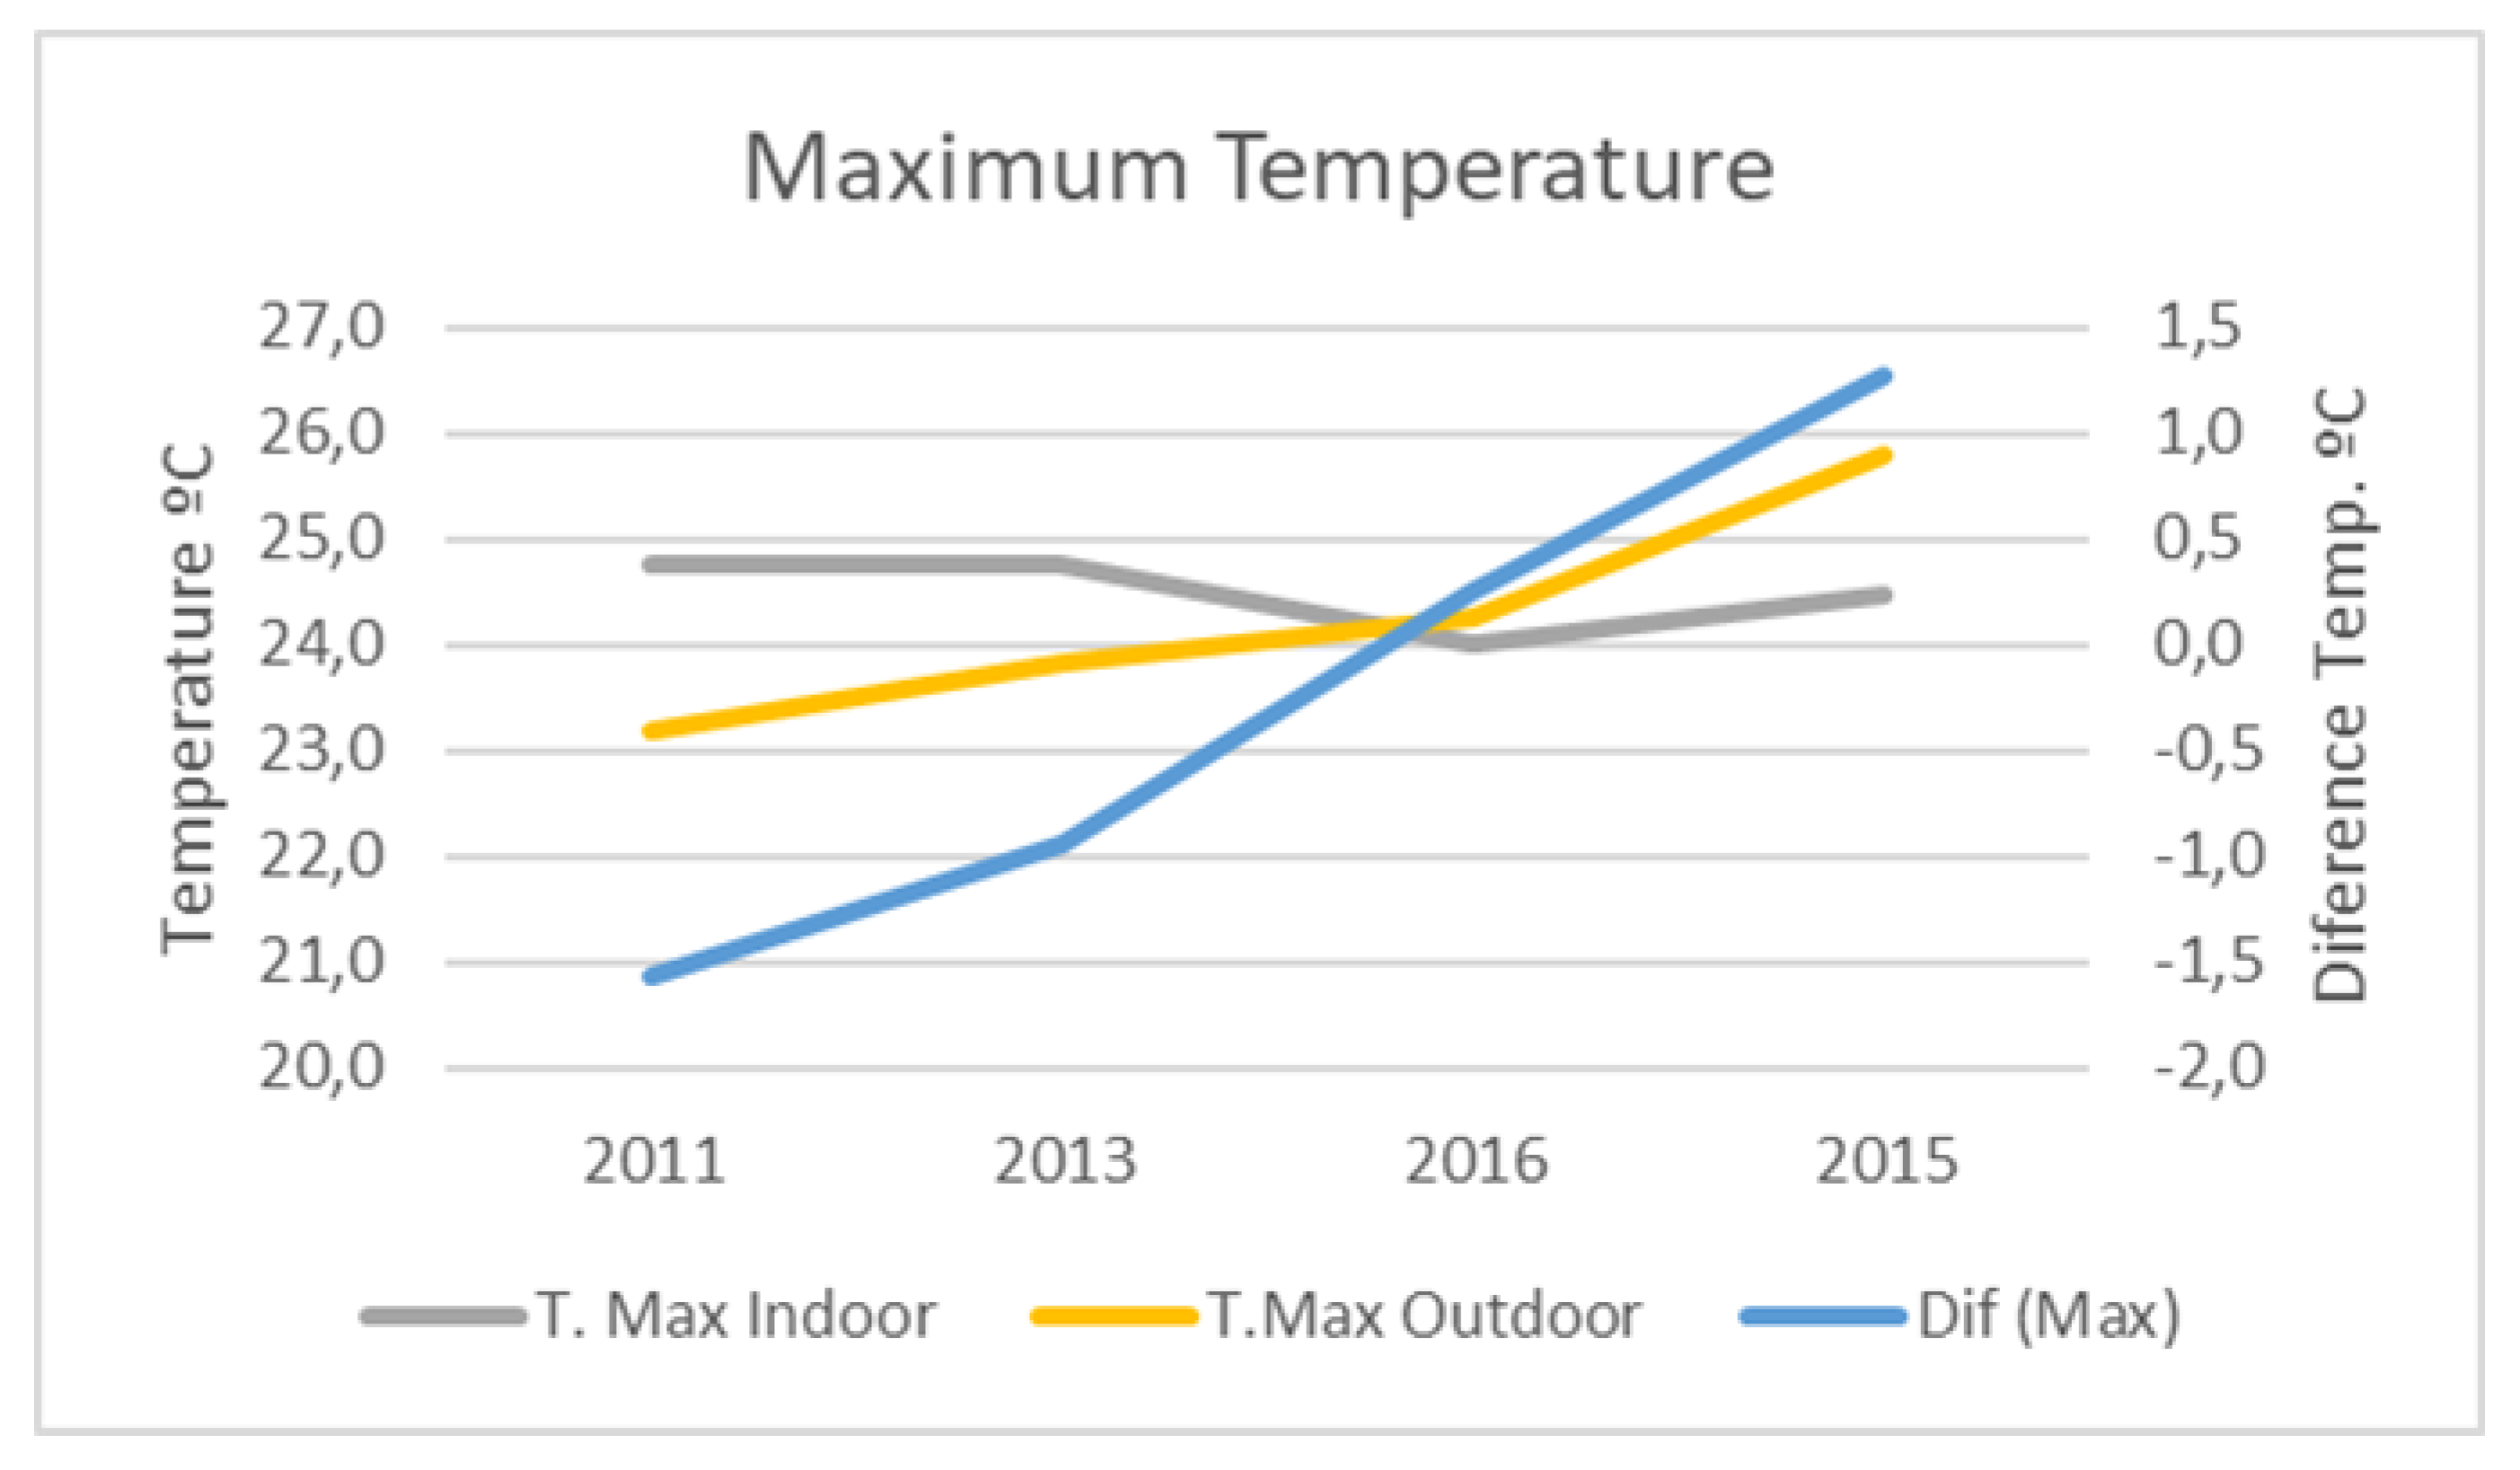
Temperature curves are very close in the summer peaks, while the average indoor temperature in winter is always 4–5 degrees above the average outdoor temperature.
In summer, the interior temperature of the Cathedral remains around 24–25 °C (
Figure 16), although the exterior temperature varied above or below.
Figure 12 shows the years sorted by the maximum outside temperature to more clearly illustrate this behavior.
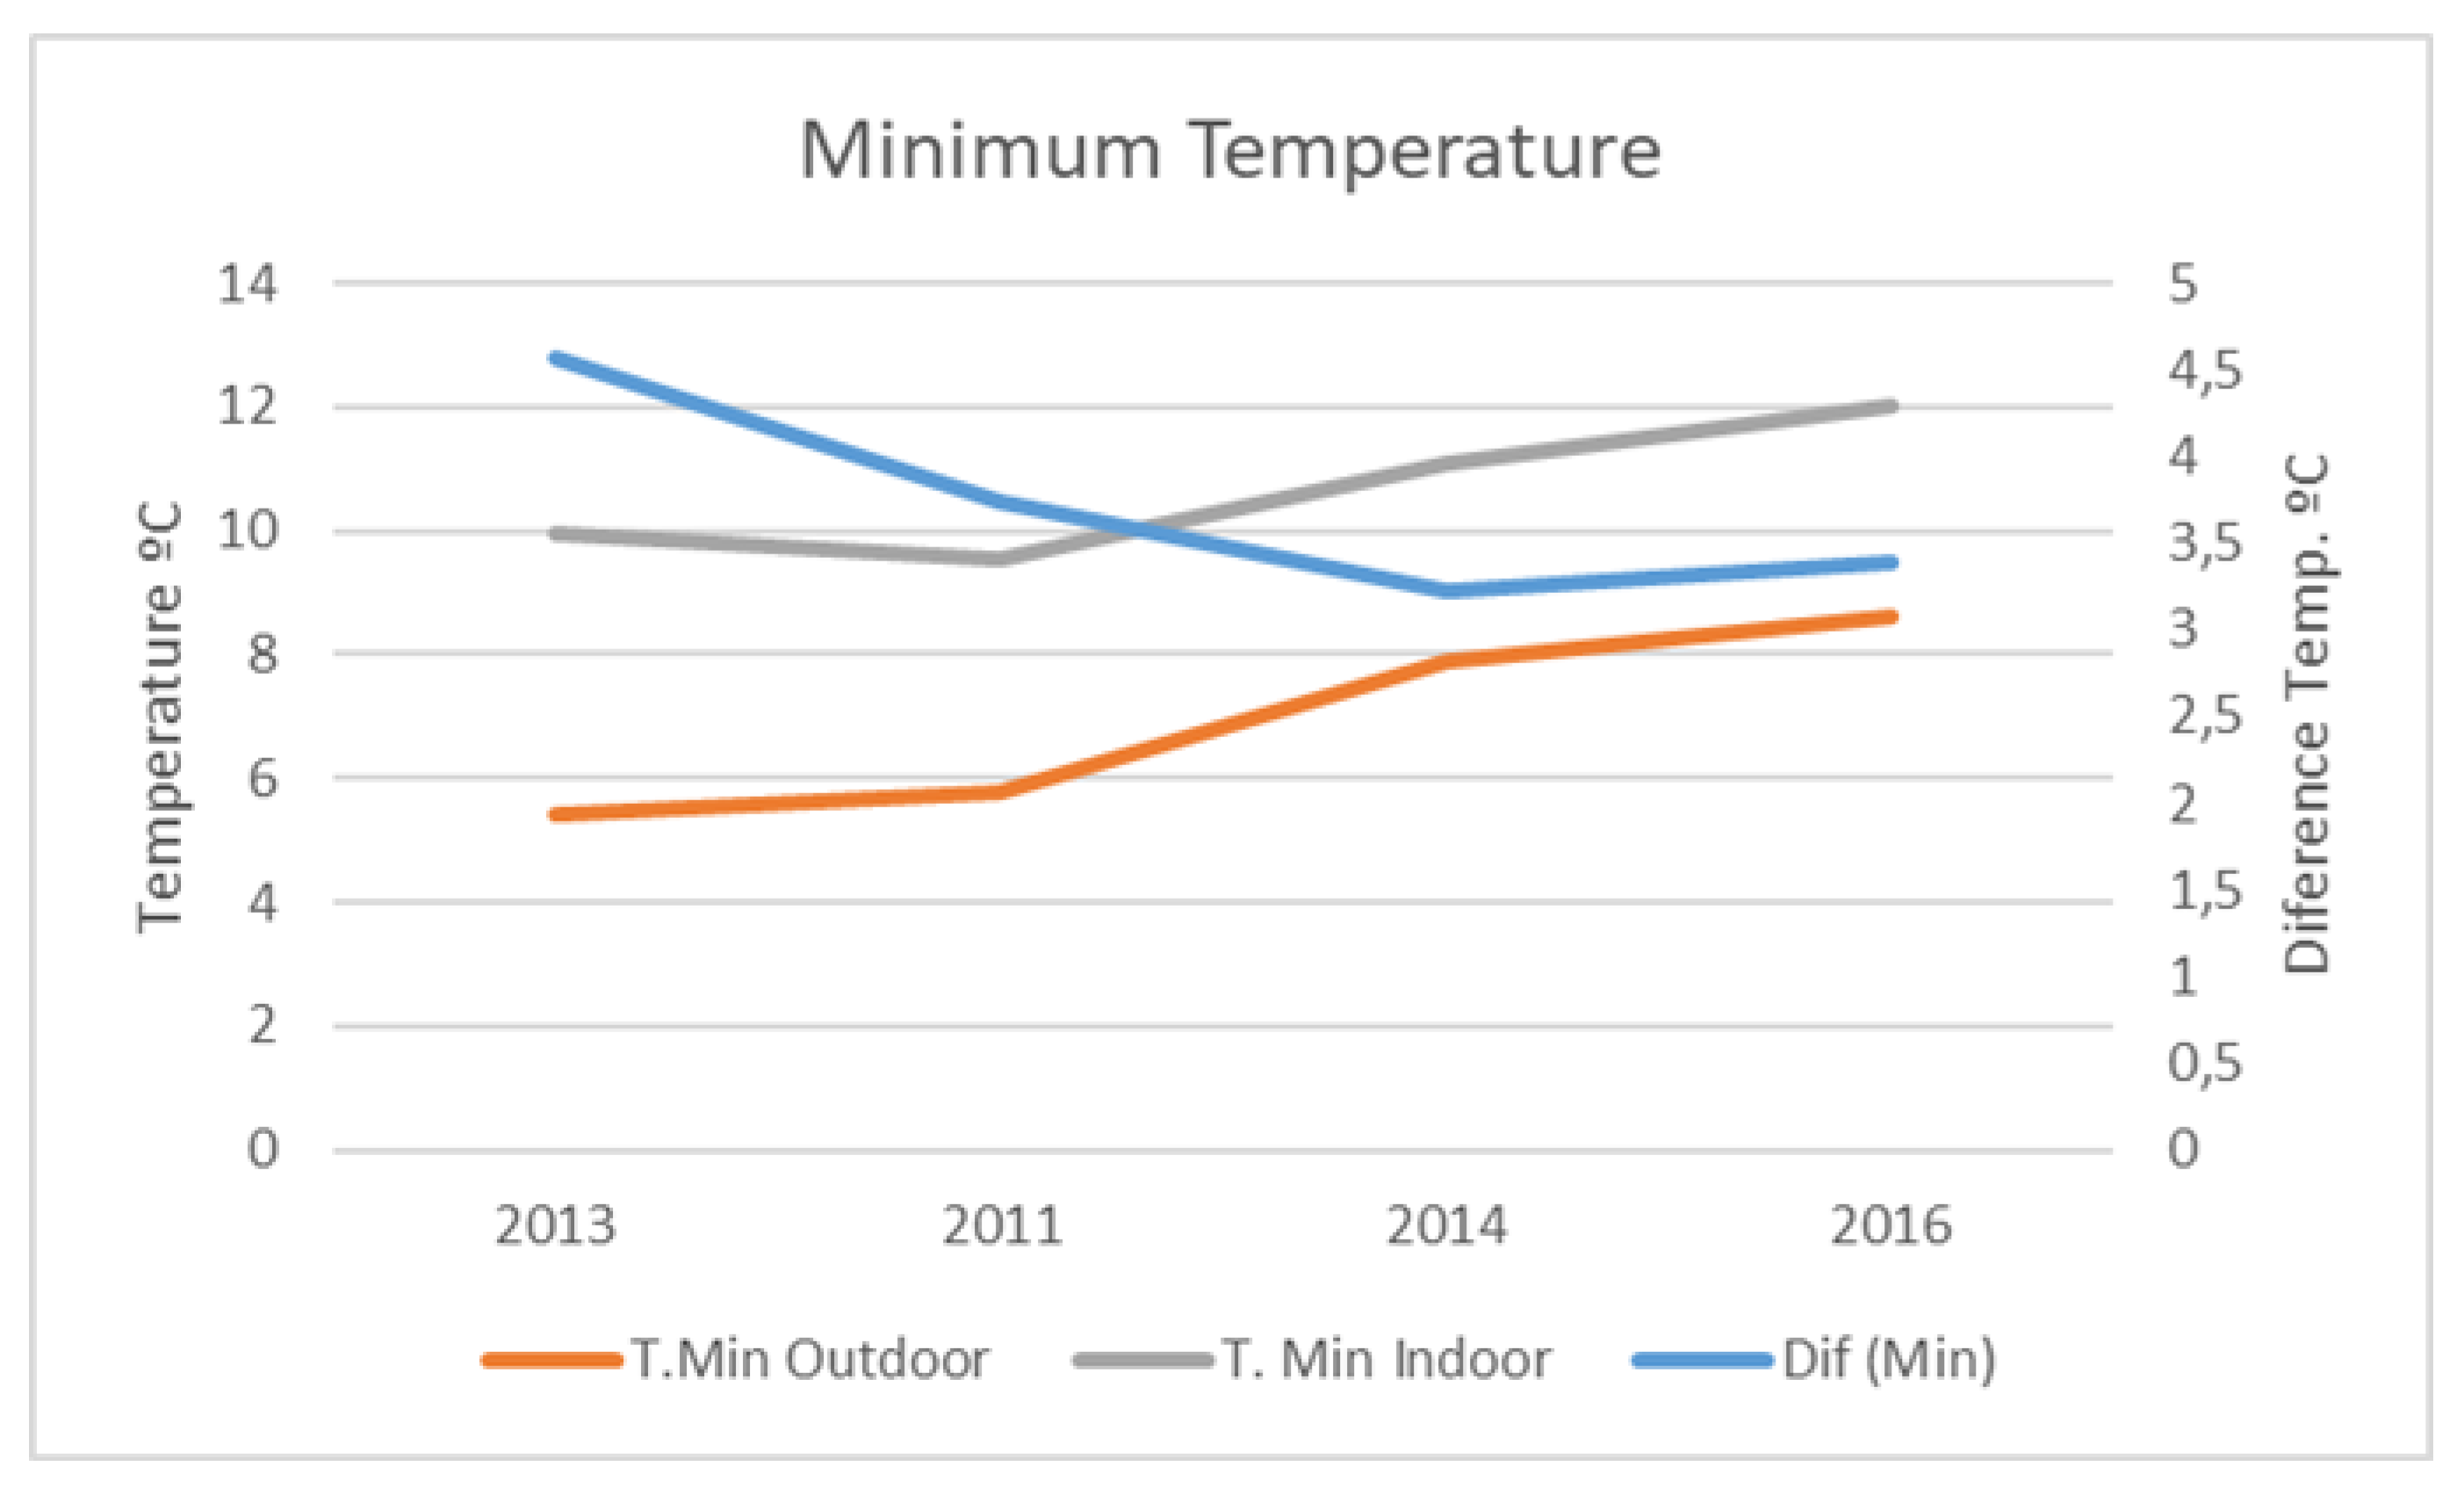
During winter, the indoor temperature is always higher than the outdoor temperature. The lower the outdoor temperature, the greater the difference between the indoor and outdoor temperature (
Figure 17).
This behavior is explained by the fact that the envelope can store a large amount of heat and slowly release it. However, regarding the rapid recovery of temperatures during the spring, there are two explanations. On the one hand, the minimum indoor temperature is always above the average outdoor temperature, making the starting point for recovery of the indoor temperature higher. On the other hand, there is also the effect of the heat capacity of the floor, the walls, and the greater solar radiation of this period.
5.2. Comparison between Outdoor and Model Temperatures
Figure 18 shows that the real temperatures, in the first period of the year, are similar, whereas the last period presents more differences. This is the opposite of what happens with the real and outside temperatures.
5.3. Hourly Real Interior Relativity Humidity
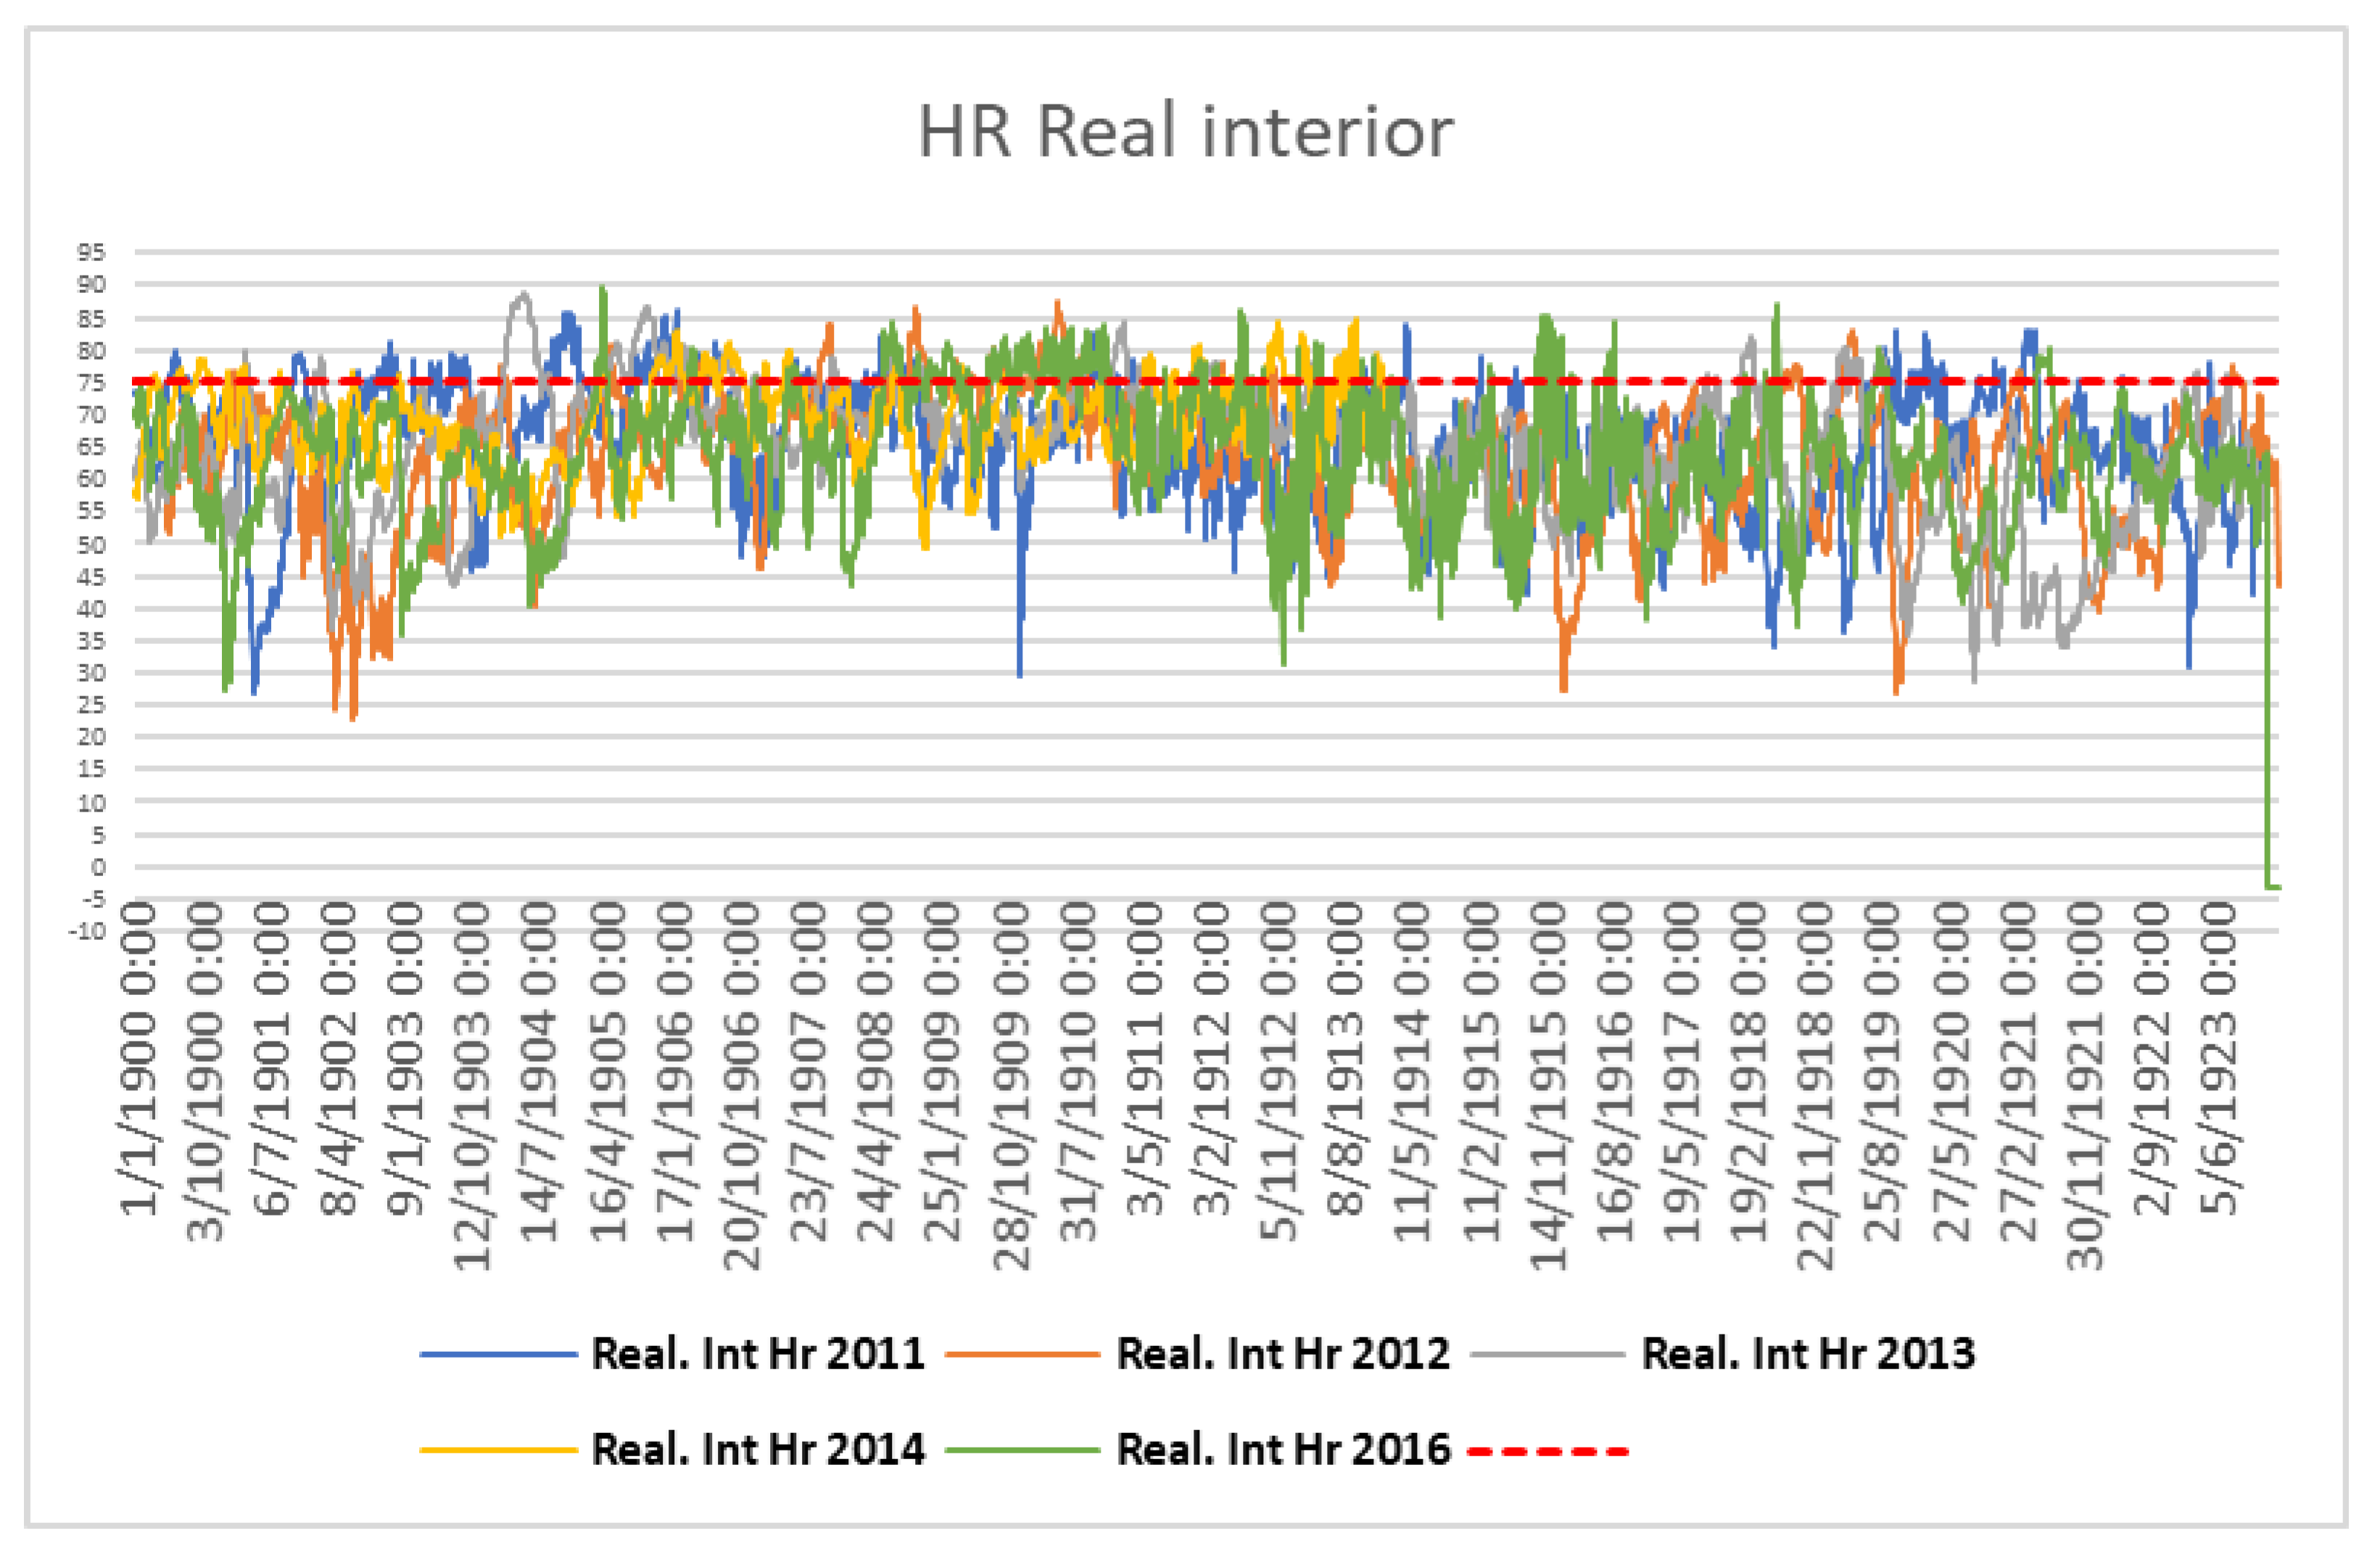
Most of the time, the relative humidity is below 75%, as can be seen in
Figure 19, which is considered the maximum threshold to ensure the conservation of pieces of art. One of the effects that occurs when relative humidity is above these values is the proliferation of mold; to occur, this moisture must persist for a certain period (see
Figure 19).
In this case, these values are not exceeded, (more than 100 days above 70% or 10 days above 80%)
Table 7 as shown in
Figure 19. It should be noted that these increases are punctual, which does not favor the proliferation of mold. Therefore, the Cathedral is favorable environment to contain pieces of art.
5.4. Annual Building Behavior: Real Data vs. Theoretical Model
In
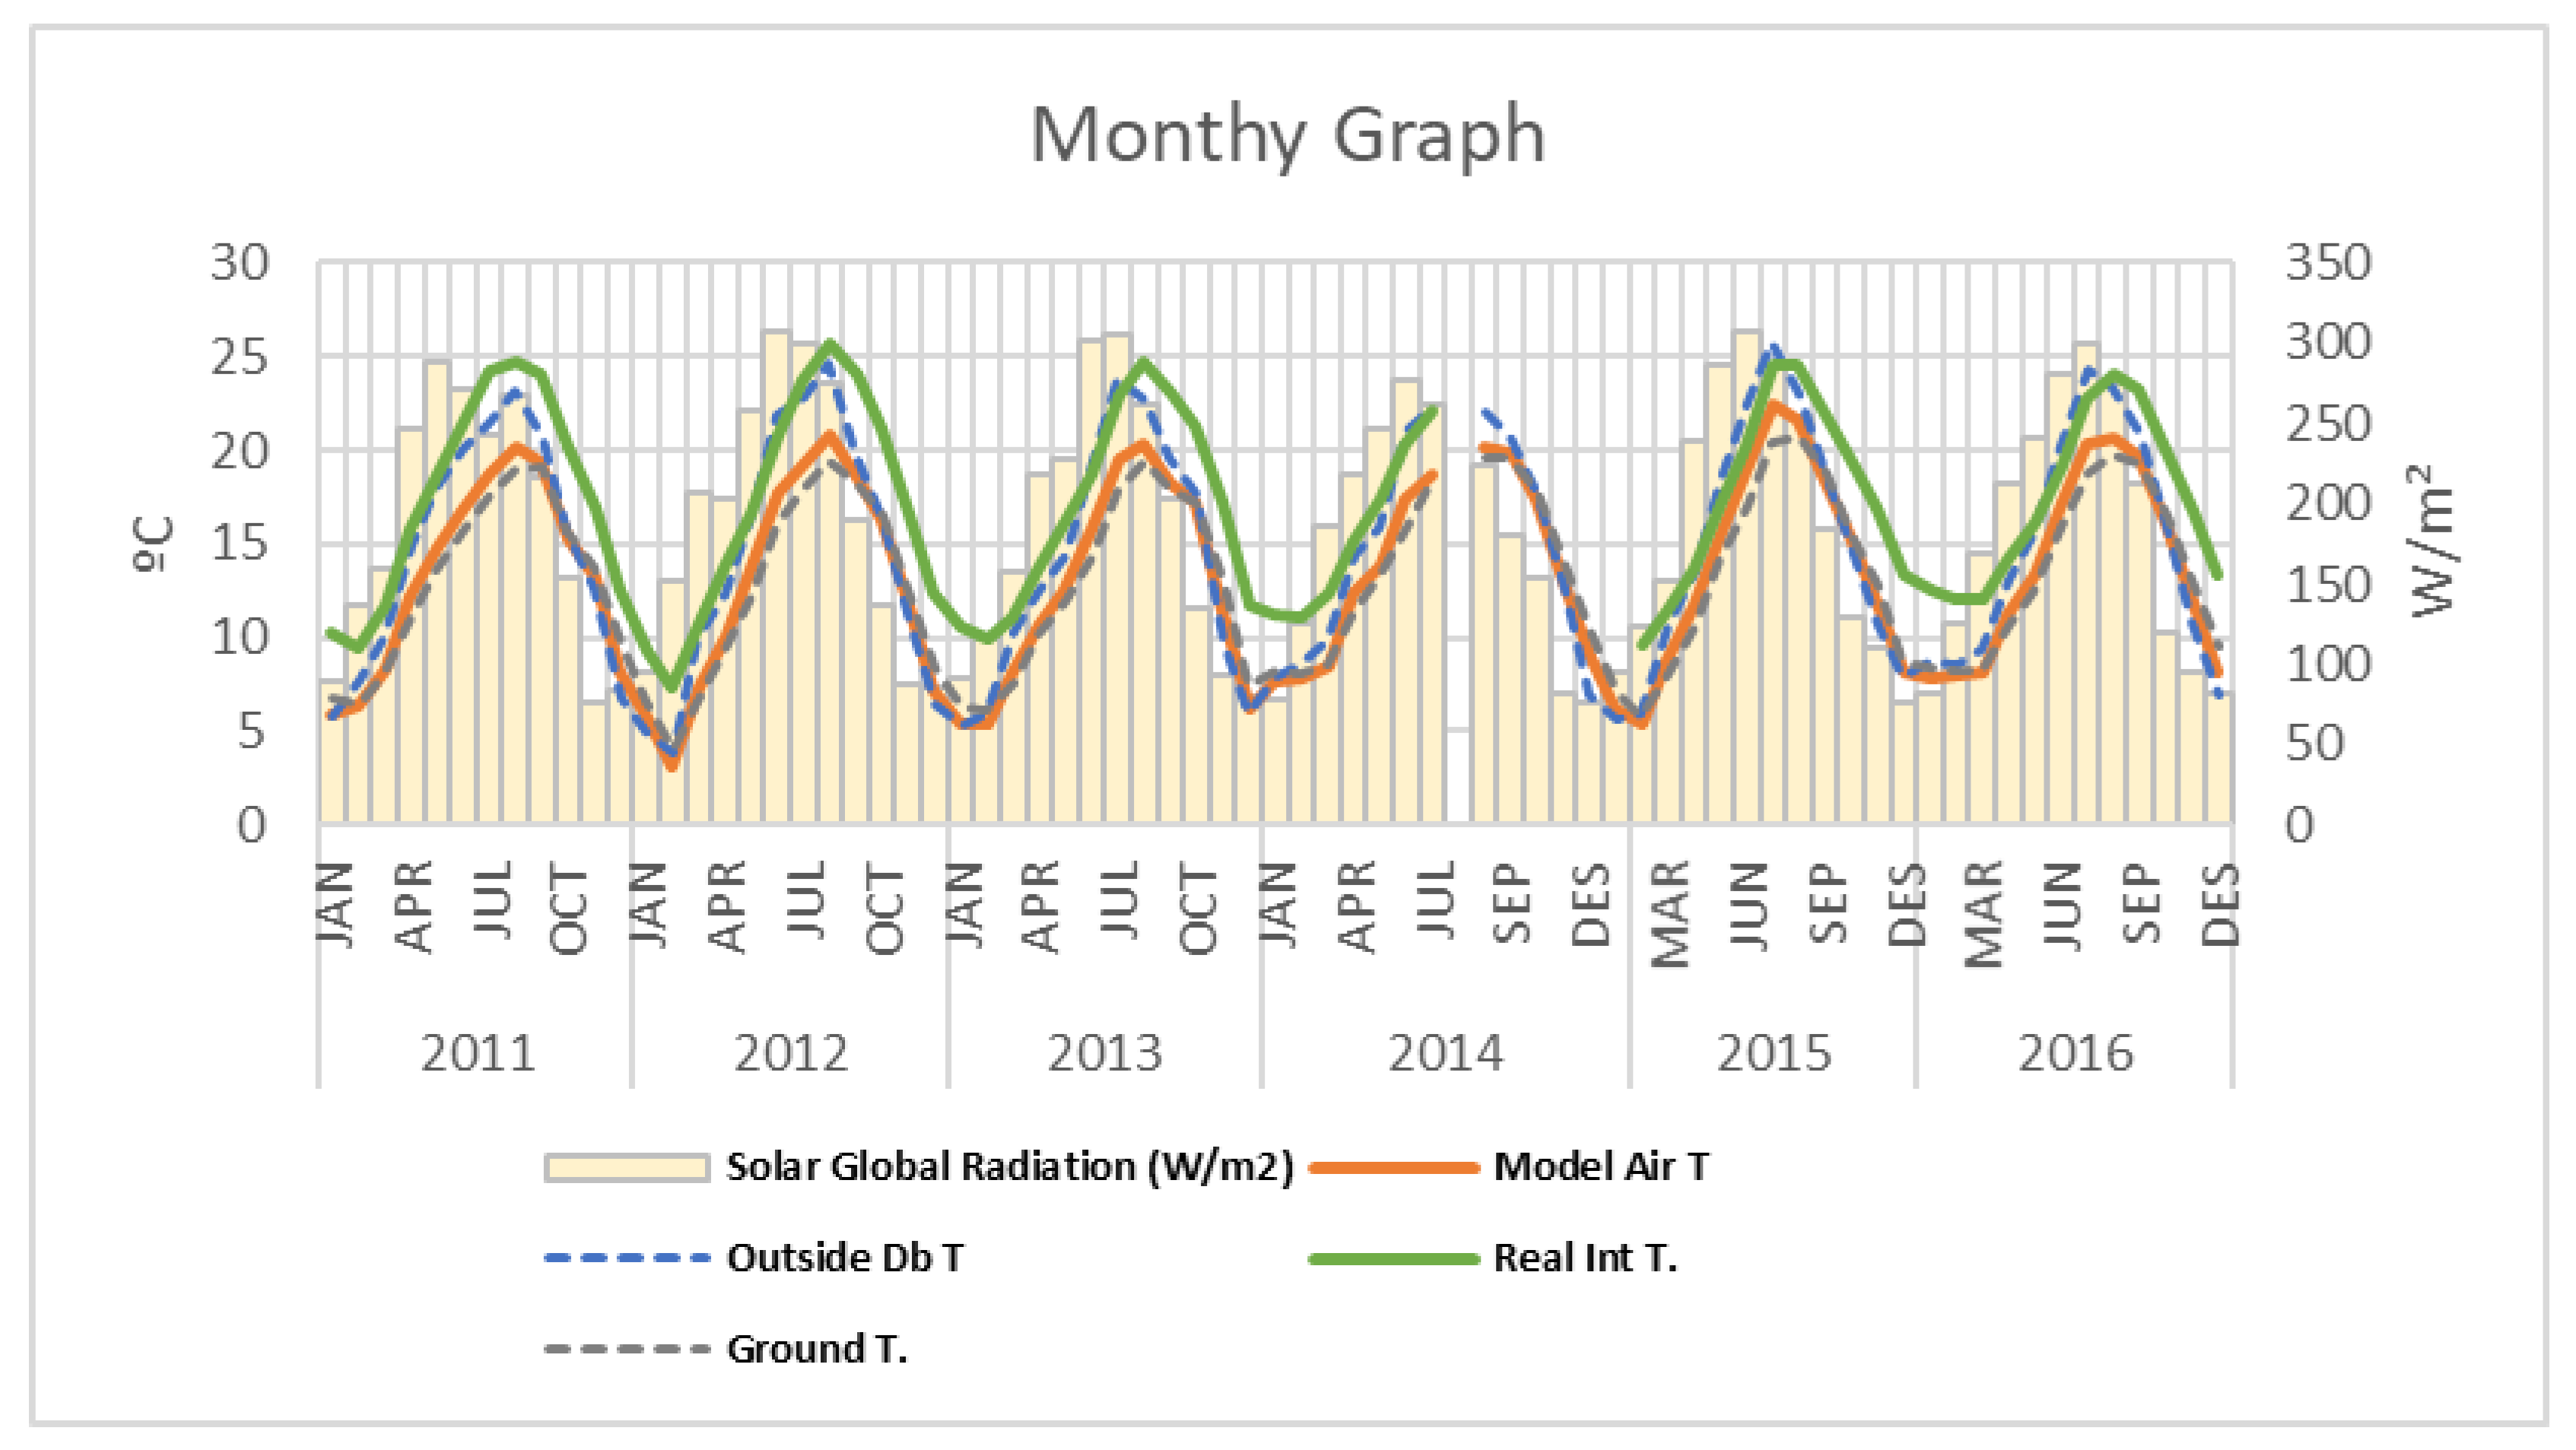
Figure 20, the real temperature and model air temperature are parallel, but the model temperature is between 3 and 5 degrees lower than the real temperature every month.
The model temperature is very close to the ground temperature, which could have an important influence on the model calculation.
5.5. Daily Variation between Indoor and Outdoor Temperature and Relative Humidity
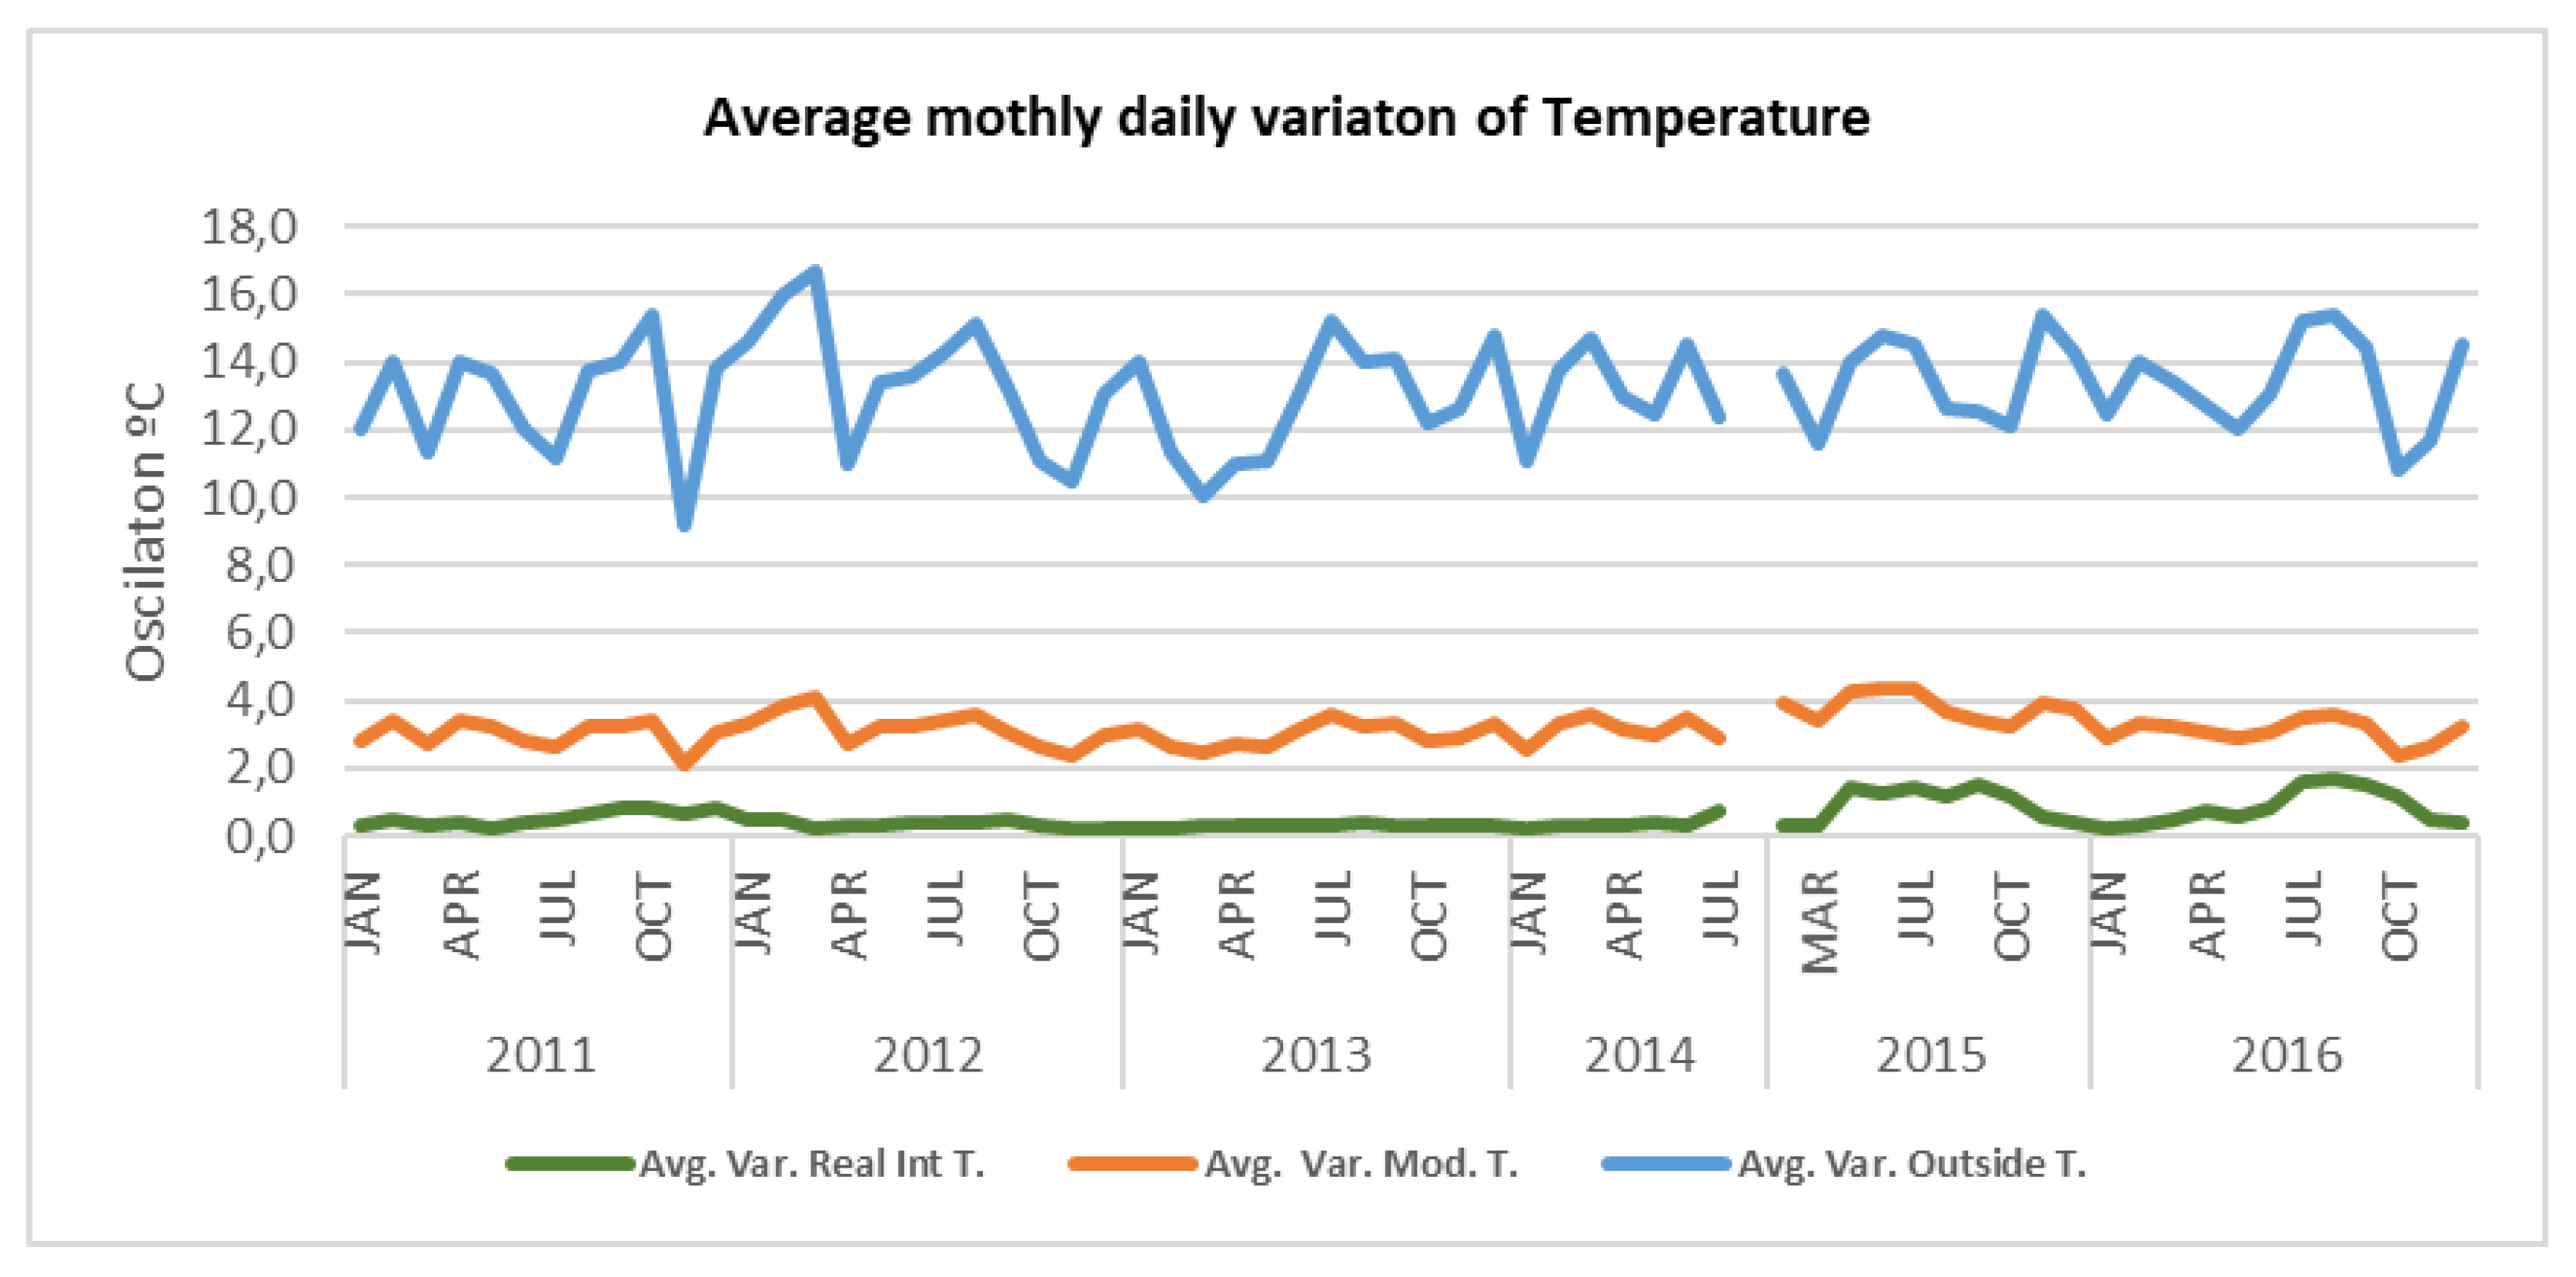
Daily temperature variation is the difference between the maximum and minimum temperatures throughout a day. Daily oscillations are attributed to ventilation or the entry of solar radiation through openings.
The high heat capacity of the building results in very few fluctuations inside. Whereas the average outer oscillation is 13 °C with peaks of 16–17 °C, the average oscillation of the real indoor temperatures is 0.5 °C, and the model’s air temperature is 3 °C.
Figure 21 shows the average monthly daily variation in the outdoor temperature, as well as the real and theoretical indoor temperature.
In
Figure 21, a difference of oscillation can be observed between real temperature and modeled temperature for the period of 2011–2014 and the period of 2015–2016, especially in the summer months. The average of the first period (2011–2014) is 0.4 °C, and that of the second period (2015–2016) is 0.9 °C, a difference of only 0.5 °C. This could be the result of the currents of air that occur when the side door of the chapel is opened. Behind the chapel is a small room with an exterior window that is sometimes opened.
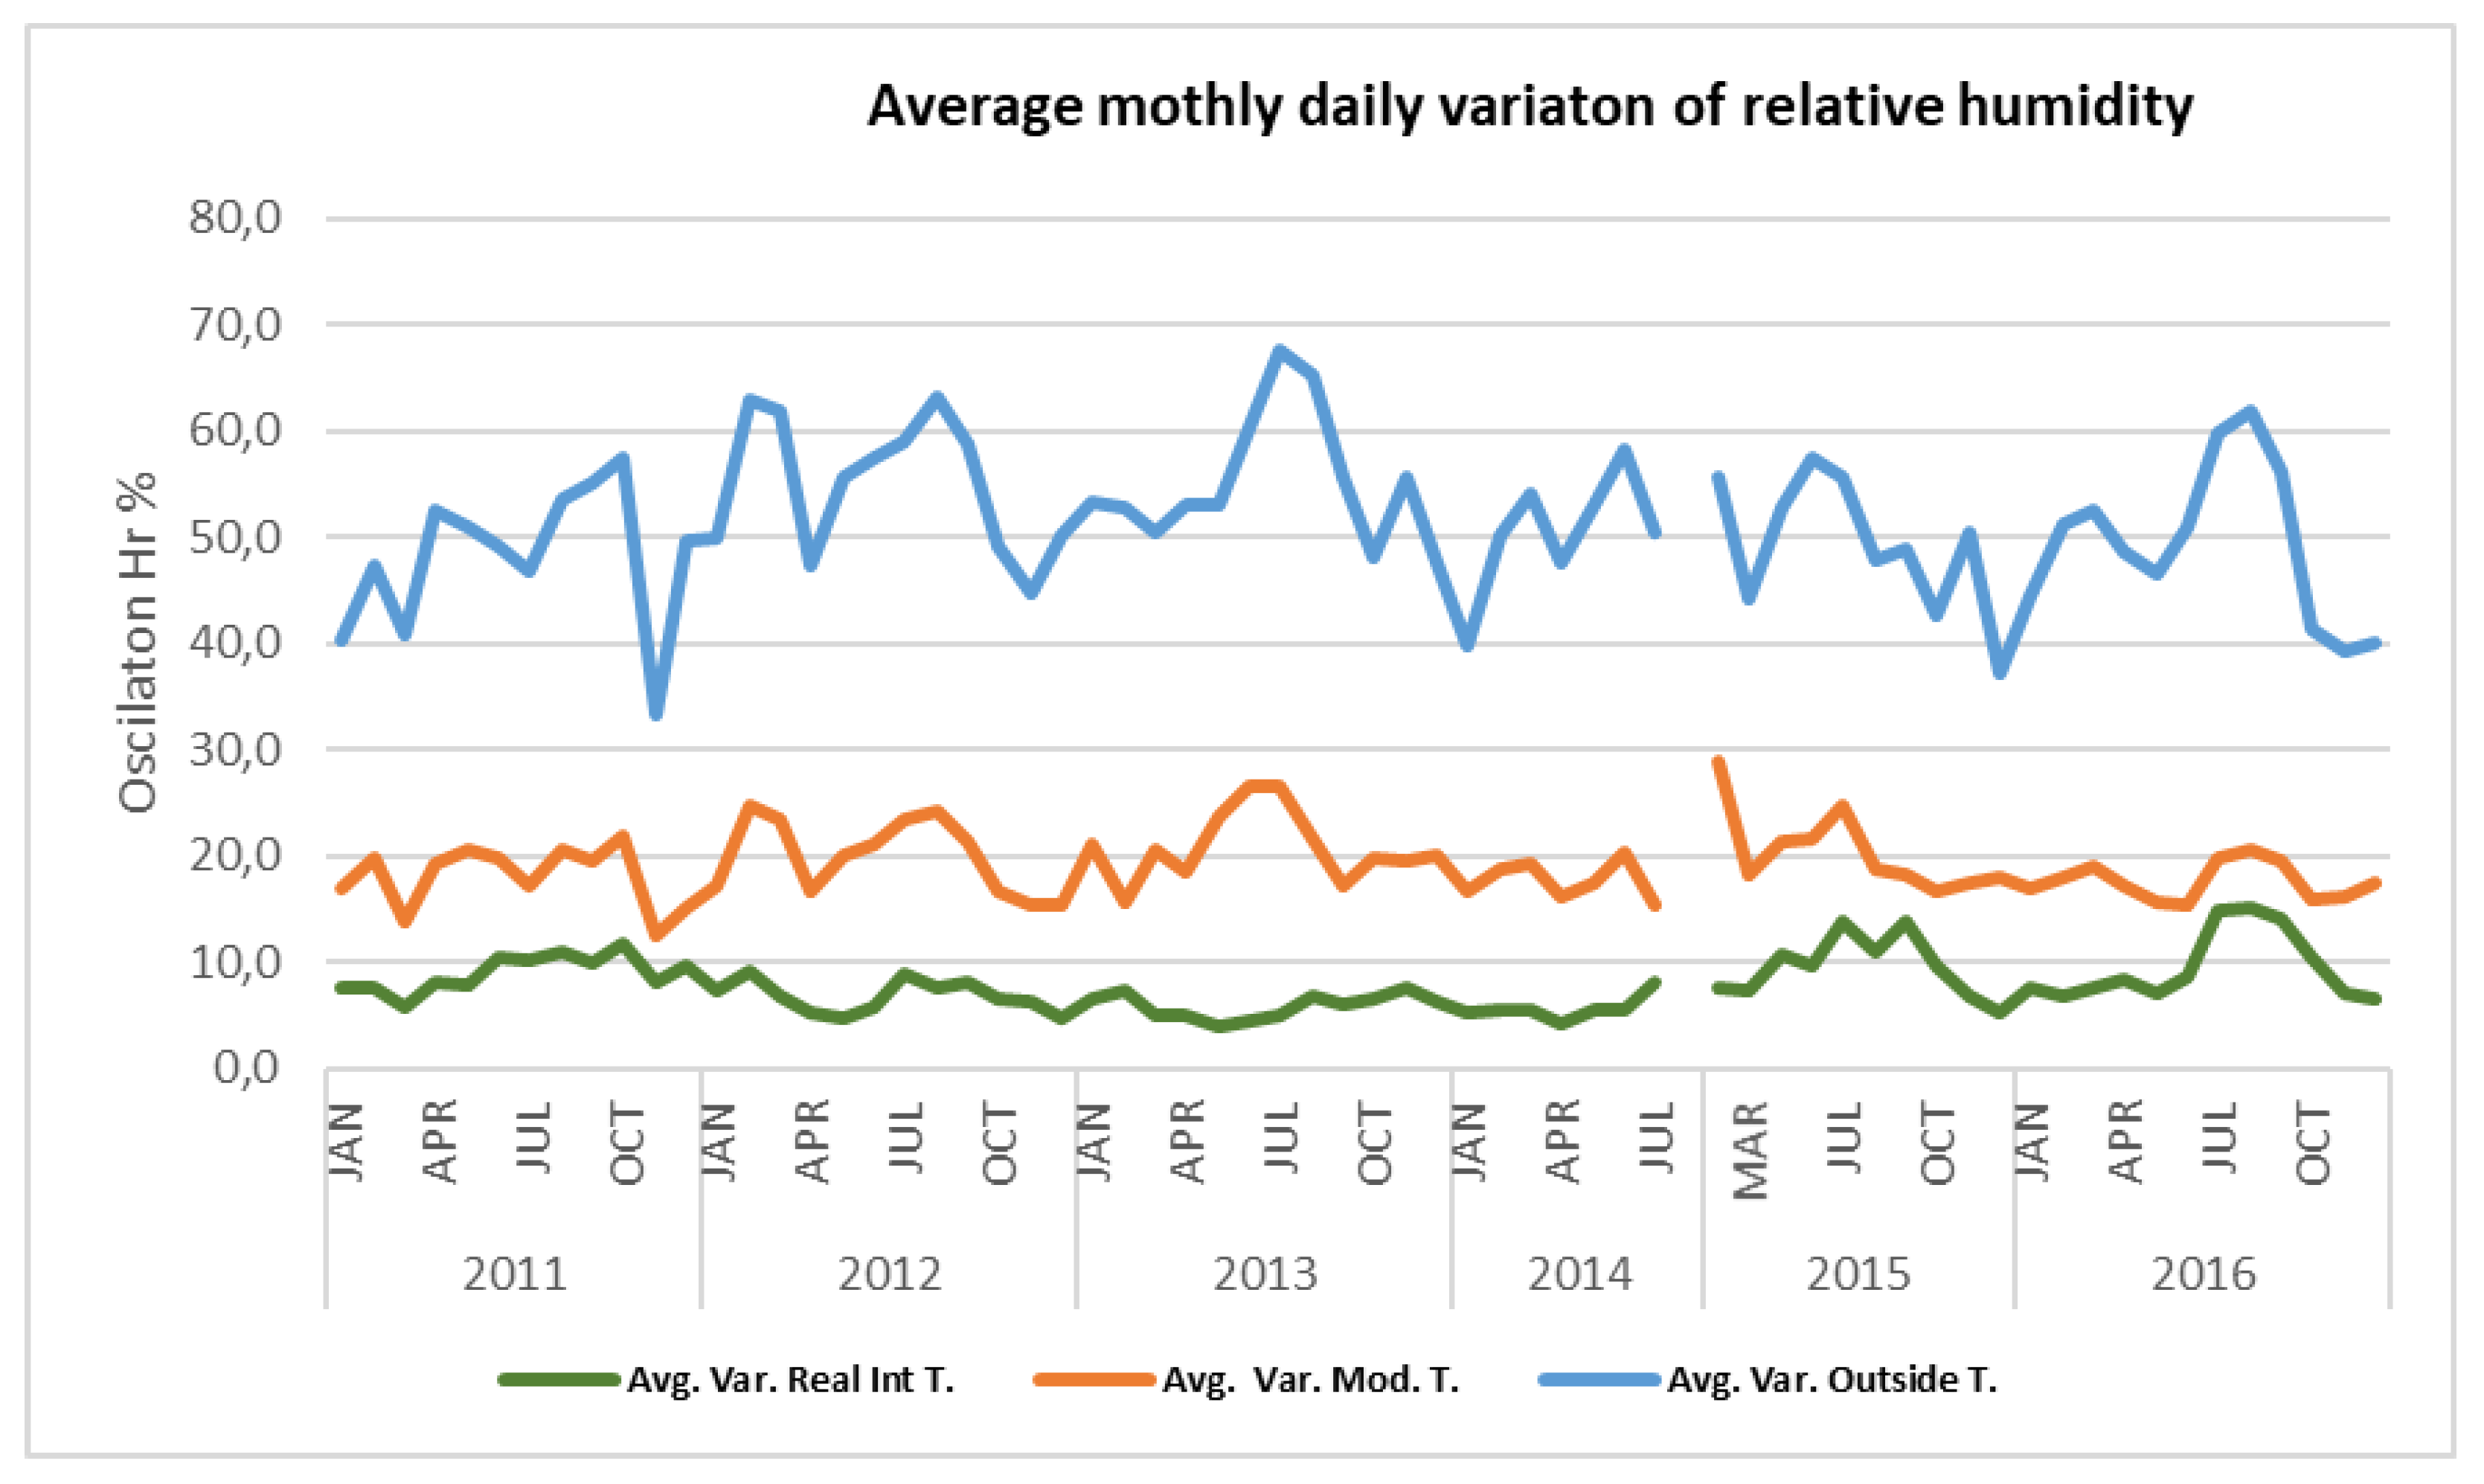
The behavior of relative-humidity oscillation (
Figure 22) is similar to that of temperature. The outside oscillation is very high, from 40% to 70% of the difference between the minimum and the maximum of the day. In both the model and reality, the indoor oscillation is much lower: about 20% in the model and 10% in the recorded data.
5.6. Analysis of the Building’s Hourly Behavior: Real Data vs. Theoretical Model
For a more detailed analysis of indoor and outdoor conditions, a series of hourly graphs were drawn up over a period of nine days for winter and summer. Although the chosen periods correspond to a particular year, they can be considered representative, since the years analyzed have very similar behavior.
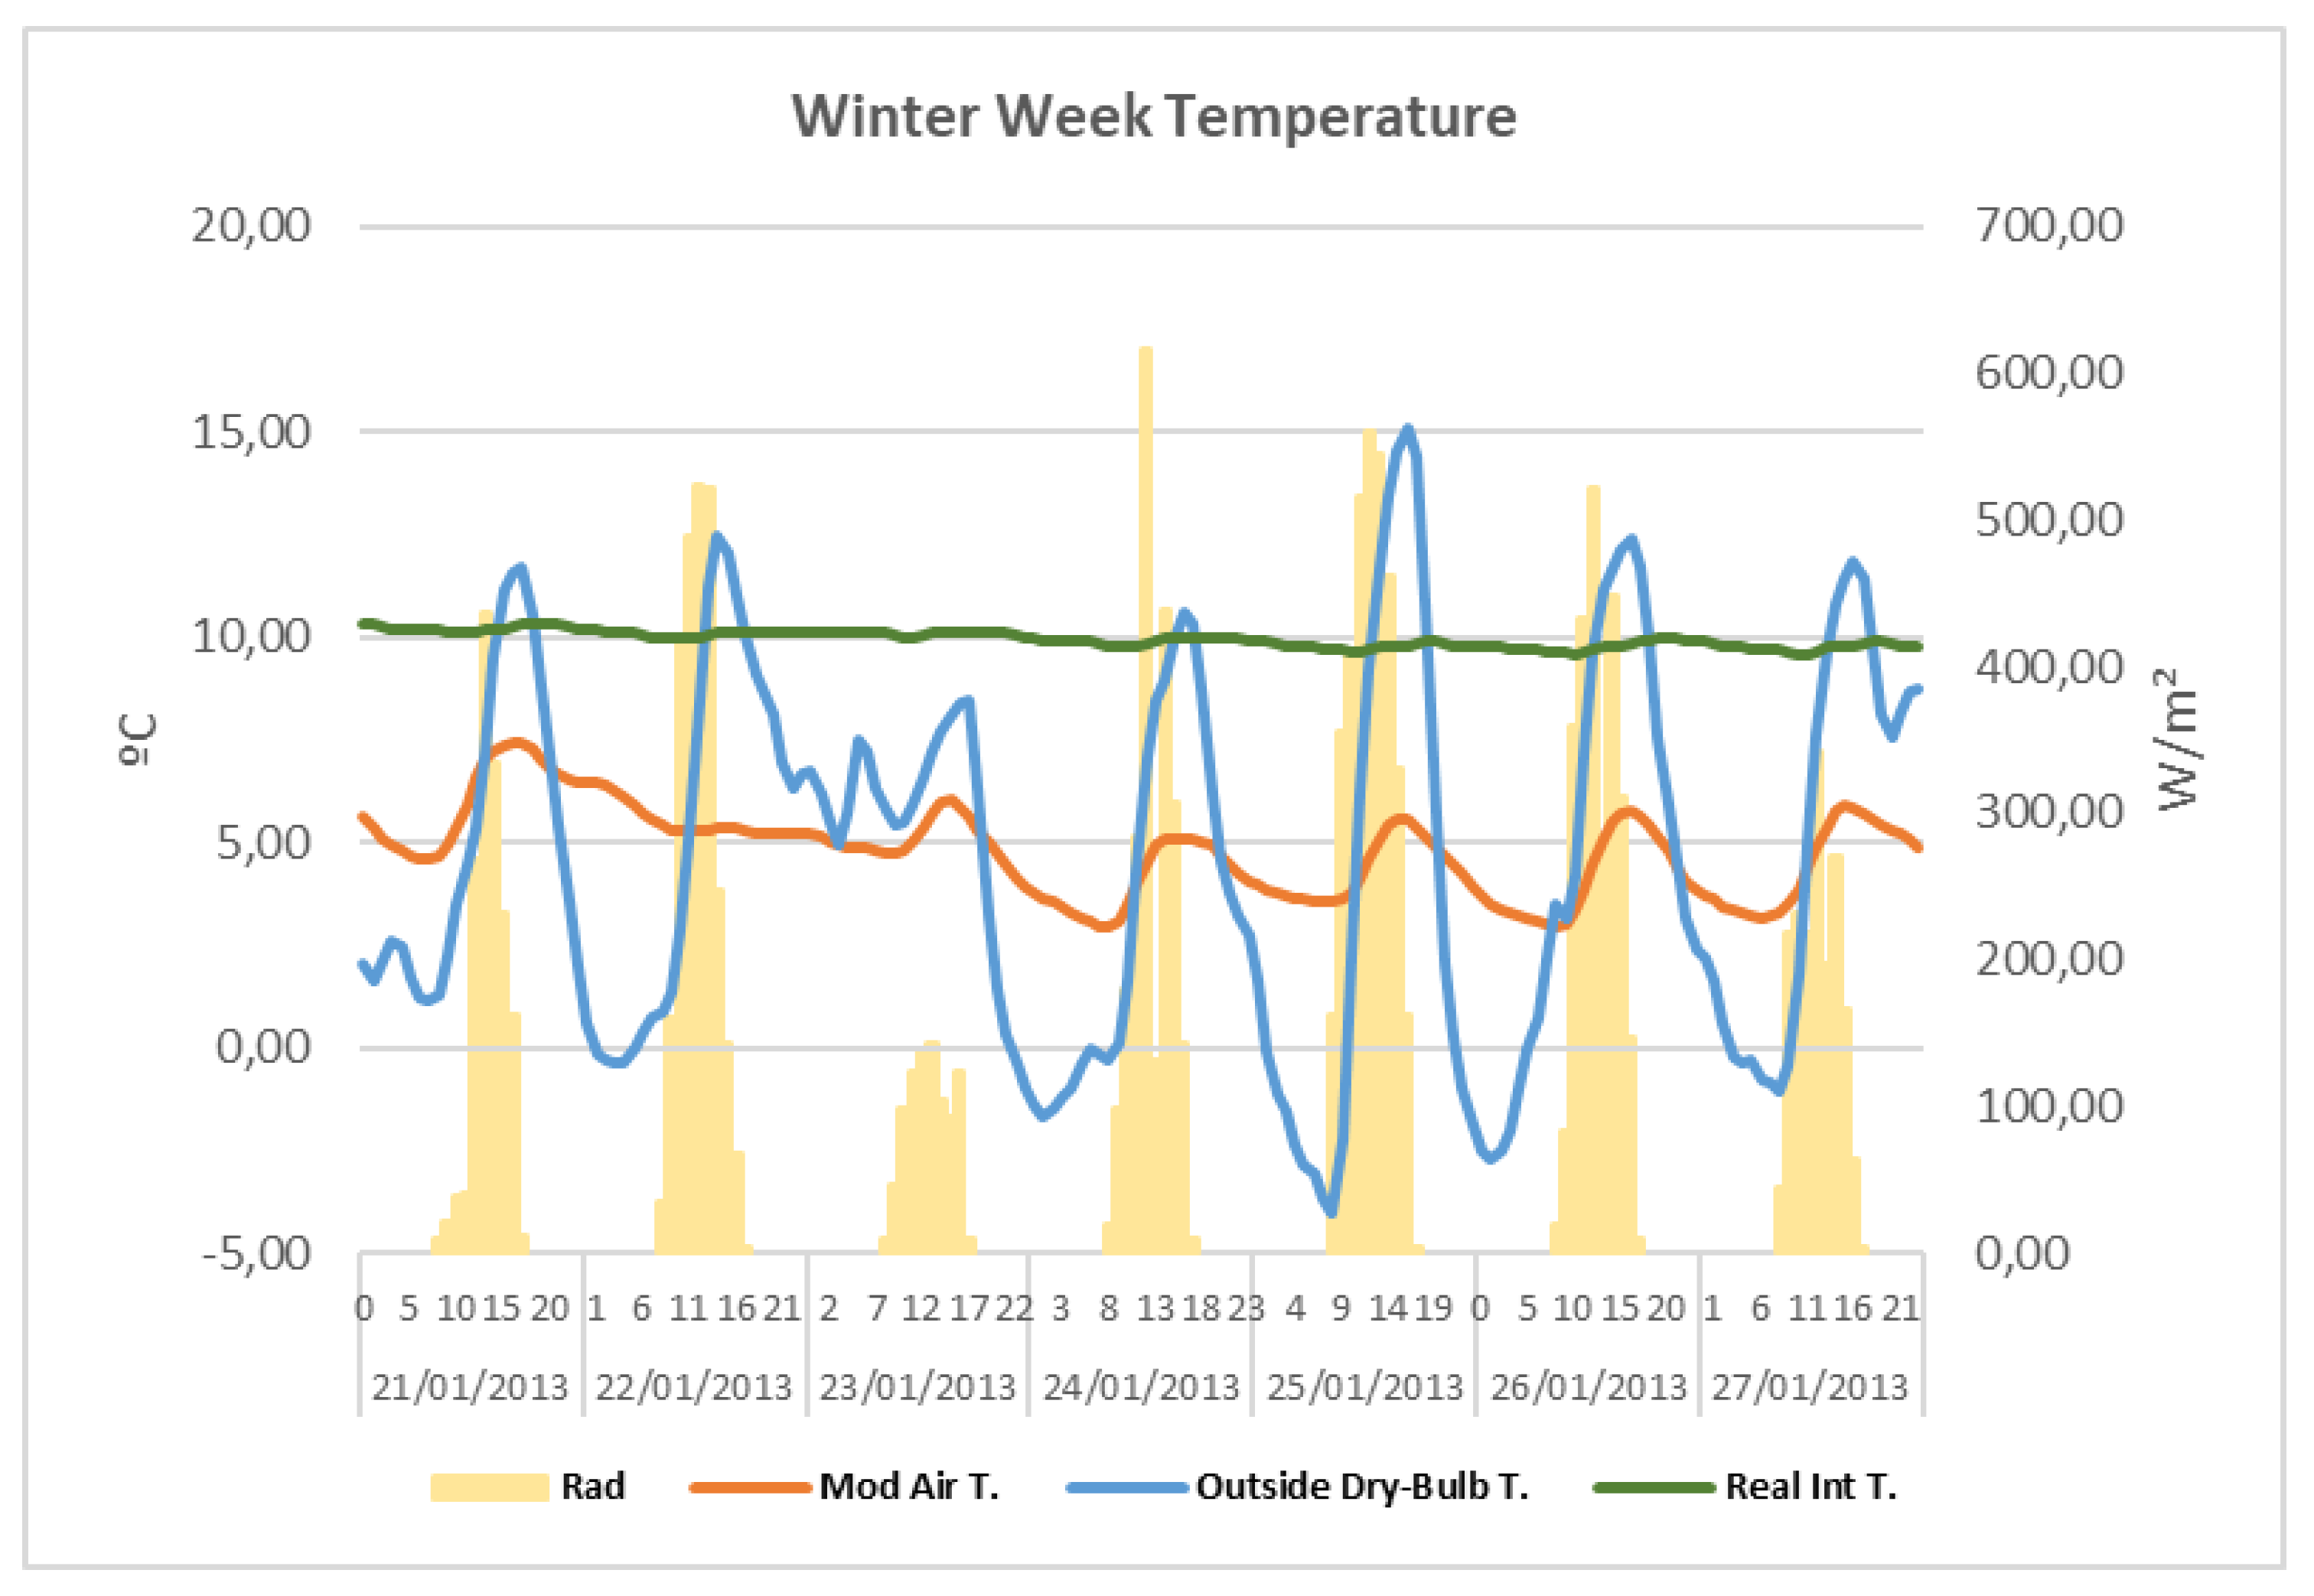
5.6.1. Temperature and Solar Radiation
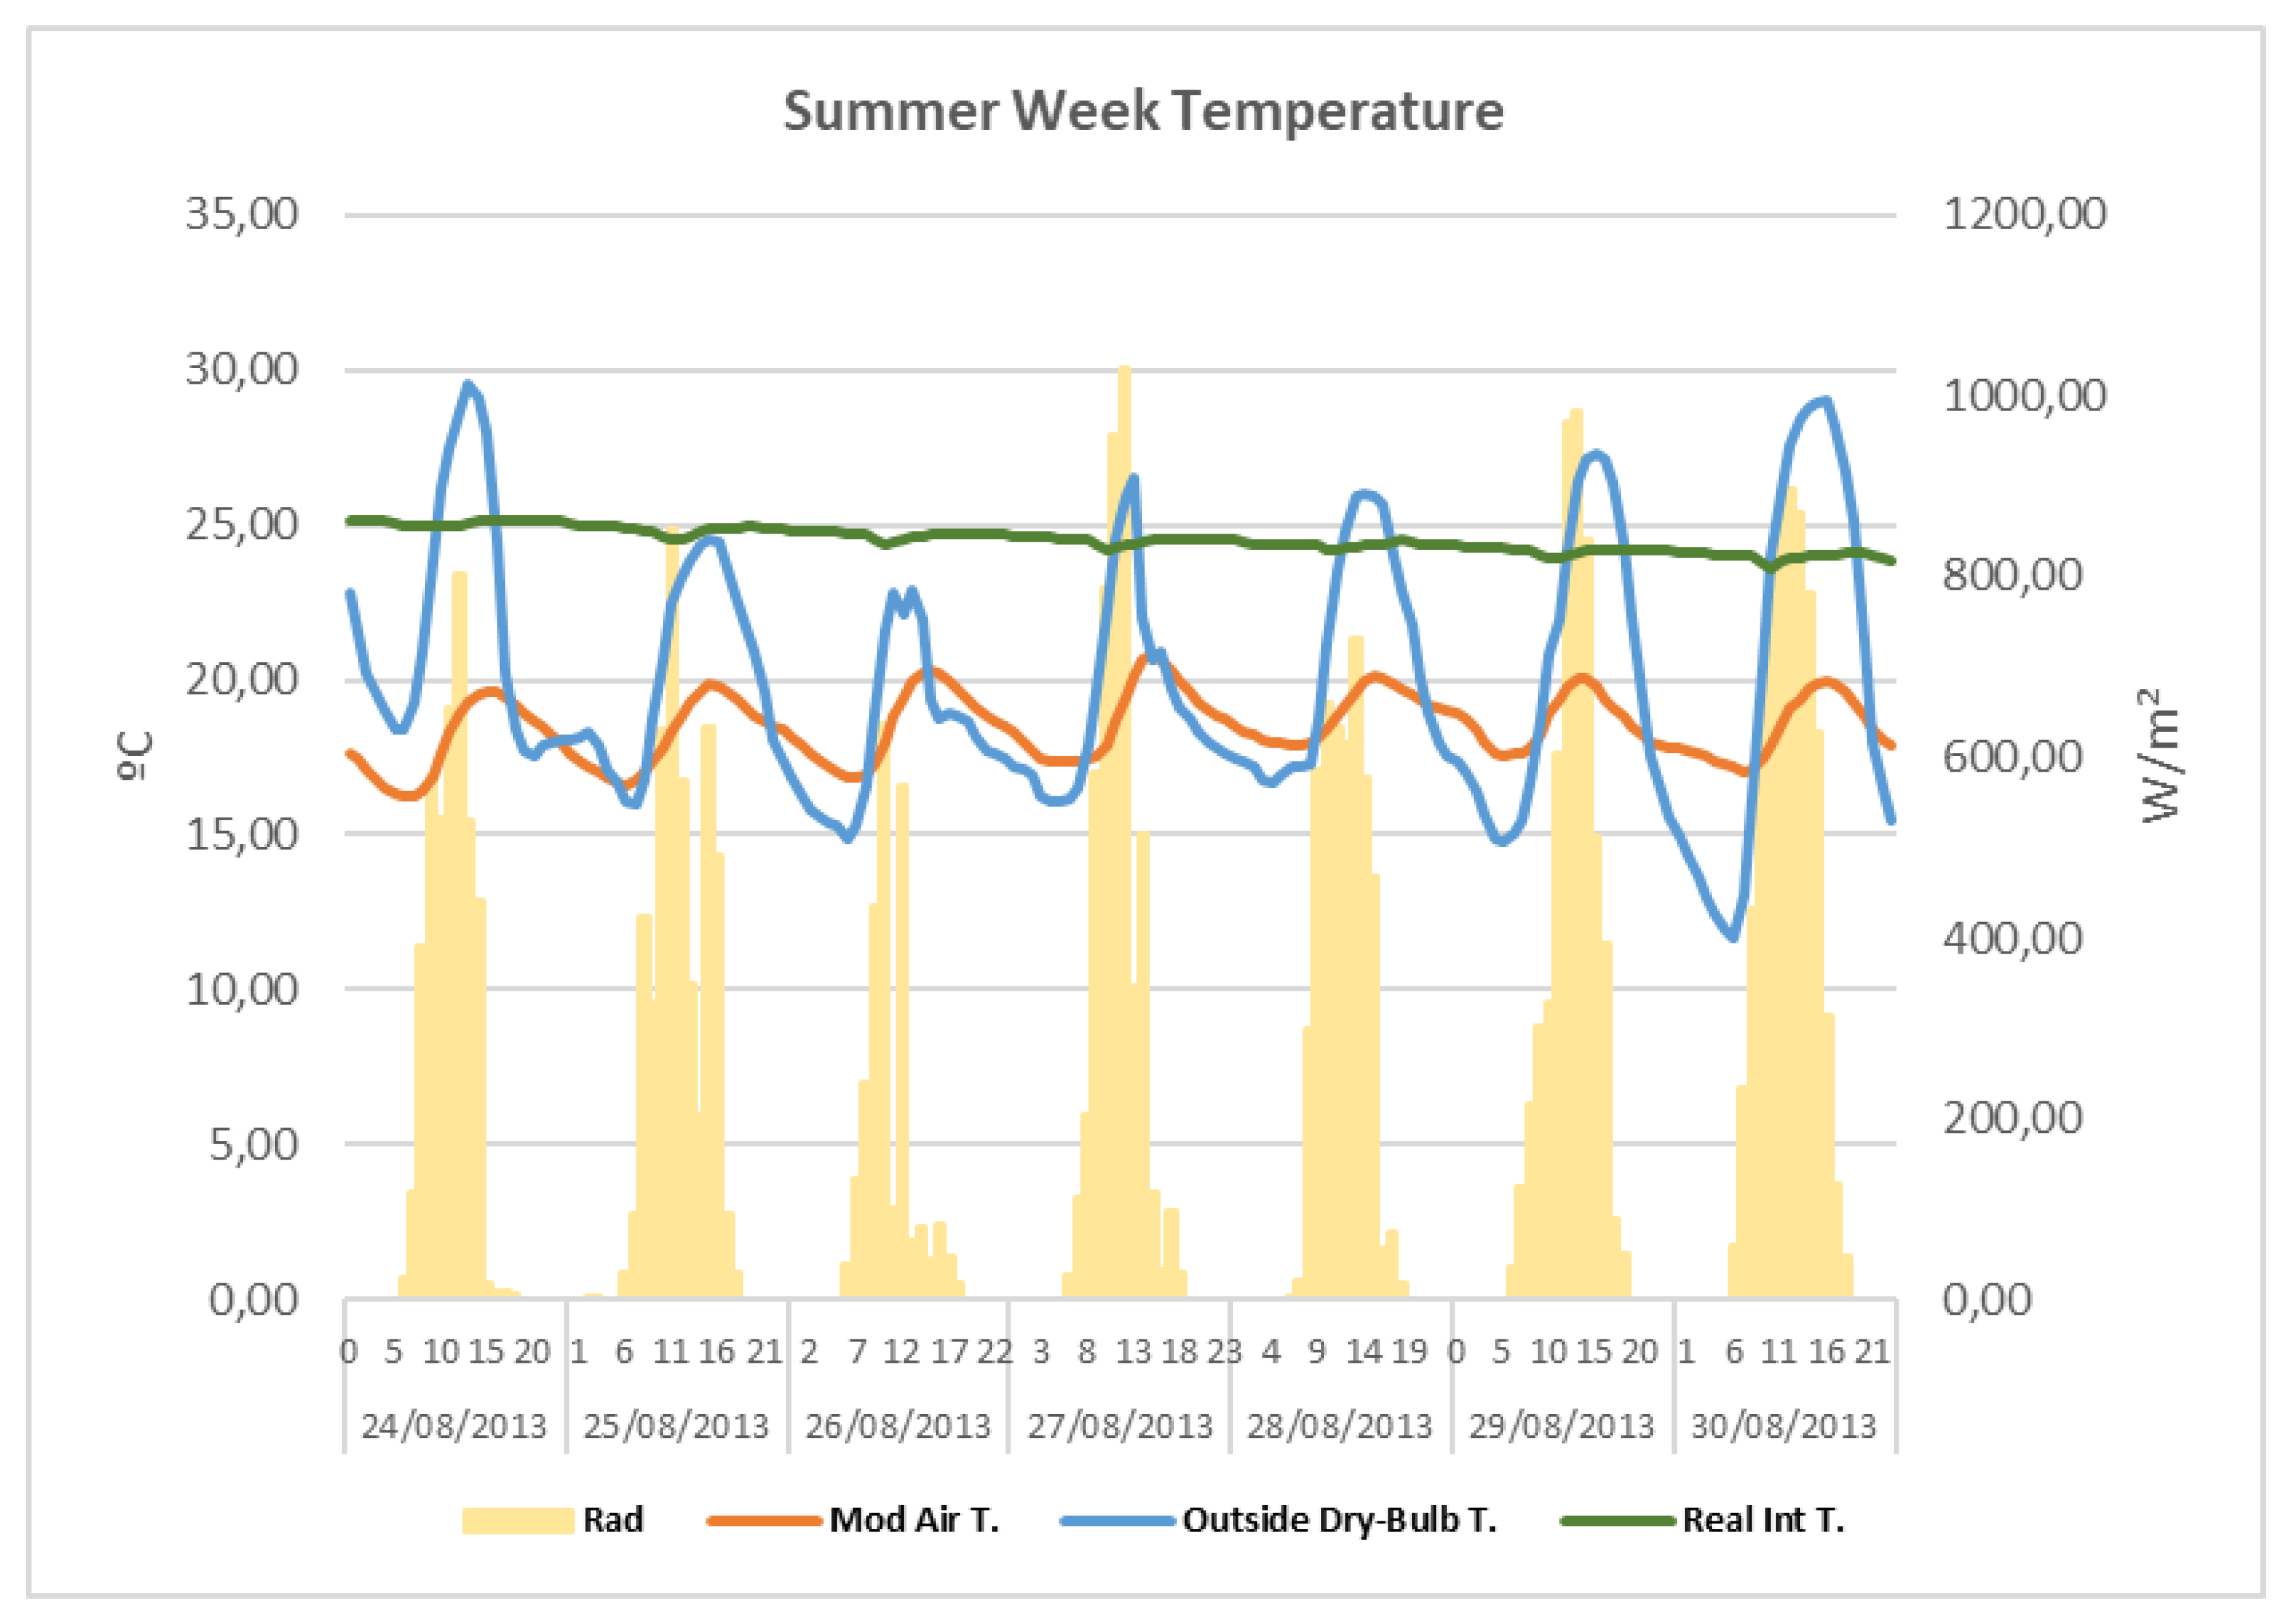
Figure 23 and
Figure 24 show, in detail, the relationship between solar radiation, outdoor temperatures, and indoor temperatures, both real and from the EnergyPlus model.
Figure 23 corresponds to the winter period, and
Figure 24 corresponds to the summer period.
Looking at
Figure 23 and
Figure 24, we can see that the difference between real and model temperature is more than 5 °C. However, if we analyze the behavior of the curves, we can see that the indoor temperature is more or less constant, despite the high fluctuations of the outdoor conditions. The indoor real temperature is practically constant, and the air temperature of the model changes slightly, in the range of about 3–4 °C.
Sudden changes in temperature and solar radiation have virtually no effect on indoor temperature.
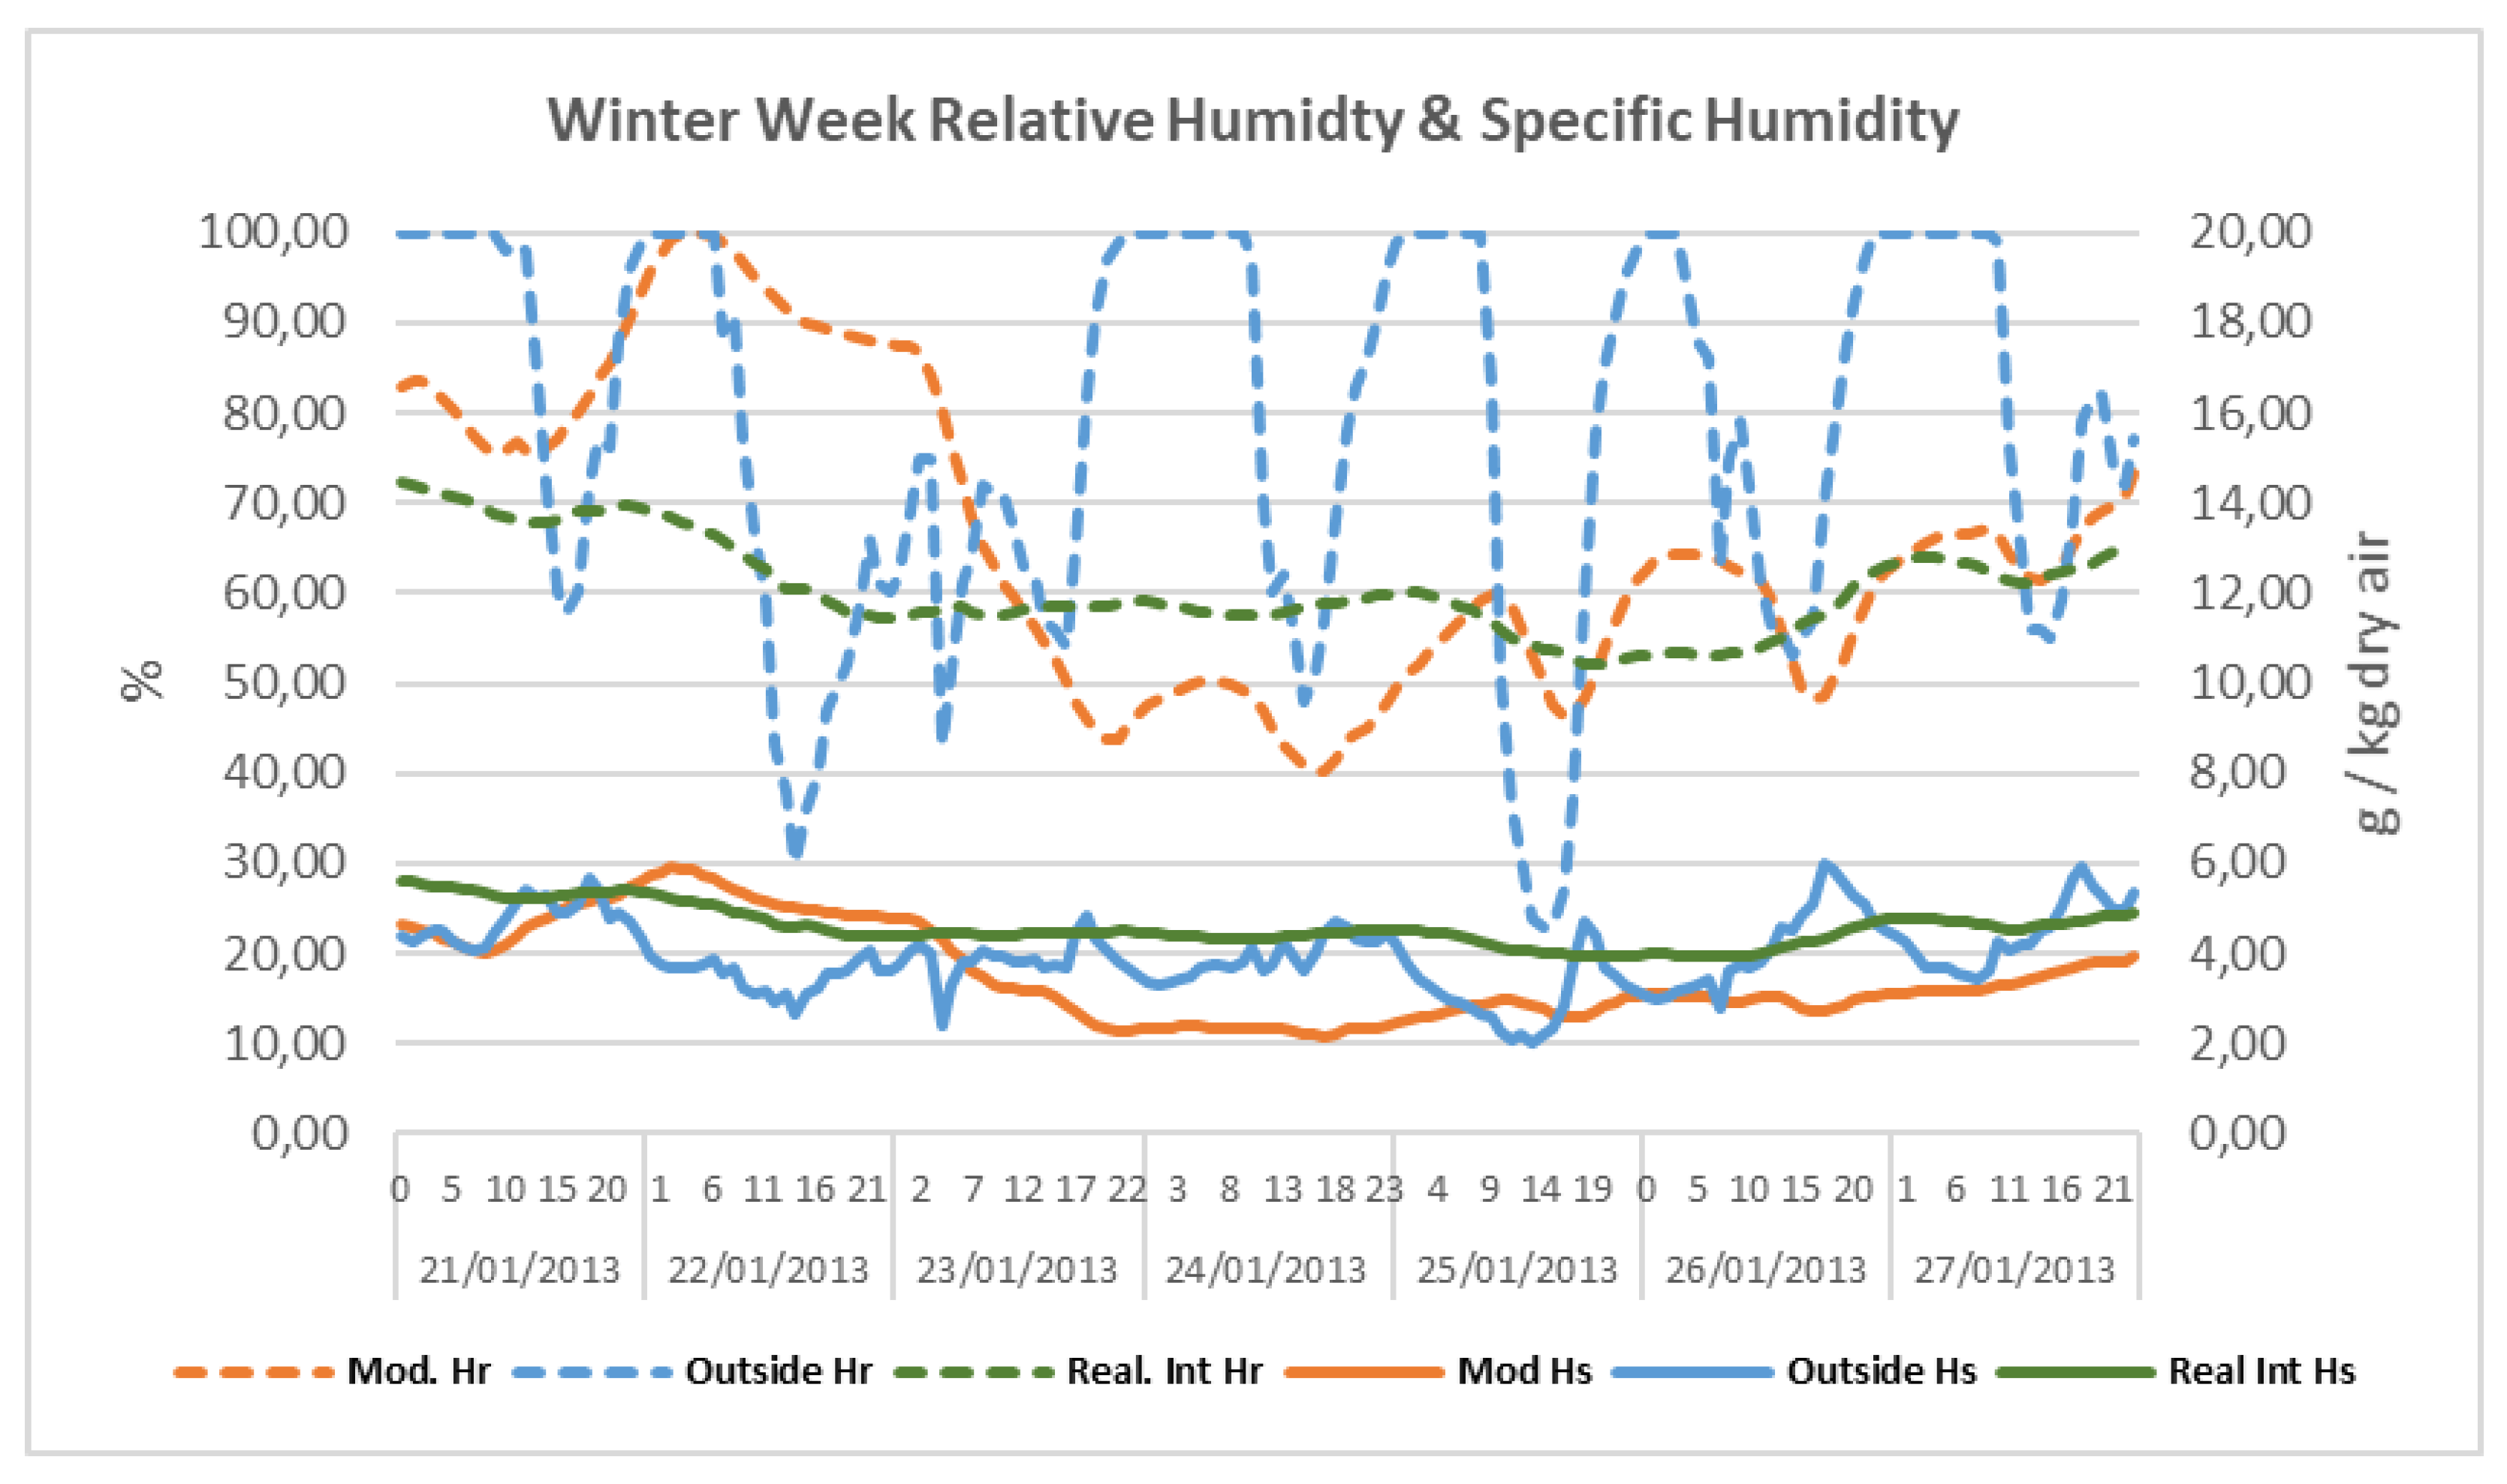
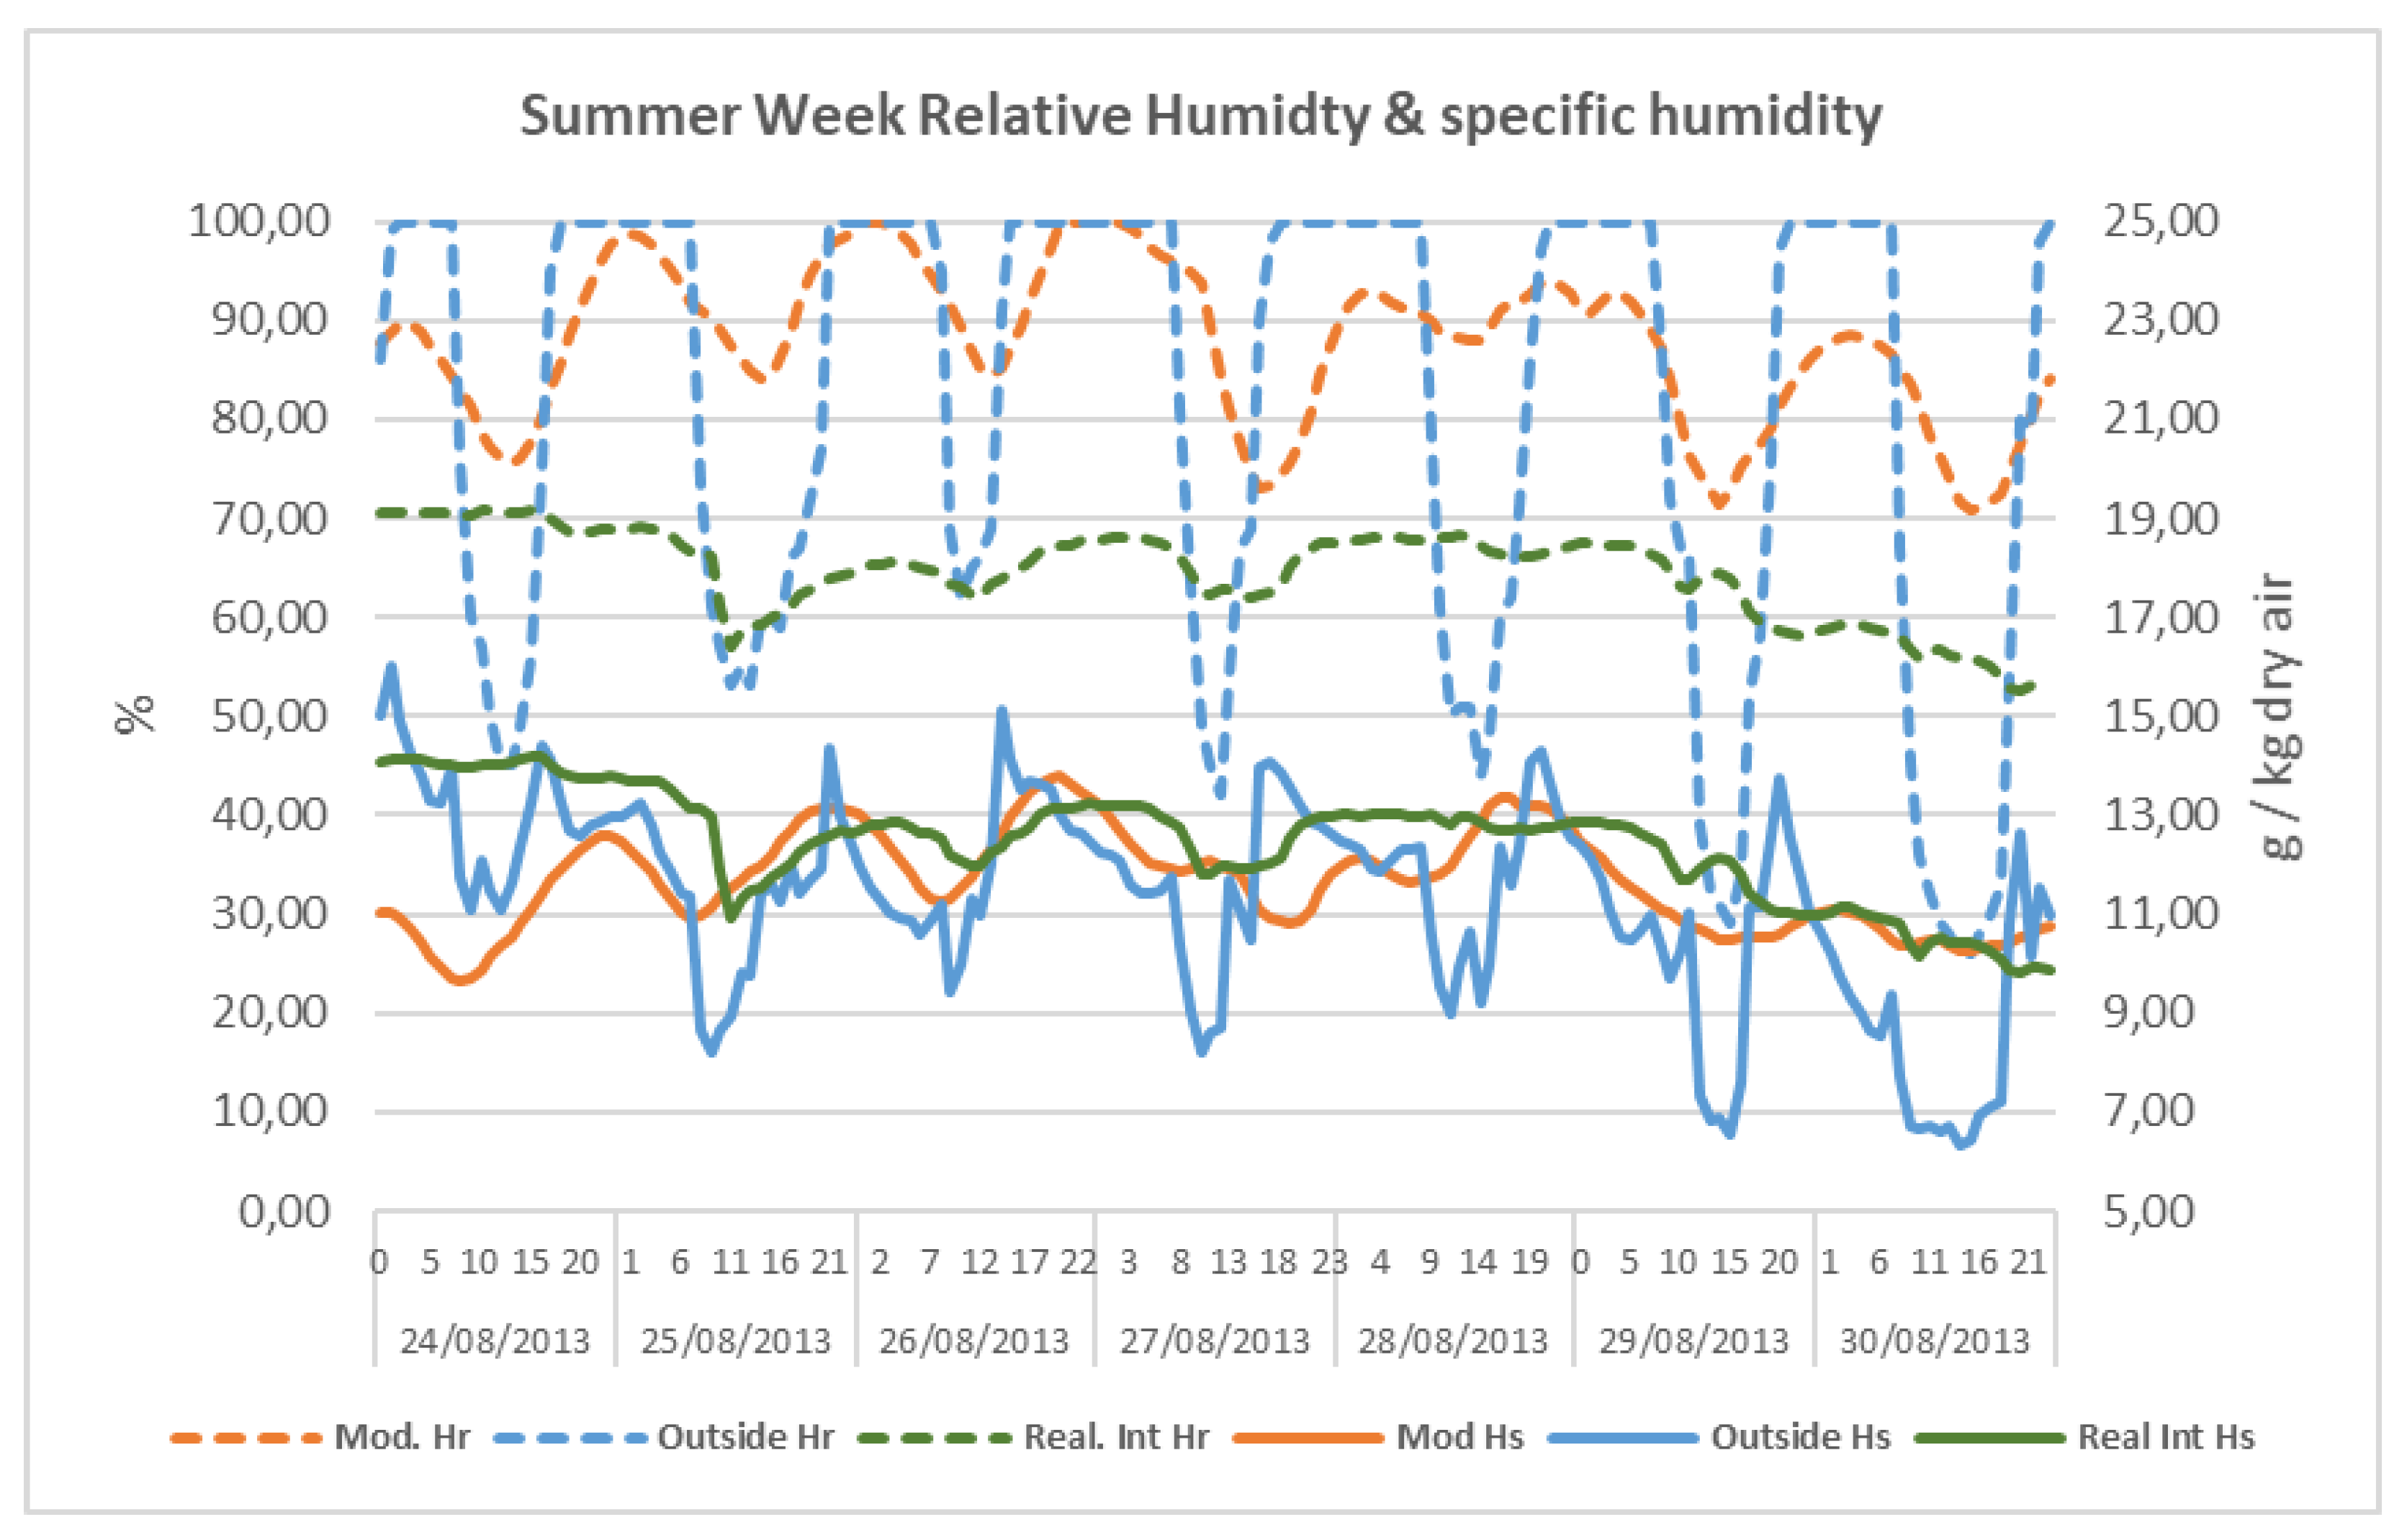
5.6.2. Humidity
Figure 25 and
Figure 26 show, in detail, the relationship between the outdoor relative humidity, the indoor relative humidity (real and simulated), and the real outdoor and indoor specific humidity over a period of nine days.
Figure 25 corresponds to a winter period, and
Figure 26 corresponds to a summer period.
The previous graphics show that the indoor relative humidity is more or less stable, with variations of only 10%. On the other hand, outdoor humidity can vary from 40% to 100% over the course of a day.
During the colder months, the relative indoor humidity varies from 40% to 80%; in very specific periods, it can go down to 30% or up to 100%. It is worth mentioning that these variations occur progressively over several days but never on the same day.
The stability of the indoor relative humidity is related to the stability of the indoor temperature and to the fact that the outdoor specific humidity of the air is dimmed inside, as shown in
Figure 25 and
Figure 26. The modeled interior Hr is higher than the real interior Hr because the modeled temperature is 5 degrees lower than the real temperature. Indoor specific humidity follows the outdoor trend with a delay. Therefore, the effect of a change in outdoor specific humidity on indoor specific humidity is also delayed. As with temperature, specific humidity suffers significant damping around 80%, which means that if the outdoor specific humidity goes from 7 g/kg to 13g/kg, the indoor specific humidity only varies by 0.6 g/kg.
5.7. Heat Loss
Heat loss was calculated from the energy model, considering the envelop, ventilation, and occupancy for a typical year.
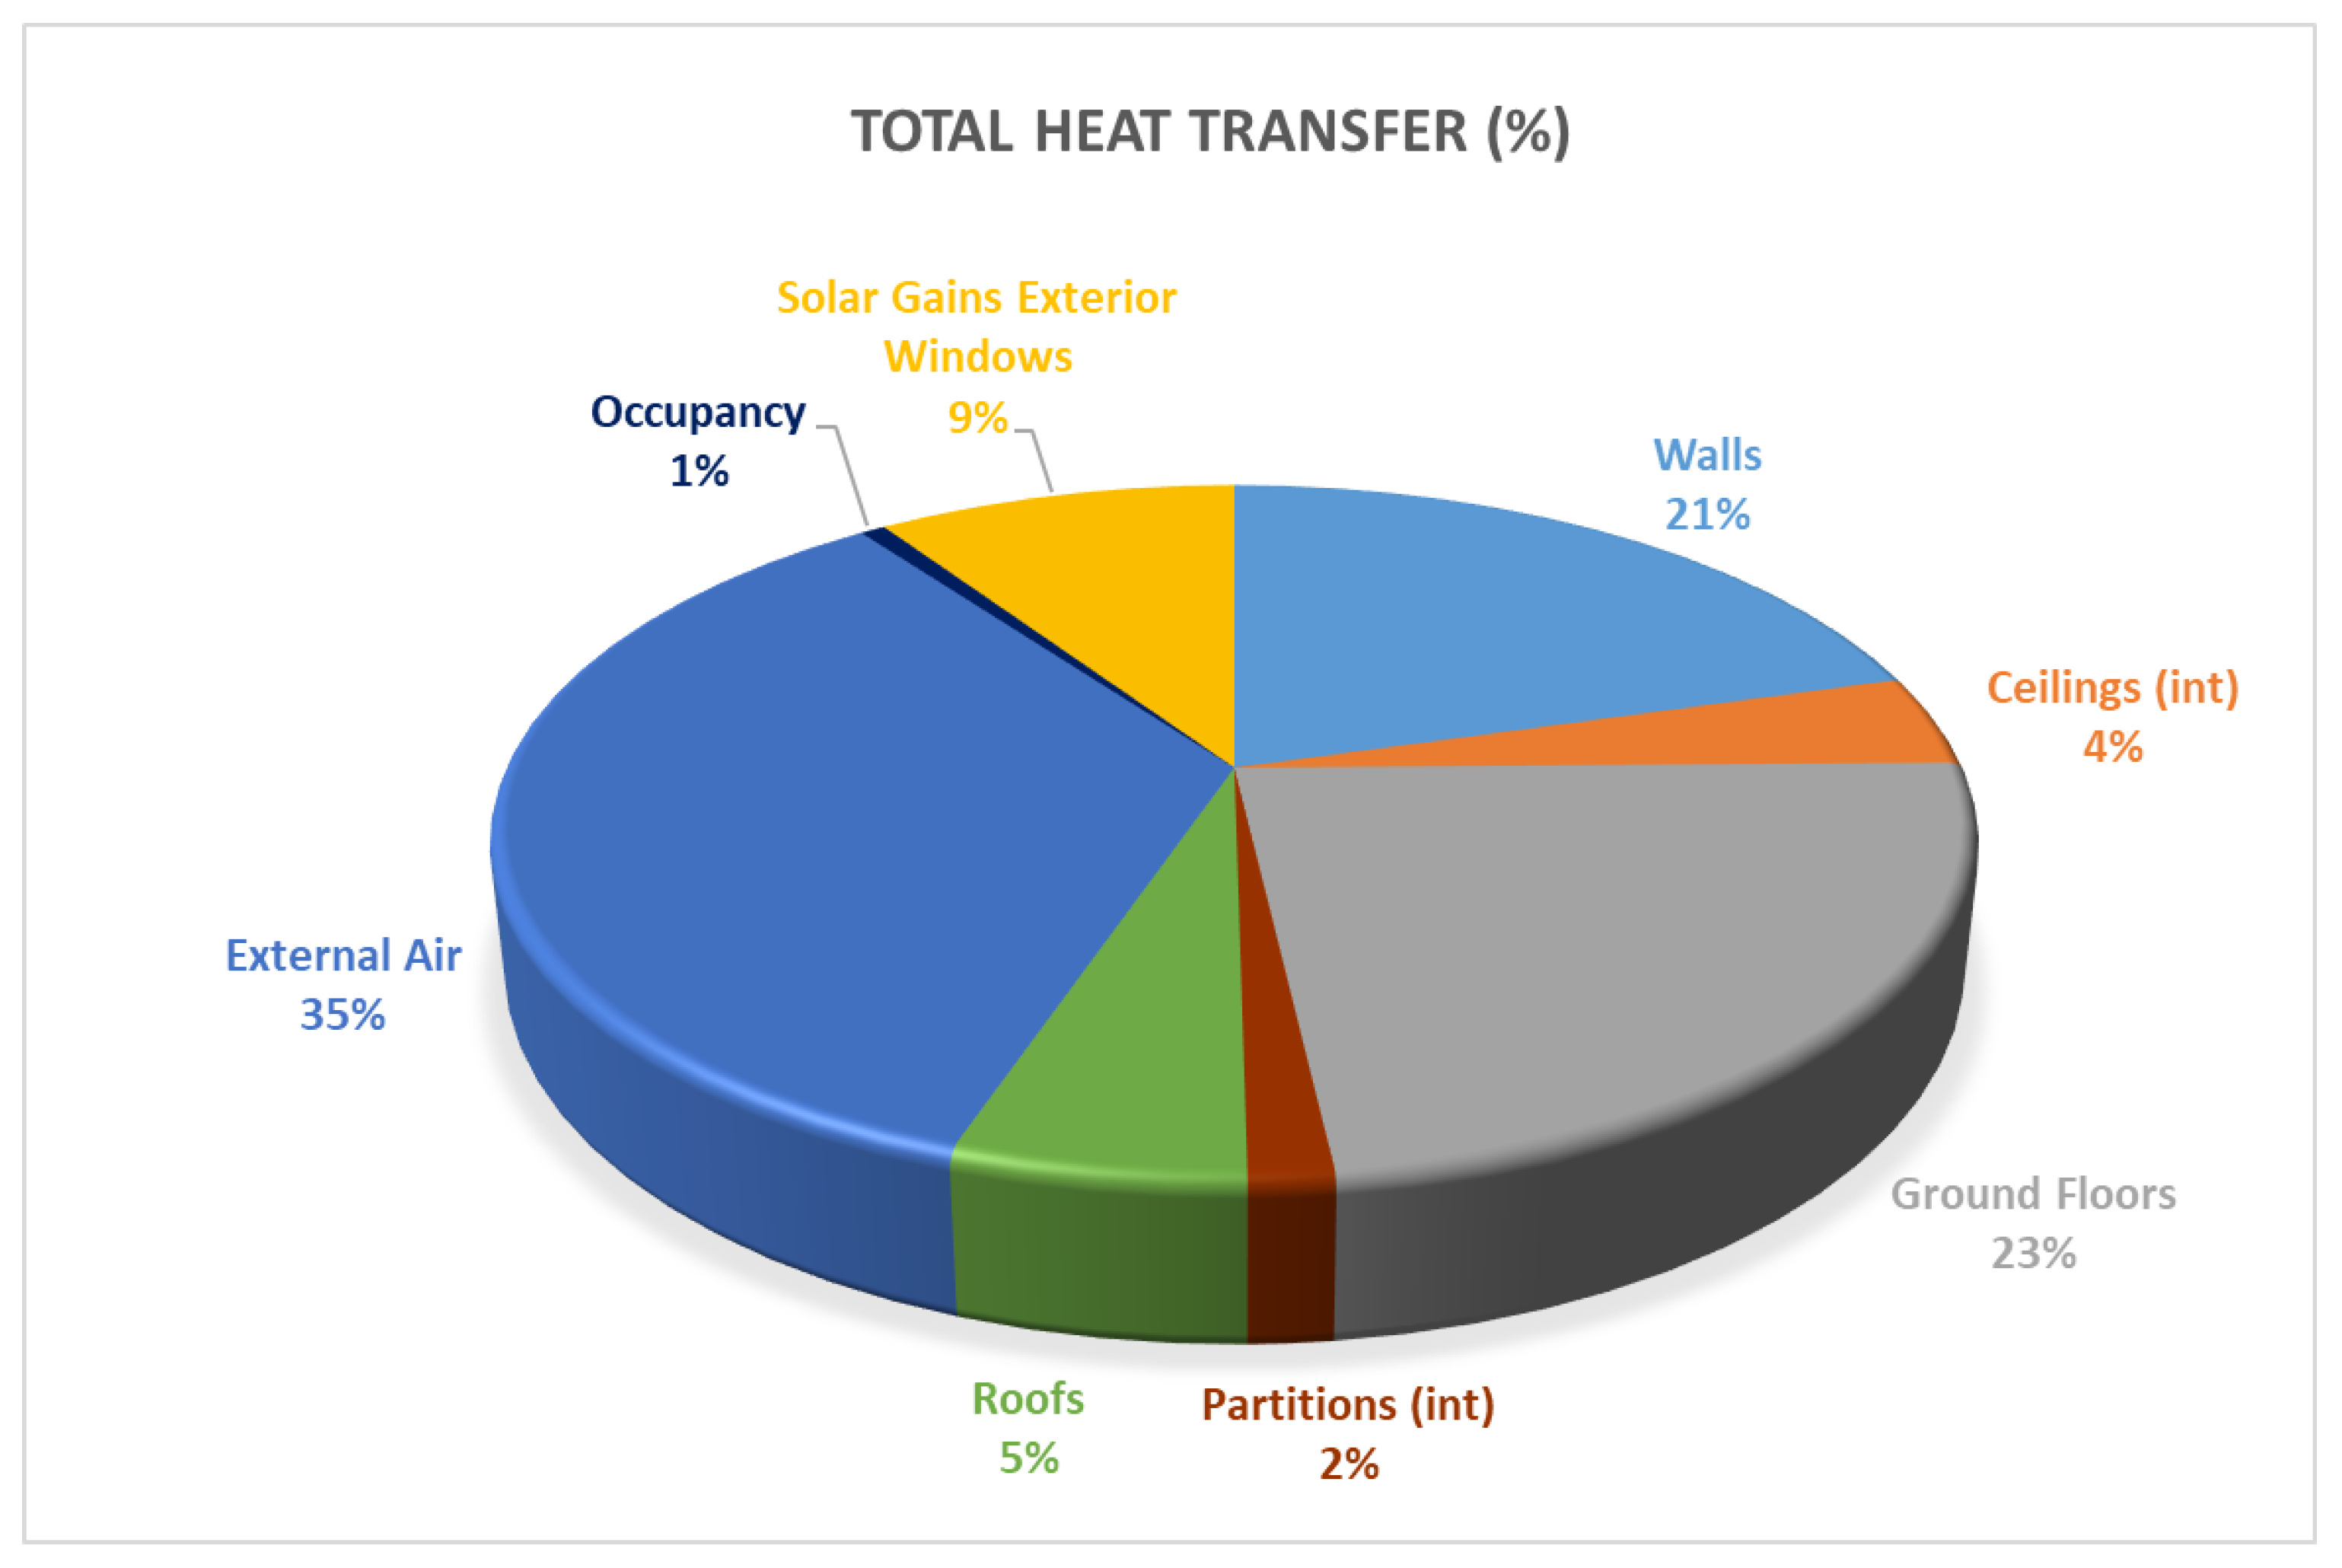
An annual percentage graph was made to illustrate the importance of each item in total heat loss (
Figure 27). Heat losses are distributed mainly by infiltrations of air, the ground floor, and the walls; the sum of these items is 79%. Solar gains from the windows represent only 9%, regularly distributed in all months. Heat losses from the roof and ceiling represent 7% of total heat transfer. Heat gains from people represent only 1%.
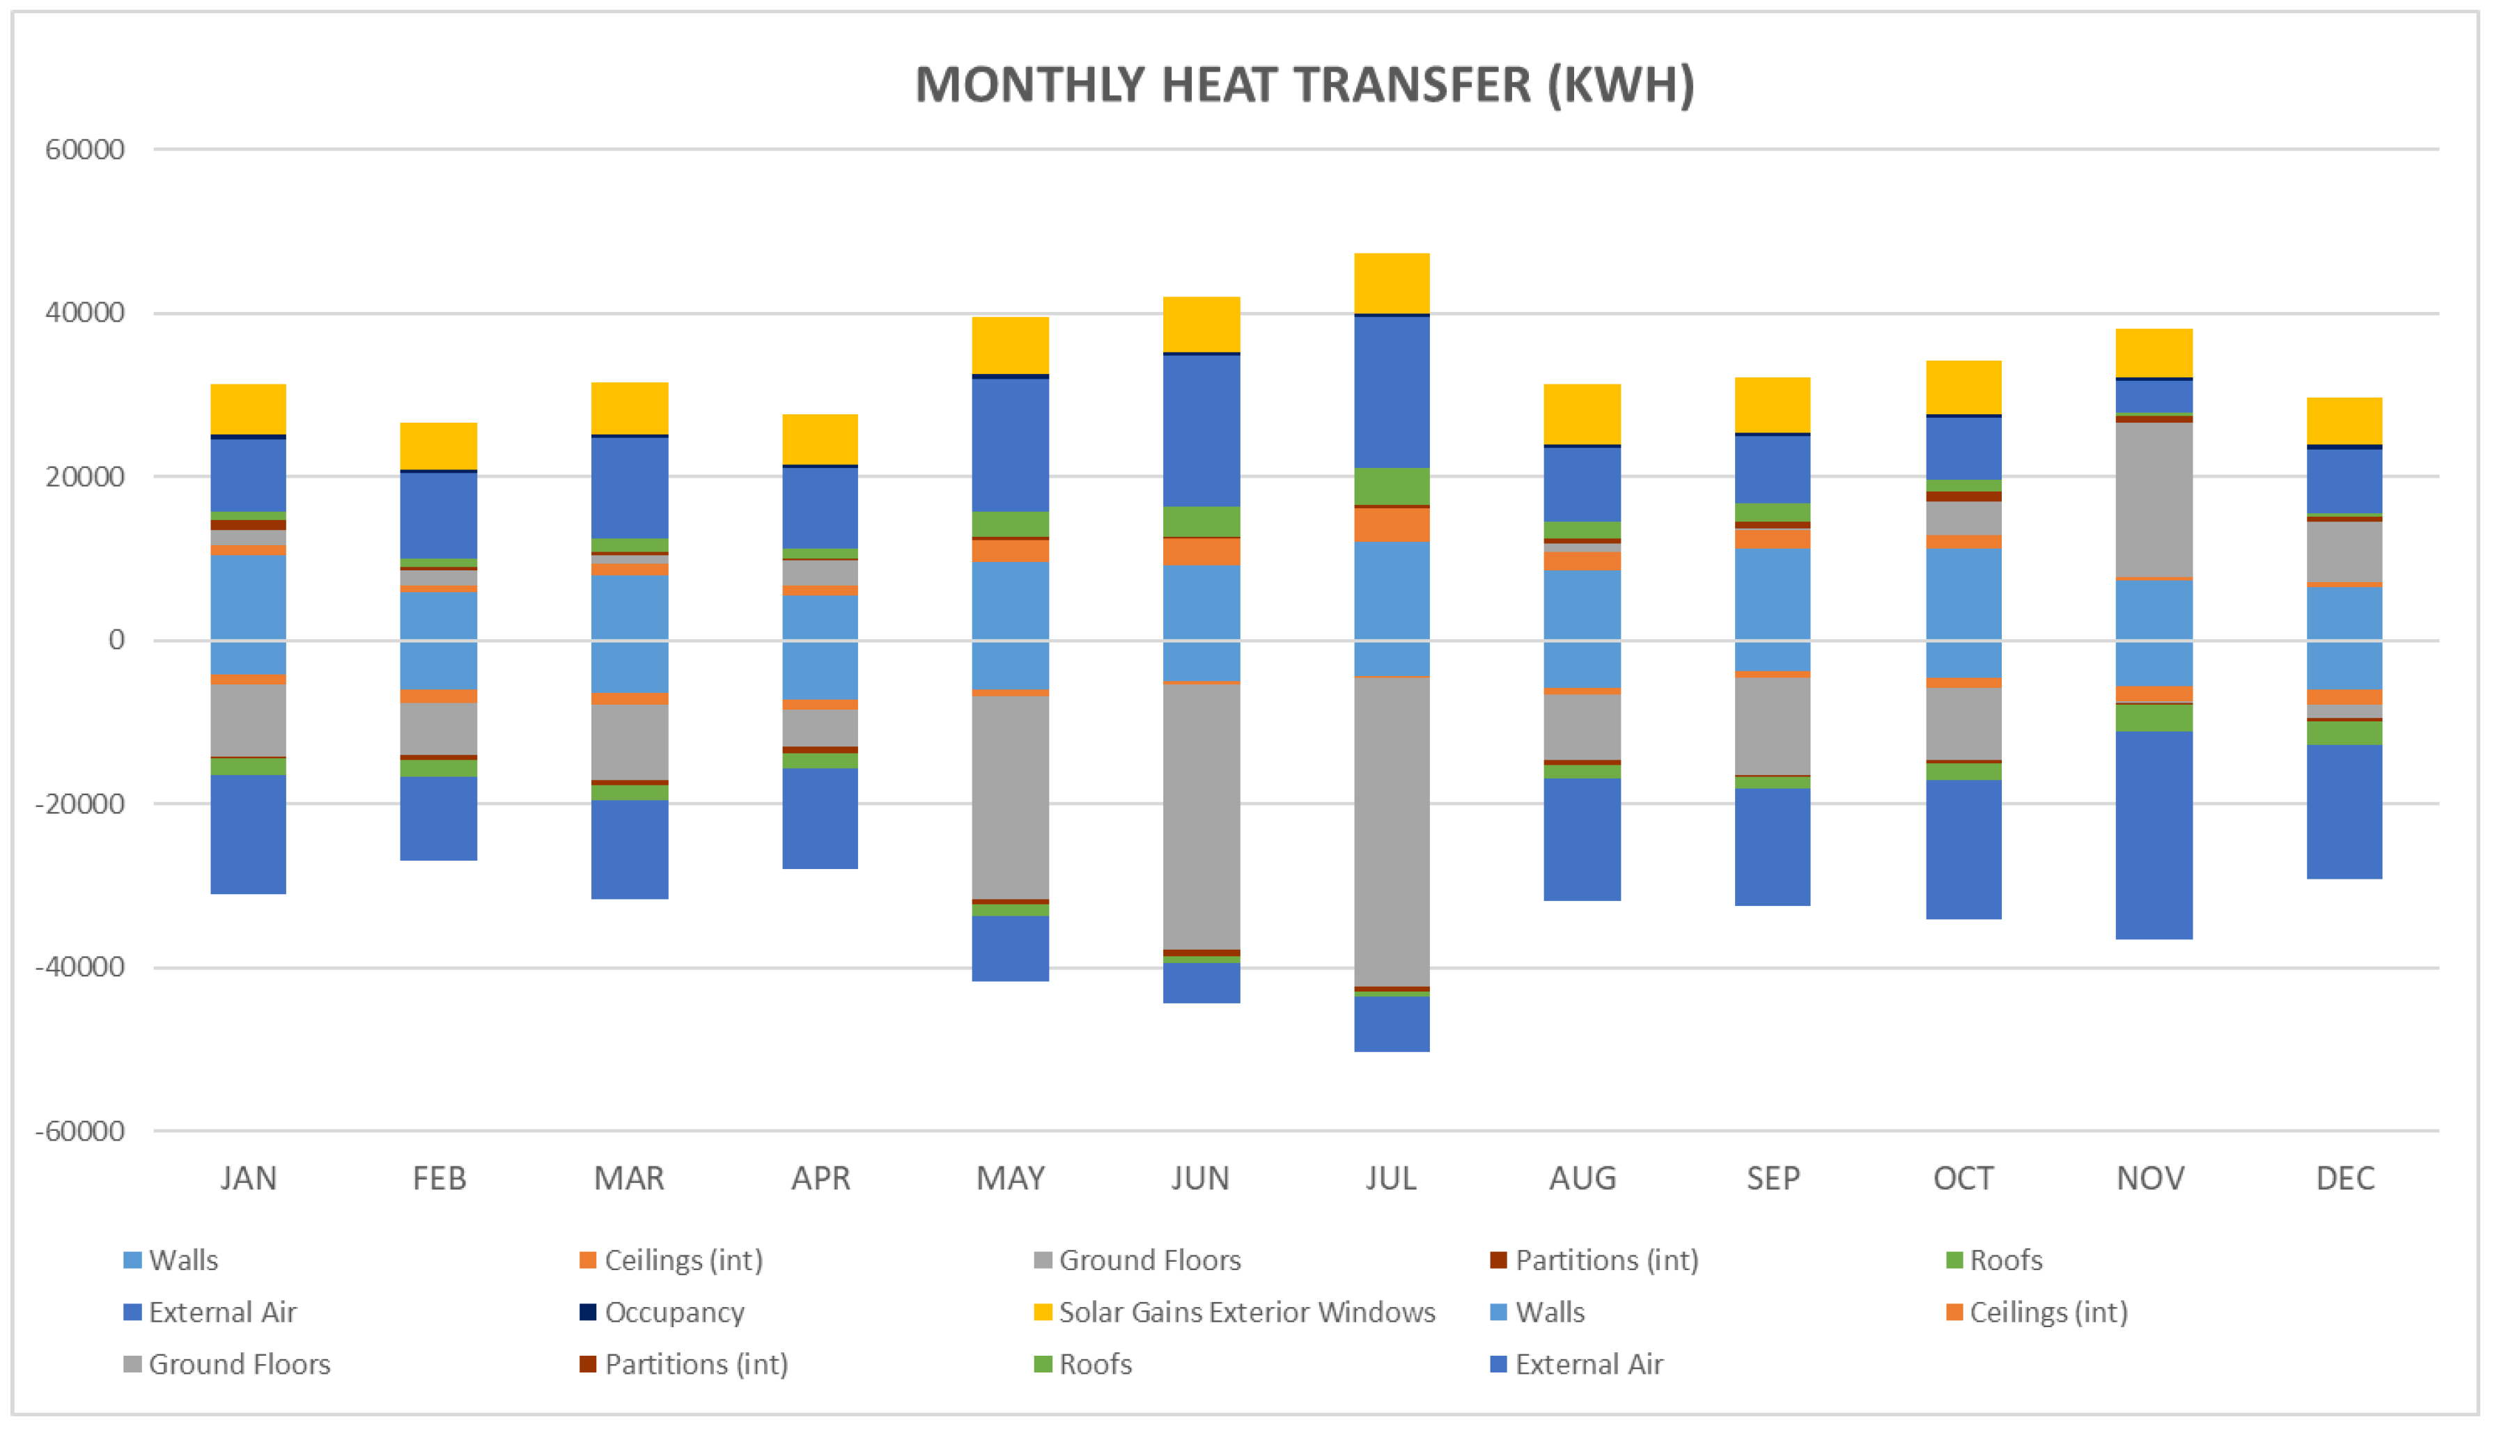
Figure 28 shows how each item affects the energy balance. For instance, the external air is responsible for some gains and some losses; this is due to the fact that the temperature of the external air during the day is higher than the inside air temperature, and during the night, it is lower than the inside air temperature. This effect also occurs with the other elements due to the external thermal oscillation. The floor helps to cool the indoor environment during the months of May to July, and then in November and December, it gives off heat to the internal cathedral space.
6. Conclusions
Based on analysis of the results, we can observe that the building analyzed has specific thermal behavior. Firstly, the indoor environment is very stable; the daily temperature remains almost constant, and the variation in indoor relative humidity is highly attenuated.
Referring to the annual temperature behavior, the obtained results were partially different from those predicted by the model. The indoor temperature curve was expected to correspond to the average outdoor temperature but with a constant lag throughout the year. This study has shown that this lag exists only for about half a year, from August to January. During this period, there is a one-month delay. This behavior could be explained by the effect of solar radiation during the summer, the significant effect of the terrain helping to dampen the indoor temperature during the winter, and the energy-storage capacity of the envelope.
Another conclusion refers to the temperatures that are reached during the coldest and hottest months. The minimum indoor temperature is dampened and never reaches the outdoor average. In the coldest month, the inside temperature is about 5 °C higher than the monthly average temperature. In the case of our study, indoor temperatures are between 10 and 24 degrees, with a maximum daily variation of 0.5 °C. The relative humidity during the year fluctuates from 40% to 75%, with some values above and below, but the maximum daily variation is 10%. These conditions would be appropriate for many pieces of art, according to [
23], with the advantage that no HVAC is used and therefore no energy needs to be consumed for their conservation, as is the case in other environments requiring HVAC [
12].
Comparing the real indoor relative humidity with that predicted by the model, we see that they have similar curves and values, although they do not completely coincide.
If we want to study daily behavior, we can conclude that the model gives a good idea of the stability of the inside conditions of temperature and humidity, but it is does not accurately predict the inside temperature throughout the year.
This building has very unique features; it is built with Girona stone, which is a material with a thermal driving coefficient and a high density that confers to the stone the capacity to accumulate a lot of energy and therefore to act as a regulatory element of the interior temperature. The walls have important widths, and therefore, the thermal inertia is very high.
The Cathedral also has a high heat capacity, virtually no internal loads, low air renovations, low solar incidence, and no HVAC system installed. These traits cause monthly thermal inertia effects instead of daily effects, as is common in other buildings.
There is no specific agreement as to the temperatures at which works of art should be maintained, but for their preservation, they should be stable, since pieces of art can suffer from sudden changes in thermal conditions.
The optimal conditions for the conservation of pieces of art are those with stable temperatures between 10 °C and 30 °C and a relative humidity almost always below 75%. In the Girona Cathedral, the periods with values above this range are punctual and therefore not sufficient to favor the proliferation of mold. Therefore, we can say that the Cathedral of Girona is an optimal space to contain pieces of art.
Therefore, it is plausible to design buildings for heritage conservation with high heat capacity and low outdoor air changes with contemporary building materials and systems. For such buildings, minimal or zero energy consumption is expected, and energy modeling tools can be used to predict daily behavior and assist in design before construction.


