Article

Heat and Mass Transfer by Vapour in Freezing Soils †

by
Assel Sarsembayeva
1,*,
Askar Zhussupbekov
1 and
Philip E. F. Collins
2
1
Department of Structural Engineering, L.N. Gumilyov Eurasian National University, Nur Sultan 010008, Kazakhstan
2
Department of Civil and Environmental Engineering, College of Engineering, Design & Physical Sciences, Brunel University London, London UB8 3PH, UK
*
Author to whom correspondence should be addressed.
This paper is an extended version of our paper published in Cryosphere Transformation & Geotechnical Safety ‘21, Salekhard, Russia, 8–12 November 2021; pp. 366–369.
Energies 2022, 15(4), 1515; https://doi.org/10.3390/en15041515
Submission received: 2 December 2021 / Revised: 14 January 2022 / Accepted: 15 February 2022 / Published: 18 February 2022

Abstract

:
Vapour mass transfer is often underestimated when designing the bases for structures in frost susceptible soils. Intensive and long-term vapour transport may lead to excessive frost heaving and associated issues. A vapour transport model and the algorithm of its calculation is presented in this study based on the results of experimental freeze–thaw cycles of nine soil samples with varied density. The temperature field distribution, air voids volume and the energy comprising latent heat for the phase transition and heat extracted during the temperature drop are the main parameters for determining the vapour velocity and the amount of ice formed. According to the results, the average speed of vapour transport in frozen soils was about 0.4 m/h. The amount of ice built in 1 h during uniaxial freezing due to the saturated vapour pressure difference was 1.64 × 10⁻⁵–3.6 × 10⁵ g/h in loose samples and 1.41 × 10⁶ g/h to 5.61 × 10⁷ g/h in dense samples of 10 cm diameter and 10 cm high sections. The results show that vapour mass transfer can increase the risk of ice growth and related problems.

Graphical Abstract

1. Introduction

Frost heave poses huge geotechnical challenges for foundations in cold areas with both seasonally freezing and seasonally thawing soils in arctic regions [1]. Highways and dams are the most vulnerable structures prone to frost heaving [2]. While soil ice formation due to the migration of liquid water has been extensively studied, the role of vapour mass transfer is less well understood.
The focus for the research presented here is Nur-Sultan, Kazakhstan. This is the second coldest capital in the world and is classified as a climate zone III with a minimum day temperature of −41 °C in winter and a record low temperature of −52 °C [3]. It is also one of the most resource-intensive cities in terms of annual investment in the repair of highways and other structures with shallow foundations.
Soils in the city are represented by alluvial mid-Quaternary modern deposits with a thickness of 0.9 to 10.0 m, consisting of sandy clay soils with interlayering loamy sands and sandy clay loams, and clays and silty soils, which can be considered as a highly compressible and frost susceptible base. Eluvial formations of the weathering crust occur as sandy clay loams located beneath the sand and gravel alluvial formations at a depth of 6.0–10.0 m. Gravelly, gruss and rubble soils of eluvial formations of the weathering crust with sufficient bearing capacity have been found at a depth of 7.0 to 23.0 m. [4]. The filtration coefficient for alluvial medium-upper Quaternary modern soils ranges from 0.2–0.6 m/day for alluvial sandy clay soils, 3.8 ÷ 15.7 for medium size sands and 17.32–30.29 m/day for gravel and gravel soils. The filtration coefficient for eluvial formations underlying Quaternary sediments ranges from 0.001–0.007 m/day for sandy clay soils, 2.4 ÷ 20.0 m/day for grit-crushed stone soils and 0.37 ÷ 11.5 m/day for fractured sandstones. The sites are periodically flooded with rain and melt water and the groundwater level is relatively high and prone to frost heaving in the winter and weakening during thaws in the spring. The increased density and thermal conductivity of pavement materials and structures creates low-temperature fields near structures and enhances increased moisture transfer due to cryosuction forces that exacerbate frost heaving.
There are few widely recognized concepts of frost heave, notably the segregation potential perspective introduced by Konrad and Morgenstern, which implies water migration [5], and the discrete ice lens theory modified by Gilpin [6]. Both imply that moisture mass transfer occurs in a liquid state, i.e., a water–ice phase transfer. The water–ice energy balance was also considered in the coupled heat–moisture transfer, the application of which was later used in the FROSTB model [7]. Gorelik and Kolunin V.S. demonstrated that in an ice body with low hydraulic permeability all solutes and inclusions concentrate in air bubbles, which slowly move towards the warm side, where the surface tension has a reduced value [8]. This approach explains the formation of uniform blanket ice body formation containing soil particles. Arenson and Sego, in their conceptual model for ice growth in the coarse soils, observed that ice segregation in the coarse soils starts from the grain skeleton, as the thermal conductivity of the sand particles surpasses the water conductivity [9]. Moreover, the growth of ice needles starts from the sand particles’ surface in a perpendicular direction and the concentrated brine was steadily moved to the pore centres [9].
Water–ice transformation modelling in fully saturated soils and moisture mass transfer in a liquid state have been widely studied and explained by Ming and Li, among others [10,11]. Henry, in her review, has summarized that frost heave is the conversion from the liquid part to the solid, which is dependent on: a removal of heat, a means of transporting the ice away from the pores and a water supply [12]. Arenson et al., discovered that vertical ice vein growth precedes the horizontal ice lens formation [13] and noted that vertical veins do not grow in thickness over time, unlike horizontal lenses. They did not identify in what phase the moisture was transported, but did note concerns about the suction required to drive the hydraulic conductivity in atmospheric pressure by determining that the negative pressure should be no less than 900 kPa to draw up the water [13]. Concerning the crack formation concept, Azmatch et al., recognised that it is still unclear whether the horizontal cracking of the soil during ice lens formation occurs due to desiccation shrinkage or thermal strain [14].
In this work, the moisture transfer in a gas state was considered. The pressure reduction in the cold temperatures on the top of the sample and the higher pressure in the warm layers induced saturated vapour transport from the high pressure towards the freezing fringe zone. Moreover, the vapour does not have a capillary surface tension; hence, its transportation is more reliable in terms of hydrodynamics and tension. This article is an extended version of Sarsembayeva et al. [15] with detailed examples of the calculation presented by the height of the samples with various density.

2. Materials and Methods

The laboratory testing was implemented by freeze–thaw cycles of 9 soil columns chilled from the top downwards and supplied with deionized water from the base (open system) [16]. The environmental chamber was designed based on the ASTM D 5918-06 standard [17], although the cooling rate and the sample preparation has been modified. Each soil column of 50 cm length and 10 cm diameter was compacted with the dry density varying from very loose to very dense soils, with a range of 1177 to 1800 kg/m³ (Table 1). A mould for packing a soil sample was assembled from plastic rings 10 cm high. Gradual compaction of the samples was carried out with alternating filling of a portion of soil to ensure uniform density along the height. The samples with loose density received a smaller number of blows and energy effort per 5 cm soil layer. Each subsequent column had a higher density and accordingly more mechanical energy, i.e., hammer blows, applied during packing. After packing, each column was securely wrapped with cling film and installed with water supplied to the base (Figure 1). A thermocouple was inserted into the middle of each section, creating a 10 cm height interval. The remoulded samples were prepared using a similar technique to Sarsembayeva and Zhussupbekov [18], with the only difference being the height of the sample and the absence of chemical reagents. The sandy clay samples were modelled in grade and grain size to reproduce natural soils in Nur-Sultan city with similar plasticity limits and engineering properties. The initial physical characteristics of the soil samples are presented in Table 2.
Two freeze–thaw cycles were performed with a slow freeze technique to provide sufficient time for moisture transport and phase transfer and thereby ensure the most favourable conditions for frost heaving [18,19]. The freezing rate was 2 °C/day; the setting temperature dropped up to −24 °C in the chilling collars. However, the minimum temperature in the topsoil layer was only −16 °C to −18 °C. Temperature changes in the sample sections were recorded by 96 thermocouples and recorded via Pica loggers over the entire period of the freeze–thaw cycles. Additional 3.5 kPa surcharges were placed on the soil surfaces, representing the weight of the pavement and evenly distributing the heat extraction over the surface of the sample. Solid plastic rods screwed to surcharges served to measure the vertical linear movements during the freeze–thaw cycles.
After the second freezing cycle, all the samples were immediately removed and moisture was determined in each section by oven drying at 105 °C. The redistribution of dry density was determined by weighing each section and determining the moisture content in each section separately.

2.1. Water Mass Transfer in Freezing Soils

The method presented in this paper, although outwardly similar to the previous work of Konrad and Morgenstern, on the concept of the ice segregation and water migration based on hygroscopic water transport [5,6], is fundamentally different in the presence of the gaseous component in the transport of water in frozen soil. The further stages of frost heave have been considered for unsaturated soils without a chemical component:
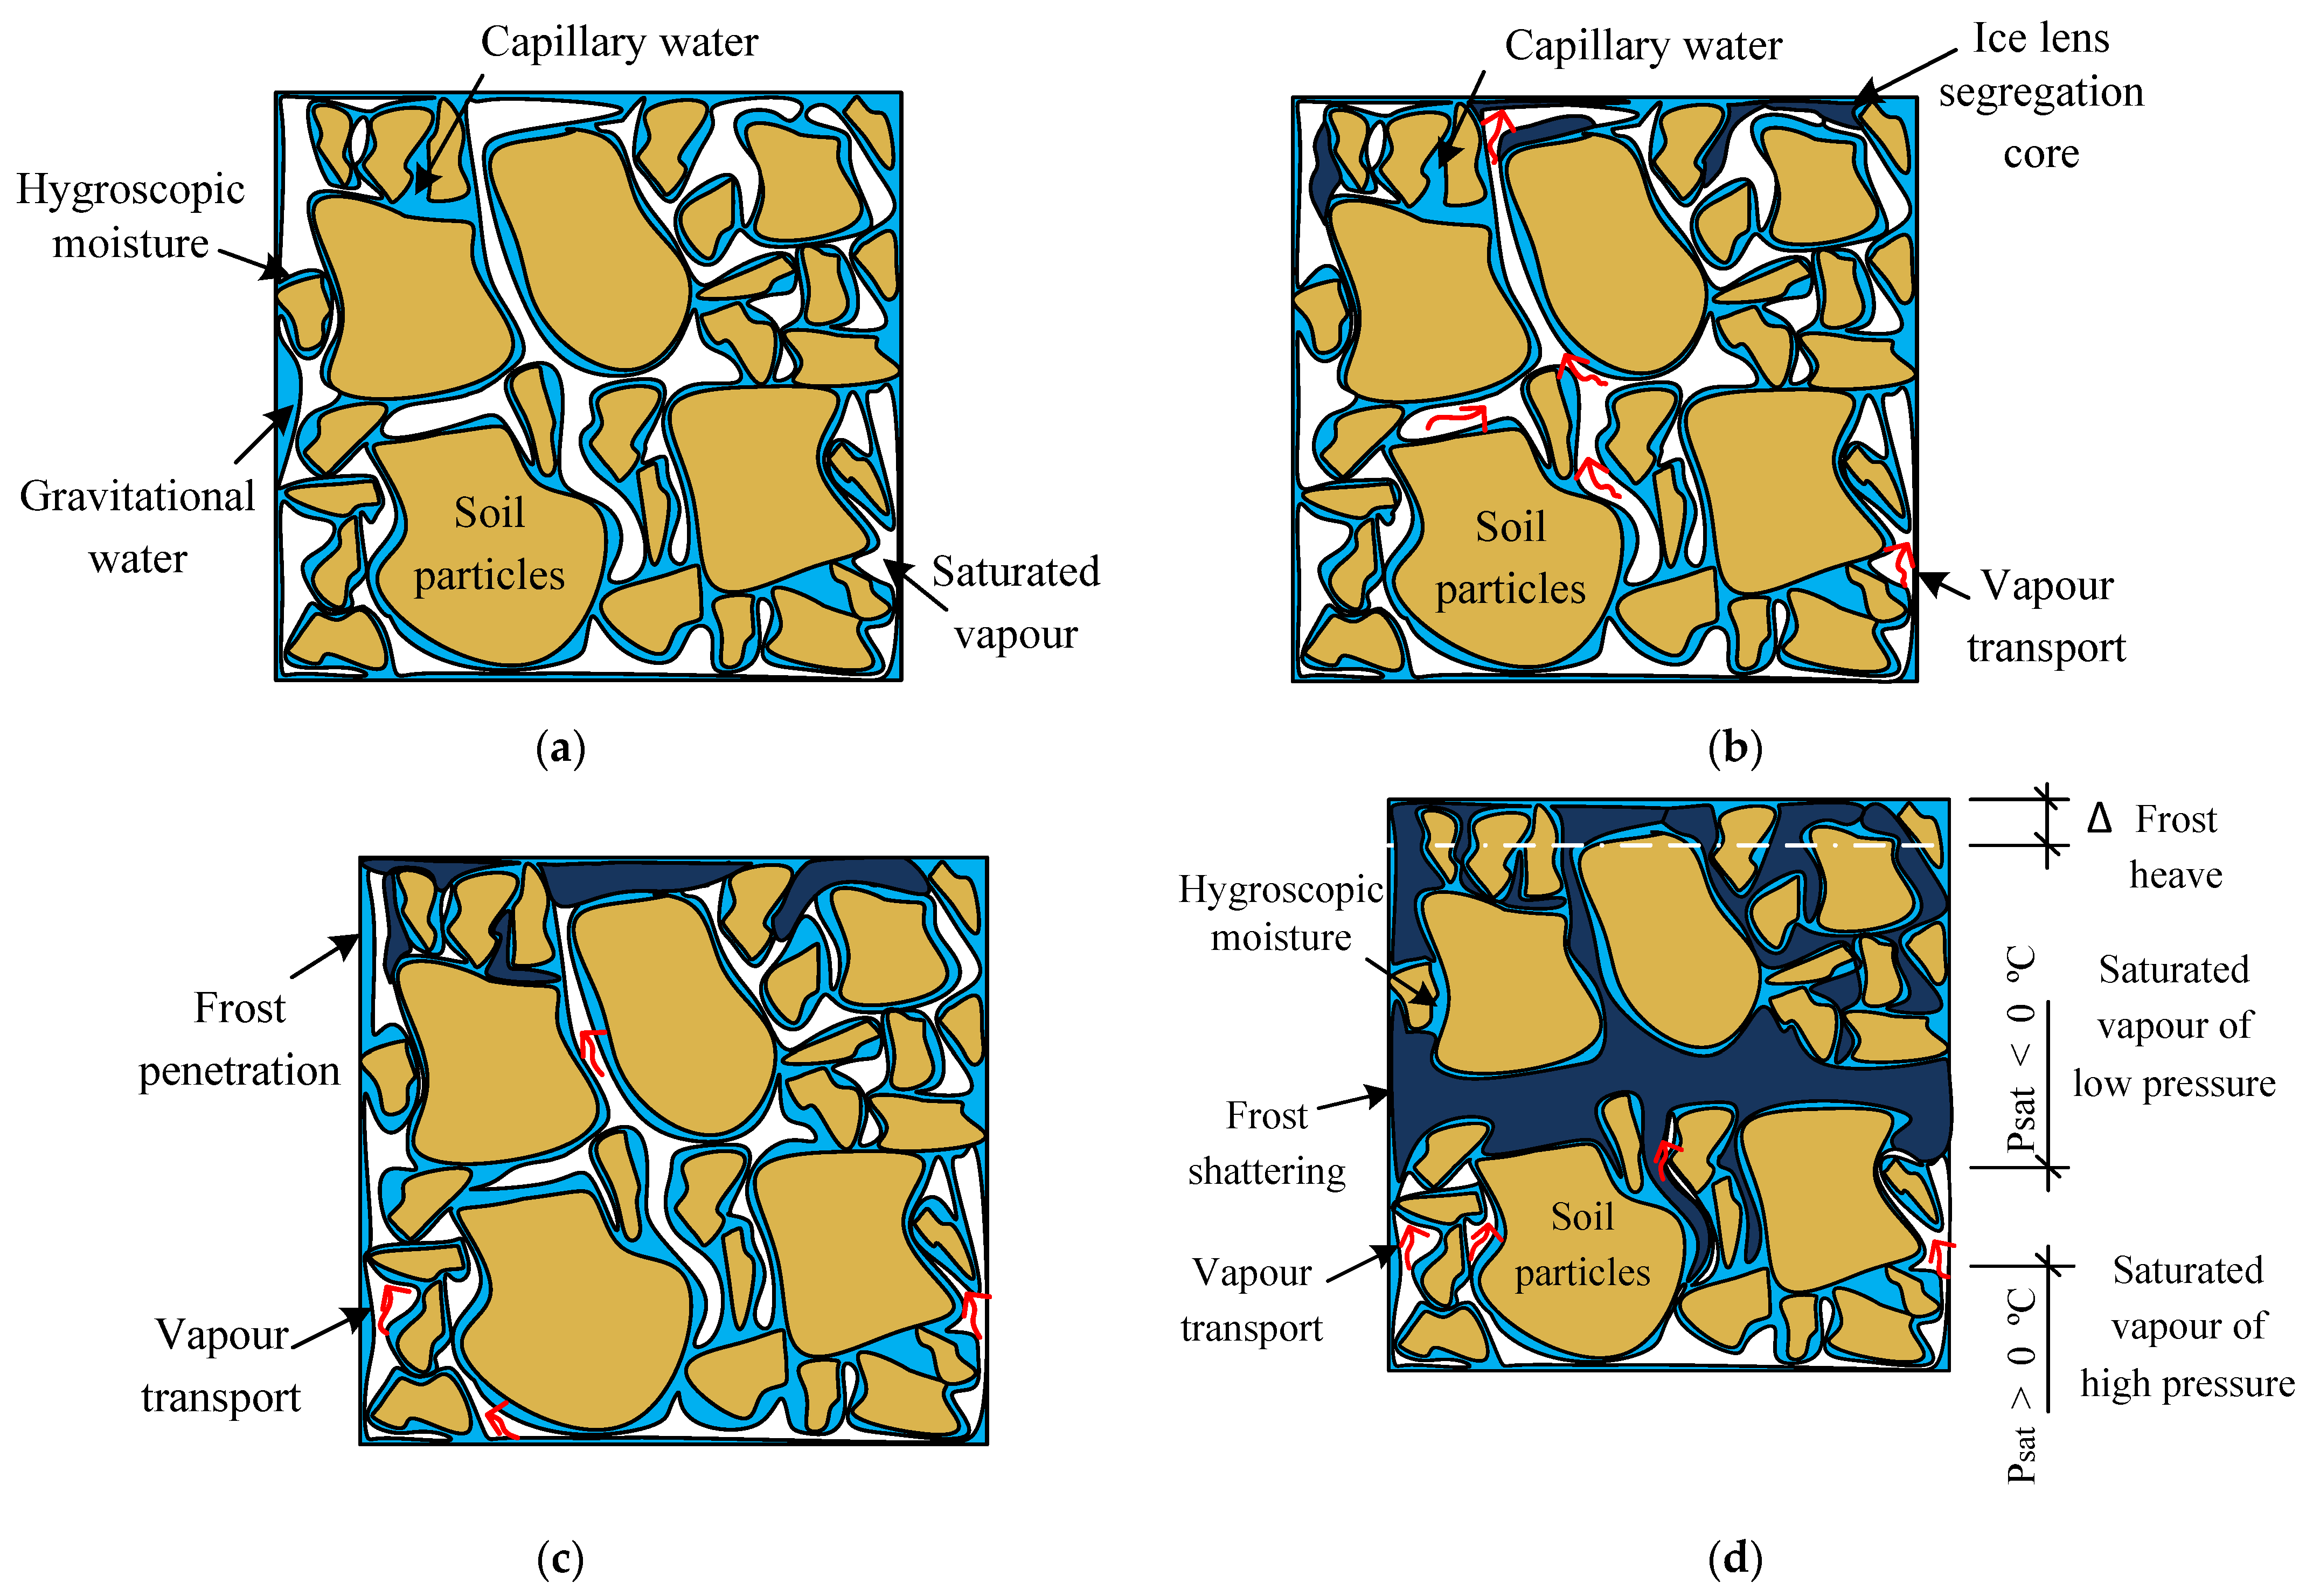
  • In Figure 2a, an unfrozen soil sample with relatively low moisture content is presented. The degree of saturation is S₀ < 1, therefore the sample is unsaturated. The soil is considered as a closed system with a phase equilibrium condition. The moisture here is considered in two phases: the liquid part presented with gravitational, hydroscopic and capillary water and the gas phase in the form of saturated vapour. The equilibrium between the water and vapour phases in a porous soil media is established when the temperature T and pressure P are stabilized.
  • In Figure 2b, the sample is considered at the beginning of the freezing period, when the ice lenses’ cores have just started to segregate. The soil structure in the freezing fringe includes the moisture in three phases: the solid part—ice lenses; the liquid phase—hydroscopic; and the capillary water and the gas phase—saturated and unsaturated vapour.
  • In Figure 2c, the moisture mass transfer in terms of vapour migration continues, progressively filling all the pore volume with ice, which starts with the pores nearest to the vertical channel or the so-called ice veins.
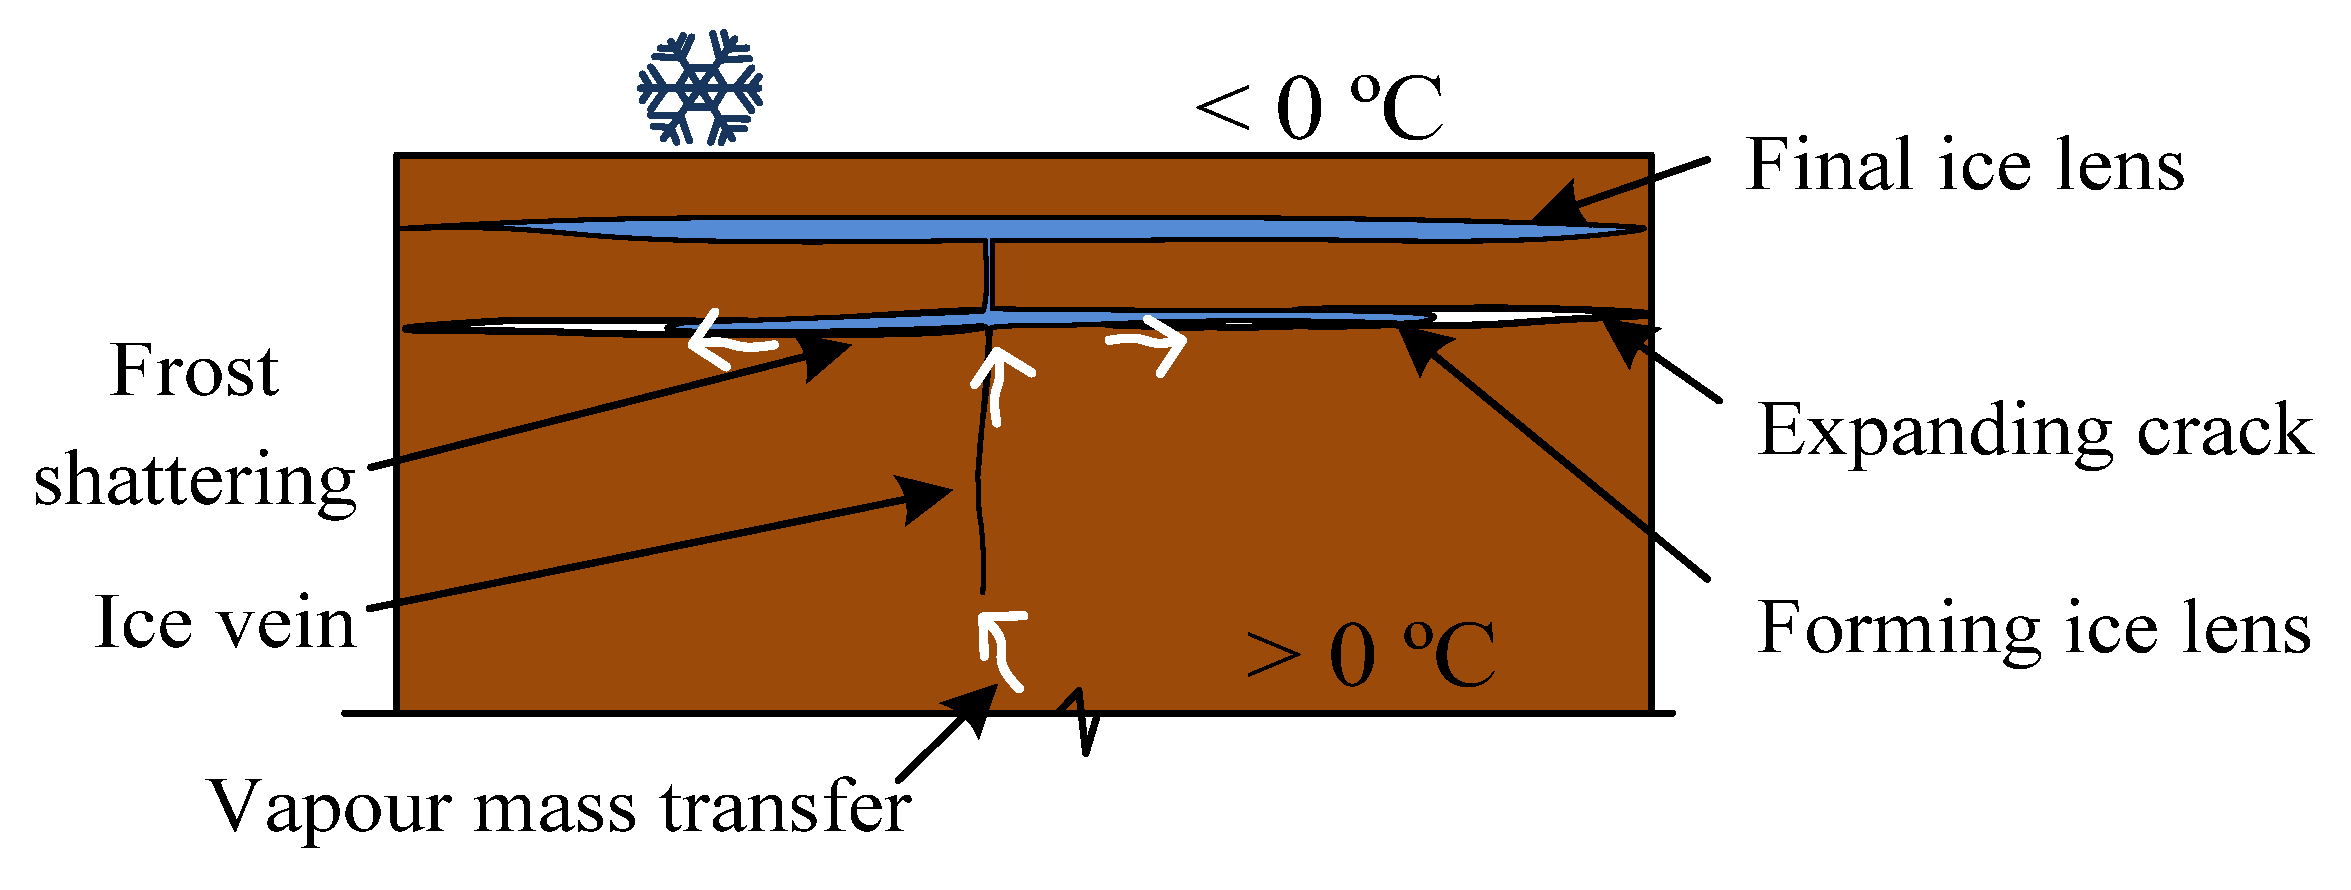
  • In Figure 2d, all pores of the top layer are filled with ice and the suction in the vertical vein is still inducing the vapour mass transfer; the uneven filling of the soil layer induces a horizontal crack. This crack continues to fill with ice and lifts the soil layer in the only possible direction—upwards. As a result, the formed frost heaving is equal to ∆ (Figure 2d). The thickness of the horizontal crack increases until the overburden pressure equilibrates with cryosuction, after which the vapour mass continues to fill the lower layer pores (Figure 3).

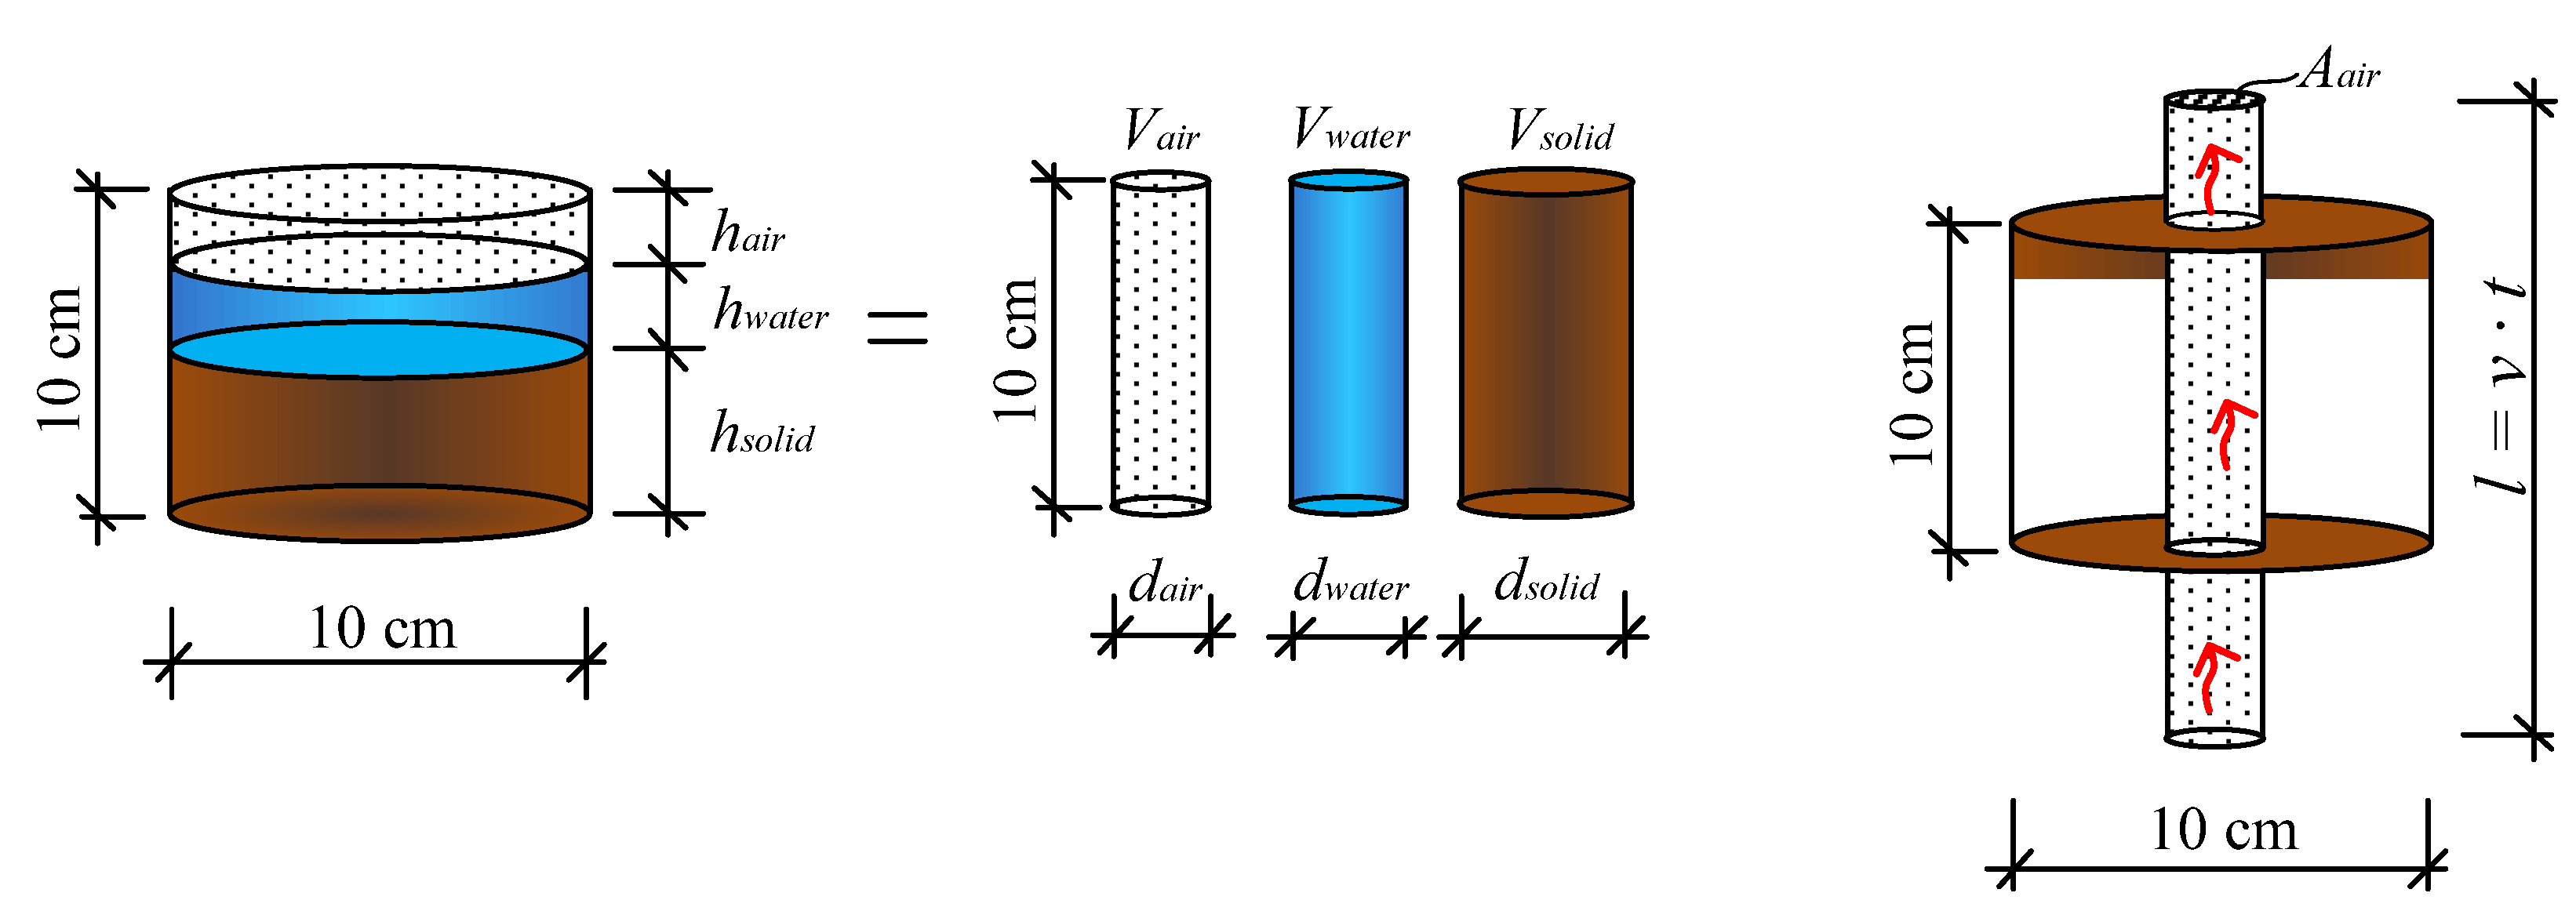
2.2. Vapour Mass Tranfer in the Gaseous State

The calculation of the moisture transfer in a gaseous state was based on the temperature data and a volumetric ratio of gaseous liquid and solid medium in timeline. Porosity and the volume of air are the crucial characteristics for vapour mass transfer in freezing soils. The reason for this is that the mass transfer of vapour is based on convection of a vapour flow from warmer to colder parts due to the difference in pore pressures during uniaxial freezing and accompanying phase transitions, i.e., condensation and freezing of excess gas on cold surfaces, as well as evaporation in warmer lower soil layers. A greater volume of air means more convection capacity in the soil. The amount of vapour in the pores is also highly temperature dependent. Evaporation/sublimation occurs in warm parts and condensation/deposition in the cold due to the pressure of saturated vapour over ice or water, therefore the transfer of moisture in the gaseous state explains the cryosuction forces. It is notable that the phase transfer from the gas to the liquid state happens with the high compression of molecules and volume release. The latent heat for condensation to 1 kg of water C c o n d = 2.3 × 10 6   J is more than six times higher than that for segregation to ice C = 335 × 10 3   J . Since there is no capillary surface tension during the vapour transport, it can pass through the smallest pores.
An algorithm for determining mass transfer in a gaseous state is shown in Figure 4. Therefore, by knowing the volume and mass of the soil, V s o i l and m s o i l , as well as the humidity W   and temperatures T at the boundary points along the height, it is possible to determine the bulk and dry density of soil ρ d r y and the corresponding volumetric weight characteristics of each constituent: water V w a t e r , solid particles V s o l i d , air voids V a i r and porosity e.
Another important parameter to determine the mass transfer is time t i . It is presumed that the concentration of vapour in an enclosed space tends to full saturation. To determine the mass of the vapour m v a p o u r , t i at the initial or final moment of the period, it is necessary to know the pressure of saturated vapour over water or ice corresponding to the phase state and temperature:
m v a p o u r , t i = μ · P s w · V a R · T
where μ—molar mass of vapour and equal to 18.01528 (33) g/mol; P s w , P s i —saturated vapour pressure over water, ice surface corresponding to the temperature, Pa; R—Universal gas constant, 8.3144598 J/(mol·K), which corresponds to 8.3144598 m 3 · Pa K · mol , T—temperature in Kelvin.
Further, by the mass of vapour, its density is determined for a certain time and temperature (Figure 4). However, to find the volume of vapour passing through the soil section over time the cross-section of the air channel must be determined.
Based on experimental studies [1,12,16,18], porosity and volume of air are the most important characteristics for moisture transfer in freezing soils. The classical understanding of the volumetric relationship of a soil sample is given on the left side of Figure 5. In this study, the volumes are regrouped as separate cylinders (Figure 5) as this makes it possible to calculate the cross-sectional area of each of them. The calculation of vapour volume passed through the section over time is found via the speed of vapour passing through the air voids’ cross-section A a i r over the time t:
V v a p o u r = v · t · A a i r  
where v —average speed of vapour, cm/h; and A a i r —cumulative cross-section of the air voids A a i r = π · d a i r 2 4 , cm², corresponding to the porosity coefficient and moisture content.
Further, returning to the algorithm for calculating the vapour mass transfer in Figure 4, the heat transfer for the gaseous constitutive Q during the calculated period t of the test in section was found as total energy spent on the temperature drop ΔΤ of the gaseous phase Q₁ and the latent heat of the vapour part transitioning from the gas phase to the solid ice phase Q₂, called the deposition.
Q · t = Q1 + Q2 = mvapour,t2 · C · ΔT + (mvapour,t1mvapour,t2) · L · m · C · ΔΤ
Expressing the mass with volume and density and substituting Equation (1) for the vapour volume it became possible to calculate the speed of vapour transfer. The vapour speed is found at the beginning and at the end of the time period:
v v a p o u r = 4 Q C · ρ · π · d a i r 2 · Δ T · t = Q C · ρ · A a i r · Δ T · t
The mass of ice built from the vapour passing over time t with speed v over the cumulative air channel cross-section A a i r is calculated:
m i c e = ρ v a p o u r · V a i r = ρ v a p o u r · v · t · A a i r
where m i c e —mass of built ice in grams; ρ v a p o u r —is taken as an average density value of the vapour densities at the start and the end time point, g/cm³.
The volume ratio between the phases of a liquid and a solid medium changes with time and, accordingly, so does the pore space. Consequently, it is necessary to consider the formed ice lenses and cracks, and the negative pressure present due to the formation of lenses during frost heaving. These volumetric changes need to be tracked over time and updated in computer simulations of ice lens growth.
The main benefit of the proposed calculation method is the determination of vapour mass transfer based on the known physical laws. The calculation considers the data obtained through the ongoing monitoring of volumetric and temperature data without applying empirical formulas or coefficients.

3. Results

Temperature distribution along the x axis can be conditionally divided into: first, the consolidation zone; second, the freezing and thawing cycles (Figure 6). Temperature distribution over the sample length showed a cooling deceleration in the transition zone through zero degrees due to the latent heat of freezing. This is especially evident in large time intervals between 0 °C and −5 °C isotherms, which is explained by the specific heat of crystallization of water in the soil and requires much more energy than for its cooling. There is no clear pattern in the distribution of the temperature field inside samples with different densities. Slow freezing in this test gives enough time for phase transitions and uniform cooling and the density of the soil samples in this case does not affect the freezing rate. However, in loose density samples (Figure 6a–d), the isotherms in the first freezing cycle penetrate deeper than in the second, this is due to the large moisture content drawn upward in the second freezing cycle than in the initial state of the samples before testing. Due to the high heat capacity of water, a larger amount of heat removal is required to cool the samples.
Moisture redistribution after freeze–thaw cycles is presented in Figure 7. In the top 10 cm layer, ice lens formation caused a highly irregular distribution of moisture, which was confirmed by the centimetre-resolution sampling. Since the ground water supply table was quite shallow at 45 cm depth the moisture intake is high and this induces the capillary rise. For this reason, the moisture increase at a depth of 15 to 45 cm from the soil surface was very stable and depended just on the density of the soil samples.
The frost heave that occurred in the soil samples with various densities indicates a strong connection between the packing of soil particles and the amount of frost heaving and its progress (Figure 8). The maximum rates of frost heave were achieved in columns #7 and #8, where the dry density was close to the maximum value 1650–1790 kg/m³, while the loose soil samples with dry density 1180–1470 kg/m³ registered very weak heaving in the first cycle and consolidation or compression in the second cycle compared with the initial volume.
The dry density change in soil samples during two freeze–thaw cycles are presented in Figure 9. The columns with loose densities were consolidated throughout the column length with the densest part in the bottom of the samples. In comparison, in the dense soil samples only the 10 cm layer on top was loosened, which also attracted a large amount of water to form ice lenses.

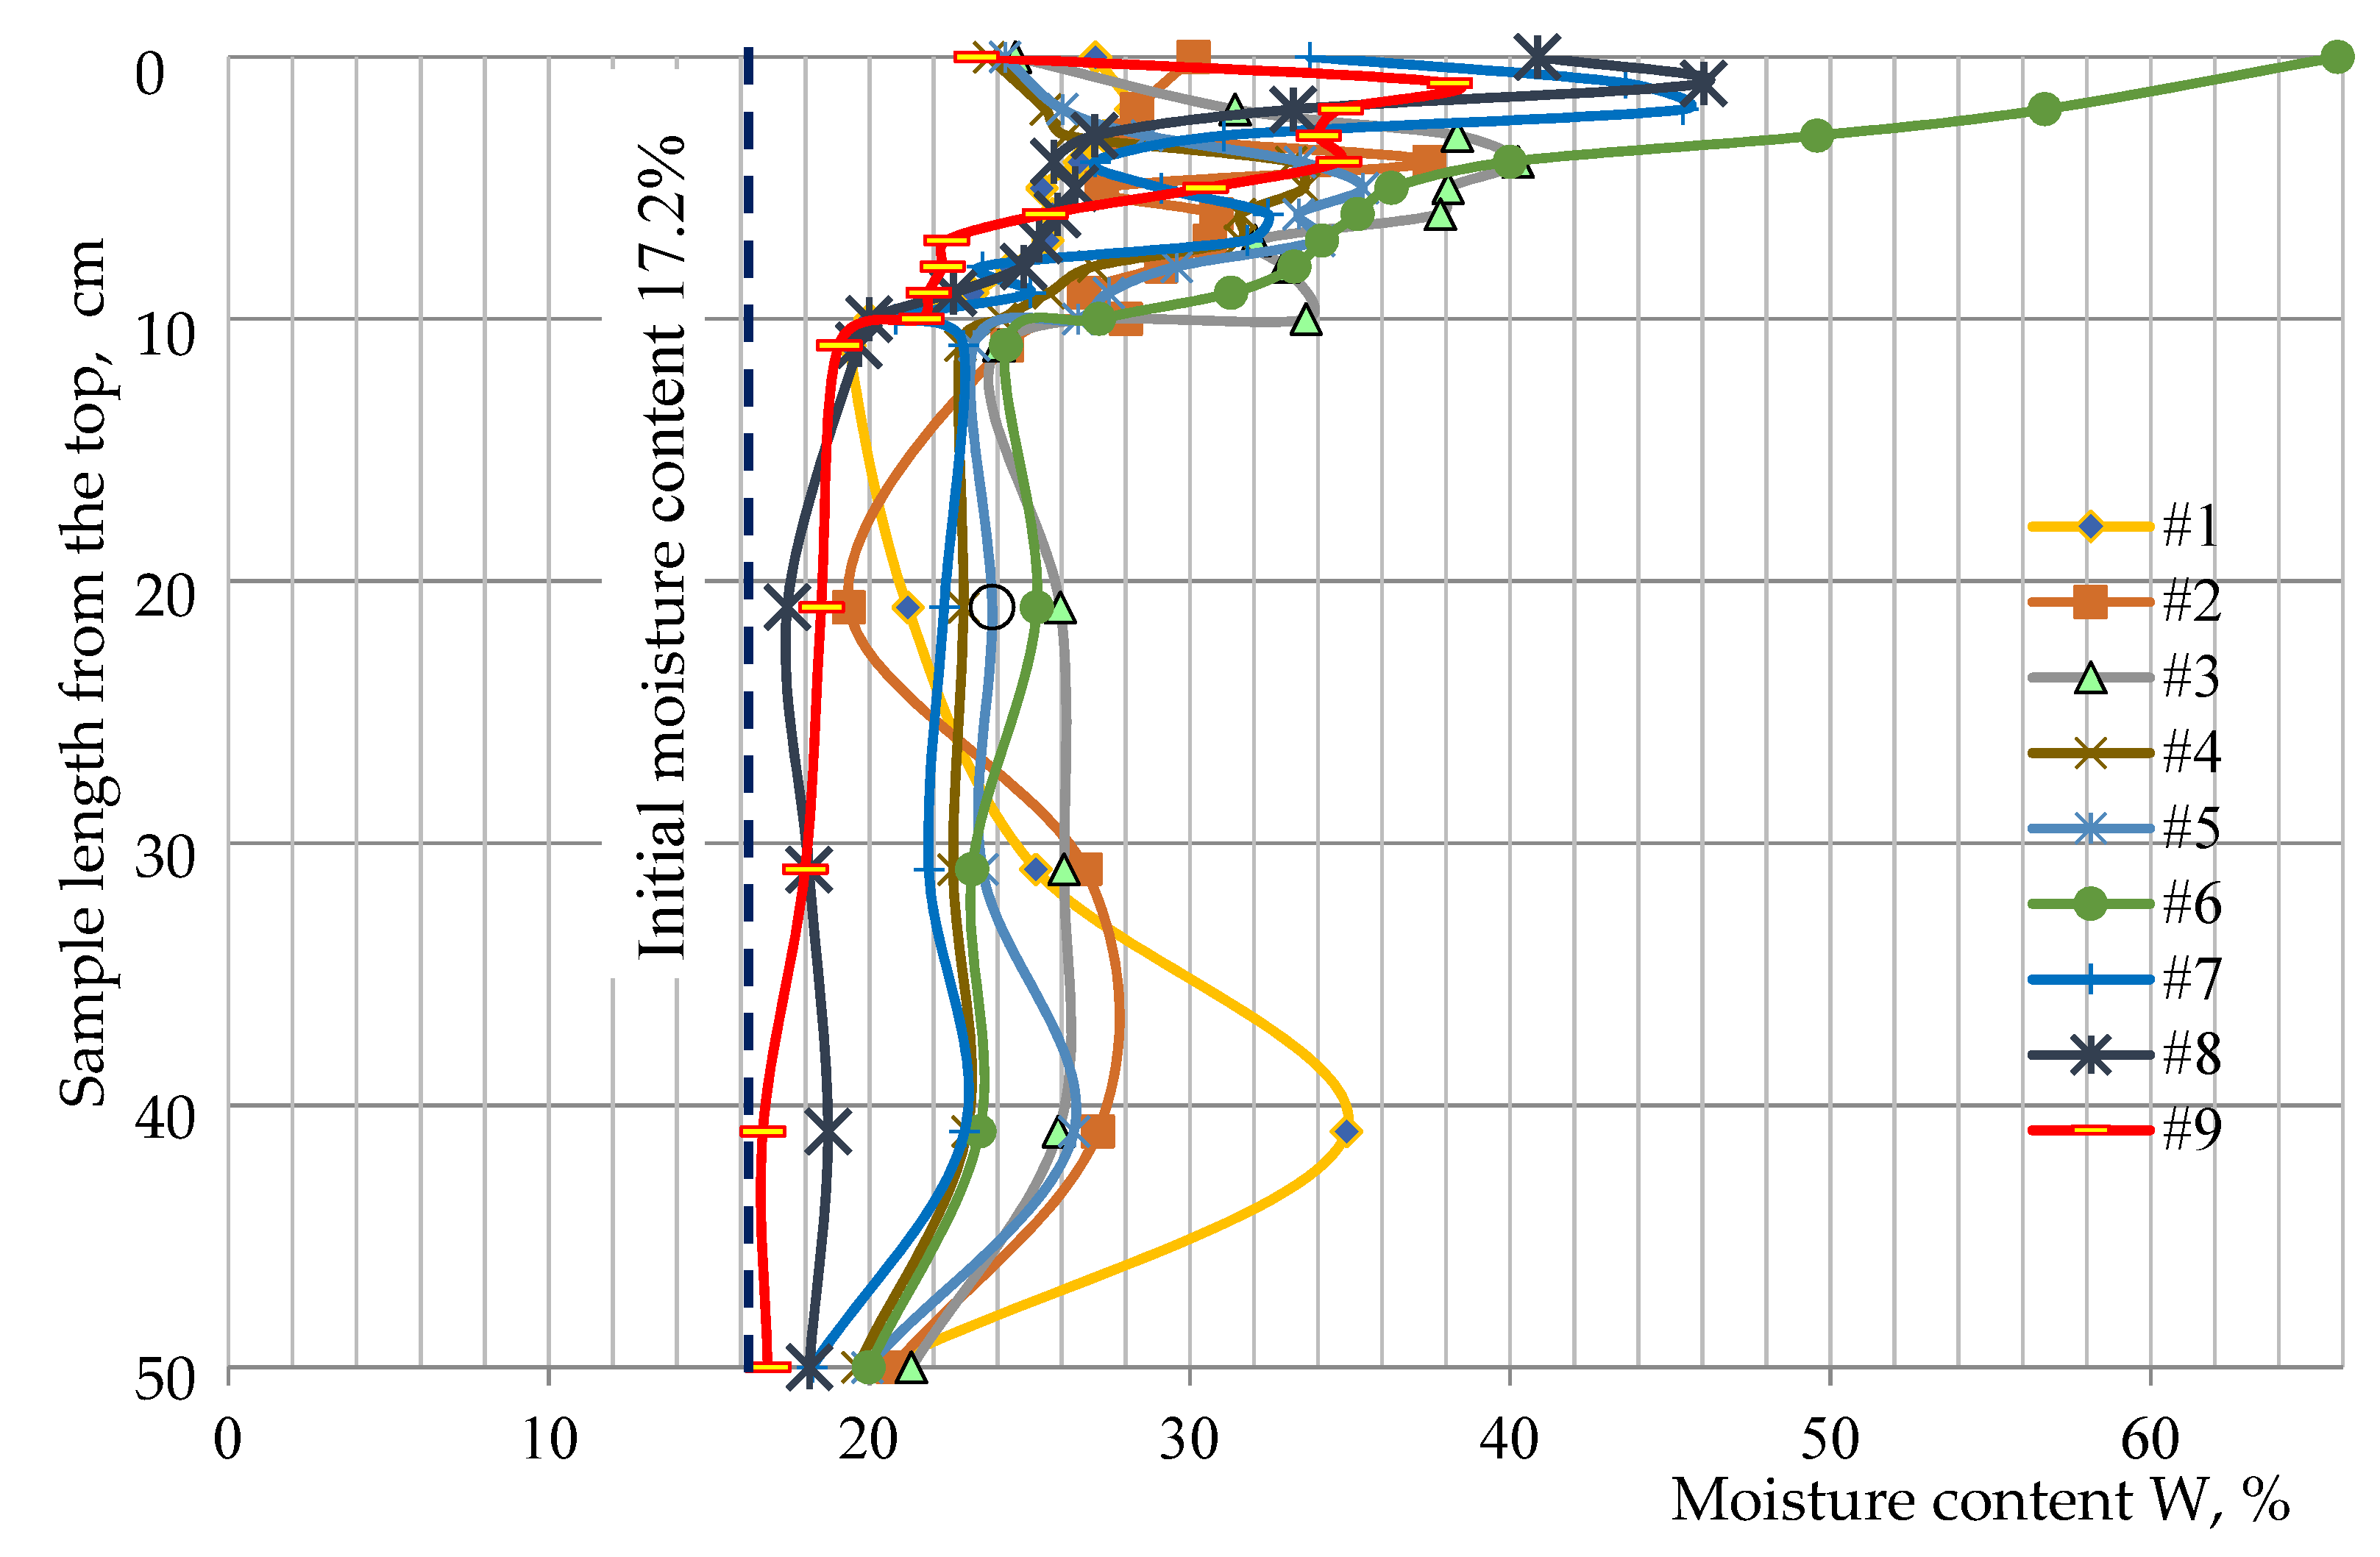
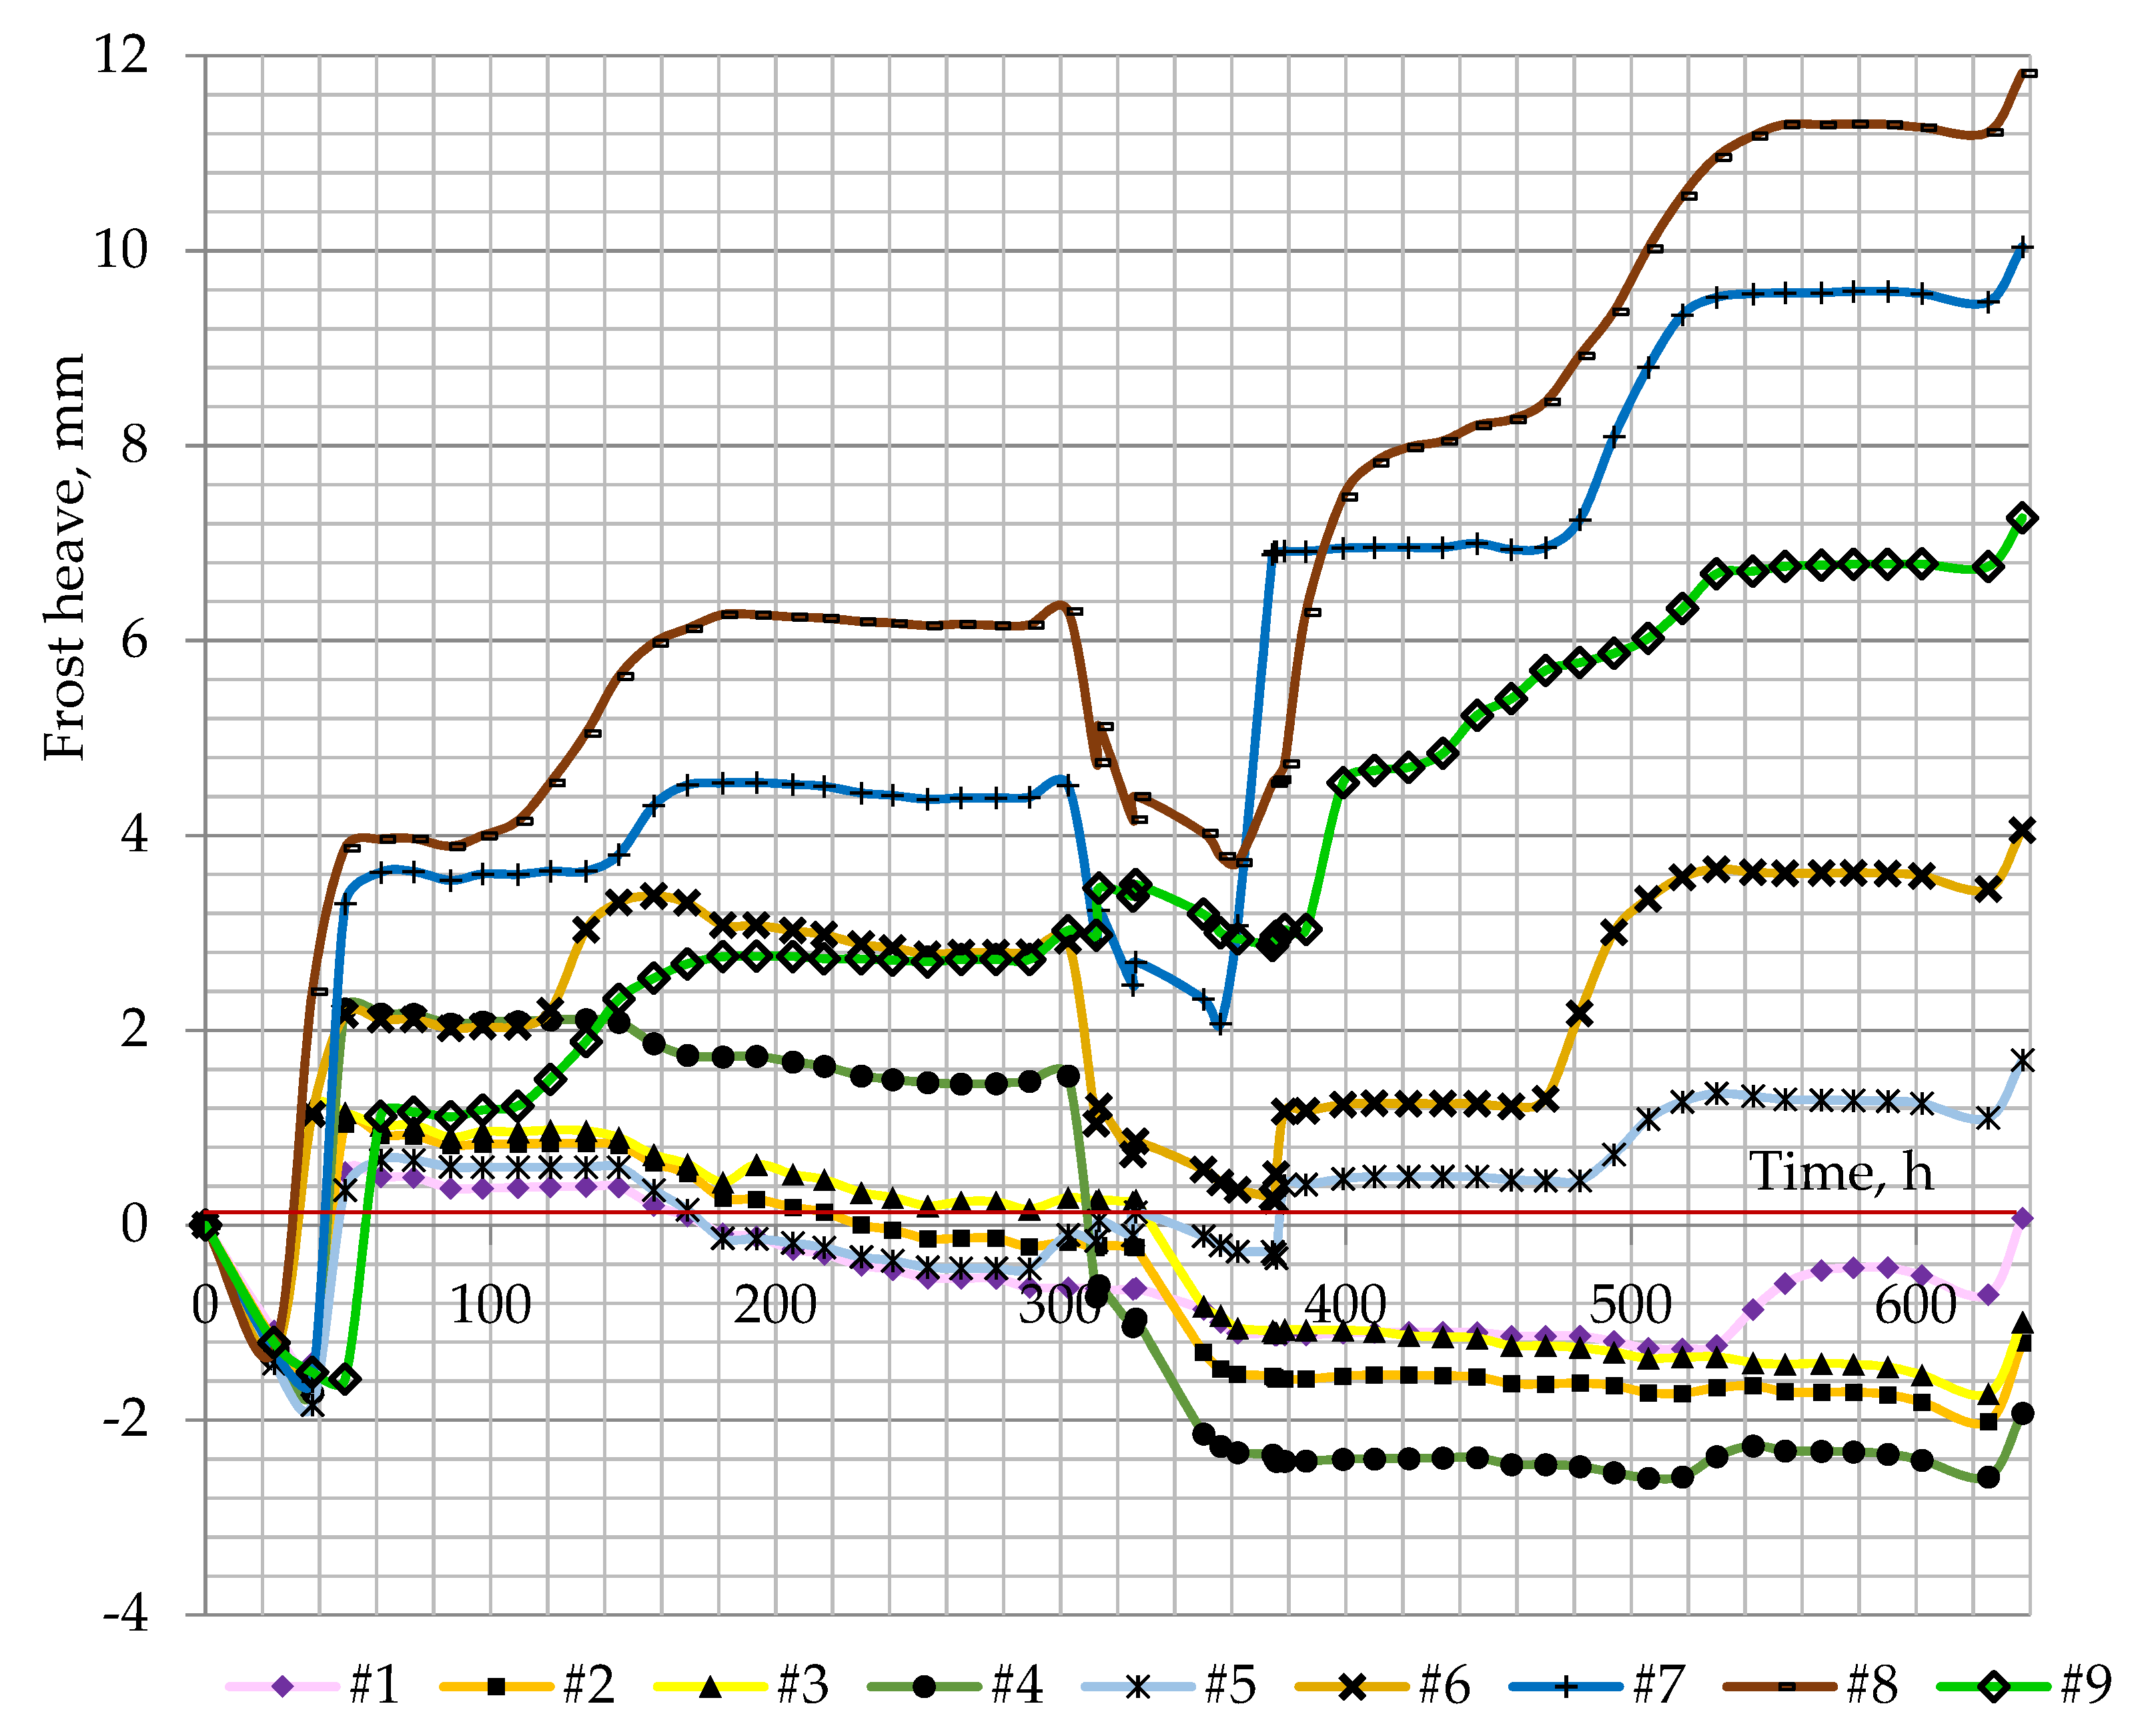
Vapour Mass Transfer in Soil Samples

Since the density, moisture and void ratio have the greatest influence on the amount of vapour transported, the general volumetric parameters of the tested soil columns are presented in Table 3.
Based on the volumetric data, temperature change and the distribution of these parameters over the height of the samples, the vapour transfer was calculated using the example of columns #1, #7, #8 and #9 during the calculated period 494–518 h in the second freezing cycle (Table 4 and Table A1, Table A2 and Table A3). Columns #7, #8 and #9 were chosen as the densest and preferred as soil bases for roads, buildings and structures. The calculation was carried out according to the algorithm presented in Figure 4. The void ratio was determined according to the vertical movement gauges’ data from the top of the environmental chamber. According to the temperature data for 494 h and 518 h, the corresponding mass of saturated vapour and density were calculated for each 10 cm high section.
The heat released from the vapour constitutive comprises the energy extracted for cooling down from the temperature at 494 h to the temperature at 518 h and the latent heat of the vapour part transitioning from the gas phase to the solid ice phase, called the deposition. Since the latent heat of deposition of the freezing part of the vapour is more than 100 times higher than the temperature difference in the heat capacity of the vapour during cooling in 24 h, this part of the energy has a greater influence.
As the temperature decreased approximately for 2 °C per 24 h in the top layers, the pressure of saturated vapour over the ice reduced to 11–13%, which caused vapour migration towards lower temperatures. At the same time, the similar part of the vapour deposited and froze on the cold surfaces of the ice crystals from above. In the lower sections, the temperature drop comprised 0.5–1.0 °C per 24 h, while the saturated vapour pressure over ice reduced to 3–7%.
The void ratio in the top section is two times that at 50 cm depth from the top in the dense samples; the loosening process is clearly observed in the top layers of the soil samples packed with 1.64–1.76 g/cm³ dry density. In the soil loose density samples with 1.21–1.63 g/cm³ the void ratio redistribution is not so unambiguous. The frost heaving and consolidation processes in the loose samples led to the restructuring of the skeleton of solid particles in the sample. The volume of air/vapour in the pores of one section was varying from 4 cm³ in the top to 19 cm³ in the dense samples, while the top layers’ pores were filled with ice lenses. The loose packed samples had 170–215 cm³ air volume and the intensive vapour mass transfer occurred there due to the increased air volume, as the cumulative cross-section is larger there.
The speed of vapour transfer is related to the temperature field distribution. The vapour rate was around 0.4 m/h in the heaved soils, while in the phase transition zone it accelerated due to the extensive energy of latent heat for deposition.
The obtained ice mass formation rate was in the range of 1.64 × 10 5   –3.60 × 10 5     g/h in the loose samples and 1.42 × 10 6 g/h to 5.61 × 10 7 g/h in the dense samples (Table 5). In the top layers with excessive ice lens formation the vapour transfer speed dropped to 6.40 × 10 8   g/h (Table A1).

4. Discussion

The modified freeze–thaw cycles with slow freezing rates and longer sample length allowed for approximating the freezing process of the soils close to natural conditions. According to Iushkov and Sergeev, the greatest values of the frost heave are achieved when the freezing rate in the unidirectional freezing test of the soil is compiled between 2 and 3 cm/day [19], while Arenson et al., noted that the steady state thermal conditions were achieved for the final ice lens growth at a cooling rate of 3 °C/day [20]. In the current study, the temperature decrease of the cold plate was set at 2 °C/day and was run independently from the freezing rate in the samples. The most favourable conditions for the frost heave formation were distinguished at the freezing rate of 2 cm/day, which agrees with the results obtained by Iushkov and Sergeev [19].
The conceptual model ice growth of Arenson et al., is correct for coarse grain soils with lower surfactant forces and a greater proportion of gravitational water [13]. However, it is not applicable to frost susceptible soils, where the surface tension and particle surfaces charge come to the fore, while the role of vapour transfer is undeservedly underestimated in the frost heaving processes.
Henry, while stating that the latent heat of freezing is part of the frost heave transport process, also proposed that there is a relationship between frost heave and the drying or evaporating from liquid water, yet went no further in defining this [12]. She emphasized how the initiation of ice lenses is associated with the phase transformation from liquid to solid state, accompanied by the replenishment of desiccated areas with water flow from the unfrozen soils. However, this understanding has been implied only regarding the liquid and solid states of the soil structure.
The amount of transported moisture is related to the withdrawn energy, which is distributed to the phase transfer energy and the cooling of each soil component, according to its heat conductivity. The supplementary requirement for the mass transfer is sufficient time. Incidentally, this is related to the travel distance of the vapour along the pore channels tortuosity.
Therefore, the freezing energy is equal to:
Q = Q s + Q w + Q i + Q v + Q w i
where   Q s ,   Q w ,   Q i ,   Q v —heat loss for cooling down the solids, water, ice and vapour components, respectively, and Q w i —latent heat for the phase transfer from water to the ice state.
In Figure 10 the heat loss for the phase transfer from vapour to ice includes the heat required to transfer the vapour first from a gas to a liquid state, and subsequently into the solid state. The energy loss for the vapour to water phase transfer in the frozen fringe equilibrates with the water to vapour transition in the lower soil layers to stabilize the negative pressure. Eventually, the mass moisture transfer energy corresponds with the crystallization heat release from the liquid to solid state and the low energy-intensive cooling heat. Therefore, the vapour speed increases within the transition through zero degrees.
The hypothesis formation of ice lenses presented in Figure 3 is perfectly combined with the theory of vapour transfer, when water in a gaseous state penetrates through any holes bypassing the surface tension of solid soil particles. The negative pressure occurring in the crack due to the volume expansion enhances the vapour transport to the crack.
Each 1 mm of crack formed in ice lens formation according to the presented examples caused an addition 78.5 cm³ of air volume corresponding to the existing 19 cm³ volume of gaseous state, which caused the reduction of saturated vapour pressure to −1115.5 Pa; not enough to draw in water, although this negative pressure is quite enough to advance the movement of vapour.
This research has implications for infrastructure development in areas that experience seasonal freezing. Ice formation cannot be entirely mitigated by simply draining soils to an unsaturated condition. Consideration of the potential impact of vapour-driven ice growth, and how this occurs, may reduce the risk of damage.

5. Conclusions

The slow freeze–thaw cycles performed in this study improved the understanding of the frost heave phenomena in frost susceptible soils. The following outcomes have been made:
  • A freezing rate of 2 °C/day creates the most favourable conditions for frost heaving and provides sufficient time for the phase transitions in the freezing soils.
  • A model of moisture transfer in frozen soil has been developed and a calculation method presented based on this model.
  • The vapour transfer rate was calculated on the example of soil samples that were subjected to cyclic freezing and thawing. The average speed of vapour transport in frozen soils was about 0.4 m/h.
  • The amount of ice built in 1 h due to the saturated vapour pressure difference over ice comprised 1.64 × 10⁵ to 3.6 × 10⁵ g/h in loose samples and 1.41 × 10⁶ g/h to 5.61 × 10⁷ g/h in dense samples with 10 cm diameter and 10 cm of section height.
  • Each 1 mm of crack formed due to the ice lens formation in the 10 cm diameter and 10 cm high sample caused the addition 78.5 cm³ of air volume to the existing voids and caused −1115.5 Pa of negative pressure which accelerated the vapour transport in the top layer.

Author Contributions

Conceptualization, A.S.; methodology, A.S. and P.E.F.C.; software, A.S.; validation, A.Z. and A.S.; formal analysis, A.Z.; investigation, A.Z.; resources, A.Z.; data curation, A.Z.; writing—original draft preparation, A.S.; writing—review and editing, P.E.F.C.; visualization, A.S.; supervision, P.E.F.C.; project administration, A.Z; funding acquisition, P.E.F.C. All authors have read and agreed to the published version of the manuscript.

Funding

This research received no external funding.

Institutional Review Board Statement

Not applicable.

Informed Consent Statement

Not applicable.

Data Availability Statement

All available data for the current study can be provided upon request by the corresponding author.

Acknowledgments

The author team acknowledges the support of Brunel University London for the provision of facilities and technical support to conduct the laboratory testing, the first author is grateful to the Bolashak scholarship of the Republic of Kazakhstan for the financial support of the research. The authors also thank the organizers of the Cryosphere Transformation & Geotechnical Safety 2021 Conference, the Department for External Relations of Yamal-Nenets autonomous okrug, for the excellent organization of the conference and for covering the article processing charge in the Energies journal.

Conflicts of Interest

The authors declare no conflict of interest. The funders had no role in the design of the study; in the collection, analyses, or interpretation of data; in the writing of the manuscript, or in the decision to publish the results.

Appendix A

Table A1. Calculation of soil parameters for the 24 h time interval for column #7.
SectionVoid RatioTemperature at 494 hMass of
Vapour at 494 h, g
Saturated Vapour Density at 494 h, g/cm³Temp.
at 518 h, °C
Mass
of Vapour at 518 h, g
Heat Released in 24 h, JVapour Speed, cm/DayVapour Speed,
m/h
Built Ice Mass, g/h
top1.14−10.581.420 × 10−62.261 × 10⁻⁶−12.111.264 × 10−60.00041082.3990.4516.405 × 10−8
#710.84−6.753.642 × 10−53.005 × 10⁻⁶−8.063.306 × 10−50.0089935.3460.3901.419 × 10−6
#720.60−4.271.470 × 10−53.595 × 10⁻⁶−5.461.350 × 10−50.0032915.3160.3815.606 × 10−7
#730.59−2.952.998 × 10−53.948 × 10⁻⁶−4.132.757 × 10−50.0064905.9510.3771.132 × 10−6
#740.60−1.212.472 × 10−54.462 × 10⁻⁶−2.372.279 × 10−50.0051893.3770.3729.201 × 10−7
#750.57−0.168.520 × 10−54.799 × 10⁻⁶−0.268.462 × 10−50.0015900.9100.3753.198 × 10−6
Table A2. Calculation of soil parameters for the 24 h time interval for column #8.
SectionVoid RatioTemperature at 494 hMass of Vapour at 494 h, gSaturated Vapour Density at 494 h, g/cm³Temp.
at 518 h, °C
Mass
of Vapour at 518 h, g
Heat Released in 24 h, JVapour Speed, cm/DayVapour Speed,
m/h
Built Ice Mass, g/h
top 0.89−10.762.758 × 10−52.231 × 10⁻⁶−12.522.412 × 10−60.00921070.7460.4461.231 × 10−6
#810.77−6.662.144 × 10−53.025 × 10⁻⁶−8.291.901 × 10−50.0064922.2750.3848.237 × 10−7
#820.50−4.222.459 × 10−53.608 × 10⁻⁶−5.862.185 × 10−50.0073904.3770.3779.267 × 10−7
#830.49−2.635.093 × 10−54.040 × 10⁻⁶−4.344.511 × 10−50.0155890.3790.3711.890 × 10−6
#840.50−0.433.698 × 10−54.711 × 10⁻⁶−2.043.304 × 10−50.0105881.1290.3671.358 × 10−6
#850.50−0.023.767 × 10−54.844 × 10⁻⁶−0.543.636 × 10−50.0035891.0110.3711.398 × 10−6
Table A3. Calculation of soil parameters for the 24 h time interval for column #9.
SectionVoid RatioTemperature at 494 hMass of
Vapour at 494 h, g
Saturated Vapour Density at 494 h, g/cm³Temp.
at 518 h, °C
Mass
of Vapour at 518 h, g
Heat Released in 24 h, JVapour Speed, cm/DayVapour Speed,
m/h
Built Ice Mass, g/h
top 1.01−9.691.066 × 10−62.443 × 10⁻⁶−11.459.240 × 10−60.00381136.8270.4745.050 × 10−7
#910.76−5.961.479 × 10−53.182 × 10⁻⁶−7.541.318 × 10−50.0043914.1780.3815.633 × 10−7
#920.50−2.841.813 × 10−53.980 × 10⁻⁶−4.331.631 × 10−50.0048896.1980.3736.770 × 10−7
#930.49−1.253.721 × 10−54.450 × 10⁻⁶−2.703.362 × 10−50.0096886.9690.3701.375 × 10−6
#940.48−0.706.985 × 10−54.624 × 10⁻⁶−1.146.773 × 10−50.0056917.9260.3822.672 × 10−6
#950.470.091.012 × 10−45.180 × 10⁻⁶−0.549.135 × 10−50.02612044.6820.8528.622 × 10−6

References

  1. Sakharov, I.I.; Paramonov, V.N.; Paramonov, M.V.; Igoshin, M.E. Deformations of frost heaving and thawing of soils during operation and damage to seasonal cooling devices. Ind. Civ. Constr. 2017, 12, 23–30. [Google Scholar]
  2. Kudryavtsev, S.A.; Sakharov, I.I.; Paramonov, V.N. Freezing and Thawing of Soils (Practical Examples and Finite Element Calculations); Monograph; Group of companies “Georeconstruction”: St. Petersburg, Russia, 2014; p. 248. [Google Scholar]
  3. SP RK 2.04-01-2017; Building Climatology. RGP Kazakh Research and Design Experimental Institute of Earthquake Engineering and Architecture: Almaty, Kazakhstan, 2017.
  4. Zhussupbekov, A.; Alibekova, N.; Akhazhanov, S.; Sarsembayeva, A. development of a unified geotechnical database and data processing on the example of nur-sultan city. Appl. Sci. 2021, 11, 306. [Google Scholar] [CrossRef]
  5. Konrad, J.M.; Morgenstern, N.R. Segregation potential of a freezing soil. Can. Geotech. J. 1981, 18, 482–491. [Google Scholar] [CrossRef]
  6. Gilpin, R.R. A model for the prediction of ice lensing and frost heave in soils. Water Resour. Res. 1980, 16, 918–930. [Google Scholar] [CrossRef]
  7. Simonsen, E.; Janoo, V.C.; Isacsson, U. Prediction of temperature and moisture changes in pavement structures. J. Cold Reg. Eng. 1997, 11, 291. [Google Scholar] [CrossRef]
  8. Gorelik, Y.B.; Kolunin, V.S. Amazing permafrost. Nature 2001, 10, 7–14. [Google Scholar]
  9. Arenson, L.U.; Sego, D.C. The effect of salinity on the freezing of coarse-grained sands. Can. Geotech. J. 2006, 43, 325–337. [Google Scholar] [CrossRef]
  10. Ming, F.; Li, D. Experimental and Theoretical Investigations on Frost Heave in Porous Media. Math. Probl. Eng. 2015, 2015, 198986. [Google Scholar] [CrossRef] [Green Version]
  11. Bronfenbrener, L.; Bronfenbrener, R. Modeling frost heave in freezing soils. Cold Reg. Sci. Technol. 2010, 61, 43–64. [Google Scholar] [CrossRef]
  12. Henry, K.S. A Review of the Thermodynamics of Frost Heave; Army Corps of Engineers: Hannover, NH, USA, 2000. [Google Scholar]
  13. Arenson, L.U.; Azmatch, T.F.; Sego, D.C. A new hypothesis of ice lens formation in frost-susceptible soils. In Proceedings of the Ninth International Conference of Permafrost, Fairbanks, Alaska, 29 June–3 July 2008; pp. 59–65. [Google Scholar]
  14. Azmatch, T.F.; Sego, D.C.; Arenson, L.U.; Biggar, K.W. Using soil freezing characteristic curve to estimate the hydraulic conductivity function of partially frozen soils. Cold Reg. Sci. Technol. 2012, 83, 103–109. [Google Scholar] [CrossRef]
  15. Sarsembayeva, A.; Zhussupbekov, A.; Collins, P.E. Vapour transport in the freezing soils. In Proceedings of the Cryosphere Transformation & Geotechnical Safety 21, Salekhard, Russia, 8–12 November 2021; pp. 366–369. [Google Scholar]
  16. Sarsembayeva, A. Evaluation of De-Icing Chemical and Moisture Mass Transfer in Freezing Soils. Ph.D. Thesis, Brunel University London, London, UK, March 2017; p. 176. [Google Scholar]
  17. ASTM D 5918:2013; Standard Test Methods for Frost Heave and Thaw Weakening Susceptibility of Soils. American Society for Testing and Materials: West Conshohocken, AL, USA, 2013; p. p. 13. Available online: https://www.astm.org/d5918-13.html (accessed on 2 December 2021).
  18. Sarsembayeva, A.; Zhussupbekov, A. Experimental study of deicing chemical redistribution and moisture mass transfer in highway subsoils during the unidirectional freezing. Transp. Geotech. 2021, 26, 100426. [Google Scholar] [CrossRef]
  19. Iushkov, B.S.; Sergeev, A.S. Reserach of dependence of frost heaving clay soils to freezing speed. Transp. Transp. Facil. Ecol 2015, 4, 130–139. [Google Scholar]
  20. Arenson, L.U.; Xia, D.; Sego, D.C.; Biggar, K. Brine and unfrozen water migration during the freezing of Devon silt. In Proceedings of the 4th Biennial Workshop on Assessment and Remediation of Contaminated Sites in Arctic and Cold Climates (ARCSACC), Edmonton, AB, Canada, 8–10 May 2005; pp. 35–44. [Google Scholar]
Figure 1. The open system experimental setup used to investigate freeze–thaw cycles in soil columns.
Energies 15 01515 g001
Figure 2. Soil sample structure at the different stages of freezing: (a) unfrozen equilibrium; (b) beginning of the freezing of ice lenses segregation; (c) further freezing or frost penetration; and (d) frost shattering and frost heave stage.
Energies 15 01515 g002
Figure 3. Ice lenses formation in freezing soils.
Energies 15 01515 g003
Figure 4. Algorithm for the vapour mass transfer calculation.
Energies 15 01515 g004
Figure 5. Cumulative cross-section of air voids channel: h a i r , h w a t e r , h s o l i d —volume of air, water and solid particles, V a i r , V w a t e r , V s o l i d —cumulative height of air, water and solids, d a i r , d w a t e r , d s o l i d —diameter of regrouped volumes of air, water and solids, l —length of air path.
Energies 15 01515 g005
Figure 6. Temperature field distribution in columns #1–#9 within two freeze–thaw cycles: figures (ai).
Energies 15 01515 g006aEnergies 15 01515 g006b
Figure 7. Moisture redistribution after freeze–thaw cycles in columns #1–#9.
Energies 15 01515 g007
Figure 8. Frost heaving in soil samples over time.
Energies 15 01515 g008
Figure 9. Dry density change of soil samples during two freeze–thaw cycles.
Energies 15 01515 g009
Figure 10. Energy balance of moisture mass transfer during freezing in soils.
Energies 15 01515 g010
Table 1. Initial density distribution within the soil samples.
Column
Number
Average
Volume in a Mould, m³
Weight of the Compacted Sample in the Mould, kgDensity before the Test, kg/m³Dry Density before the Test, kg/m³
#13.958 × 10³5.46313801177
#23.958 × 10³6.01215191295
#33.958 × 10³6.23615751343
#43.958 × 10³6.81317211467
#53.958 × 10³7.05717831520
#63.958 × 10³7.45218831605
#73.958 × 10³7.66219361650
#83.958 × 10³8.33221051794
#93.958 × 10³8.35521111799
Table 2. Physical characteristics of soil samples.
CharacteristicSymbolUnitValueAnnotation
Initial moisture contentW%17.2according to 95% maximum dry densitymoisture content relationship
Angle of internal frictionφ 24.1CD direct shear test, moisture content W = 17.2%
CohesionCkN/m²10
Particle density of sandy clayρsMg/m³2.615Soil mixture by mass: 50% sand and 50% kaolinite
Uniformity coefficientCu-2.4Uniformly-graded sand
Coefficient of curvatureCc-3.65
Activity of claysA-0.25Inactive clays
Liquid limitwL%37.18CI—Medium plasticity
cone penetrometer test used
Plastic limitwP%23.77Fraction of soil sample passed through 0.425 mm sieve
Average linear shrinkageLS%5
Plasticity indexPI%13
Table 3. Volumetric parameters of soil columns after two freeze–thaw cycles.
Column Mass of Soil after Test, kg Volume of Soil after Test, m³ Mass of Water after Test, kg Bulk Density kg/m³Average Moisture Content W, %Volume
of Voids, m³
Void Ratio eDry Density,
kg/m³
#15.9883.96 × 10³0.806151225.012.18 × 10³12271209
#26.5593.95 × 10³0.887166025.231.99 × 10³10241326
#36.9563.95 × 10³0.920176027.391.92 × 10³0.9511381
#47.9643.95 × 10³1.099201823.781.52 × 10³0.6331631
#57.6223.97 × 10³1.041191825.351.67 × 10³0.7241530
#67.0683.99 × 10³1.005177029.071.77 × 10³0.7861371
#78.2304.04 × 10³1.130203724.501.54 × 10³0.5881636
#88.6124.05 × 10³1.208212420.701.34 × 10³0.4601760
#98.5444.02 × 10³1.211212620.851.30 × 10³0.4561759
Table 4. Calculation of soil parameters for the 24 h time interval for column #1.
Section 1Void RatioTemperature at 494 hMass of Vapour at 494 h, gSaturated Vapour Density at 494 h, g/cm3Temperature at 518 h, °CMass of Vapour at 518 h, gHeat Released in 24 h, JVapour Speed, cm/DayVapour Speed, m/hBuilt Ice Mass, g/h
top1.22−10.444.157 × 10−42.285 × 10⁻⁶−12.283.613 × 10−40.1445944.5830.3941.636 × 10−5
#111.19−4.46.742 × 10−43.552 × 10⁻⁶−6.006.021 × 10−40.1918888.9180.3702.497 × 10−5
#121.10−3.338.182 × 10−43.817 × 10⁻⁶−4.997.307 × 10−40.2330857.5460.3572.924 × 10−5
#131.15−1.388.819 × 10−44.410 × 10⁻⁶−3.207.758 × 10−40.2823879.5790.3663.232 × 10−5
#141.27−0.547.884 × 10−44.676 × 10⁻⁶−1.047.611 × 10−40.0727922.6120.3843.031 × 10−5
#151.230.248.853 × 10−44.934 × 10⁻⁶−0.168.611 × 10−40.0645910.4500.3793.358 × 10−5
1 When marking sample sections the first number represents number of soil column; the second is the position of the section from the top.
Table 5. Comparative table of built ice mass for columns #1, #7, #8 and #9.
Section Built Ice Mass, g/h
#1#7#8#9
top1.636 × 10−56.405 × 10−81.231 × 10−65.050 × 10⁻⁷
#712.497 × 10−51.419 × 10−68.237 × 10−75.633 × 10−7
#722.924 × 10−55.606 × 10−79.267 × 10−76.770 × 10−7
#733.232 × 10−51.132 × 10−61.890 × 10−61.375 × 10−6
#743.031 × 10−59.201 × 10−71.358 × 10−62.672 × 10−6
#753.358 × 10−53.198 × 10−61.398 × 10−68.622 × 10−6
Publisher’s Note: MDPI stays neutral with regard to jurisdictional claims in published maps and institutional affiliations.

