
Research into Cryolithozone Spatial Pattern Changes Based on the Mathematical Morphology of Landscapes


Abstract
:1. Introduction
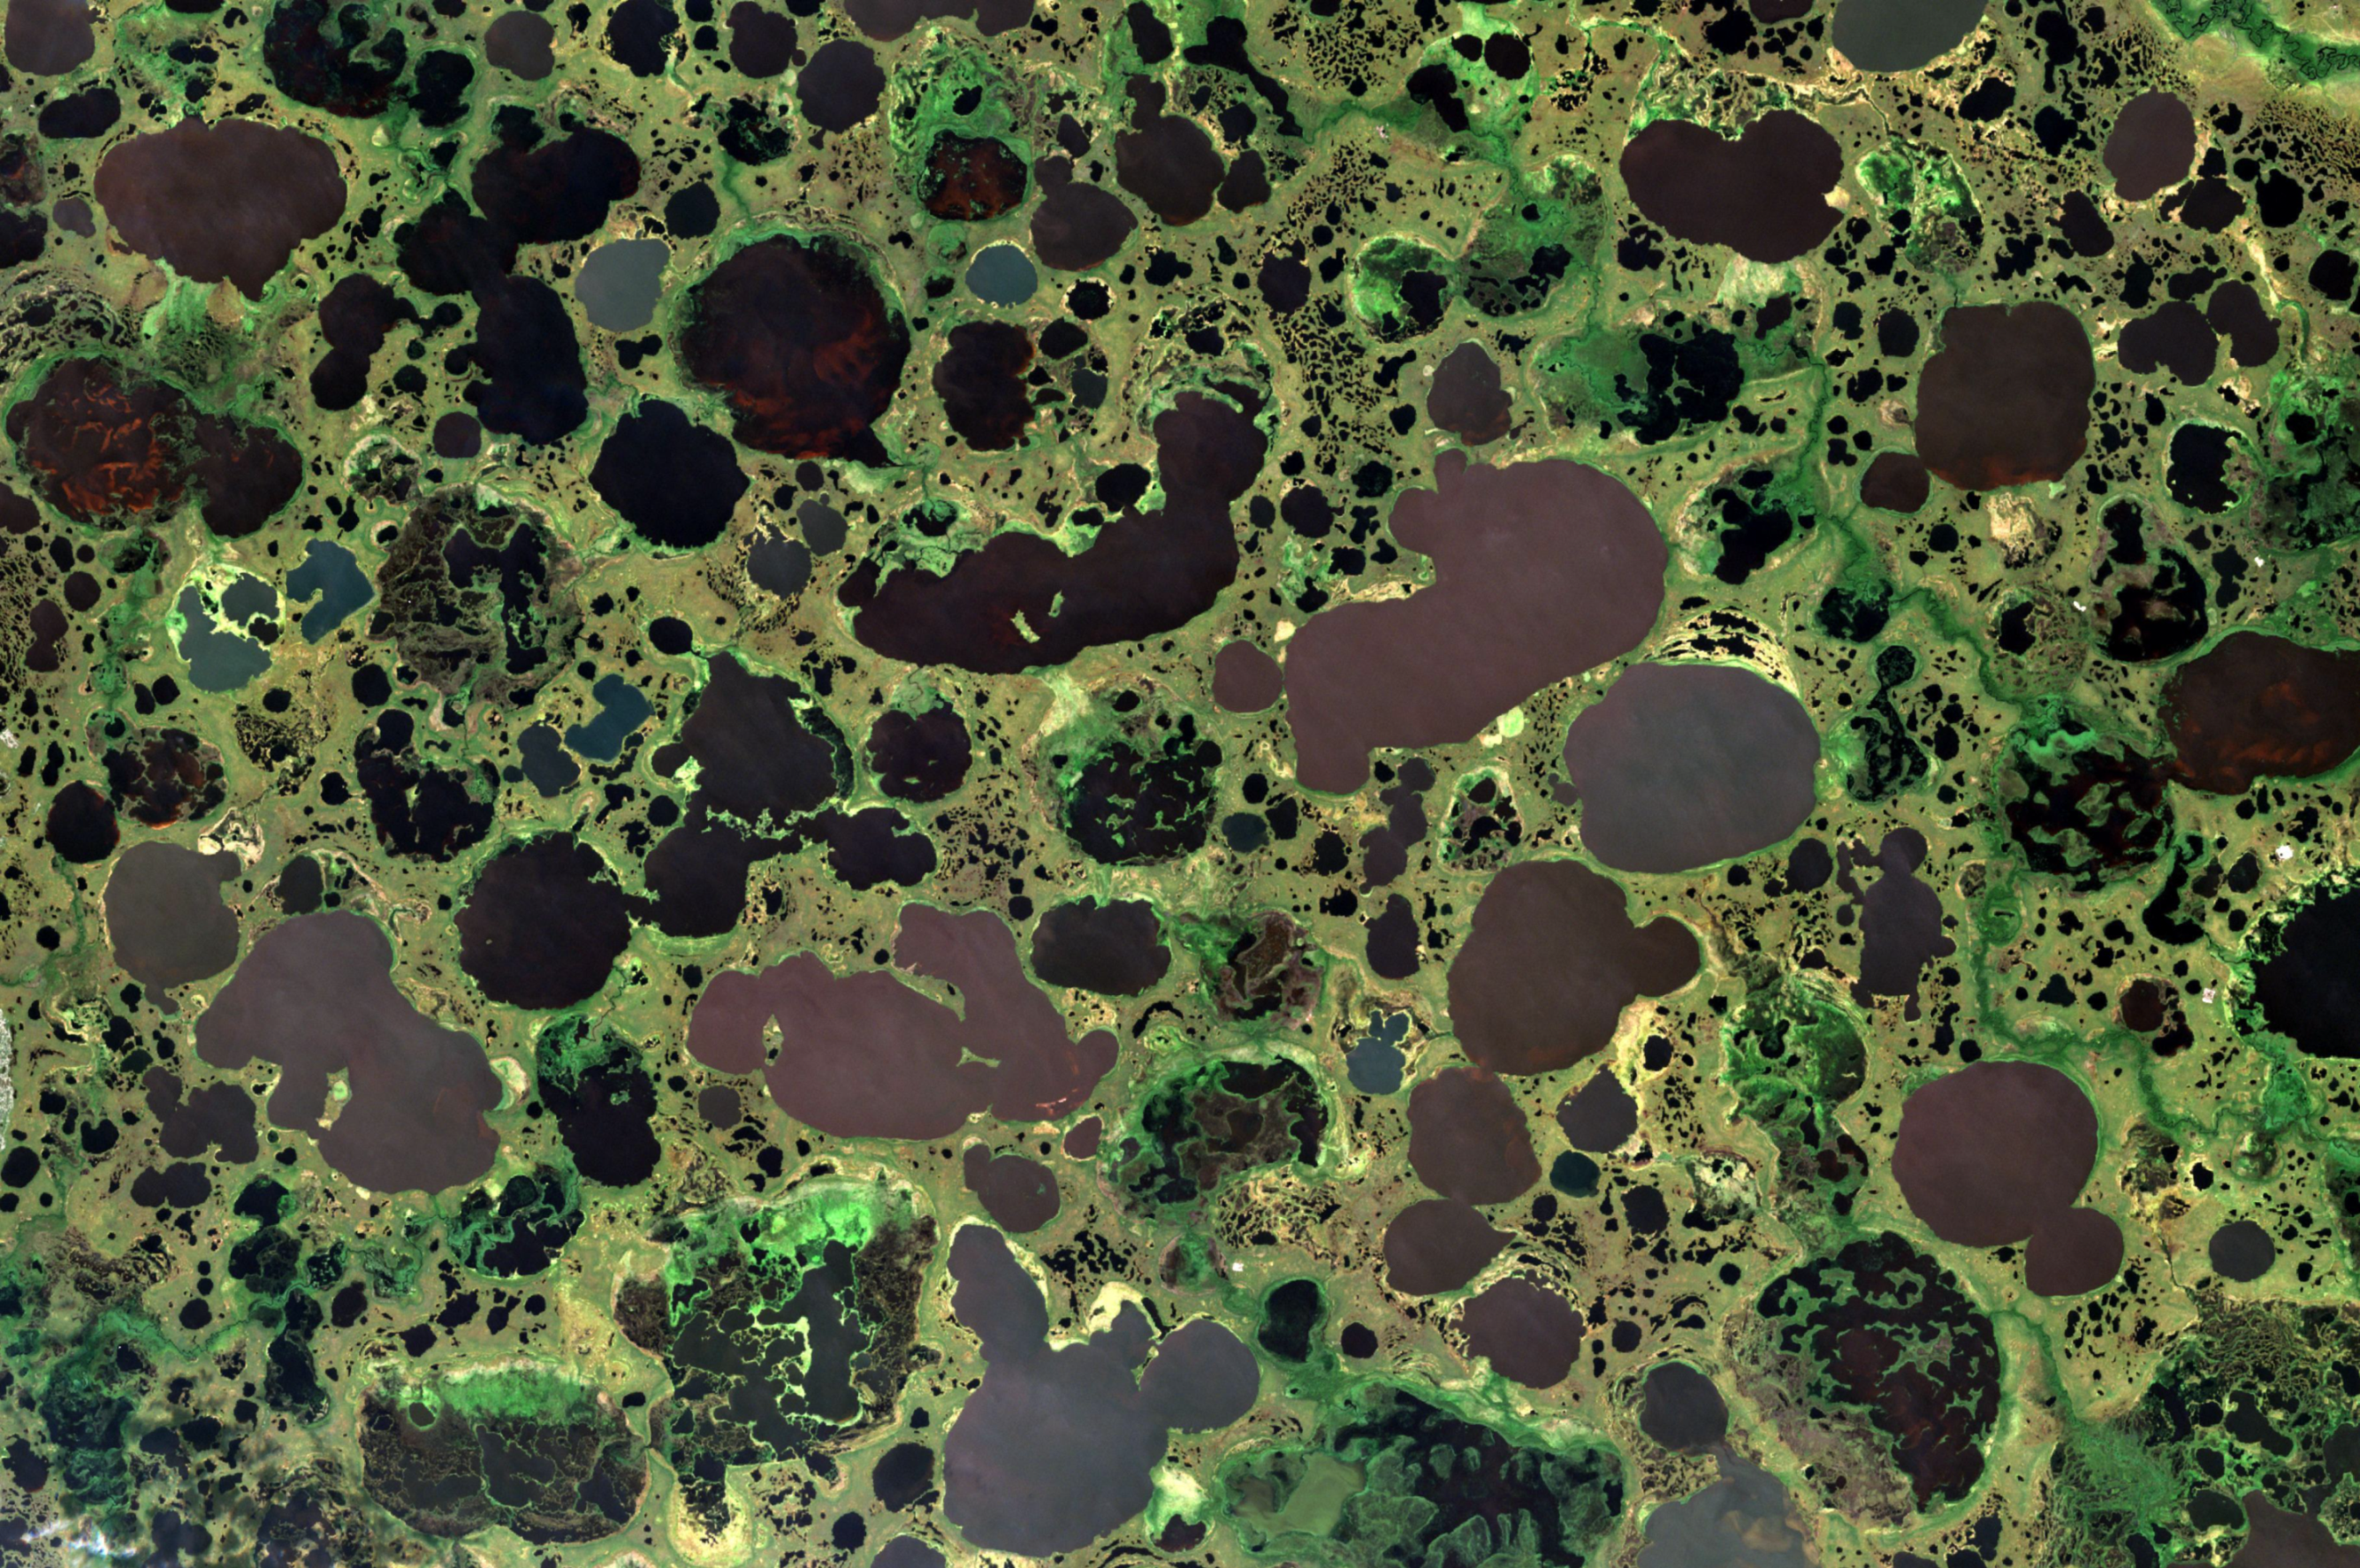
- Lacustrine thermokarst plains;
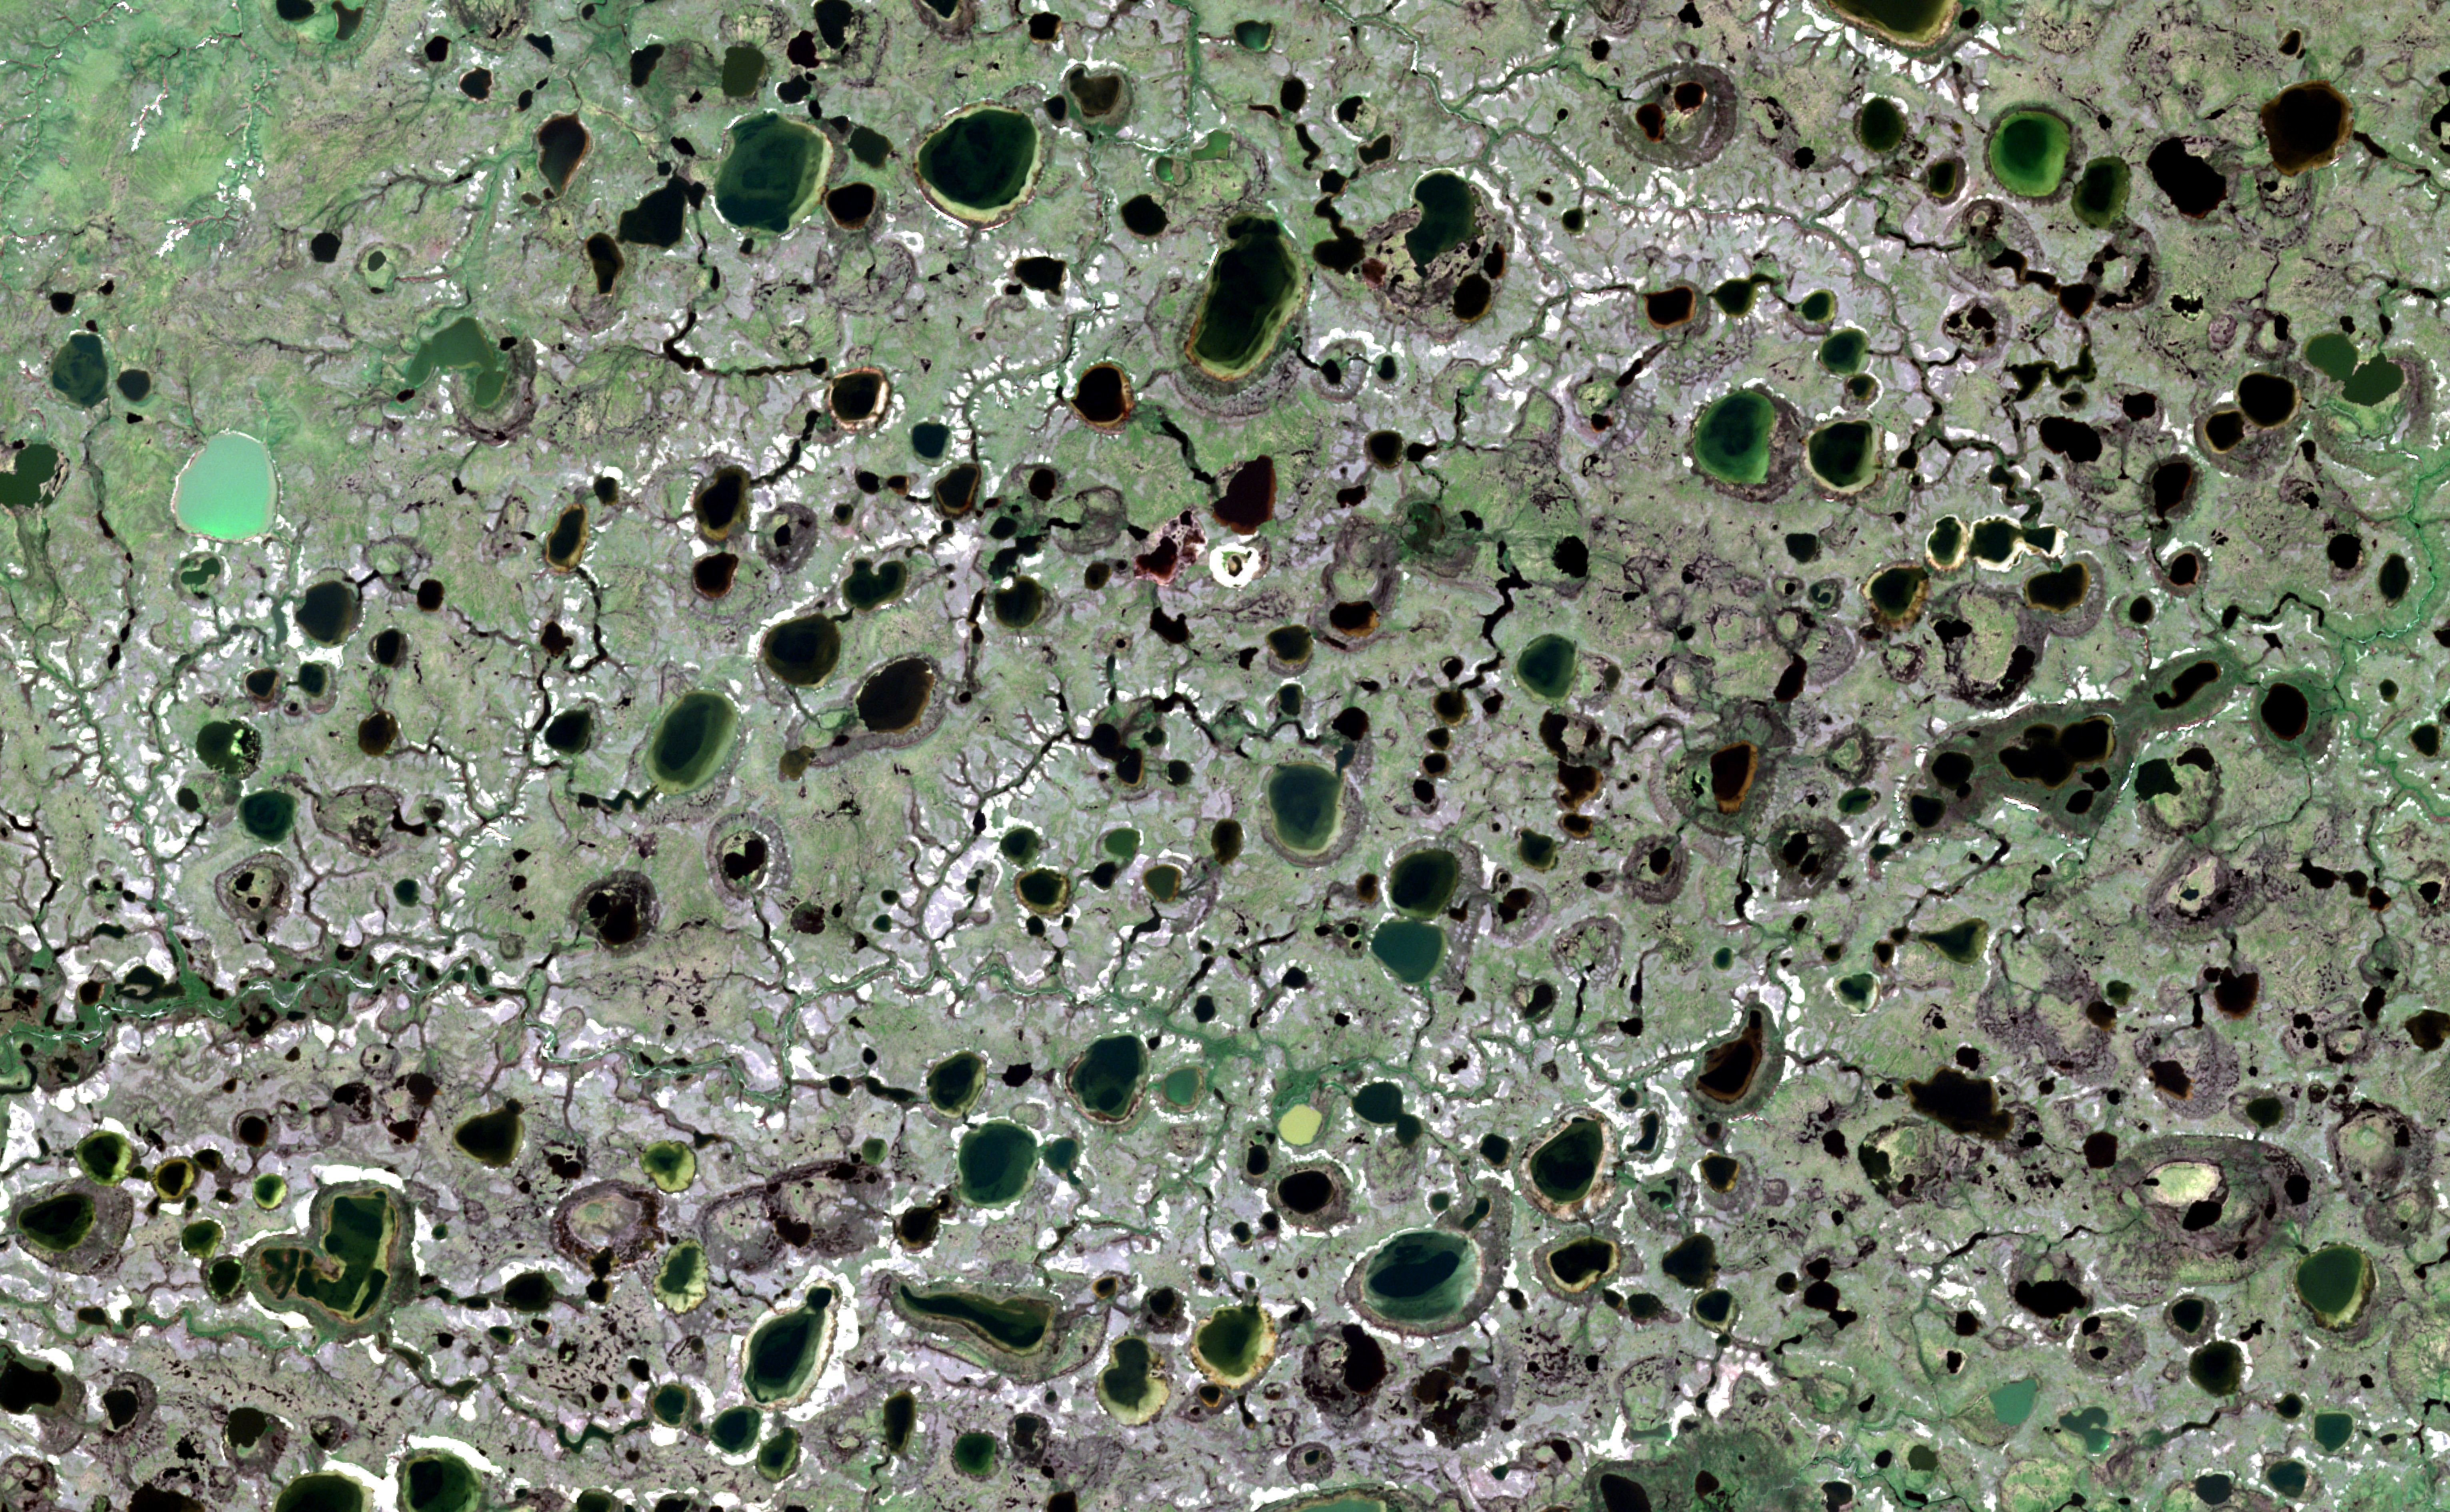
- (Lacustrine) thermokarst plains with fluvial erosion.
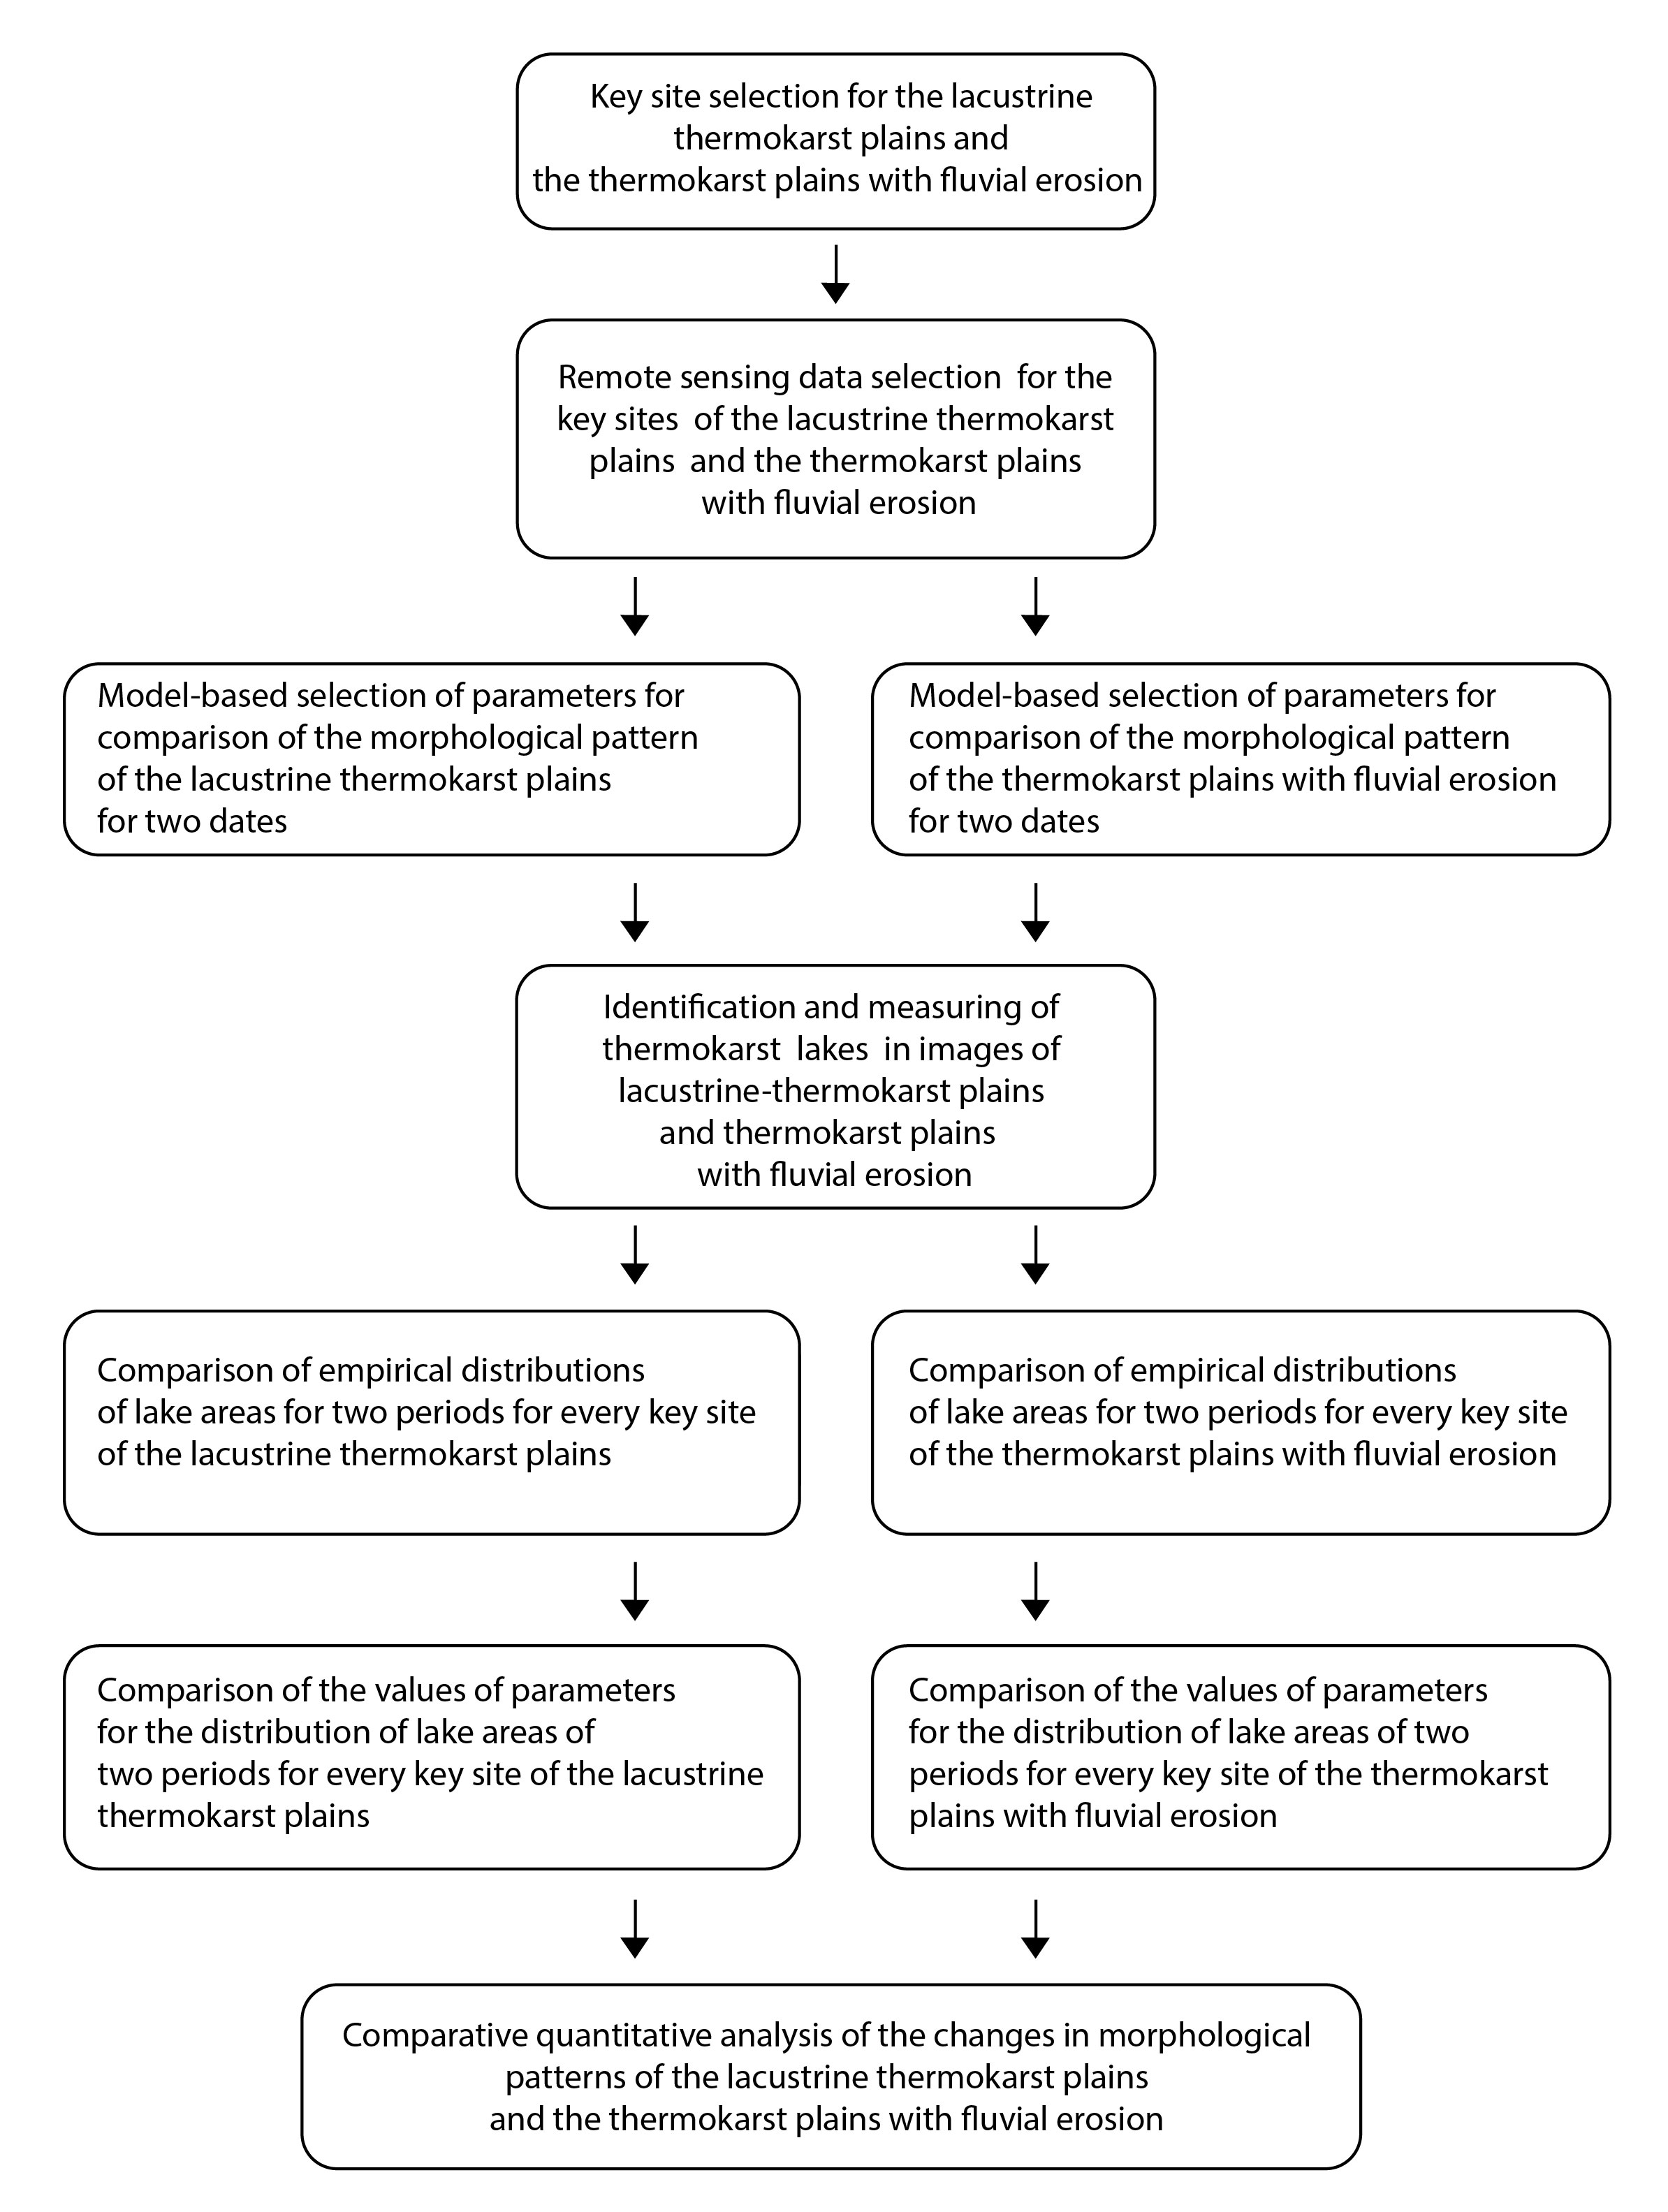
2. Materials and Methods
- -
- Archival Corona images with a resolution of 3–12 m/pix, June–August 1965–1976;
- -
- New (June–August 2008–2014) images from satellites IKONOS, QuickBird, Worldview 2, Geoeye-1, Pleiades, SPOT-5, SPOT-6 with high resolution 0.5–2.5 m/pix, obtained both from open sources (Google earth, Yandex maps, Bing) and specially purchased (ScanEx R&D Center). The description of space imagery is in Table 3.
- -
- Ensuring two shooting dates for each site;
- -
- Maximizing the time between two shooting dates for each site;
- -
- The maximum spatial resolution of space imagery.
- The emergence of the initial depressions took a short time; it was a random process and developed independently within nonintersecting sites. The emergence probability of depressions at a test site depends only on its area.
- The growth of individual lakes due to the thermoabrasion impact (a low intensity of thermal abrasion is also possible, while the process approaches “purely thermokarst”) occurs independently in each lake. It was directly proportional to the heat reserves in the lake and inversely proportional to the area of the side surface of the water body.
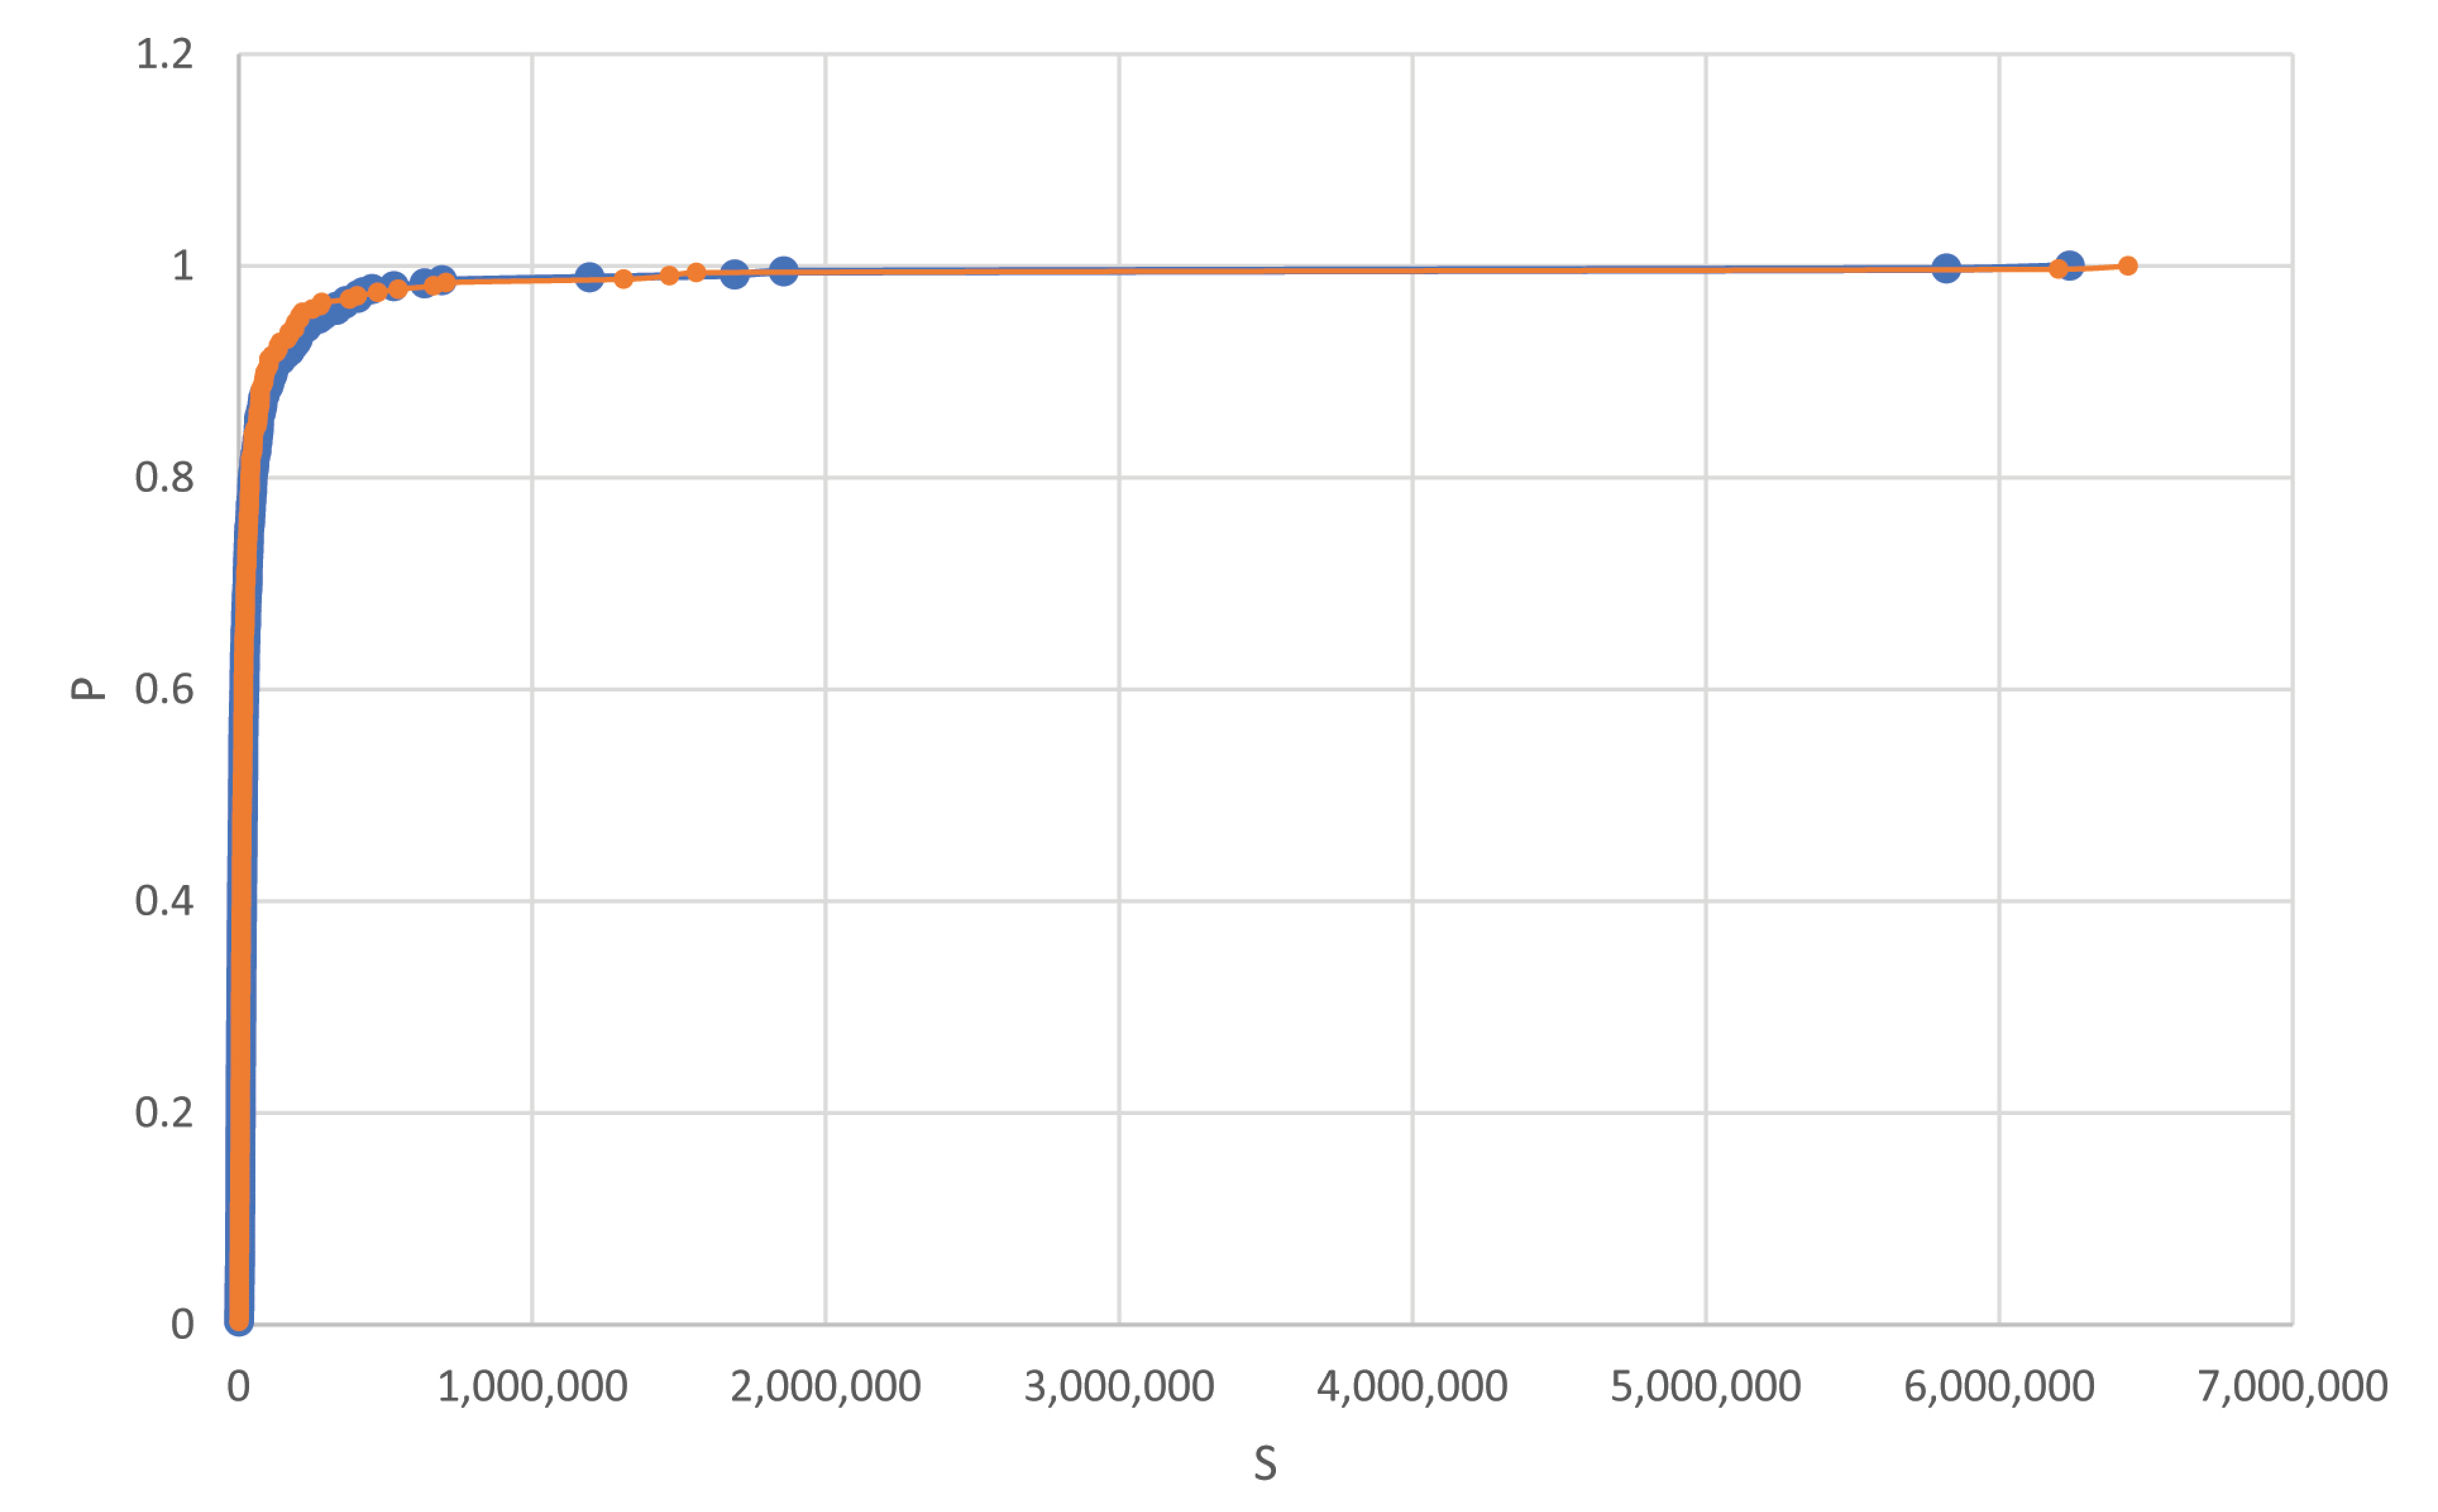
- Radius and area distributions of the thermokarst lakes after long development fit the lognormal distribution:
- -
- A mean logarithm of the lake area:
- -
- Variance in the lake area logarithm
- Emergences of initial thermokarst depressions (foci) are independent random events during nonintersecting periods and at nonintersecting sites; the emergence probability depends only on the period and the site values (For small sites, the probability of occurrence of more than one depression is infinitely small, to a higher order than the probability of the occurrence of one depression).
- The change in a thermokarst depression radius is a random variable; it does not depend on other lakes. Its growth rate under random factors is directly proportional to heat losses through the side (water-covered) surface of the lake depression.
- While growing, a lake can turn into a khasyrei after draining by a stream; the probability of this does not depend on the development of other lakes. If it happens, the depression stops growing.
- The origins of new sources of fluvial erosion within disjointed sites are independent random events; the probability of a source of a fluvial stream within a given site depends only on its area and is much higher than the probability of having more than one source (For small sites, the probability of occurrence of more than one source is infinitely small, to a higher order than the probability of the occurrence of one source).
- The initial thermokarst depressions cannot appear within already existing thermokarst lakes.
- -
- The radii distribution for the freely growing thermokarst lakes after time t since the occurrence of a particular lake fits the lognormal distribution.
- -
- A distance distribution from the center of the growing focus to the nearest source of fluvial erosion, stopping the growth of the lake by turning it into khasyrei, fits the Rayleigh distribution:
- -
- The number of initial thermokarst depressions that occurred at the start of the thermokarst process within a test site fits the Poisson law:
- -
- The lake area distribution (density distribution) for the area of the initial depression ε (the integral exponential distribution) is:
- -
- The mean lake area is
- -
- The mean thermokarst lake location density is
- -
- The percentage of the lake area fits the expression:
- -
- The mean steam-source location density γ;
- -
- The ratio of the new thermokarst foci generation density to the growth rate of the logarithm of the size ;
- -
- The area of a primary thermokarst lake (pond) ε.
- -
- Mean area of thermokarst lakes;
- -
- Mean thermokarst lake location density;
3. Results
- -
- Date 1: 1964–1980;
- -
- Date 2: 2011–2019.
4. Discussion
5. Conclusions
- -
- The morphological patterns of lacustrine thermokarst plains and thermokarst plains with fluvial erosion do not demonstrate significant evolution despite climatic changes during the observation period;
- -
- Changes in the morphological pattern of thermokarst plains with fluvial erosion are somewhat greater than those of lacustrine thermokarst plains and, accordingly, the risk for engineering structures is also higher;
- -
- The different variability of the morphological patterns of the analyzed landscapes can be explained by fluvial erosion, which first reacts to climatic changes, leading to a change in the area distributions of thermokarst lakes in thermokarst plains with fluvial erosion and the acceleration of their drainage and transformation into khasyreis.
Author Contributions
Funding
Data Availability Statement
Conflicts of Interest
References
- Kotlyakov, V.M.; Velichko, A.A.; Glazovsky, A.F.; Tumskaya, V.E. The past and present-day arctic cryosphere. Her. Russ. Acad. Sci. 2015, 85, 251–259. [Google Scholar] [CrossRef]
- Sazonova, T.S.; Romanovsky, V.E.; Walsh, J.E.; Sergueev, D.O. Permafrost dynamics in the 20th and 21st centuries along the East Siberian transect. J. Geophys. Res. 2004, 109, D01108. [Google Scholar] [CrossRef]
- Jafarov, E.E.; Marchenko, S.S.; Romanovsky, V.E. Numerical modeling of permafrost dynamics in Alaska using a high spatial resolution dataset. Cryosphere 2012, 6, 613–624. [Google Scholar] [CrossRef] [Green Version]
- Oberman, N.G.; Mazhitova, G.G. Permafrost dynamics in the north-east of European Russia at the end of the 20th century. Nor. Geogr. Tidsskr. 2010, 55, 241–244. [Google Scholar] [CrossRef]
- Sergeev, D.O.; Chesnokova, I.V.; Bezdelova, A.P.; Dernova, E.O. Results of permafrost geocryological monitoring for the period 1986-2019: State and dynamics of mountain permafrost. Stability of natural and technical systems in permafrost. In Proceedings of the All-Russian Conference with International Participation Dedicated to the 60th Anniversary of the Formation of the Institute of Permafrost, Yakutsk, Russia, 28–30 September 2020; pp. 164–168. (In Russian). [Google Scholar]
- Farquharson, L.M.; Romanovsky, V.E.; Cable, W.L.; Walker, D.A.; Kokelj, S.V.; Nicolsky, D. Climate change drives widespread and rapid thermokarst development in very cold permafrost in the Canadian High Arctic. Geophys. Res. Lett. 2019, 46, 6681–6689. [Google Scholar] [CrossRef] [Green Version]
- Morgenstern, A.; Overduin, P.P.; Günther, F.; Stettner, S.; Ramage, J.; Schirrmeister, L.; Grigoriev, M.N.; Grosse, G. Thermo-erosional valleys in Siberian ice-rich permafrost. Permafr. Periglac Process 2021, 32, 59–75. [Google Scholar] [CrossRef]
- Nicolsky, D.J.; Romanovsky, V.E.; Panda, S.K.; Marchenko, S.S.; Muskett, R.R. Applicability of the ecosystem type approach to model permafrost dynamics across the Alaska North Slope. J. Geophys. Res. Earth Surf. 2017, 122, 50–75. [Google Scholar] [CrossRef]
- Nitze, I.; Grosse, G.; Jones, B.M.; Romanovsky, V.E.; Boike, J. Remote sensing quantifies widespread abundance of permafrost region disturbances across the Arctic and Subarctic. Nat. Commun. 2018, 9, 5423. [Google Scholar] [CrossRef]
- Gibson, C.M.; Chasmer, L.E.; Thompson, D.K.; Quinton, W.L.; Flannigan, M.D.; Olefeldt, D. Wildfire as a major driver of recent permafrost thaw in boreal peatlands. Nat. Commun. 2018, 9, 3041. [Google Scholar] [CrossRef] [Green Version]
- Farquharson, L.; Mann, D.H.; Grosse, G.; Jones, B.; Romanovsky, V. Spatial distribution of thermokarst terrain in Arctic Alaska. Geomorphology 2016, 273, 116–133. [Google Scholar] [CrossRef] [Green Version]
- Grosse, G.; Romanovsky, V.; Walter, K.; Morgenstern, A.; Lantuit, H.; Zimov, S. Distribution of Thermokarst Lakes and Ponds at Three Yedoma Sites in Siberia. In Proceedings of the Ninth International Conference on Permafrost, Fairbanks, AL, USA, 28 June–3 July 2008; pp. 551–556. [Google Scholar]
- Anderson, L.; Edwards, M.; Shapley, M.D.; Finney, B.P.; Langdon, C. Holocene thermokarst lake dynamics in northern Interior Alaska: The interplay of climate, fire, and subsurface hydrology. North Pac. Environ. Paleoclimate Late Pleistocene Present 2019, 7, 53. [Google Scholar] [CrossRef] [Green Version]
- Edwards, M.; Grosse, G.; Jones, B.M.; McDowell, P. The evolution of a thermokarst-lake landscape: Late Quaternary permafrost degradation and stabilization in interior Alaska. Sediment. Geol. 2016, 340, 3–14. [Google Scholar] [CrossRef] [Green Version]
- Swanson, D.K. Thermokarst and precipitation drive changes in the area of lakes and ponds in the National Parks of northwestern Alaska, 1984–2018. Arct. Antarct. Alp. Res. 2019, 51, 265–279. [Google Scholar] [CrossRef] [Green Version]
- Veremeeva, A.; Nitze, I.; Günther, F.; Grosse, G.; Rivkina, E. Geomorphological and Climatic Drivers of Thermokarst Lake Area Increase Trend (1999–2018) in the Kolyma Lowland Yedoma Region, North-Eastern Siberia. Remote Sens. 2021, 13, 178. [Google Scholar] [CrossRef]
- Dvornikov, Y.; Leibman, M.; Heim, B.; Bartsch, A.; Herzschuh, U.; Skorospekhova, T.; Fedorova, I.; Khomutov, A.; Widhalm, B.; Gubarkov, A.; et al. Terrestrial CDOM in lakes of Yamal peninsula: Connection to lake and lake catchment properties. Remote Sens. 2018, 10, 167. [Google Scholar] [CrossRef] [Green Version]
- Lantz, T.C.; Turner, K.W. Changes in lake area in response to thermokarst processes and climate in Old Crow Flats, Yukon. J. Geophys. Res. Biogeosciences 2015, 120, 513–524. [Google Scholar] [CrossRef]
- Jones, B.M.; Grosse, G.D.A.C.; Arp, C.D.; Jones, M.C.; Anthony, K.W.; Romanovsky, V.E. Modern thermokarst lake dynamics in the continuous permafrost zone, northern Seward Peninsula, Alaska. J. Geophys. Res. Biogeosciences 2011, 116, 1–13. [Google Scholar] [CrossRef]
- Belshe, E.F.; Schuur, E.; Grosse, G. Quantification of upland thermokarst features with high resolution remote sensing. Environ. Res. Lett. 2013, 8, 035016. [Google Scholar] [CrossRef] [Green Version]
- Chen, M.; Rowland, J.; Wilson, C.; Altmann, G.; Brumby, S. Temporal and spatial pattern of thermokarst lake area changes at Yukon Flats, Alaska. Hydrol. Processes 2014, 28, 837–852. [Google Scholar] [CrossRef]
- Jones, B.M.; Grosse, G.; Farquharson, L.M.; Roy-Léveillée, P.; Veremeeva, A.; Kanevskiy, M.Z.; Gaglioti, B.V.; Breen, A.L.; Parsekian, A.D.; Ulrich, M.; et al. Lake and drained lake basin systems in lowland permafrost regions. Nat. Rev. Earth Environ. 2022, 3, 85–98. [Google Scholar] [CrossRef]
- Polishchuk, V.Y.; Polishchuk, Y.M. Geoimitation Modeling of Thermokarst Lake Fields in Permafrost Zones; Yugra State University Press: Khánty-Mansíysk, Russia, 2013; (In Russian with English Summary). [Google Scholar]
- Nitze, I.; Grosse, G.; Jones, B.M.; Arp, C.D.; Ulrich, M.; Fedorov, A.; Veremeeva, A. Landsat-Based Trend Analysis of Lake Dynamics across Northern Permafrost Regions. Remote Sens. 2017, 9, 640. [Google Scholar] [CrossRef] [Green Version]
- Muster, S.; Riley, W.J.; Roth, K.; Langer, M.; Cresto Aleina, F.; Koven, C.D.; Lange, S.; Bartsch, A.; Grosse, G.; Wilson, C.J.; et al. Size distributions of Arctic waterbodies reveal consistent relations in their statistical moments in space and time. Front. Earth Sci. 2019, 7, 5. [Google Scholar] [CrossRef] [Green Version]
- Morgenstern, A.; Grosse, G.; Günther, F.; Fedorova, I.; Schirrmeister, L. Spatial analyses of thermokarst lakes and basins in Yedoma landscapes of the Lena Delta. Cryosphere Discuss. 2011, 5, 849–867. [Google Scholar] [CrossRef] [Green Version]
- Olefeldt, D.; Goswami, S.; Grosse, G.; Hayes, D.; Hugelius, G.; Kuhry, P.; McGuire, A.D.; Romanovsky, V.E.; Sannel, A.B.K.; Schuur, E.A.G.; et al. Arctic Circumpolar Distribution and Soil Carbon of Thermokarst Landscapes 2015; ORNL DAAC: Oak Ridge, TN, USA, 2016. [Google Scholar] [CrossRef]
- Pekel, J.-F.; Cottam, A.; Gorelick, N.; Belward, A.S. High-resolution mapping of global surface water and its long-term changes. Nature 2016, 540, 418–422. [Google Scholar] [CrossRef] [PubMed]
- Theodoratos, N.; Seybold, H.; Kirchner, J.W. Scaling and similarity of a stream-power incision and linear diffusion landscape evolution model. Earth Surf. Dyn. 2018, 6, 779–808. [Google Scholar] [CrossRef] [Green Version]
- Grau Galofre, A.; Jellinek, A.M. The geometry and complexity of spatial patterns of terrestrial channel networks: Distinctive fingerprints of erosional regimes. J. Geophys. Res. Earth Surf. 2017, 122, 1037–1059. [Google Scholar] [CrossRef]
- Perron, J.; Kirchner, J.; Dietrich, W. Formation of evenly spaced ridges and valleys. Nature 2009, 460, 502–505. [Google Scholar] [CrossRef]
- Geological Map of Russia. Available online: http://webmapget.vsegei.ru/index.html (accessed on 4 February 2022).
- Ogureeva, G.N.; Leonova, N.B.; Buldakova, E.V.; Kadetov, N.G.; Arkhipova, M.V.; Miklyaeva, I.M.; Bocharnikov, M.V.; Dudov, S.V.; Ignatova, E.A.; Ignatov, M.S.; et al. The Biomes of Russia. Map. Scale 1:7,500,00/Mocквa 2018. Available online: https://www.elibrary.ru/item.asp?id=36725020 (accessed on 4 February 2022).
- Viereck, L.A.; Dyrness, C.T.; Batten, A.R.; Wenzlick, K.J. The Alaska Vegetation Classification; PNW-GTR-286; Department of Agriculture, Forest Service, Pacific Northwest Research Station: Portland, OR, USA, 1992; 278p.
- Jacobs, J.D.; Hedley, A.N.; Maus, L.A.; Mode, W.N.; Simms, E.L. Climate and Vegetation of the Interior Lowlands of Southern Baffin Island: Long-Term Stability at the Low Arctic Limit. Arctic 1997, 50, 101–200. [Google Scholar] [CrossRef] [Green Version]
- Victorov, A.S. The Main Problems of the Mathematical Morphology of the Landscape; Maik Nauka-Interperiodica Publishing: Moscow, Russia, 2006; p. 252. (In Russian) [Google Scholar]
- Victorov, A.S.; Orlov, T.V.; Kapralova, V.N.; Trapeznikova, O.N.; Arkhipova, M.V.; Berezin, P.V.; Zverev, A.V.; Sadkov, S.A.; Panchenko, E.G. Mathematical Morphology of Permafrost Landscapes; Publishing house of RUDN University: Moscow, Russia, 2016; p. 230, (In Russian with English Summary). [Google Scholar]
- Victorov, A.S. Mathematical Morphology of Landscape; Tratek: Moscow, Russia, 1998; p. 180. (In Russian) [Google Scholar]
- Alexey, V.; Maria, A.; Olga, T. Dynamic balance of the landscape morphological pattern of alluvial plains: The quantitative aspect. In Proceedings of the 20th International Multidisciplinary Scientific GeoConference SGEM 2020, Albena, Bulgaria, 16–25 August 2020; pp. 207–214. [Google Scholar] [CrossRef]
- Victorov, A.S.; Orlov, T.V.; Trapeznikova, O.N.; Kapralova, V.N.; Arkhipova, M.V. Regularities of the distribution of lake areas on thermokarst plains with fluvial erosion. Dokl. Earth Sci. 2020, 491, 282–284. [Google Scholar] [CrossRef]
- Victorov, A.S.; Orlov, T.V.; Arkhipova, M.V. Laws for size distribution of khasyreis. Dokl. Earth Sci. 2019, 488, 1253–1255. [Google Scholar] [CrossRef]
- Polishchuk, Y.M.; Bryksina, N.A.; Kupriyanov, M.A. Comparative analysis of changes in the size of lakes in the permafrost zone of Western and Eastern Siberia based on satellite images. Geoinformatika 2016, 1, 64–67. [Google Scholar]
- Sejourne, A.; Costard, F.; Fedorov, A.; Gargani, J.; Skorve, J.; Masse, M.; Mege, D. Evolution of the banks of thermokarst lakes in Central Yakutiya (Central Siberia) due to retrogressive thaw slump activity controlled by insolation. Geomorphology 2015, 241, 31–40. [Google Scholar] [CrossRef]
- Riordan, B.; Verbyla, D.; McGuire, A.D. Shrinking ponds in subarctic Alaska based on 1950–2002 remotely sensed images. J. Geophys. Res. 2006, 111, G04002. [Google Scholar] [CrossRef]
- Kravtsova, V.I.; Bystrova, A.G. Study of changes in the distribution of thermokarst lakes in Russia based on satellite images of different times. Kriosf. Zemli 2009, 15, 16–26. [Google Scholar]
- Dneprovskaya, V.P.; Bryksina, N.A.; Polishchuk, Y.M. Study of thermokarst changes in the zone of discontinuous distribution of permafrost in Western Siberia on the basis of satellite images. Issled. Zemli Kosm. 2009, 3, 88–96. [Google Scholar]

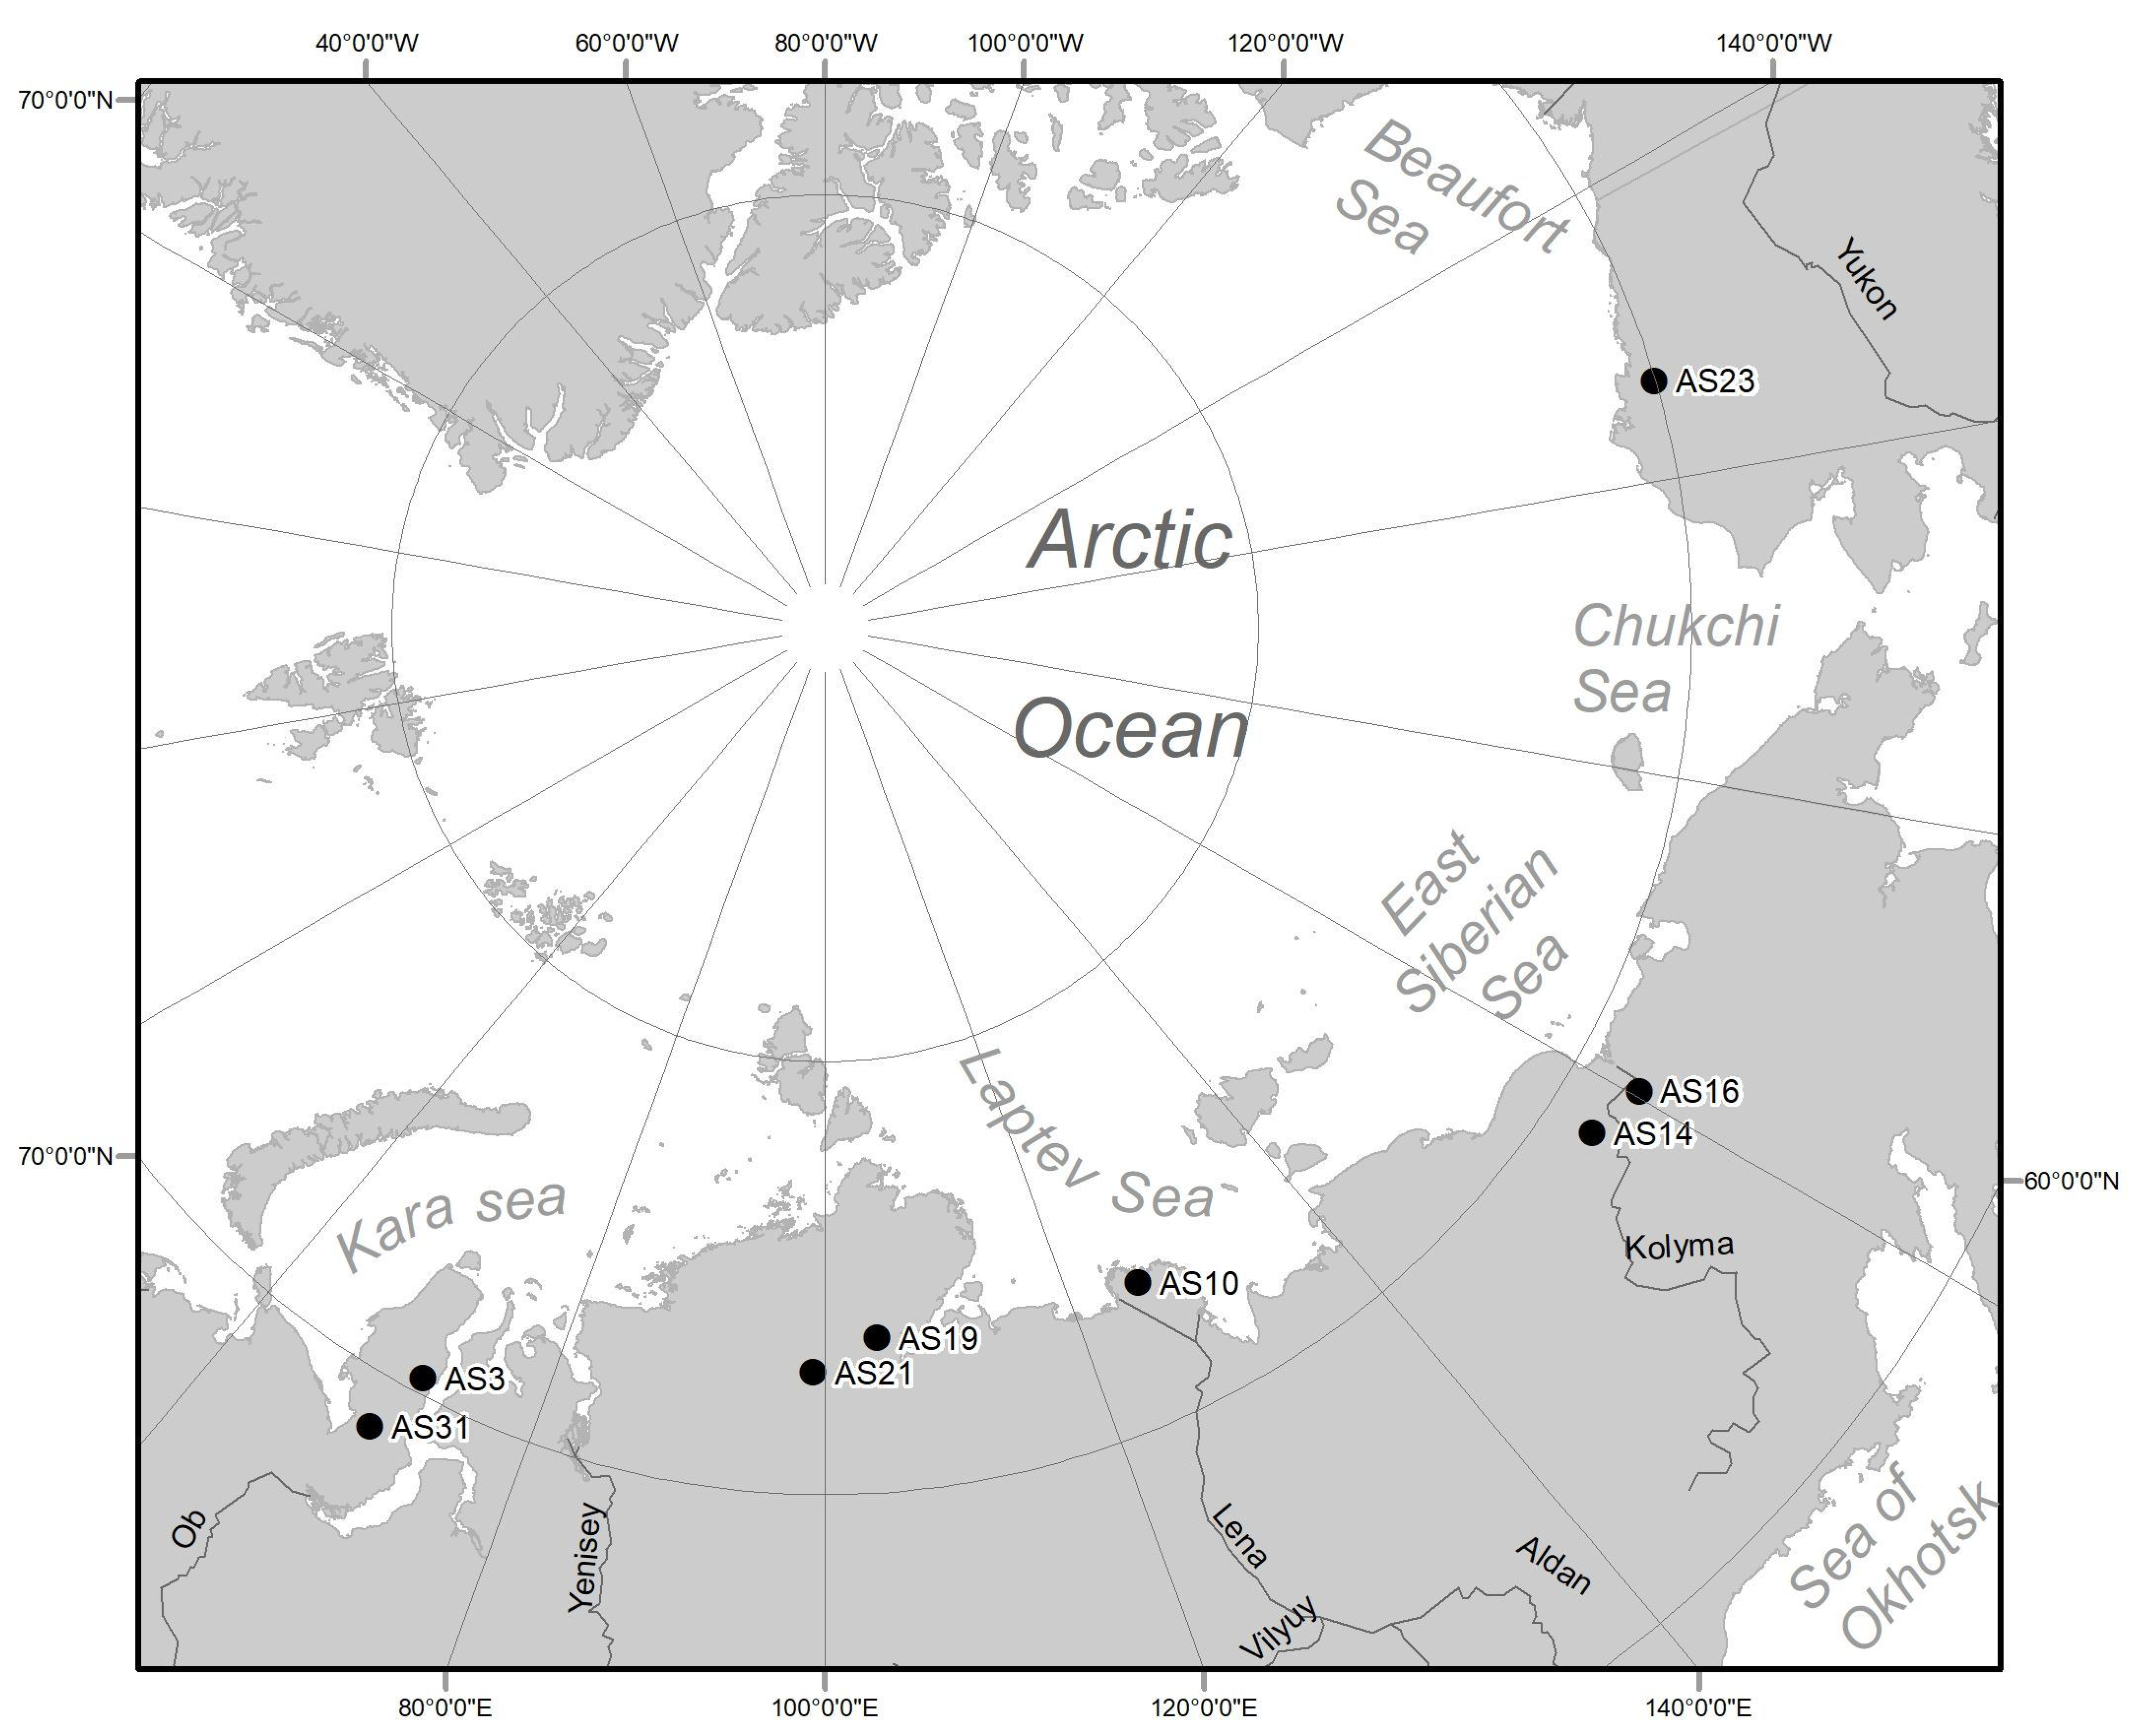
| Key Site (and Its Area km2) | Region | Annual Rock Temperature °C | Permafrost Thickness (m) | Description |
|---|---|---|---|---|
| AS31 (78) | Yamal peninsula, Baydaratsko-Yuribeysky region | −5 | 150–250 | The flat and swampy third marine terrace, composed of sandy, sandy loam and loamy deposits. The rocks are medium-icy (0.2–0.4). Continuous permafrost. Ref. [33] Vegetation: southern hypoarctic tundra—shrub and tussock tundra (Betula nana, Salix lapponum, S. phylicifolia, S. dasyclados, S. glauca, S. lanata, Empetrum hermaph-roditum; Vaccinium myrtillus, V. uliginosum ssp. microphyllum, V. vitis-idaea ssp. minus и s. str., Deschampsia flexuosa, Festuca ovina, Aconitum septen-trionale, Cirsium helenioides, Trolius europaeus, T. asiaticus) [34]. |
| AS3 (58) | East Yamal, Mudriyakha | −7 | 200–280 | The densely dissected first and second lagoon-marine terraces, composed of fine and silty sands, with frequent replacement by sandy loams and rare interlayers of loams with occasional lenses of gravel and pebbles. The rocks are highly icy (>0.4). Continuous permafrost. Ref. [33] Vegetation: northern hypoarctic (typical) tundra (Cassiope tetragona, Empetrum subholarcticum, Arctous alpina, Dryas octopetala, Vaccinium uliginosum ssp. microphyllum, V. vitisidaea ssp. minus, Ledum decumbens, Eriophorum angustifolium, Carex arctisibirica, Arctagrostis latifolia, Dupontia fisheri, D. psilosantha, Deschampsia borealis, D. brevifolia, Betula nana, Salix arctica, S. glauca, S. lanata) [34]. |
| AS21 (343) | Central Taimyr | −9 | 900–1100 | Hilly-ridged Upper Quaternary fluvioglacial plain, composed of boulder loams, boulders, blocks with loamy rubble, layered sands and pebbles. Continuous permafrost. Ref. [33] Vegetation: southern hypoarctic tundra—shrub and tussock tundra (Betula nana, Salix lapponum, S. phylicifolia, S. dasyclados, S. glauca, S. lanata, Empetrum hermaphroditum; Vaccinium myrtillus, V. uliginosum ssp. microphyllum, V. vitisidaea ssp. minus и s. str., Deschampsia flexuosa, Festuca ovina, Aconitum septentrionale, Cirsium helenioides, Trolius europaeus, T. asiaticus) [34]. |
| AS19 (303) | Central Taimyr | −8 | 900–1100 | Hilly-ridged Upper Quaternary fluvioglacial plain, composed of boulder loams, boulders, blocks with loamy rubble, layered sands and pebbles. Continuous permafrost. Ref. [33] Vegetation: southern hypoarctic tundra—shrub and tussock tundra (Betula nana, Salix lapponum, S. phylicifolia, S. dasyclados, S. glauca, S. lanata, Empetrum hermaphroditum; Vaccinium myrtillus, V. uliginosum ssp. microphyllum, V. vitisidaea ssp. minus и s. str., Deschampsia flexuosa, Festuca ovina, Aconitum septentrionale, Cirsium helenioides, Trolius europaeus, T. asiaticus) [34]. |
| AS10 (378) | Delta of the Lena River | −11–13 | 400–600 | The second sandy Middle-Late Quaternary terrace of the deltaic plain, composed of sands and specific organogenic sediments. Highly icy rocks. Ref. [33] Vegetation: arctic tundra (Salix polaris, S. reptans, Dryas punctata, D. octopetala, Cassiope tetragona; Saxifraga hieracifolia, S. hirculus, S. serpyllifolia ssp. glutinosa, Alopecurus alpinus, Deschampsia borealis, D. brevifolia, Dupontia fisheri, Luzula confusa, L. nivalis, Eriophorum angustifolium, E. scheuchzeri, Carex arctisibirica) [34]. |
| AS14 (185) | Kolyma lowland | −6.7–9 | 400–500 | Lacustrine-alluvial Pleistocene accumulative plain, composed mainly of horizontally layered silts interbedded with sands and peat. Continuous permafrost. Ref. [33] Vegetation: pre-tundra light forests with southern hypoarctic tundras and swamps (Larix gmelinii, L. Cajanderi, Salix udensis, S. schwerin, Chosenia arbutifolia, Populus suaveolens) [34]. |
| AS16 (318) | Right bank of the lower Kolyma | −7.8–10 | 400–500 | Heavily peaty lacustrine-alluvial Pleistocene-Holocene plain, composed of loams, sandy loams, with a high content of silts. Continuous permafrost. Ref. [33] Vegetation: pre-tundra light forests with southern hypoarctic tundras and swamps (Larix gmelinii, L. Cajanderi, Salix udensis, S. schwerin, Chosenia arbutifolia, Populus suaveolens) [34]. |
| AS23 (333) | Alaska | −8 | 200–300 | Structural-accumulative plain, composed of eolian sands. Ice content is less than 0.1. Continuous permafrost.The dominant vegetation is a wet sedge meadow of Eriophorum angustifolium and Carex aquafilis. Eriophorum vaginatum, while tussock tundra occurs on the dryer sites [35]. |
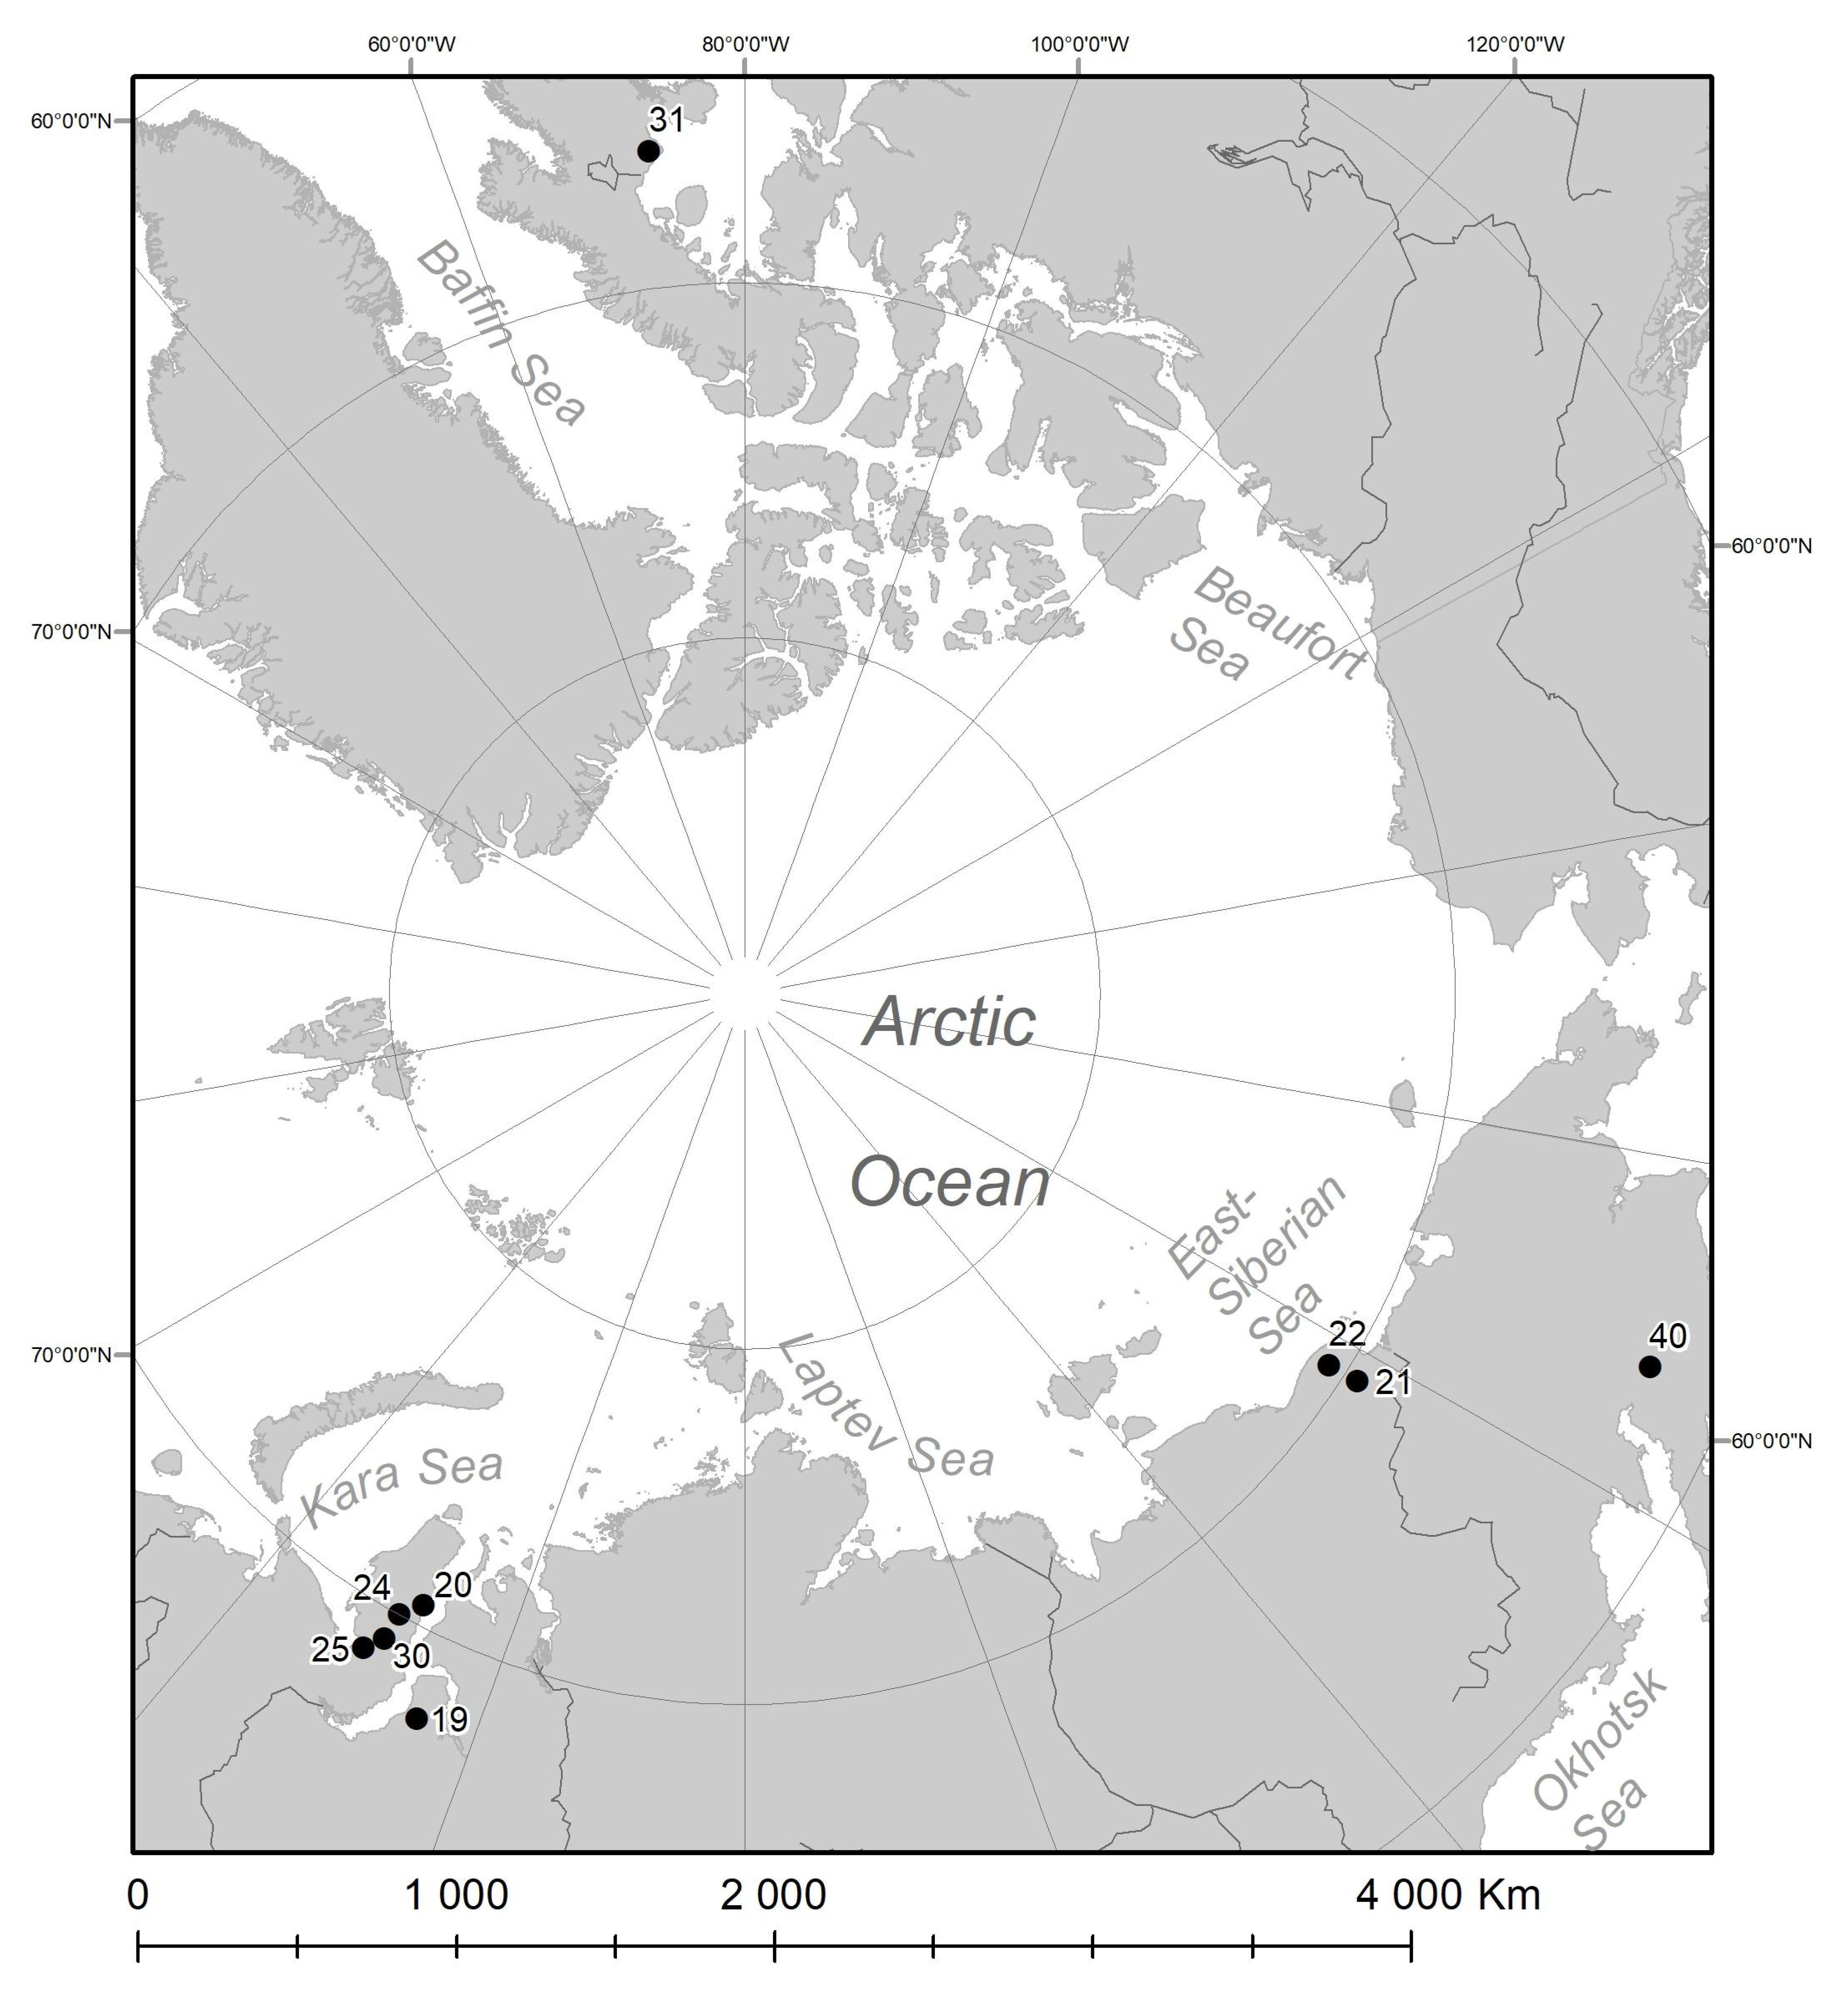
| Key site (and Its Area km2) | Region | Annual Rock Temperature °C | Permafrost Thickness (m) | Description |
|---|---|---|---|---|
| 19 (207) | Taz Peninsula | −3–−5 | 200–300 | The third and fourth alluvial-marine terraces, composed of sandy loams, partly replaced by loams. Continuous permafrost. Ref. [33] Vegetation: southern hypoarctic tundra—shrub and tussock tundra (Betula nana, Salix lapponum, S. phylicifolia, S. dasyclados, S. glauca, S. lanata, Empetrum hermaphroditum; Vaccinium myrtillus, V. uliginosum ssp. microphyllum, V. vitisidaea ssp. minus и s. str., Deschampsia flexuosa, Festuca ovina, Aconitum septentrionale, Cirsium helenioides, Trolius europaeus, T. asiaticus) [34]. |
| 20 (450) | Yamal Peninsula | −7–−9 | 200–300 | The first alluvial-marine terrace of the Gulf of Ob, composed of fine and fine-grained sands; there are lenses of peat and interlayers of sandy loams, less often loans. Continuous permafrost. Ref. [33] Vegetation: northern hypoarctic (typical) tundra (Cassiope tetragona, Empetrum subholarcticum, Arctous alpina, Dryas octopetala, Vaccinium uliginosum ssp. microphyllum, V. vitis-idaea ssp. minus, Ledum decumbens, Eriophorum angustifolium, Carex arctisibirica, Arctagrostis latifolia, Dupontia fisheri, D. psilosantha, Deschampsia borealis, D. brevifolia, Betula nana, Salix arctica, S. glauca, S. lanata) [34].. |
| 21 (1157) | Indigirka-Kolyma interfluve | −7–−9 | 200–400 | A lacustrine-marsh plain composed of lacustrine icy sandy loams with interbeds of clayey silts, often compacted by lenses and interbeds of peat, less often by clayey sands with massive cryotextures and large ice veins. Continuous permafrost. Ref. [33] Vegetation: southern hypoarctic tundra (Betula exilis, Salix alaxensis, S. boganidensis, S. pulchra, S. glauca, S. reptans, S. richardsonii, Alnus fruticosa, Eriophorum vaginatum, Ledum decumbens, Vaccinium vitis-idaea ssp. minus) [34]. |
| 22 (2867) | Indigirka-Kolyma interfluve | −9–−11 | 400–500 | A lacustrine-marsh plain composed of lacustrine icy sandy loams with interbeds of clayey silts, often compacted by lenses and interbeds of peat, less often by clayey sands with massive cryotextures and large ice veins. Continuous permafrost. Ref. [33] Vegetation: northern hypoarctic (typical) tundra—(Salix fuscescens, Arctous alpina, Dryas punctata, Vaccinium uliginosum ssp. microphyllum, V. vitis-idaea ssp. minus, Ledum decumbens, Empetrum subholarcticum, Eriophorum vaginatum, E. angustifolium, Carex arctisibirica, Arctagrostis latifolia, Dupontia psilosantha, D. fisheri, Deschampsia borealis, D. Brevifolia, Betula exilis, Salix richardsonii, S. glauca, S. pulchra) [34]. |
| 24 (154) | Yamal Peninsula | −7–−9 | 200–300 | The second alluvial-marine terrace of the Gulf of Ob, composed of sands with thin interlayers of sandy loams and loams up to 10 m thick. Continuous permafrost. Ref. [33] Vegetation: northern hypoarctic (typical) tundra (Cassiope tetragona, Empetrum subholarcticum, Arctous alpina, Dryas octopetala, Vaccinium uliginosum ssp. microphyllum, V. vitisidaea ssp. minus, Ledum decumbens, Eriophorum angustifolium, Carex arctisibirica, Arctagrostis latifolia, Dupontia fisheri, D.psilosantha, Deschampsia borealis, D. brevifolia, Betula nana, Salix arctica, S. glauca, S. lanata) [34]. |
| 25 (202) | Yamal Peninsula | −5–−7 | 200–300 | The first and second marine terraces, composed of several units of sandy, sandy-argillaceous sediments with lenses and interlayers of sandy loam and clay. Continuous permafrost. Ref. [33] Vegetation: southern hypoarctic tundra—shrub and tussock tundra (Betula nana, Salix lapponum, S. phylicifolia, S. dasyclados, S. glauca, S. lanata, Empetrum hermaphroditum; Vaccinium myrtillus, V. uliginosum ssp. microphyllum, V. vitisidaea ssp. minus и s. str., Deschampsia flexuosa, Festuca ovina, Aconitum septentrionale, Cirsium helenioides, Trolius europaeus, T. asiaticus) [34]. |
| 30 (441) | Yamal Peninsula | −7–−9 | 300–400 | The fourth marine terrace, composed of sandy, sandy loamy and loamy deposits. Continuous permafrost. Ref. [33] Vegetation: southern hypoarctic tundra—shrub and tussock tundra (Betula nana, Salix lapponum, S. phylicifolia, S. dasyclados, S. glauca, S. lanata, Empetrum hermaphroditum; Vaccinium myrtillus, V. uliginosum ssp. microphyllum, V. vitisidaea ssp. minus и s. str., Deschampsia flexuosa, Festuca ovina, Aconitum septentrionale, Cirsium helenioides, Trolius europaeus, T. asiaticus) [34]. |
| 31 (846) | Baffin Land | −5–−6 | >500 | A flat, vast post-glacial plain, composed mainly of limestone and shales overlain by glacial and fine-grained lacustrine and marine sediments. Clay soils and peat deposits predominate in lake basins. High density segregated ice. Continuous permafrost.Vegetation: Wet sedge-meadows (Carex spp. and Eriophorum spp.); Low shrub heath with (Salix arctica, Cassiope tetragona, Betula glandulosa, Vaccinium vitisideae, Ledum palustre) and other heath plants, and numerous herbs, grasses, and mosses; Semivegetated granite-gneiss terrain (Salix herbacea, Saxifraga tricuspidata, Luzula confusa, Silene acaulis), and abundant lichens; and Polar semidesert limestone barrens (Salix lanata, Saxifraga oppositifolia, Leucanthemum integrifolium) [36]. |
| 40 (670) | Koryak Highlands, near Palmatkina River | −1–−3 | 50–150 | Glacio-fluvial valley, composed of alluvium and proluvium of “dry deltas”, which are pebbles with inclusions of gravel, sand, and boulders. Mainly continuous permafrost. Ref. [33] Vegetation: southern hypoarctic tundra (Betula exilis, Salix pulchra, S. glauca, S. krylovii, S. alaxensis, S. boganidensis, S. richardsonii, Alnus fruticosa, Eriophorum vaginatum, Carex lugens) [34]. |
| Date 2 | Date 1 | Time between Surveys | |||||
|---|---|---|---|---|---|---|---|
| Key Site | Source of Imagery | Survey Date | Resolution, m/pix | Source of Imagery | Survey Date | Resolution, m/pix | |
| Lacustrine thermokarst plains | |||||||
| AS10 | SPOT 5 | 17.07.2011 | 2.5 | Corona | 13.07.1964 | 2.7 | 47 |
| AS14 | WorldView2 | 09.07.2014 | 0.5 | Corona | 19.08.1976 | 1.2 | 38 |
| AS16 | QuickBird | 23.06.2011 | 0.64 | Corona | 21.07.1965 | 2.7 | 46 |
| AS19 | SPOT 5 | 11.08.2008 | 2.5 | Corona | 22.07.1965 | 2.7 | 43 |
| AS21 | SPOT 5 | 10.08.2008 | 2.5 | Corona | 14.08.1966 | 2.7 | 42 |
| AS23 | QuickBird | 05.07.2011 | 0.64 | Corona | 01.08.1976 18.07.1976 | 1.2 | 35 |
| AS3 | SPOT 5 | 14.09.2011 | 2.5 | Corona | 22.07.1976 | 1.2 | 35 |
| AS31 | Worldview2 | 24.06.2011 | 0.5 | Corona | 21.08.1968 | 1.8 | 43 |
| Thermokarst plains with fluvial erosion | |||||||
| 19 | WorldView2 | 28.07.2013 | 0.5 | Corona | 14.08.1967 | 1.2 | 46 |
| 20 | WorldView2 | 24.08.2018 | 0.5 | Corona | 26.07.1972 | 1.2 | 46 |
| 21 | WorldView2 | 10.07.2013 | 0.5 | Corona | 21.07.1965 | 4 | 48 |
| 22 | Sentinel | 11.08.2018 | 10 | Corona | 21.07.1965 | 3.4 | 53 |
| 24 | SPOT 7 | 15.09.2015 | 1.5 | Corona | 31.08.1978 | 3 | 37 |
| 25 | SPOT 6 | 03.08.2019 | 1.5 | Corona | 21.08.1968 | 2.1 | 51 |
| 30 | SPOT 7 | 17.09.2017 | 1.5 | Corona | 07.07.1961 | 2 | 56 |
| 31 | WorldView2 | 01.07.2017 | 0.5 | Corona | 04.07.1979 | 10 | 38 |
| 40 | SPOT 7 | 07.08.2015 | 1.5 | Corona | 29.07.1969 | 2.2 | 46 |
| Key Site | Sample Volume (Date 1) | Sample Volume (Date 2) | Max Neg Differnc | Max Pos Differnc | p-Value |
|---|---|---|---|---|---|
| AS3 | 180 | 176 | −0.016414 | 0.151641 | p < 0.05 |
| AS10 | 167 | 167 | −0.017964 | 0.035928 | p > 0.10 |
| AS14 | 153 | 154 | −0.008021 | 0.048256 | p >0.10 |
| AS16 | 584 | 576 | −0.031369 | 0.024353 | p > 0.10 |
| AS19 | 209 | 209 | −0.038278 | 0.014354 | p > 0.10 |
| AS21 | 351 | 345 | −0.017292 | 0.023981 | p > 0.10 |
| AS23 | 109 | 108 | −0.013931 | 0.047995 | p > 0.10 |
| AS31 | 207 | 210 | −0.026363 | 0.027743 | p > 0.10 |
| Key Site | Mean Area Logarithm (Date 1) | Mean Area Logarithm (Date 2) | Student’s Criterion | Critical Value at the Level of 0.95 | Logarithm Variance (Date 1) | Logarithm Variance (Date 2) | Fisher’s Criterion | Critical Value at the Level of 0.95 |
|---|---|---|---|---|---|---|---|---|
| AS 23 | 12.21 | 12.17 | 0.21 | 1.96 | 1.88 | 1.95 | 1.04 | 1.26 |
| AS 21 | 10.83 | 10.82 | 0.10 | 1.96 | 1.53 | 1.61 | 1.05 | 1.1 |
| AS 19 | 10.90 | 10.92 | 0.16 | 1.96 | 1.51 | 1.54 | 1.02 | 1.14 |
| AS 14 | 11.63 | 11.55 | 0.53 | 1.96 | 1.64 | 1.81 | 1.10 | 1.18 |
| AS 16 | 10.14 | 10.17 | 0.29 | 1.96 | 2.97 | 3.12 | 1.05 | 1.06 |
| AS 10 | 11.94 | 11.92 | 0.13 | 1.96 | 2.04 | 2.07 | 1.02 | 1.18 |
| AS 31 | 9.11 | 8.99 | 0.22 | 1.96 | 5.64 | 5.48 | 1.01 | 1.14 |
| AS 3 | 9.64 | 9.42 | 1.05 | 1.96 | 3.50 | 4.30 | 1.23 | 1.14 |
| Key Site | Sample Volume (Date 1) | Sample Volume (Date 2) | Max Neg Diff | Max Pos Diff | p-Value |
|---|---|---|---|---|---|
| 19 | 205 | 205 | −0.078 | 0.014 | >0.10 |
| 20 | 359 | 372 | −0.150 | 0.002 | <0.001 |
| 21 | 430 | 433 | −0.007 | 0.04 | >0.10 |
| 22 | 291 | 298 | −0.004 | 0.056 | >0.10 |
| 24 | 381 | 362 | −0.100 | 0.011 | <0.05 |
| 25 | 314 | 309 | −0.073 | 0.009 | >0.10 |
| 22 | 291 | 298 | −0.004 | 0.056 | >0.10 |
| 30 | 524 | 522 | −0.043 | 0.007 | >0.10 |
| 31 | 100 | 95 | −0.040 | 0.037 | >0.10 |
| 40 | 553 | 549 | −0.031 | 0.043 | >0.10 |
| Key Site | Mean Lake Area (km2) (Date 1) | Mean Lake Area (km2) (Date 2) | Student’s Criterion | Critical Value at the Level of 0.95 |
|---|---|---|---|---|
| 19 | 0.049 | 0.043 | 0.53 | 1.96 |
| 20 | 0.126 | 0.134 | 0.11 | 1.96 |
| 21 | 0.225 | 0.233 | 0.20 | 1.96 |
| 22 | 0.314 | 0.333 | 0.23 | 1.96 |
| 24 | 0.073 | 0.072 | 0.03 | 1.96 |
| 25 | 0.083 | 0.075 | 0.72 | 1.96 |
| 30 | 0.058 | 0.054 | 0.61 | 1.96 |
| 31 | 0.908 | 0.761 | 0.83 | 1.98 |
| 40 | 0.032 | 0.028 | 1.04 | 1.96 |
| Mean Lake Location Density (km−2) (Date 1) | Mean Lake Location Density (km−2) (Date 2) | Student’s Criterion | Critical Value at the Level of 0.95 | |
|---|---|---|---|---|
| 19 | 0.99 | 0.99 | 0 | 1.96 |
| 20 | 0.80 | 0.83 | 0.50 | 1.96 |
| 21 | 0.37 | 0.37 | 0 | 1.96 |
| 22 | 0.10 | 0.10 | 0 | 1.96 |
| 24 | 2.47 | 2.35 | 0.68 | 1.96 |
| 25 | 1.55 | 1.53 | 0.16 | 1.96 |
| 30 | 1.19 | 1.18 | 0.14 | 1.96 |
| 31 | 0.12 | 0.11 | 0.61 | 1.96 |
| 40 | 0.83 | 0.82 | 0.20 | 1.96 |
Publisher’s Note: MDPI stays neutral with regard to jurisdictional claims in published maps and institutional affiliations. |
© 2022 by the authors. Licensee MDPI, Basel, Switzerland. This article is an open access article distributed under the terms and conditions of the Creative Commons Attribution (CC BY) license (https://creativecommons.org/licenses/by/4.0/).
Share and Cite
Victorov, A.; Kapralova, V.; Orlov, T.; Trapeznikova, O.; Arkhipova, M. Research into Cryolithozone Spatial Pattern Changes Based on the Mathematical Morphology of Landscapes. Energies 2022, 15, 1218. https://doi.org/10.3390/en15031218
Victorov A, Kapralova V, Orlov T, Trapeznikova O, Arkhipova M. Research into Cryolithozone Spatial Pattern Changes Based on the Mathematical Morphology of Landscapes. Energies. 2022; 15(3):1218. https://doi.org/10.3390/en15031218
Chicago/Turabian StyleVictorov, Alexey, Veronika Kapralova, Timofey Orlov, Olga Trapeznikova, and Maria Arkhipova. 2022. "Research into Cryolithozone Spatial Pattern Changes Based on the Mathematical Morphology of Landscapes" Energies 15, no. 3: 1218. https://doi.org/10.3390/en15031218
APA StyleVictorov, A., Kapralova, V., Orlov, T., Trapeznikova, O., & Arkhipova, M. (2022). Research into Cryolithozone Spatial Pattern Changes Based on the Mathematical Morphology of Landscapes. Energies, 15(3), 1218. https://doi.org/10.3390/en15031218