1. Introduction
Aging is the irreversible degradation of material properties caused by applied stresses coming from the environment, e.g., heat, radiation, moisture, and electric fields. In the case of extruded cables, these stresses lead to chemical changes inside the insulation such as depletion of additives and oxidation of polymer chains [
1,
2,
3,
4]. At the macroscale, the chemical modification of the insulation may cause the deterioration of the mechanical and electrical performance of the cable system. In particular, the loss of insulating properties of the material is a key element to be investigated during aging since it can lead to the breakdown (electrical failure) of the insulation system [
5,
6,
7].
Failure of the insulation system, in the case of instrumentation and control (I&C) cables, may imply the unavailability of the device the cable is connected to. This is particularly important in the case of cables connected to safety devices, where the unexpected failure of the system might cause serious danger, as in the case of nuclear environments [
8,
9,
10]. For this reason, monitoring the evolution of insulating properties throughout the application life of the cable system is very important in order to schedule maintenance and take corrective actions which ensure the prevention of damage and the increase of system reliability.
To do so, condition monitoring techniques are used. They can be described as the assessment of the current state and estimation of the future state of a system by means of measurements and calculations [
11]. In the case of low voltage cable systems, which are analyzed in this article, various condition monitoring techniques are commonly used at industrial scale, e.g., insulation resistance, indenter modulus and elongation-at-break [
8,
11,
12,
13,
14,
15,
16]. Even so, in some cases, these techniques are not referred to the bulk of the insulation, they may exhibit high error dispersion, or they are based on destructive tests. In this framework, various electrical techniques, e.g., frequency domain reflectometry (FDR) and dielectric spectroscopy (DS) are increasing in interest due to their non destructiveness and possibility to be used onsite [
13,
14,
17,
18,
19,
20,
21].
The DS technique addresses most of the requirements being also referred to the bulk of the insulation. The measured dielectric quantity, the complex permittivity, is a function of the electric field frequency. In particular, in the case of the imaginary part of permittivity (dielectric losses), the quantity can vary by several orders of magnitudes depending on the analyzed frequency [
13,
22,
23,
24,
25]. For this reason, some researchers [
17,
26,
27,
28,
29,
30] looked for the most suitable frequency to be related to the aging development inside the insulating material. Despite this being still under debate, the authors found that the complex permittivity at 100 kHz well follows the aging state of the material and successfully correlates with some of the most common techniques for aging evaluation i.e., elongation-at-break [
14,
18,
31], suggesting its use as an aging marker for LV cable systems.
Nowadays, various portable devices able to measure various dielectric properties, e.g., tan δ and resistivity are commercially available. However, they usually operate in a very narrow frequency range which, in most cases, is not efficiently related to the aging development of the insulation system, such as power frequencies (50 or 60 Hz) and low frequencies (0.1 Hz). On the other hand, devices able to provide a broadband dielectric spectrum (up to 1 MHz) are lab-scale equipment and, for this reason, not easily usable on site.
This article aims at filling this gap by developing a portable device, capable of performing dielectric spectroscopy measurements, able to operate in the frequency region of interest for the aging evaluation e.g., 1–200 kHz. The validation of the device is achieved by measuring and checking the values obtained from tests on reference samples, i.e., with known capacitance and tan δ. Finally, a sensitivity analysis of the device is presented, aiming at evaluating the minimum aged cable length able to register modification in the dielectric spectrum.
2. Dielectric Spectroscopy as a Condition Monitoring Technique
2.1. Introduction and Operating Principle
Dielectric spectroscopy, sometimes called impedance spectroscopy, is a nondestructive technique which measures the dielectric response of a medium subjected to an external alternating electric field as a function of frequency. From this measurement, the complex permittivity can be obtained. It is defined as:
where ε′ is the real part of permittivity and represents the ability of the dielectric medium to store energy and ε″ is the imaginary part of permittivity and defines the energy losses of the material. The values of permittivity of dielectric materials are usually recorded as relative values with respect to the permittivity in vacuum (ε
0 = 8.85 pF/m). For polyolefins, typical values of ε’ range in the order of some units (~2.2 for polyethylene and polypropylene) [
25,
32,
33,
34,
35].
In the case of perfect dielectrics, the current is π/2 leading with respect to the applied voltage. In real dielectrics, the phase displacement is not exactly π/2 but there is an angular deviation (δ), whose tangent (tan δ) is defined as dissipation factor (DF) (
Figure 1). This measures the quantity of energy dissipated by the dielectric system due to polarization mechanisms [
25,
36,
37,
38].
The dissipation factor may be expressed as a function of other electrical properties, i.e., complex permittivity and conductivity, through the following formula:
where σ is the conductivity of the dielectric and ω is the angular frequency. At high frequencies, the term
is negligible, and the dissipation factor is reduced to the ratio between the two parts of complex permittivity.
The use of the dissipation factor over the complex of permittivity is very convenient in the case of real systems, e.g., cables. Indeed, while the complex permittivity (particularly the real part) is deeply influenced by the geometrical properties of the dielectric material, tan δ values are invariant to dielectric structural characteristics. Moreover, if we consider frequency regions where the ratio can be neglected, the dissipation factor can be a good representative of the dielectric losses of the material under test.
2.2. Effect of Frequency
As briefly reported above, the complex permittivity is a function of the frequency of the applied alternating electrical field. In particular, the dielectric losses exhibit a peak in the dielectric spectrum once the electric field frequency is close to the inverse of the relaxation time of the species inside the dielectric. Depending on the nature of the species and the frequency region in which these species exhibit a relaxation peak, we can divide the dielectric spectrum into four sections, each one related to a particular polarization mechanism: electronic, atomic, dipolar, and interfacial polarizations.
The first two mechanisms are related to optical frequencies (>400 THz) and the complex permittivity trend is normally very difficult to identify due to the environmental noises and distortions [
25,
37,
39].
The other two mechanisms are the most interesting in terms of investigation of material properties, since they represent the biggest part of the dielectric losses for the material, and they are related to frequencies normally used in electrical applications. In particular, the dipolar polarization is related to the movement of dipoles in the direction of the electric field. The frequency region, in which this polarization mechanism occurs, is estimated to be between 10
3–10
9 Hz, with a peak of dielectric losses at ~10
5 Hz. On the other side, the interfacial polarization, also called Maxwell–Wagner–Sillars (MWS) polarization, is linked to the accumulation of opposite charges at different surfaces (e.g., between the amorphous and crystalline phase or between matrix and additives) thanks to the external electric field. This kind of polarization, which is characterized by frequencies lower than ~10 Hz, is the most relevant in terms of dielectric losses, which can reach very high values [
25,
37,
39].
Among the two, the dipolar polarization is the one to be taken into account for the dielectric aging assessment. As is well known, the main degradation mechanism, occurring inside organic materials like polymers, is oxidation. This latter is a thermo-assisted process since its kinetics is exponentially dependent on temperature (see Arrhenius law) [
2,
4]. Briefly reporting, during the initial phases of the degradative process, the polymer macromolecules face chain scission [
2]. This process leads to the creation of two smaller molecules with unpaired charges (radicals), which are highly reactive and tend to acquire oxygen molecules coming from the environment (oxidation reaction). Given the high electronegativity of oxygen molecules in comparison with the carbon and hydrogen ones, the molecules produced during this process (oxidized polymer chains) are characterized by a permanent dipole. As an example, using the chemical simulation software Avogadro [
40], it is possible to obtain and verify that typical PE chains exhibit no permanent dipole (estimated dipole moment ~0 D), while the same PE chain with a single oxygen atom, e.g., ketone, show a permanent dipole ~2.7 D. The presence of permanent dipoles brings to the modification of the electrostatic potential as shown in
Figure 2 for a PE chain before (2a) and after (2b) the formation of a ketone group (oxidation phase). Obviously, as we increase the aging time and the aging stress, we are increasing the number of reactions taking place and, consequently, of oxidized species, e.g., aldehydes, hydroperoxides, ketones and carboxyl acids. Given their dipolar properties, all these species electrically respond in the dipolar polarization frequency region.
Nonetheless, it is worth recalling at this point that the molecule relaxation time, and consequently its resonant frequency, is also proportional to the size of the molecule [
37]. In particular, given the big molecular dimensions and dipolar properties, the frequency region likely associated with the response of the oxidized polymer chains is the lowest frequency region related to the dipolar polarization (10
4–10
6 Hz).
2.3. The Proper Aging Marker
In our previous works [
14,
17,
18,
28,
35,
41], it was demonstrated how well the dielectric response close to 100 kHz fits the aging evolution of the dielectric materials under test. The values of dielectric losses (or tan δ) at 100 kHz were proposed as a suitable aging marker for LV cables, depicting a monotonic increase of the property with aging and a direct dependence with the aging severity.
As an example,
Figure 3 shows the trend of tan δ as a function of frequency at different aging times for a twisted pair cable subjected to radio-chemical aging (400 Gy/h at 21 °C). From the graph, it is possible to highlight that the monotonic increase of the property is displayed only in the highest frequency region of the spectrum (10
6–10
4 Hz). On the contrary, not good agreement between aging time and tan δ values is shown in the interfacial polarization region (<10 Hz).
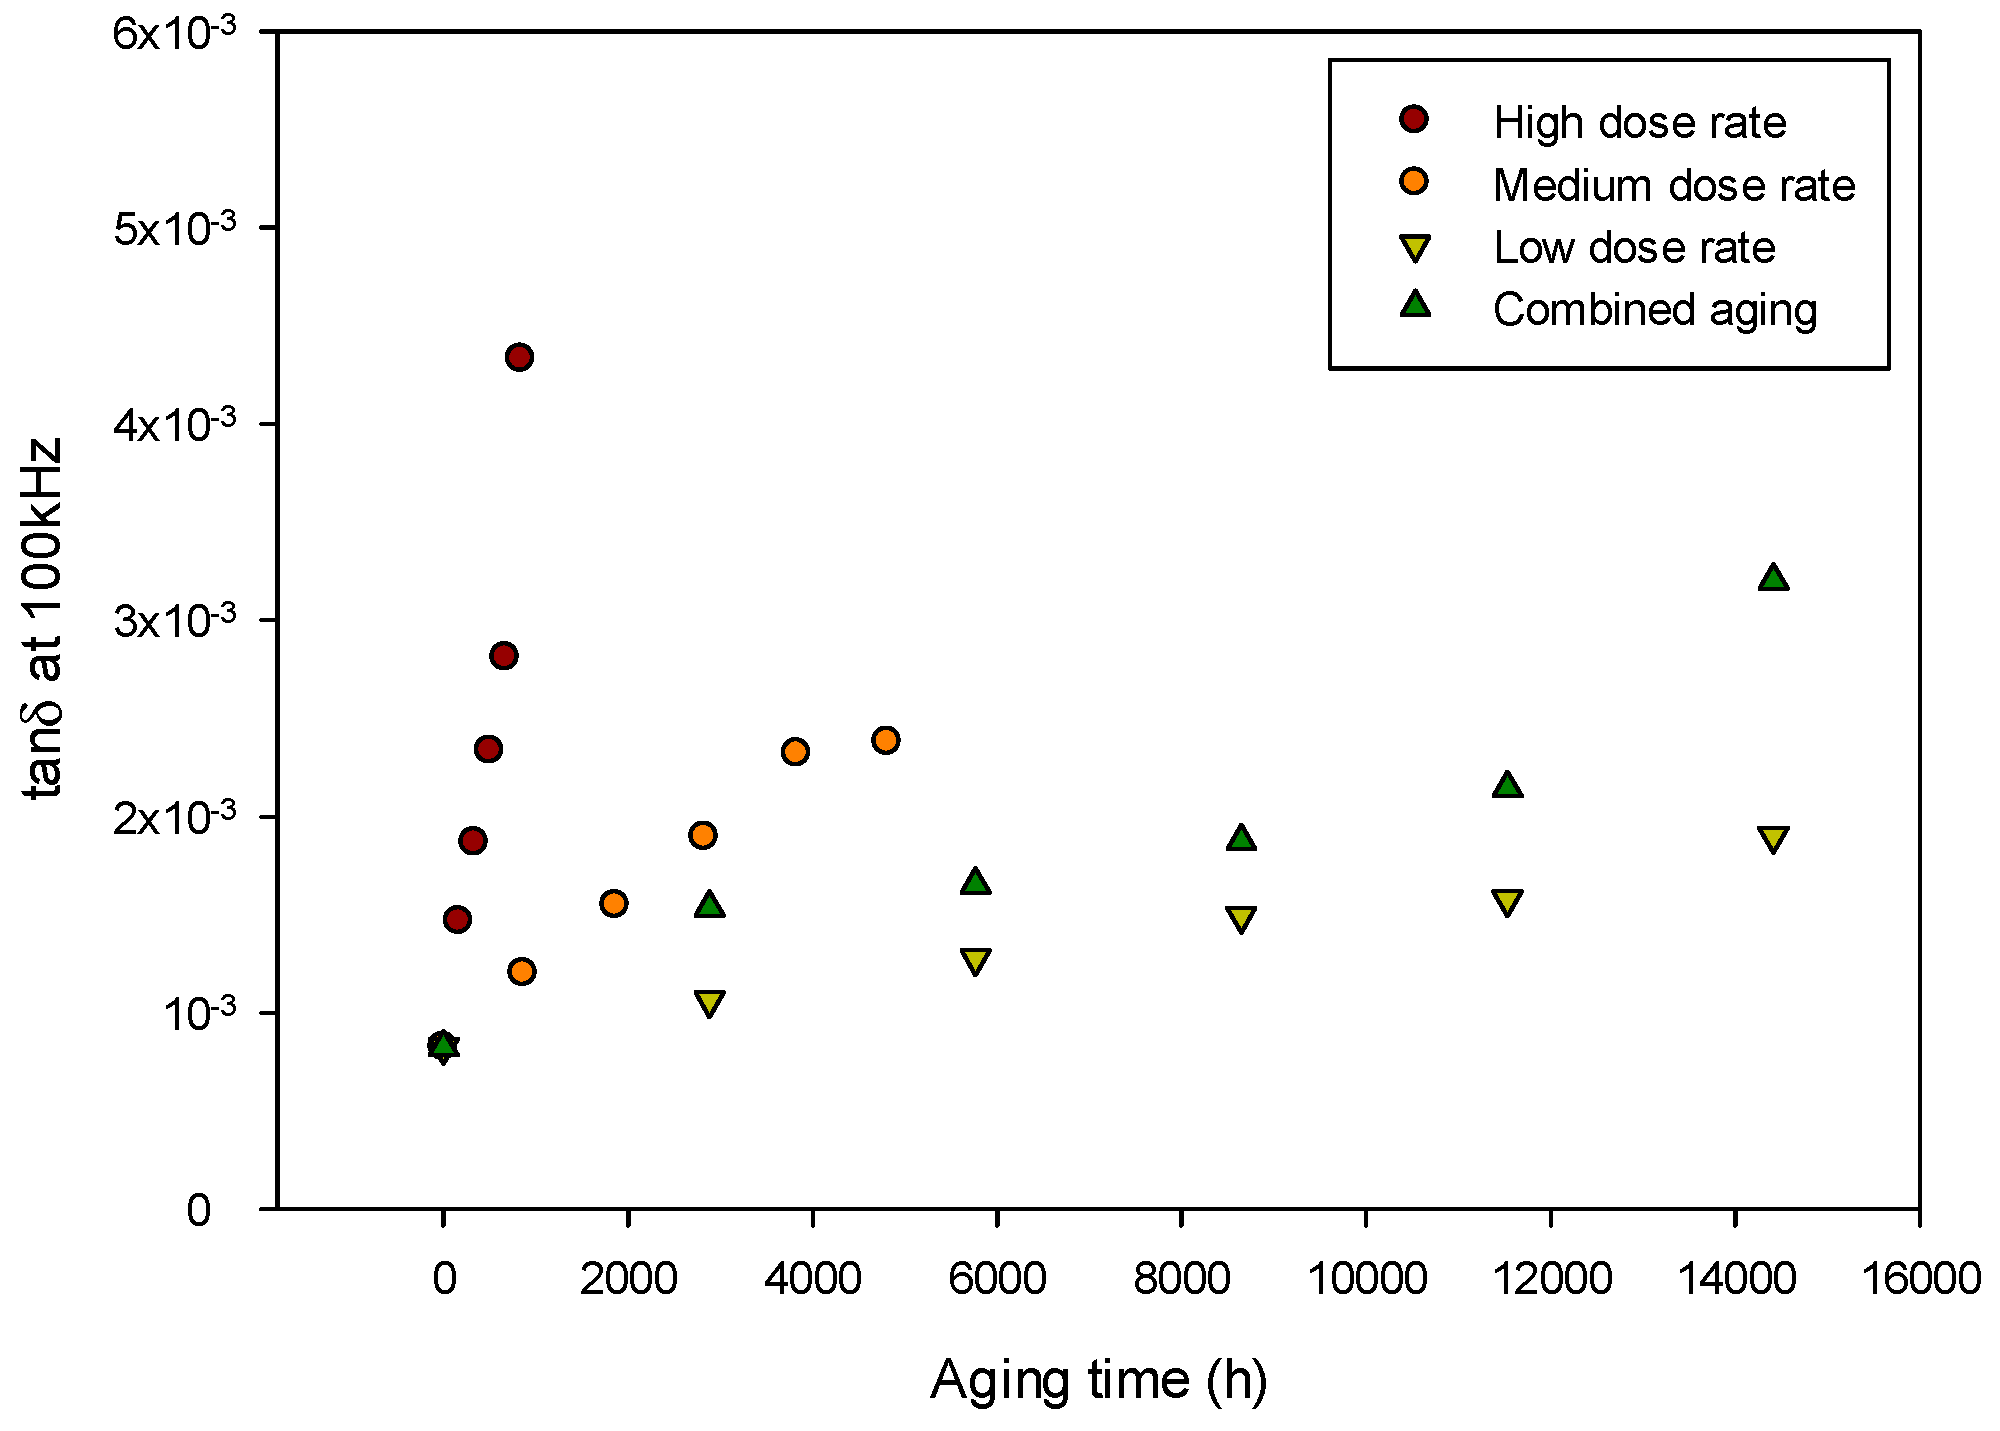
To check the dependance of the property with aging severity, the same cables were aged under different aging conditions, reported in
Table 1. Once aged, dielectric spectroscopy measurements are performed on the cables. The values of tan δ at 100 kHz as a function of the different aging conditions (
Figure 4) claim a complete accordance between the aging severity and the increase of the property, confirming the suitability of the dielectric quantity at 100 kHz to be used as an aging marker for the assessment of the health of LV cables.
3. Portable Dielectric Analyzer
Given the high potential and consistency of the dielectric spectroscopy technique for nondestructive cable health assessment, there is the need to select a device capable to perform such measurements onsite. Indeed, while accessing the cable terminations to perform these measurements is fairly simple inside power plants, up to now and to our knowledge, there is no availability of a portable device for the evaluation of cable dielectric properties at the frequencies of interest (around 100 kHz).
Various devices are commercially available, e.g., LCR (inductance L, Capacitance C, Resistance R) meters and broadband dielectric analyzers, i.e., Novocontrol or Solartron. Unfortunately, the former ones usually work only with selected frequencies in a limited range, i.e., 20 Hz–1 MHz, while the latter ones offer the capability to sweep the frequency throughout a wider range (10−3–107 Hz) and graphically display the acquired parameters, i.e., complex permittivity and tan δ. Besides this, they are lab-scale devices which are not suitable to be used on site. For these reasons, it has been chosen to develop and build a portable device which is able to evaluate the dielectric properties of interest, namely capacitance and tan δ, in a frequency region (1–200 kHz) which includes the frequencies related to the aging of the material (~100 kHz).
3.1. Portable Device Components and Onsite Cable Connections
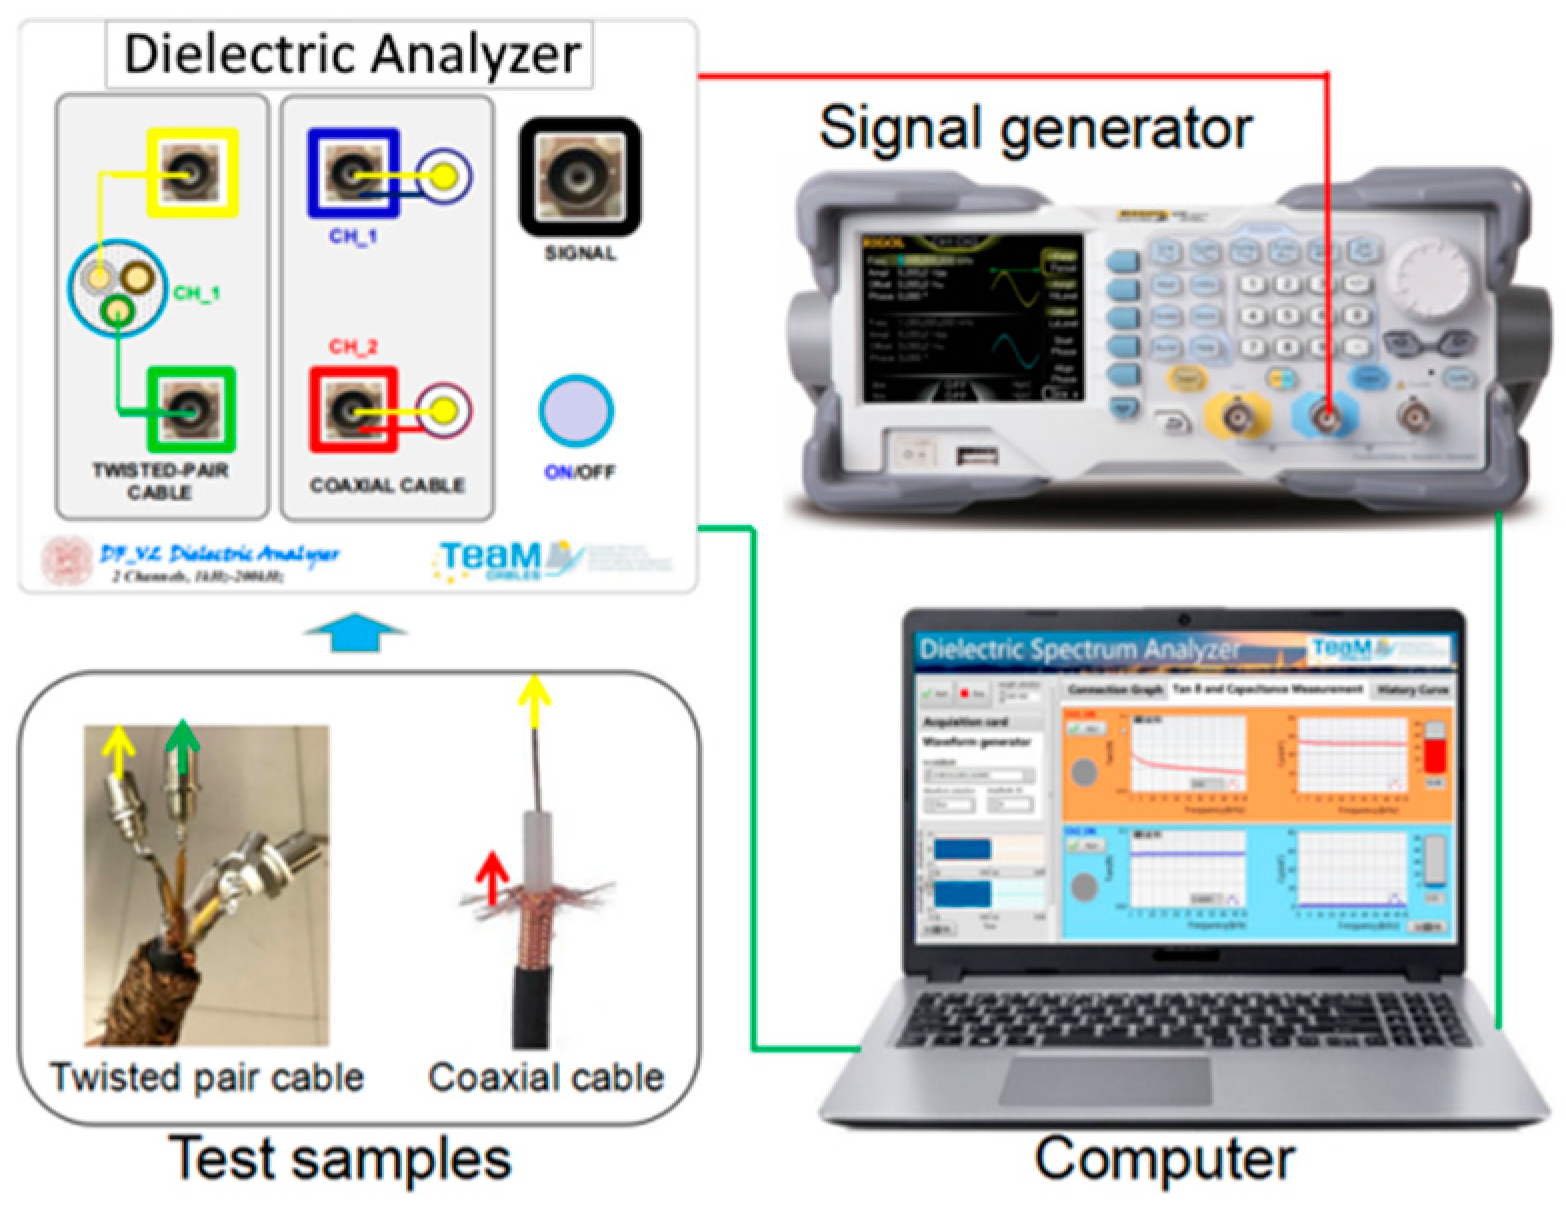
The proposed portable measurement setup is made up of a mainframe, a signal generator, and a laptop to acquire data. The schematic of the setup is reported in
Figure 5.
- -
Device mainframe
The dielectric analyzer mainframe consists of a data acquisition module with a National Instrument (NI) DAQ9174 [
42] and a NI9222 data acquisition card [
43], two sampling resistor modules and five input channels for connection with the signal generator and the cable under test.
- -
Signal generator
The signal generator used is a DG1000Z from Rigol [
44]. It can operate up to 10 V
rms, possibly providing different voltage waveforms.
- -
Cable connections
Cable terminations are usually easily accessible inside the plants. Cables are connected to the device mainframe through two type N or BNC plugs. For the analysis of the cable insulation, one plug is connected to the cable conductor and the second one is connected to the cable shield.
3.2. Theoretical Outlook—Principle of Operation
The operation principle of the proposed system lays on the calculation of the parameters of the voltage drop through the dielectric material once an external voltage is applied [
25,
37]. In the studied setup, the AC voltage is applied through the abovementioned signal generator.
The equivalent circuit of the cable to be tested is a parallel connection of a resistor and a capacitor, and a sampling resistor is connected in series to the cable circuit. Voltages U
C (passing through the cable circuit) and U
0 (passing through the sample resistance) are synchronously collected by the acquisition card together with their corresponding voltage waveforms. After extracting and calculating the parameters, U
C, U
0 and φ (the angle difference of the two voltage waveforms), it is possible to obtain the capacitance, C, and dissipation factor, tan δ of the cable under test according to Equations (3)–(6). The schematic of the connections is reported in
Figure 6.
The current flowing through the two components can be described using the following formula.
After solving Formula (1), we can have the value of C and R, namely:
Therefore, we can obtain tan δ through:
3.3. Software
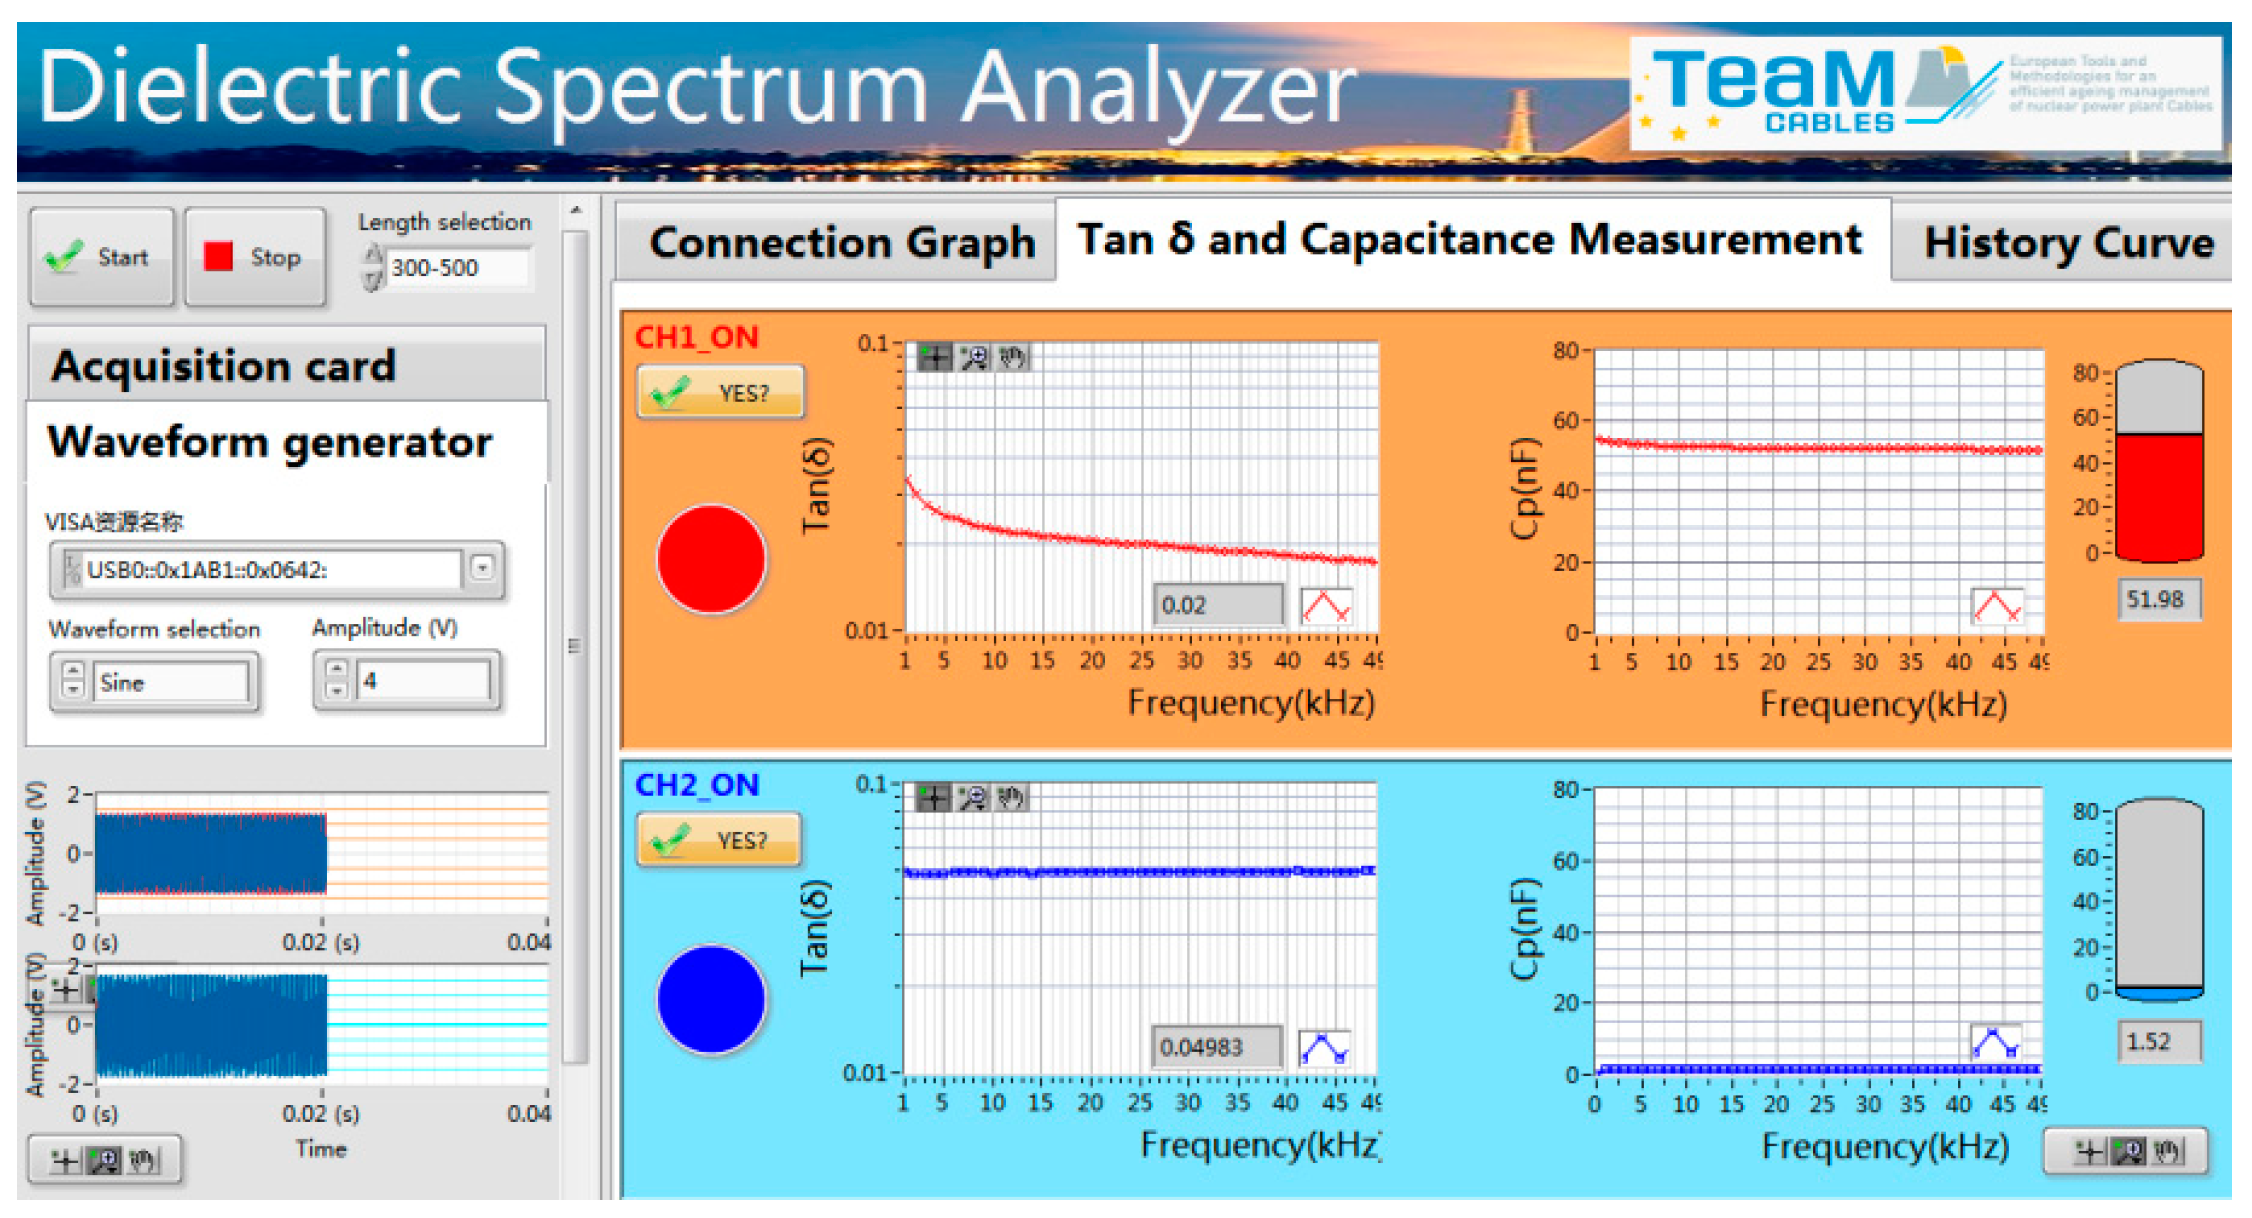
The data coming from the measurements are then acquired by a software based on LabVIEW
® 2018. The software interface allows the choosing of the acquisition card and the signal generator properties i.e., the applied voltage and the waveform. On the right-hand side of the interface capacitance and tan δ values of the cable under test are plotted as a function of frequency after measurements (
Figure 7).
3.4. Laboratory Validation
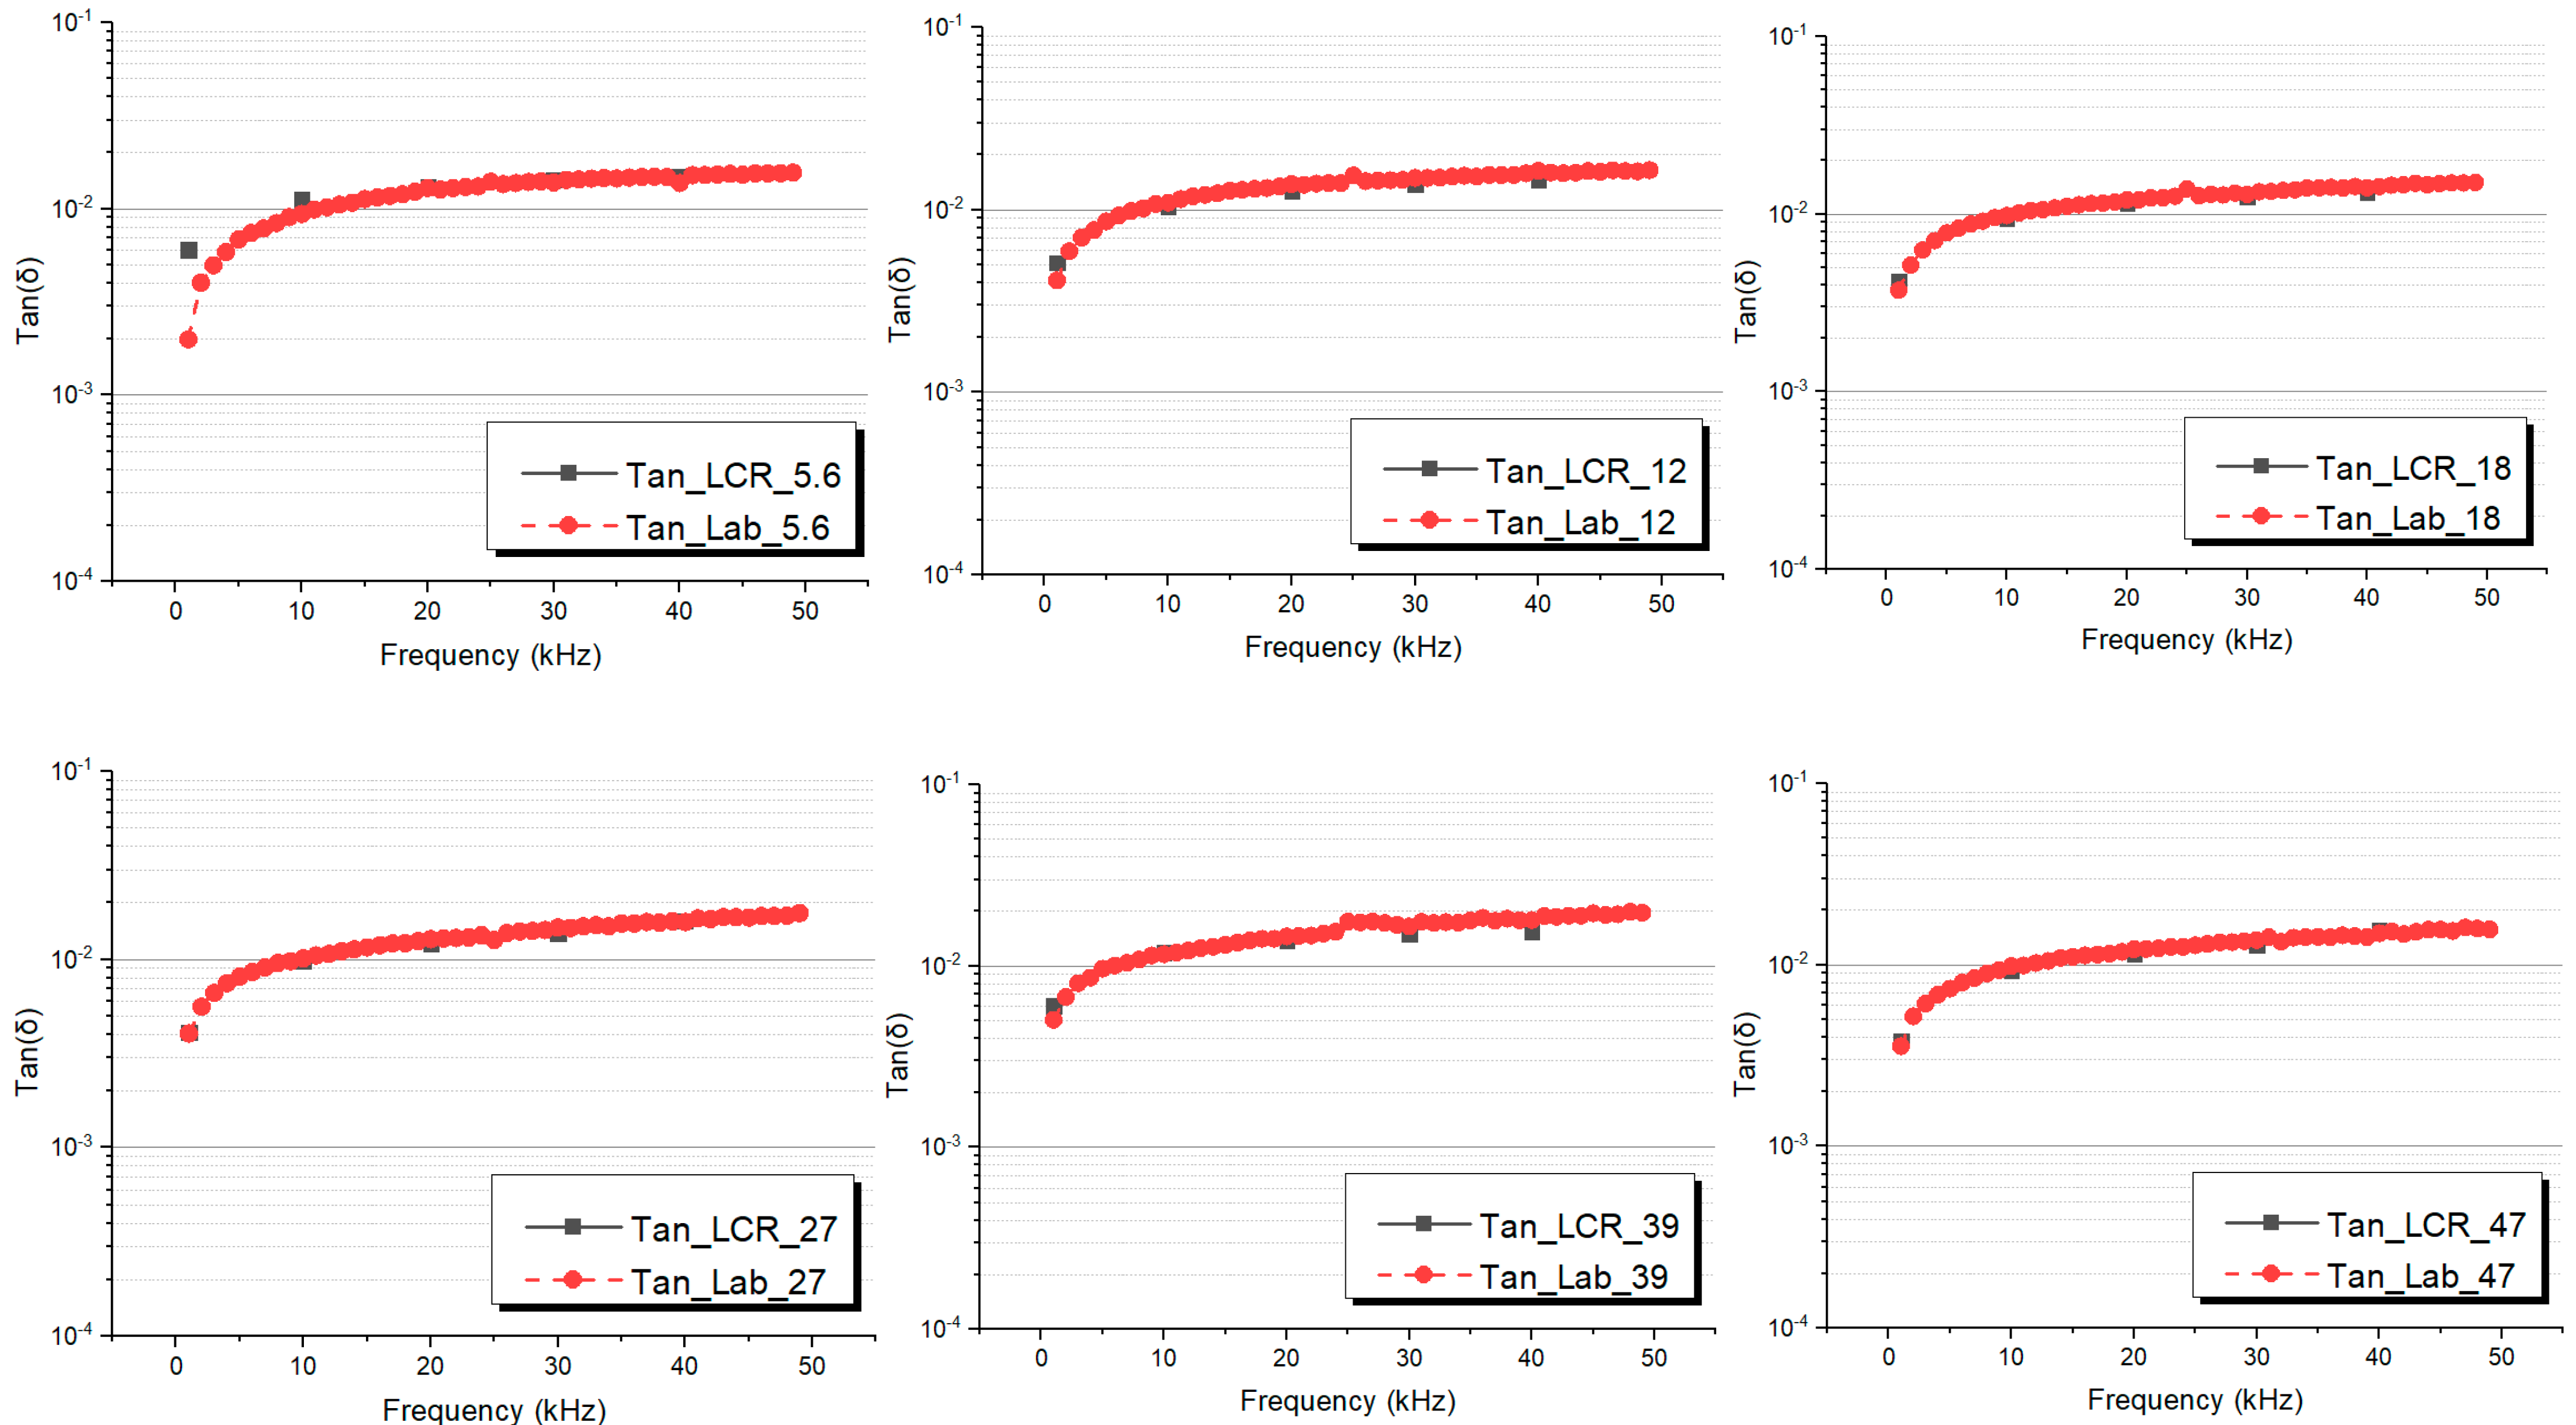
To verify the reliability and consistence of the values obtained by the portable device, capacitors with different nominal capacitances ranging from 1.2 nF to 74 nF are picked and tested.
Figure 8 and
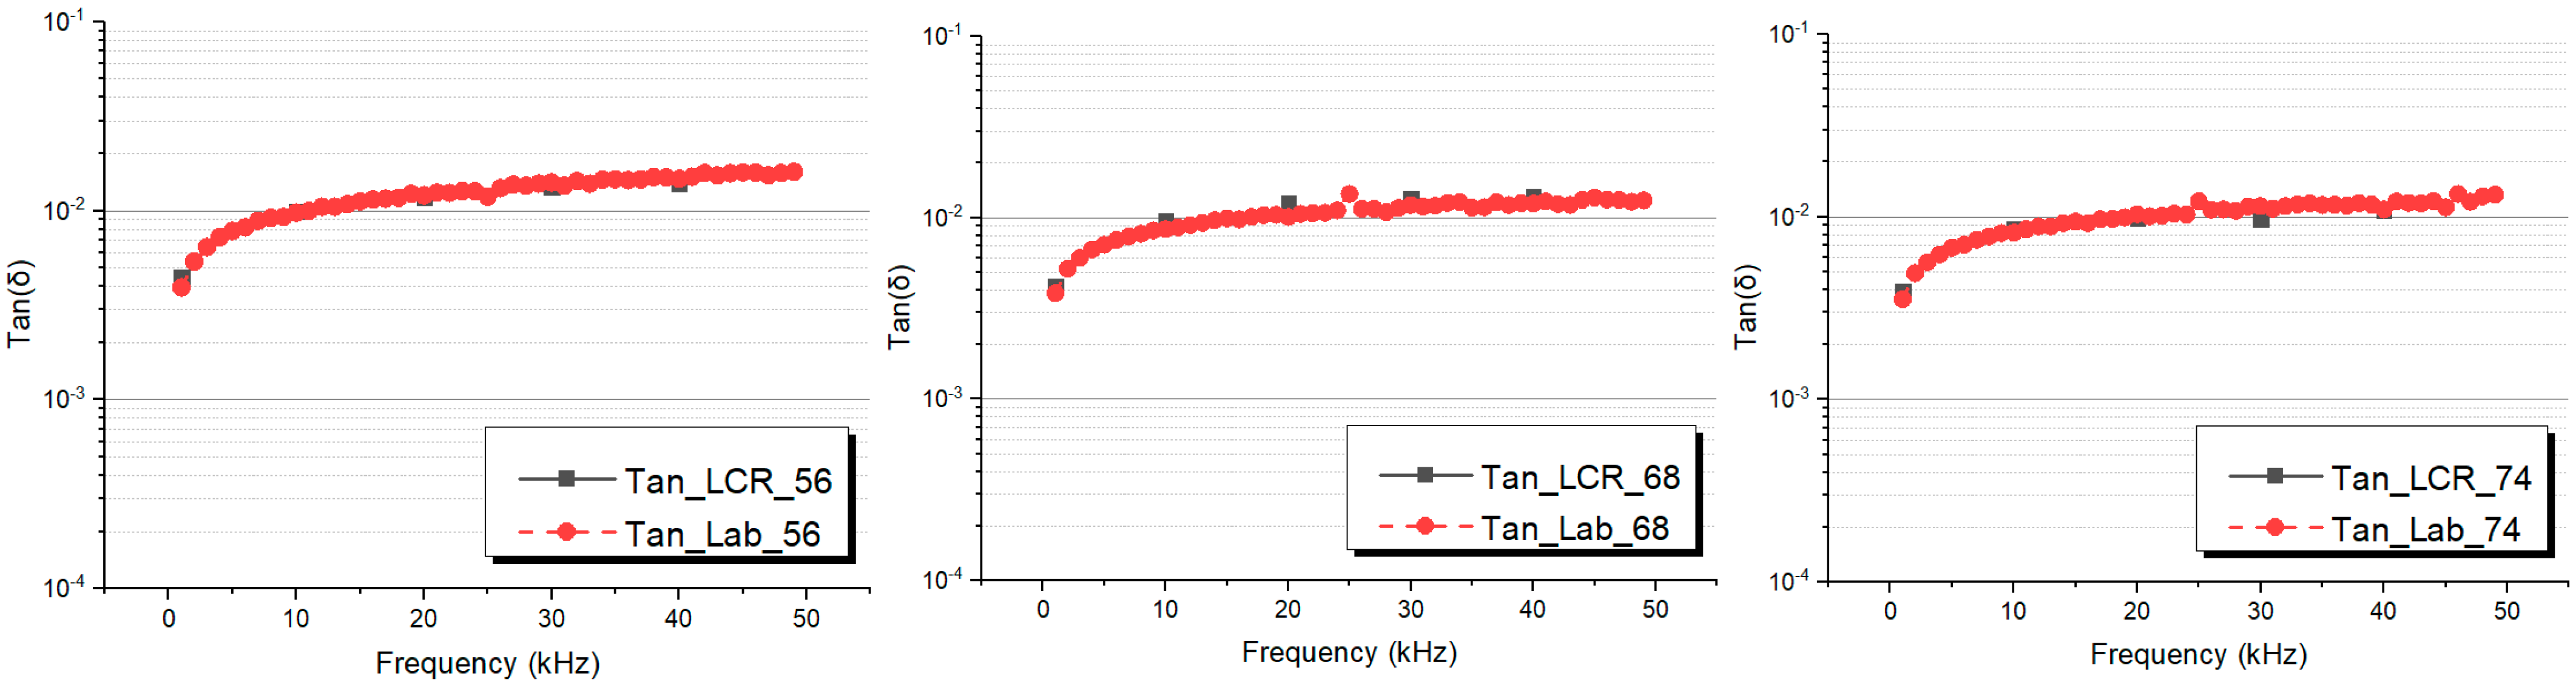
Figure 9 show the measurement results from the proposed device and a commercial impedance analyser (LCR meter Hewlett Packard 4284A).
From
Figure 8, we can find that the measurement results on capacitors obtained by the portable device are in excellent agreement with the ones obtained through the Hewlett Packard 4284A. Similarly, referring to the tan δ measurements (
Figure 9), the obtained results are close to the those obtained by Hewlett Packard 4284A, resulting in maximum difference equal to 8% between the two measurement setups.
4. Sensitivity Tests
4.1. Damage Ratio
One of the limitations appointed to the DS technique is the fact that it cannot localize limited aged region (hot spots) since it is a bulk technique. Indeed, if the aged part of the cable is limited in length, the variation in the property can be small and, in some cases, close to the accuracy of the instrumentation [
45]. Hence, there is the need to study which is the minimum aged length which can cause recordable modifications of the property. In order to perform this sensitivity analysis of the proposed portable device, dielectric properties of cables with different aged lengths have to be tested.
For quantifying the aged part of the cable under test, let us introduce the damage ratio which is defined as the ratio between the aged and the total cable lengths:
In other words, the damage ratio represents the concentration of the aged part of the cable in the total cable length.
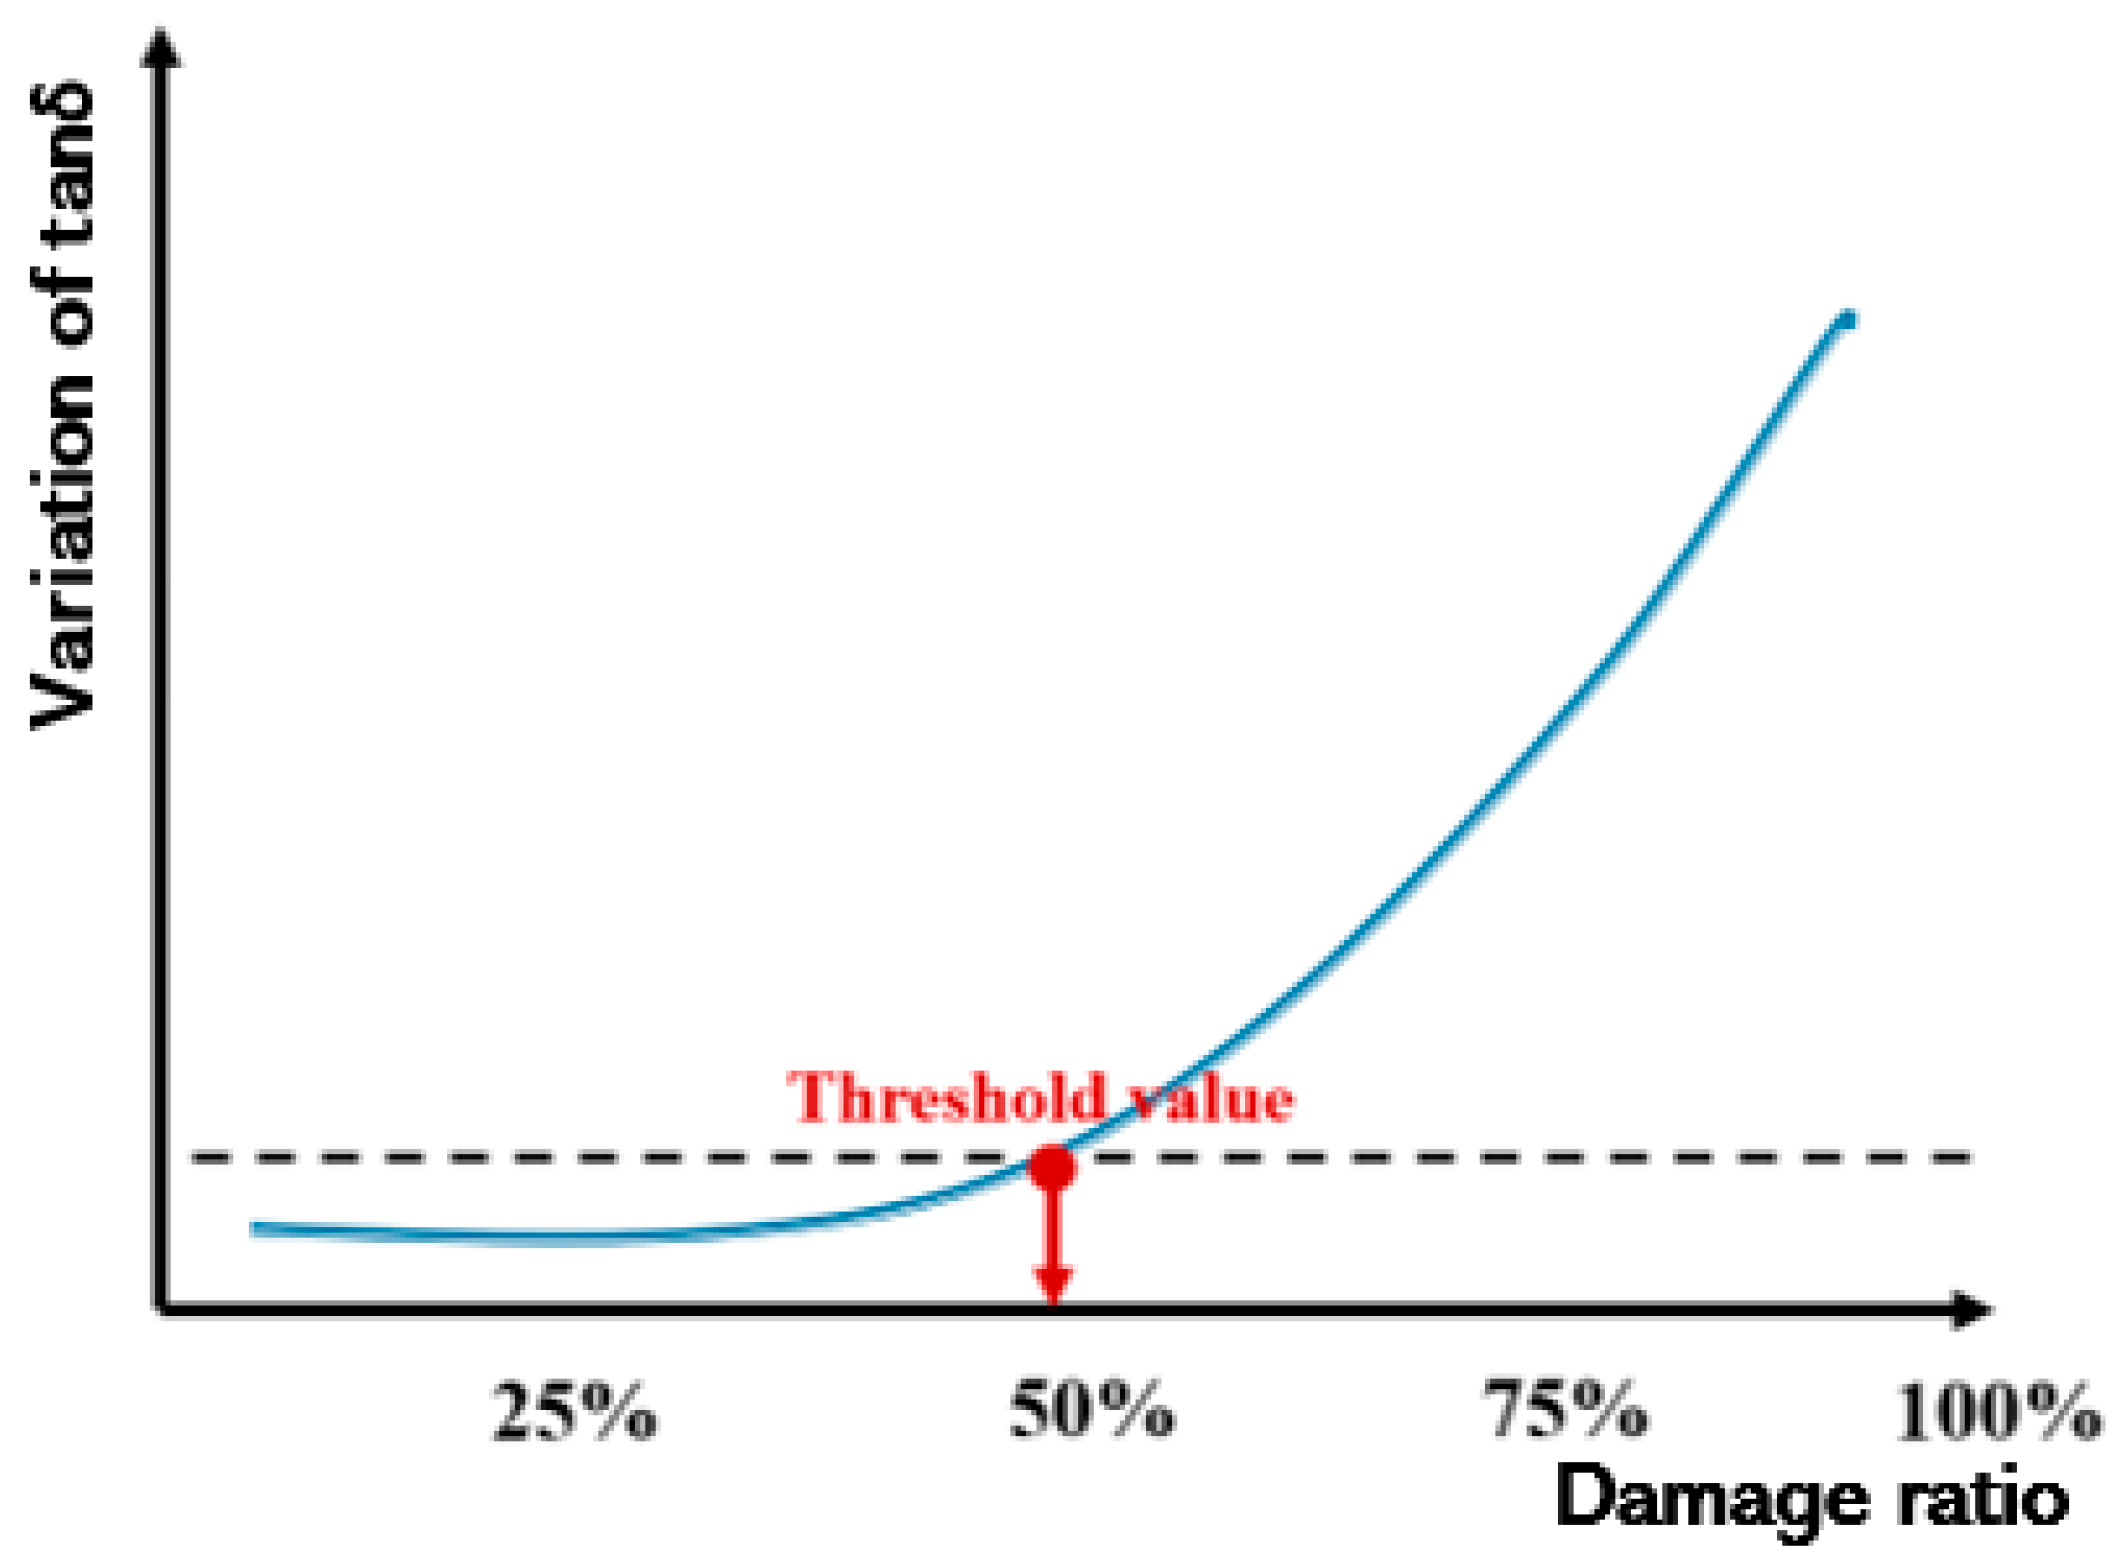
Performing electrical measurements on cables with different damage ratios allows the identification of a threshold value under which the variations of bulk electrical properties are negligible. As a result, this process will allow the definition of the sensitivity of the proposed portable device (
Figure 10).
4.2. Cable Specimens
The cables used to carry the sensitivity tests out are two low-voltage cables, with length of ~10 m, designed for the TeaM Cables H2020 EU Project purposes by Nexans. Their primary insulation is 1.05 mm-thick and it is made up of a Silane cross-linked polyethylene (Si-XLPE) matrix with 1 phr of primary antioxidant (phenol-based) and 1 phr of secondary antioxidant (thioether-based). The cable structure is presented in
Figure 11.
4.3. Aging Procedure and Samples
Table 2 reports the specifications of the tested samples, portraying both the unaged and aged lengths of the different coaxial cables tested and their correspondent damage ratio. Aging was performed on one 10 m-long coaxial cable in an air ventilated oven at 120 °C for ~6000 h. The aged cable was then connected to the second 10 m unaged one through BNC plugs. As a result, a 20 m-cable with a damage ratio = 50% is obtained. After testing, the unaged cable was reduced in length by cutting the cable to the desired dimension and analyzed. Iterating this procedure with different lengths, allows to obtain a wide range of damage ratios (
Table 2).
4.4. Results and Discussion
4.4.1. Specific Capacitance
Capacitance is deeply influenced by the geometric properties of the cable under test. Therefore, it is not usually used as a reference quantity for the evaluation of aging if the cable structure is not known. In this work, given the different lengths (
Table 2) of the cables and in order to compare the different cables under test, it is necessary to divide the measured capacitance results, in Farads, by the correspondent cable length.
Figure 12 shows the trend in specific capacitance (nF/m) as a function of frequency for the different damage ratios considered. Measurements were performed multiple times in order to identify the standard deviation of tests. This was dependent on applied frequency, but was in any case lower than 5%.
From this graph, it is possible to highlight very little modifications of specific capacitance, ranging between 0.1 and 0.12 nF/m, which can be close to the measurement setup accuracy. Moreover, no monotonic increase of the property with damage ratio is observable. This result suggests that the considered property is not related to the damage ratio of the cables; hence it is not suitable for the evaluation of the damage ratio threshold value.
4.4.2. Tan δ Results
Figure 13 displays the trend of tan δ values as a function of frequency for different damage ratios. From this graph it is possible to notice that, as we increase the damage ratio, the tan δ trend is shifted upwards, hence the dielectric losses increase. This result has a twofold output. On the one hand, it confirms the suitability of tan δ to be used for aging assessment of cable systems. On the other hand, it highlights the possibility to use this property for following the variation of concentration of aged sections in the cable and for defining the damage ratio threshold value.
4.4.3. Derivation of the Damage Ratio Threshold Value
For an easier data analysis, it is chosen to report the values of tan δ for the different damage ratios considered for three fixed frequencies, namely 50, 100 and 150 kHz.
Figure 14a reports the absolute values of tan δ while
Figure 14b depicts the percentage variations of the property as a function of the cable damage ratio.
Considering the absolute values, one can notice that, for all the considered frequencies, the tan δ values depict variations even with low damage ratios, although with damage ratios between 0 and 25%, the property value change is very small and could be influenced by the instrumentation uncertainties and noise, in particular in on-field measurements. Moreover, in the case of 150 kHz and 100 kHz, it is possible to see a reduction in the property for low damage ratios (DR < 25%). For these reasons, a variation of at least 10% from the initial value is advisable, this would correspond to a damage ratio ~35%. After this level, for all the frequencies considered, there is a good correspondence between the increase in tan δ values and the cable damage ratio.
Similar reasoning can be obtained focusing on the tan δ percentage variation shown in
Figure 14b. In particular, from the graph, a more significant increase in the property (up to +80% of the initial value) is seen for the 50 kHz response. For the other two frequencies, tan δ increases up to +40%. The limited increase in the property for these two last frequencies is also caused by an initial high value of tan δ which decreases with low damage ratios (DR < 25%). Furthermore, the minimum damage ratio beyond which increasing variations are registered is again equal to ~35%, in agreement with that mentioned above.
In particular, the choosing of this threshold value leads to:
the neglection of small modifications of tan δ values with low damage ratios, (reduction of the registered tan δ).
the overcoming of possible environmental disturbances or instrumentation-related issues.
the use of different frequencies among the frequency region considered. In particular, it would be possible to use 100 kHz as a reference frequency in accordance with its use as an aging marker for cable health status evaluation (see
Section 2.3).
4.4.4. Assessing Cable Health in Cables with Low Damage Ratios
In the previous section it has been shown that negligible variation of the dielectric losses can be recorded by the instrumentation if the aged portion of the cable under test occupies less than 35% of the total cable length (DR < 35%). In real conditions, lower damage ratios are common due to non-homogenous aging stresses the cables are subjected to throughout their length e.g., cables passing through different environments and areas, presence of accidental conditions and localized moisture. In these circumstances, coupling the dielectric spectroscopy setup with a complementary measurement technique may overcome this issue. In our previous work [
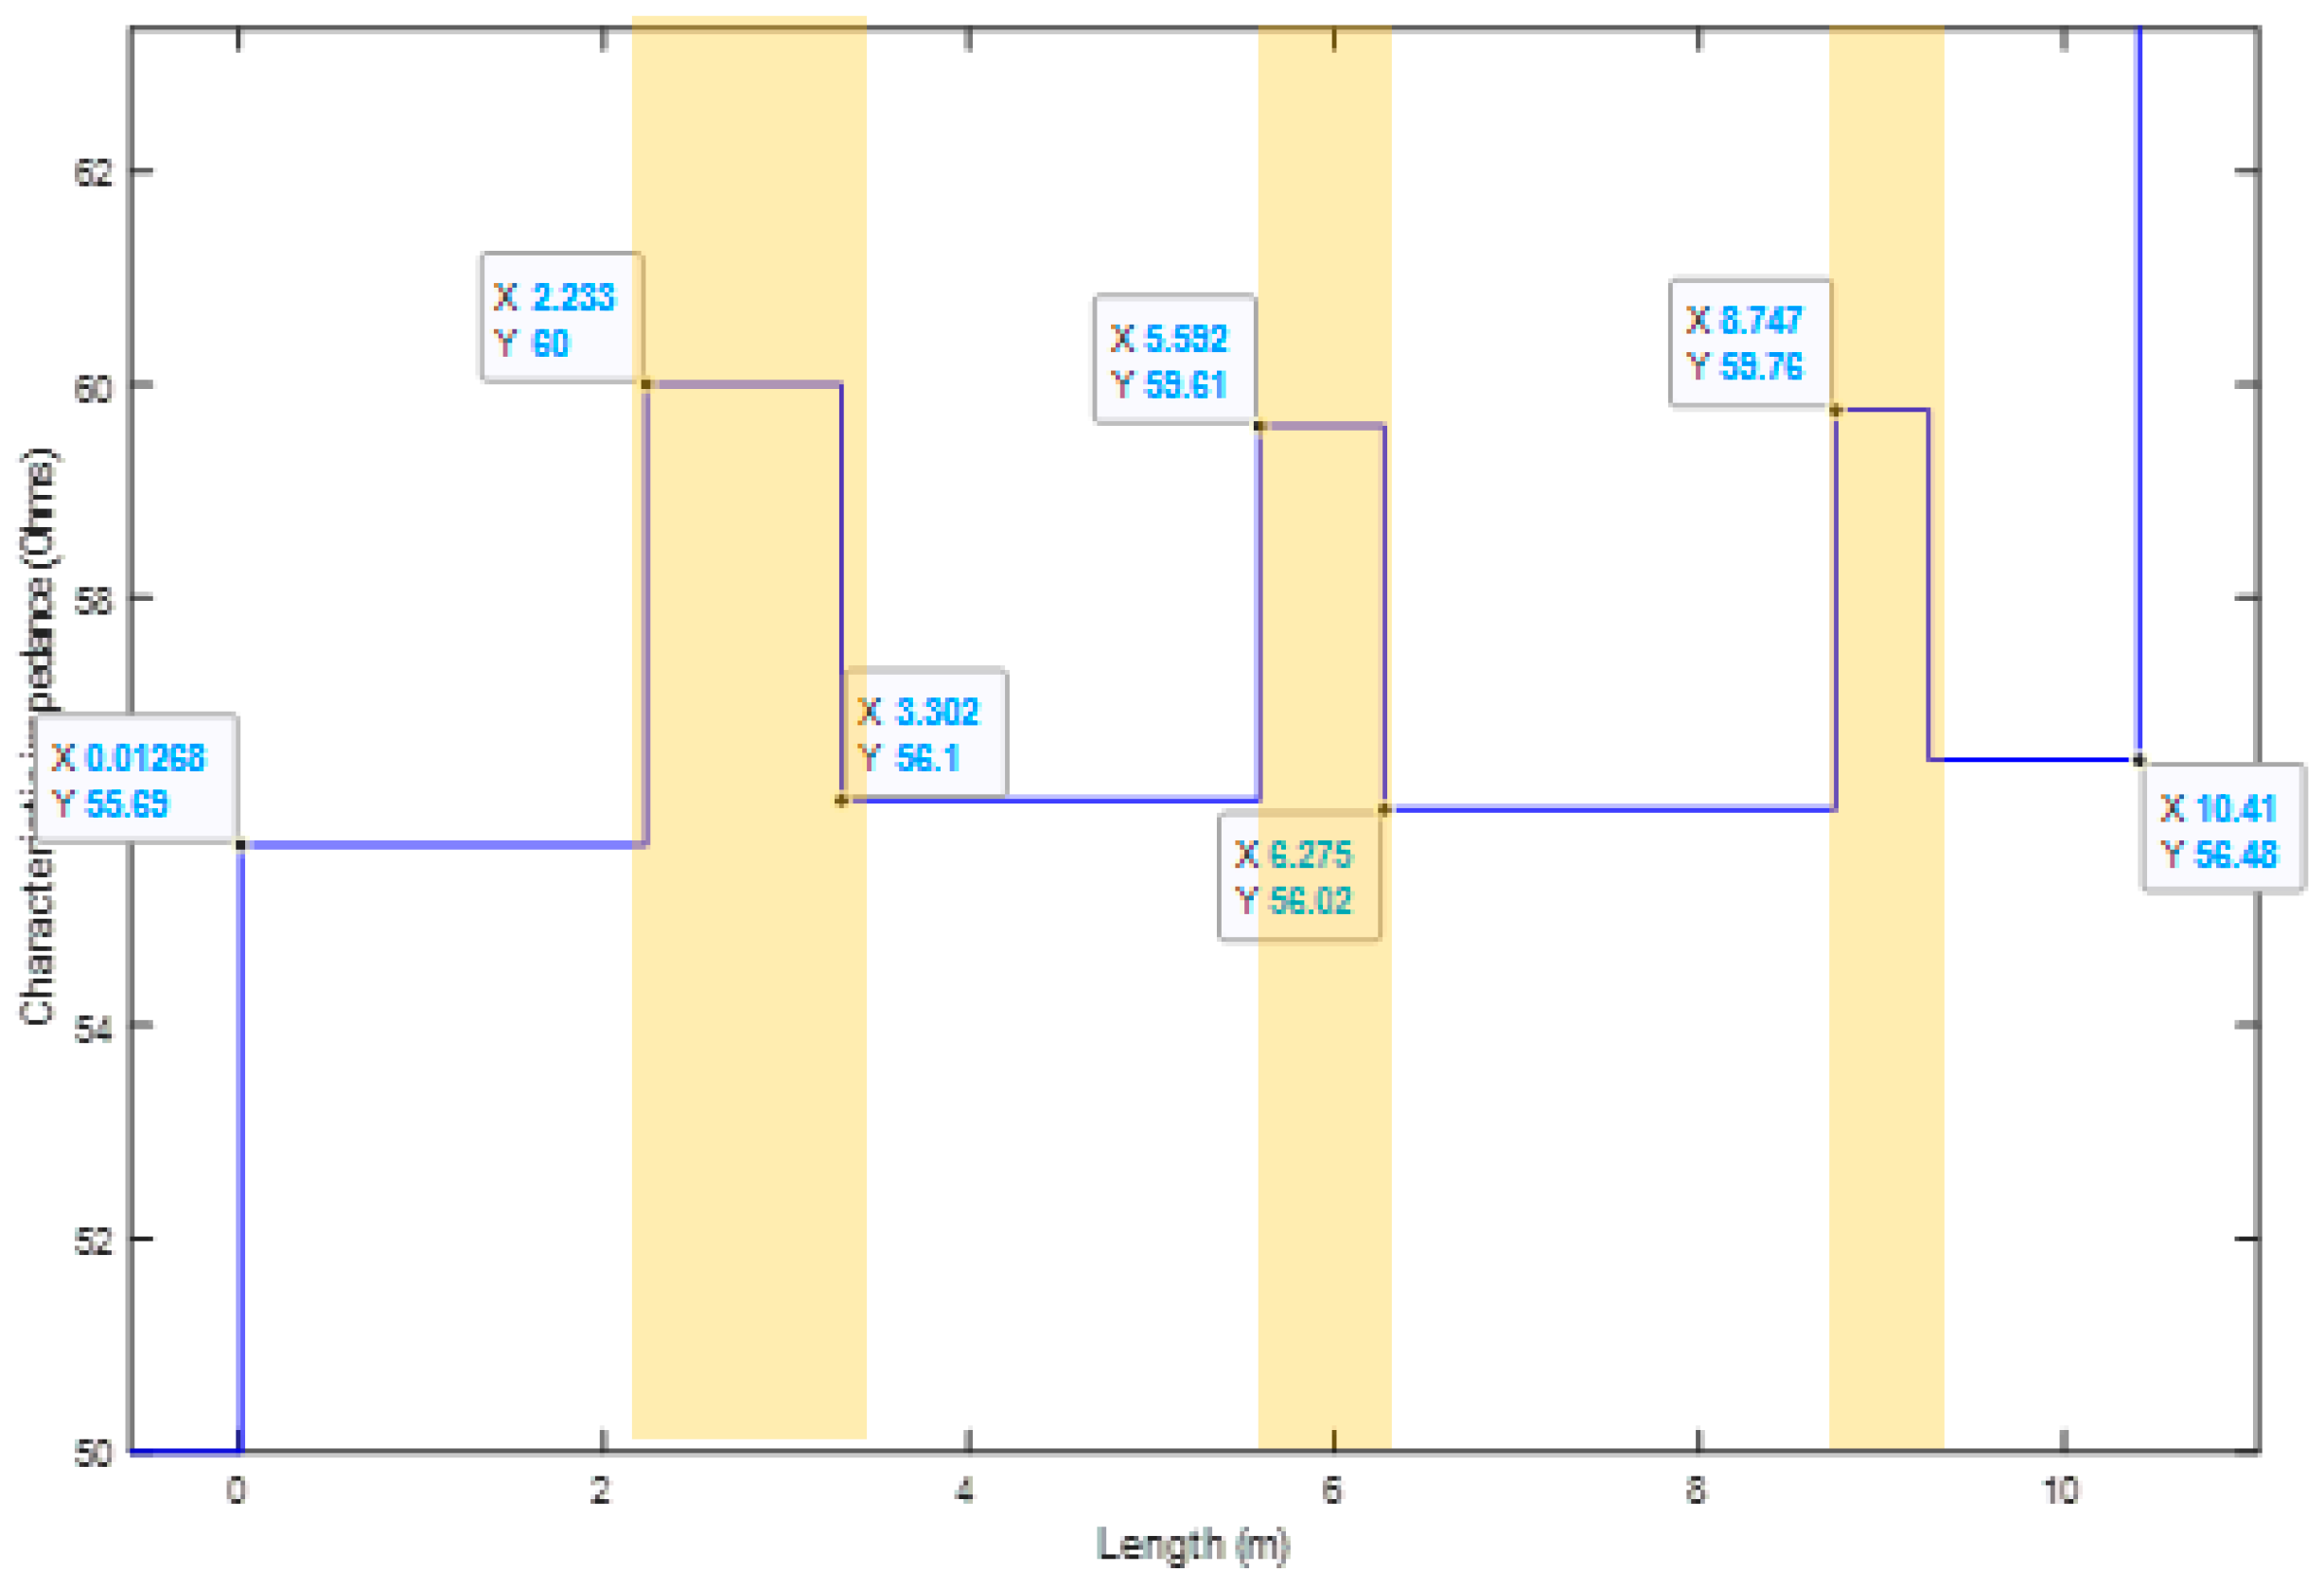
45], we have demonstrated how the Time Domain Reflectometry (TDR) is able to evaluate the locally aged spots and assess the status of the insulation. The device used to perform such measurement is a Vector Network Analyzer (VNA) working in the frequency region 50 kHz–1 GHz. The setup provides the characteristic impedance (Z
c) as a function of cable length. This property is found to increase from its initial value if any defect is present in the cable system e.g., aged spots. As an example,
Figure 15 reports the trend of Z
c for a coaxial cable which was thermally aged in three different sections. As expected, the increase of characteristic impedance is placed in correspondence to the cable aged sections, permitting the identification of the most stressed sections of the cable. Unfortunately, this technique is not a quantitative measurement, hence it is not possible to follow the aging evolution of the cable under test and define an end-of-life criterion. For this reason, the use of the TDR technique is limited to the localization of zones which are more likely to induce cable failure and in need of additional localized tests, e.g., indenter modulus tests [
15].
5. Conclusions
In this work, the design, development, and validation of a portable device capable of performing dielectric spectroscopy measurements on low voltage cables are presented.
It was reported that the most suitable electrical property to be used for aging evaluation is related to the dielectric losses, as tan δ, in the frequency region nearby 105 Hz. To validate the results coming from the device in the frequency range of interest, reference capacitances were used proving good agreement with measured values.
The sensitivity analyses of the portable device were performed using cables with different aged lengths (different damage ratios). It was found that the portable device is able to follow the concentration (and dilution) of aged sections in the cable. This permitted the assessment of the minimum damage ratio which causes appreciable variations in the dielectric spectrum. In particular, depending on the frequency considered, very low damage ratios can be recorded (down to 15%). However, due to the initial small modification of the property, a minimum variation (~10%) from the initial value, related to the unaged sample, is suggested to overcome uncertainties given by instrumentation and environmental noises. Thus, it was found that at least 35% of the damage ratio is needed to trigger noticeable changes in the measured property. Cables with damage ratios <35% would require complementary measurement techniques e.g., TDR, in order to monitor and localize locally aged spots which were showed not to significantly modify the global dielectric property.
Future work on this topic will include the validation of the portable device on cables with different structures e.g., multi pair, different aging conditions, radio-chemical and electrical aging, and onsite testing.
Author Contributions
Conceptualization, S.V.S., C.L. and D.F.; methodology, S.V.S., C.L. and D.F.; validation, S.V.S., C.L. and D.F.; formal analysis, S.V.S., C.L. and D.F.; investigation, S.V.S.; resources, D.F.; data curation, S.V.S.; writing—original draft preparation, S.V.S. and C.L.; writing—review and editing, D.F.; visualization, S.V.S. and D.F.; supervision, D.F.; project administration, D.F.; funding acquisition, D.F. All authors have read and agreed to the published version of the manuscript.
Funding
The project leading to this application has received funding from the Euratom research and training programme 2014–2018 under grant agreement No 755183. This publication reflects only the authors’ view and the European Commission is not responsible for any use that may be made of the information it contains.
Conflicts of Interest
The authors declare no conflict of interest.
References
- Colin, X.; Essatbi, F.; Delozanne, J.; Moreau, G. A new analytical model for predicting the thermal oxidation kinetics of composite organic m atrices. Application to diamine cross-linked epoxy. Polym. Degrad. Stab. 2021, 186, 109513. [Google Scholar] [CrossRef]
- Fayolle, B.; Richaud, E.; Colin, X.; Verdu, J. Review: Degradation-induced embrittlement in semi-crystalline polymers having their amorphous phase in rubbery state. J. Mater. Sci. 2008, 43, 6999–7012. [Google Scholar] [CrossRef]
- Celina, M.C. Review of polymer oxidation and its relationship with materials performance and lifetime prediction. Polym. Degrad. Stab. 2013, 98, 2419–2429. [Google Scholar] [CrossRef]
- Celina, M.; Gillen, K.; Assink, R. Accelerated aging and lifetime prediction: Review of non-Arrhenius behaviour due to two competing processes. Polym. Degrad. Stab. 2005, 90, 395–404. [Google Scholar] [CrossRef]
- Mazzanti, G.; Castellon, J.; Chen, G.; Fothergill, J.; Fu, M.; Hozumi, N.; Lee, J.H.; Li, J.; Marzinotto, M.; Mauseth, F.; et al. The insulation of HVDC extruded cable system joints. Part 1: Review of materials, design and testing procedures. IEEE Trans. Dielectr. Electr. Insul. 2019, 26, 964–972. [Google Scholar] [CrossRef]
- Chiodo, E.; Mazzanti, G. Theoretical and practical aids for the proper selection of reliability models for power system components. Int. J. Reliab. Saf. 2008, 2, 99. [Google Scholar] [CrossRef]
- Delpino, S.; Fabiani, D.; Montanari, G.C.; Laurent, C.; Teyssedre, G.; Morshuis, P.H.F.; Bodega, R.; Dissado, L. Feature article–Polymeric HVDC cable design and space charge accumulation. Part 2: Insulation interfaces. IEEE Electr. Insul. Mag. 2008, 24, 14–24. [Google Scholar] [CrossRef]
- Plaček, V.; Kohout, T.; Kábrt, J.; Jiran, J. The influence of mechanical stress on cable service life-time. Polym. Test. 2011, 30, 709–715. [Google Scholar] [CrossRef]
- Plaček, V.; Kohout, T. Comparison of cable ageing. Radiat. Phys. Chem. 2010, 79, 371–374. [Google Scholar] [CrossRef]
- Plaček, V.; Bartoníček, B.; Hnát, V.; Otáhal, B. Dose rate effects in radiation degradation of polymer-based cable materials. Nucl. Instruments Methods Phys. Res. Sect. B Beam Interactions Mater. Atoms 2003, 208, 448–453. [Google Scholar] [CrossRef]
- Assink, A.; Gillen, K.T.; Bernstein, R. Nuclear Energy Plant Optimization (NEPO) Final Report on Aging and Condition Monitoring of Low-Voltage Cable Materials; SAND2005–7331; Sandia National Laboratories (SNL): Albuquerque, NM, USA; Livermore, CA, USA, 2005; p. 875986. [CrossRef] [Green Version]
- Glass, S.W.; Fifield, L.S.; Dib, G.; Tedeschi, J.R.; Jones, A.M.; Hartman, T.S. State of the Art Assessment of NDE Techniques for Aging Cable Management in Nuclear Power Plants FY2015. In State of the Art Assessment of NDE Techniques for Aging Cable Management in Nuclear Power Plants FY2015; PNNL—24649, M2LW—15OR0404024; Office of Scientific and Technical Information (OSTI): Richland, WA, USA, 2015; p. 1242348. [Google Scholar] [CrossRef]
- Mustafa, E.; Afia, R.S.A.; Tamus, Z. Ádám Condition Monitoring Uncertainties and Thermal—Radiation Multistress Accelerated Aging Tests for Nuclear Power Plant Cables: A Review. Period. Polytech. Electr. Eng. Comput. Sci. 2019, 64, 20–32. [Google Scholar] [CrossRef]
- Suraci, S.V.; Fabiani, D.; Roland, S.; Colin, X. Multi scale aging assessment of low-voltage cables subjected to radio-chemical aging: Towards an electrical diagnostic technique. Polym. Test. 2021, 103, 107352. [Google Scholar] [CrossRef]
- Hirai, N.; Ohki, Y. Correlation between indenter modulus and elongation-at-break observed for four electrical insulating polymers. In Proceedings of the 2017 International Symposium on Electrical Insulating Materials (ISEIM), Toyohashi, Japan, 11–15 September 2017; Volume 2, pp. 753–756. [Google Scholar]
- Zhou, H.; Hanafusa, W.; Udo, K.; Hirai, N.; Ohki, Y. Aging Behavior of Flame-retardant Cross-linked Polyolefin under Thermal and Radiation Stresses. IEEE Trans. Dielectr. Electr. Insul. 2021, 28, 303–309. [Google Scholar] [CrossRef]
- Fabiani, D.; Suraci, S. Broadband Dielectric Spectroscopy: A Viable Technique for Aging Assessment of Low-Voltage Cable Insulation Used in Nuclear Power Plants. Polymers 2021, 13, 494. [Google Scholar] [CrossRef]
- Linde, E.; Verardi, L.; Fabiani, D.; Gedde, U. Dielectric spectroscopy as a condition monitoring technique for cable insulation based on crosslinked polyethylene. Polym. Test. 2015, 44, 135–142. [Google Scholar] [CrossRef]
- Mustafa, E.; Afia, R.S.A.; Nouini, O.; Tamus, Z. Ádám Implementation of Non-Destructive Electrical Condition Monitoring Techniques on Low-Voltage Nuclear Cables: I. Irradiation Aging of EPR/CSPE Cables. Energies 2021, 14, 5139. [Google Scholar] [CrossRef]
- Sallem, S.; Ravot, N. Self-adaptive correlation method for soft defect detection in cable by reflectometry. In Proceedings of the IEEE SENSORS 2014 Proceedings, Valencia, Spain, 2–5 November 2014; pp. 2114–2117. [Google Scholar]
- Gagliani, R.; Bowler, N.; Glass, S.W.; Fifield, L.S. Capacitance measurements for nondestructive testing of aged nuclear power plant cable. In Proceedings of the QNDE 2019: 46th Annual Review of Progress in Quantitative Nondestructive Evaluation, Portland, OR, USA, 14–18 July 2019; p. 3. [Google Scholar]
- Alegria, A.; Colmenero, J. Dielectric relaxation of polymers: Segmental dynamics under structural constraints. Soft Matter 2016, 12, 7709–7725. [Google Scholar] [CrossRef]
- Suraci, S.V.; Fabiani, D. Aging Modeling of Low-Voltage Cables Subjected to Radio-Chemical Aging. IEEE Access 2021, 9, 83569–83578. [Google Scholar] [CrossRef]
- Linde, E.; Verardi, L.; Pourmand, P.; Fabiani, D.; Gedde, U. Non-destructive condition monitoring of aged ethylene-propylene copolymer cable insulation samples using dielectric spectroscopy and NMR spectroscopy. Polym. Test. 2015, 46, 72–78. [Google Scholar] [CrossRef]
- Schönhals, A. Molecular Dynamics in Polymer Model Systems. In Broadband Dielectric Spectroscopy; Springer: Berlin/Heidelberg, Germany, 2003. [Google Scholar]
- Wang, Y.; Zhao, A.; Zhang, X.; Shen, Y.; Yang, F.; Deng, J.; Zhang, G. Study of dielectric response characteristics for thermal aging of XLPE cable insulation. In Proceedings of the 2016 International Conference on Condition Monitoring and Diagnosis (CMD), Xi’an, China, 25–28 September 2016; pp. 602–605. [Google Scholar]
- Bowler, N.; Liu, S. Aging Mechanisms and Monitoring of Cable Polymers. Int. J. Progn. Health Manag. 2015, 6. [Google Scholar] [CrossRef]
- Suraci, S.V.; Fabiani, D.; Xu, A.; Roland, S.; Colin, X. Ageing Assessment of XLPE LV Cables for Nuclear Applications Through Physico-Chemical and Electrical Measurements. IEEE Access 2020, 8, 27086–27096. [Google Scholar] [CrossRef]
- Banerjee, S.; Rouison, D.; Mantey, A. Low Frequency Dielectric Spectroscopy As A Condition Monitoring Technique For Low Voltage Cable In Nuclear Plants. In Proceedings of the 10th International Conference on Insulated Power Cables, Paris, France, 23–27 June 2019. [Google Scholar]
- Liu, J.; Zhang, D.; Bin, C.; Huang, L.; Gao, Y.; Li, X. A New method of aging assessment for XLPE cable insulation based on dielectric response. In Proceedings of the 2015 IEEE 11th International Conference on the Properties and Applications of Dielectric Materials (ICPADM), Sydney, Australia, 19–22 July 2015; pp. 560–563. [Google Scholar]
- Suraci, S.V.; Fabiani, D.; Sipila, K.; Joki, H. Filler impact analysis on aging of crosslinked polyethylene for nuclear applications through dielectric spectroscopy. In Proceedings of the 2019 IEEE Conference on Electrical Insulation and Dielectric Phenomena (CEIDP), Richland, WA, USA, 20–23 October 2019; pp. 166–169. [Google Scholar]
- Meunier, M.; Quirke, N.; Aslanides, A. Molecular modeling of electron traps in polymer insulators: Chemical defects and impurities. J. Chem. Phys. 2001, 115, 2876–2881. [Google Scholar] [CrossRef]
- Natan, A.; Kuritz, N.; Kronik, L. Polarizability, Susceptibility, and Dielectric Constant of Nanometer-Scale Molecular Films: A Microscopic View. Adv. Funct. Mater. 2010, 20, 2077–2084. [Google Scholar] [CrossRef]
- Liu, T.; Fothergill, J.; Dodd, S.; Nilsson, U. Dielectric spectroscopy measurements on very low loss cross-linked polyethylene power cables. J. Phys. Conf. Ser. 2009, 183, 012002. [Google Scholar] [CrossRef]
- Suraci, S.V.; Fabiani, D.; Mazzocchetti, L.; Maceratesi, V.; Merighi, S. Investigation on Thermal Degradation Phenomena on Low Density Polyethylene (LDPE) through Dielectric Spectroscopy. In Proceedings of the 2018 IEEE Conference on Electrical Insulation and Dielectric Phenomena (CEIDP), Cancun, Mexico, 21–24 October 2018; pp. 434–437. [Google Scholar]
- Schultz, J.W. Dielectric Spectroscopy in Analysis of Polymers. In Encyclopedia of Analytical Chemistry; Wiley: Hoboken, NJ, USA, 2000. [Google Scholar]
- Menczel, J.D.; Prime, R.B. Frontmatter. In Thermal Analysis of Polymers; Wiley: Hoboken, NJ, USA, 2008. [Google Scholar]
- Woodward, W.H.H. Broadband Dielectric Spectroscopy—A Practical Guide. In Broadband Dielectric Spectroscopy: A Modern Analytical Technique 2021; American Chemical Society: Washington, DC, USA, 2021; pp. 3–59. [Google Scholar] [CrossRef]
- Resta, R.; Vanderbilt, D. Theory of Polarization: A Modern Approach. In Integrated Optics; Springer: Berlin/Heidelberg, Germany, 2007; Volume 105, pp. 31–68. [Google Scholar]
- Hanwell, M.D.; Curtis, D.E.; Lonie, D.C.; Vandermeersch, T.; Zurek, E.; Hutchison, G.R. Avogadro: An advanced semantic chemical editor, visualization, and analysis platform. J. Cheminform. 2012, 4, 17. [Google Scholar] [CrossRef] [Green Version]
- Suraci, S.V. Aging Assessment of Polyethylene-Based Insulated Low-Voltage Cables for Nuclear Applications; University of Bologna: Bologna, Italy, 2020. [Google Scholar]
- cDAQ-9174—NI. Available online: https://www.ni.com/it-it/support/model.cdaq-9174.html (accessed on 28 December 2021).
- NI-9222—NI. Available online: https://www.ni.com/it-it/support/model.ni-9222.html (accessed on 28 December 2021).
- DG1000Z Series-RIGOL Waveform-Generators-RIGOL Technologies EU GmbH. Available online: https://www.rigol.eu/products/waveform-generators/dg1000z.html?tp3 (accessed on 28 December 2021).
- Suraci, S.V.; Fabiani, D.; Cohen, J. In situ defect recognition analysis on long cables through nondestructive reflectometry and dielectric spectroscopy methods: A comparison. In Proceedings of the 2020 IEEE Electrical Insulation Conference (EIC), Knoxville, TN, USA, 22 June–3 July 2020; pp. 41–44. [Google Scholar]
Figure 1.
Representation of voltage-current phase displacement inside capacitors.
Figure 1.
Representation of voltage-current phase displacement inside capacitors.
Figure 2.
Electrostatic potential of a PE chain made up of 12 carbon atoms, before (a) and after (b) formation of a ketone group. (a) Pure PE (b) PE + ketone.
Figure 2.
Electrostatic potential of a PE chain made up of 12 carbon atoms, before (a) and after (b) formation of a ketone group. (a) Pure PE (b) PE + ketone.
Figure 3.
Tan δ versus frequency as a function of aging time.
Figure 3.
Tan δ versus frequency as a function of aging time.
Figure 4.
Tan δ values at 100 kHz as a function of different aging conditions.
Figure 4.
Tan δ values at 100 kHz as a function of different aging conditions.
Figure 5.
Measurement setup scheme for dielectric spectroscopy tests.
Figure 5.
Measurement setup scheme for dielectric spectroscopy tests.
Figure 6.
Measurement circuit schematic.
Figure 6.
Measurement circuit schematic.
Figure 7.
LabVIEW software GUI.
Figure 7.
LabVIEW software GUI.
Figure 8.
Capacitance values as a function of frequency for different reference capacitances. Scatters are results given by the lab scale LCR meter. Continuous lines are results coming from the portable device.
Figure 8.
Capacitance values as a function of frequency for different reference capacitances. Scatters are results given by the lab scale LCR meter. Continuous lines are results coming from the portable device.
Figure 9.
Tan δ values as a function of frequency for different reference samples. Scatters are results given by the lab scale LCR meter. Continuous lines are results coming from the portable device.
Figure 9.
Tan δ values as a function of frequency for different reference samples. Scatters are results given by the lab scale LCR meter. Continuous lines are results coming from the portable device.
Figure 10.
Schematic of the variation of tan δ as a function of the damage ratio. The threshold value is placed ~50%.
Figure 10.
Schematic of the variation of tan δ as a function of the damage ratio. The threshold value is placed ~50%.
Figure 11.
Multilayer structure of coaxial cables under investigation. (1) Conductor—Copper, (2) Primary insulation—XLPE, (3) Polymeric film—PET, (4) Shielding—Copper wire braid, (5) Sheath—Low smoke zero halogen rubber.
Figure 11.
Multilayer structure of coaxial cables under investigation. (1) Conductor—Copper, (2) Primary insulation—XLPE, (3) Polymeric film—PET, (4) Shielding—Copper wire braid, (5) Sheath—Low smoke zero halogen rubber.
Figure 12.
Results of specific capacitance for different damage ratios as a function of frequency.
Figure 12.
Results of specific capacitance for different damage ratios as a function of frequency.
Figure 13.
Tan δ values for different damage ratios as a function of frequency.
Figure 13.
Tan δ values for different damage ratios as a function of frequency.
Figure 14.
Tan δ values for different damage ratio for three fixed frequencies 50 kHz (green), 100 kHz (red), 150 kHz (black). (a) absolute values of tan δ, (b) tan δ percentage variation.
Figure 14.
Tan δ values for different damage ratio for three fixed frequencies 50 kHz (green), 100 kHz (red), 150 kHz (black). (a) absolute values of tan δ, (b) tan δ percentage variation.
Figure 15.
Zc profile for the locally aged coaxial sample (after [
45]). Yellow area represents aged sections of the analyzed cable.
Figure 15.
Zc profile for the locally aged coaxial sample (after [
45]). Yellow area represents aged sections of the analyzed cable.
Table 1.
Accelerated aging conditions.
Table 1.
Accelerated aging conditions.
| Aging Type | Dose Rate (Gy/h) | Withdrawal Time (h) | Total Absorbed Dose (kGy) | Temperature (°C) |
|---|
| Low dose rate | 7 | 3456 | 48 | 47 |
| Medium dose rate | 66 | 864 | 286 | 47 |
| High dose rate | 400 | 167 | 334 | 21 |
| Combined aging | 7 | 3456 | 48 | 87 |
Table 2.
Sample specifications.
Table 2.
Sample specifications.
| Unaged Length (m) | Aged Length (m) | Damage Ratio (DR) |
|---|
| 0 | 10 | 100% |
| 3.3 | 10 | 87% |
| 5 | 10 | 66% |
| 7 | 10 | 59% |
| 10 | 10 | 50% |
| 3.3 | 2 | 37% |
| 3.3 | 1.5 | 31% |
| 3.3 | 1 | 23% |
| 3.3 | 0.33 | 10% |
| 10 | 0 | 0% |
| Publisher’s Note: MDPI stays neutral with regard to jurisdictional claims in published maps and institutional affiliations. |
© 2022 by the authors. Licensee MDPI, Basel, Switzerland. This article is an open access article distributed under the terms and conditions of the Creative Commons Attribution (CC BY) license (https://creativecommons.org/licenses/by/4.0/).


