Author Contributions
Conceptualization, Q.C.H. and J.R.H.; methodology, Q.C.H., J.R.H. and S.B.M.; software, J.R.H.; validation, J.R.H. and B.H.; formal analysis, J.R.H.; investigation, J.R.H., B.H. and S.B.M.; resources, J.R.H.; data curation, J.R.H.; writing—original draft preparation, J.R.H.; writing—review and editing: B.H., S.B.M. and Q.C.H.; visualization, J.R.H.; supervision, Q.C.H.; project administration, J.R.H.; funding acquisition Q.C.H. and J.R.H. All authors have read and agreed to the published version of the manuscript.
Appendix A
DC internal resistance (DCIR) values in this article are derived from the voltage recovery that occurs during the first 60 s of each rest during the DCIR discharge cycle. The DCIR is calculated using the following formula:
where
is the final voltage measured prior to the start of the rest,
is the voltage measured 60 s after the start of the rest, and
is the discharge current (0.5C). This value was calculated for each DCIR rest pulse (every 10% of the SOC) during each DCIR cycle for all cells.
Appendix B
Differential capacity (dQ/dV) was calculated using the following algorithm:
Group the measurements sequentially, such that all points within each group have a voltage close to one another (where closeness is an adjustable parameter).
For each group, calculate the mean voltage and capacity.
Then, calculate the change in voltage and capacity between each group in order.
The differential capacity is calculated by dividing the change in capacity by the change in voltage for each group.
The closeness parameter was tuned to be as small as possible while minimizing sign reversals at voltage plateaus (which occur when random fluctuations in the voltage exceed the closeness threshold). A closeness limit of 3 mV was found to be optimal, which is close to the voltage accuracy of the battery cyclers (2 mV).
Appendix C
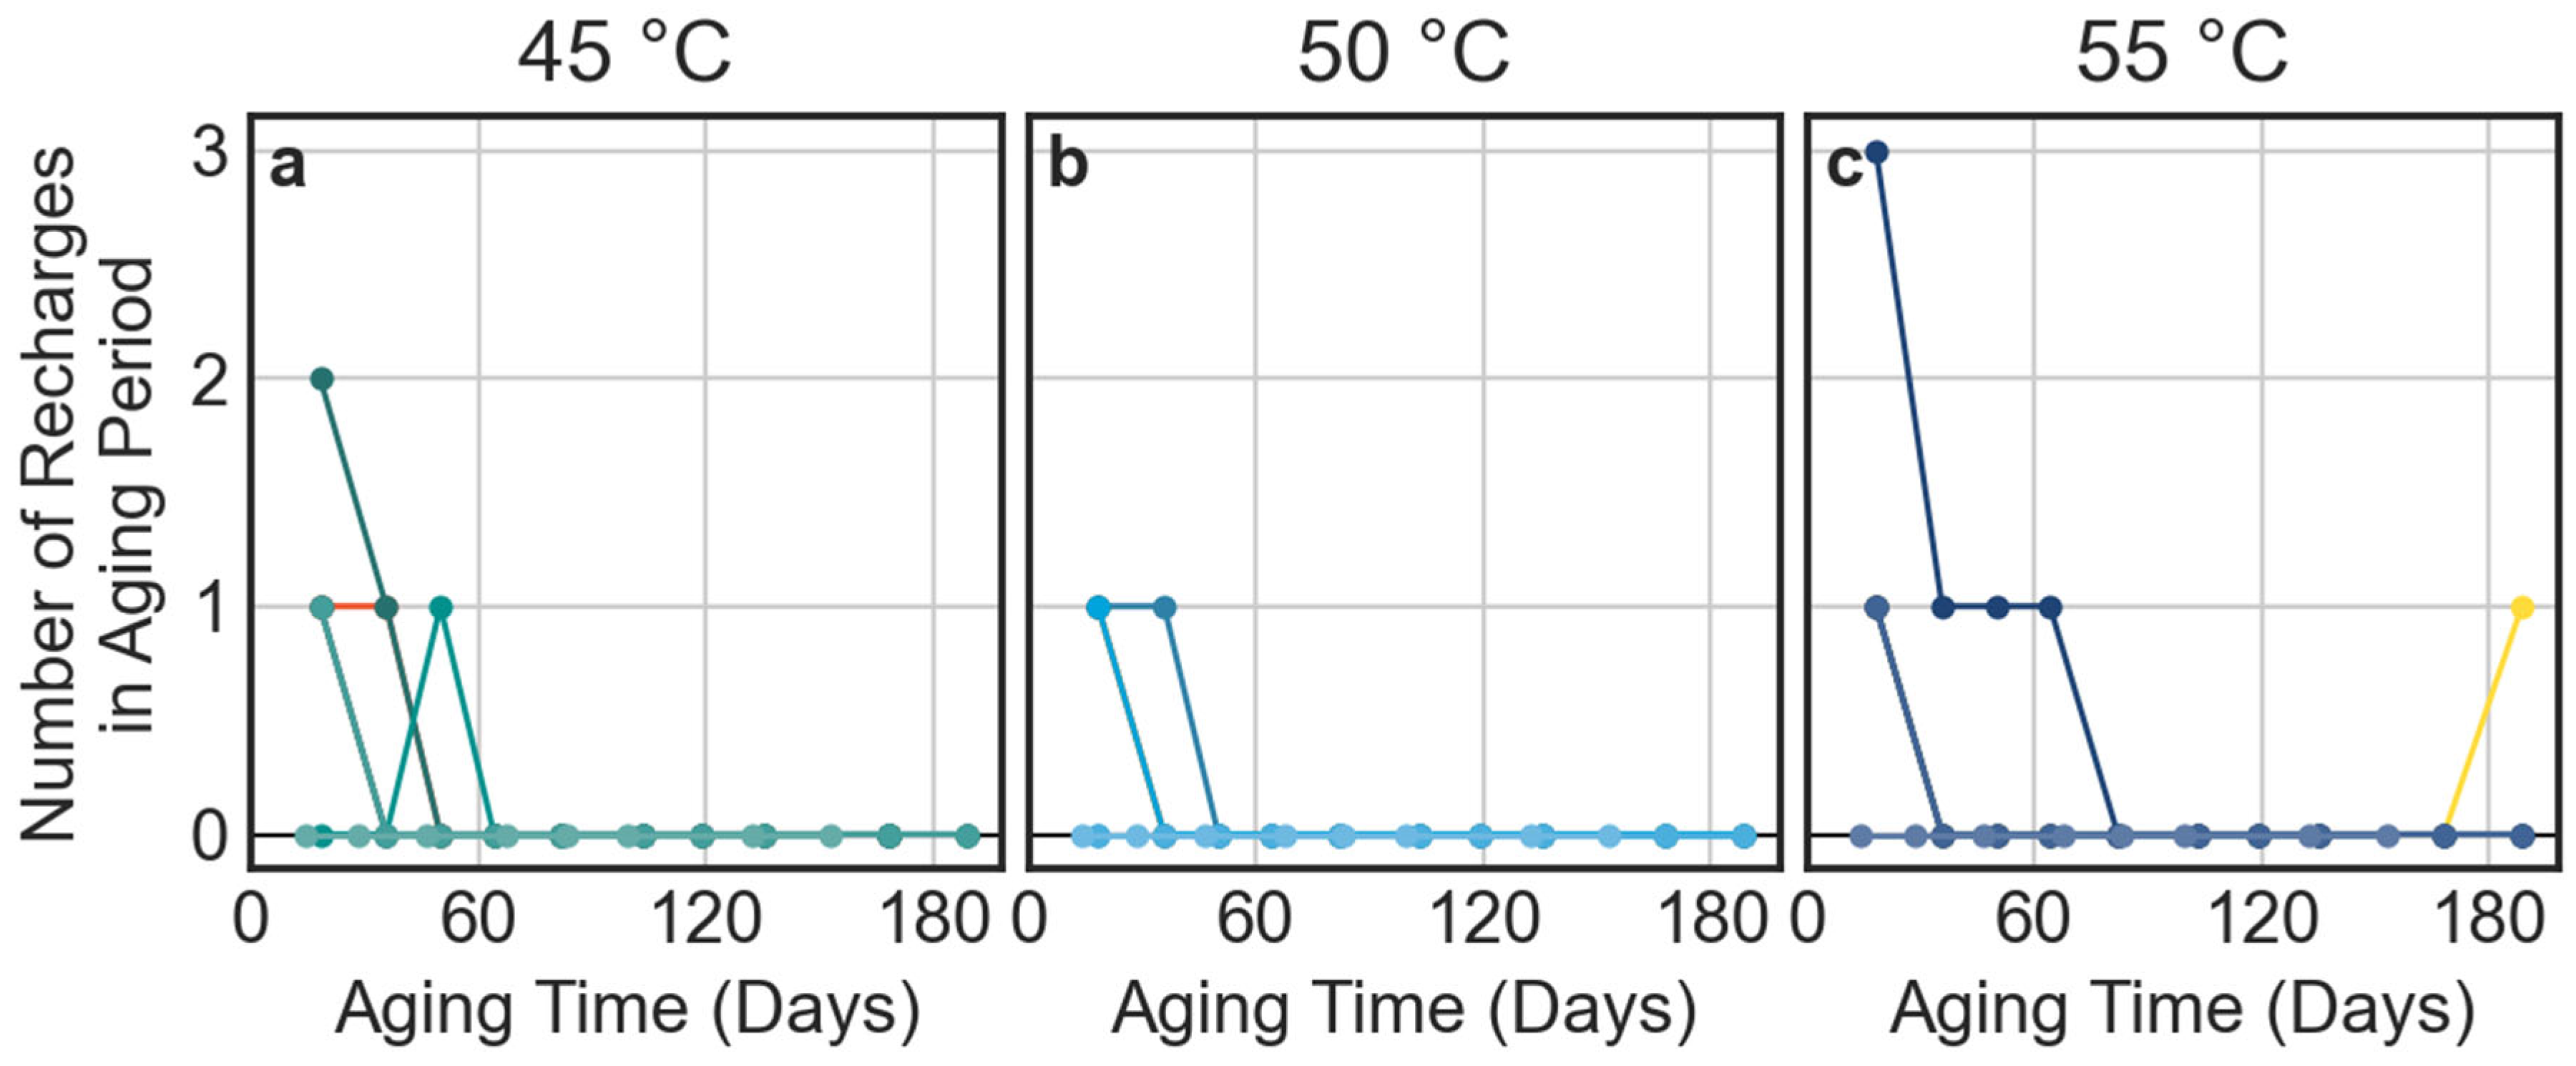
The number of recharges that occurred during aging between the characterization timepoints is shown in
Figure A1. Most aging periods were approximately 14 days long.
Figure A1.
The number of recharges that occurred during each aging period.
Figure A1.
The number of recharges that occurred during each aging period.
Appendix D
Equation (1) can be linearized by taking the natural log of both sides, which is shown here as Equation (A2):
In this form, is linear with respect to and , and can be solved using an ordinary least squares (OLS) solver. While this produces a useful analytical relationship, fitting directly to Equation (A2) requires the rejecting of all data where is nonpositive, and this formula increases the weight of very small values of . Therefore, the final fit optimization is performed using a nonlinear minimizer on the exponential form of Equation (1).
The algorithm used to calculate the best fit for the parameters is as follows:
Collect all aging measurements (at all temperatures) for a given cell type; remove any rejected data points.
Calculate for each measurement.
Calculate the preliminary values of , , and , using Equation (2) and an OLS solver with reasonable bounds (stated below), for all three parameters
Calculate the final values of , , and using Equation (1) and an initial guess taken from the solution found in step 2.
For this analysis, the following boundaries were used: , and . For and , these boundaries are significantly wider than the expected range of reasonable outcomes; solutions found near the extremes of the boundaries were interpreted to indicate a poor-quality prediction. The boundaries for C were chosen to prevent numerical errors during the evaluation of Equation (1).
Bootstrapping was used to estimate the confidence interval of each of the parameters. For each fit, 10,000 iterations of steps (3) and (4) above were repeated on random samples. The percentile method was used to estimate the confidence intervals for each parameter, as it has been reported that this is more accurate when including the underlying statistic than alternative methods [
25].
Predictions were made by taking the fitted parameters and entering them into Equation (1), along with the desired time and temperature of the prediction. Confidence intervals were estimated by evaluating each of the bootstrapped solutions at the given time/temperature. The percentile method was then used to estimate the upper and lower boundaries on the confidence interval for each unique time/temperature combination.
Appendix E
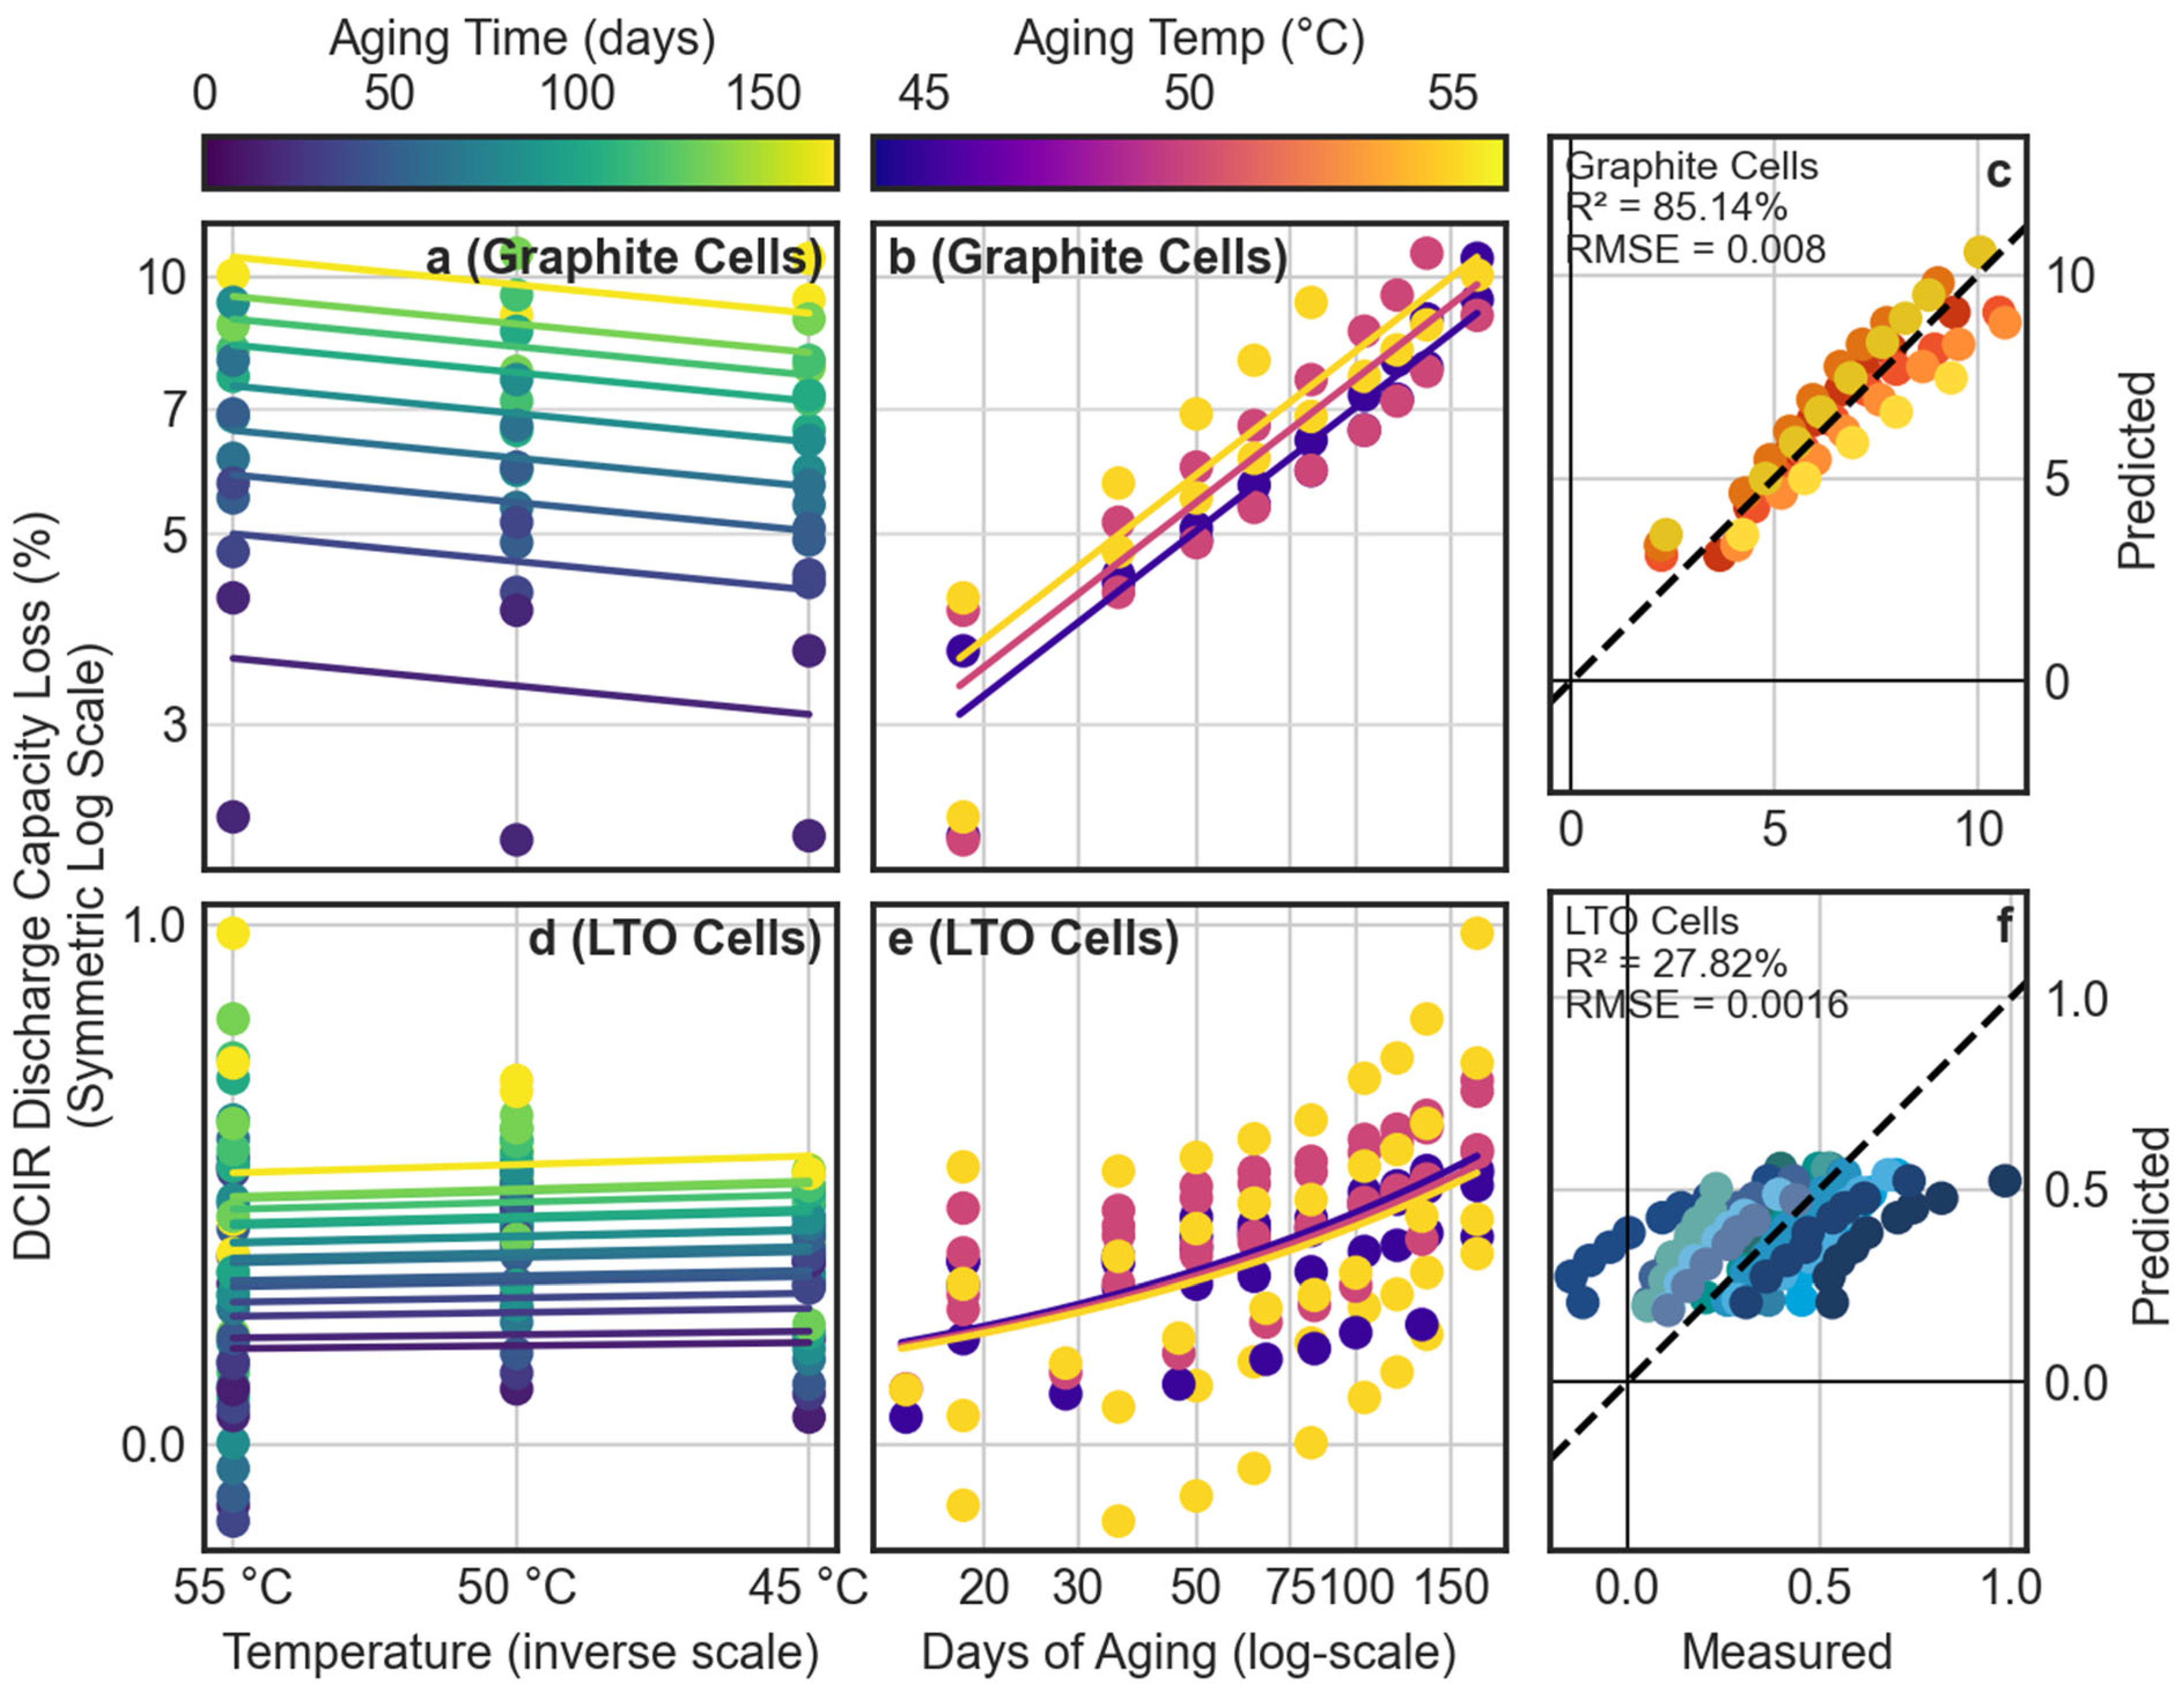
The quality-of-fit metrics for the DCIR discharge capacity are presented in
Figure A2. All panels have the same meaning as those described in
Figure 12.
Figure A2.
Quality of fit metrics for the modified Arrhenius fit of the DCIR cycle discharge capacity. Upper plots (a–c): the graphite cells. Lower plots (d–f): the LTO cells. Left column (a,d): capacity loss (symmetric log scale) vs. aging temperature (plotted on an inverse absolute temperature scale), with colors indicating aging time. Middle column (b,e): capacity loss vs. aging time, with colors indicating the aging temperature. Points indicate the measured data, lines reflect the best fit for the model. Right column (c,f): predicted vs. actual figures. Colors reflect individual cells; the 45° line indicates a perfect agreement between the model and the data.
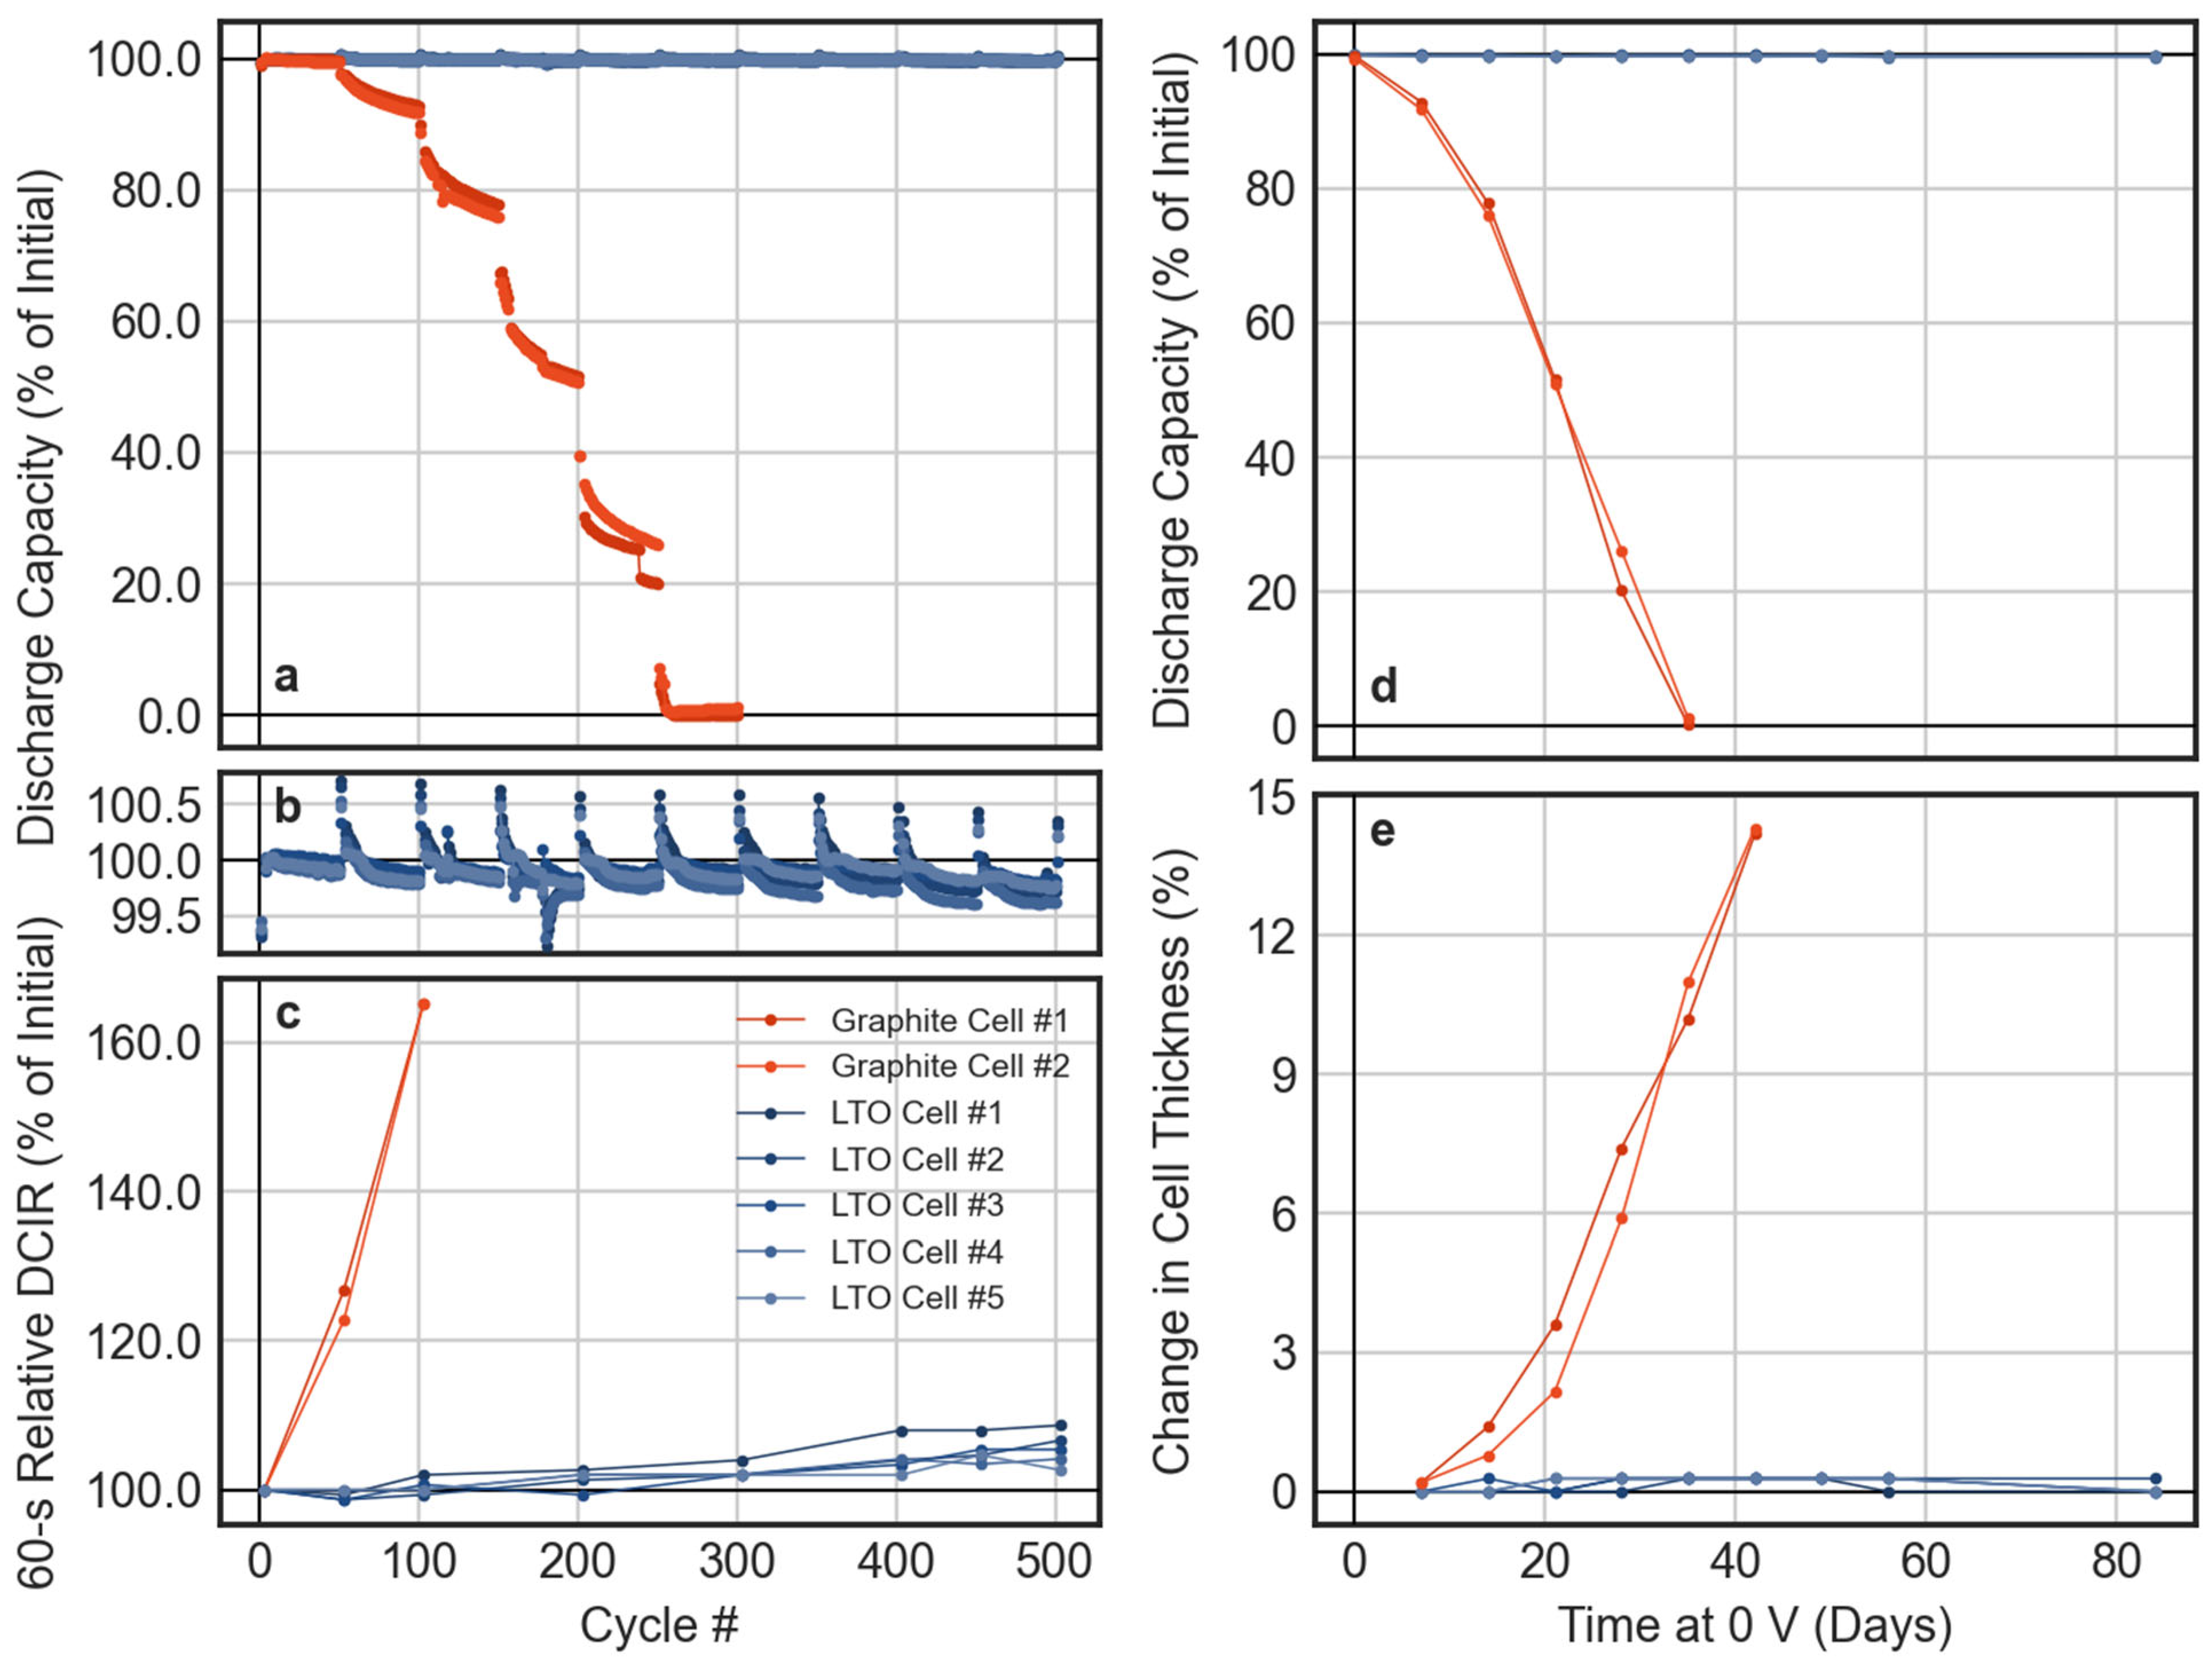
Figure 1.
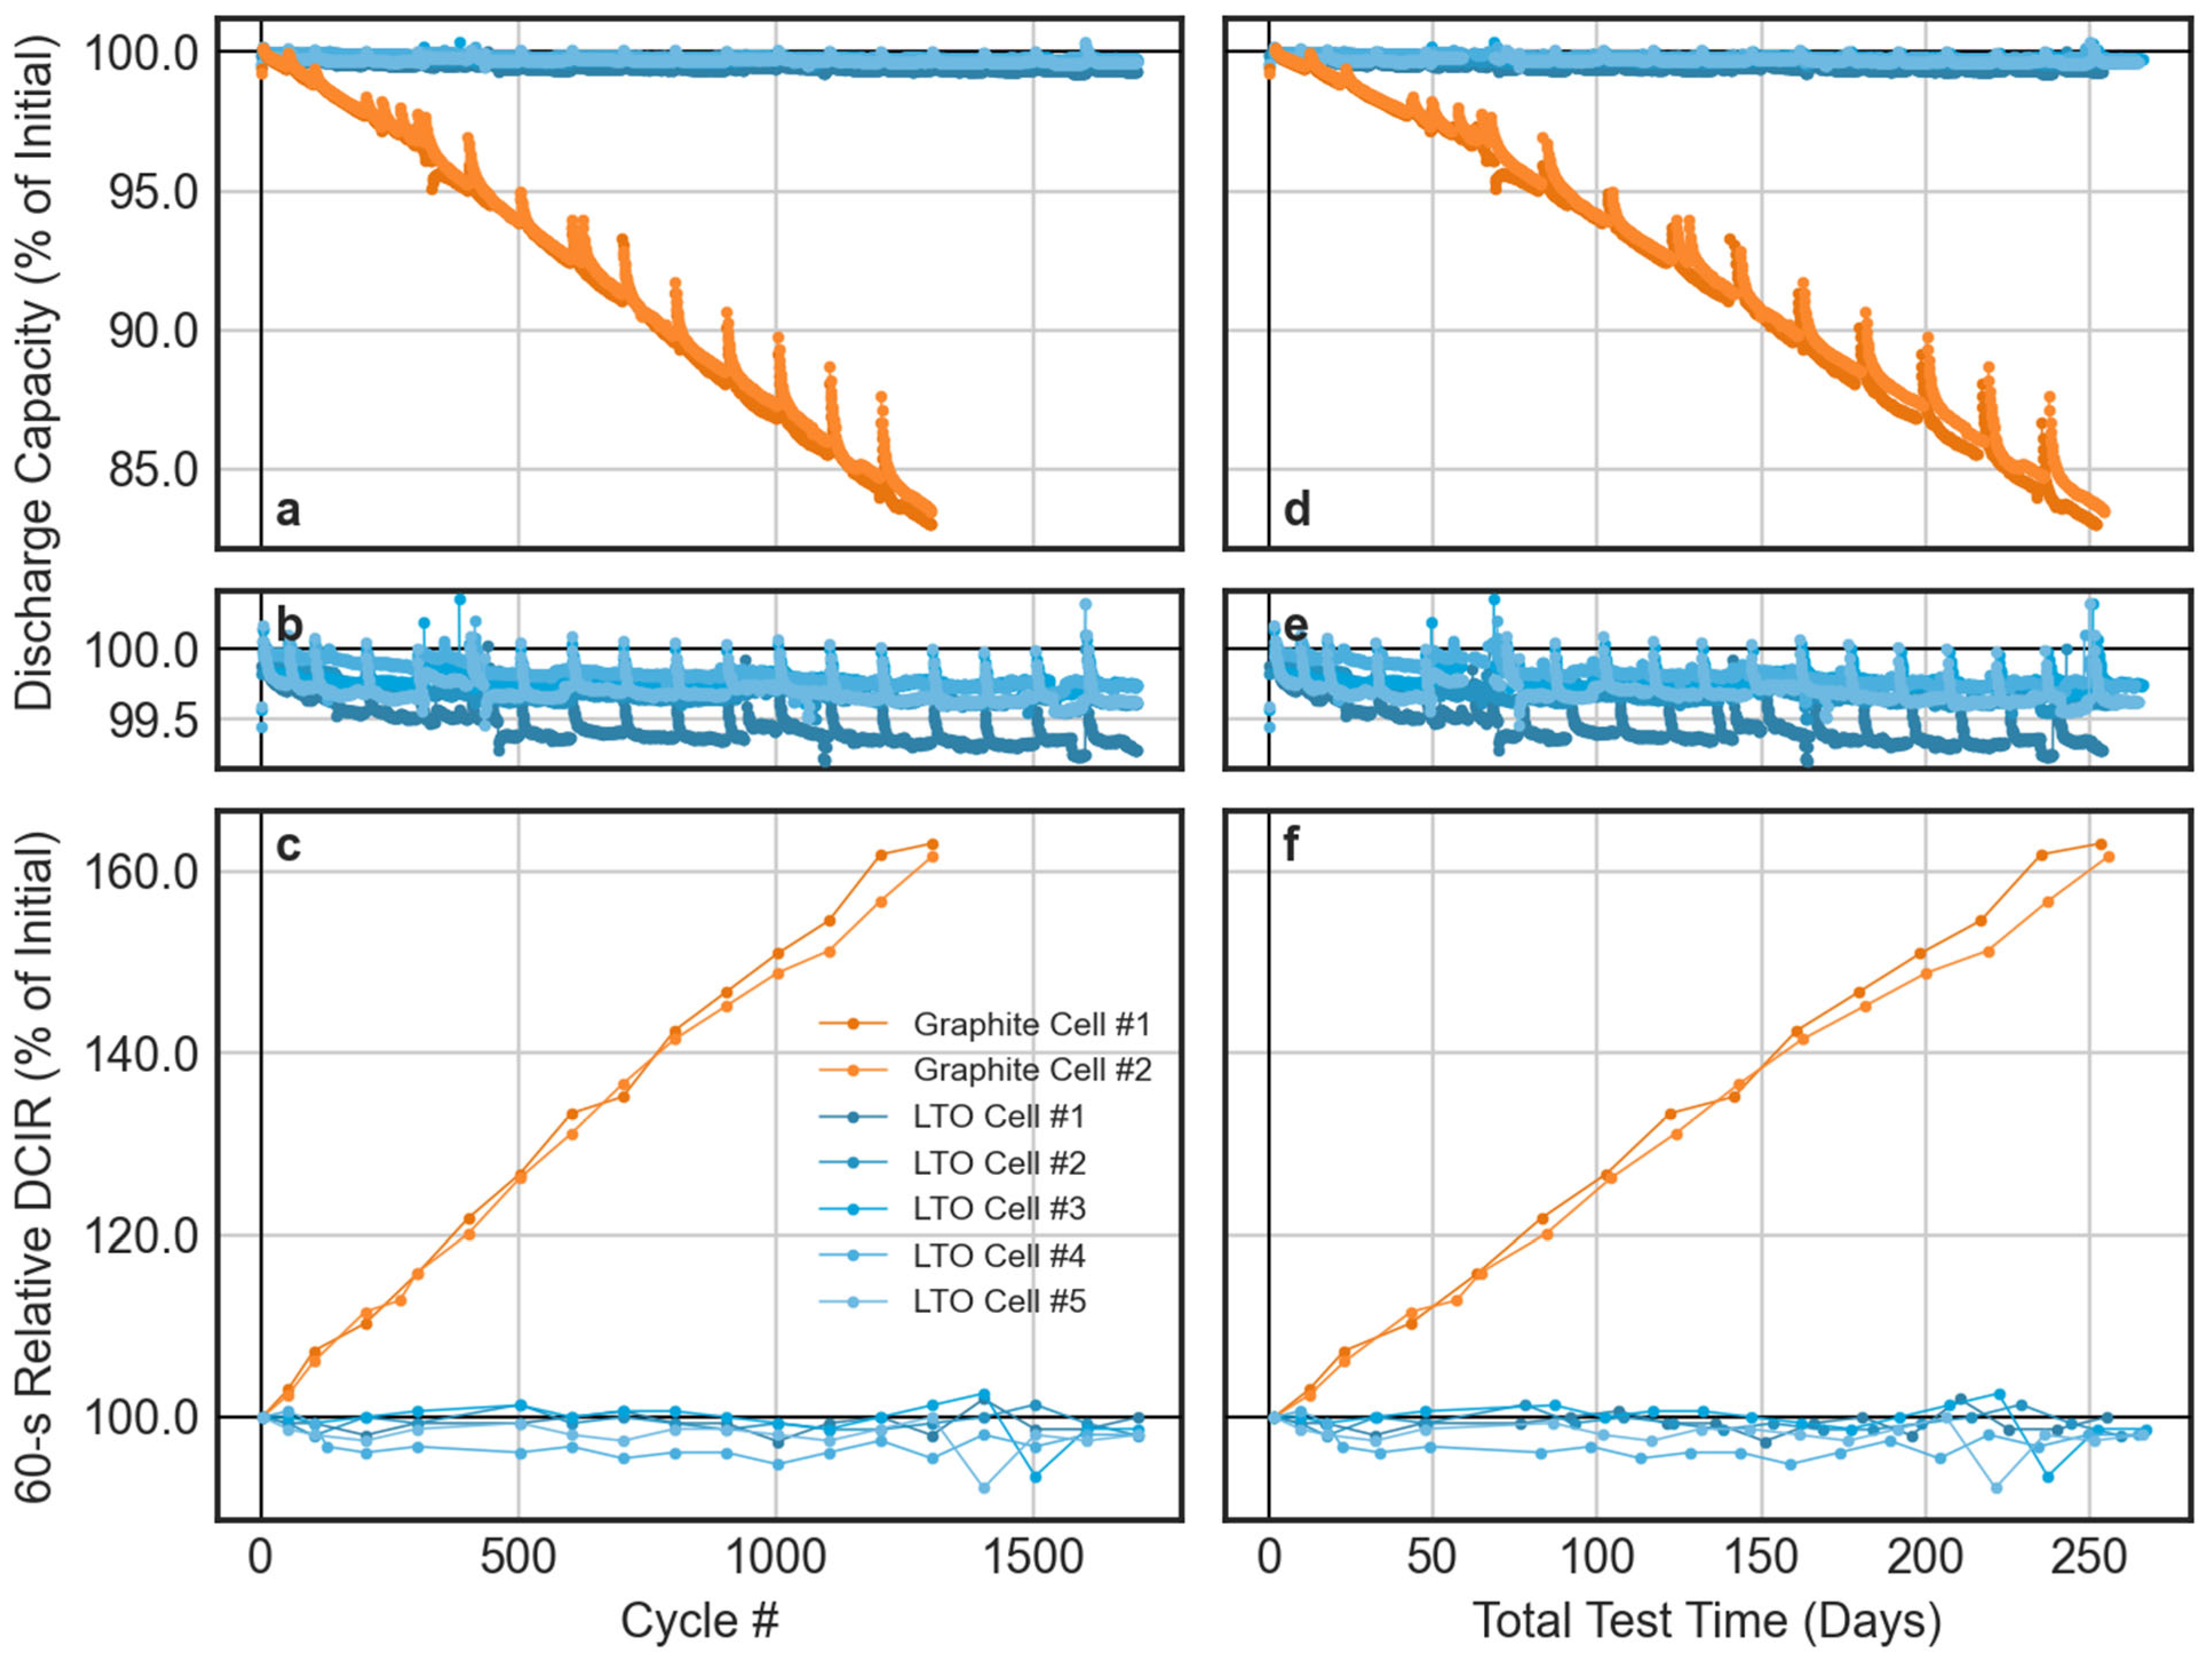
The left-hand column shows the standard cycle discharge capacity (a,b) and DC internal resistance (DCIR) at 50% depth-of-discharge (DoD) (c), vs. the number of cycles for baseline cells. The right-hand column (d–f) shows the same metrics presented against total active testing time. All cycles were performed at 37 ± 1 °C. Orange colors indicate graphite cells; blue colors indicate lithium titanium oxide (LTO) cells.
Figure 1.
The left-hand column shows the standard cycle discharge capacity (a,b) and DC internal resistance (DCIR) at 50% depth-of-discharge (DoD) (c), vs. the number of cycles for baseline cells. The right-hand column (d–f) shows the same metrics presented against total active testing time. All cycles were performed at 37 ± 1 °C. Orange colors indicate graphite cells; blue colors indicate lithium titanium oxide (LTO) cells.
Figure 2.
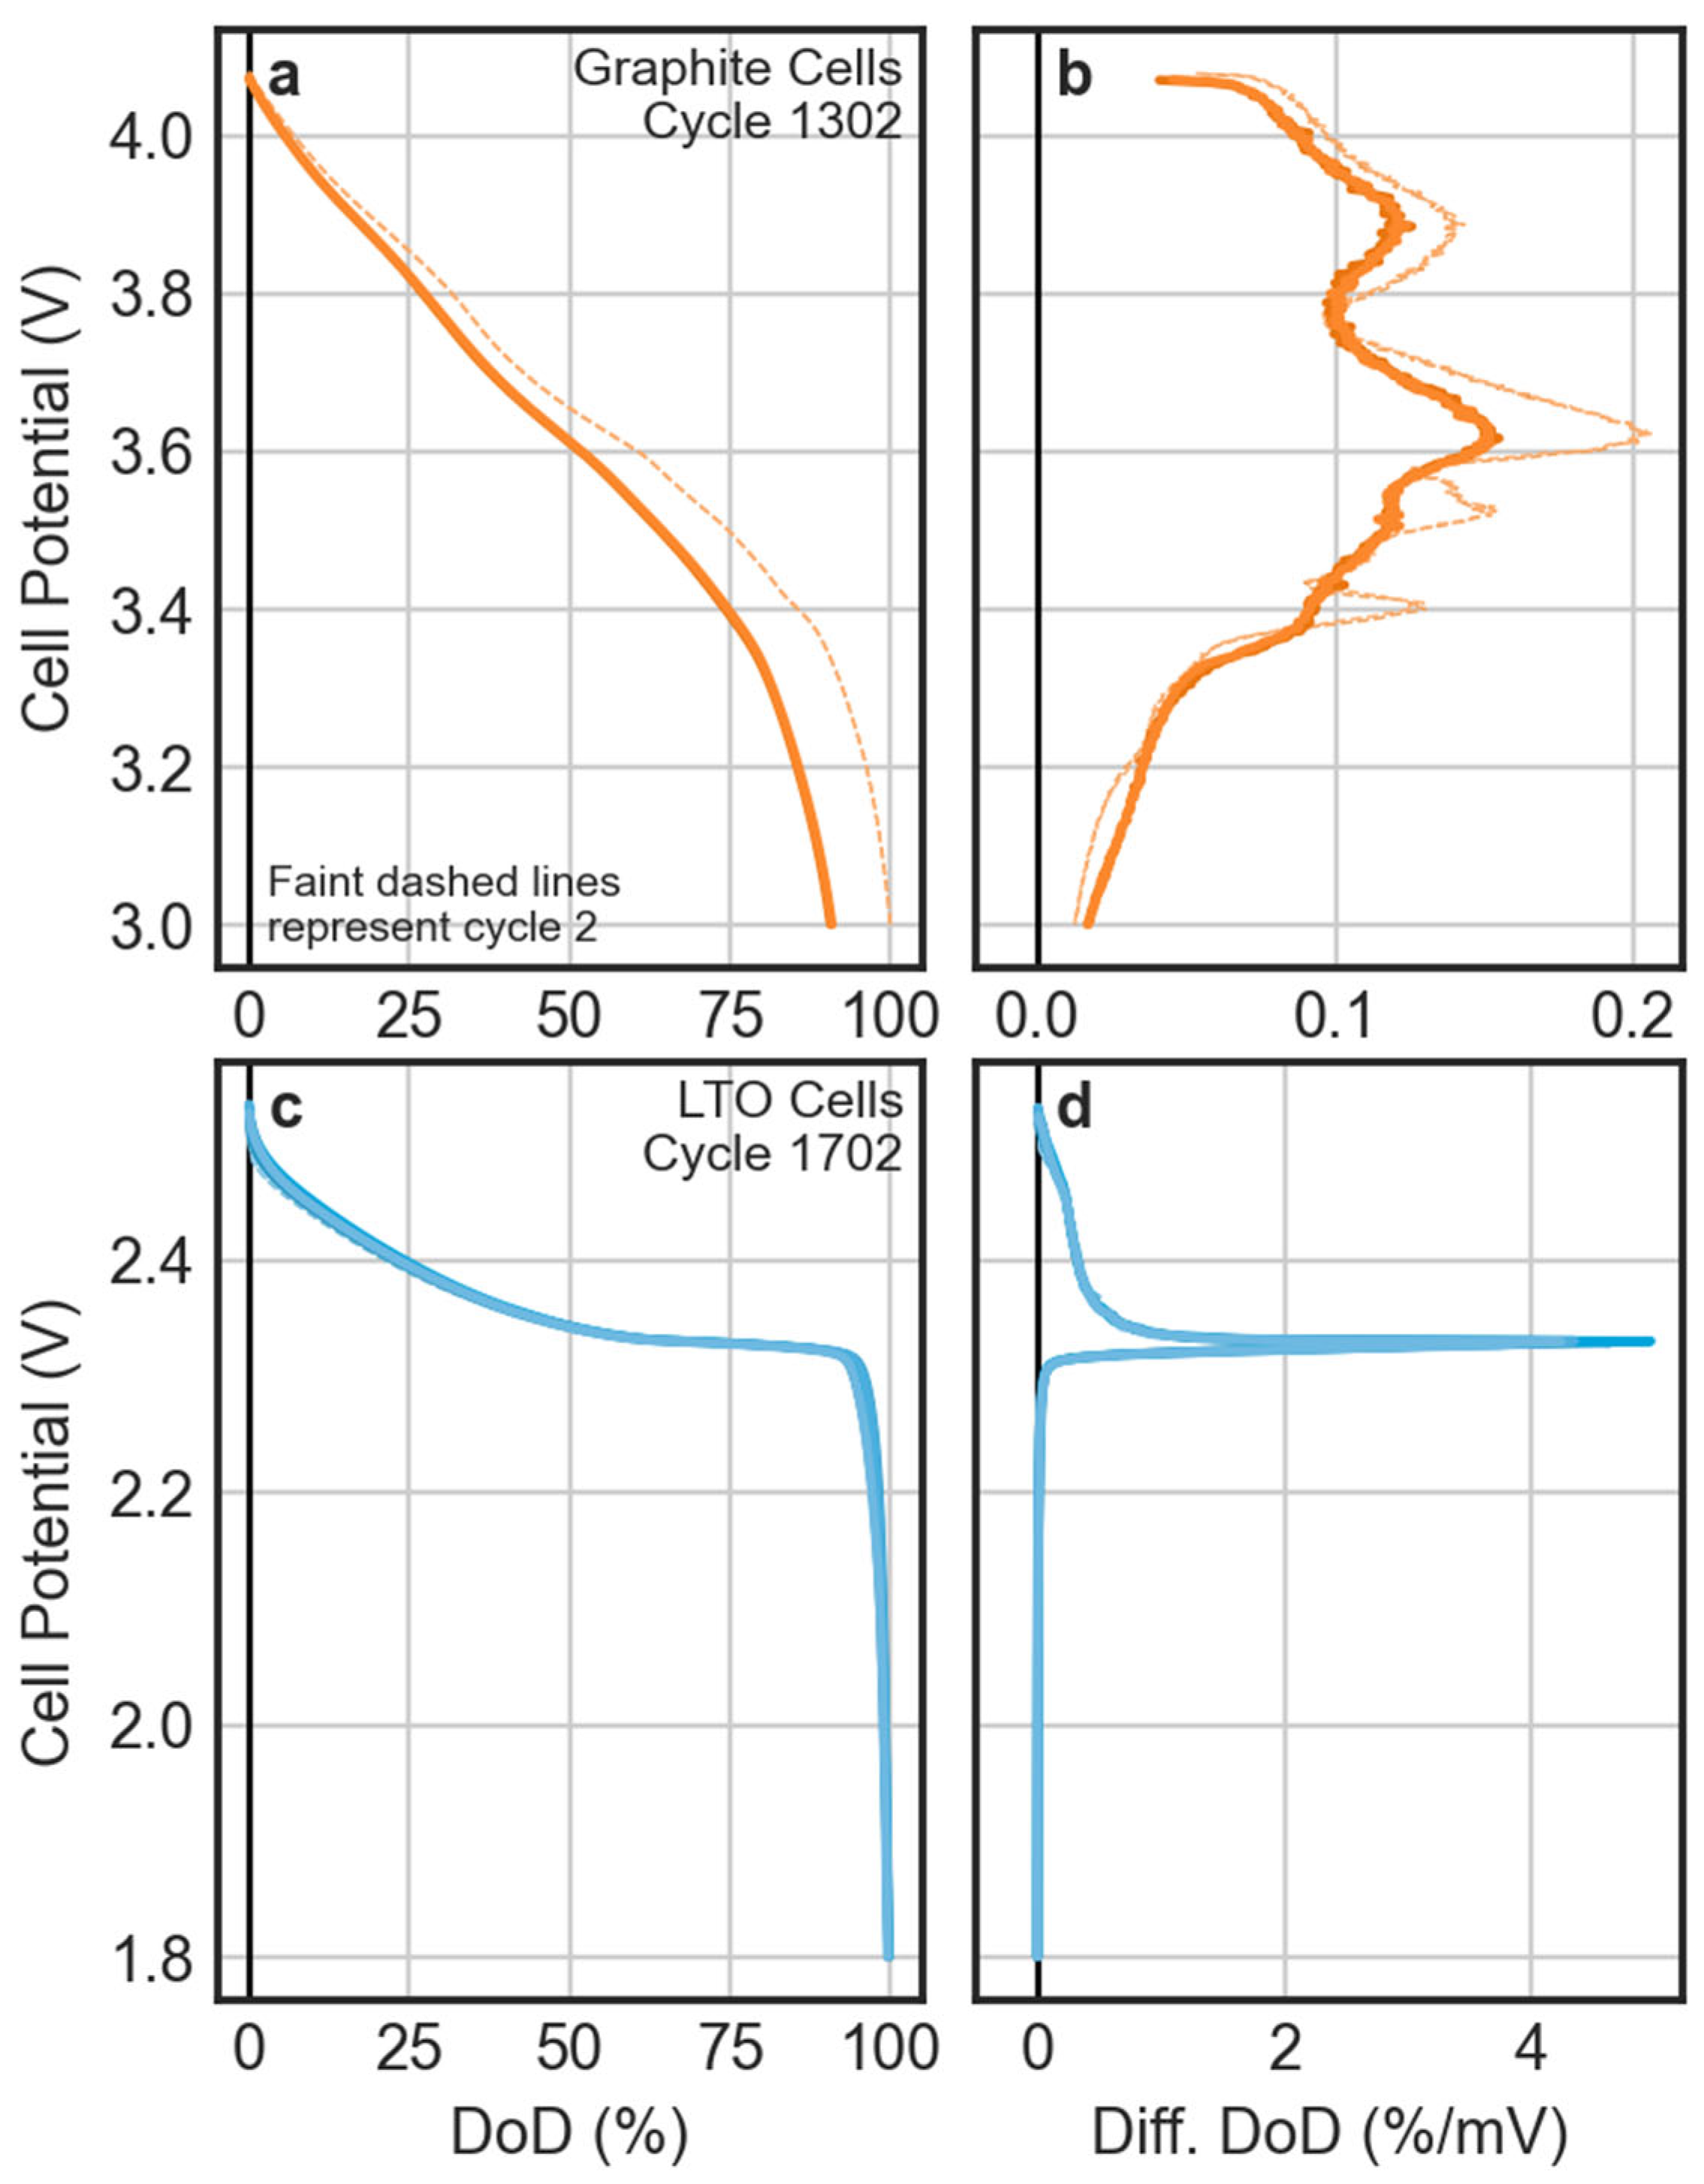
Cell potential vs. depth-of-discharge (DoD; (a,c)) and differential DoD (b,d) for the graphite (a,b) and lithium titanium oxide (LTO) (c,d) cells, during selected C/24 discharges. DoDs are normalized to the initial C/24 discharge capacity for each cell. The differential capacity plots include faint dashed lines that show the initial cycle performance. These are covered by other lines on the LTO differential capacity plot.
Figure 2.
Cell potential vs. depth-of-discharge (DoD; (a,c)) and differential DoD (b,d) for the graphite (a,b) and lithium titanium oxide (LTO) (c,d) cells, during selected C/24 discharges. DoDs are normalized to the initial C/24 discharge capacity for each cell. The differential capacity plots include faint dashed lines that show the initial cycle performance. These are covered by other lines on the LTO differential capacity plot.
Figure 3.
Overdischarge cycling performance data. The left-hand column shows the standard cycle discharge capacity (a,b) and DCIR @ 50% SOC (c) vs. the number of cycles for overdischarged cells. Right-hand column: (d) the final discharge capacity prior to each overdischarge and (e) DCIR @ 50% SOC vs. total time spent at 0 V.
Figure 4.
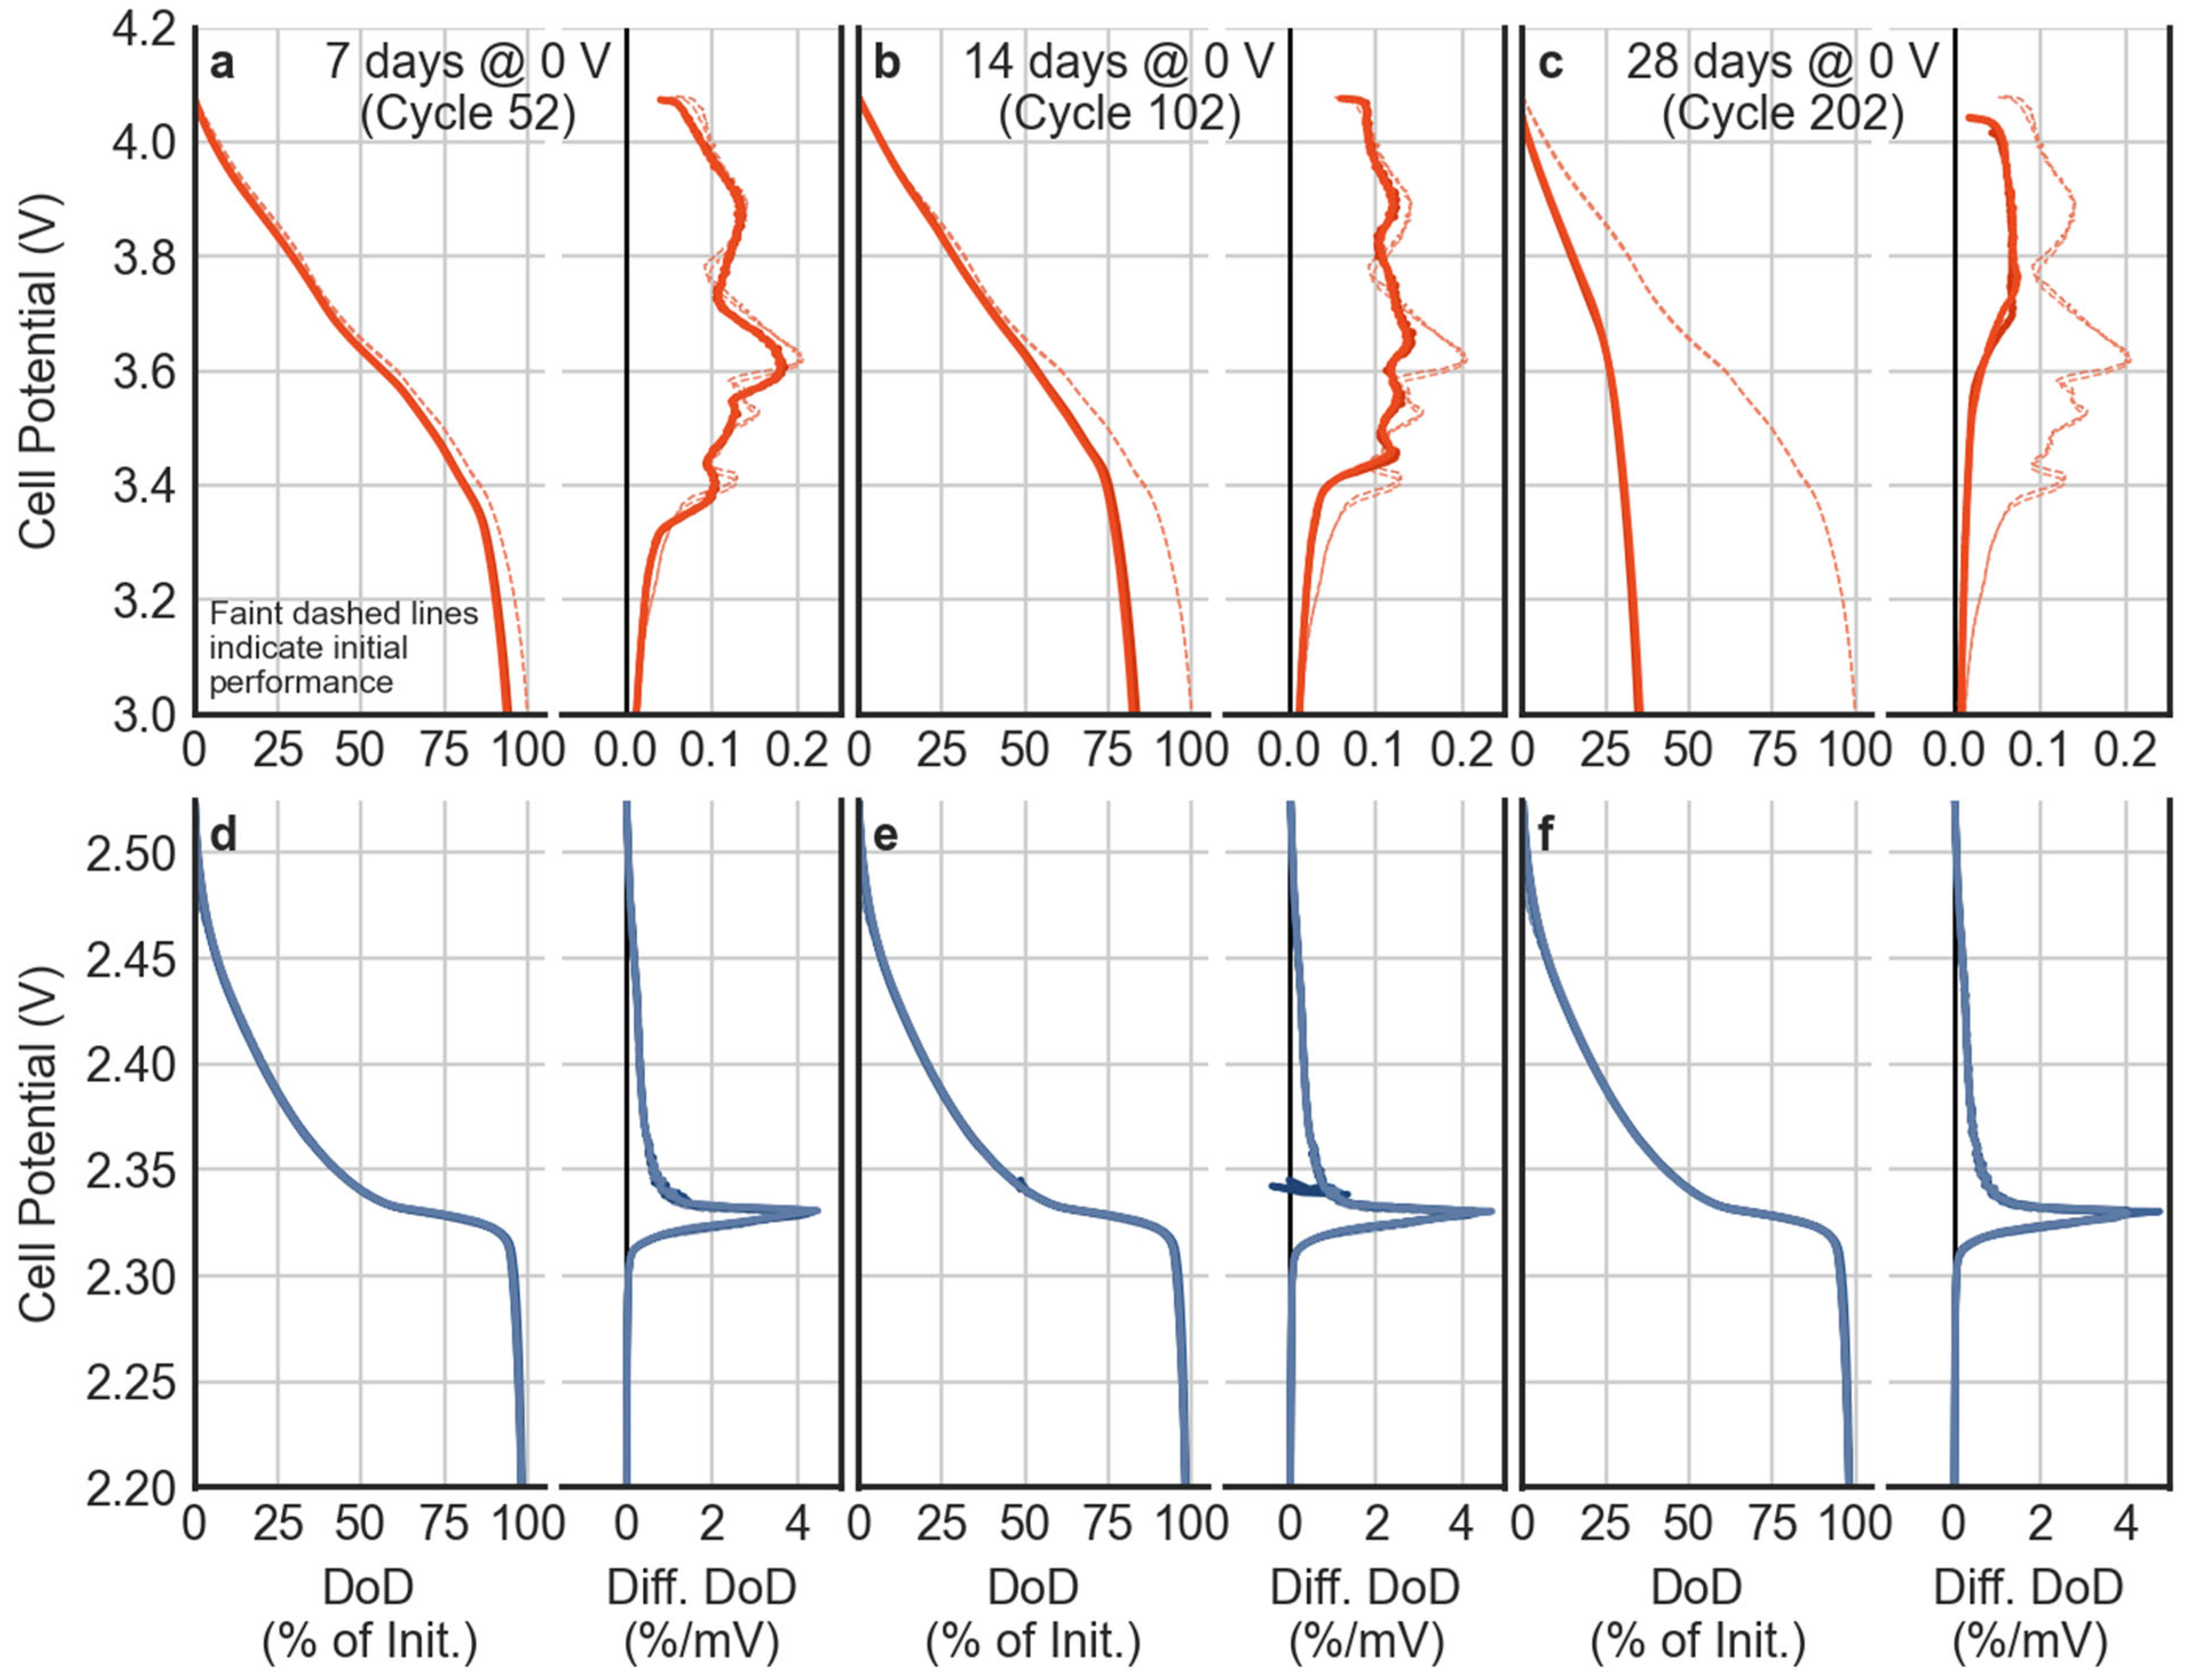
Differential capacity plots for selected C/24 discharge cycles, following different overdischarge regimes. Faint dashed lines represent the initial C/24 discharge performance for each cell. Top row (a–c): graphite cells. Bottom row (d–f): LTO cells. Left column (a,d): performance after 7 days at 0 V. Middle column (b,e): performance after 14 days at 0 V. Right column (c,f): performance after 28 days at 0 V. Each column shows the cell potential vs. DoD(left) and differential DoD (right). DoDs are normalized to the initial C/24 discharge capacity for each cell. LTO voltage data below 2.2 V is not shown. Plots include faint dashed lines, which show the performance during cycle 2. These are covered by other lines for the LTO cells at all cycle counts.
Figure 4.
Differential capacity plots for selected C/24 discharge cycles, following different overdischarge regimes. Faint dashed lines represent the initial C/24 discharge performance for each cell. Top row (a–c): graphite cells. Bottom row (d–f): LTO cells. Left column (a,d): performance after 7 days at 0 V. Middle column (b,e): performance after 14 days at 0 V. Right column (c,f): performance after 28 days at 0 V. Each column shows the cell potential vs. DoD(left) and differential DoD (right). DoDs are normalized to the initial C/24 discharge capacity for each cell. LTO voltage data below 2.2 V is not shown. Plots include faint dashed lines, which show the performance during cycle 2. These are covered by other lines for the LTO cells at all cycle counts.
Figure 5.
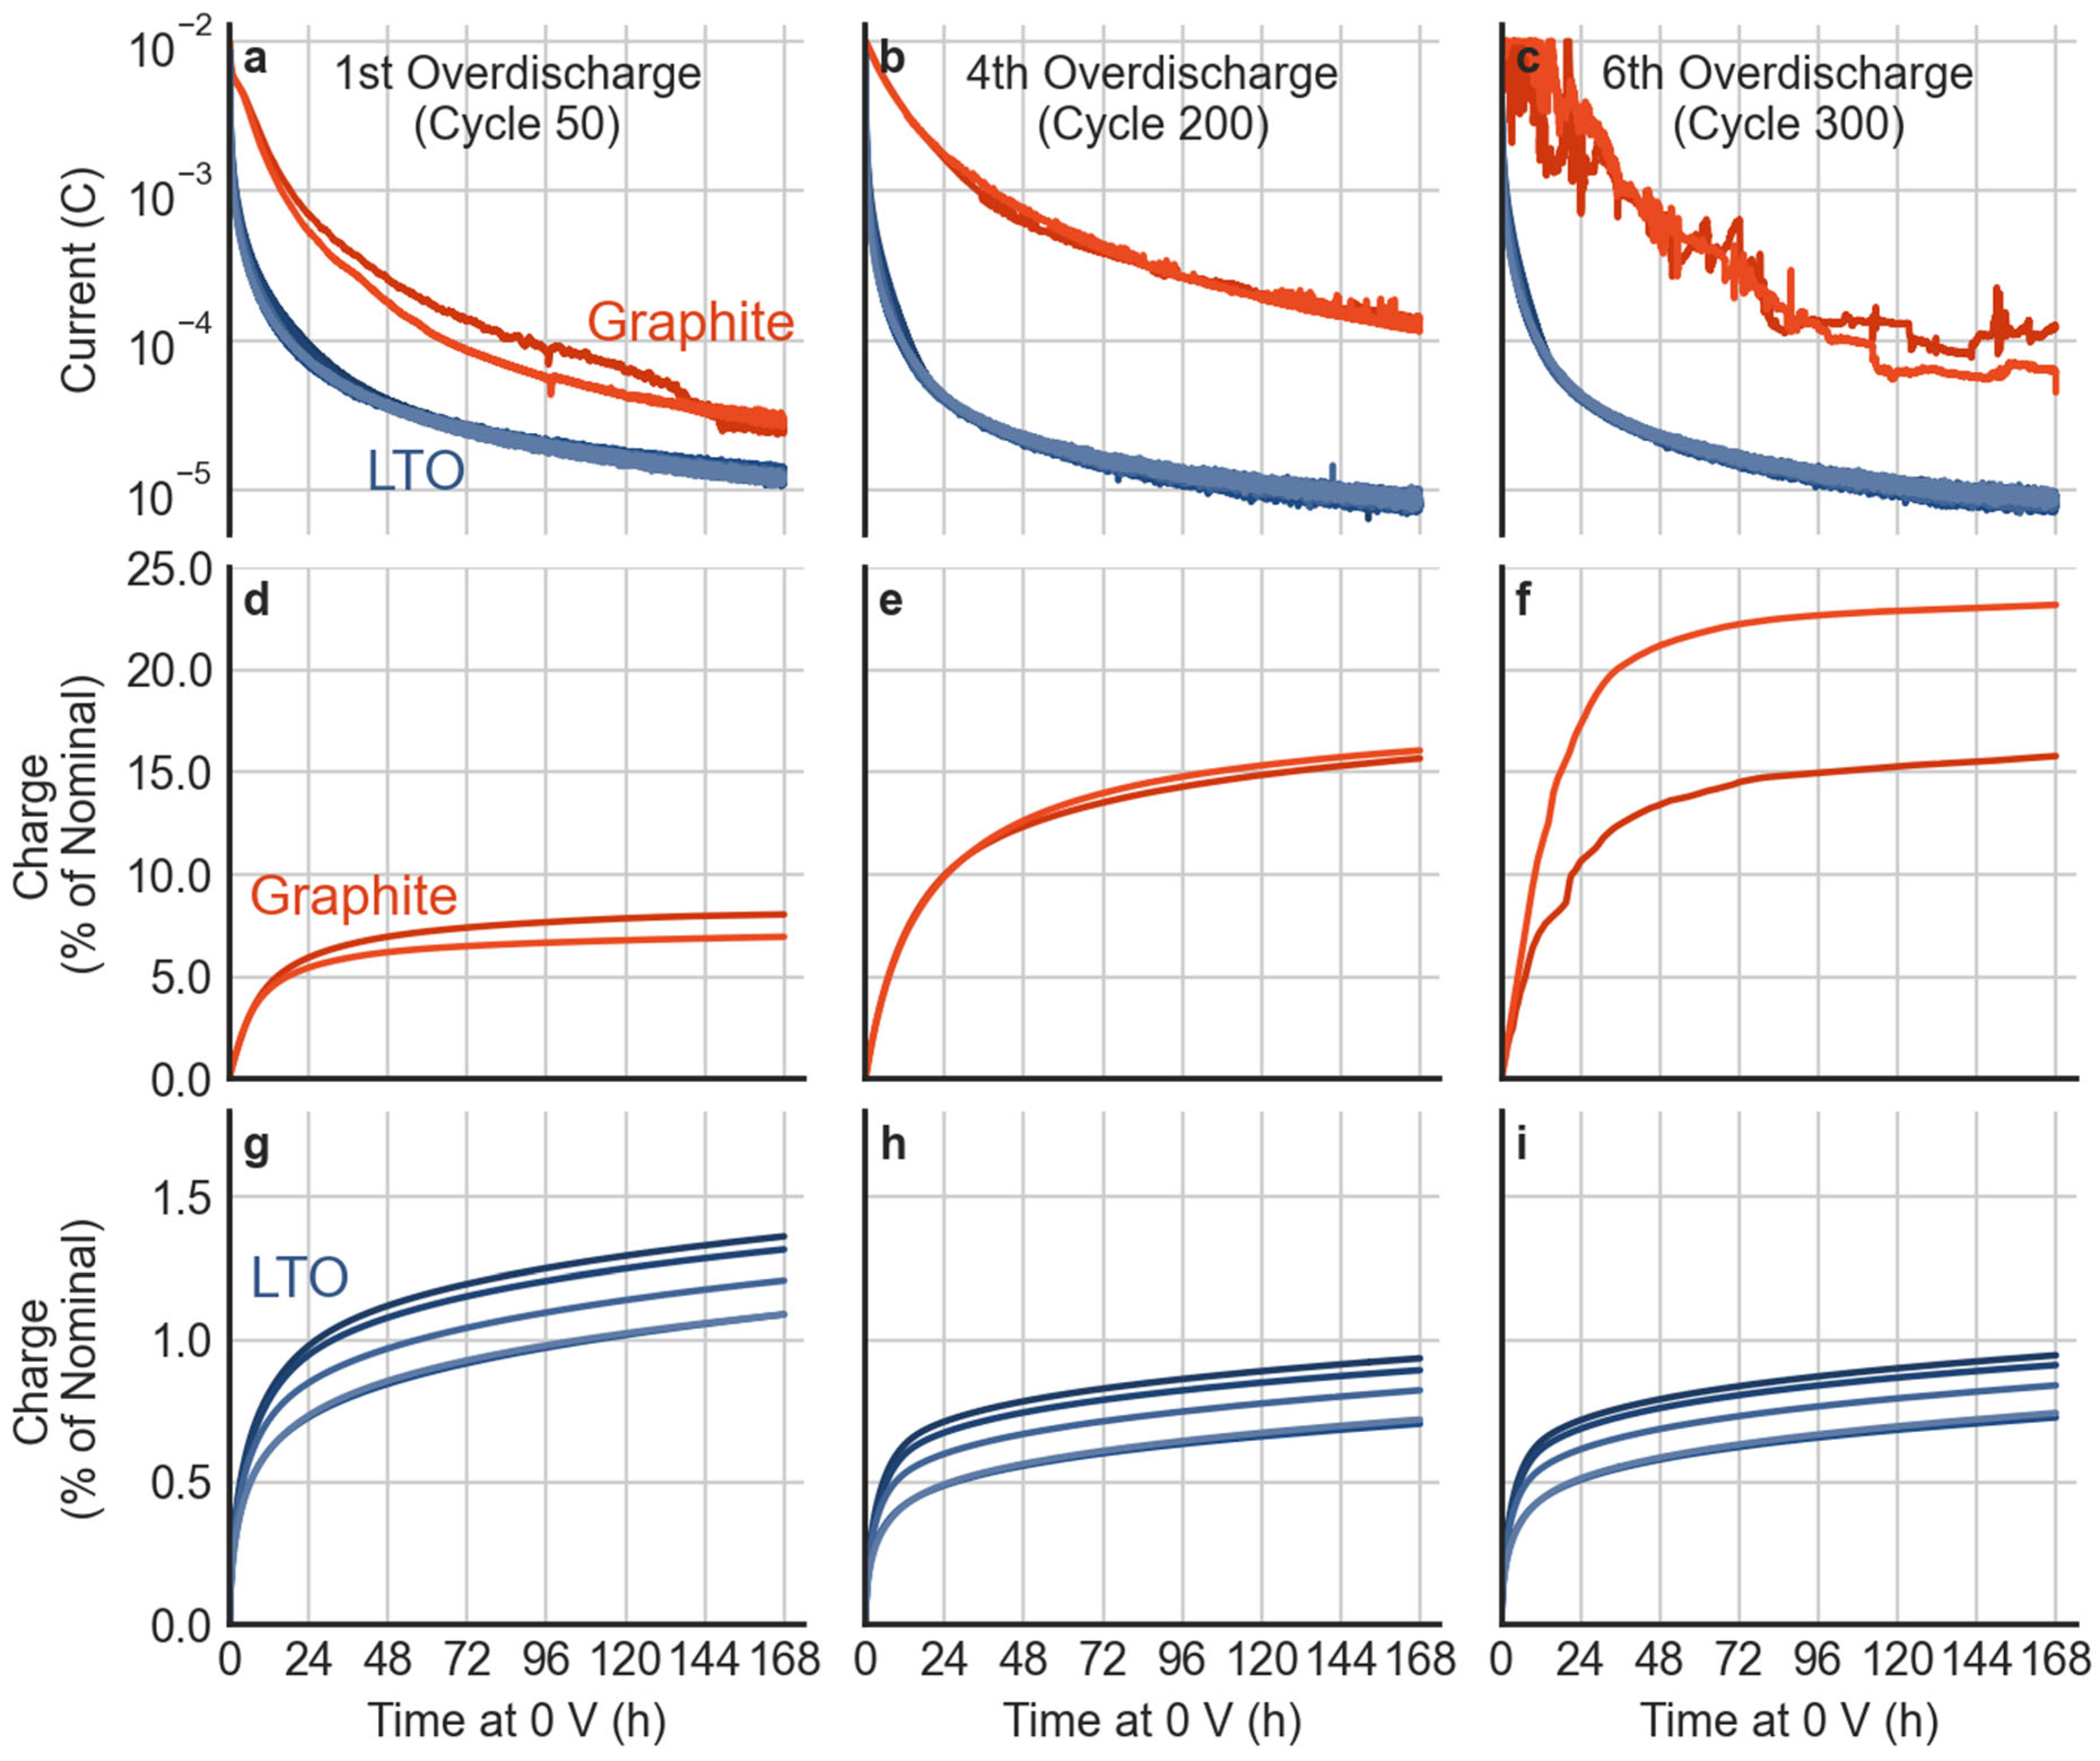
Current (a–c) and charge (d–i) vs. time for selected 0 V holds. The top row shows both graphite (red) and LTO (blue) cells. The charges passed for graphite (middle row) and LTO (bottom row) are presented separately. The left column (a,d,g) shows the first overdischarge. The middle column (b,e,h) shows the fourth overdischarge, and the right column (c,f,i) shows the sixth overdischarge.
Figure 5.
Current (a–c) and charge (d–i) vs. time for selected 0 V holds. The top row shows both graphite (red) and LTO (blue) cells. The charges passed for graphite (middle row) and LTO (bottom row) are presented separately. The left column (a,d,g) shows the first overdischarge. The middle column (b,e,h) shows the fourth overdischarge, and the right column (c,f,i) shows the sixth overdischarge.
Figure 6.
Total charge passed by each cell during each 7-day hold at 0 V. Graphite (a) and LTO (b) cells are presented separately.
Figure 6.
Total charge passed by each cell during each 7-day hold at 0 V. Graphite (a) and LTO (b) cells are presented separately.
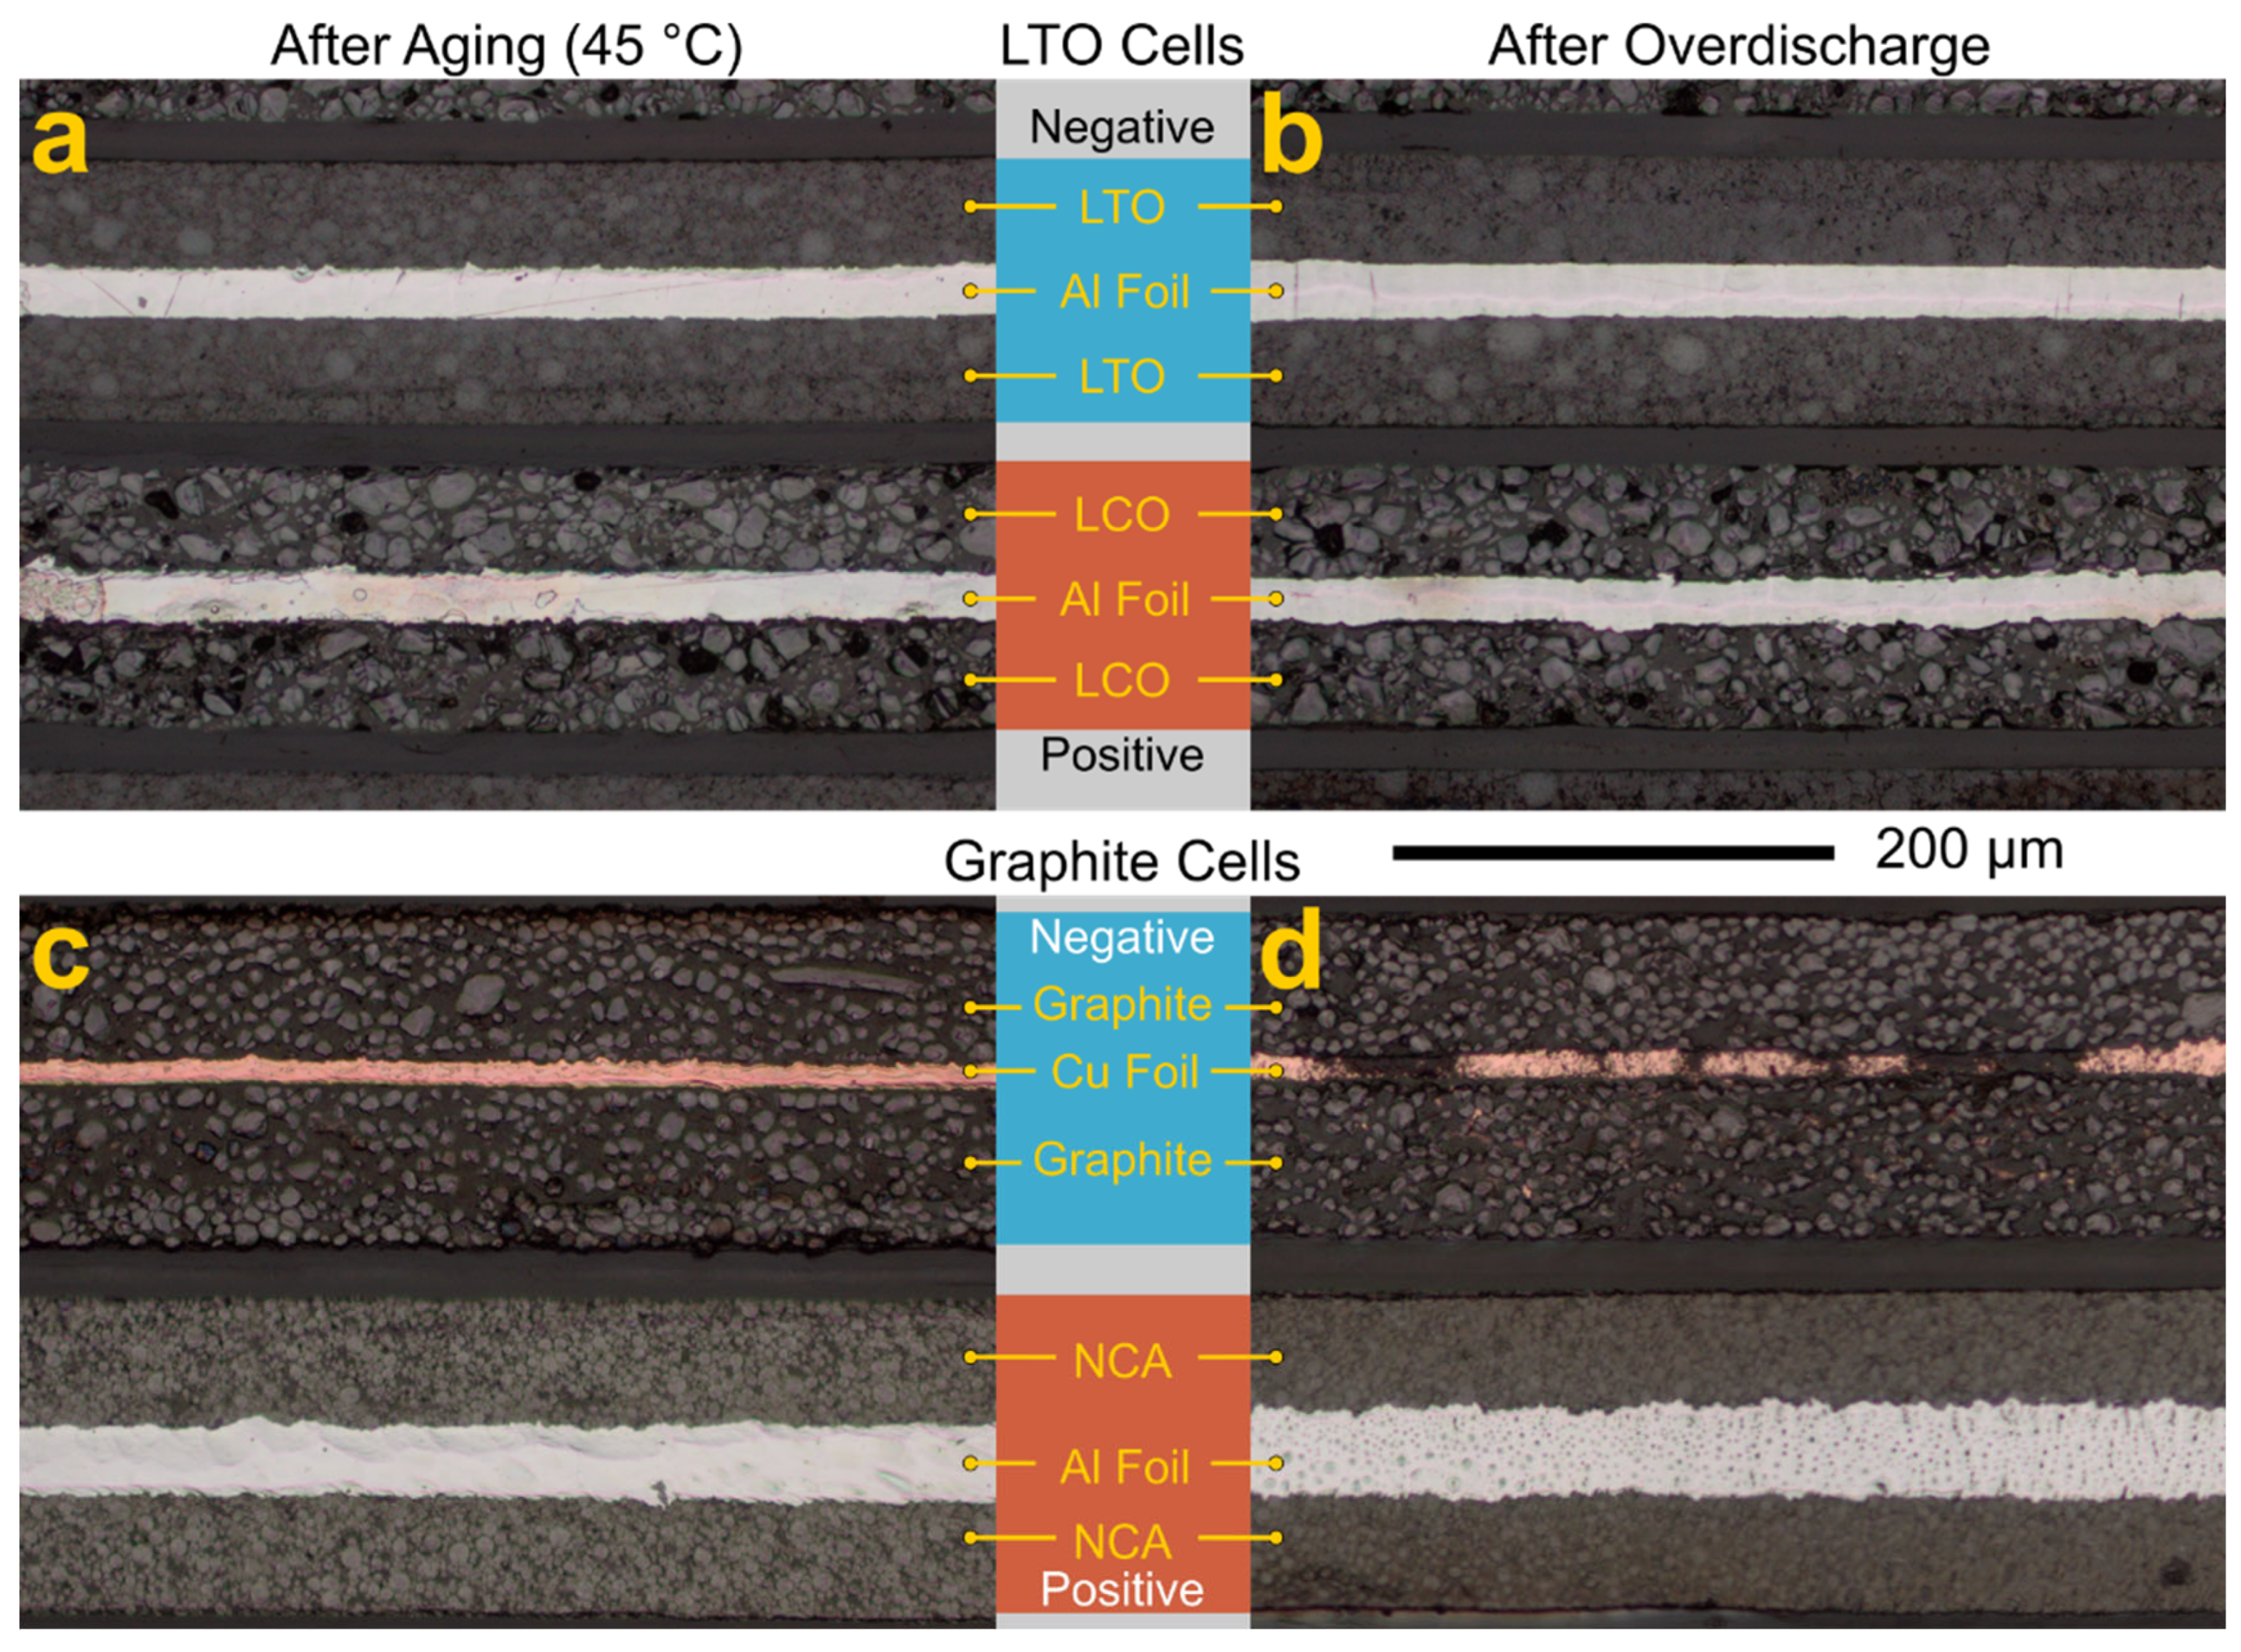
Figure 7.
Optical microscopy of cross-sectioned LTO (top row) and graphite (bottom row) cells. (a) An LTO cell, after aging at 45 °C; (b) an LTO cell after overdischarge testing; (c) a graphite cell after aging at 45 °C; (d) a graphite cell after overdischarge testing. Images are oriented so that the negative electrode is above the positive electrode. All images are scaled equally.
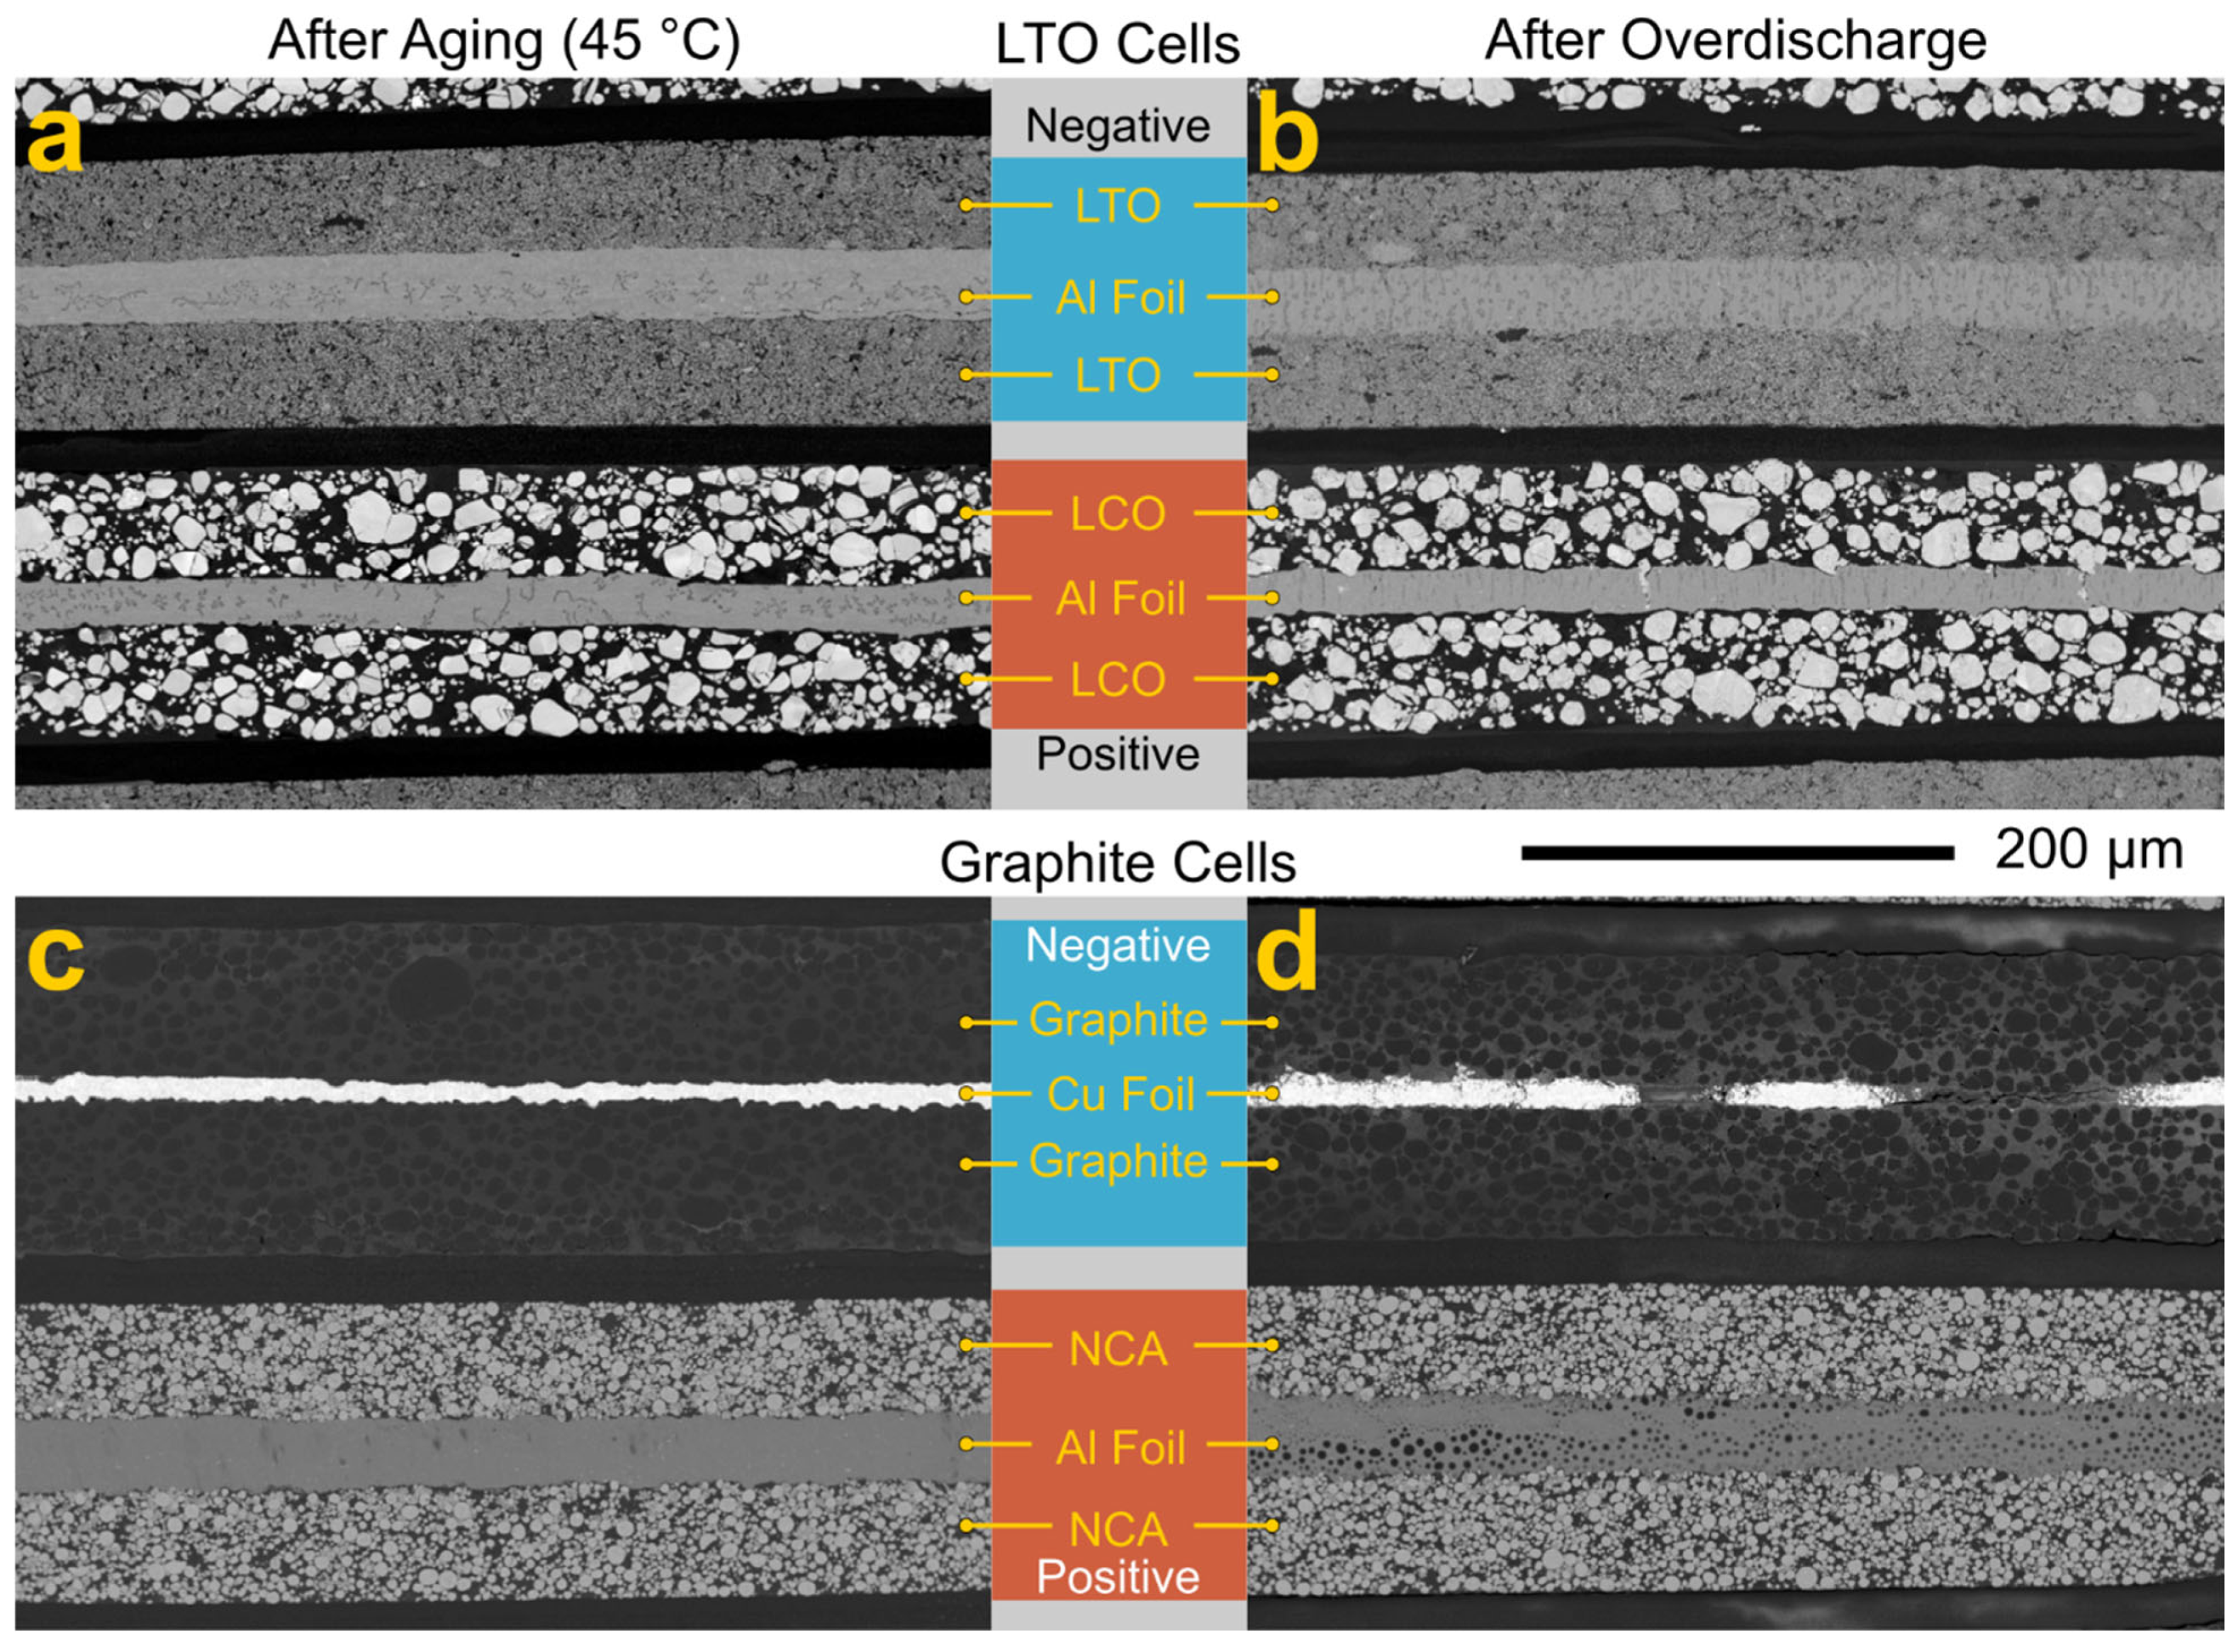
Figure 8.
Backscatter electron micrographs of electrodes from the cross-sectioned LTO (
top row) and graphite (
bottom row) cells. (
a) An LTO cell after aging at 45 °C; (
b) an LTO cell after overdischarge testing; (
c) a graphite cell after aging at 45 °C; (
d) a graphite cell after overdischarge testing. The images here are representative and do not correspond to the specific locations shown in
Figure 7. The images were collected with a 3 keV electron beam. All images are scaled equally.
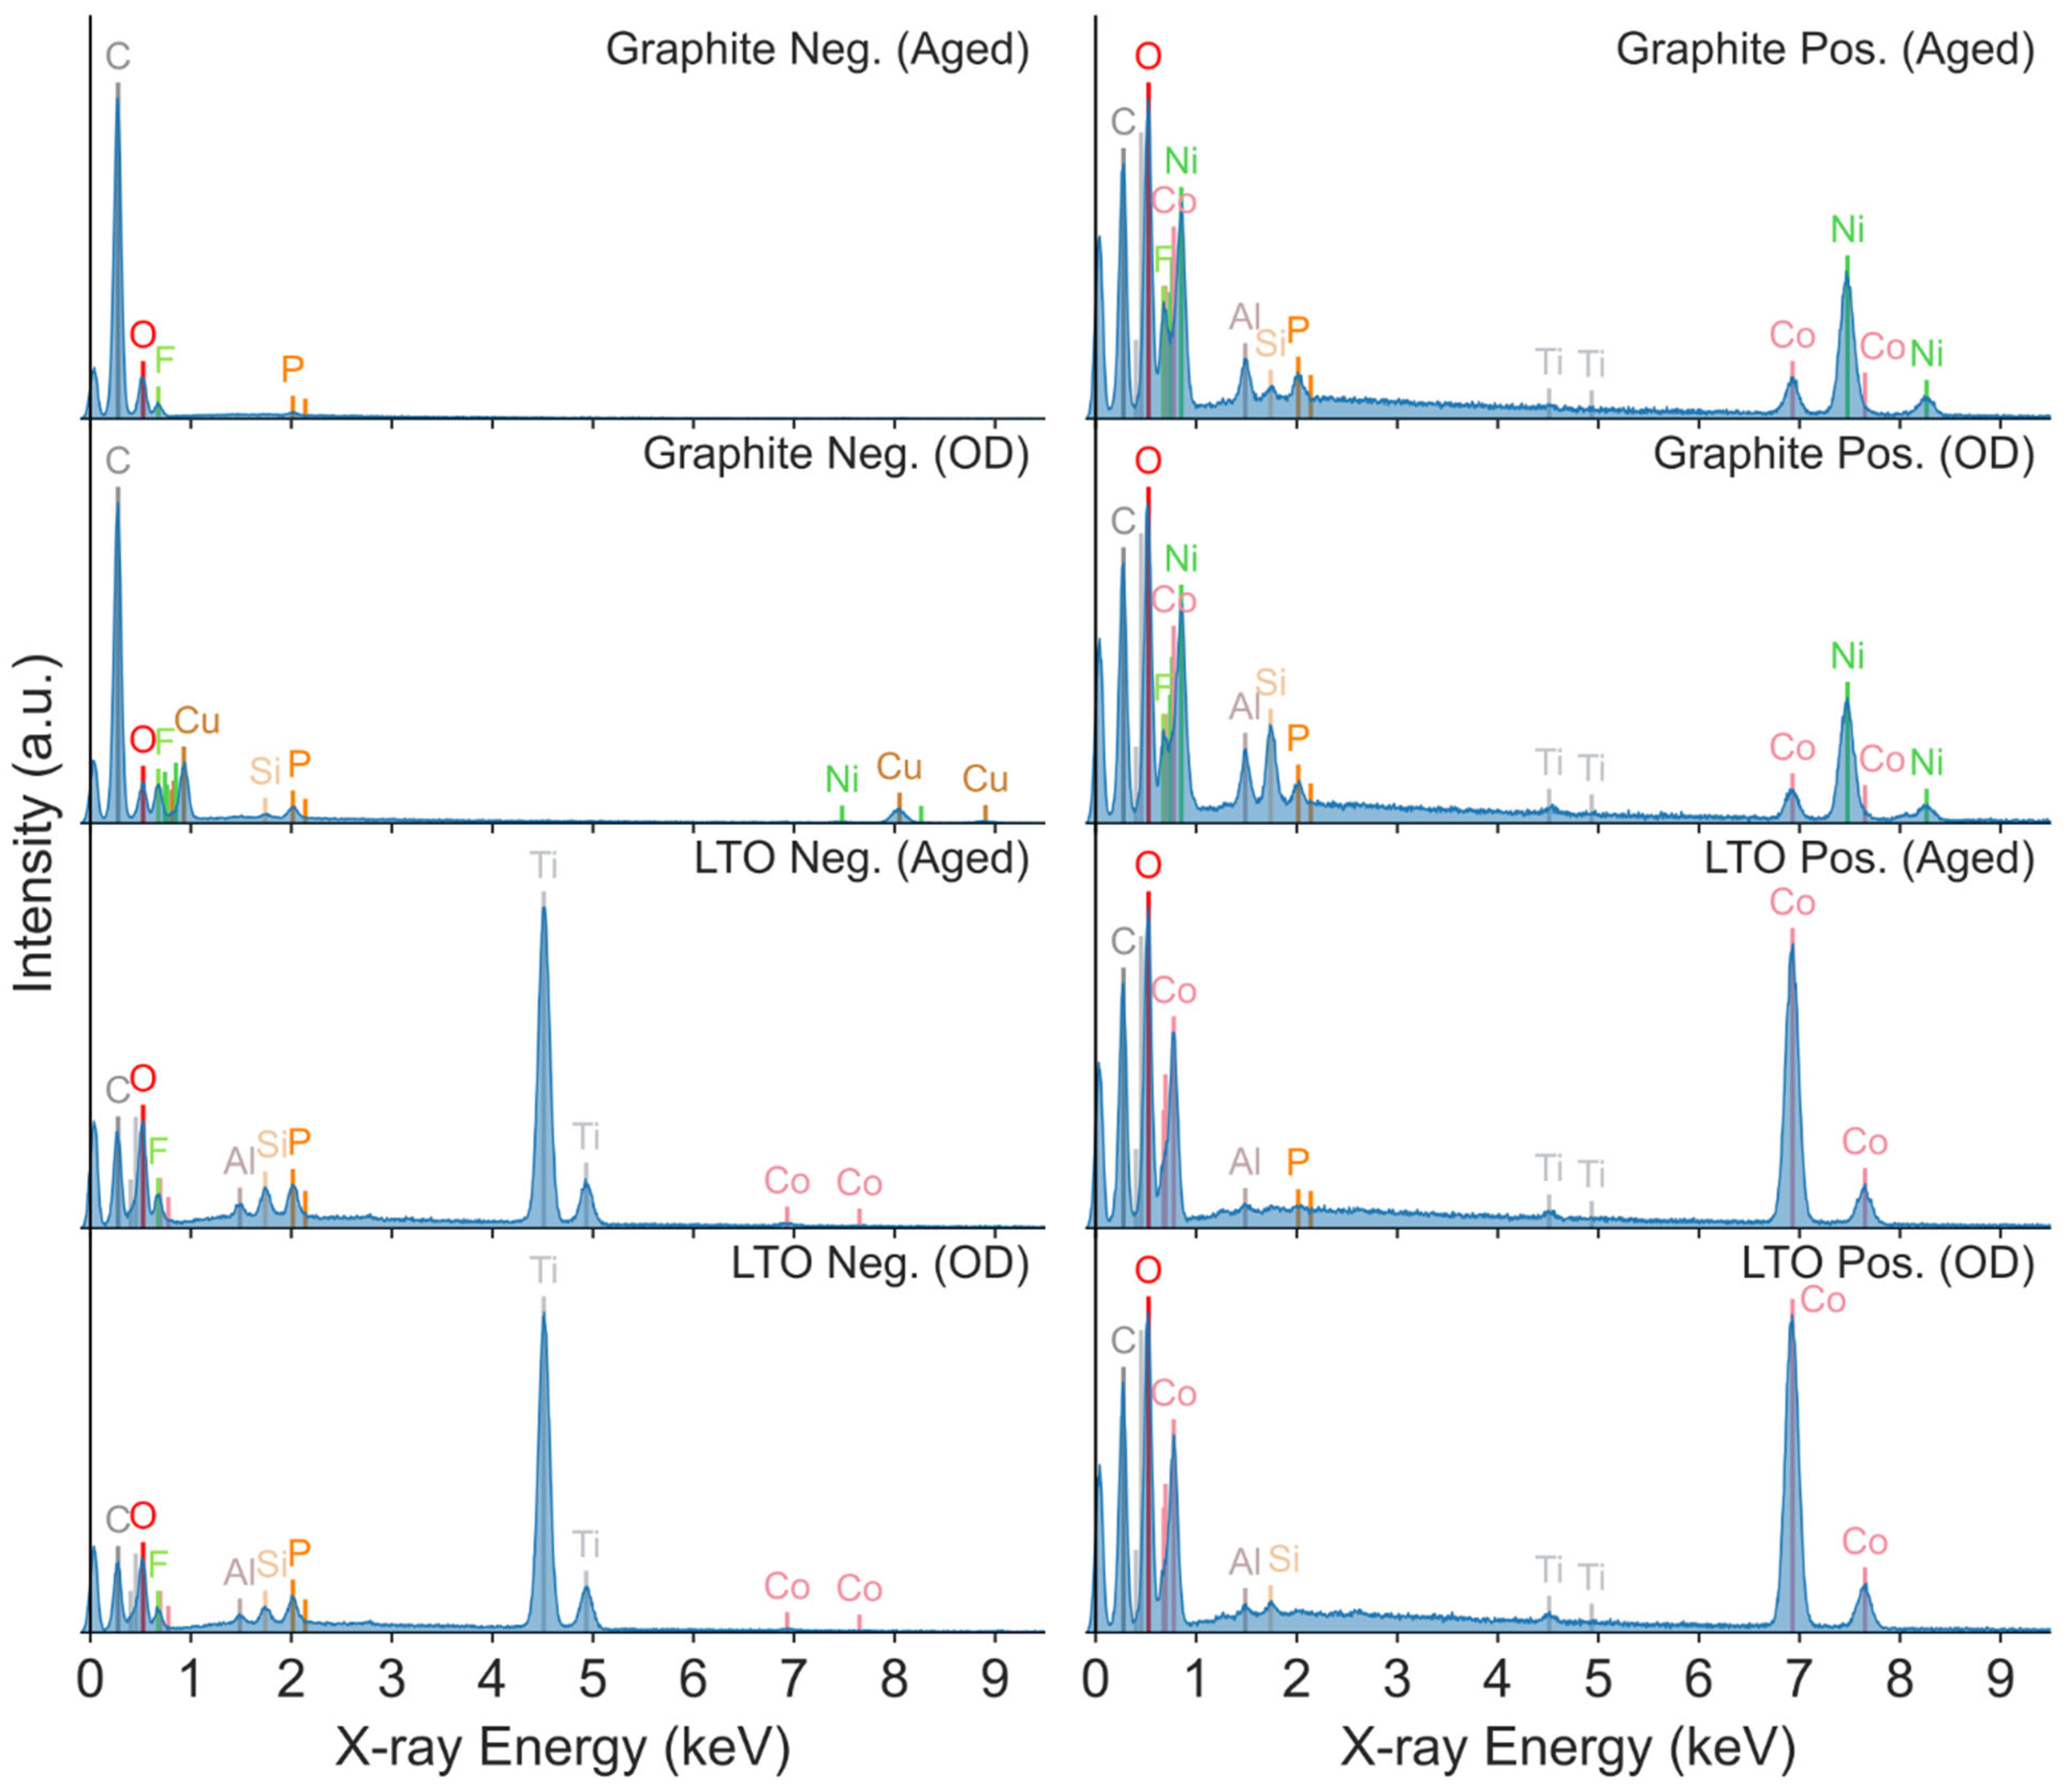
Figure 9.
Energy-dispersive X-ray spectroscopy (EDS) spectra of the cross-sectioned electrodes. The left column shows the negative electrode spectra; the right column shows the positive electrode spectra. Top row: a graphite cell after aging at 45 °C. Second row: a graphite cell after overdischarge testing. Third row: an LTO cell after aging at 45 °C. Bottom row: an LTO cell after overdischarge testing. All spectra are normalized to the maximum peak height. Atomic X-ray lines are marked and colored using the Jmol color scheme [
12].
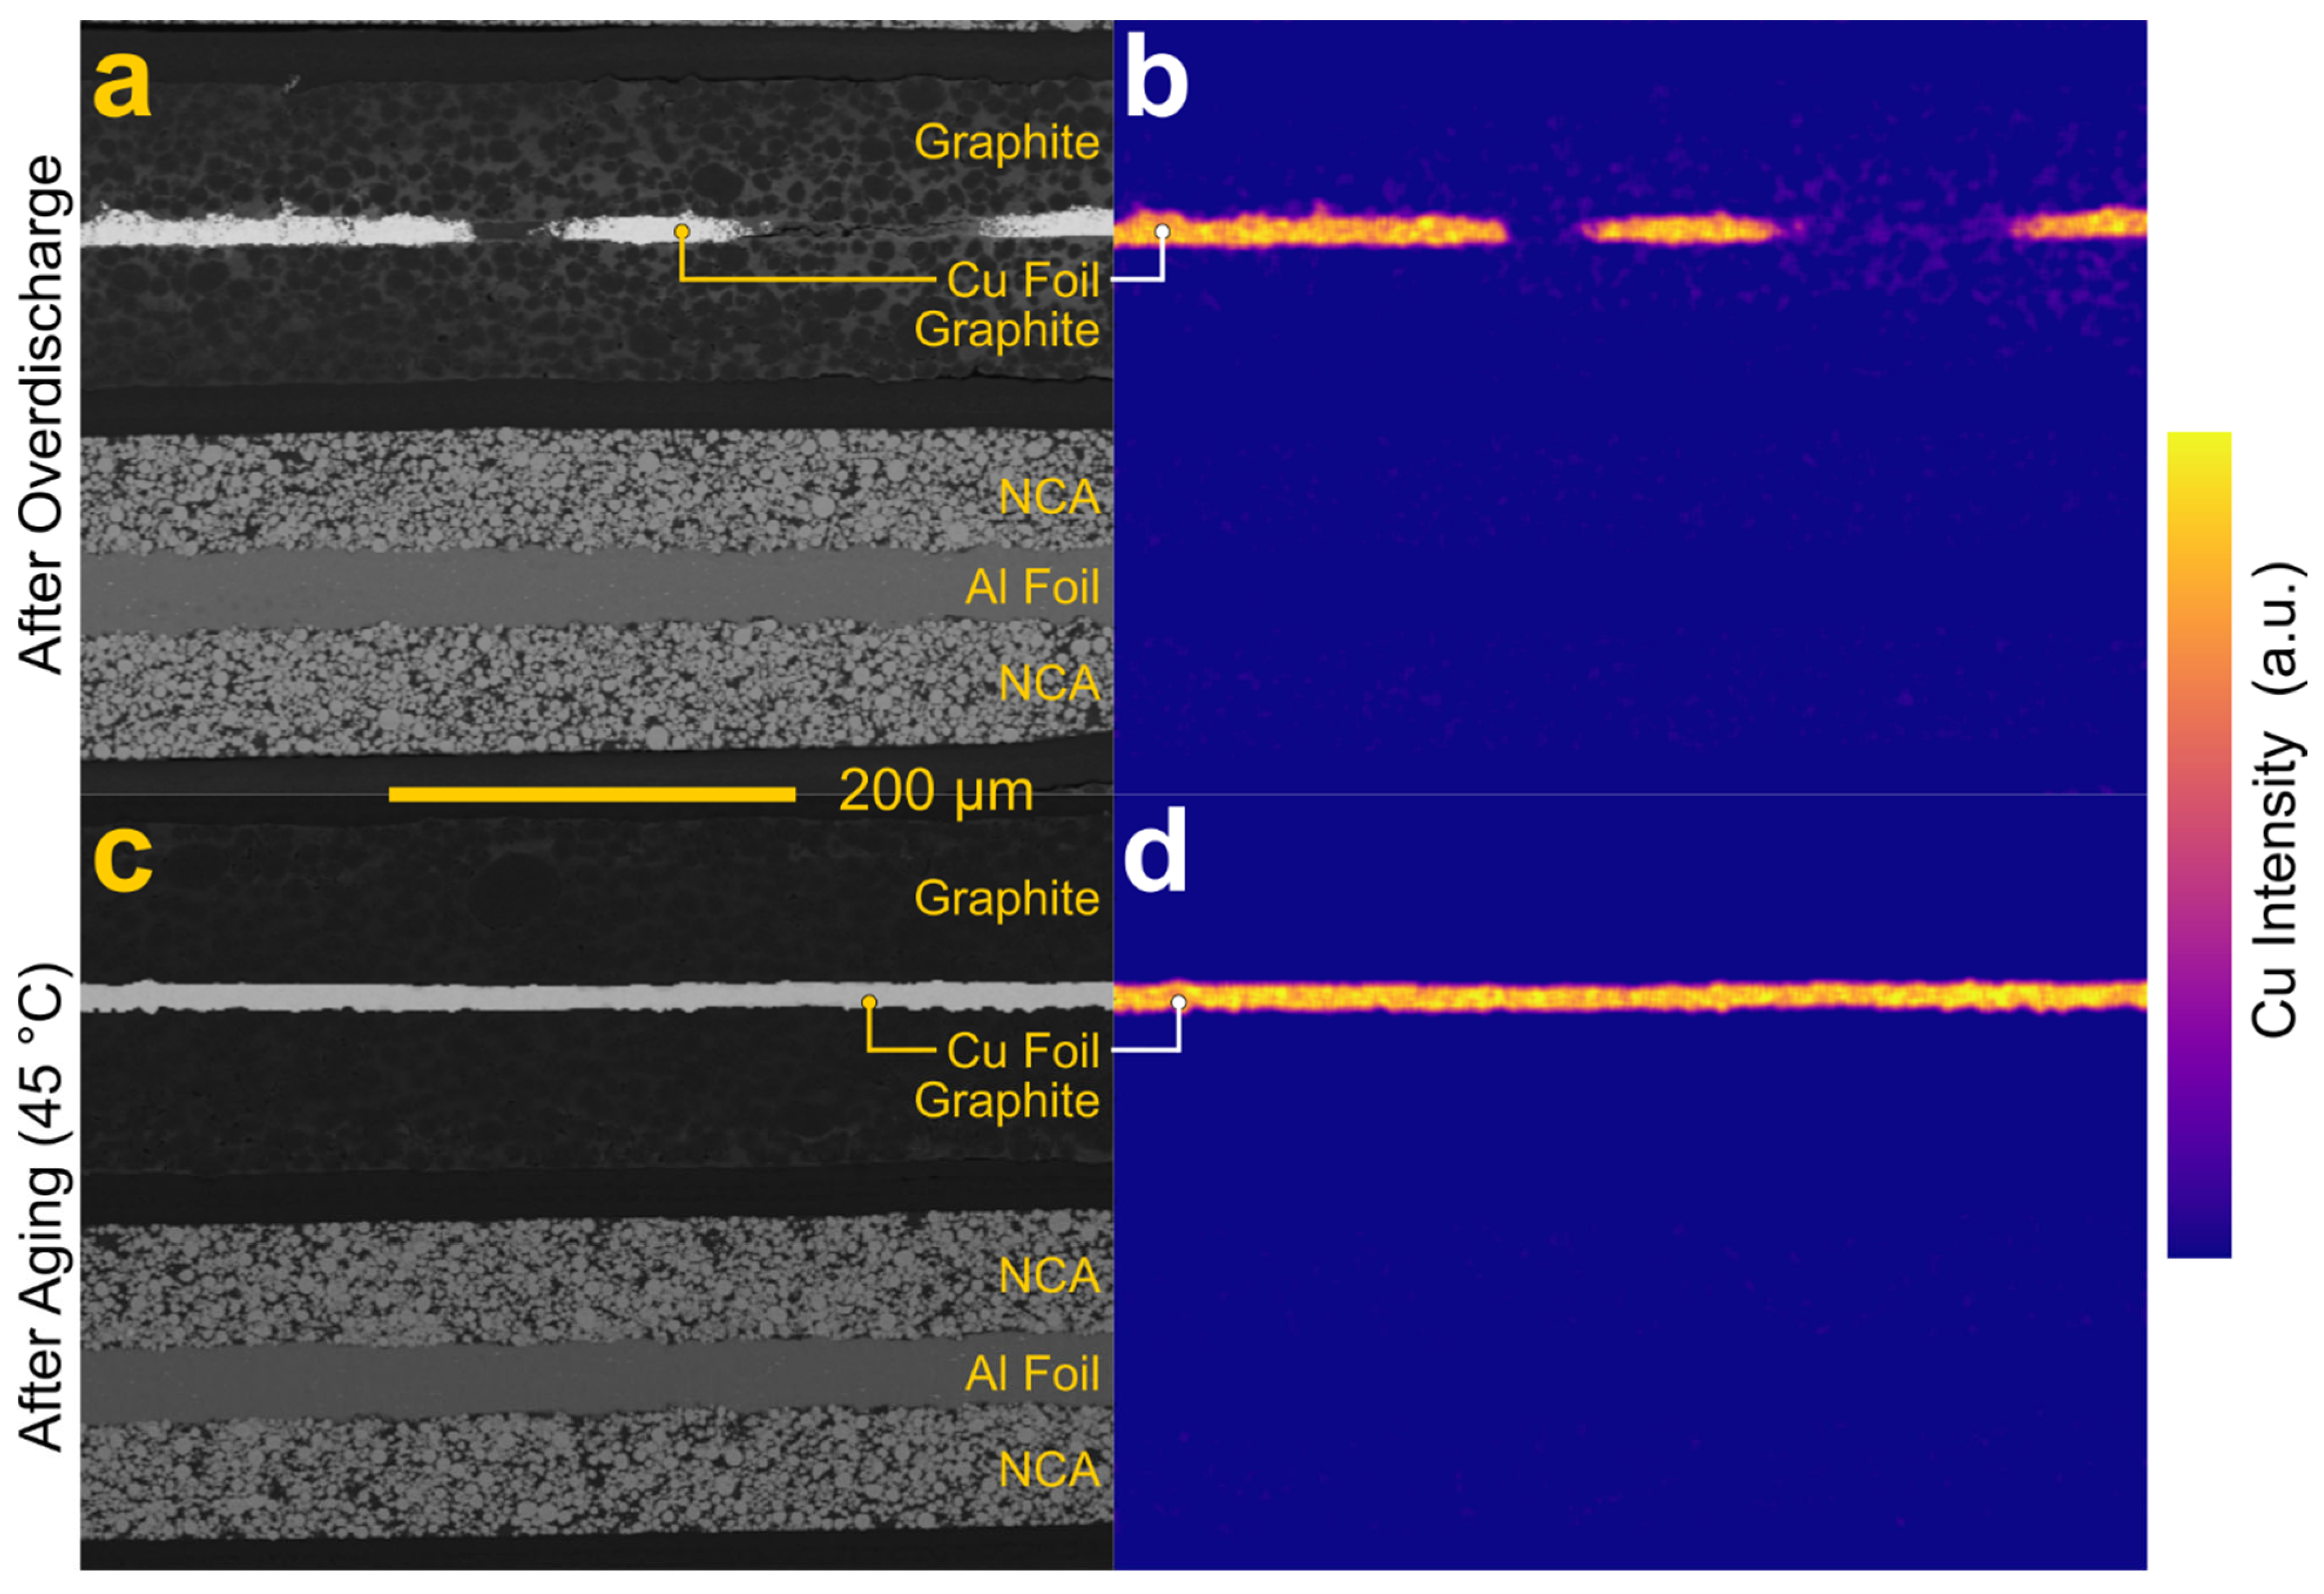
Figure 10.
Backscatter (a,c) and Cu-K EDS map (b,d) of the overdischarged (a,b) and aged (c,d) graphite cells. The color indicates the Cu-K signal intensity. All images are scaled equally.
Figure 10.
Backscatter (a,c) and Cu-K EDS map (b,d) of the overdischarged (a,b) and aged (c,d) graphite cells. The color indicates the Cu-K signal intensity. All images are scaled equally.
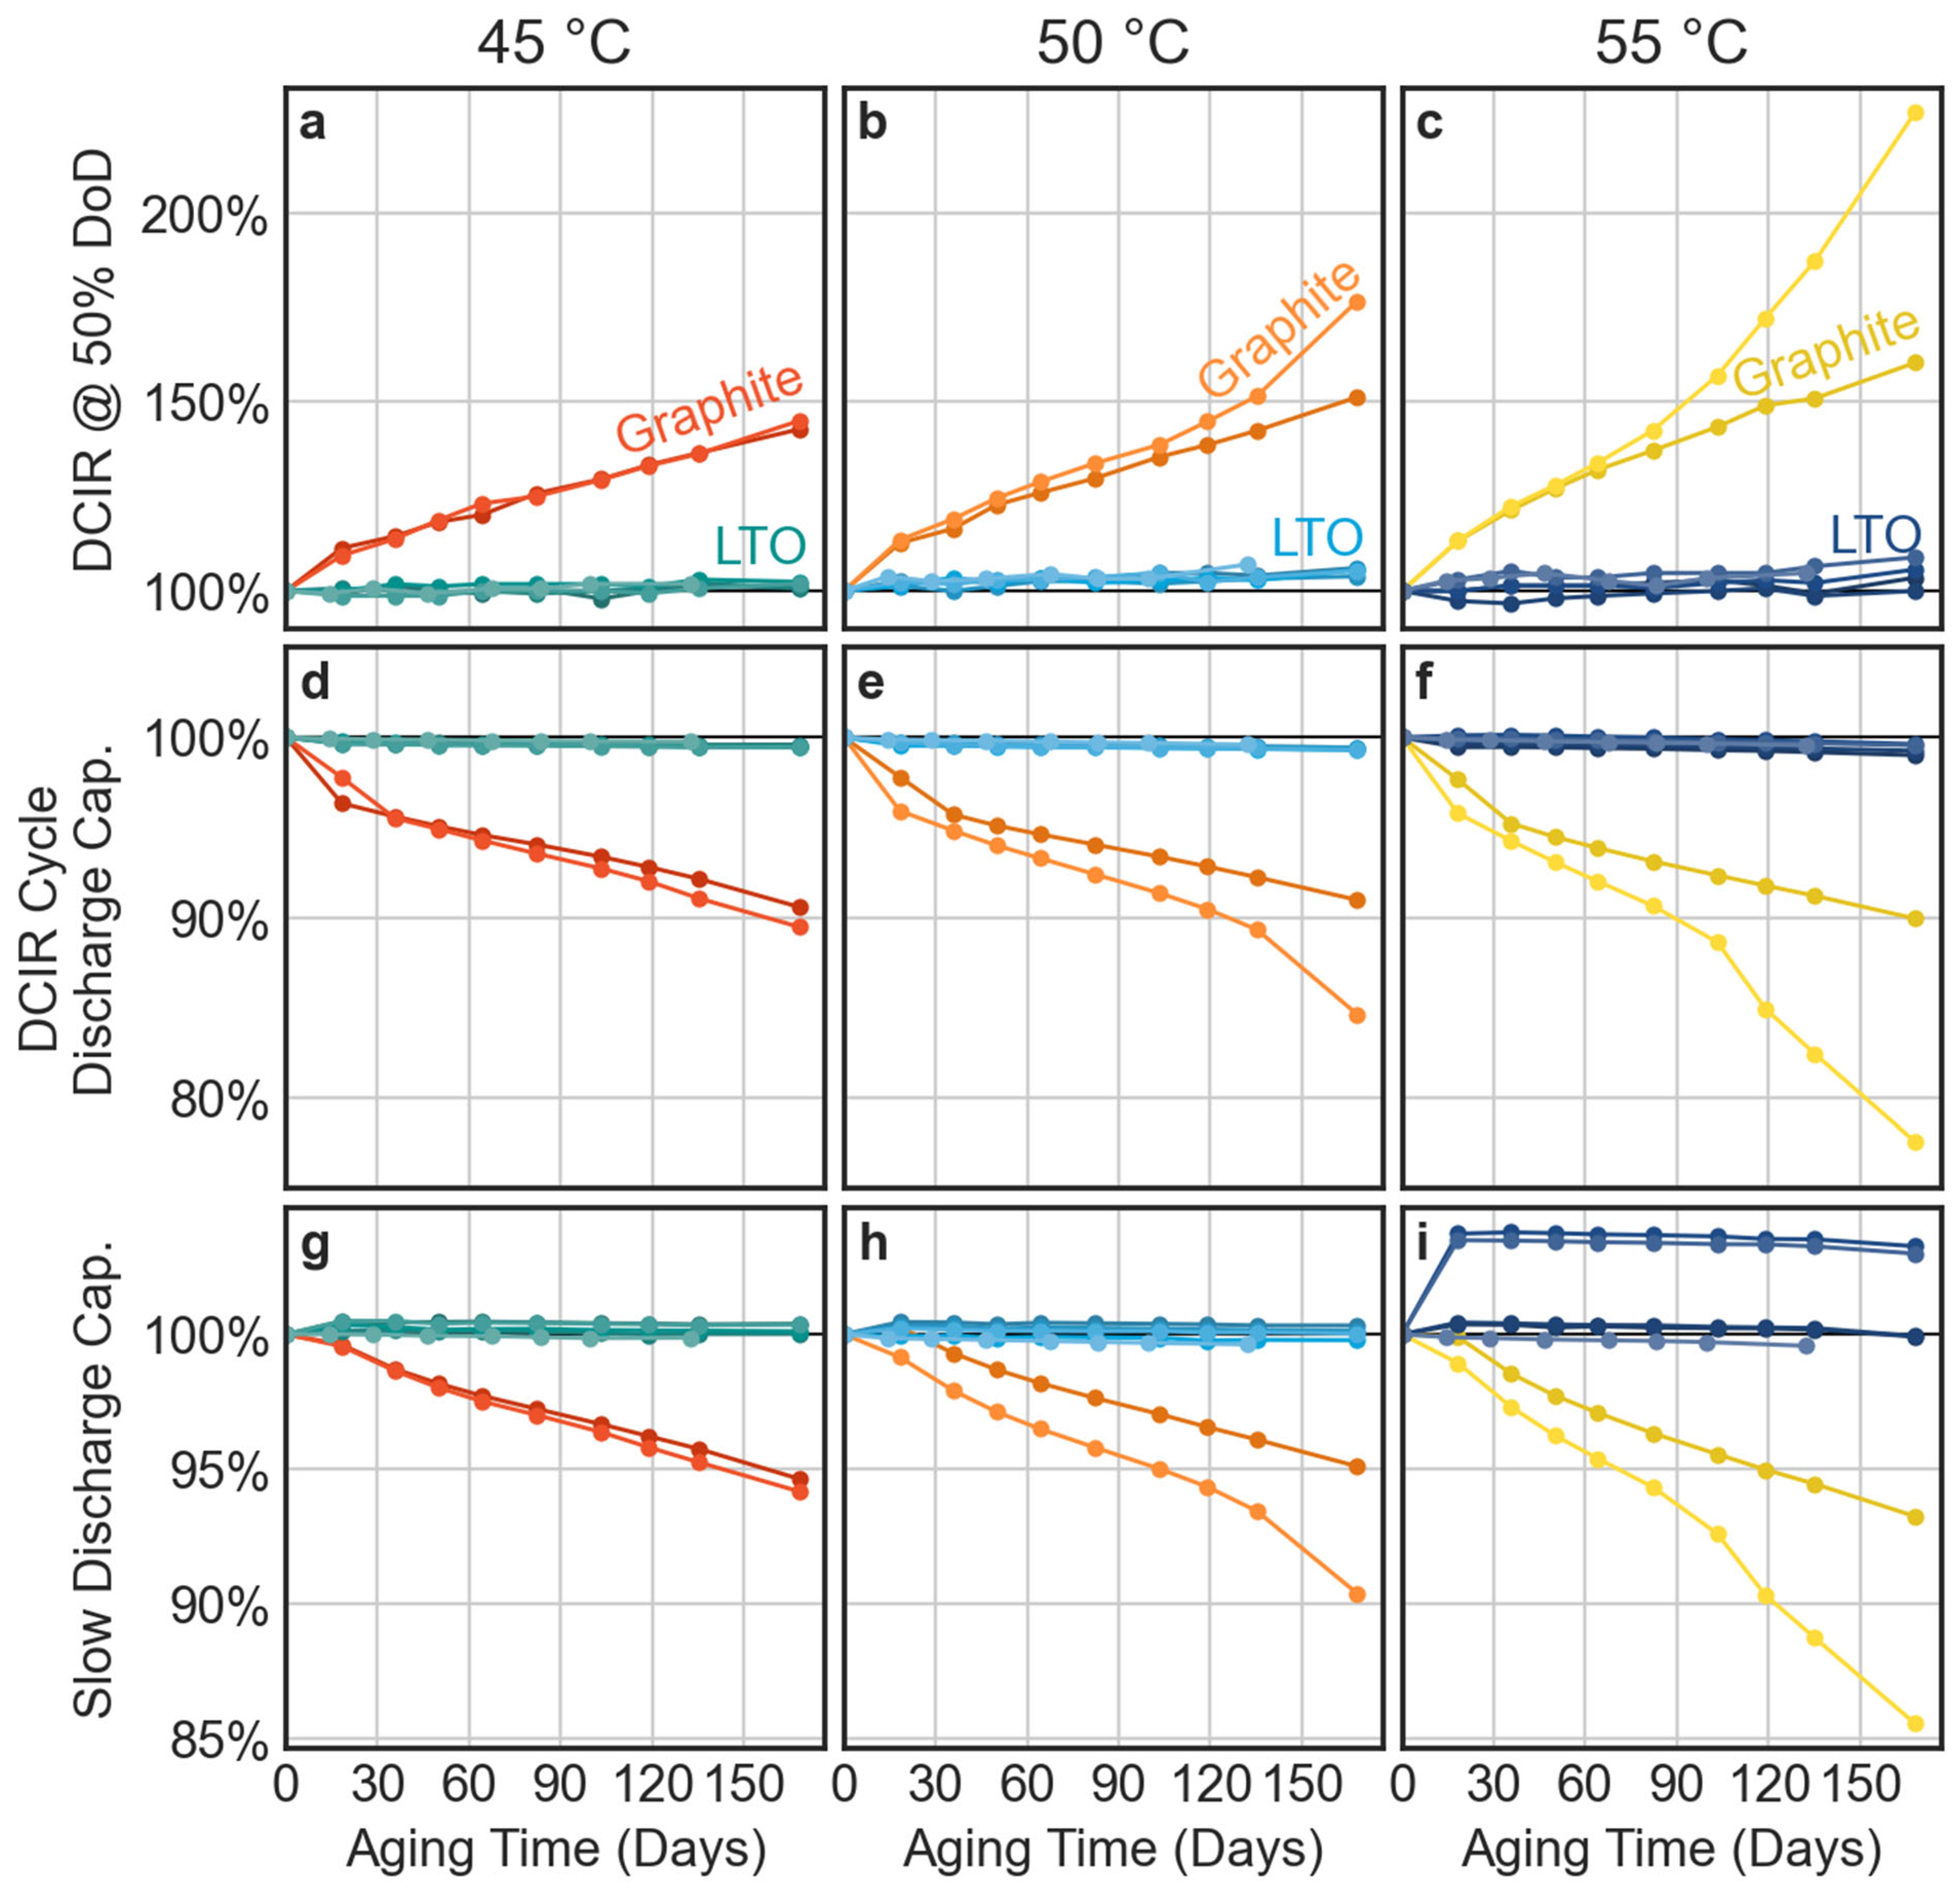
Figure 11.
Change in various metrics vs. aging time at 45 °C (a,d,g), 50 °C (b,e,h), and 55 °C (c,f,i). All metrics were normalized relative to the pre-aging value of that metric. Top row (a,b,c) DCIR at 50% depth of discharge. Middle row (d,e,f) discharge capacity of the DCIR cycle. Bottom row (g,h,i) C/24 discharge capacity. The graphite cells are depicted in warm colors (red, orange, yellow) while the LTO cells are depicted in cool colors (teal, blue, navy).
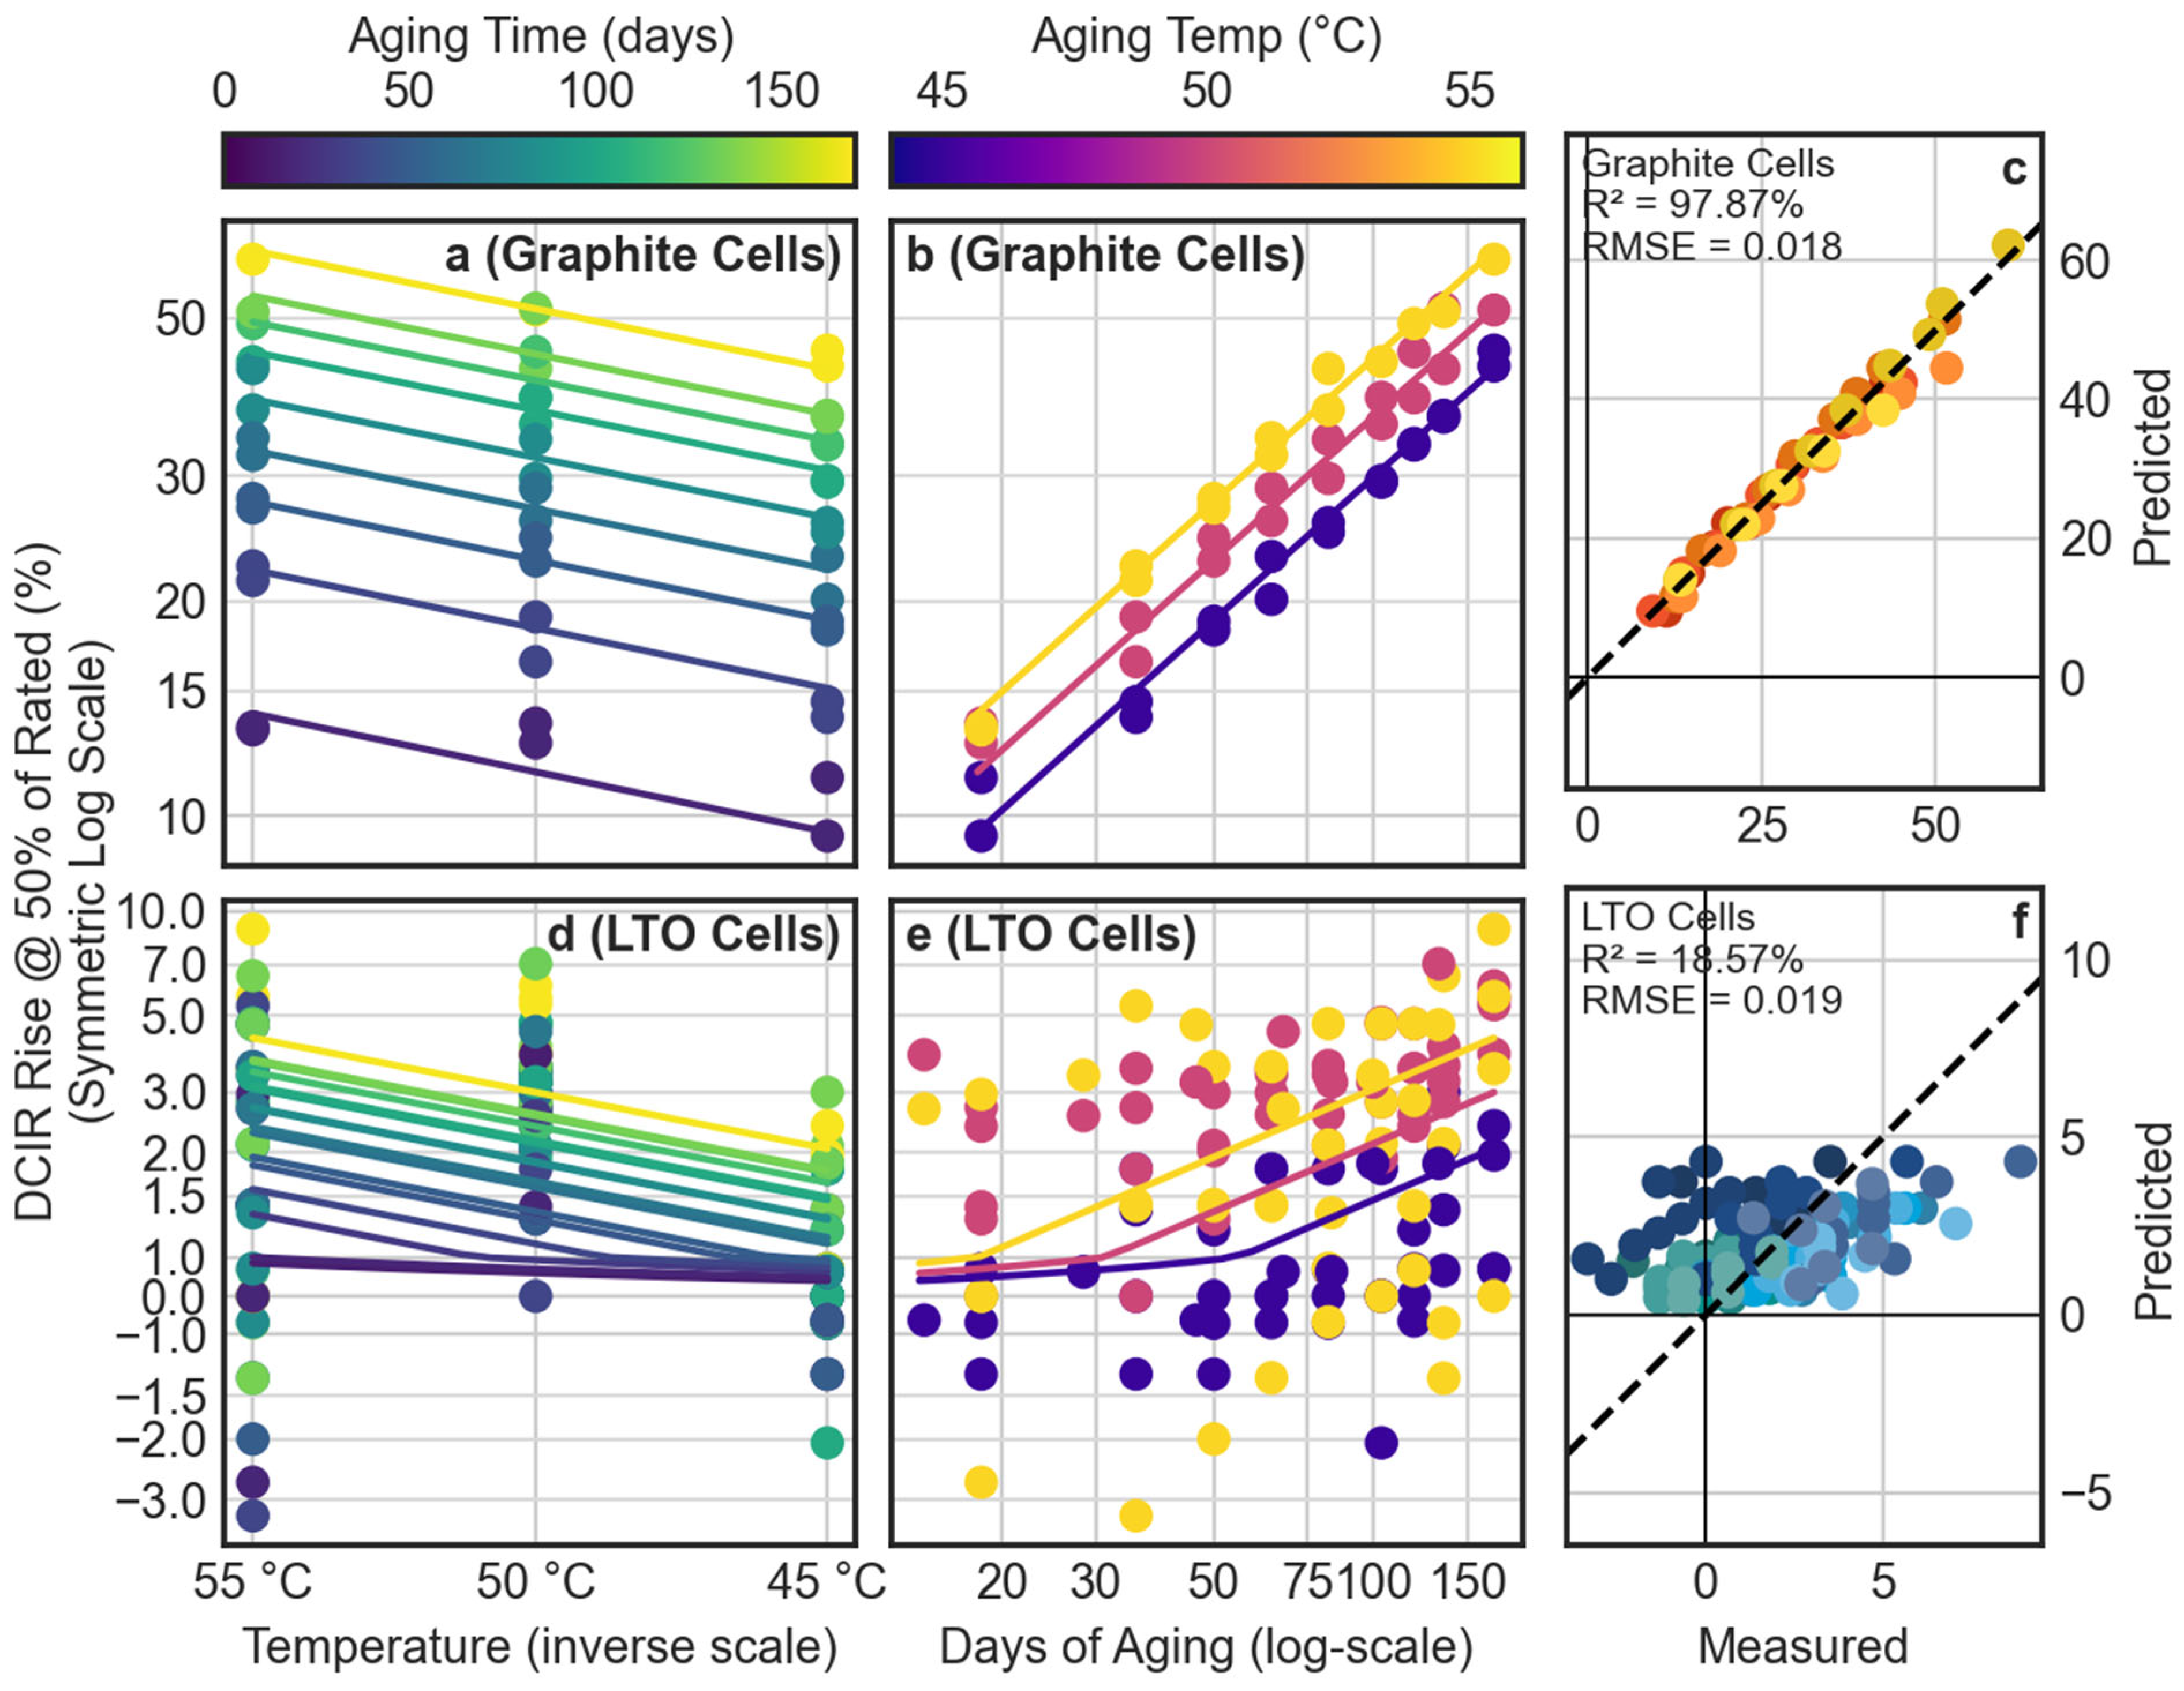
Figure 12.
Quality of fit metrics for the modified Arrhenius fit of the DCIR at 50%. Upper plots (a–c): the graphite cells. Lower plots (d–f): the LTO cells. Left column (a,d): the rise in DCIR (symmetric log scale) vs. aging temperature (plotted on an inverse absolute temperature scale), with colors indicating aging time. Middle column (b,e): the rise in DCIR vs. aging time, with colors indicating aging temperature. The points indicate measured data, while the lines reflect the best fit for the model. Right column (c,f): the predicted vs. the actual results. Colors reflect the individual cells; the 45° line indicates a perfect agreement between the model and the data.
Figure 13.
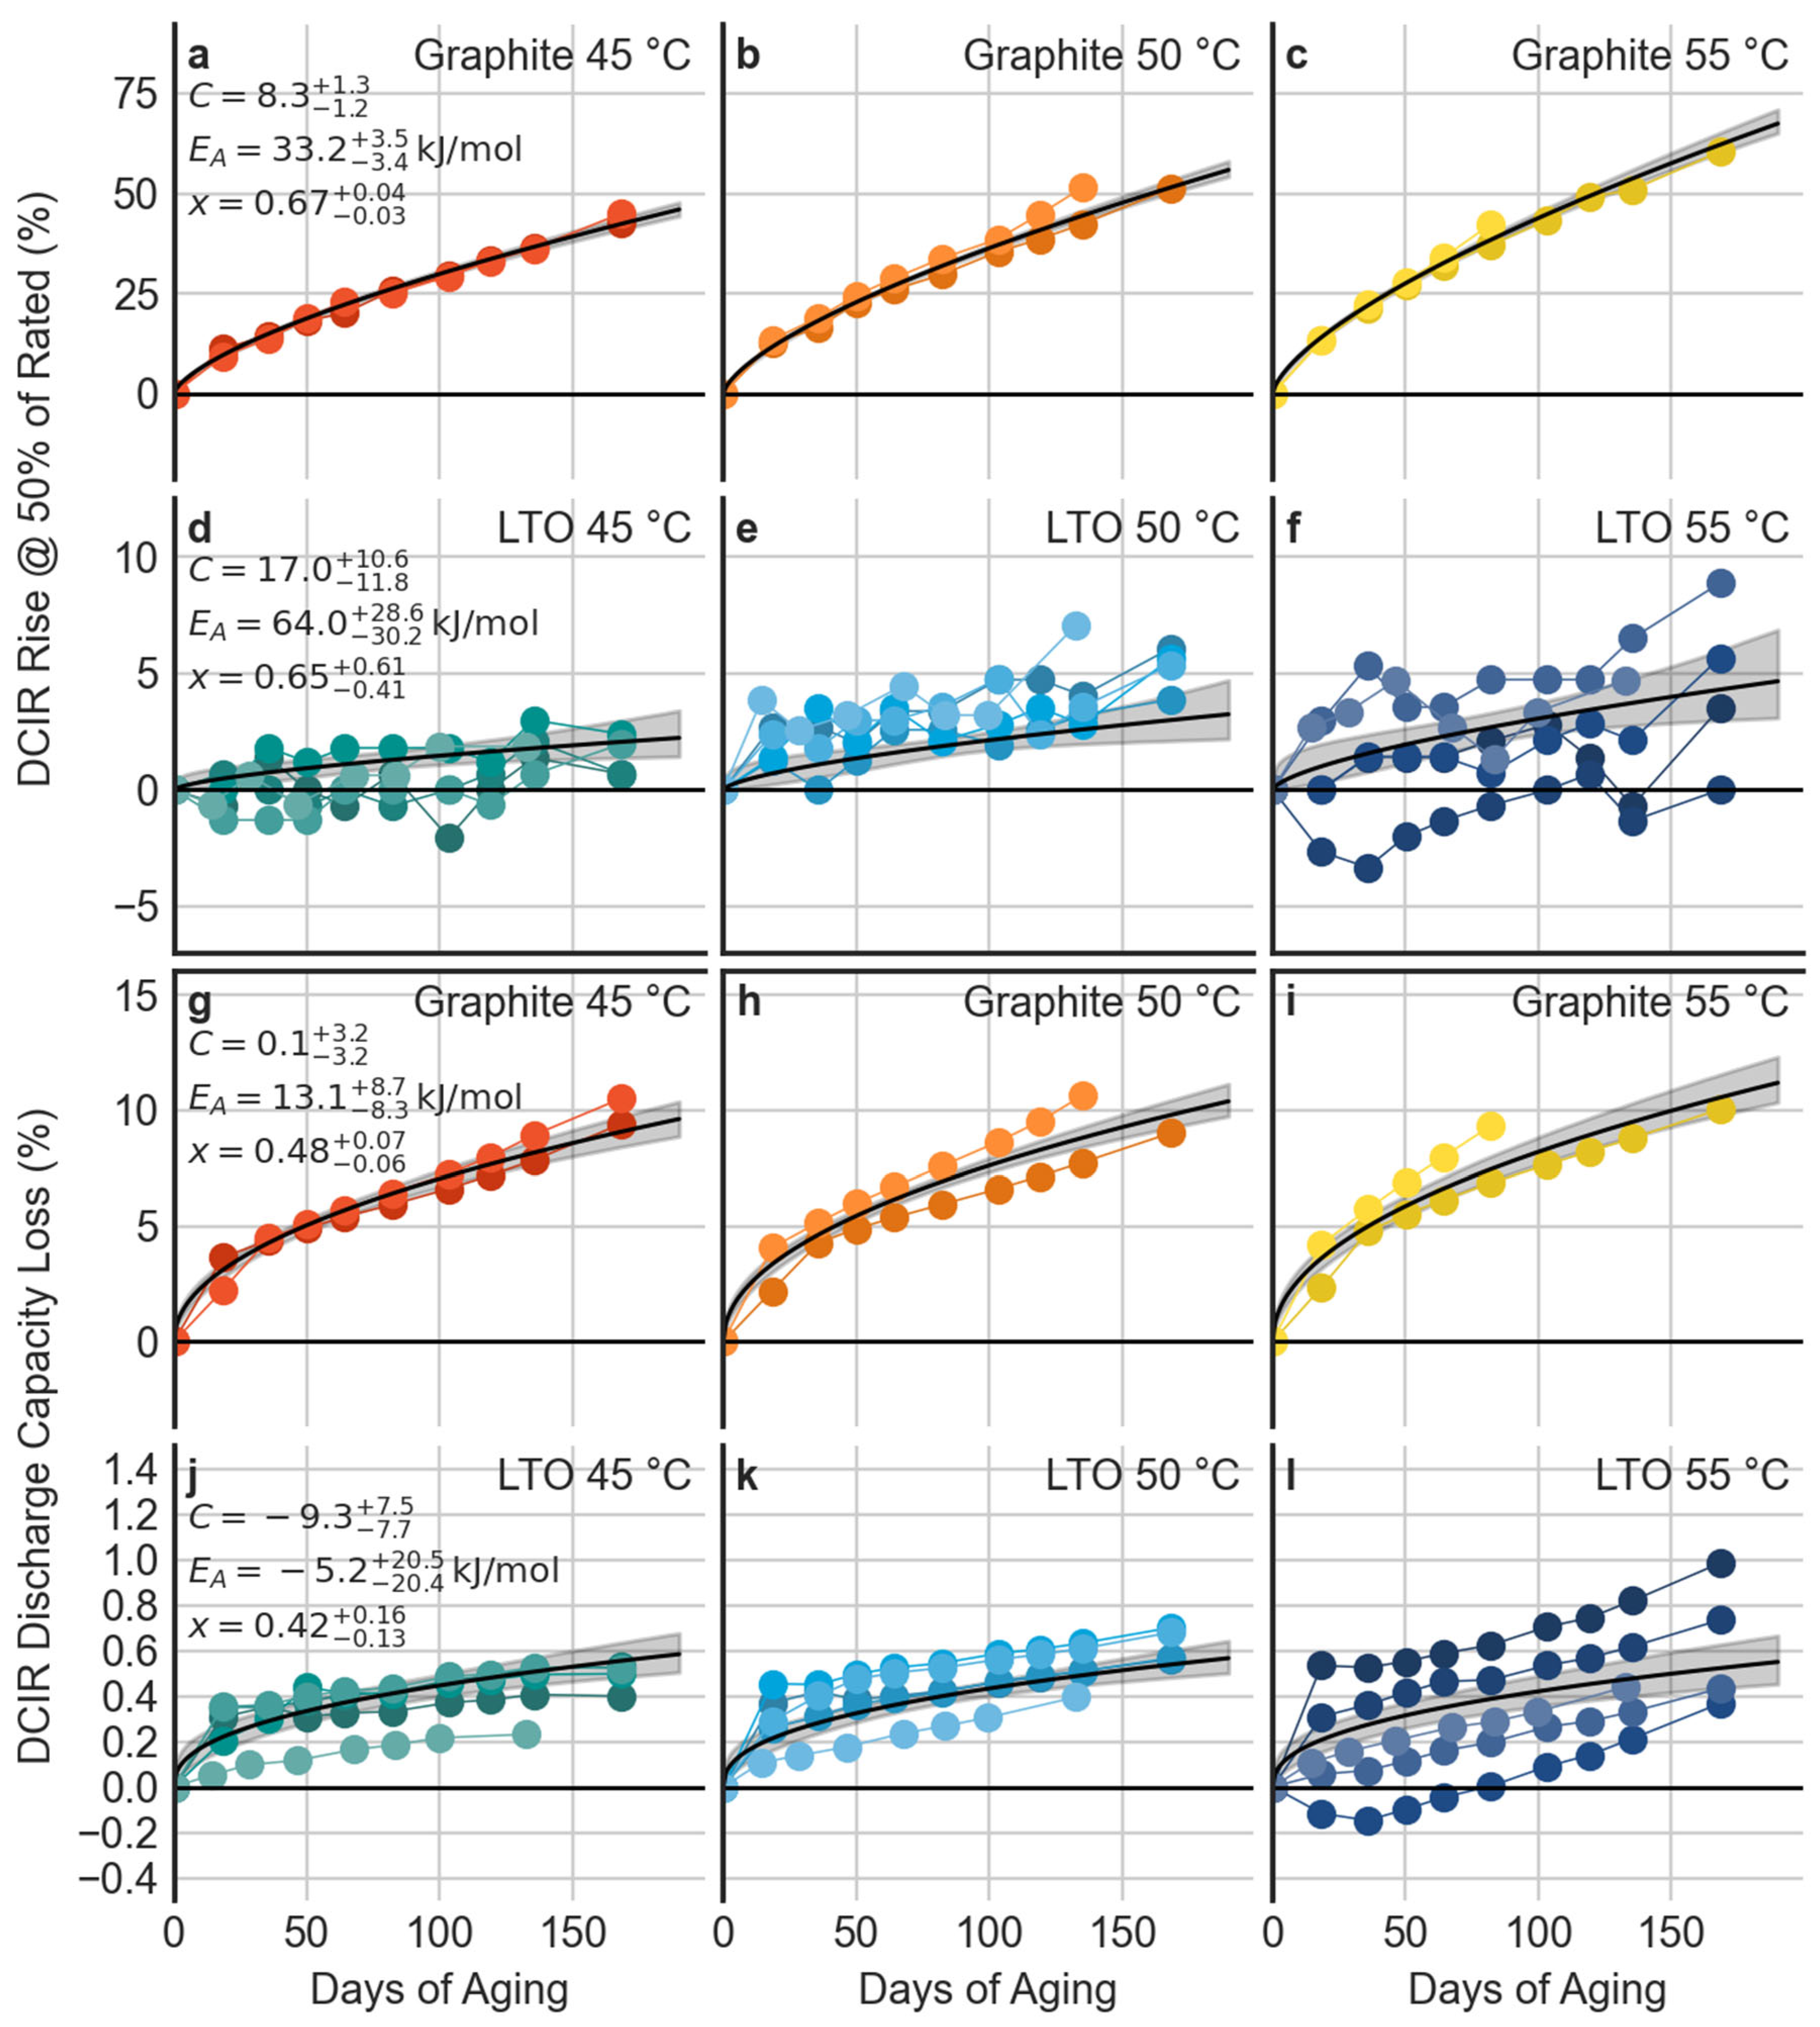
Aging data and modeled predictions. For all plots, colored dots and lines reflect the measured data, while the solid black curves reflect the model prediction. Shaded regions reflect the 95% confidence interval for the population average. Fit parameters are shown on the left-most plot in each row. Top two rows (a–f) the rise in DCIR at 50% DoD. Bottom two rows (g–l) the C/24 discharge capacity.
Figure 13.
Aging data and modeled predictions. For all plots, colored dots and lines reflect the measured data, while the solid black curves reflect the model prediction. Shaded regions reflect the 95% confidence interval for the population average. Fit parameters are shown on the left-most plot in each row. Top two rows (a–f) the rise in DCIR at 50% DoD. Bottom two rows (g–l) the C/24 discharge capacity.
Figure 14.
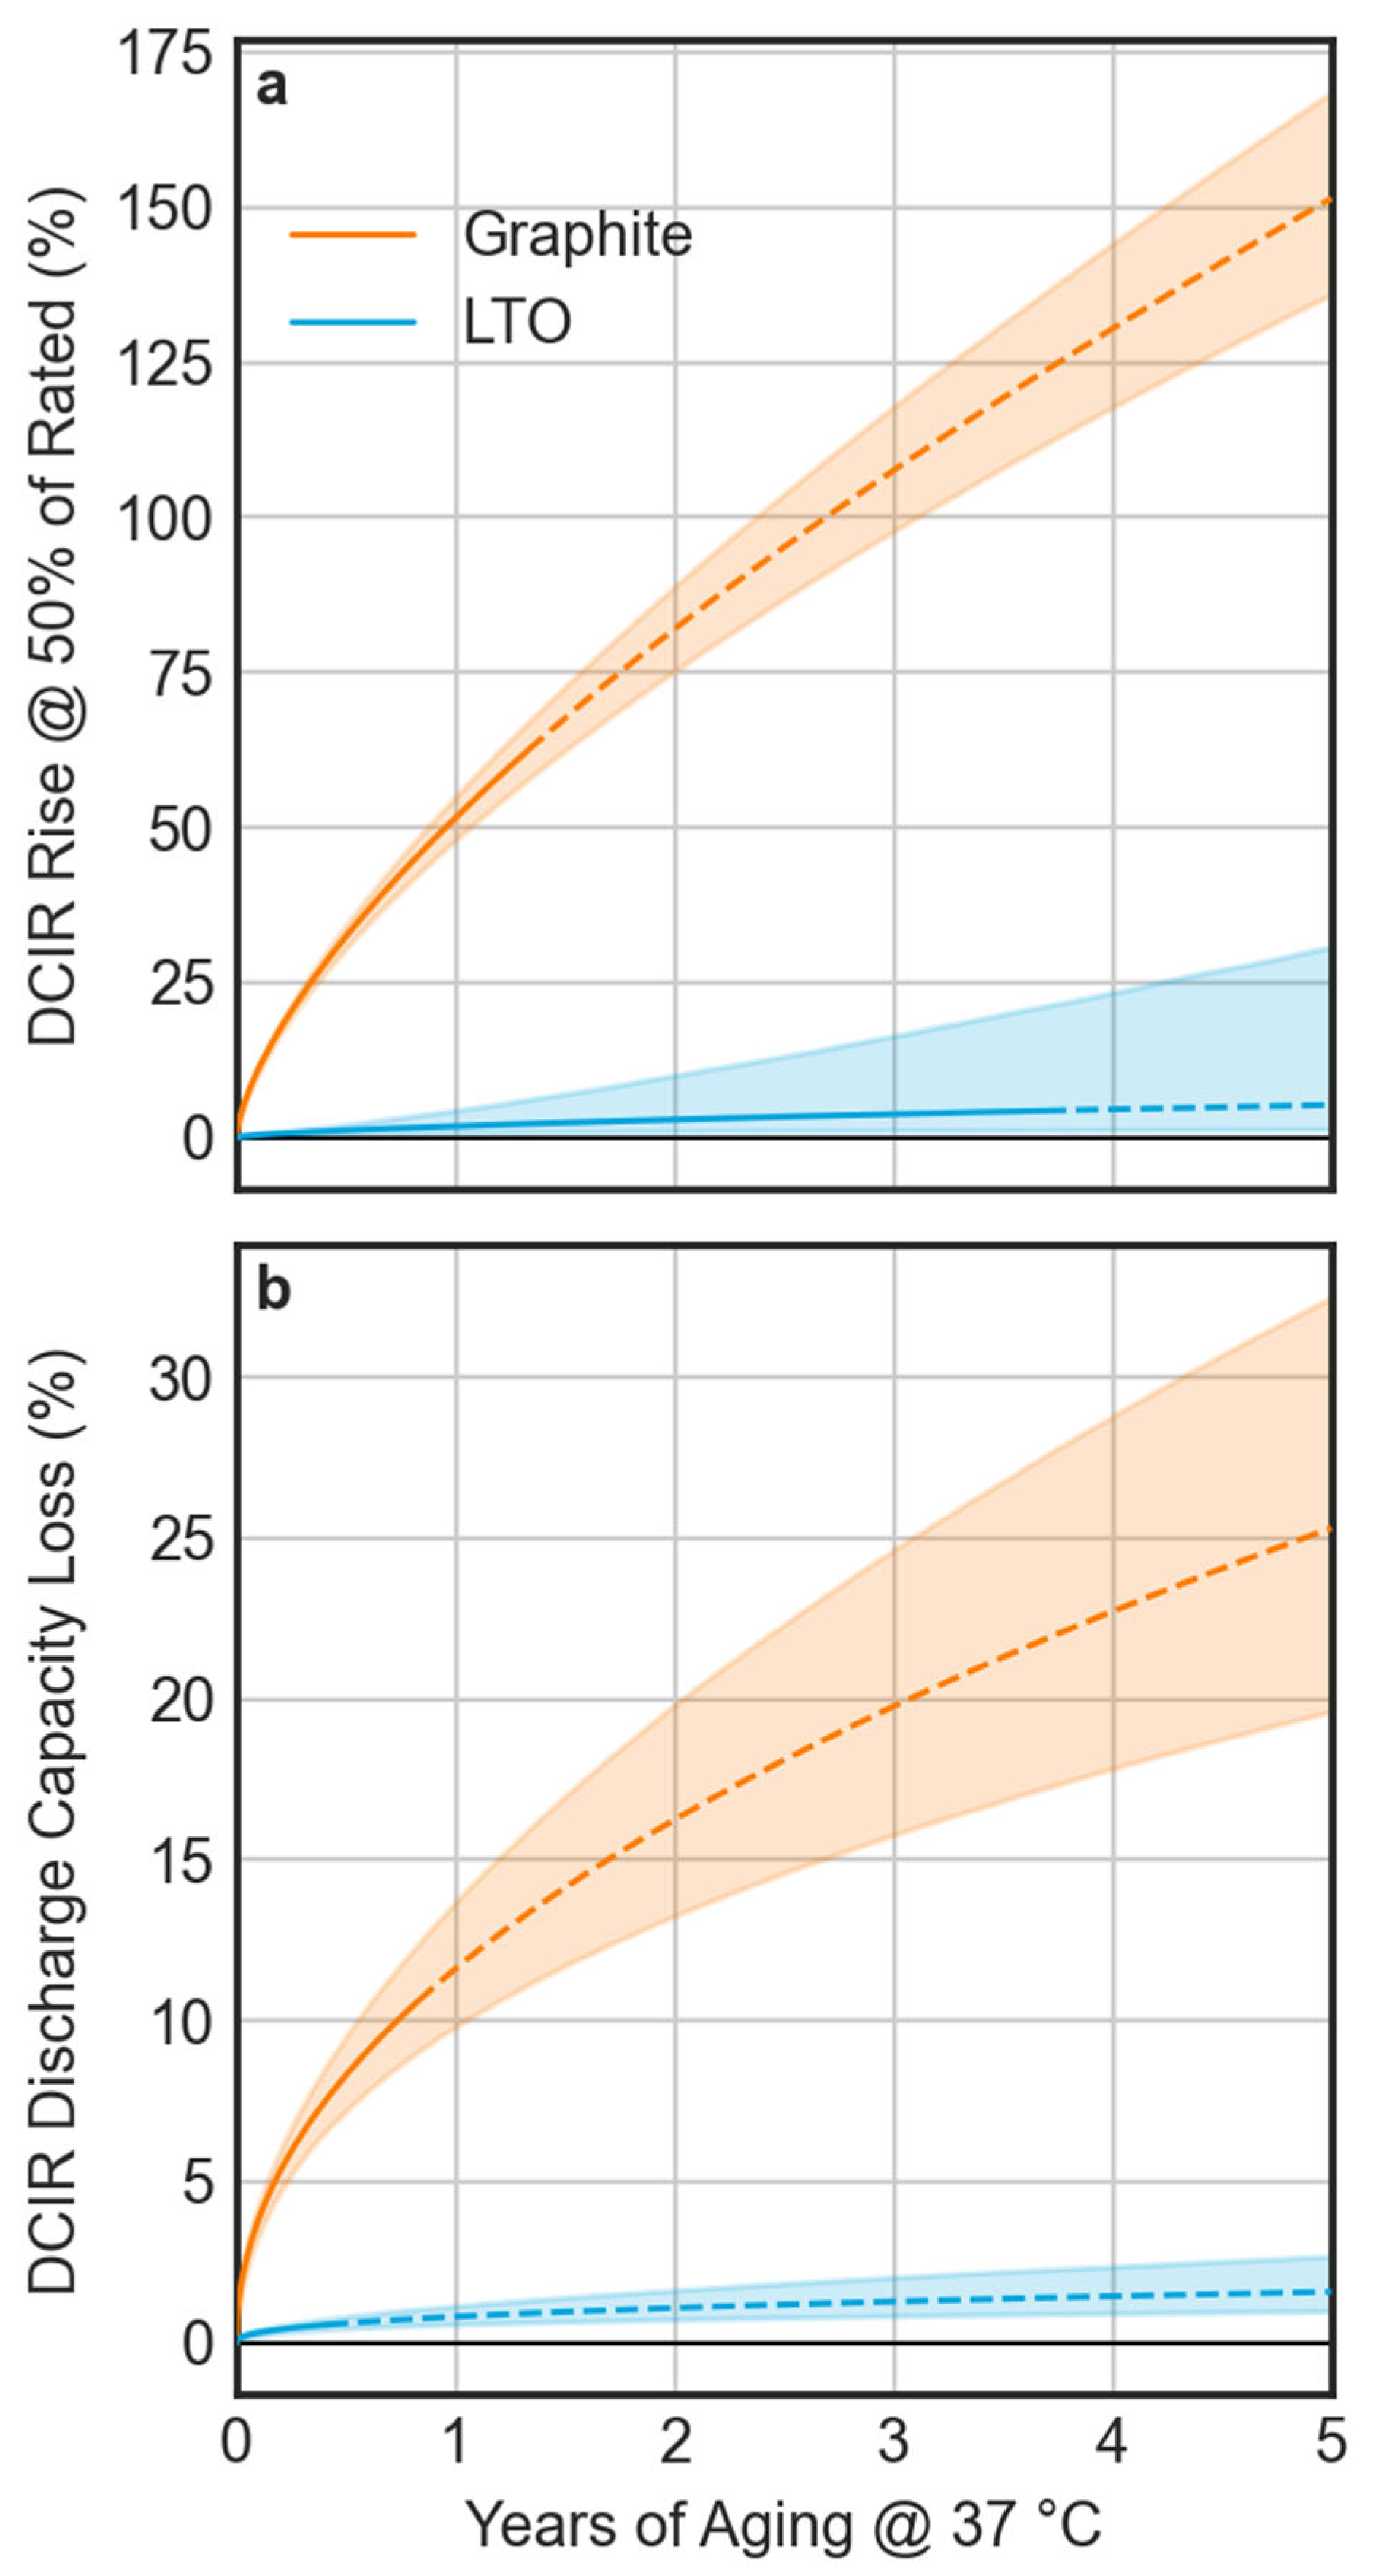
Long-term aging prediction at 37 °C. Solid lines represent the prediction within the range of aging observed in the accelerated aging test. Dotted lines reflect the extrapolated performance beyond this point. Shaded regions reflect the 95% confidence interval for the population mean. (a) The predicted rise in DCIR @ 50% SOC; (b) the predicted DCIR discharge capacity loss.
Figure 14.
Long-term aging prediction at 37 °C. Solid lines represent the prediction within the range of aging observed in the accelerated aging test. Dotted lines reflect the extrapolated performance beyond this point. Shaded regions reflect the 95% confidence interval for the population mean. (a) The predicted rise in DCIR @ 50% SOC; (b) the predicted DCIR discharge capacity loss.


