
Greenhouse Gas Abatement in EUROPE—A Scenario-Based, Bottom-Up Analysis Showing the Effect of Deep Emission Mitigation on the European Energy System


Abstract
:1. Introduction
2. Materials and Methods
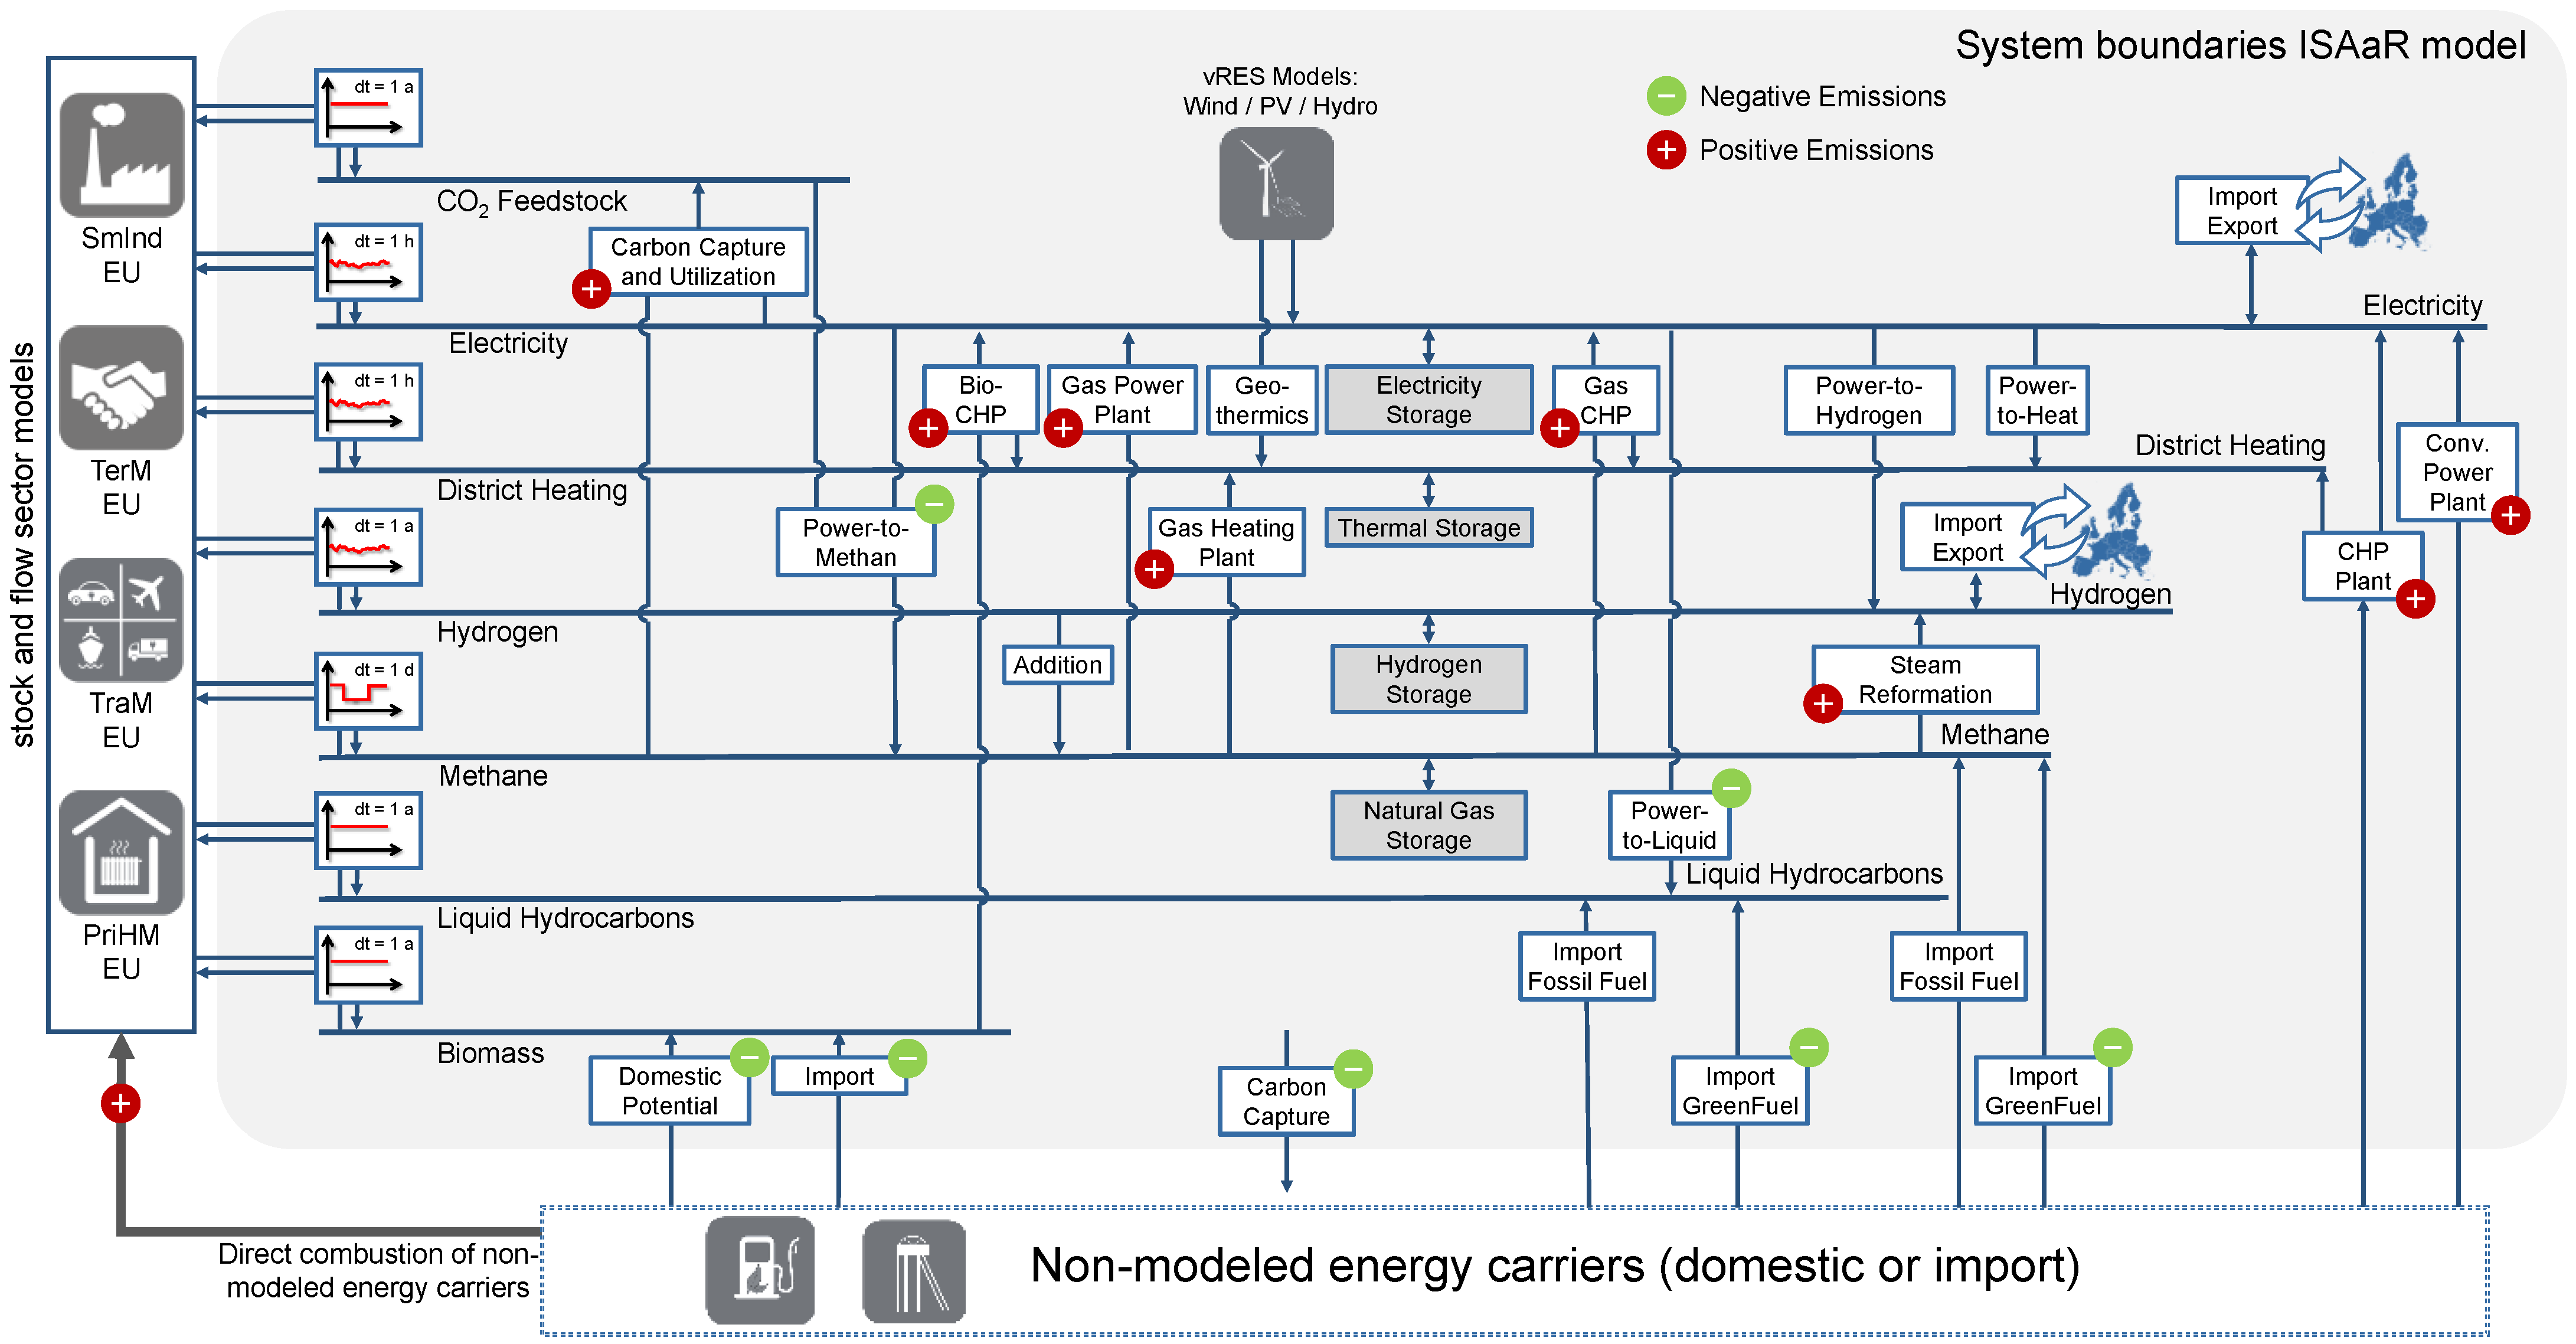
2.1. Model Landscape
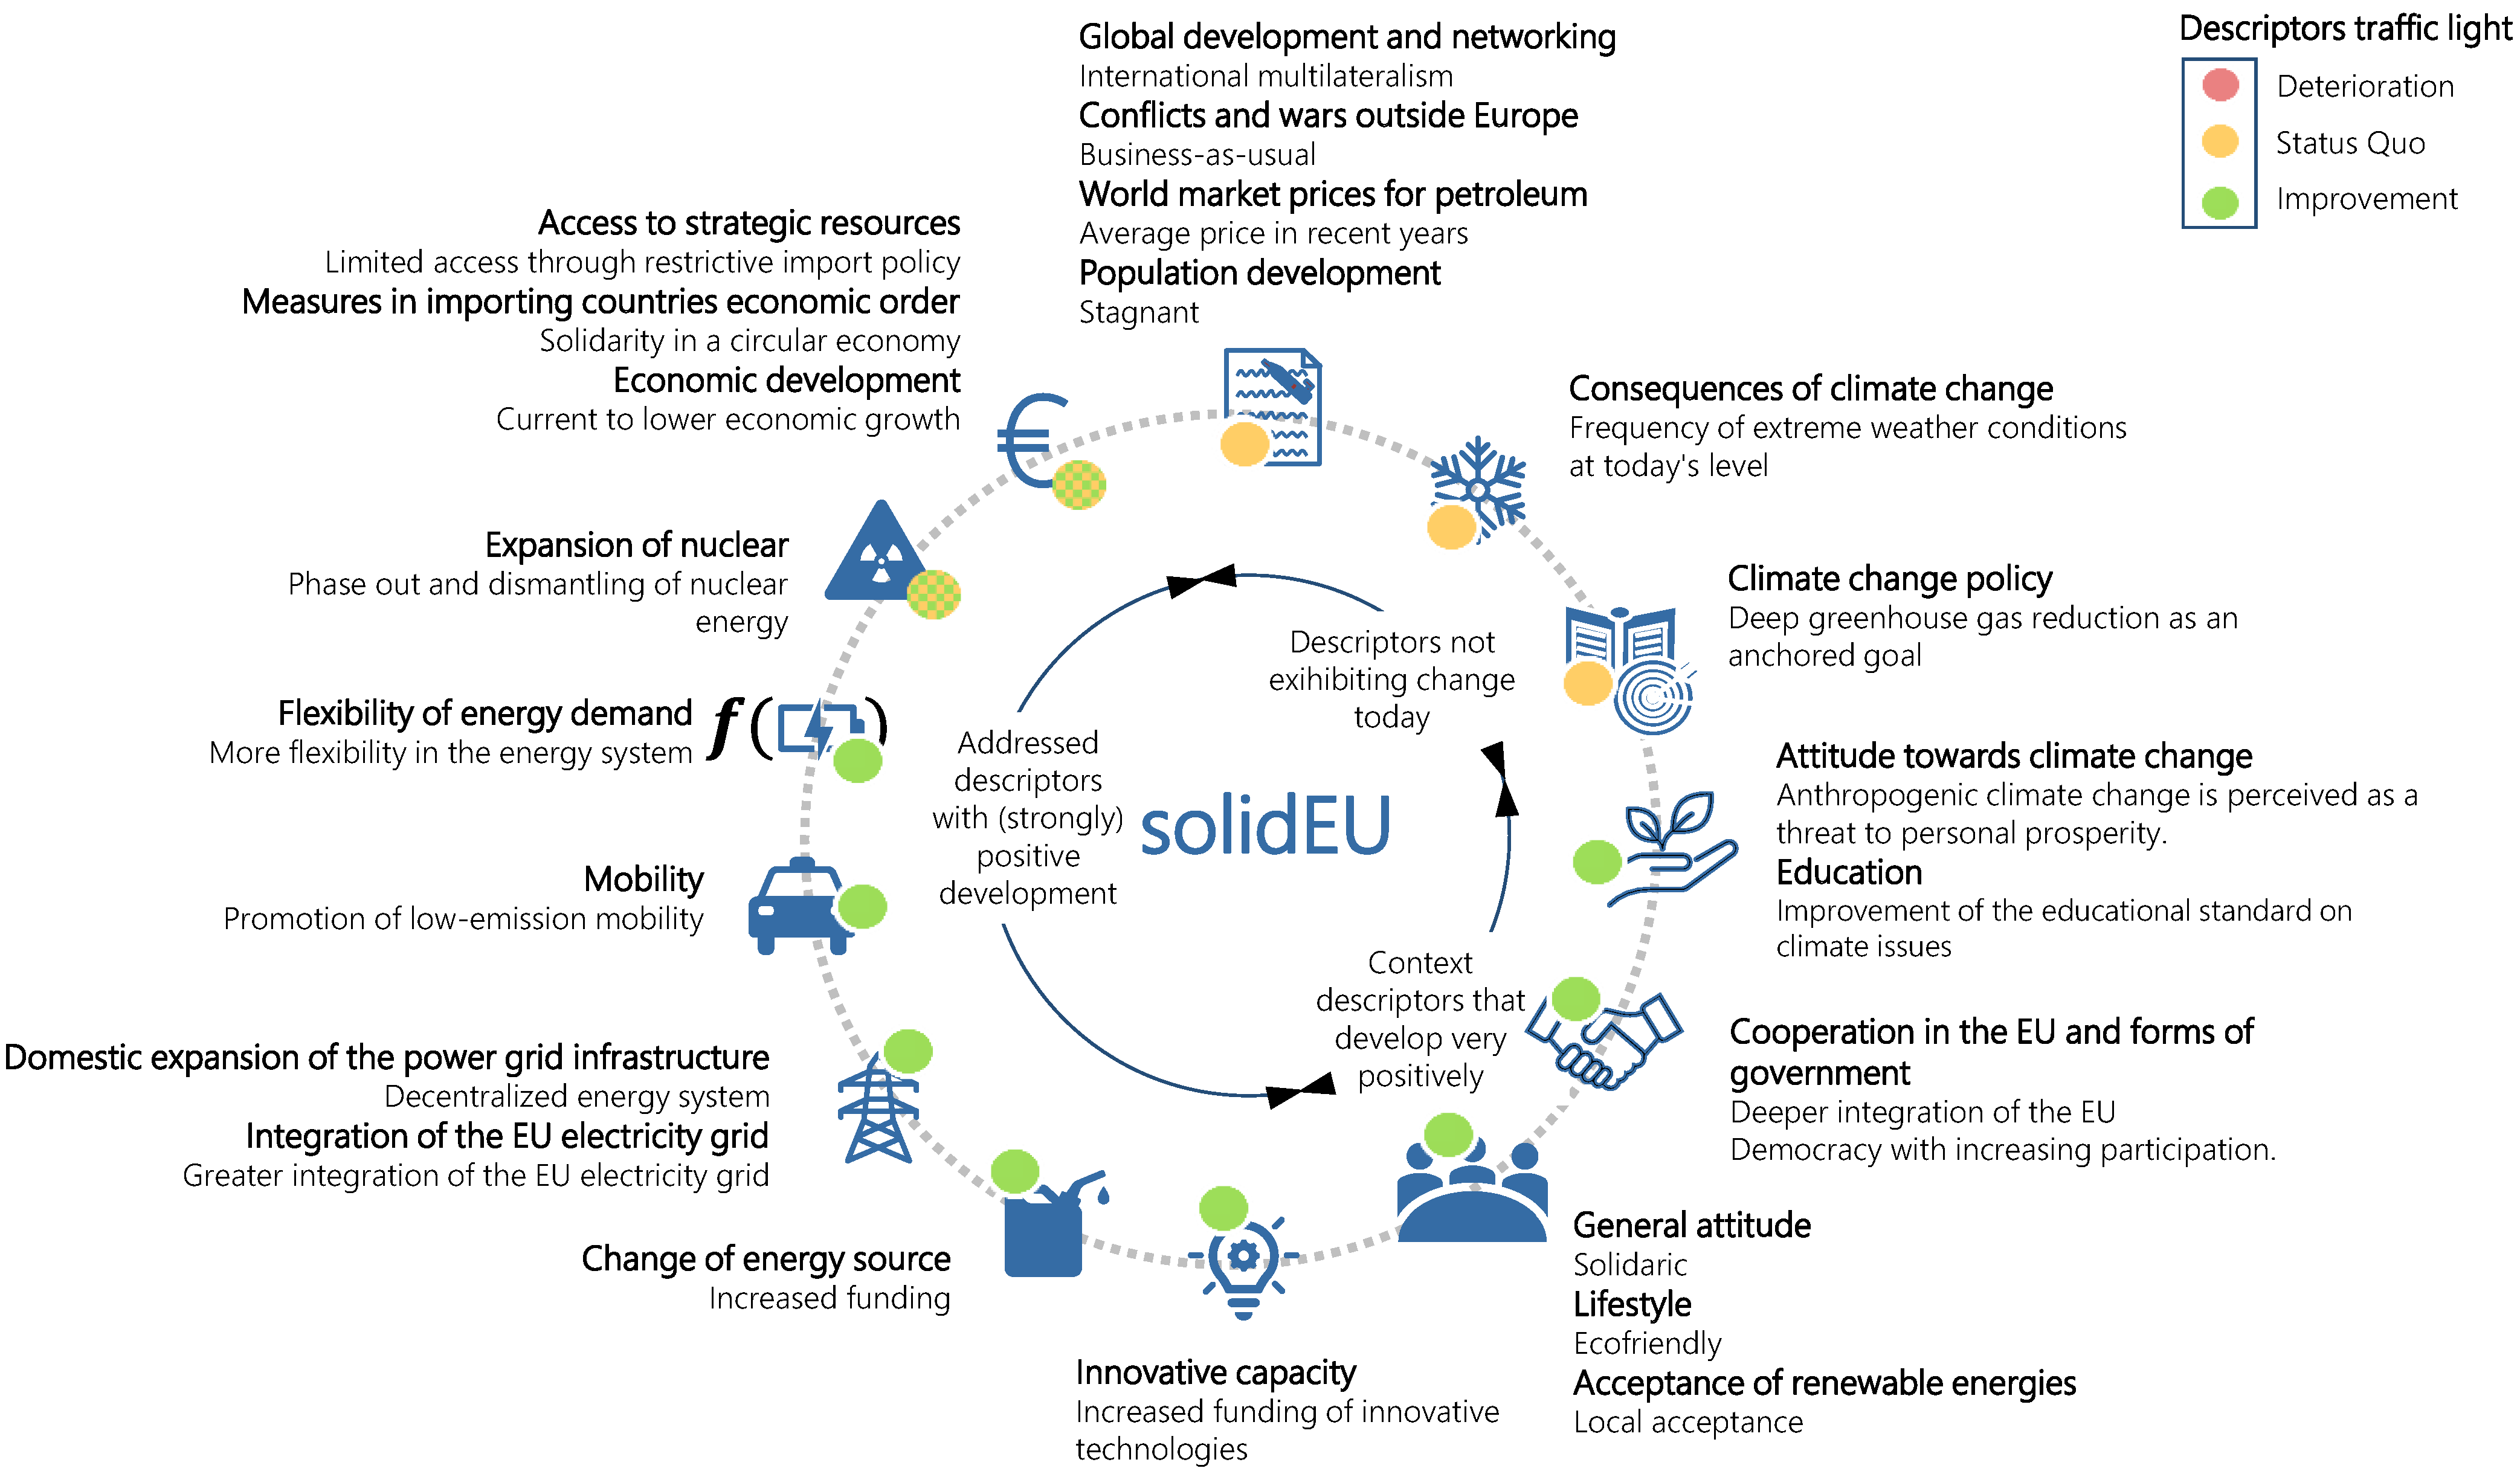
2.2. Quantifying the Storyline
3. Results
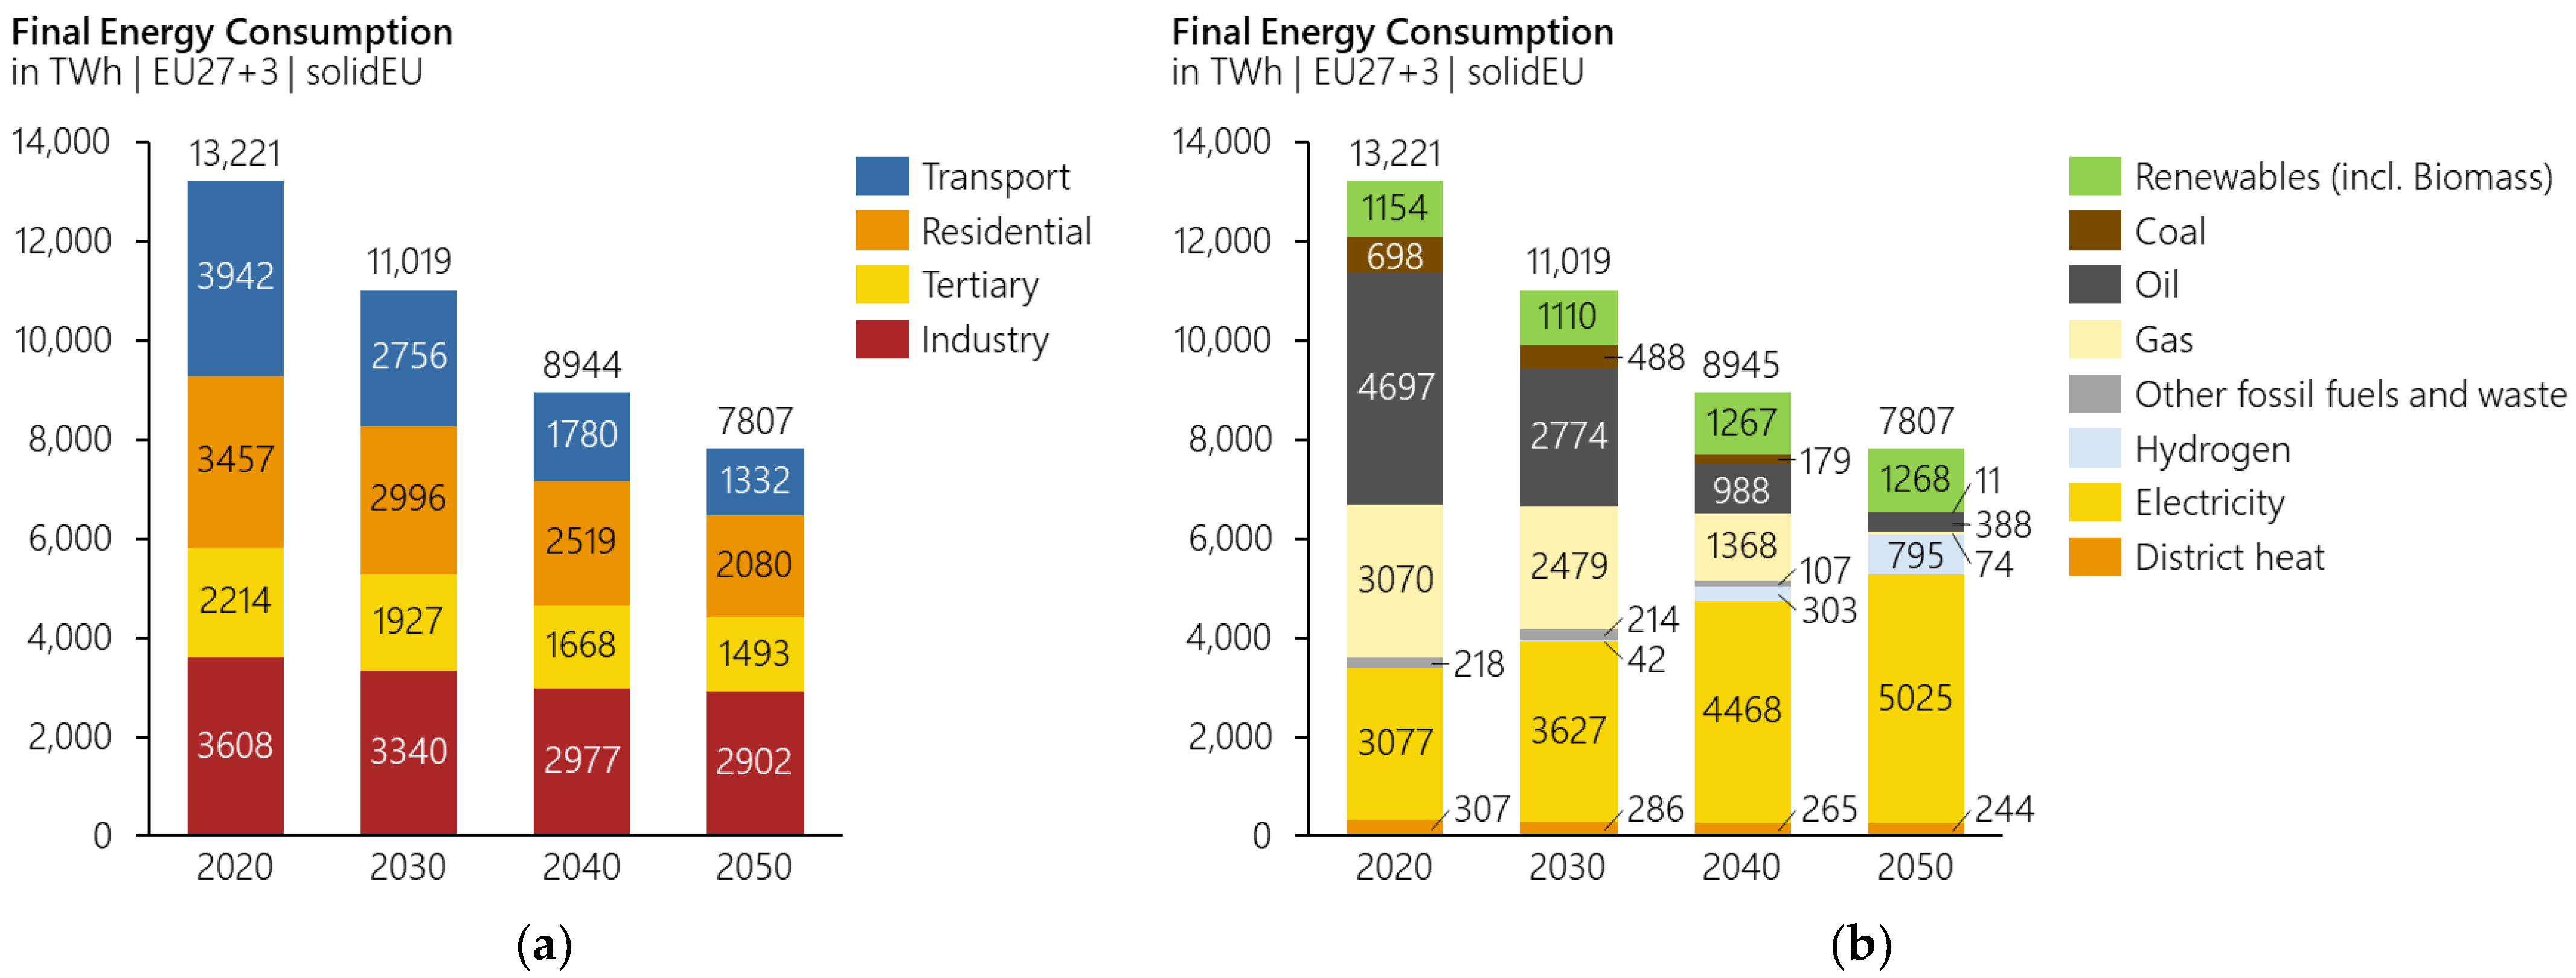
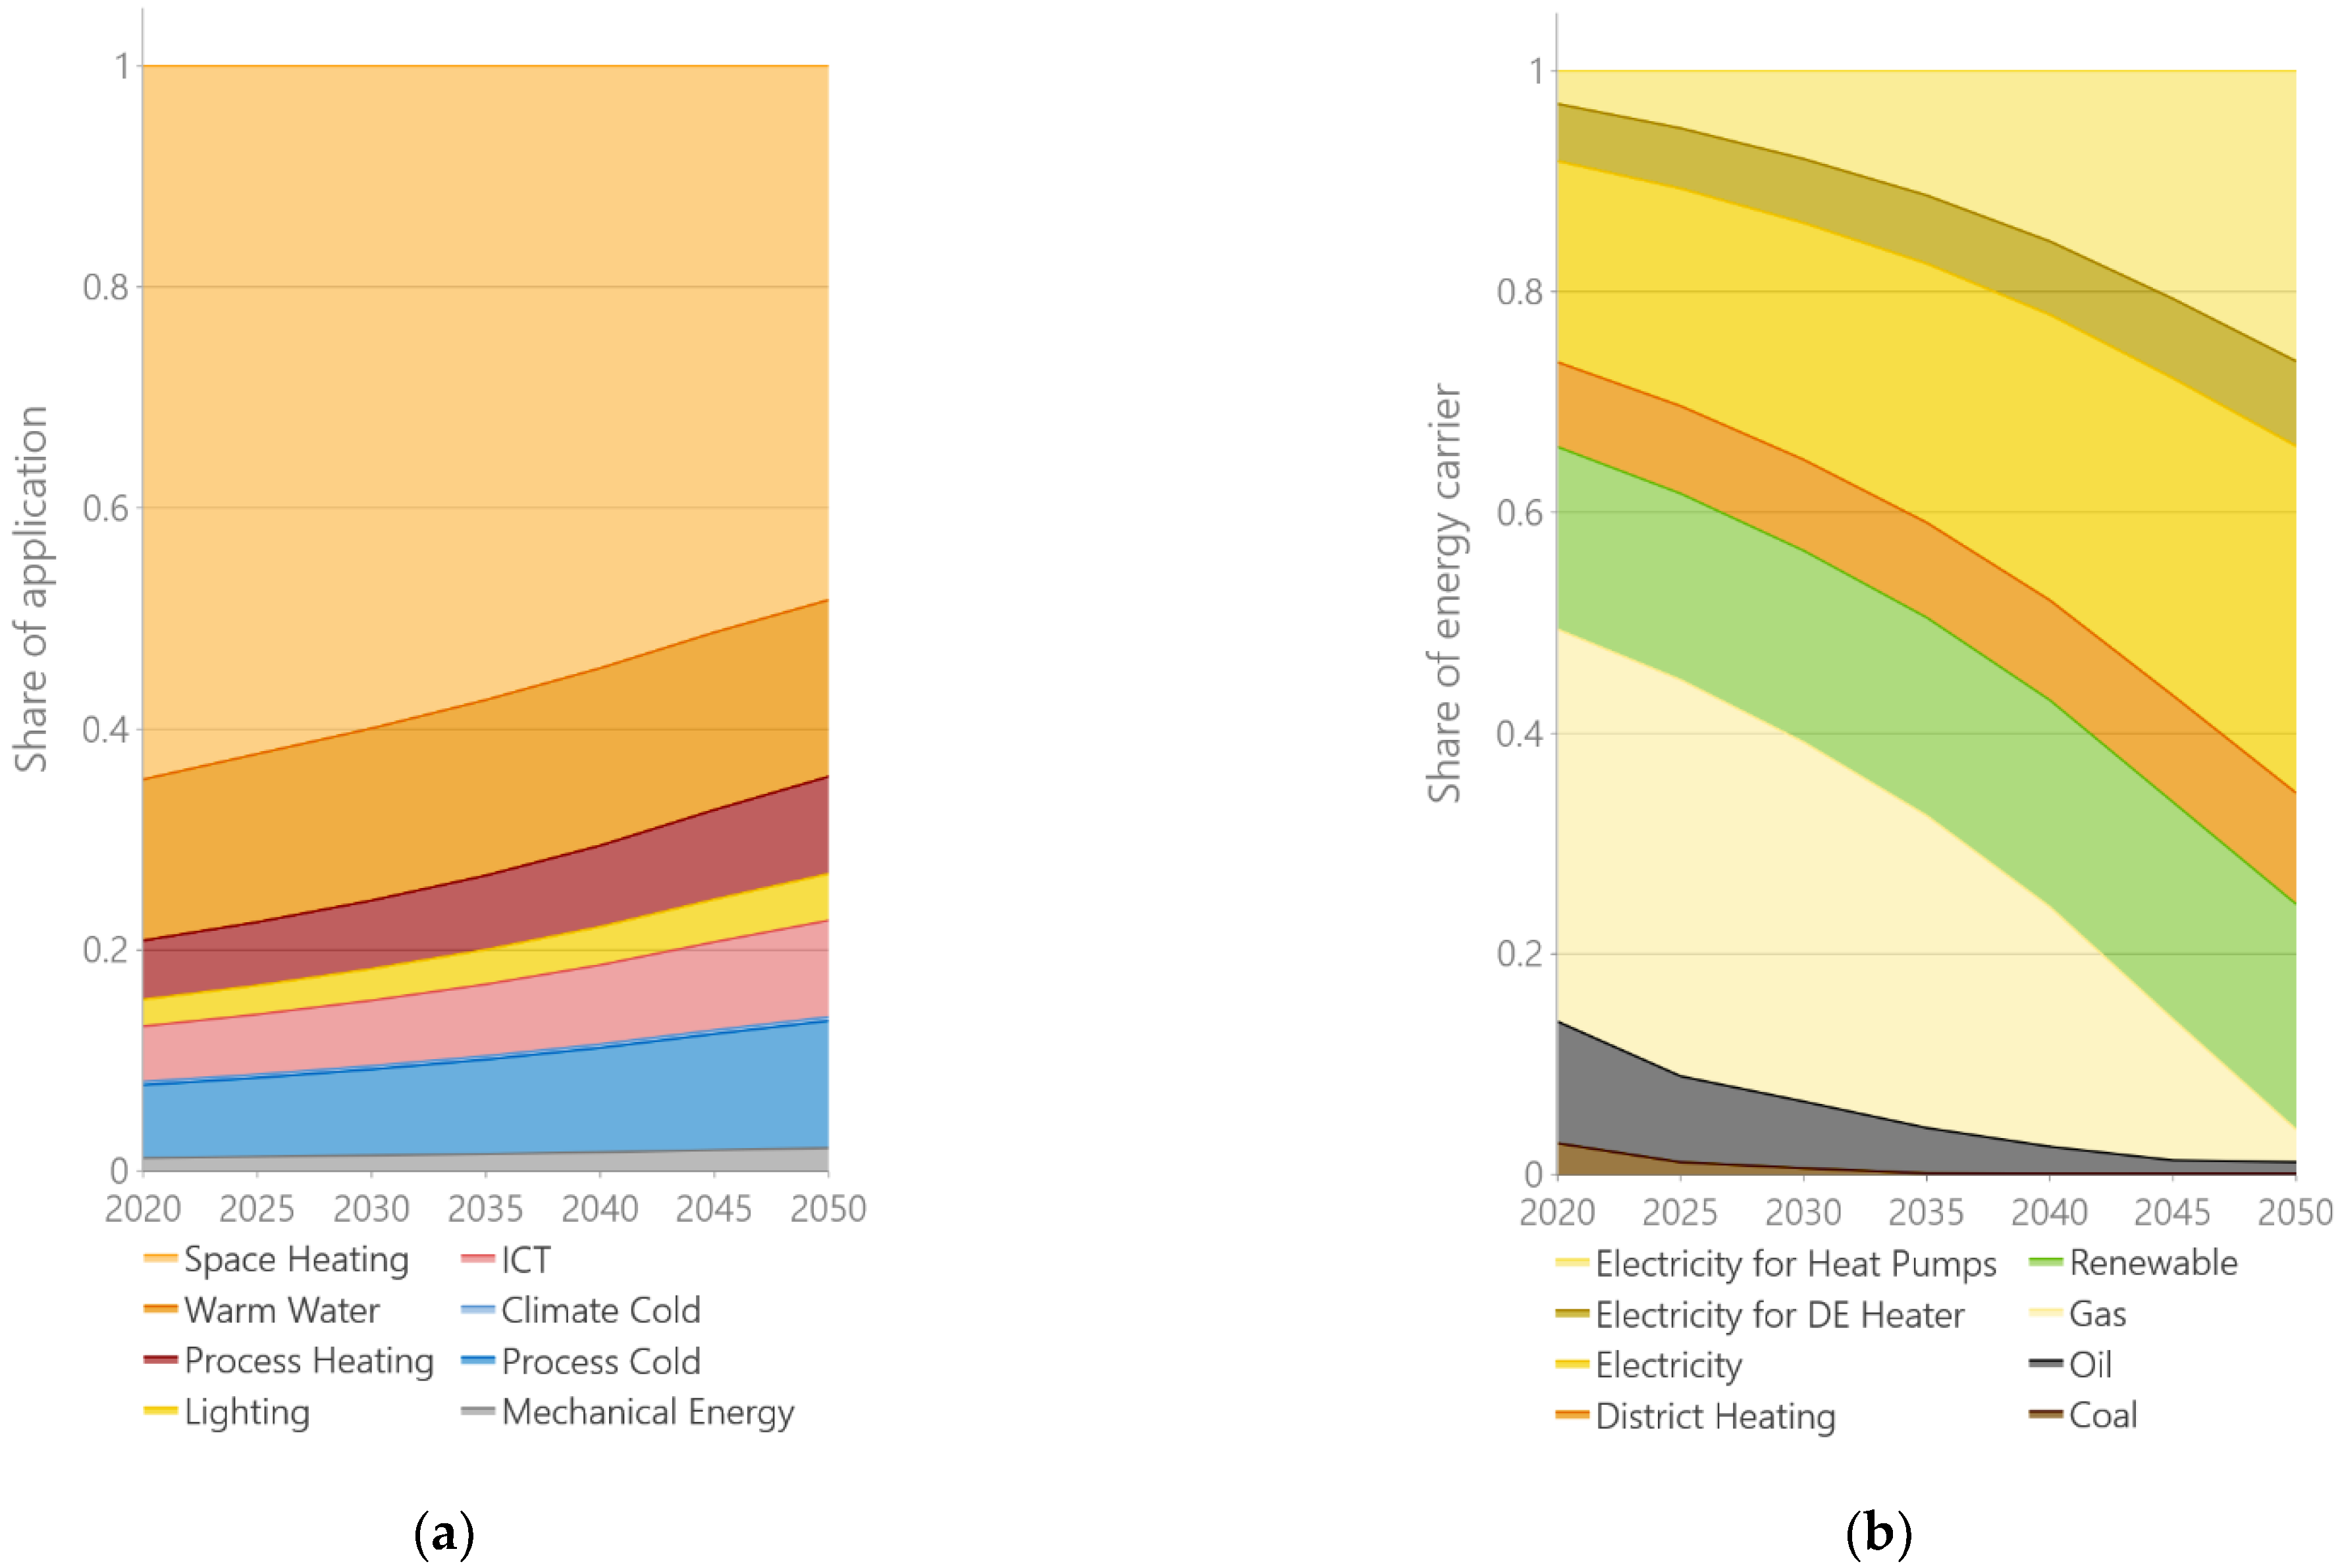
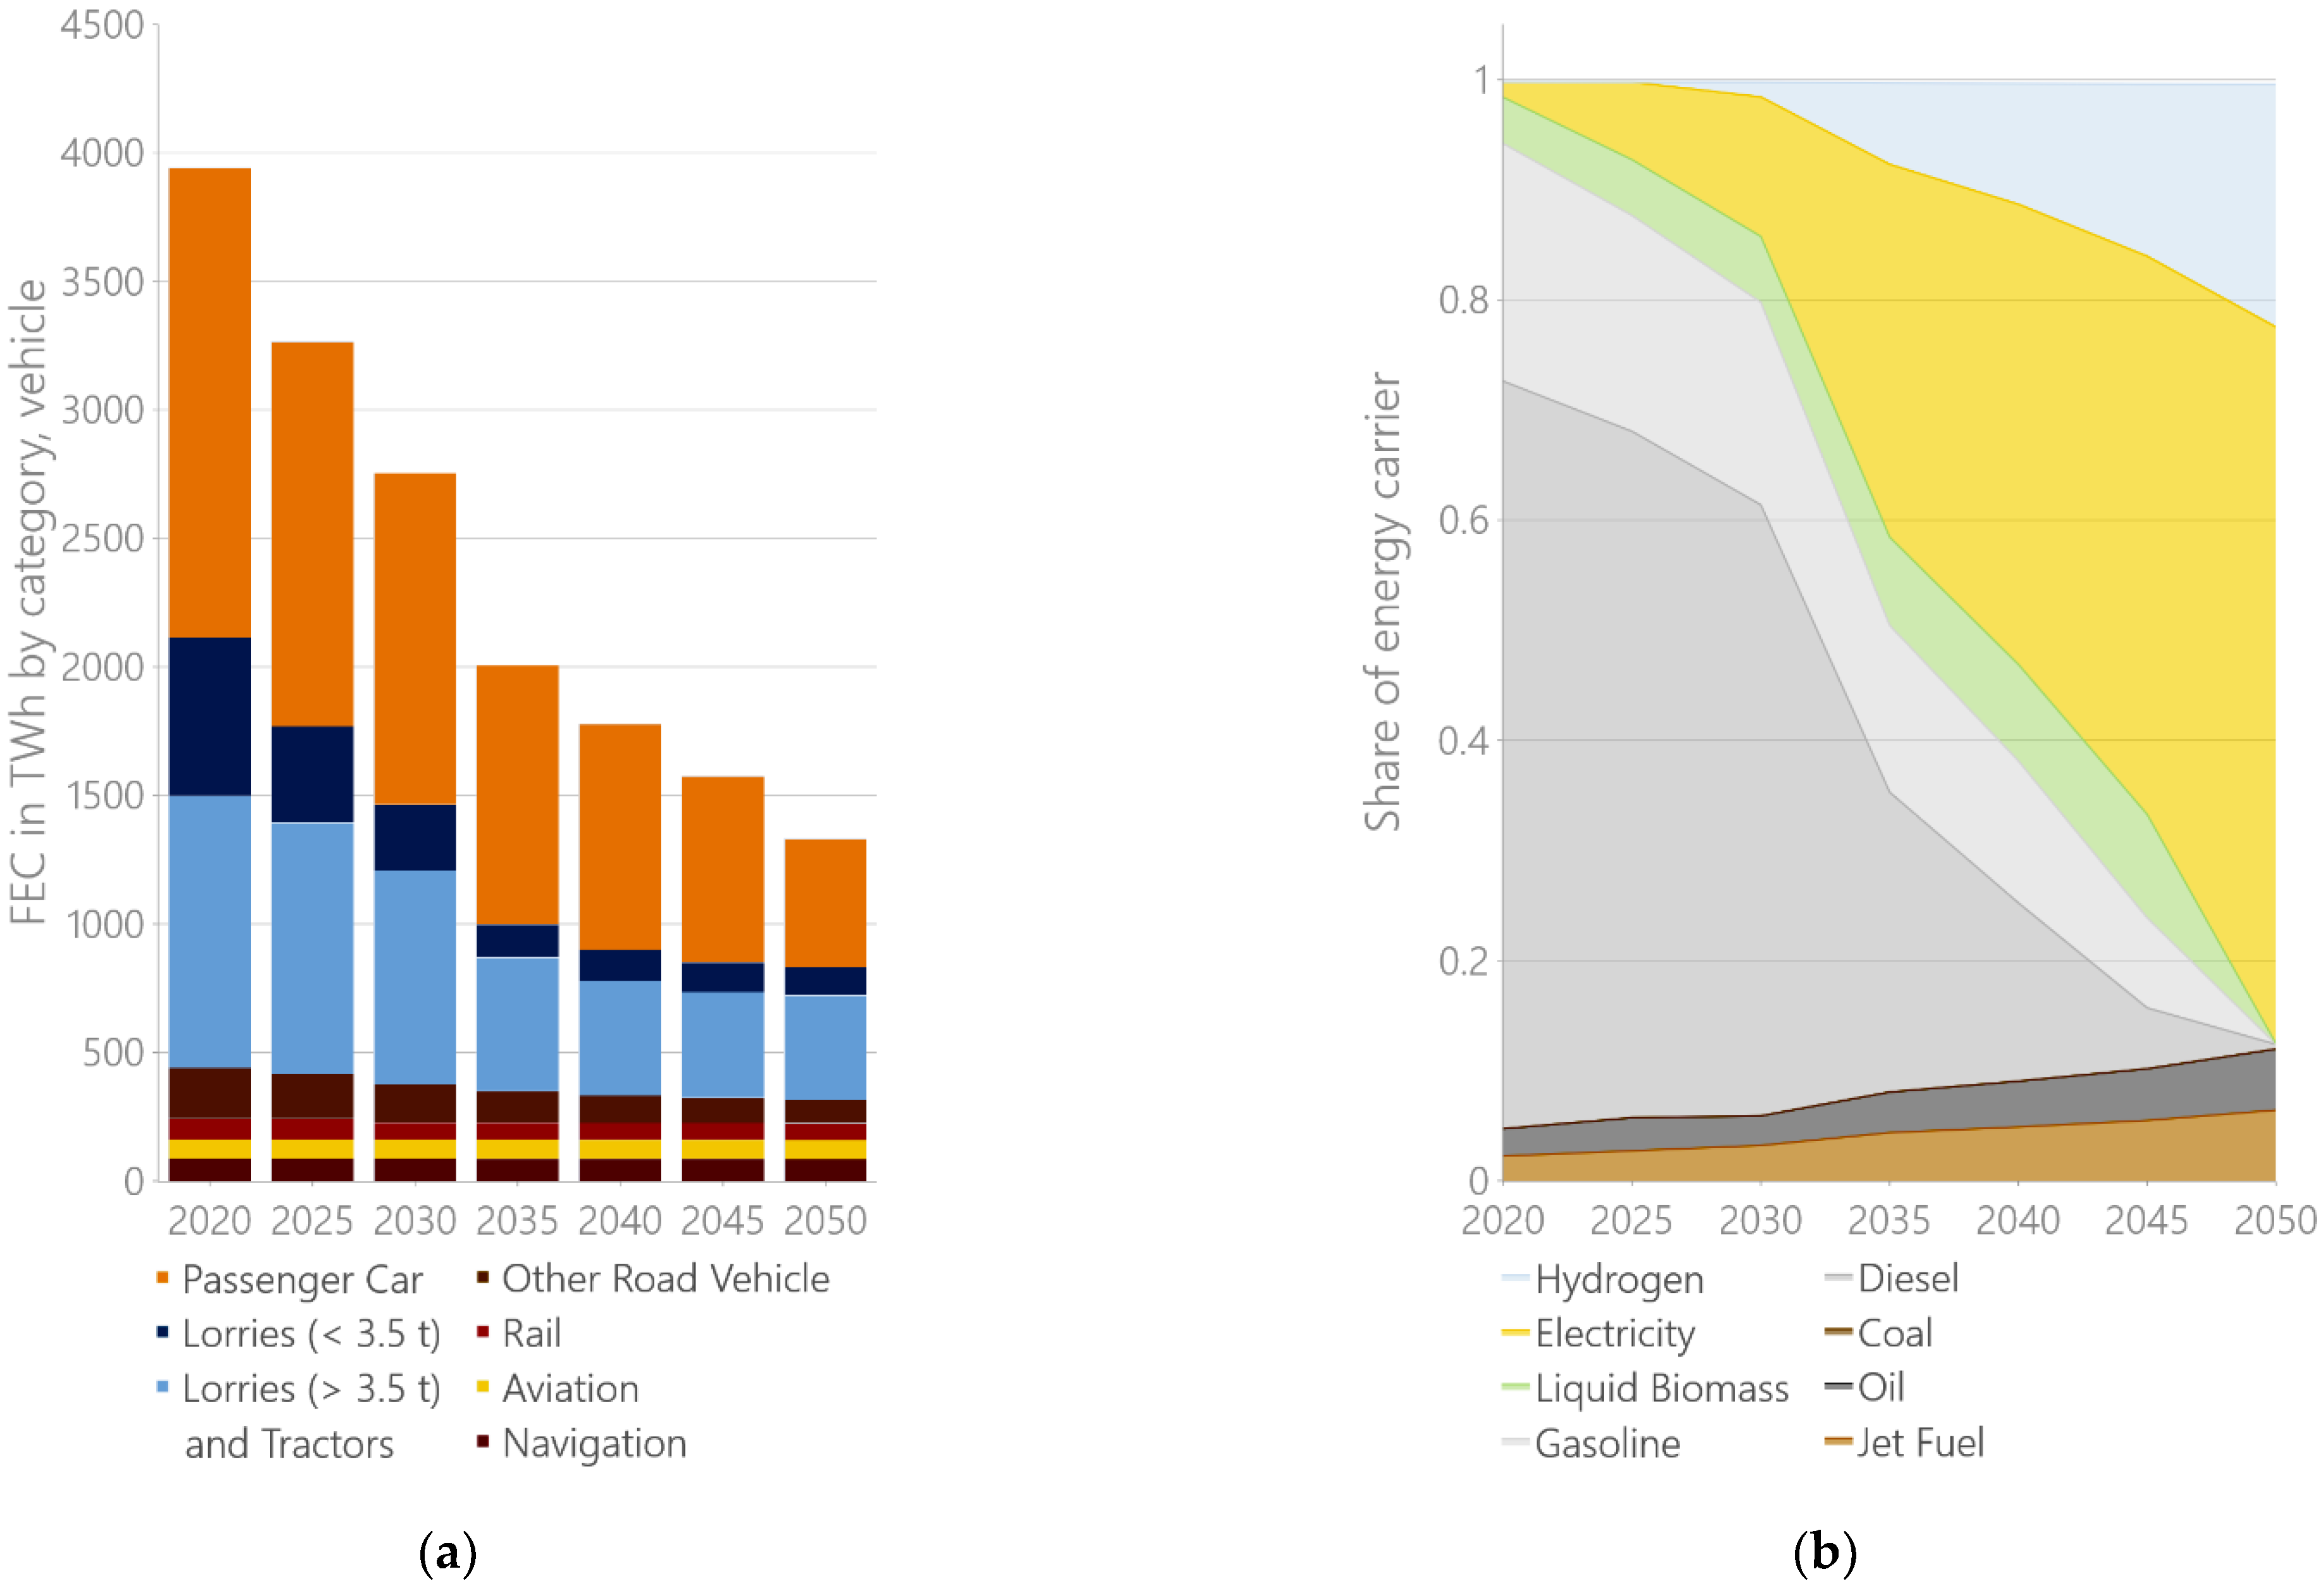
3.1. FEC Sectors
3.2. Energy Sector
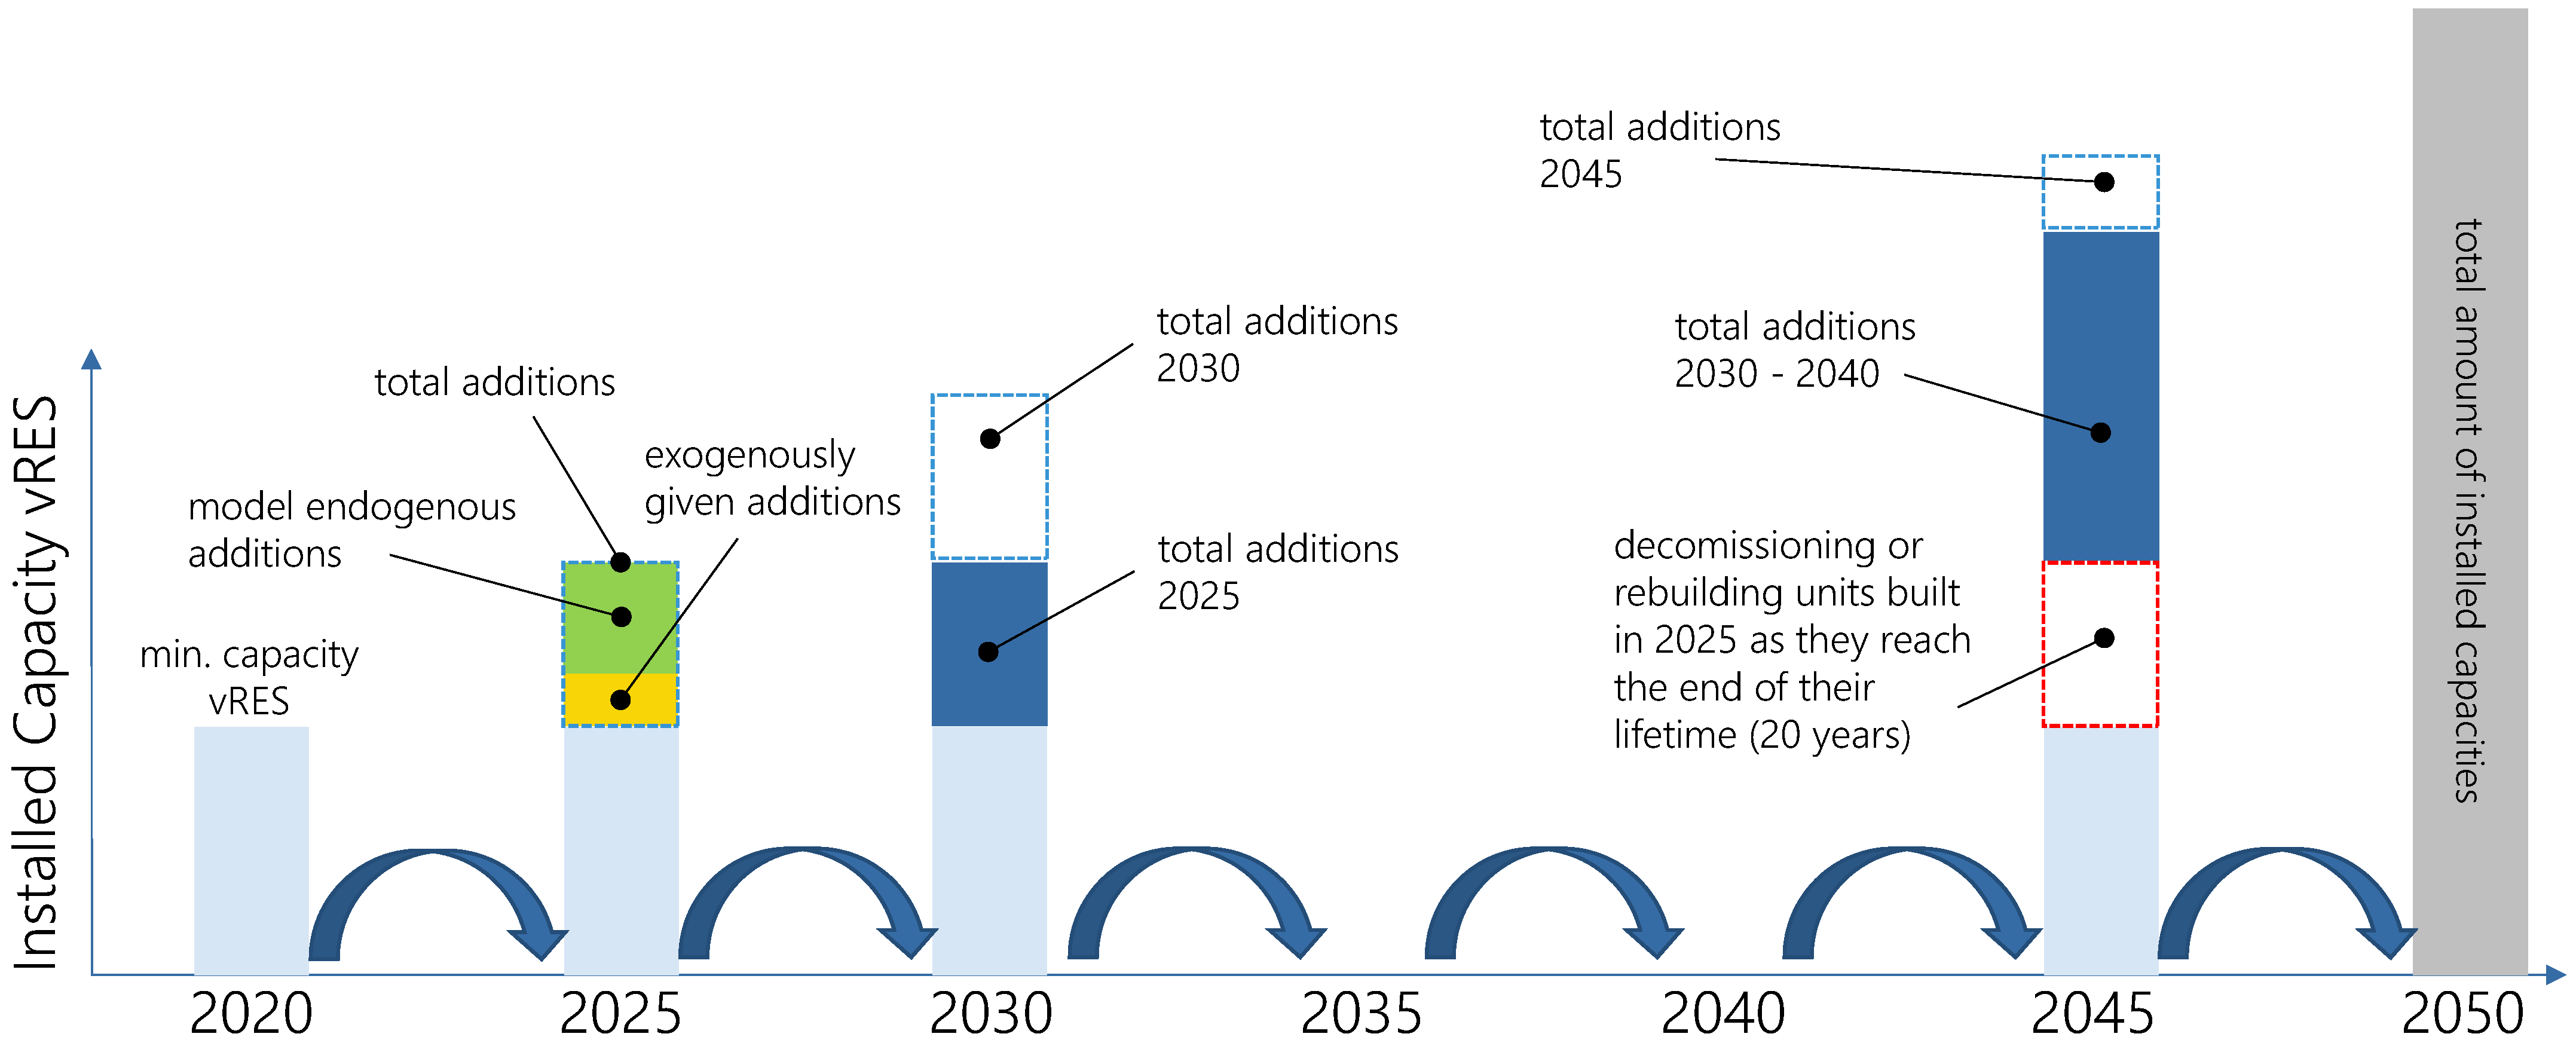
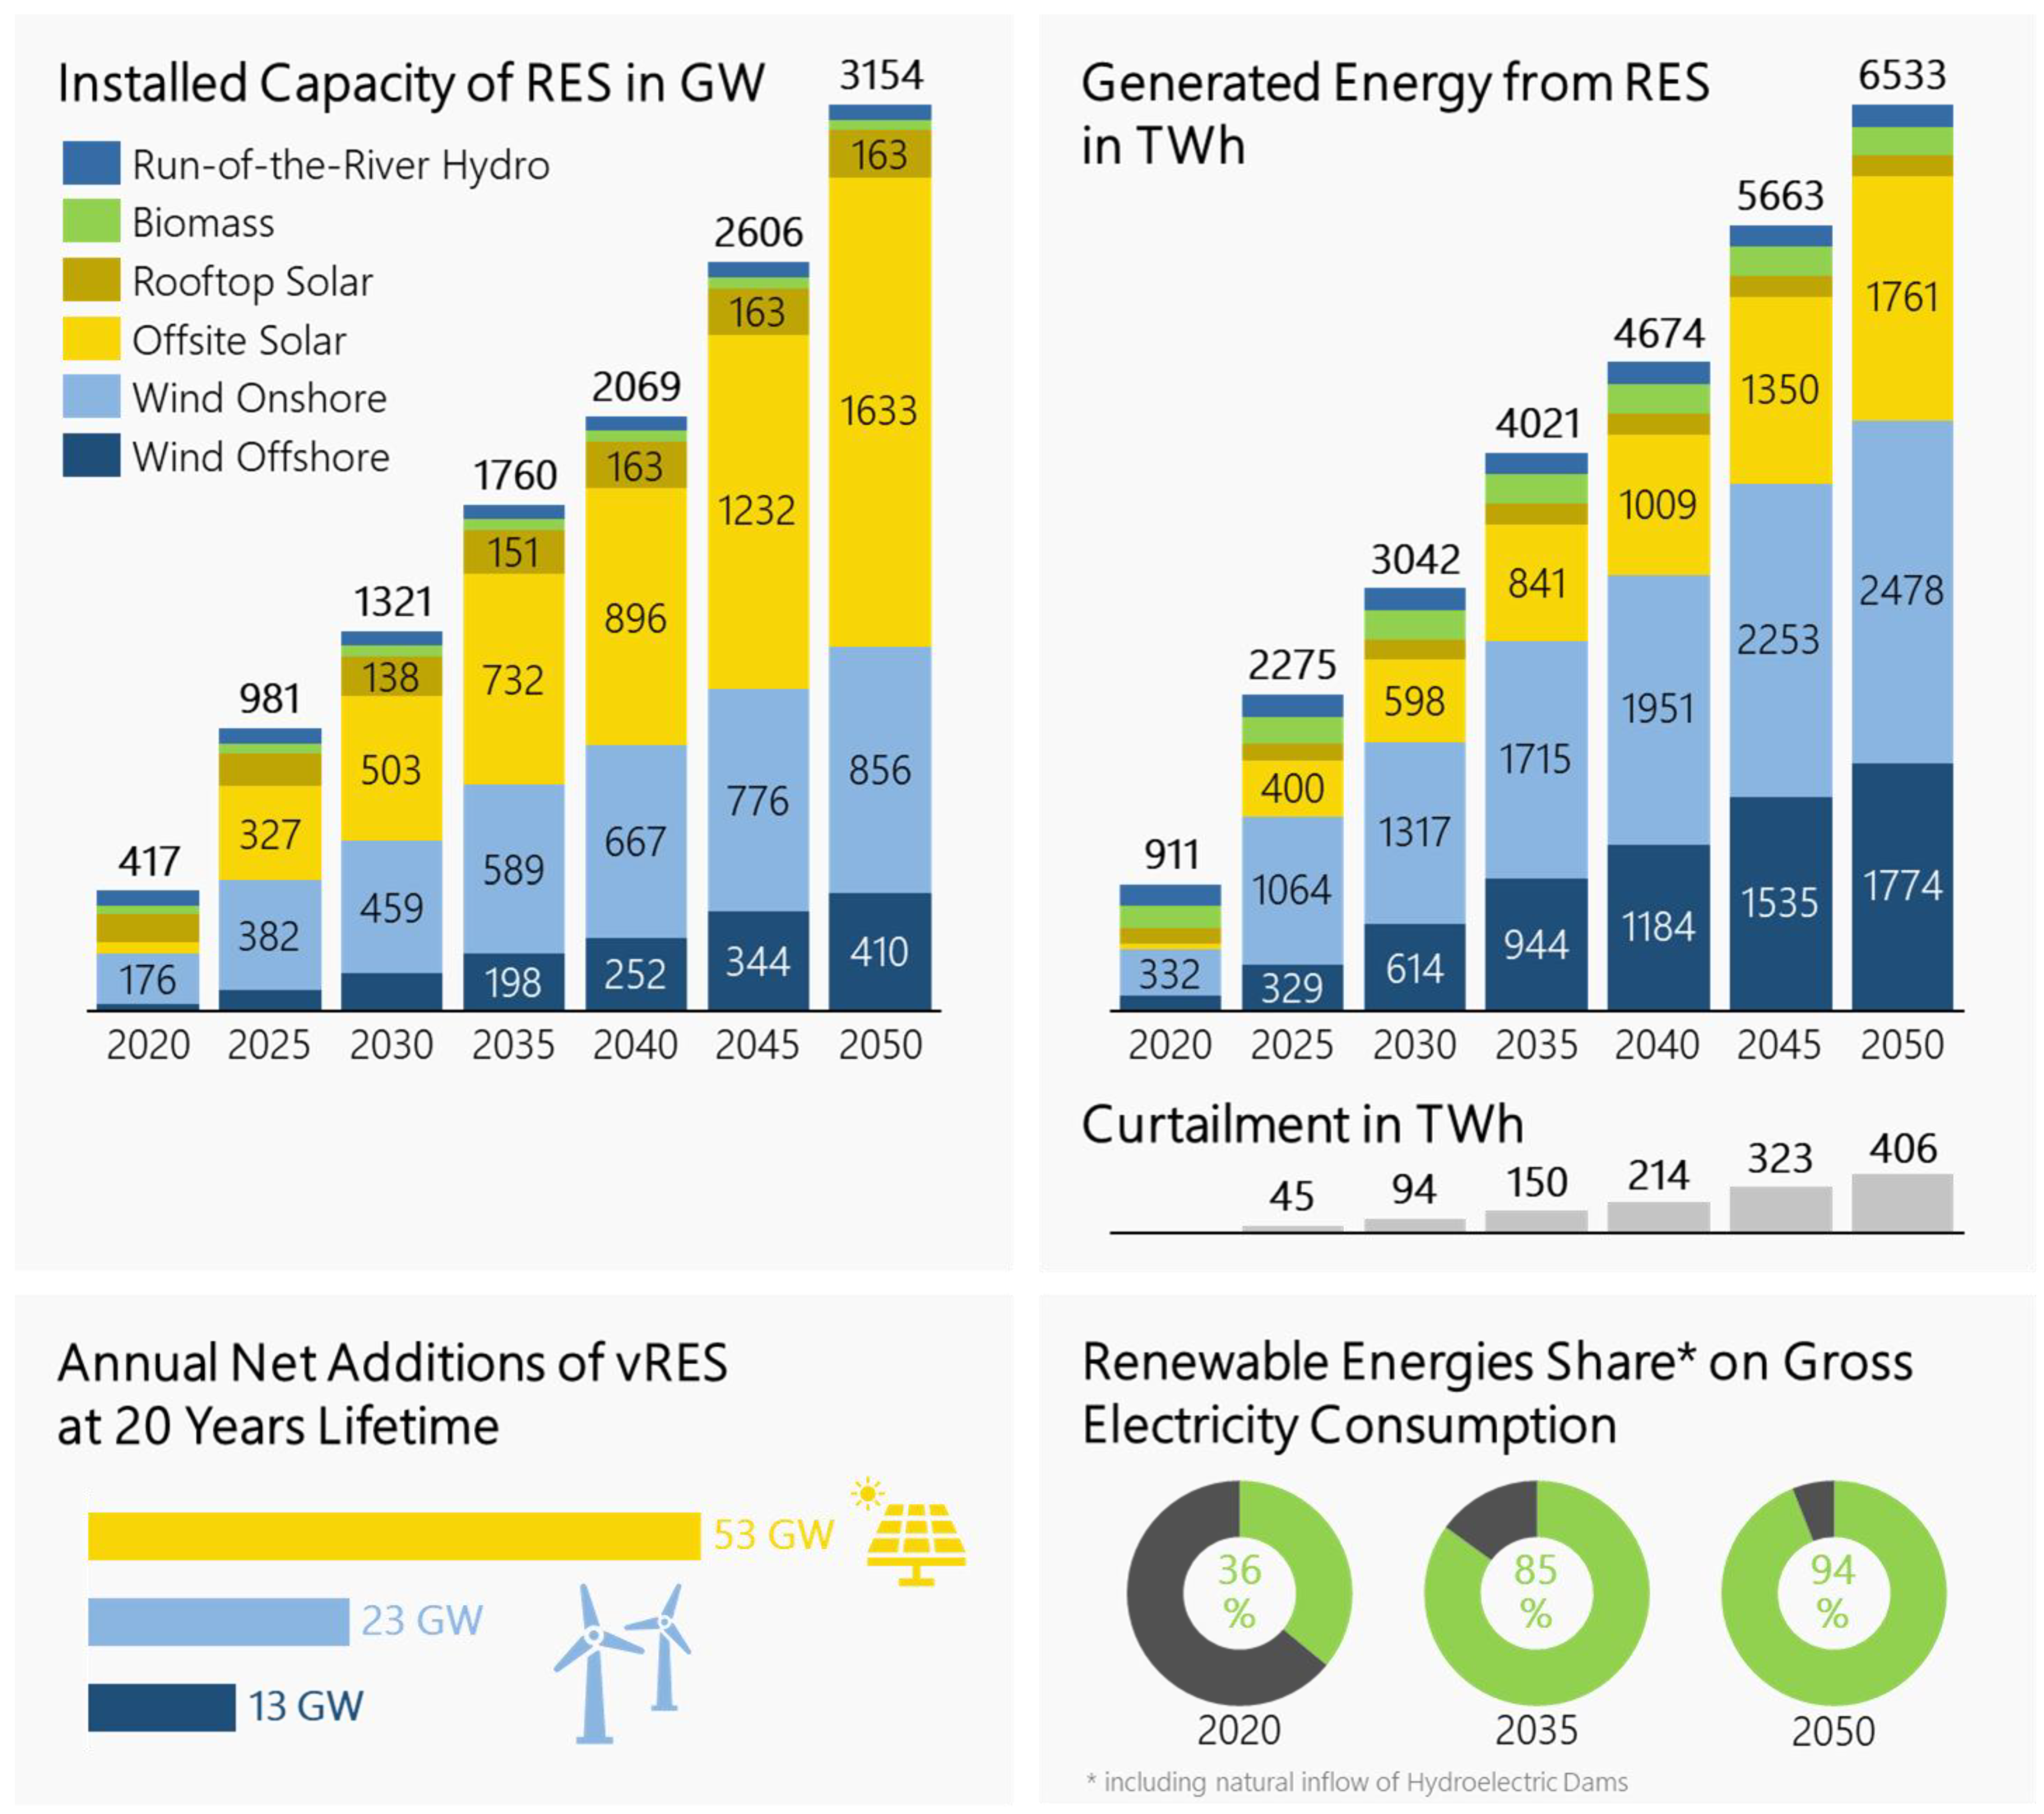
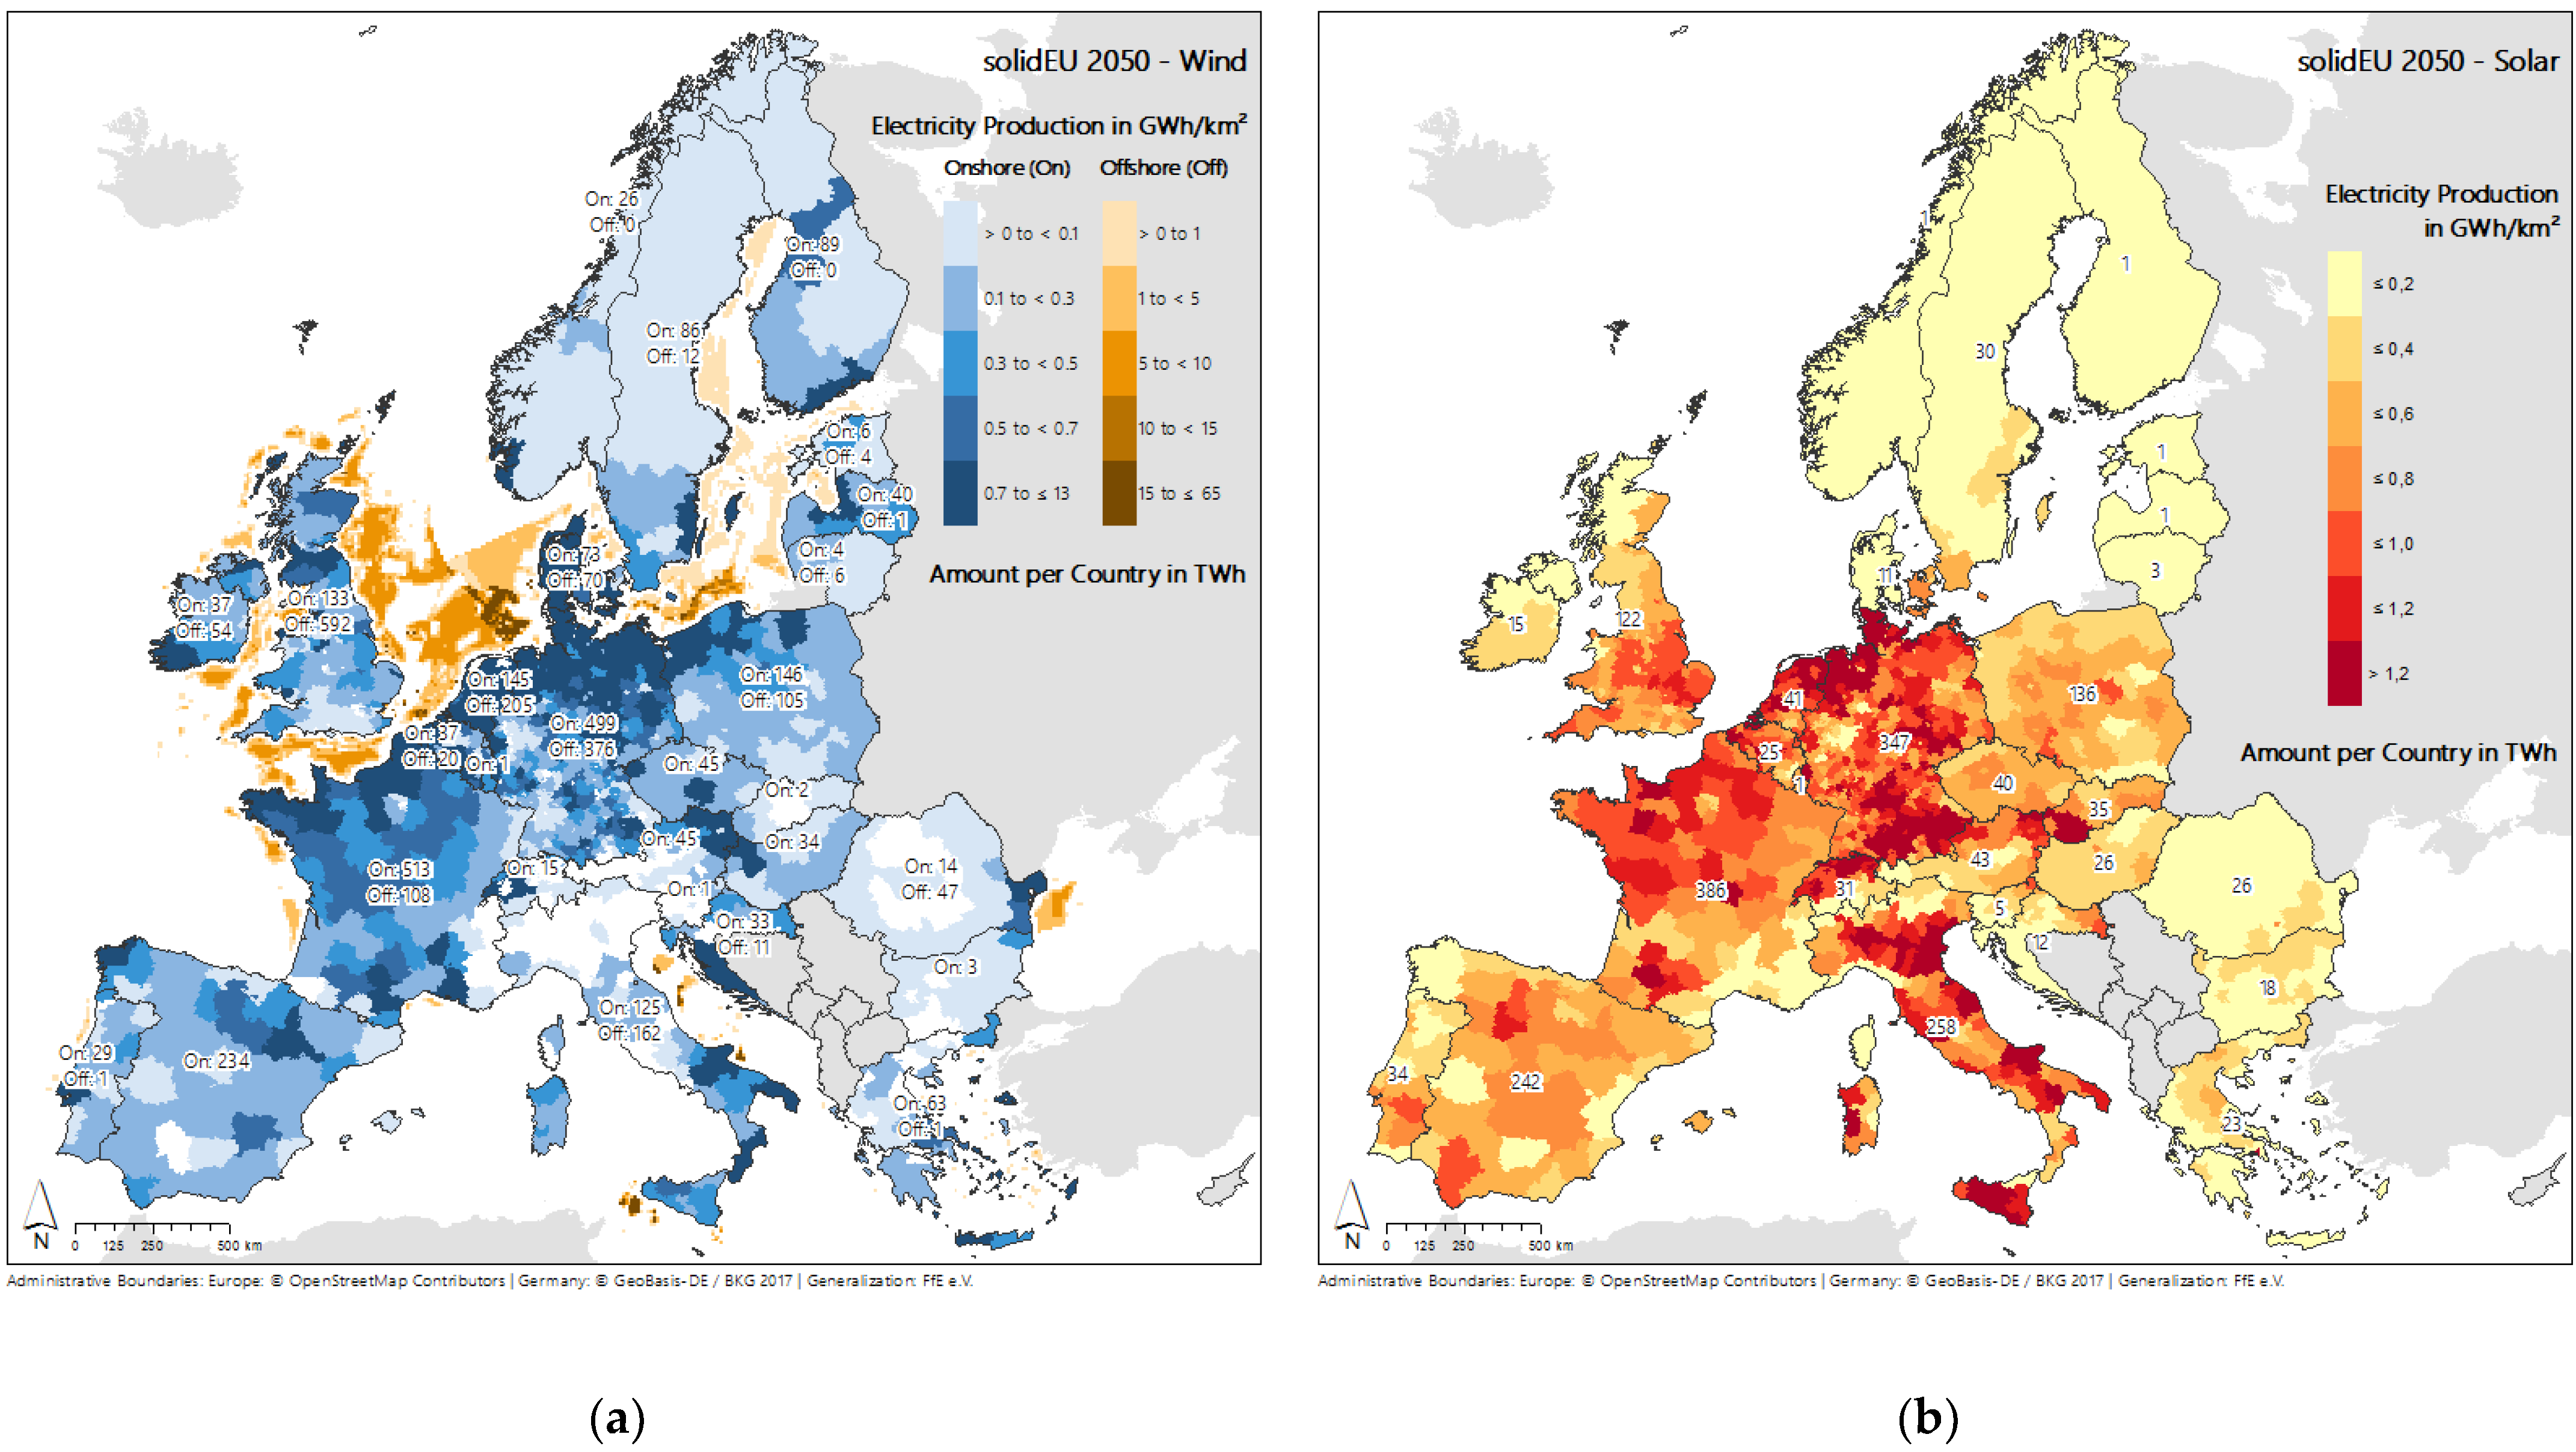
3.2.1. Generation Capacities
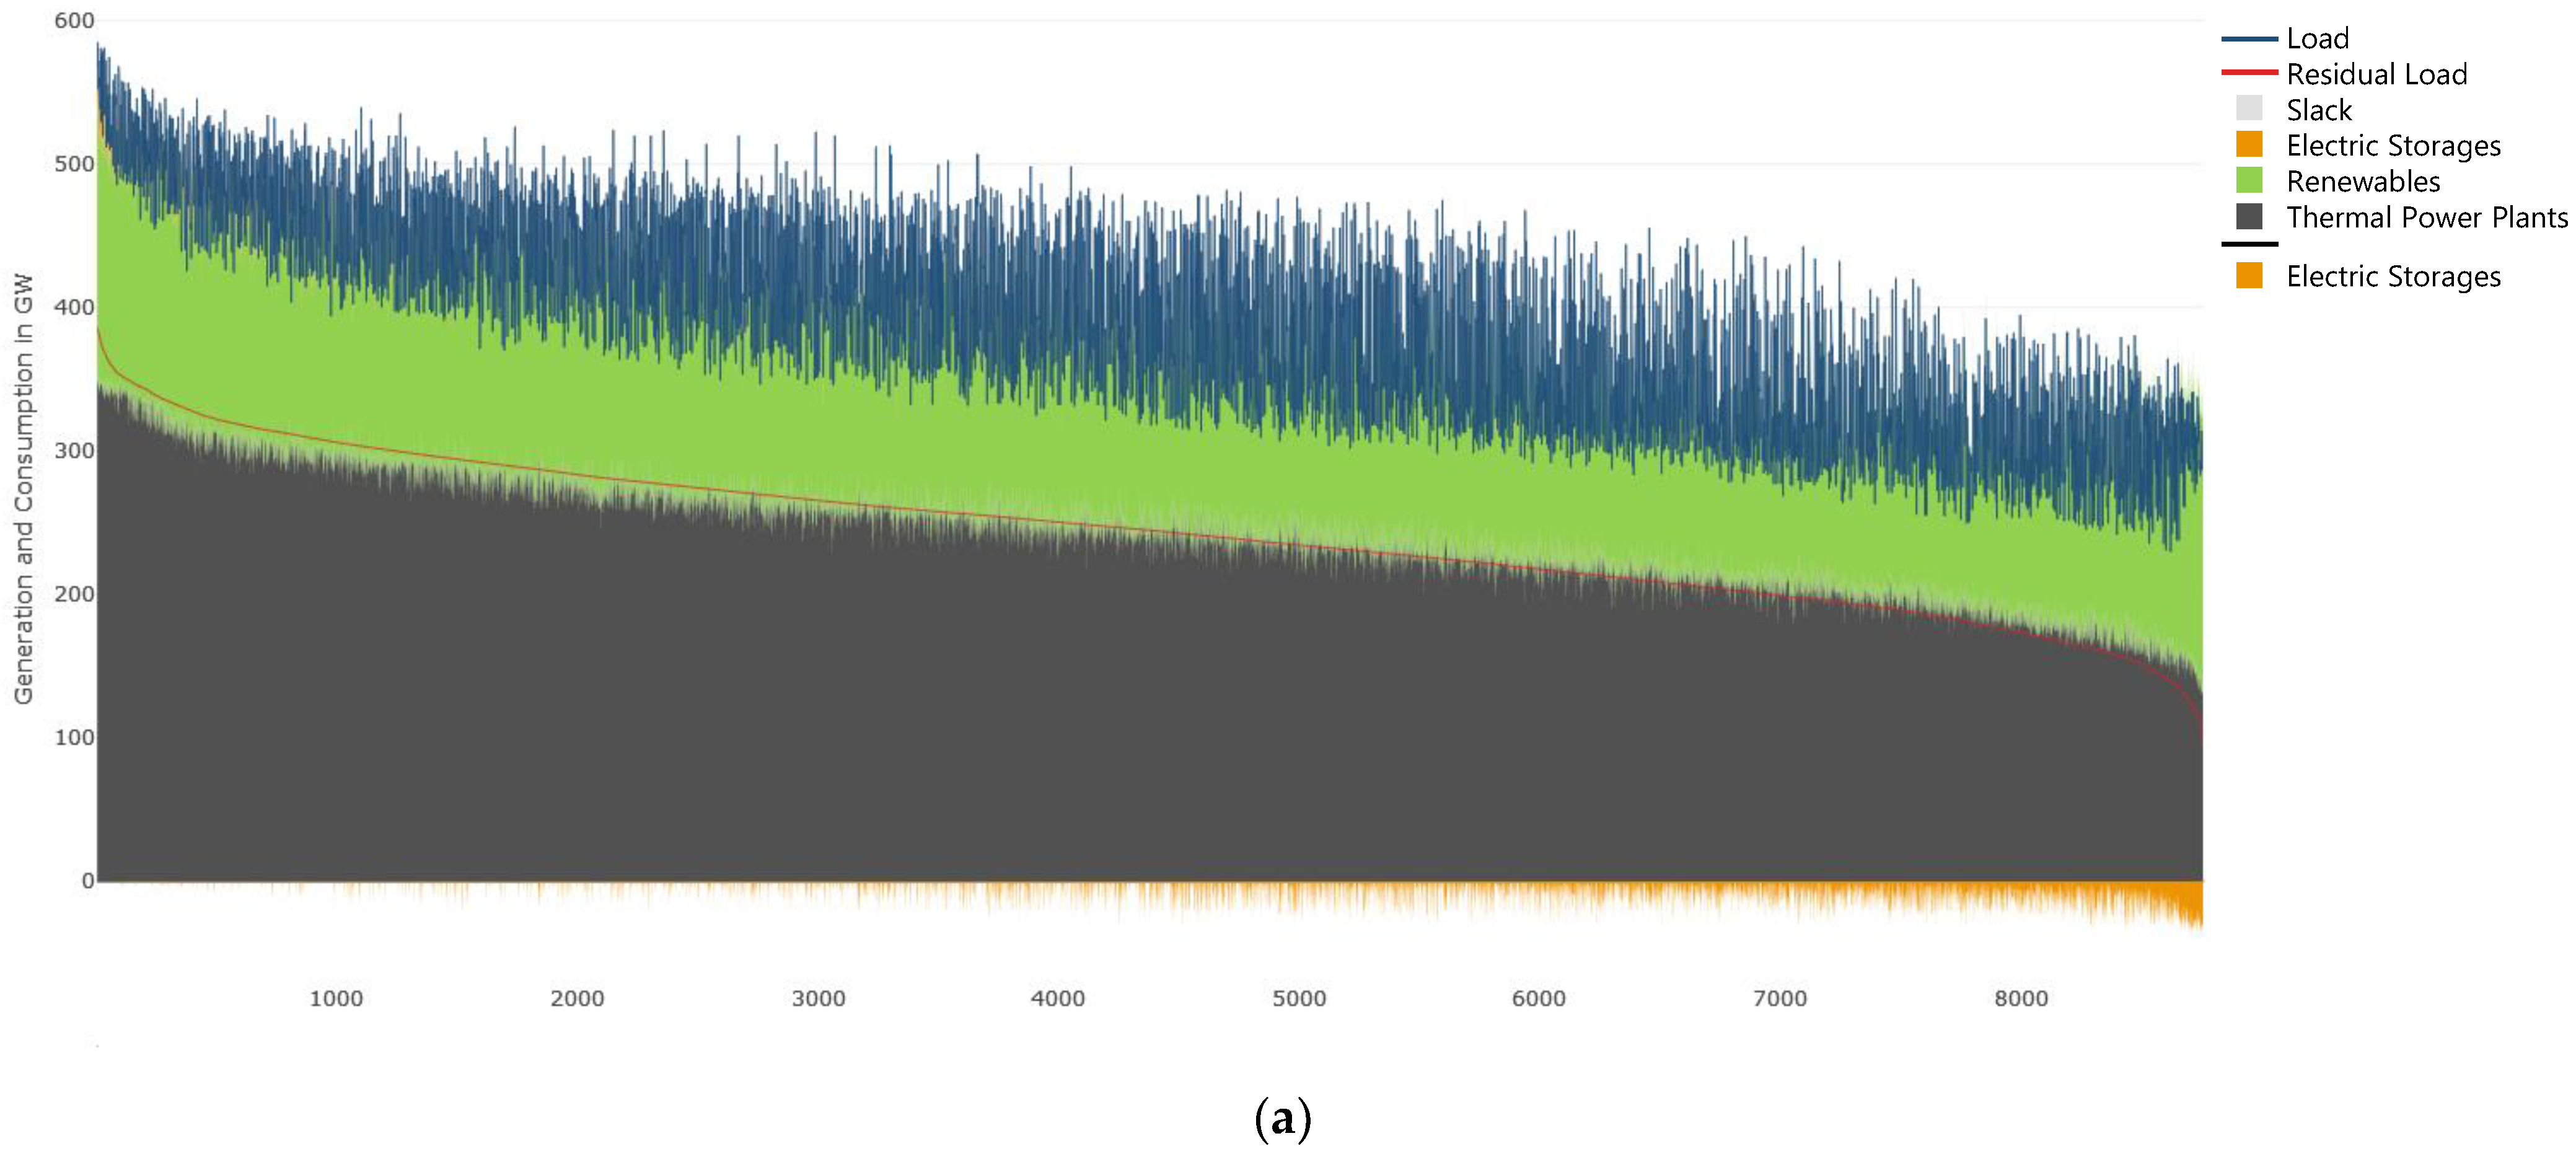
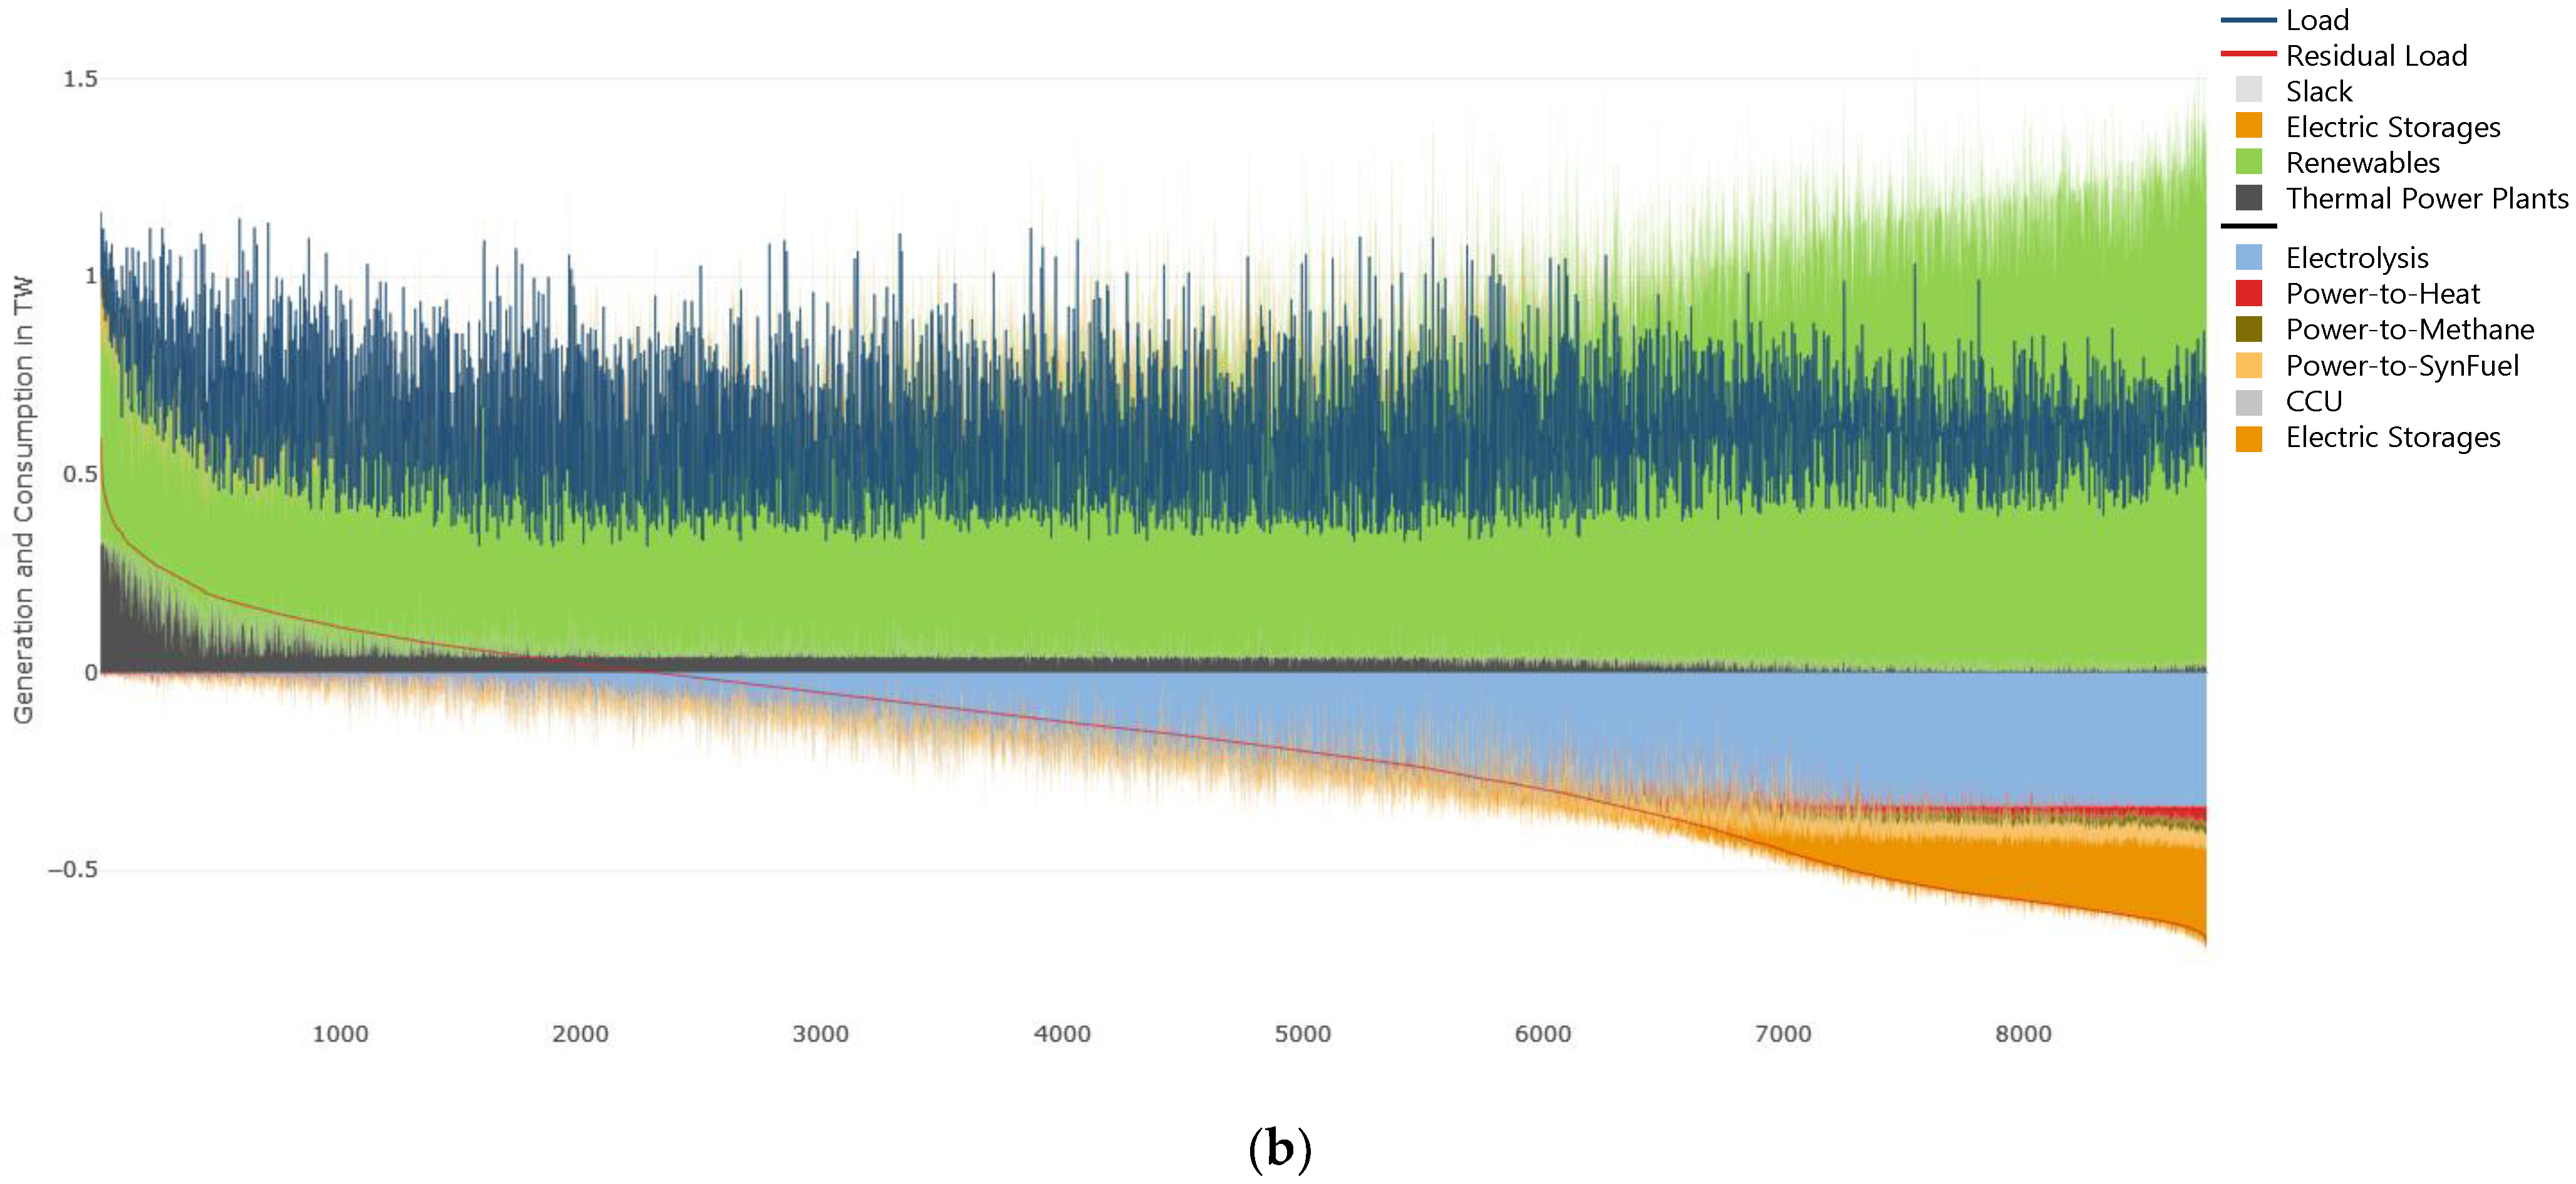
3.2.2. Energy Balance Electricity
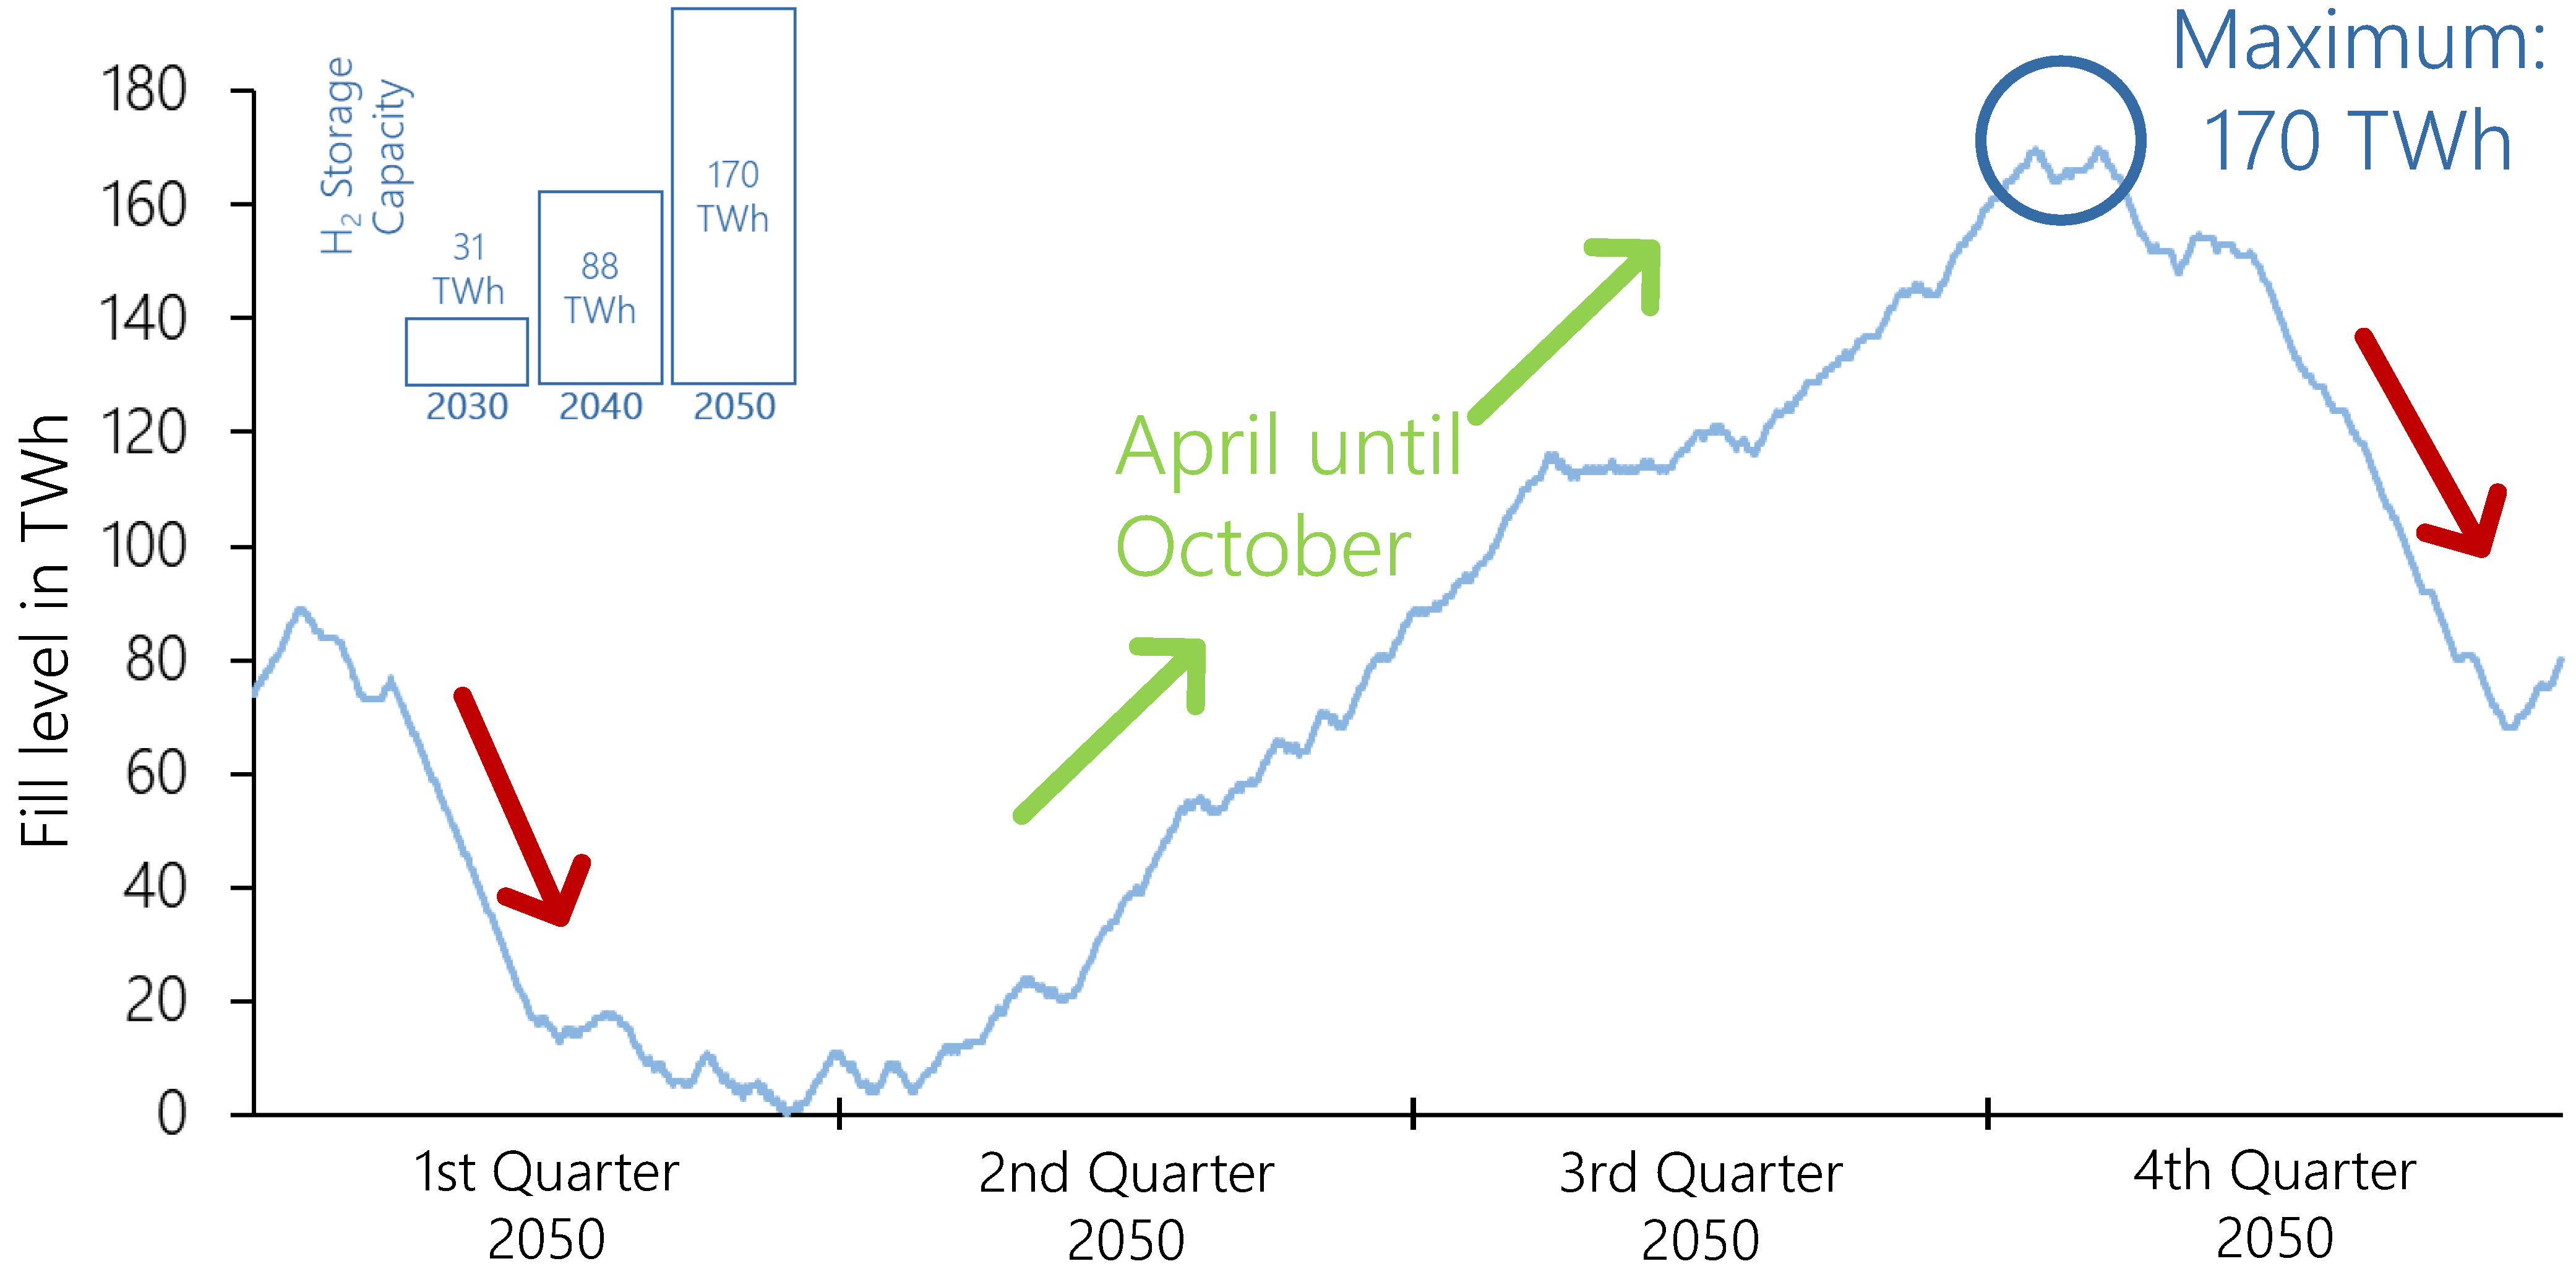
3.2.3. Hydrogen Generation
4. Discussion
5. Conclusions
Author Contributions
Funding
Data Availability Statement
Acknowledgments
Conflicts of Interest
References
- Borasio, M.; Moret, S. Deep Decarbonisation of Regional Energy Systems: A Novel Modelling Approach and Its Application to the Italian Energy Transition. Renew. Sustain. Energy Rev. 2022, 153, 111730. [Google Scholar] [CrossRef]
- Fortes, P.; Simoes, S.G.; Gouveia, J.P.; Seixas, J. Electricity, the Silver Bullet for the Deep Decarbonisation of the Energy System? Cost-Effectiveness Analysis for Portugal. Appl. Energy 2019, 237, 292–303. [Google Scholar] [CrossRef]
- Prina, M.G.; Lionetti, M.; Manzolini, G.; Sparber, W.; Moser, D. Transition Pathways Optimization Methodology through EnergyPLAN Software for Long-Term Energy Planning. Appl. Energy 2019, 235, 356–368. [Google Scholar] [CrossRef]
- Hansen, K.; Mathiesen, B.V.; Skov, I.R. Full Energy System Transition towards 100% Renewable Energy in Germany in 2050. Renew. Sustain. Energy Rev. 2019, 102, 1–13. [Google Scholar] [CrossRef]
- Lanati, F.; Gaeta, M. How to Achieve a Complete Decarbonization of the Italian Energy System by 2050? In Proceedings of the 2020 17th International Conference on the European Energy Market (EEM), Stockholm, Sweden, 16–18 September 2020; pp. 1–5. [Google Scholar]
- Antosiewicz, M.; Nikas, A.; Szpor, A.; Witajewski-Baltvilks, J.; Doukas, H. Pathways for the Transition of the Polish Power Sector and Associated Risks. Environ. Innov. Soc. Transit. 2020, 35, 271–291. [Google Scholar] [CrossRef]
- Bompard, E.; Botterud, A.; Corgnati, S.; Huang, T.; Jafari, M.; Leone, P.; Mauro, S.; Montesano, G.; Papa, C.; Profumo, F. An Electricity Triangle for Energy Transition: Application to Italy. Appl. Energy 2020, 277, 115525. [Google Scholar] [CrossRef]
- Limpens, G.; Moret, S.; Jeanmart, H.; Maréchal, F. EnergyScope TD: A Novel Open-Source Model for Regional Energy Systems. Appl. Energy 2019, 255, 113729. [Google Scholar] [CrossRef]
- Limpens, G.; Jeanmart, H.; Maréchal, F. Belgian Energy Transition: What Are the Options? Energies 2020, 13, 261. [Google Scholar] [CrossRef] [Green Version]
- Bartholdsen, H.-K.; Eidens, A.; Löffler, K.; Seehaus, F.; Wejda, F.; Burandt, T.; Oei, P.-Y.; Kemfert, C.; Hirschhausen, C. von Pathways for Germany’s Low-Carbon Energy Transformation Towards 2050. Energies 2019, 12, 2988. [Google Scholar] [CrossRef] [Green Version]
- Böing, F.; Regett, A. Hourly CO2 Emission Factors and Marginal Costs of Energy Carriers in Future Multi-Energy Systems. Energies 2019, 12, 2260. [Google Scholar] [CrossRef] [Green Version]
- Lombardi, F.; Pickering, B.; Colombo, E.; Pfenninger, S. Policy Decision Support for Renewables Deployment through Spatially Explicit Practically Optimal Alternatives. Joule 2020, 4, 2185–2207. [Google Scholar] [CrossRef]
- Landis, F.; Marcucci, A.; Rausch, S.; Kannan, R.; Bretschger, L. Multi-Model Comparison of Swiss Decarbonization Scenarios. Swiss J. Econ. Stat. 2019, 155, 12. [Google Scholar] [CrossRef]
- Müller, C.; Falke, T.; Hoffrichter, A.; Wyrwoll, L.; Schmitt, C.; Trageser, M.; Schnettler, A.; Metzger, M.; Huber, M.; Küppers, M.; et al. Integrated Planning and Evaluation of Multi-Modal Energy Systems for Decarbonization of Germany. Energy Procedia 2019, 158, 3482–3487. [Google Scholar] [CrossRef]
- Connolly, D.; Lund, H.; Mathiesen, B.V. Smart Energy Europe: The Technical and Economic Impact of One Potential 100% Renewable Energy Scenario for the European Union. Renew. Sustain. Energy Rev. 2016, 60, 1634–1653. [Google Scholar] [CrossRef]
- Zappa, W.; Junginger, M.; van den Broek, M. Is a 100% Renewable European Power System Feasible by 2050? Appl. Energy 2019, 233–234, 1027–1050. [Google Scholar] [CrossRef]
- Hainsch, K.; Burandt, T.; Kemfert, C.; Löffler, K.; Oei, P.-Y.; von Hirschhausen, C. Emission Pathways Towards a Low-Carbon Energy System for Europe: A Model-Based Analysis of Decarbonization Scenarios; Social Science Research Network: Rochester, NY, USA, 2018. [Google Scholar]
- Spiecker, S.; Weber, C. The Future of the European Electricity System and the Impact of Fluctuating Renewable Energy—A Scenario Analysis. Energy Policy 2014, 65, 185–197. [Google Scholar] [CrossRef]
- Simoes, S.; Nijs, W.; Ruiz, P.; Sgobbi, A.; Thiel, C. Decarbonised Pathways for a Low Carbon EU28 Power Sector until 2050. In Proceedings of the 11th International Conference on the European Energy Market (EEM14), Krakow, Poland, 28–30 May 2014; pp. 1–5. [Google Scholar]
- Solano Rodriguez, B.; Drummond, P.; Ekins, P. Decarbonizing the EU Energy System by 2050: An Important Role for BECCS. Clim. Policy 2017, 17, S93–S110. [Google Scholar] [CrossRef]
- Capros, P.; Tasios, N.; De Vita, A.; Mantzos, L.; Paroussos, L. Model-Based Analysis of Decarbonising the EU Economy in the Time Horizon to 2050. Energy Strategy Rev. 2012, 1, 76–84. [Google Scholar] [CrossRef]
- Capros, P.; Paroussos, L.; Fragkos, P.; Tsani, S.; Boitier, B.; Wagner, F.; Busch, S.; Resch, G.; Blesl, M.; Bollen, J. European Decarbonisation Pathways under Alternative Technological and Policy Choices: A Multi-Model Analysis. Energy Strategy Rev. 2014, 2, 231–245. [Google Scholar] [CrossRef]
- Louis, J.-N.; Allard, S.; Kotrotsou, F.; Debusschere, V. A Multi-Objective Approach to the Prospective Development of the European Power System by 2050. Energy 2020, 191, 116539. [Google Scholar] [CrossRef]
- Haller, M.; Ludig, S.; Bauer, N. Decarbonization Scenarios for the EU and MENA Power System: Considering Spatial Distribution and Short Term Dynamics of Renewable Generation. Energy Policy 2012, 47, 282–290. [Google Scholar] [CrossRef]
- Jägemann, C.; Fürsch, M.; Hagspiel, S.; Nagl, S. Decarbonizing Europe’s Power Sector by 2050—Analyzing the Economic Implications of Alternative Decarbonization Pathways. Energy Econ. 2013, 40, 622–636. [Google Scholar] [CrossRef]
- Pleßmann, G.; Blechinger, P. Outlook on South-East European Power System until 2050: Least-Cost Decarbonization Pathway Meeting EU Mitigation Targets. Energy 2017, 137, 1041–1053. [Google Scholar] [CrossRef]
- Capros, P.; Kannavou, M.; Evangelopoulou, S.; Petropoulos, A.; Siskos, P.; Tasios, N.; Zazias, G.; DeVita, A. Outlook of the EU Energy System up to 2050: The Case of Scenarios Prepared for European Commission’s “Clean Energy for All Europeans” Package Using the PRIMES Model. Energy Strategy Rev. 2018, 22, 255–263. [Google Scholar] [CrossRef]
- Fattler, S.; Conrad, J.; Regett, A.; Böing, F.; Guminski, A.; Greif, S. (Eds.) Dynamis—Hauptbericht: Dynamische und intersektorale Maßnahmenbewertung zur kosteneffizienten Dekarbonisierung des Energiesystems; Forschungsstelle für Energiewirtschaft e.V.: München, Germany, 2019; ISBN 978-3-941802-45-2. [Google Scholar]
- Guminski, A.; Pellinger, C.; von Roon, S.; Fiedler, C. Vom Wort Zum Wert—Leitfaden Zur Quantifizierung von Kontextszenarien Für Komplexe Modelllandschafte. Energ. Tagesfr. 2020, 4, 35–39. [Google Scholar]
- Guminski, A.; Fiedler, C.; Kigle, S.; Pellinger, C.; Dossow, P.; Ganz, K.; Jetter, F.; Kern, T.; Limmer, T.; Murmann, A.; et al. EXtremOS Summary Report: Modeling Kit and Scenarios for Pathways Towards a Climate Neutral Europe; Forschungsstelle für Energiewirtschaft e.V.: Munich, Germany, 2021. [Google Scholar] [CrossRef]
- Fiedler, C.; Guminski, A.; Limmer, T.; Wagner, T.; Bilici, S.; Pellinger, C.; von Roon, S. Modelling Transformation Pathways for EU27+3 Final Energy Demand Using Temporally and Spatially Resolved Sector Models. In Proceedings of the 5th AIEE Energy Symposium, Virtual Conference, 15–17 December 2020; pp. 187–235. [Google Scholar]
- Ebner, M.; Fiedler, C.; Jetter, F.; Schmid, T. Regionalized Potential Assessment of Variable Renewable Energy Sources in Europe. In Proceedings of the 2019 16th International Conference on the European Energy Market (EEM), Ljubljana, Slovenia, 18–20 September 2019; pp. 1–5. [Google Scholar]
- Poncelet, K.; Delarue, E.; Six, D.; D’haeseleer, W. Myopic Optimization Models for Simulation of Investment Decisions in the Electric Power Sector. In Proceedings of the 2016 13th International Conference on the European Energy Market (EEM), Porto, Portugal, 6–9 June 2016; pp. 1–9. [Google Scholar]
- Ezequiel, D.; Poganietz, W.-R. Storylines for Extreme Context Energy Scenarios for Germany and Neighbouring Countries. 2020. [Google Scholar]
- Weimer-Jehle, W. Cross-Impact Balances: A System-Theoretical Approach to Cross-Impact Analysis. Technol. Forecast. Soc. Change 2006, 73, 334–361. [Google Scholar] [CrossRef]
- National Emissions Reported to the UNFCCC and to the EU Greenhouse Gas Monitoring Mechanism—European Environment Agency. Available online: https://www.eea.europa.eu/data-and-maps/data/national-emissions-reported-to-the-unfccc-and-to-the-eu-greenhouse-gas-monitoring-mechanism-16 (accessed on 26 November 2021).
- Lebois, O.; Boersma, P.; McGowan, D.; Rzepczyk, T.; Sönmez, C.; Powell, D.; Fernandez, M.; Bogucka, M.; Watine, L.; Nielsen, M. TYNDP 2020-Scenario Report; ENTSO-E: Brussels, Belgium, 2020. [Google Scholar]
- The European Natural Gas Network 2017; ENTSOG: Brussels, Belgium, 2017.
- Krieg, D. Konzept und Kosten Eines Pipelinesystems zur Versorgung des Deutschen Straßenverkehrs mit Wasserstoff; Schriften des Forschungszentrums Jülich Reihe Energie & Umwelt; Forschungszentrum Jülich: Jülich, Germany, 2012; ISBN 978-3-89336-800-6. [Google Scholar]
- Bossel, U.; Eliasson, B.; Taylor, G. The Future of the Hydrogen Economy: Bright or Bleak? Cogener. Distrib. Gener. J. 2003, 18, 29–70. [Google Scholar] [CrossRef]
- Population on 1 January by Age Group, Sex and NUTS 3 Region-Products Datasets-Eurostat. Available online: https://ec.europa.eu/eurostat/web/products-datasets/product?code=demo_r_pjangrp3 (accessed on 26 November 2021).
- Opendata.Ffe.de—The FfE Open Data Portal. Available online: http://opendata.ffe.de/ (accessed on 26 November 2021).
- ISAaR Dashboard. Available online: http://isaarblick.ffe.de/ (accessed on 26 November 2021).
- IRENA. Renewable Capacity Statistics 2020; International Renewable Energy Agency (IRENA): Masdar City, Abu Dhabi, 2020; ISBN 978-92-9260-239-0. [Google Scholar]
- Schmela, M. EU Market Outlook for Solar Power 2020–2024; SolarPower Europe: Brussels, Belgium, 2020; ISBN 978-94-6407-347-8. [Google Scholar]
- Komusanac, I.; Brindley, G.; Fraile, D.; Ramirez, L. Wind Energy in Europe 2020 Statistics and the Outlook for 2021—2025; Wind Europe: Brussels, Belgium, 2021. [Google Scholar]
- Maris, G.; Flouros, F. The Green Deal, National Energy and Climate Plans in Europe: Member States’ Compliance and Strategies. Adm. Sci. 2021, 11, 75. [Google Scholar] [CrossRef]


| Thermal Power Plants | 2020 | 2025 | 2030 | 2035 | 2040 | 2045 | 2050 |
|---|---|---|---|---|---|---|---|
| Gas | 3518 | 1346 | 763 | 731 | 715 | 540 | 407 |
| Hard Coal | 2438 | 678 | 585 | 502 | 102 | 43 | 5 |
| Lignite | 4801 | 3591 | 2502 | 2101 | 1328 | 37 | 4 |
| Nuclear | 6899 | 6171 | 5821 | 5897 | 5644 | 5497 | 5547 |
Publisher’s Note: MDPI stays neutral with regard to jurisdictional claims in published maps and institutional affiliations. |
© 2022 by the authors. Licensee MDPI, Basel, Switzerland. This article is an open access article distributed under the terms and conditions of the Creative Commons Attribution (CC BY) license (https://creativecommons.org/licenses/by/4.0/).
Share and Cite
Kigle, S.; Ebner, M.; Guminski, A. Greenhouse Gas Abatement in EUROPE—A Scenario-Based, Bottom-Up Analysis Showing the Effect of Deep Emission Mitigation on the European Energy System. Energies 2022, 15, 1334. https://doi.org/10.3390/en15041334
Kigle S, Ebner M, Guminski A. Greenhouse Gas Abatement in EUROPE—A Scenario-Based, Bottom-Up Analysis Showing the Effect of Deep Emission Mitigation on the European Energy System. Energies. 2022; 15(4):1334. https://doi.org/10.3390/en15041334
Chicago/Turabian StyleKigle, Stephan, Michael Ebner, and Andrej Guminski. 2022. "Greenhouse Gas Abatement in EUROPE—A Scenario-Based, Bottom-Up Analysis Showing the Effect of Deep Emission Mitigation on the European Energy System" Energies 15, no. 4: 1334. https://doi.org/10.3390/en15041334
APA StyleKigle, S., Ebner, M., & Guminski, A. (2022). Greenhouse Gas Abatement in EUROPE—A Scenario-Based, Bottom-Up Analysis Showing the Effect of Deep Emission Mitigation on the European Energy System. Energies, 15(4), 1334. https://doi.org/10.3390/en15041334