Skip to Content
EnergiesEnergies
  • Article
  • Open Access

28 January 2022

Natural Gas, a Mean to Reduce Emissions and Energy Consumption of HDV? A Case Study of Colombia Based on Vehicle Technology Criteria

,
,
,
,
and
Genergética Research Group, Faculty of Mechanical Engineering, Technological University of Pereira, Pereira 660003, Colombia
*
Author to whom correspondence should be addressed.

Abstract

In this study, the use of compressed and liquefied natural gas is evaluated for heavy-duty passengers (HDPV) and freight vehicles (HDFV). The evaluation is conducted considering the socioeconomic and vehicle fleet characteristics of Colombia. The energy consumption, the CO2, and the pollutant emissions of a baseline and four natural gas penetration scenarios are analyzed. The results show that the inclusion of natural gas reduces the energy consumption per capita of the HDPV and HDFV by up to 40% by 2050. Furthermore, PM2.5 emissions per capita are reduced up to 77% for HDPV and 90% for HDFV, while CO emissions per capita decreased by 82%. Additionally, the technological renovation of HDFV emerges as an effective way to reduce pollutant emissions in the medium term. The establishment of strategies to make HDFV cleaner and more efficient is imperative for the long term. Finally, a sensitivity analysis is conducted to evaluate the influence of the gross domestic product per capita (GDPc) over the indicators analyzed. The results show that higher GDPc demands more ambitious actions to decarbonize the transportation sector, since a considerable increase in energy consumption and emissions from heavy-duty vehicles is identified.

1. Introduction

Transport is one of the key economic sectors to propose strategies for reducing emissions. It is one of the primary producers of pollutants and greenhouse gasses (GHG) emissions. In 2018, this sector produced about 25% of CO2 global emissions [1]. Likewise, the transport sector is one of the primary generators of pollutant gases that affect air quality in urban areas. Chemical species like particulate matter (PM), tropospheric ozone (O3), nitrogen oxides (NOx), and sulfur oxides (SOx), are intricately linked to the operation of the transport sector. The use of cleaner fuels as hydrogen, biofuels, electricity, natural gas, and carbon synthetic fuels emerges as a strategy to achieve environmentally sustainable transport [2].
In this sense, socioeconomic parameters are simulated to evaluate the possible consequences of the introduction of new transport technologies in existing transport systems. [3]. Nevertheless, not all fuels are competitive in terms of performance or availability. The penetration of electric vehicles has been slow, principally in countries with developing economies [4]. Today, natural gas has emerged as a possible transition fuel to substitute the use of diesel and gasoline in road transport vehicles, since its carbon content is lower. Generally, natural gas can be employed in transport as compressed natural gas (CNG) or liquefied natural gas (LNG) [5]. A change from petroleum-based energy chains to natural gas-based energy chains could be a good strategy to both reduce emissions of fuels used today as well as maintain a high grade of flexibility regarding the development of future technologies due to three principal reasons: (i) carbon emission per unit of energy in combustion is lower for natural gas; (ii) in time, natural gas can be substituted for climate-neutral energy carriers, such as hydrogen; and (iii) natural gas is the cleanest and most environmentally acceptable primary fossil fuels regarding its combustion products [6].
It has been identified that the substitution of diesel fuel for natural gas is a viable alternative, from both an economic and environmental point of view [7]. Nevertheless, it is not sensible to apply a general rule for all cases without considering the specific conditions of each country. From an environmental perspective, natural gas vehicles can produce between 70% and 85% fewer pollutant emissions than gas or diesel vehicles, and a reduction of the GHG of 10% compared to diesel [8]. Today, natural gas has facilitated energy security and diversification in transport, as well as generated profit for users and companies of the transport sector, as the cost of natural gas is less than diesel fuel [9].
Specifically, in heavy-duty passengers vehicles (HDPV) and heavy-duty freight vehicles (HDFV), one of the most-profiled alternatives to substitute diesel fuel is LNG, as it presents a greater energy density than CNG. LNG gives vehicles greater autonomy during their routes, being much more attractive for commercial transport [10]. Generally, LNG is stored in a cryogenic liquid phase, after which it passes through an evaporator where a phase change from liquid to gas occurs [11]. From here, it is directed to the engine where, as is with gas engines, there is a spark ignition system [12]. Some important advantages of LNG vehicles include an increase in the vehicle’s performance, weight reduction, and less time spent refueling compared to CNG [13]. Because of these advantages, the use of LNG is recommended in fleets comprised of heavy-duty vehicles (HDV) that operate on long or cyclical routes (intercity trucks, urban trucks, and semi-tractor trucks) where fueling takes place upon departure or arrival–until a network of service stations is available to supply the automotive fleet [14].
LNG is considered the cleanest form of natural gas. This is because before the liquefaction process several impurities are removed from natural gas to conduct the liquefaction safely and efficiently [15]. As a result, LNG contains up to 98% methane [16]. Being such a pure fuel, LNG combustion, compared to traditional fossil fuels, has less NOx, SOx, and PM emissions [17]. Moreover, CO emissions are practically null [16]. For said reasons, diverse studies have found that by operating HDV with LNG, low levels of pollutant concentrations can be achieved without the need to employ costly emissions control systems, as are required for diesel vehicles [18]. It is estimated that an LNG truck, as compared to conventional diesel trucks, can consume up to 7% more energy, given that these vehicles are approximately 18% less efficient. However, the sale price of LNG is less than that of diesel; therefore, the fleet operating costs could be considerably reduced [19].
On the other hand, it has been confirmed that employing buses that operate with CNG in public transport diminish the negative impact on the environment due to the reduction of emissions of toxic substances, particles, and GHG [20,21]. Likewise, the use of CNG buses contributes to a cleaner operation and supports the objectives of sustainable development. Natural gas has been studied extensively and used in the transport sector in several countries, as presented in Table 1.
Table 1. Studies related to the evaluation of natural gas in HDV in the world.
Even though the use of natural gas has been analyzed widely, and some environmental and economic advantages have been demonstrated, Latin America still requires an analysis of social, geographical, and technical factors that directly influence the penetration of technologies to identify the viability of the implementation of this type of energy in the transport sector. Moreover, the low quality of public transport, poor planning practices, and highly populated and polluted cities emerge as some of the challenges that the new technologies must overcome. Likewise, the mountainous geography in countries like Bolivia, Colombia, Peru, and Ecuador requires high mechanical performance from engines. The weak vehicle and quality emission standards and fuel savings mean vehicles in the region tend to have a higher level of pollutant and GHG emissions. This shows potential in reducing emissions through the use of natural gas in the region.
In this article, the authors want to assess if natural gas can be considered as a transition fuel in the transport sector in Colombia based on the energy and environmental effects that result from the inclusion of this fuel in the operation of the HDPV and HDFV fleet. For this, models that relate the socioeconomic, energy, pollutant emissions, vehicle technology, and energy supply infrastructure parameters are proposed for road transport systems. The models are applied in the case study of Colombia; nevertheless, they can be replicated in any region based on data of the fleet composition, population, and the use of the energy sources in the transport sector.
An estimate and projection are made of the number of commercial transport vehicles and tank-to-wheel (TTW) pollutant emissions resulting from the operation of the HDPV and commercial vehicle fleet in the country through the year 2050. The above provides an evaluation of the environmental and energetic effectiveness of the use of passenger buses powered by CNG in public transport and HDFV powered by LNG, considering the current HDV technologies, based on diesel and gasoline fuels, that are being commercialized in Colombia. Based on the model, several scenarios of the inclusion of natural gas in HDV can be proposed and analyzed. The results could be used to draw insights, support, and argue the development of national and regional policies, as well as to project the required actions in the medium and short term.
Finally, a sensitivity analysis is executed to identify what factors influence the projections of energy consumption and pollutant emissions in the case study, and medium and long-term regulatory recommendations are established.

2. Methodology

An analysis of HDV is conducted, since this fleet is one of the primary causes of NOx, SOx, CO, and PM emissions in urban areas [29]. Currently, Colombia has about 341,100 HDV (26% HDPV and 74% HDFV) in operation. 11% of HDPV uses gasoline fuel, meanwhile 86% and 3% uses diesel and natural gas respectively. On the other hand, 9% of HDFV uses gasoline and 91% uses diesel.

2.1. Vehicle and Population Projections

The size of the HDV fleet in Colombia by 2050 is projected through the Gompertz function. It has been widely used for modeling the growth of vehicle fleets considering the market and the socioeconomic characteristics of a specific population. This function models the relation between the number of vehicles and the economic development of a country. It establishes the number of vehicles per capita in the function of the gross domestic product per capita (GDPc), as shown in Equation (1) [30].
V = γ e e β GDP c
where:
V is the motorization index, in number of vehicles per capita.
α and β establish the form of the Gompertz function. These parameters are determined using a linear regression method that allows the curve to be adjusted according to the specific conditions of the region, based on the historical data of the vehicle fleet.
γ : is known as the saturation level and determines the maximum point of growth of the fleet. It is expressed in vehicles per 1000 inhabitants and depends, principally, on the population density and urbanization rate of the country [30]. Initially, it is determined for Light-Duty Vehicles (LDV), according to Equation (2) [30]. Later, the saturation level of HDPV and HDFV are determined based on the relation between the number of automobiles and the number of vehicles in each category.
γ = γ m a x 0.388   D ¯ i 7.765   U ¯ i
where:
γ m a x is the maximum saturation level of automobiles. As a reference, it is considered the γ m a x of the United States, with 652 automobiles for every 1000 inhabitants [30].
D ¯ i and U ¯ i relate population density and the urbanization rate, respectively, and are calculated according to Equations (3) and (4), respectively.
D ¯ i = D i D U S   if   D i > D U S D ¯ i = 0   if   D U S > D i
U ¯ i = U i U U S   if   U i > U U S U ¯ i = 0   if   U U S > U
where:
D U S and D i are the population densities of the United States and the country of study, in this case, Colombia. For these, values of 36 and 45 inhabitants/km2 are considered, respectively [31].
U U S and U i are the urbanization rates of the United States and the case study, Colombia. Values of 82.7 and 81.4% are considered respectively [32].
Once the saturation level is determined for LDV, the saturation level of HDPV and HDFV is estimated according to the historic relationship between the number of automobiles and the quantity of HDPV and HDFV. In the last 15 years, an average relation of 3.2 HDPV and 8.47 HDFV per 100 automobiles is established.
Table 2 shows the parameters of the Gompertz function. The level of saturation γ is established based on the ratio between the number of automobiles of the country and the quantity of HDPV and HDFV, knowing the level of saturation of automobiles in the country. It is calculated based on what Dargy, Gately, and Sommer [30] established.
Table 2. Parameters of the Gompertz function.
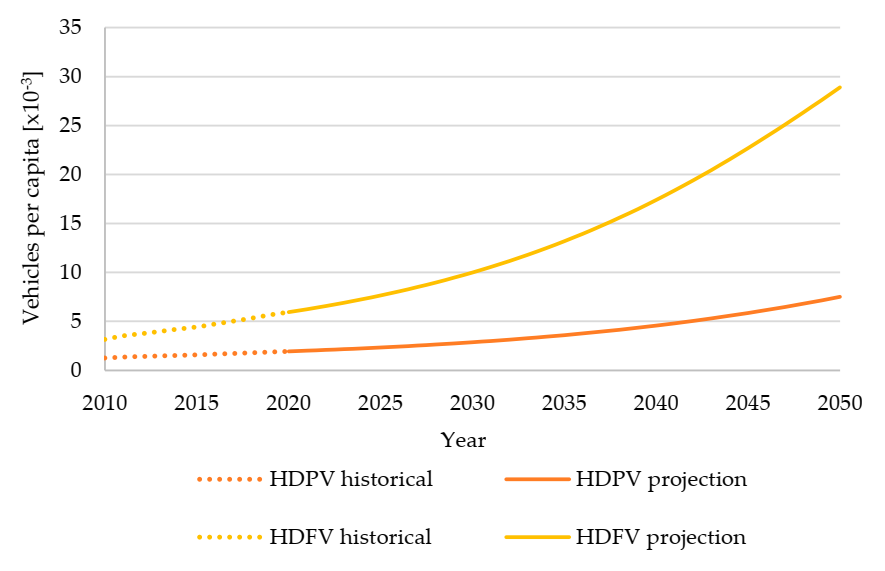
From this model, the quantity of HDPV and HDFV from 2020 to 2050 is projected, based on the actual data from 2010 to 2020, and assuming an average annual growth of GDPc of 4% each year as established in the report “The World in 2050” [33]. In Figure 1, the projection of the number of vehicles per capita is presented. In which an elevated growth is identified from 2030 and greater growth for HDFV than for HDPV, reaching 28 vehicles per 1000 inhabitants by the year 2050 for HDFV as compared to a total of 7 per 1000 inhabitants of HDPV by the year 2050.
Figure 1. Projection of HDPV and HDFV per 1000 inhabitants by 2050—Colombia.
The substitution of diesel fuel and gasoline for natural gas is considered, specifically HDPV powered by CNG, and HDFV powered by LNG. Four scenarios of natural gas penetration are proposed:
  • The baseline scenario follows the current trend of natural gas use in HDV. Therefore, it considers a minimal penetration of natural gas, with a participation of 95% diesel and 5% natural gas by 2050.
  • In a low scenario, greater participation of diesel compared to natural gas by 2050 is assessed (75% diesel–25% natural gas).
  • In the medium scenario, equal participation of both fuels diesel and natural gas is considered by 2050.
  • In the high scenario, greater participation of natural gas compared to diesel fuel is analyzed (25% diesel–75% natural gas).
  • Finally, the total gas scenario considers that all the HDV fleet uses natural gas by 2050.
In all the analyzed scenarios, the withdrawal of used vehicles with more than 20 years of useful life is considered. To this end, an historical assessment of the registrations of new HDPV and HDFV in Colombia is conducted. Besides, the penetration of natural gas vehicles is analyzed progressively, considering a linear growth for each year.
Under the Gompertz model, a projection of 260,000 HDPV is expected by 2050. In the base scenario, about 13,000 vehicles will use CNG. For the low, medium, and high penetration scenarios of natural gas, about 65,000; 130,000; and 195,000 vehicles will operate using natural gas. In addition, the total gas scenario will consider all the vehicles operating with CNG by 2050.
On the other hand, about 1.27 million HDFV are projected by 2050. In the base scenario, 63,700 vehicles will use LNG by 2050. In the low scenario, about 318,500 LNG-HDFV are projected; about 637,000 for the medium; and 955,500 for the high penetration scenario.

2.2. Energy Consumption

To estimate the energy consumed (EC), vehicle fuel consumption, and lower heating value (LHV) of fuels must be considered. These variables are related to the vehicle kilometers traveled (VKT) using Equation (5), through which the EC by class and vehicle technology is obtained. The VKT is calculated knowing the average of kilometers traveled per vehicle (AVKT) and the quantity of vehicles (Veh), as is shown in Equation (6). For this study, the AVKT is calculated based on the registry of total trips each year made by vehicles on the country’s roads, and the number of kilometers traveled on each of the roads. Thus, the AVKT has been established at 40,576 km for HDPV and 37,877 km for HDFV [34]. Table 3 presents the mean fuel consumption of diesel and gasoline HDV fleet in Colombia under real operational conditions. In addition, this table reports the mean fuel consumption (FC) of LNG HDFV for China [19]. Table 4 presents the lower heating value of fuels and CO2 (EF CO2) emission factors.
EC = VKT     FC   LHV
VKT = AVKT     Veh
Table 3. FC of vehicles by technology [19,35].
Table 4. Lower heating value of fuels [36].

2.3. Pollutant and CO2 Emissions

The pollutant emissions (PE) generated by a vehicle fleet depend on the VKT and the emission factors (EF). The EF refers to the total emissions of a pollutant and can be expressed per unit of energy (g/MJ) or distance traveled (g/km). For this study, emission factors (g/km) are used, based on available information regarding emission standards with which vehicles must comply, which are presented in the Appendix A.
Therefore, as each vehicle of the fleet can accomplish a specific emission standard (ES), the PE is determined by Equation (7). It considers the participation of each ES in the fleet, in which the counter n = 1 is equivalent to the Euro I standard, through n = 6, equivalent to the Euro VI standard, for diesel and gasoline vehicles, respectively.
PE = VKT     n = 1 6 %   ES n     EF n
The actual participation percentage of ES is obtained from the baseline, and its projection is estimated assuming a vehicle lifespan of 20 years, as is indicated by the regulations of the case study country. Moreover, it is assumed that the EF in vehicles does not vary over the lifespan of the vehicle. These two considerations are made based on Colombia’s regulations, which establish that diesel HDV must accomplish the Euro II standard since 2010, Euro IV since 2015, and Euro VI since 2023. On the other hand, gasoline HDV must accomplish the Euro II standards since 2015, Euro IV since 2025, and Euro VI since 2030 [29,37].
Furthermore, for the study, Euro VI is the maximum reference standard because of the lack of information on the values and implementation dates of forthcoming standards.
Carbon dioxide emissions (E CO2) are calculated using Equation (8). It relates the CO2 emission factors of (EF CO2) in g/MJ, as shown in Table 4, and the used fuel through the energy consumption (EC) of the vehicles.
E   CO 2 = EC     EF   CO 2

3. Results

Despite the use of natural gas has been analyzed widely, several authors have found controversial results related to the benefits of its use. This is because results are closely linked to the characteristics of the vehicle fleet under analysis and its operational conditions. Particularly for Colombia, Table 5 shows the behavior of energy consumption and CO2, CO, NOx, and PM2.5 emissions per capita in the proposed scenarios compared to the baseline scenario for HDPV and HDFV by 2050. In general, the use of natural gas generated a positive impact on energy consumption and pollutant emissions is evidenced for HDPV and HDFV by 2050.
Table 5. Reduction of emissions and energy consumption by 2050.
Nevertheless, results show a “negative” reduction in NOx emissions of HDFV fleet for each analyzed scenario. It means that the use of LNG may cause the NOx emissions rates to increase by up to 30% in 2050 when compared to the baseline scenario. This behavior could be related to the fact that in real operating conditions the NOx emission factor is greater for LNG HDFV than Euro VI diesel ones. It occurs because the higher exhaust temperature of LNG vehicles affects the efficiency of the selected catalytic reduction system, causing a great rise in NOx emissions [25]. Nevertheless, there are ample benefits related to PM2.5 emissions, given that LNG is considered the cleanest form of natural gas and has a lower sulfur content than gasoline and diesel [38]. Therefore, studies have shown that the use of LNG has generated reductions between 90% and 97% in PM emissions [39,40].
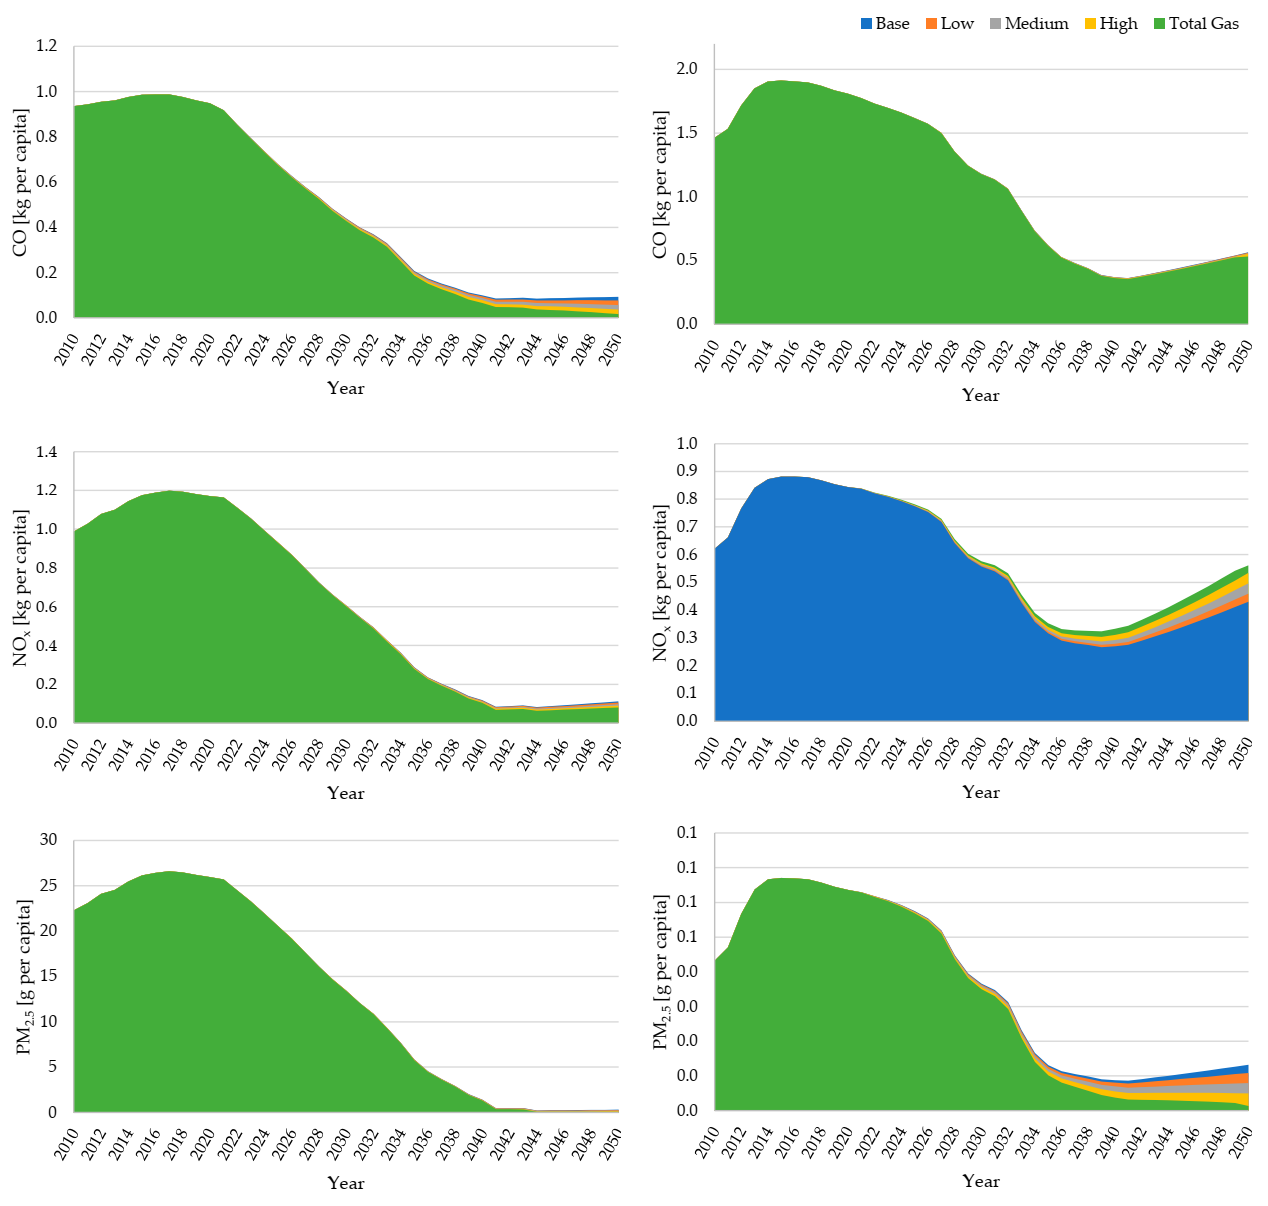
Figure 2 presents CO, NOx, and PM2.5 emissions per capita in both vehicle categories between 2010 and 2050. From this, a direct relationship between emissions and the technological renewal of the fleet is identified. Since new emissions standards are required, there are considerable reductions in this parameter. It illustrates the renewal of technology in HDPV, showing a considerable reduction in pollutants. The projected CO emissions are reduced from 0.95 kg per capita in 2020 to less than 0.1 kg per capita by 2050. PM2.5 emissions have projected reductions from 26 g per capita in 2020 to less than 0.5 g per capita in 2050. Additionally, NOx emissions present reductions of about 1 to 0.1 kg per capita. The results show that actions taken on HDPV in the case study country could generate considerable benefits regarding pollutant emissions in the transport sector.
Figure 2. Pollutant emissions by 2050.
On the other hand, when considering HDFV, there are reductions in CO, NOx, and PM2.5 emissions until approximately 2035, after which emissions begin to increase again. This is due to the close relationship between emissions and the number of vehicles, where the increase of the HDFV vehicle fleet based on the GDPc represents a significant number, and the renewal of technology is not sufficient to maintain a reduction in emissions, as opposed to what happens for HDPV. It is relevant to point that out, even though the total inclusion of LNG contributes, in great measure, to the reduction of CO and PM2.5 emissions. In the other scenarios, similar reductions of emissions are evident, which is due to the inclusion of vehicle technologies with more responsible ES. For the case of NOx in the HDFV, emissions of this pollutant are reduced until 2035, as a result of stopping the operation of vehicles with low ES. Nevertheless, from the said year, there is a considerable increase of the PE of this chemical species, as a product of an increase in the number of vehicles in circulation and the greater LNG contribution in NOx emissions, in comparison with diesel fuel.
Likewise, the results reveal that from the year 2035, proposing complementary actions to significantly reduce NOx and CO emissions is important, principally, in HDFV. In other words, for this class of vehicles, a quicker transition to zero-emissions than for the HDPV is necessary, where new technologies like hybrid, electrical, or fuel cell trucks, not only could reduce emissions, but also provide economic benefits and fuel savings [41,42,43,44].

4. Sensitivity Analysis

The results represent the impact in emissions and energy consumption as a product of the inclusion of natural gas in heavy vehicles, varying the percentage of participation of fossil fuels. Nevertheless, a variation in the GDPc values, population growth, vehicle fuel efficiency, or emission factors can directly influence the results. Therefore, in this section, a sensitivity analysis of the GDPc and emission standards is executed to observe the impact of the number of vehicles, EC, and emissions.
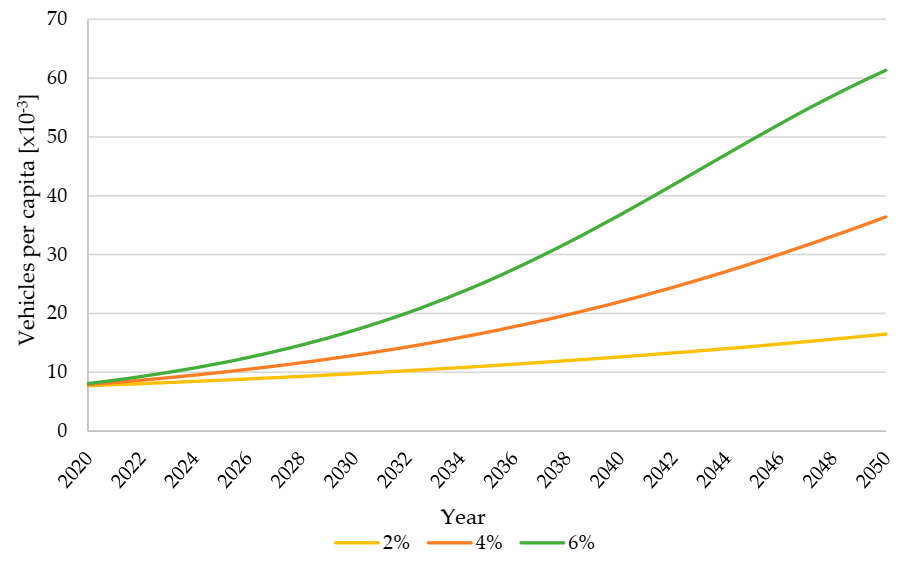
The GDPc is directly related to the number of existing vehicles in a population, as the greater the economic development of a country the greater the purchasing power of its inhabitants. For effects of analysis, the average annual growth percentages of the GDPc were varied, with values of 2%, 4%, and 6%. Thus, it was observed that with an average annual growth of 6%, the total fleet analyzed would come close to its saturation value by 2050, with 61 heavy vehicles for every 1000 inhabitants. On the other hand, with a growth of 2% of the GDPc, there would be 16 heavy-duty vehicles for every 1000 inhabitants by 2050. Said behavior can be observed in Figure 3.
Figure 3. Motorization index by varying GDPc.
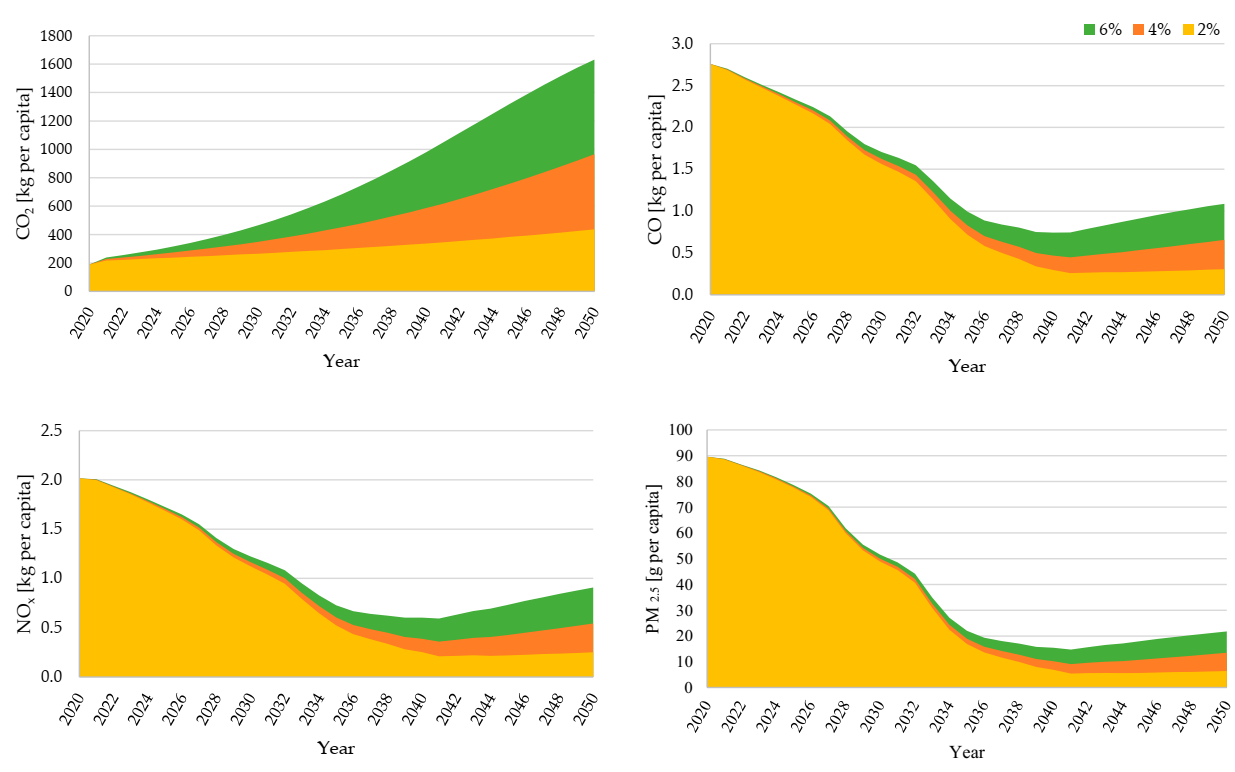
Moreover, in Figure 4, the quantity of emissions of CO2, CO, NOx, and PM2.5 per capita that would be generated by varying the GDPc is presented. In this figure, baseline scenario emissions with average growth percentages of the GDPc of 2%, 4%, and 6% are presented, observing a significant difference from the minimum to the maximum case. As can be observed, despite the reduction of the tons of emissions emitted due to the technological renewal of the fleet, CO, NOx, and PM2.5 emissions reach a point of new increase. This shows that the reduction in emission factors is not enough to offset the total emissions of the number of vehicles. Additionally, a direct correlation between the GDPc and GHG and pollutant emissions has been identified. This is because a greater GDPc represents the greater purchasing power of the population to buy vehicles, which will induce an increase in the size of the fleet, thus, a higher level of emissions. This leads to the assessment that countries with greater levels of wealth should generate more rigorous strategies of decarbonization of heavy vehicles.
Figure 4. Total emissions per capita by varying GDPc.
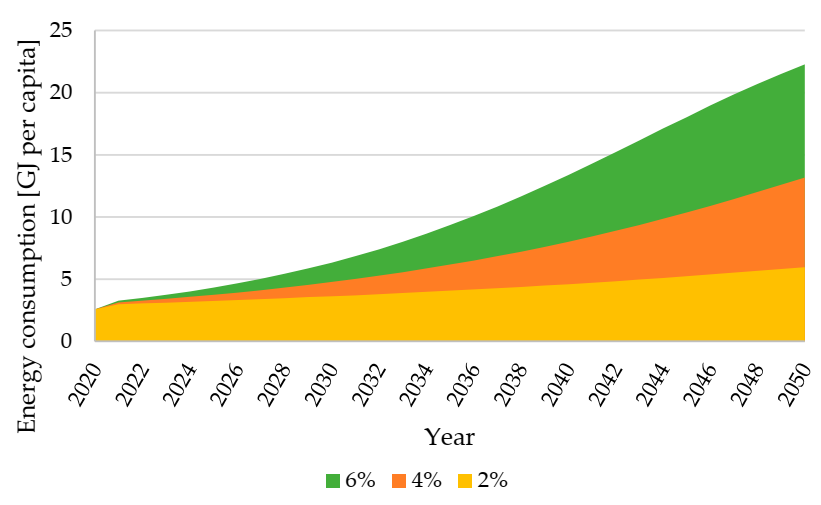
Additionally, Figure 5 shows how EC varies with different values of the GDPc. By the year 2050, there would be a total EC of 5.97 GJ per capita with a 2% annual growth of the GDPc, whereas the energy consumption would be 13.18 GJ per capita for a 4% annual growth. Finally, with a 6% annual average growth of the GDPc, there would be a total EC of 22.28 GJ per capita.
Figure 5. Energy consumption by varying GDPc.
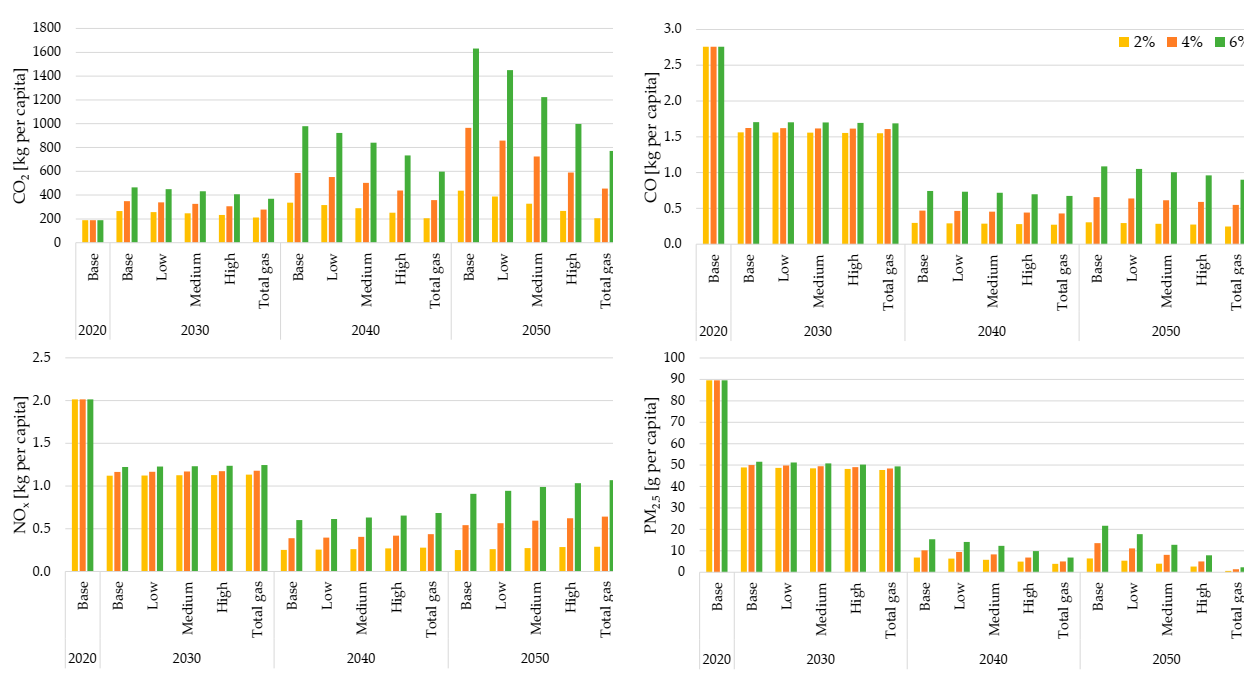
Figure 6 shows the influence of the GDPc in total emissions per capita in different periods in natural gas inclusion scenarios. As can be observed, CO2 emissions are most affected by the GDPc, generating increases of up to 375% by the year 2050. Likewise, as evidenced, independent of the GDPc, there is an initial reduction in CO and NOx emissions; however, an increase in these pollutants is generated by the year 2050. The tendency that the greater the GDPc, the greater the generation of these emissions, has been identified. It was also identified that, for PM2.5 emissions, independent of the GDPc, the inclusion of natural gas technologies generates a significant reduction of the emission of this material.
Figure 6. Sensitivity analysis—total emissions per capita.

5. Conclusions

In this article, an evaluation of the inclusion of natural gas as a transition fuel to reduce the use of diesel and gasoline in heavy-duty passenger (HDPV) and freight vehicles (HDFV) has been executed. Taking into consideration their operating conditions, the use of compressed natural gas (CNG) in HDPV and liquified natural gas (LNG) in HDFV are considered.
Four substitution scenarios were proposed considering different natural gas penetration rates. For the evaluation, a baseline of vehicles in Colombia was used as a case study. Vehicle projections were made based on the socioeconomic criteria of the population, annual vehicle kilometers traveled (VKT), fuel economy, and vehicle emission standards.
Based on the results, we can conclude that the inclusion of natural gas in heavy transport road vehicles significantly reduces CO and PM2.5 emissions per capita. By 2050, potential reductions of around 82% and 77% of these pollutants, respectively, are identified in HDPV. On the other hand, a reduction of PM2.5 emissions of the order of 90% can be expected by 2050 in HDFV, compared to the baseline scenario. The results show that the use of natural gas in HDV can generate relevant environmental benefits in the medium and long term. However, it is necessary to promote the renewal of the fleet.
In the case of HDFV, there is evidence of a significant reduction in CO, NOx, and PM2.5 emissions until 2035. Nevertheless, from this year, a net increase in the generation of these pollutants is identified. This is a product of the significant rise in the number of vehicles in operation. Thus, the inclusion of LNG in the HDFV fleet generates environmental benefits medium-term; however, long-term benefits will require more ambitious and complementary strategies of the decarbonization of the vehicles.
Based on the results of the period from 2034–2036 (medium-term), strategies should be developed to reduce pollutant emissions in the future. This said, addressing challenges in transport requires an integral approach that implements greater actions to diversify energy sources in the transport sector. Long-term, the most important action would be a transition to electric vehicles (EV), which provide a more viable road to clean transportation with zero emissions.
A sensitivity analysis of evaluated indicators concerning the GDPc was performed. It was identified that with a higher GDPc, there is a higher purchasing power of vehicles, which induces growth in the vehicle fleet in operation. Thus, this triggers a significant increase in GHG and pollutant emissions. This tells us that greater wealth—a greater GDPc—demands the deployment of more ambitious energy and environmental policies in the transport sector.
Several authors disagree on the effects of the use of natural gas in HDV since some studies reveal that CO2 emissions and energy consumption are reduced, others report increases on these parameters. This is because results are closely linked to the characteristics of the vehicle fleet under analysis and its operational conditions. The results showed in this article are based on the historical data and information of the HDFV and HDPV fleet of Colombia and the energy demand reported on local studies. Nevertheless, the projected behavior of pollutant emissions, such as NOx is aligned to the results reported in other studies, where the increase in the emissions of this pollutant is reported when LNG is used in HDV.
The results presented in this study are based on limited information on the actual operation and technological characteristics of the HDV fleet in Colombia. Thus, to generate technical inputs closed to the reality of the country is required for supporting the enforcement of policies to reduce energy consumption and pollutant emissions on HDV. Thence, the existing gaps between real and reported data on pollutant emissions, fuel consumption, and the VKT of HDPV and HDFV need to be closed. In addition, modeling the impact of geographical conditions and the age of the vehicles on fuel consumption and pollutant emissions will allow us to perform more reliable projections. Finally, to compare natural gas-powered vehicles with electric and hybrid technologies is necessary to establish a whole roadmap to move the HDV fleet towards sustainability.

Author Contributions

Conceptualization, J.C.C. and J.C.L.; methodology, A.E. and D.R.; software, A.E. and D.R.; validation, L.F.Q. and J.C.L.; formal analysis, J.C.C.; investigation, J.C.C., A.E. and D.R.; resources, J.C.C., J.C.L., L.F.Q. and J.E.T.; data curation, A.E. and D.R.; writing—original draft preparation, J.C.C., A.E. and D.R.; writing—review and editing, J.C.L., L.F.Q. and J.E.T.; visualization, J.C.C. and J.C.L.; supervision, J.E.T.; project administration, J.C.L.; funding acquisition, J.C.C., J.C.L., L.F.Q. and J.E.T. All authors have read and agreed to the published version of the manuscript.

Funding

This work was supported by the Ministerio de Ciencia, Tecnología e Innovación (Minciencias) under the Grant 852–Conectando Conocimiento.

Institutional Review Board Statement

Not applicable.

Acknowledgments

The authors want to acknowledge the Gestión Energética Research Group (GENERGÉTICA), the Universidad Tecnológica de Pereira, and the Universidad Católica de Pereira for their contribution to the development of this research. Besides, the authors want to acknowledge to Ministerio de Ciencia Tecnología e Innovación de Colombia for the financial support to this project and to our “Jóvenes Investigadores”.

Conflicts of Interest

The authors declare that they have no known competing financial interests or personal relationships that could have appeared to influence the work reported in this paper.

Appendix A

Table A1. Emission factors for HDPV and HDFV [45,46,47].

References

  1. International Energy Agency (IEA). CO2 Emissions from Fuel Combustion, 2020 ed.; Database documentation; IEA: Paris, France, 2020. [Google Scholar]
  2. Pamucar, D.; Ecer, F.; Deveci, M. Assessment of alternative fuel vehicles for sustainable road transportation of United States using integrated fuzzy FUCOM and neutrosophic fuzzy MARCOS methodology. Sci. Total Environ. 2021, 788, 147763. [Google Scholar] [CrossRef] [Scilit] [PubMed]
  3. Połom, M.; Tarkowski, M.; Puzdrakiewicz, K.; Dopierała, Ł. Is It Possible to Develop Electromobility in Urban Passenger Shipping in Post-Communist Countries? Evidence from Gdańsk, Poland. Energies 2020, 13, 6362. [Google Scholar] [CrossRef] [Scilit]
  4. Osorio-Tejada, J.L.; Llera-Sastresa, E.; Scarpellini, S. Liquefied natural gas: Could it be a reliable option for road freight transport in the EU? Renew. Sustain. Energy Rev. 2017, 71, 785–795. [Google Scholar] [CrossRef] [Scilit]
  5. Gürsan, C.; de Gooyert, V. The systemic impact of a transition fuel: Does natural gas help or hinder the energy transition? Renew. Sustain. Energy Rev. 2021, 138, 110552. [Google Scholar] [CrossRef] [Scilit]
  6. Osorio-Tejada, J.L.; Llera-Sastresa, E.; Scarpellini, S. A multi-criteria sustainability assessment for biodiesel and liquefied natural gas as alternative fuels in transport systems. J. Nat. Gas Sci. Eng. 2017, 42, 169–186. [Google Scholar] [CrossRef] [Scilit]
  7. Wang, C.; Sun, Z.; Zhirui, Y. On-Road Bus Emission Comparison for Diverse Locations and Fuel Types in Real-World Operation Conditions. Sustainability 2020, 12, 1798. [Google Scholar] [CrossRef] [Scilit]
  8. Gerber Machado, P.; Naoki Akiyoshi Ichige, E.; Ninni Ramos, K.; Mouette, D. Natural gas vehicles in heavy-duty transportation—A political-economic analysis for Brazil. Case Stud. Transp. Policy 2021, 9, 22–39. [Google Scholar] [CrossRef] [Scilit]
  9. Smajla, I.; Karasalihović Sedlar, D.; Drljača, B.; Jukić, L. Fuel Switch to LNG in Heavy Truck Traffic. Energies 2019, 12, 515. [Google Scholar] [CrossRef] [Scilit]
  10. Langshaw, L.; Ainalis, D.; Acha, S.; Shah, N.; Stettler, M.E.J. Environmental and economic analysis of liquefied natural gas (LNG) for heavy goods vehicles in the UK: A Well-to-Wheel and total cost of ownership evaluation. Energy Policy 2020, 137, 111161. [Google Scholar] [CrossRef] [Scilit]
  11. Sharafian, A.; Talebian, H.; Blomerus, P.; Herrera, O.; Mérida, W. A review of liquefied natural gas refueling station designs. Renew. Sustain. Energy Rev. 2017, 69, 503–513. [Google Scholar] [CrossRef] [Scilit]
  12. U.S. Department of Energy; Energy Efficiency & Renewable Energy. How Do Liquefied Natural Gas Trucks Work? Available online: https://afdc.energy.gov/vehicles/how-do-lng-cars-work (accessed on 18 July 2021).
  13. Ma, L.; Geng, J.; Li, W.; Liu, P.; Li, Z. The development of natural gas as an automotive fuel in China. Energy Policy 2013, 62, 531–539. [Google Scholar] [CrossRef] [Scilit]
  14. IDEA. Combustibles Y Vehículos Alternativos-España; Treatise Inst. Para la Divers; Y Ahorr. la Energía Minist. Ind. Tur. Comer. 2005, pp. 16–22. Available online: https://www.idae.es/uploads/documentos/documentos_10297_TREATISE_CombustiblesVehiculosAlternativos_A2005_d9d8d6b3.pdf (accessed on 20 September 2021).
  15. BP. BP and International Gas Union Guidebook to Gas Interchangeability and Gas Quality. Secretary 2011, 6, 154. Available online: http://www.igu.org/sites/default/files/node-page-field_file/Guidebook_to_Gas_Interchangeability_and_Gas_Quality,_August_2011.pdf (accessed on 20 September 2021).
  16. Kumar, S.; Kwon, H.-T.; Choi, K.-H.; Lim, W.; Cho, J.H.; Tak, K.; Moon, I. LNG: An eco-friendly cryogenic fuel for sustainable development. Appl. Energy 2011, 88, 4264–4273. [Google Scholar] [CrossRef] [Scilit]
  17. Rejeesh, C.R.; Anoob, J.; Chinmayakrishan, G. Impact of Using Liquefied Natural Gas for Transportation in the City of Cochin: A Review. J. Altern. Energy Sources Technol. 2017, 8, 29–35. [Google Scholar]
  18. U.S. Department of Energy and Energy Efficiency & Renewable Energy. Alternative Fuels Data Center: Natural Gas Vehicles; Natural Gas Vehicles. Available online: https://afdc.energy.gov/vehicles/natural_gas.html (accessed on 23 July 2021).
  19. Song, H.; Ou, X.; Yuan, J.; Yu, M.; Wang, C. Energy consumption and greenhouse gas emissions of diesel/LNG heavy-duty vehicle fleets in China based on a bottom-up model analysis. Energy 2017, 140, 966–978. [Google Scholar] [CrossRef] [Scilit]
  20. Dyr, T.; Misiurski, P.; Ziółkowska, K. Costs and benefits of using buses fuelled by natural gas in public transport. J. Clean. Prod. 2019, 225, 1134–1146. [Google Scholar] [CrossRef] [Scilit]
  21. Brito, T.L.F.; Moutinho dos Santos, E.; Galbieri, R.; Costa, H.K. de M. Qualitative Comparative Analysis of cities that introduced compressed natural gas to their urban bus fleet. Renew. Sustain. Energy Rev. 2017, 71, 502–508. [Google Scholar] [CrossRef] [Scilit]
  22. Pourahmadiyan, A.; Ahmadi, P.; Kjeang, E. Dynamic simulation and life cycle greenhouse gas impact assessment of CNG, LNG, and diesel-powered transit buses in British Columbia, Canada. Transp. Res. Part D Transp. Environ. 2021, 92, 102724. [Google Scholar] [CrossRef] [Scilit]
  23. Chang, C.C.; Liao, Y.T.; Chang, Y.W. Life cycle assessment of alternative energy types—including hydrogen—for public city buses in Taiwan. Int. J. Hydrog. Energy 2019, 44, 18472–18482. [Google Scholar] [CrossRef] [Scilit]
  24. Zhiyi, Y.; Xunmin, O. Life Cycle Analysis on Liquefied Natural Gas and Compressed Natural Gas in Heavy-duty Trucks with Methane Leakage Emphasized. Energy Procedia 2019, 158, 3652–3657. [Google Scholar] [CrossRef] [Scilit]
  25. Lv, L.; Ge, Y.; Ji, Z.; Tan, J.; Wang, X.; Hao, L.; Wang, Z.; Zhang, M.; Wang, C.; Liu, H. Regulated emission characteristics of in-use LNG and diesel semi-trailer towing vehicles under real driving conditions using PEMS. J. Environ. Sci. 2020, 88, 155–164. [Google Scholar] [CrossRef] [Scilit] [PubMed]
  26. Chen, H.; He, J.; Zhong, X. Engine combustion and emission fuelled with natural gas: A review. J. Energy Inst. 2019, 92, 1123–1136. [Google Scholar] [CrossRef] [Scilit]
  27. Ercan, T.; Zhao, Y.; Tatari, O.; Pazour, J.A. Optimization of transit bus fleet’s life cycle assessment impacts with alternative fuel options. Energy 2015, 93, 323–334. [Google Scholar] [CrossRef] [Scilit]
  28. De Carvalho, A.V. Natural gas and other alternative fuels for transportation purposes. Energy 1985, 10, 187–215. [Google Scholar] [CrossRef] [Scilit]
  29. Consejo Nacional de Política Económica y Social. CONPES 3943: Política para el Mejoramiento de la Calidad del Aire; CONPES: Bogotá, Colombia, 2018.
  30. Dargay, J.; Gately, D.; Sommer, M. Vehicle ownership and income growth, worldwide: 1960–2030. Energy J. 2007, 28, 143–170. [Google Scholar] [CrossRef] [Scilit]
  31. The World Bank. World Development Indicators: Size of the Economy; The World Bank: Washington, DC, USA, 2021; Available online: http://wdi.worldbank.org/table/WV.1 (accessed on 18 February 2021).
  32. Knoema. Atlas Mundial de Datos. Available online: https://knoema.es/atlas (accessed on 22 May 2021).
  33. Price Waterhouse Cooper. The World in 2050: Will the Shift in Global Economic Power Continue? Price Waterhouse Cooper: London, UK, 2015. [Google Scholar] [CrossRef]
  34. Instituto Nacional de Vías. Serie Histórica de Transito (TPD) 1997 – 2018; Instituto Nacional de Vías: Bogotá, Colombia, 2019. [Google Scholar]
  35. Unidad de Planeación Minero Energética. Proyección de demanda de combustibles en el sector transporte en Colombia; Unidad de Planeación Minero Energética: Bogotá, Colombia, 2015. [Google Scholar]
  36. U.S. Environmental Protection Agency. Direct Emissions from Mobile Combustion Sources; U.S. Environmental Protection Agency: Washington, DC, USA, 2020. [Google Scholar]
  37. Congreso de la República de Colombia. Ley N° 1972 de 2019; Congreso de la República de Colombia: Bogotá, Colombia, 2019. [Google Scholar]
  38. Hekkert, M.P.; Hendriks, F.H.J.F.; Faaij, A.P.C.; Neelis, M.L. Natural gas as an alternative to crude oil in automotive fuel chains well-to-wheel analysis and transition strategy development. Energy Policy 2005, 33, 579–594. [Google Scholar] [CrossRef] [Scilit]
  39. Verbeek, R.; Verbeek, M. LNG for Trucks and Ships: Fact Analysis—Review of Pollutant and GHG Emissions; TNO: Delft, The Netherlands, 2015. [Google Scholar]
  40. Osorio-Tejada, J.; Llera, E.; Scarpellini, S. LNG: An alternative fuel for road freight transport in Europe. WIT Trans. Built Environ. 2015, 168, 235–246. [Google Scholar]
  41. Xu, C.; Guo, K.; Yang, F. A Comparative study of Different Hybrid Electric Powertrain Architectures for Heavy-Duty Truck. IFAC-PapersOnLine 2018, 51, 746–753. [Google Scholar] [CrossRef] [Scilit]
  42. Borthakur, S.; Subramanian, S.C. Optimized Design and Analysis of a Series-Parallel Hybrid Electric Vehicle Powertrain for a Heavy Duty Truck. IFAC-PapersOnLine 2018, 51, 184–189. [Google Scholar] [CrossRef] [Scilit]
  43. Kast, J.; Morrison, G.; Gangloff, J.J.; Vijayagopal, R.; Marcinkoski, J. Designing hydrogen fuel cell electric trucks in a diverse medium and heavy duty market. Res. Transp. Econ. 2018, 70, 139–147. [Google Scholar] [CrossRef] [Scilit]
  44. Giuliano, G.; Dessouky, M.; Dexter, S.; Fang, J.; Hu, S.; Miller, M. Heavy-duty trucks: The challenge of getting to zero. Transp. Res. Part D Transp. Environ. 2021, 93, 102742. [Google Scholar] [CrossRef] [Scilit]
  45. ECOPETROL. A new database of on-road vehicle emission factors for Colombia: A case study of Bogotá. CTF-Cienc. Tecnol. Y Futuro 2019, 9, 73–82. [Google Scholar] [CrossRef] [Scilit]
  46. Universidad de los Andes. Conveniencia del Gas Natural Vehícular en Colombia: Caso de Estudio Para el Sector de Transporte Público; Universidad de los Andes: Bogotá, Colombia, 2016. [Google Scholar]
  47. European Commission Air Pollutant Emissions Indicator|Mobility and Transport. Available online: https://ec.europa.eu/transport/themes/air-pollutant-emissions-indicator_en (accessed on 20 April 2021).
Publisher’s Note: MDPI stays neutral with regard to jurisdictional claims in published maps and institutional affiliations.

Article Metrics

Citations

Article Access Statistics

Multiple requests from the same IP address are counted as one view.