Article

Tap Water Quality and Habits of Its Use: A Comparative Analysis in Poland and Ukraine

1
Department of Applied Social Sciences, Faculty of Organization and Management, Silesian University of Technology, Roosevelta Str. 26–28, 41-800 Zabrze, Poland
2
Sewage and Water Supply Ltd., Pod Lasem 62, 44-210 Rybnik, Poland
3
Faculty of History and Philosophy, National Pedagogical Dragomanov University, Pyrohova Str. 9, 01-601 Kyiv, Ukraine
*
Author to whom correspondence should be addressed.
Energies 2022, 15(3), 981; https://doi.org/10.3390/en15030981
Submission received: 30 December 2021 / Revised: 24 January 2022 / Accepted: 27 January 2022 / Published: 28 January 2022
(This article belongs to the Special Issue Wastewater, Water and Energy)

Abstract

:
Water, as one of the main media of human existence on earth, is the basis of the functioning of most societies. This article discusses various activities related to water resource management and analyzes the evaluation of selected quality parameters of tap water in Poland and Ukraine. The aim of the manuscript was to compare opinions on tap water quality and habits of its use in Poland and Ukraine, taking into account different seasons of the year as periods of use of supplied water. The hypothesis of the study was that tap water parameters are evaluated differently in Poland and Ukraine at different times of water supply. Due to the complexity of research aspects, a mixed-methods research procedure was used, in which a literature review was combined with a survey and statistical analysis. For the purpose of the survey, the authors’ questionnaire “Survey of customers’ opinions on selected parameters of tap water supplied in Poland and Ukraine” was created. The results of the research confirmed the hypothesis and allowed for the development a model for the evaluation of parameters of tap water supplied on the territory of Poland and Ukraine and to get to know the expectations of customers of these countries. The presented model provides practical indications that can be used to optimize water supply and meet customers’ expectations, including improvement of water quality parameters.

1. Introduction

Quantitative water resources on the globe are unchanging and have a closed circulation. The water layer of the globe consists of surface water and groundwater, as well as water present in the atmosphere, the upper layer of the lithosphere, the pedosphere and the biosphere (as the basic component of living organisms, man). Water is ubiquitous in the environment and is also necessary in all industries, including the energy sector, where it is both a direct source of energy and an integral link in the energy transmission chain. The relationships between water and energy and energy and water address many elemental issues, ranging from water management systems and water infrastructure to sustainable energy and efficient systems. The integrated development of energy and water policies is of great importance and cannot be implemented in isolation. With the high risks that the energy sector is currently facing, it is more important than ever to include water in its strategic plans, also keeping in mind ongoing climate change.
Households use 36% of the world’s groundwater resources [1]. Especially in urban areas, they are associated with social and economic development and activities. However, there are deep concerns that due to rapid urban development and water exploitation, these resources will be depleted quickly [2]. According to some researchers [2], groundwater should only be an alternative supply of this resource during periods of drought. However, changes occurring due to industrialization, urbanization, seasonal variability and climate change may destructively affect this perception of this source. Climate change can have an impact on groundwater availability due to irreversible differences in rainfall intensity and fluctuations in groundwater supply [2]. Studies indicate [3,4] that industrial activities, improper water management and municipal waste are potential sources of groundwater contamination. With such risks, groundwater may not be suitable for potable human use, and there will be a need to use wells to prevent health risks.
For the concerns of consumer satisfaction and trust in tap water quality to be addressed, consumer perceptions must be well understood [5]. The opinions and complaints of tap water consumers express their evaluation of the quality of the water supplied. Such information can also help to improve the management of tap water quality [6]. The perception of water quality according to consumers can be influenced by factors such as contaminants and the various resulting concerns, as well as unpleasant organoleptic properties [7]. In addition, these factors may include trust or lack of trust in the water supply system, its purity [8], the relationship between chemical composition and organoleptic properties and water supply interruptions [9]. Secondary sources, i.e., private wells, bottled water, water delivery trucks, reservoirs and innovative new technologies to extract water from the environment could be an alternative to using tap water. Of course, these are alternatives more costly, but when natural sources are not sufficient, consumers may make the decision to pay a surcharge to ensure their security [10]. Viewed from this perspective, the choice between tap water and bottled water may also be economically based, in favor of the former [11]. Convenience may be the main argument for bottled water, while price and environmental hazards may be arguments against its use. An important issue is to leave the consumers a free hand in choosing the water they will use. As indicated by [3], the ease of access to alternative water sources often favors greater use of groundwater at the expense of, for example, bottled water.
The quality and security of the tap water supply are dependent on factors such as climate change, land use, soil fertilization practices, hypoxic conditions or increasing concentrations of metals that threaten water quality in lakes and reservoirs [12]. Groundwater and surface water intakes are the most reliable source of tap water, which, unfortunately, are becoming increasingly polluted by widespread use of chemical fertilizers and extensive urbanization [13]. The exploitation of ground and surface water in Europe has undergone a definite transformation over the last 200 years. Today, western and central Europe obtain most of their tap water from these sources. In Italy, Iceland, Austria, Denmark and Lithuania, groundwater accounts for 90% of total water use [14]. In France, Sweden and Finland, groundwater accounts for 50% of consumption. The same is true in Germany and the Netherlands, where the range is from 50 to 79%. In England, groundwater accounts for 30–35% of tap water. The lowest rate is in Norway, at about 15%. Serbia has a high percentage of use of ground and surface water for drinking purposes, reaching up to 70% [15]. The security of the tap water supply is also affected by economic growth and expanding global population, use of pharmaceuticals, aging population, increasing production, consumption of chemicals, increase in pollutants in tap water and intensification of agriculture and livestock farming. Confidence in tap water is being eroded by increasingly frequent reports relating to its contamination. Assessments of the risk to human health are made quantitatively and qualitatively, including the risk level for human health and the impact of consumed water on the health and well-being of consumers [15].
Referring to the above considerations, the aim of the article is to compare opinions about the quality of tap water and the habits of its use in Poland and Ukraine, taking into account the different seasons of the year as periods of use of the supplied water. The hypothesis that tap water parameters are evaluated differently in Poland and Ukraine at different times of water supply was assumed in the study. The comparison between Poland and Ukraine is due to the specificity of infrastructure and the difference in the level of water resource management in Eastern European countries, discussed in the document of the European Bank for Reconstruction and Development (EBRD) dated 15 December 2017 [16]. Social expectations in individual states, i.e., Poland and Ukraine, are also not without significance. The Polish water supply and sewage system, as well as its management structure, has recently been strongly supported by EU funds to meet the requirements of the Water Framework Directive [17] and the later adopted Water Law [18]. Ukraine, on the other hand, with its water supply and sewage infrastructure, still requires large investments. According to V. Magaletskaya, head of the State Service of Ukraine for Food Safety and Consumer Protection in Kiev, Ukraine may face a shortage of high-quality tap water within a few decades [19]. Additionally, according to Magaletskaya, there are currently outdated water quality requirements in Ukraine, which, moreover, most suppliers do not meet. The State Service of Ukraine for Food Safety and Consumer Protection supports the adaptation of Ukrainian legislation to European norms by modernizing the standards using the experience of European Union member states [20].
Accordingly, the following research questions were posed in this paper:
  • Do habits related to the use of tap water differ between Poland and Ukraine?
  • Does the evaluation of individual parameters of tap water differ between Polish and Ukrainian consumers in any period?
  • Are any parameters of tap water similarly rated among Polish and Ukrainian consumers in particular seasons of the year?
  • What are the evaluations of various parameters of tap water supplied in Poland and Ukraine for all seasons of the year?
The structure of the remainder of the manuscript begins with a literature review on the risks and safety of water resource management. Next, various indicators used to assess water quality in Poland and Ukraine are characterized. This is followed by a description of the research methods and the results of comparative statistical analysis and discussion. In the next section, conclusions, which could serve as guidelines for improvement of water resource management methods in Poland and Ukraine, are presented. Finally, some limitations are pointed out, and possibilities for future research in this area are discussed.

2. Literature Review

The risks associated with tap water safety are a challenge not only in terms of water treatment but also in the context of various social systems. Water supply problems can be dealt with more efficiently if there is positive cooperation between managers and the local community. The issue of the community’s trust in those responsible for the safety of the water supply is of great importance, which can be demonstrated by the local community’s belief in tap water as a beverage. In addition to trust in the water supplier, the taste, odor and appearance of the water, as well as its compliance with the regulations of the Ministry of Health [21] are extremely important characteristics. These parameters determine whether it is treated as a foodstuff or loses the competition with bottled water. The factors that influence the choice of tap water for drinking are demographic characteristics, i.e., income, education level and gender. There is an interesting discrepancy between the technical parameters for assessing the safety of drinking water and the intuitive and cultural approach of consumers, the so-called perception gap, which is the discrepancy between expert assessment and intuitive perception [22].
Some of the biggest threats to groundwater and surface water are related to the use pesticides and nitrates. As indicated by the European Environment Agency (EEA) in a 2018 report, extensive regulations and policy frameworks have been developed that address both the water and agricultural sectors, as well as environmental protection, pollution and land use [23]. In addition to these legal obligations, there are many other initiatives being developed at both local and regional scales that are intended to lead to the conservation of tap water resources [24]. Such activities were already undertaken much earlier, i.e., in the 1990s [25], when it was realized that the existing legal framework was insufficient to adequately protect tap water resources from agricultural pollution [26]. However, it should be emphasized that legal regulations have differing effectiveness in improving water quality. An innovative European program, the European Innovation Partnership for Water (EIP Water) [27], identified a number of inconsistencies in national policies regarding regulations and governance structure, the improvement of which would affect the development of the sector. The Partnership was active from 2012 to 2020 as an initiative under the EU 2020 Innovation Framework. EIP Water facilitated the development of innovative solutions to address major European and global water challenges. At the same time, it supported the creation of market opportunities for these innovations, both within and outside Europe [27].
From the research conducted in Europe [28], it can be concluded that the all-European legislation concerning the protection of tap water resources often does not translate into practice at the local level in relation to agricultural pollution. The inconsistencies of the European legislation cannot be ignored, and at the same time, the directions in which the legislation should be changed can be observed. The necessity of parallel action at many levels and intersectoral activities [26,29] in the field of water policy and other policy areas (i.e., energy or agriculture) can be noticed. In order to bring about sustainable changes in this area, it is often necessary to start transformations from the local or regional level and only then extend the scope of activities. This is difficult, as conflicts of interest between the various levels of management and policy are frequent. Research results [30,31] also show that particular solutions at the level of individual units are not adequate for national and EU legislation. The favorability of cross-sectoral solutions for the level of local problems could facilitate the interaction of stakeholders and thus increase the effectiveness of actions.
It is also necessary to mention the problems of water scarcity caused by climate change, which are particularly harsh in the agricultural sector in arid and semi-arid areas. Water used for irrigation of crops in agriculture is of great importance due to food production [32]. Studies [33] indicate the relationship between agriculture and water resources in Italy, where the presence of critical factors of agricultural and environmental policies has been highlighted. One of the most important factors, is that agriculture is not included in the central management of water resources at an institutional level, but there are specific institutions and agencies that manage water for this sector [33]. It is therefore important to plan appropriately for water use in agriculture, as permits for water intake for irrigation often expire or are not updated, and their renewal can be time-consuming [33]. Advanced models can also be found in the literature, used to forecast crop watering demand in relation to satellite weather forecasts [34]. Undoubtedly, the public sector plays a significant role in water resource management, through its ability to introduce appropriate regulations and incentive measures to better manage water resources [32]. According to a WHO study [35], at least two billion people worldwide are at risk from water contaminated with fecal matter, especially Escherichia coli. In 2015, as many as 1.31 million people died due to diseases caused by the presence of fecal bacteria in tap water. This could have been prevented by guaranteeing an adequate water supply through efficient sanitation facilities or proper hygiene and healthcare measures [36]. This is unfortunately a global problem, especially in low- and middle-income countries [14]. Agricultural activities, including the use of manure on agricultural land or cattle grazing, contribute to this state of affairs. Competitive organic offerings are unable to prevent the threats posed by these agricultural activities. Escherichia coli, an indicator of fecal contamination, is present in natural water, groundwater and sewage.
Consumption of water containing a certain amount of some metals can lead to health problems, such as cancer. In particular, the problem lies in metals and metalloids, such as cadmium, zinc, iron, selenium cobalt, copper, chromium, vanadium or molybdenum. Some of them are essential for growth and reproduction, but their accumulation in excess in the human body is definitely undesirable. On the other hand, non-essential metals, such as lead and cadmium, do not positively affect metabolic activity but may instead have toxic effects on tissues [37].
Proper use of water sources and their protection requires knowledge of changes occurring in ground and surface waters. To determine this, it is necessary to know their hydrochemical characteristics, i.e., pH, specific electrolytic conductivity (EC), total dissolved substances (TDS), concentrations of main anions (CO32, HCO3, Cl and SO42) and concentrations of main cations (Ca2+, Mg2+, Na+ and K+). The hydrologic cycle affects processes such as evaporation, transpiration, selective uptake by vegetation, oxidation, cation exchange, mineral dissociation, secondary mineral precipitation, water mixing and fertilizer leaching [38].
Protection of the water supply is one of the main factors that determine the national security of the country [39]. The quality of tap water is determined by nationwide regulations because it affects the safety of the population. Tap water for human consumption must meet physiological, hygienic and economic needs (disposable income). It is also used for manufacturing products, so its parameters must comply with established standards in organoleptic, microbiological, parasitological, chemical, physical and radiation range [37]. The quality of tap water is regulated at the national and international level. In Poland, tap water is governed by the Regulation of the Minister of Health of 7 December 2017 on the quality of water intended for human consumption [40]. Another document is the Ordinance of the Minister of Maritime Affairs and Inland Navigation of 29 August 2019 on the requirements to be met by surface waters used to supply the population with water intended for human consumption (Journal of Laws of 2019, item 1747) [41]. In Europe, this issue is regulated by Directive 2020/2184 of the EU Parliament and Council of 16 December 2020 on the quality of water intended for human consumption [42]. There is also Directive 2000/60/EC of the European Parliament and of the Council of 23 October 2000 establishing a framework for community action in the field of water policy: the Water Framework Directive [43]. Another document regulating the safety of drinking water for consumers is the International Standard PN-EN ISO 17994:2014-04 Water quality—Guidelines for comparing the relative recovery of microorganisms by two quantitative methods, which replaces the withdrawn PN-EN ISO 17994:2007 Water quality—Criteria for determining the equivalence of microbiological methods [44]. The document, European Standard PN-EN 15975-2:2013-12 Safety of drinking water supply—Guidelines for crisis and risk management—Part 2: Risk management, which covers risk management principles for improving the integrity of the drinking water supply system should also be mentioned. It applies to operators who hold any degree of responsibility for the safety of the drinking water supply throughout the supply chain, from intake to point of use, defined differently in each country. The laws that define the safety of drinking water are as follows: Law of 20 July 2017, Water Law (Journal of Laws of 2018 item 2268 as amended) [45], Act of 7 June 2001 on collective water supply and collective sewage disposal (Journal of Laws of 2019, item 1437) [46], Act of 14 March 1985 on State Sanitary Inspection (Journal of Laws of 2019, item 59) [47].
Water quality tests are carried out by specialized laboratories in accordance with the requirements described in the relevant regulations. Despite this, consumers are sometimes dissatisfied with the quality of tap water, mainly because of its taste, color or odor. The composition of drinking water may vary significantly from one region to another, due to the water transmission system [15]. This may be due to, among others factors, sedimentation of some contaminants, especially metals, resulting from corrosion of water pipes and leaching of various components resulting from water distribution that contaminates tap water. These elements get into the water by contact with corroded elements in pipes, valves, fittings or other elements of the distribution network.
There are about 8700 plants producing drinking water in Poland, of which over 90% [15] are small units producing up to 1000 m3 per day. One of the largest producers of this kind is the Upper Silesian Water Supply Company S.A. in Katowice, one of the largest companies in Europe, which supplies tap water to several million inhabitants of the Silesian agglomeration. This is a specific region in Poland, as its population density is the highest in the country and one of the highest in Europe, which has a negative impact on irreversible changes in the environment. The agglomeration is one of the most rapidly developing industrial regions, where many coal mines, combined heat and power plants, as well as steelworks, are located. Unfortunately, this specificity has a negative impact on the environment, including the quality of ground, surface and underground waters. The conducted research [15] shows that water supplied by the Upper Silesian Water Supply Company S.A. to local water supply companies differs in composition depending on the season of the year. Water quality in Poland is monitored by sanitary inspection, which is subordinate to the Minister of Environment and is managed by the Chief Sanitary Inspector. Water quality is examined on the basis of specified and unitary water bodies. Ground and surface water parameters, in terms of physicochemical, chemical and biological values, are monitored by the Voivodeship Inspector of Environmental Protection [48].
In Ukraine, ground and surface water monitoring is carried out by the Ministry of Environmental Protection, the Ministry of Nature, the Ministry of Health Protection, the Ministry of Agrarian Policy, the Ministry of Utilities, the State Water Management office, the State Agency of Land Resources and the State and Committee of Forest Management. The document regulating the quality of tap water in Ukraine is “MEЖГOCУДAPCTBEHHЫЙ CTAHДAPT. KAЧECTBO BOД. Tepмины и oпpeдeлeния” (Water quality. Terms and definitions) [49]. Touching upon the topic of tap water quality in this country, one cannot ignore the problem of drought, which is growing, especially in Crimea. The level of water in Ukrainian rivers is decreasing, and moreover, due to climatic conditions, they do not freeze and do not purify themselves, which causes heavy water pollution. This condition can have adverse effects on the economy of Ukraine and lead to the imposition of limits on water use. Limitation of water availability on farms causes a severe reduction in agricultural crops and weakening of the economy of Ukraine.
The assessment of tap water quality in Poland is quite different compared to Ukraine. However, the two countries share one common aim, i.e., to determine the actual state of water resources, their proper use and proper protection and regeneration. In Poland, an additional factor is the implementation of regulations introduced by the European Union in this field. Different indicators are examined in relation to specific limit values. These indicators in Poland are biological, physicochemical and chemical parameters. Five classes are used to assess ecological status, allocated on the basis of physico-chemical indicators supporting biological parameters. Class 1: very good; class II: good; class III: moderate; class IV: poor; class V: poor [48]. The assessment of surface water quality in Poland is based on the following scheme (Table 1).
In Ukraine, in turn, surface water quality is assessed on the basis of five classes and seven categories. Of the physical and chemical indicators, the following are used: salinity group, saprobiological water status group and specific indicators group (Table 2).
An important parameter relating to a country’s water resources is its independence in this respect from other countries. The greater the supply through internal resources resulting from rainfall, the greater the security. Poland has a good situation in this hierarchy, as only 11.5% of its water supply comes from abroad. A slightly worse situation is that of the Ukraine, where as much as 30.5% of water resources come from external sources. We can also mention Germany, where this indicator is 69%, the Netherlands, at 88%, or Egypt, with an indicator of 98% [50].
Testing the quality and safety of tap water is an extremely important issue in all parts of the world. In some countries, more time and funds are devoted to tap water testing; in others, it is a marginal interest of state institutions. However, taking into account the significant importance of this issue for human safety [51,52], one can notice a gradual increase in interest in this issue by governments. The EU policy, which tries to standardize some requirements and spread awareness of importance of the problem of water resource management, also plays a big role.

3. Materials and Methods

The aim of this article is the comparison of opinions about tap water quality and habits of its usage in Poland and Ukraine, taking into account different seasons of the year as periods of supplied water. The hypothesis that tap water parameters are evaluated differently in Poland and Ukraine at different times of water supply was adopted in the study. The manuscript is a continuation of research [21] that evaluated water quality in Poland and presented its seasonal variation using the PROFIT model. The comparison between Poland and Ukraine results from the specificity of infrastructure and the difference in the level of water resource management in eastern European countries, as discussed in the document of the European Bank for Reconstruction and Development (EBRD) dated 15 December 2017 [16]. Social expectations in particular states, i.e., Poland and Ukraine, are also not without significance. The Polish water supply and sewage system and its management structure has recently been strongly supported by EU funds to meet the requirements of the Water Framework Directive [17] and the later adopted Water Law [18]. Ukraine, on the other hand, with its water and sewage infrastructure, still requires large outlays. One of the co-authors is a practitioner in the water supply sector and has been a long-term cooperating partner of EBRD in eastern Europe, including Poland. In spreading its mission in eastern Europe, EBRD has always shared knowledge that has helped to improve the management of the municipal water and wastewater sector.
Empirical material was collected by means of the authors’ survey questionnaire (title: “Study of customers’ opinions on selected parameters of tap water supplied in Poland” and “Study of customers’ opinions on selected parameters of tap water supplied in Ukraine”, depending on the surveyed group). The questionnaire contained 13 questions (three of them concerning anonymous sociodemographic information, and the same number of questions concerning habits connected with the use of supplied tap water). Seven questions asked respondents to evaluate selected tap water parameters (i.e., taste, odor, color, turbidity, hardness, pressure and continuity of supply) in the context of different seasons of the year (i.e., spring, summer, autumn and winter), indicating the selected response option on a 5-point Likert scale (where 1 = definitely negative, 2 = rather negative, 3 = I have no opinion, 4 = rather positive and 5 = definitely positive). In order to assess the reliability of the above questionnaire, Cronbach’s alpha coefficient of internal consistency was used, the results of which amounted to alpha = 0.97 in the case of the respondents from Poland and alpha = 0.94 in the case of the respondents from Ukraine (both cases correct reliability). The implementation of this study took place through the Internet platform Interankiety.pl between 12 January 2021 and 30 June 2021. People over 18 years of age using tap water who gave voluntary consent to participate were qualified for the study. Other characteristics were randomized. Respondents taking part in the study came from a mixed area of towns and villages across Poland and across Ukraine (invitations to complete the questionnaires were sent out with the help of water supply companies throughout Poland and Ukraine). Links to the online survey were distributed to residents across Poland through 250 water and sewage companies, and the source for creating the address database of water companies was PWiK in Rybnik, Poland, with the support of the ‘Polish Waterworks’ Chamber of Commerce. Requests to place links to the online survey on their websites in Ukraine were sent to 180 water and sewage companies.
The survey was conducted on a sample of 1653 tap water consumers, of which 72.47% were Poles (n = 1198) and 27.53% were Ukrainians (n = 455). Table 3 shows both groups by gender, age and education.
The representativeness of the sample was based on data from all of Poland and all of Ukraine (calculating the minimum sample size), and the survey itself, because it was conducted electronically, was open to respondents living in different parts of the country. The sample size formula for qualitative characteristics (with a finite sample) was used to assess the minimum sample size [53].
In calculating the minimum sample sizes, the general population sizes were assumed:
  • For Poland: 38,265.0 thousand [54], of whom 92.48% [55] used tap water;
  • For Ukraine: 41,328.7 thousand [56], of whom 92.00% [57] used tap water.
Moreover, the above estimations assumed a 95% probability that the result obtained during the research would not deviate from the actual value in the population by more than 3%. The minimum sample sizes estimated in this way were 297 for tap water consumers from Poland and 314 from Ukraine. The achieved sample sizes (1198 and 455, respectively) far exceeded the minimum sample sizes, which made it possible to obtain reliable data.
The collected research material was subjected to quantitative and descriptive analysis. Categorized (non-measurable) variables were presented by means of number and percentage of people characterized by a given characteristic. On the other hand, data on the ratings of individual tap water parameters were analyzed based on a numerical rating scale of 1–5, and the results of these ratings were presented using descriptive statistics and examined for conformity of their distribution with the normal distribution using the Shapiro–Wilk test.
Statistical calculations used:
  • Pearson’s χ 2 test, to examine the relationship between two qualitative variables [57]. On the other hand, Pearson’s contingency coefficient was used as a measure of the strength of the relationship [58].
  • Mann–Whitney U test, to compare two groups in terms of quantitative or ordinal variables [58]. Glass’s rank biserial correlation coefficient was used as a measure of effect size [59].
  • Multivariate correspondence analysis (MCA), to find out the average profile of the recipient and graphically present the co-occurring clusters of segmentation criteria and profile variables. A multivariate correspondence analysis (MCA) was performed to compare the two countries. There was no need to perform this analysis separately for each country. The record of the observed counts of characteristic categories was made using Burt’s matrix (table), which is a product of the form ZTZ, where Z is the code matrix and ZT is the transposed Z matrix [60]. In order to analyze the profiles, the distance between them was calculated using a weighted Euclidean metric [60]. In order to represent the analyzed set of points in a three-dimensional space with full- or nearly full-row diversity information, the method of matrix decomposition by singular values [60] was used.
  • Multidimensional cluster analysis, to extract homogeneous subsets of objects (i.e., factor subgroups), which are more “similar” to objects from a given cluster in comparison to objects from other clusters. Within this analysis, the objects (parameters) were clustered in two ways: hierarchical agglomeration method and non-hierarchical clustering by k-means method. In the case of the former method, Euclidean distance was used as the distance function [60]. On the other hand, Ward’s method was adopted as the principle of binding clusters together. This method aims to minimize the sum of squares of deviations within clusters. At each stage, from among all possible pairs of clusters, Ward’s method selects the pair which, as a result of merging, gives a cluster with the minimum variation. The measure of this variation with respect to the mean value is the ESS expression (error sum from squares), also called error sum of squares [60].
  • PROFIT analysis, to assess the similarity of the studied objects in terms of selected characteristics and to develop a graphical presentation of the results of grouping objects and their relationships to the studied features in the form of a perception map [61].
Statistica v. 13.3 PL statistical package from Tulsa, OK, USA was used to perform the calculations.

4. Results and Discussion

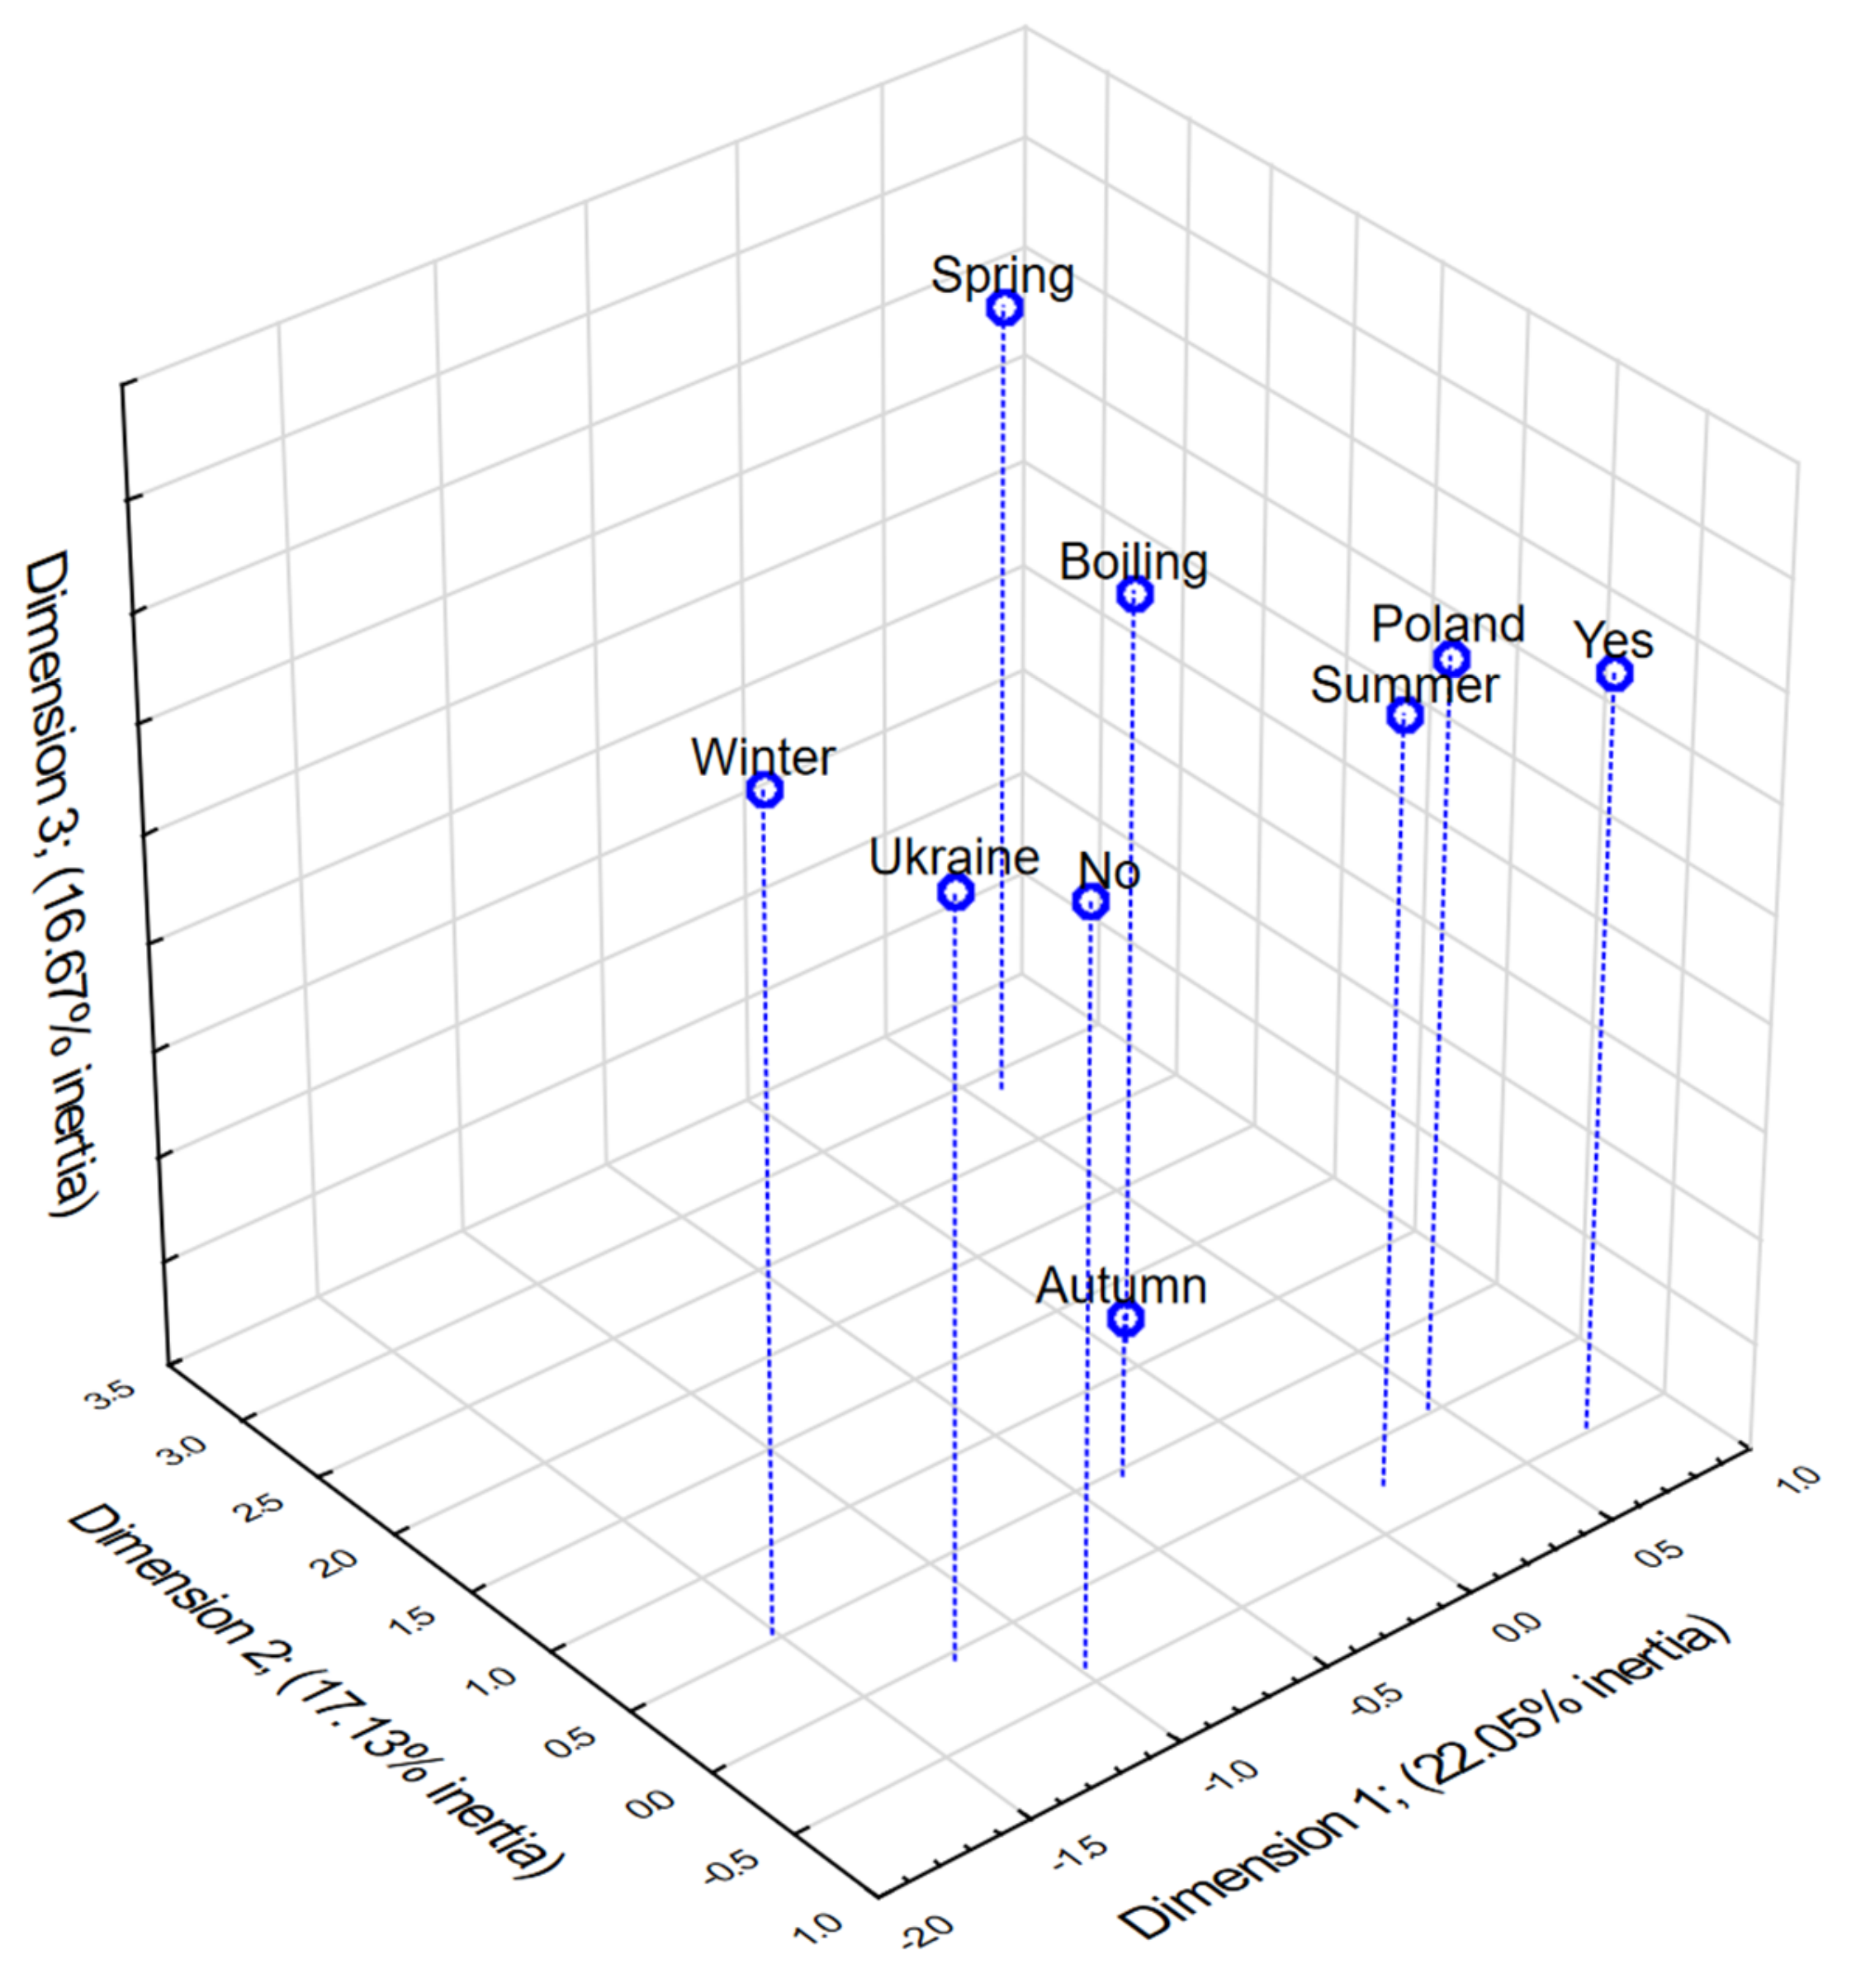
4.1. Study of the Relationship between the State and the Period of Consumption of the Largest Amount of Tap Water Supplied and the Use of Tap Water Directly for Drinking without Boiling

At the beginning of the analysis, multivariate correspondence analysis (MCA) was used to determine the relationship between the categories of variables representing the country (Country), the period of consumption of the largest amount of tap water supplied (Period) and the use of tap water directly for drinking without boiling (Drinking). The data analyzed in this part of the study were recorded in a Burt’s table (Table 4).
Singularities and eigenvalues were then calculated, along with the inertia, to estimate the number of dimensions for the search space. These results showed that the total inertia was equal to 2.00, while three dimensions explained more than half of the inertia associated with the analyzed data. The first dimension allowed for the reconstruction of 22.05% of the total inertia, the inclusion of the second increased the percentage of explained inertia to 39.18%, and the third, to 55.85% (Table 5). Thus, it was advisable to locate the profiles in three-dimensional space.
In the next step, a three-dimensional column coordinate diagram was generated showing the relationship between country, period of time when the largest amount of tap water was consumed and the use of tap water directly for drinking without boiling (Figure 1). According to the results, tap water consumers in Poland consumed tap water more frequently in summer and drank it directly from the tap without boiling. In Ukraine, tap water is used more often in winter and is not consumed directly for drinking (without prior boiling).

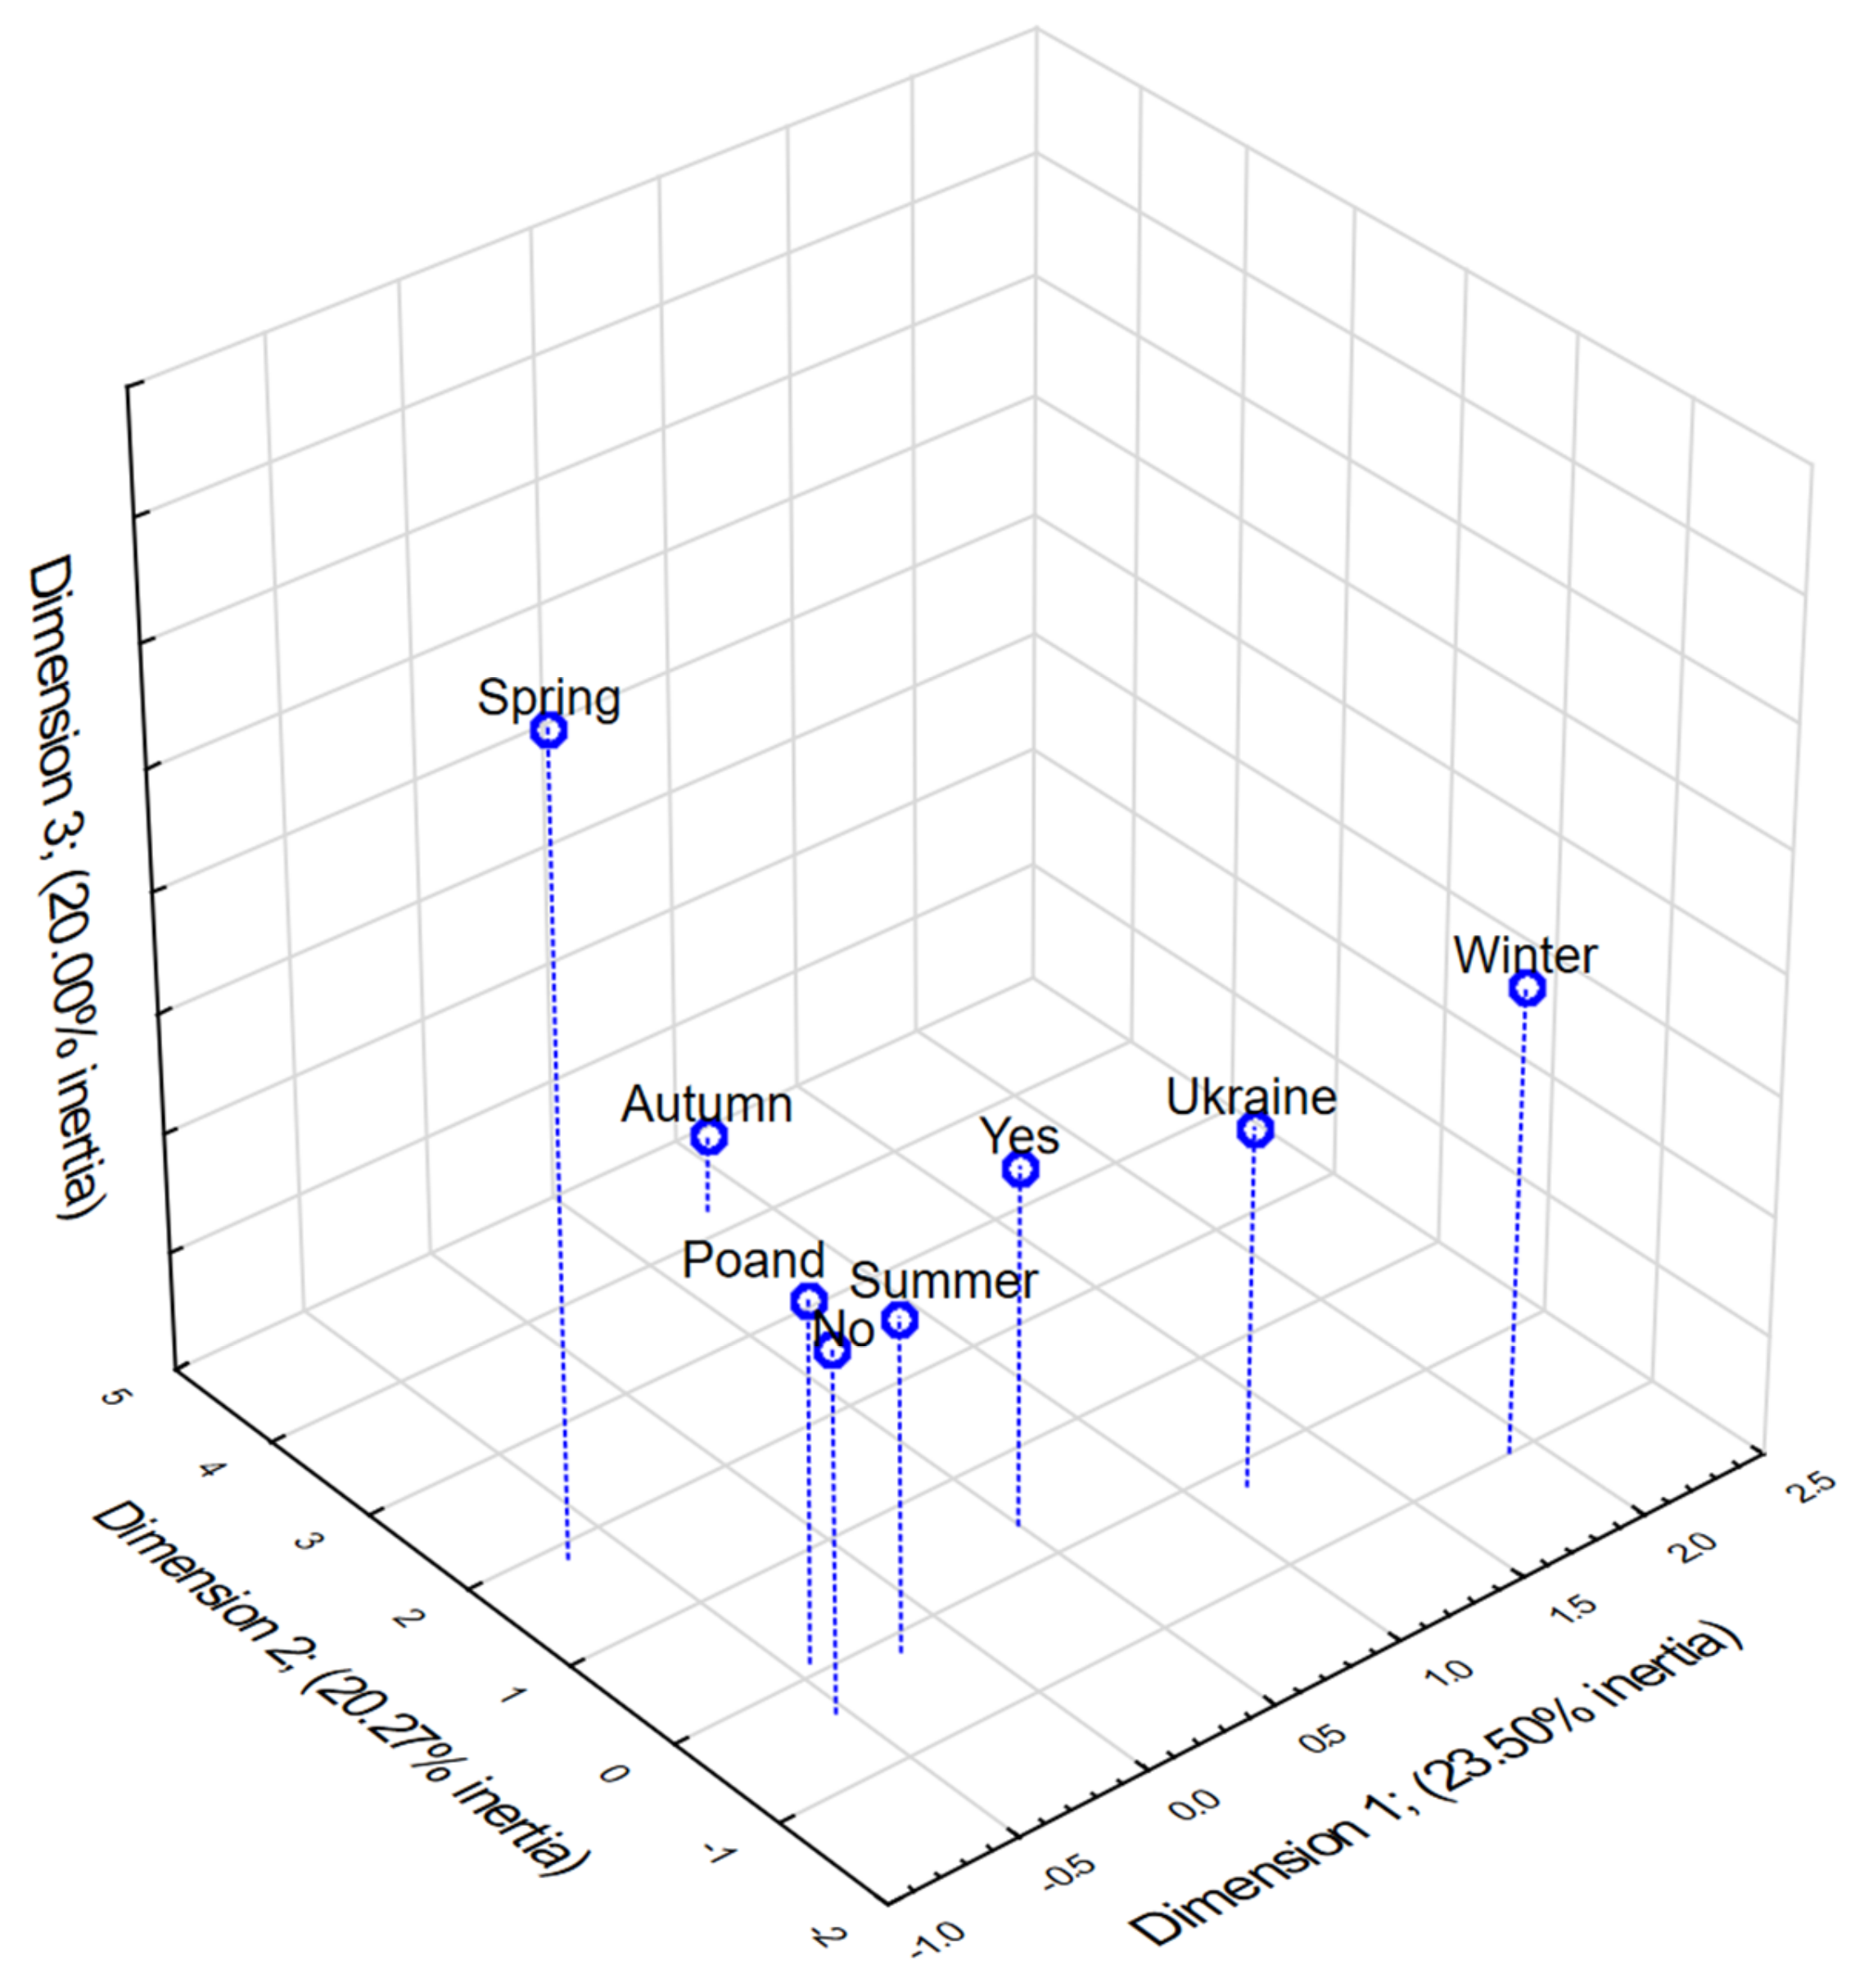
4.2. Examination of the Relationship between the Country and the Period of Consumption of the Largest Quantity of Tap Water Supplied and the Use of an Additional Tap Water Filtration and/or Treatment Device

Multivariate correspondence analysis (MCA) was also used to determine the relationship between the categories of variables representing country (Country), period of consumption of the largest amount of tap water supplied (Period) and the use of an additional tap water filtration and/or treatment device (Device). As before, the data analyzed in this part of the study were recorded in a Burt’s table (Table 6).
Further, in order to verify the number of dimensions for the search space, the singularities and eigenvalues with inertia were calculated. These results are presented in Table 7. It turned out that the total inertia is equal to 1.67 (which means a slightly smaller dispersion around the average profile in comparison to the previous study using MCA analysis). Moreover, the above calculations showed that, as in the previous case, three dimensions explain more than half of the inertia associated with the analyzed data. The first dimension allowed us to reproduce 23.50% of the total inertia, the second dimension increased the percentage of explained inertia to 43.78%, while the inclusion of the third dimension increased the aforementioned percentage to 63.78% (Table 7).
Finally, a three-dimensional column coordinate plot was generated showing the relationships between country, period of time when the largest amount of tap water was consumed and the use of an additional device for tap water filtration and/or treatment (Figure 2). The results show that in Poland, tap water consumers consumed tap water more frequently in summer, without using any additional tap water filtering and/or treatment facility. In Ukraine, tap water was used more frequently in winter, but additional devices for filtering and/or treating tap water were used.

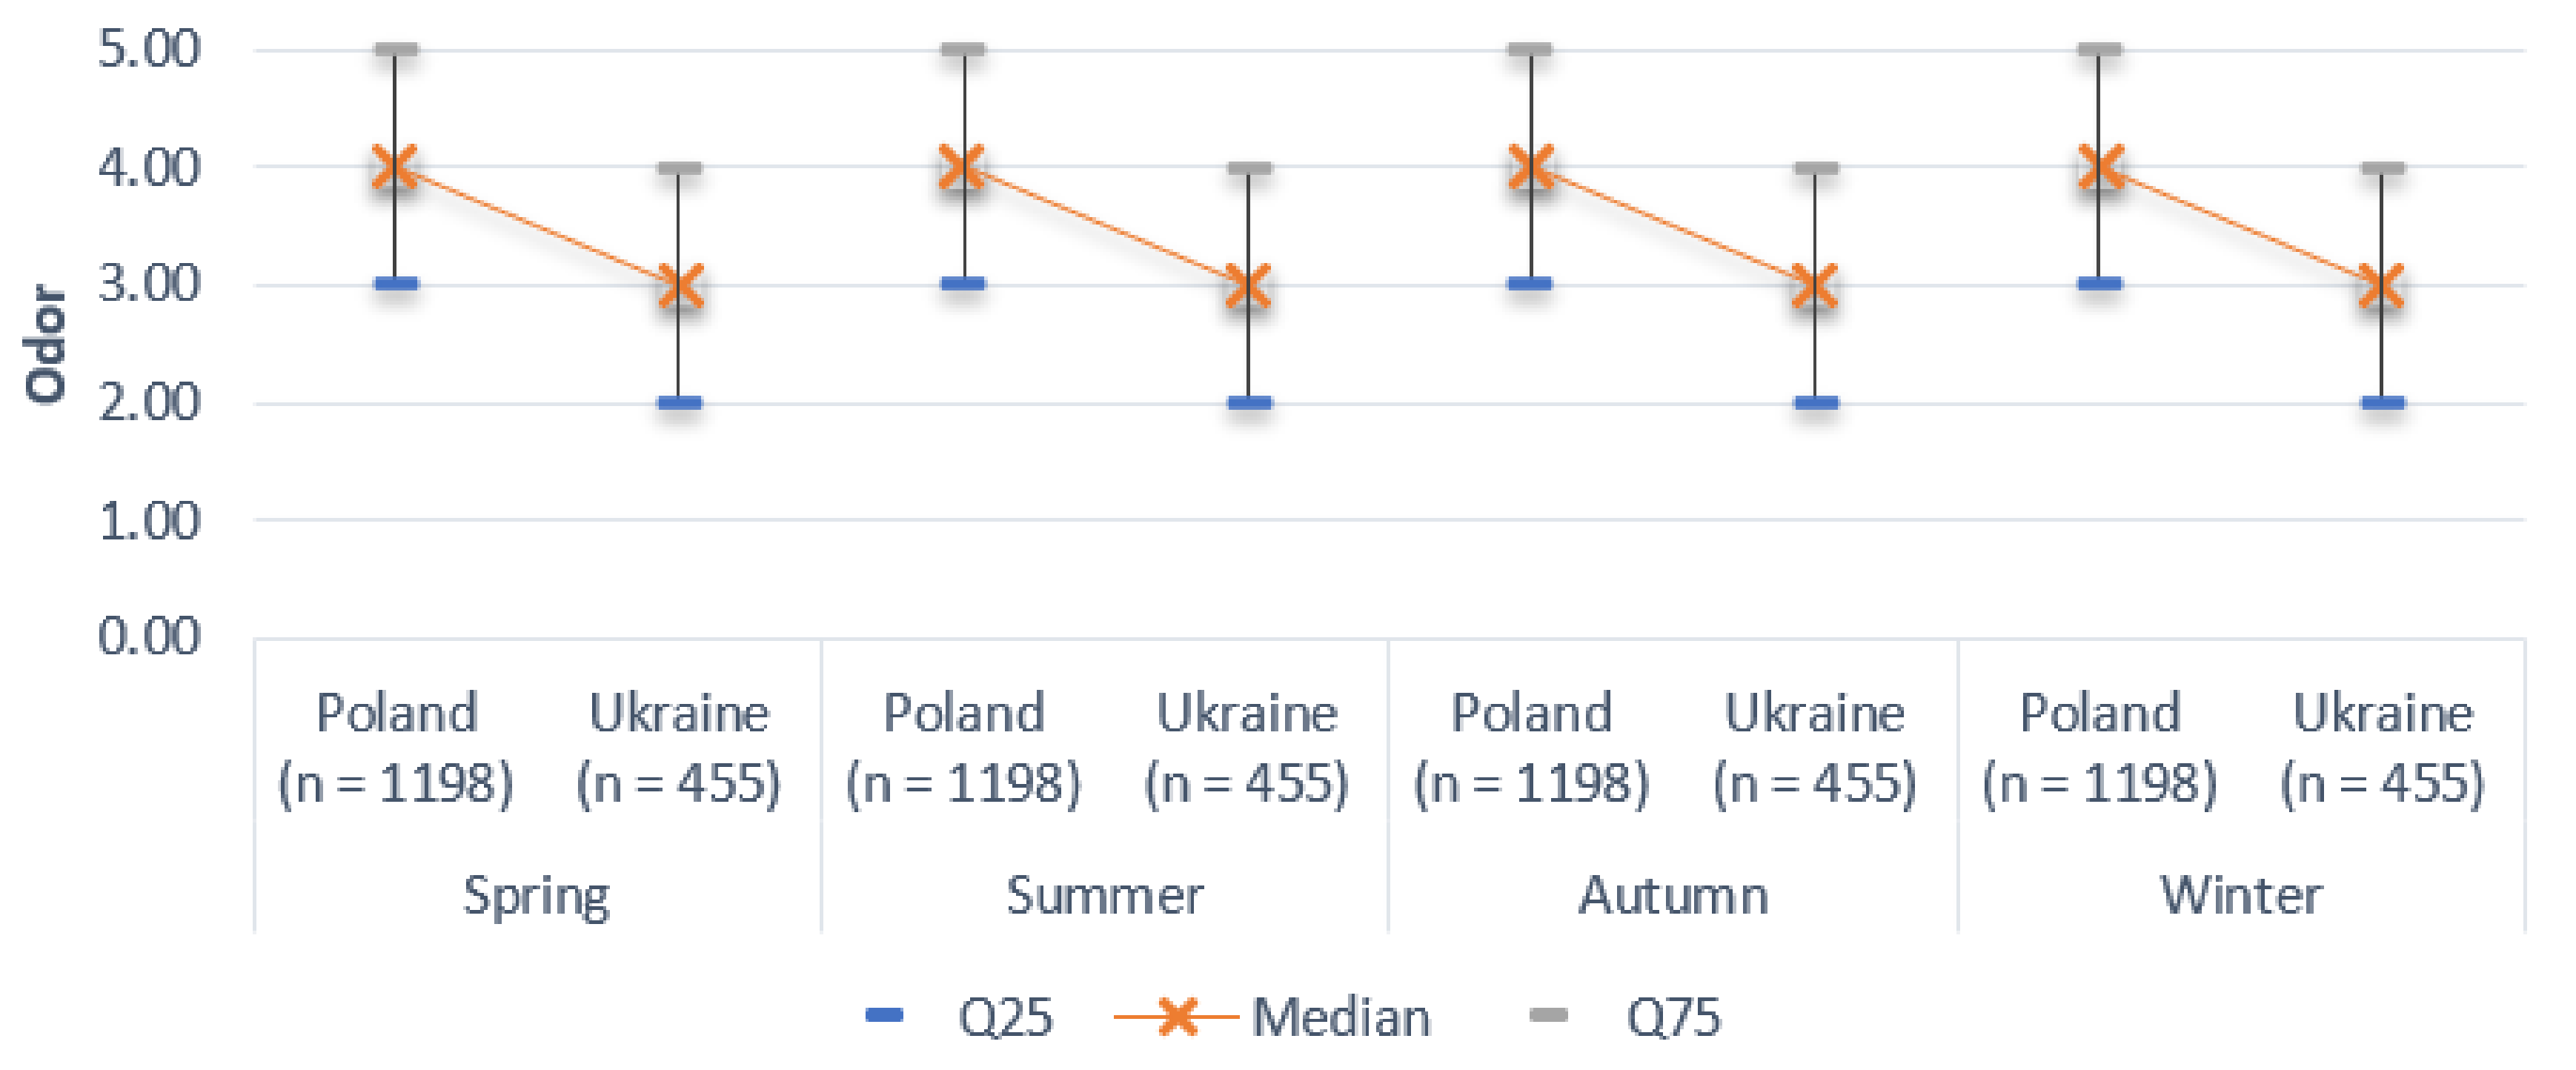
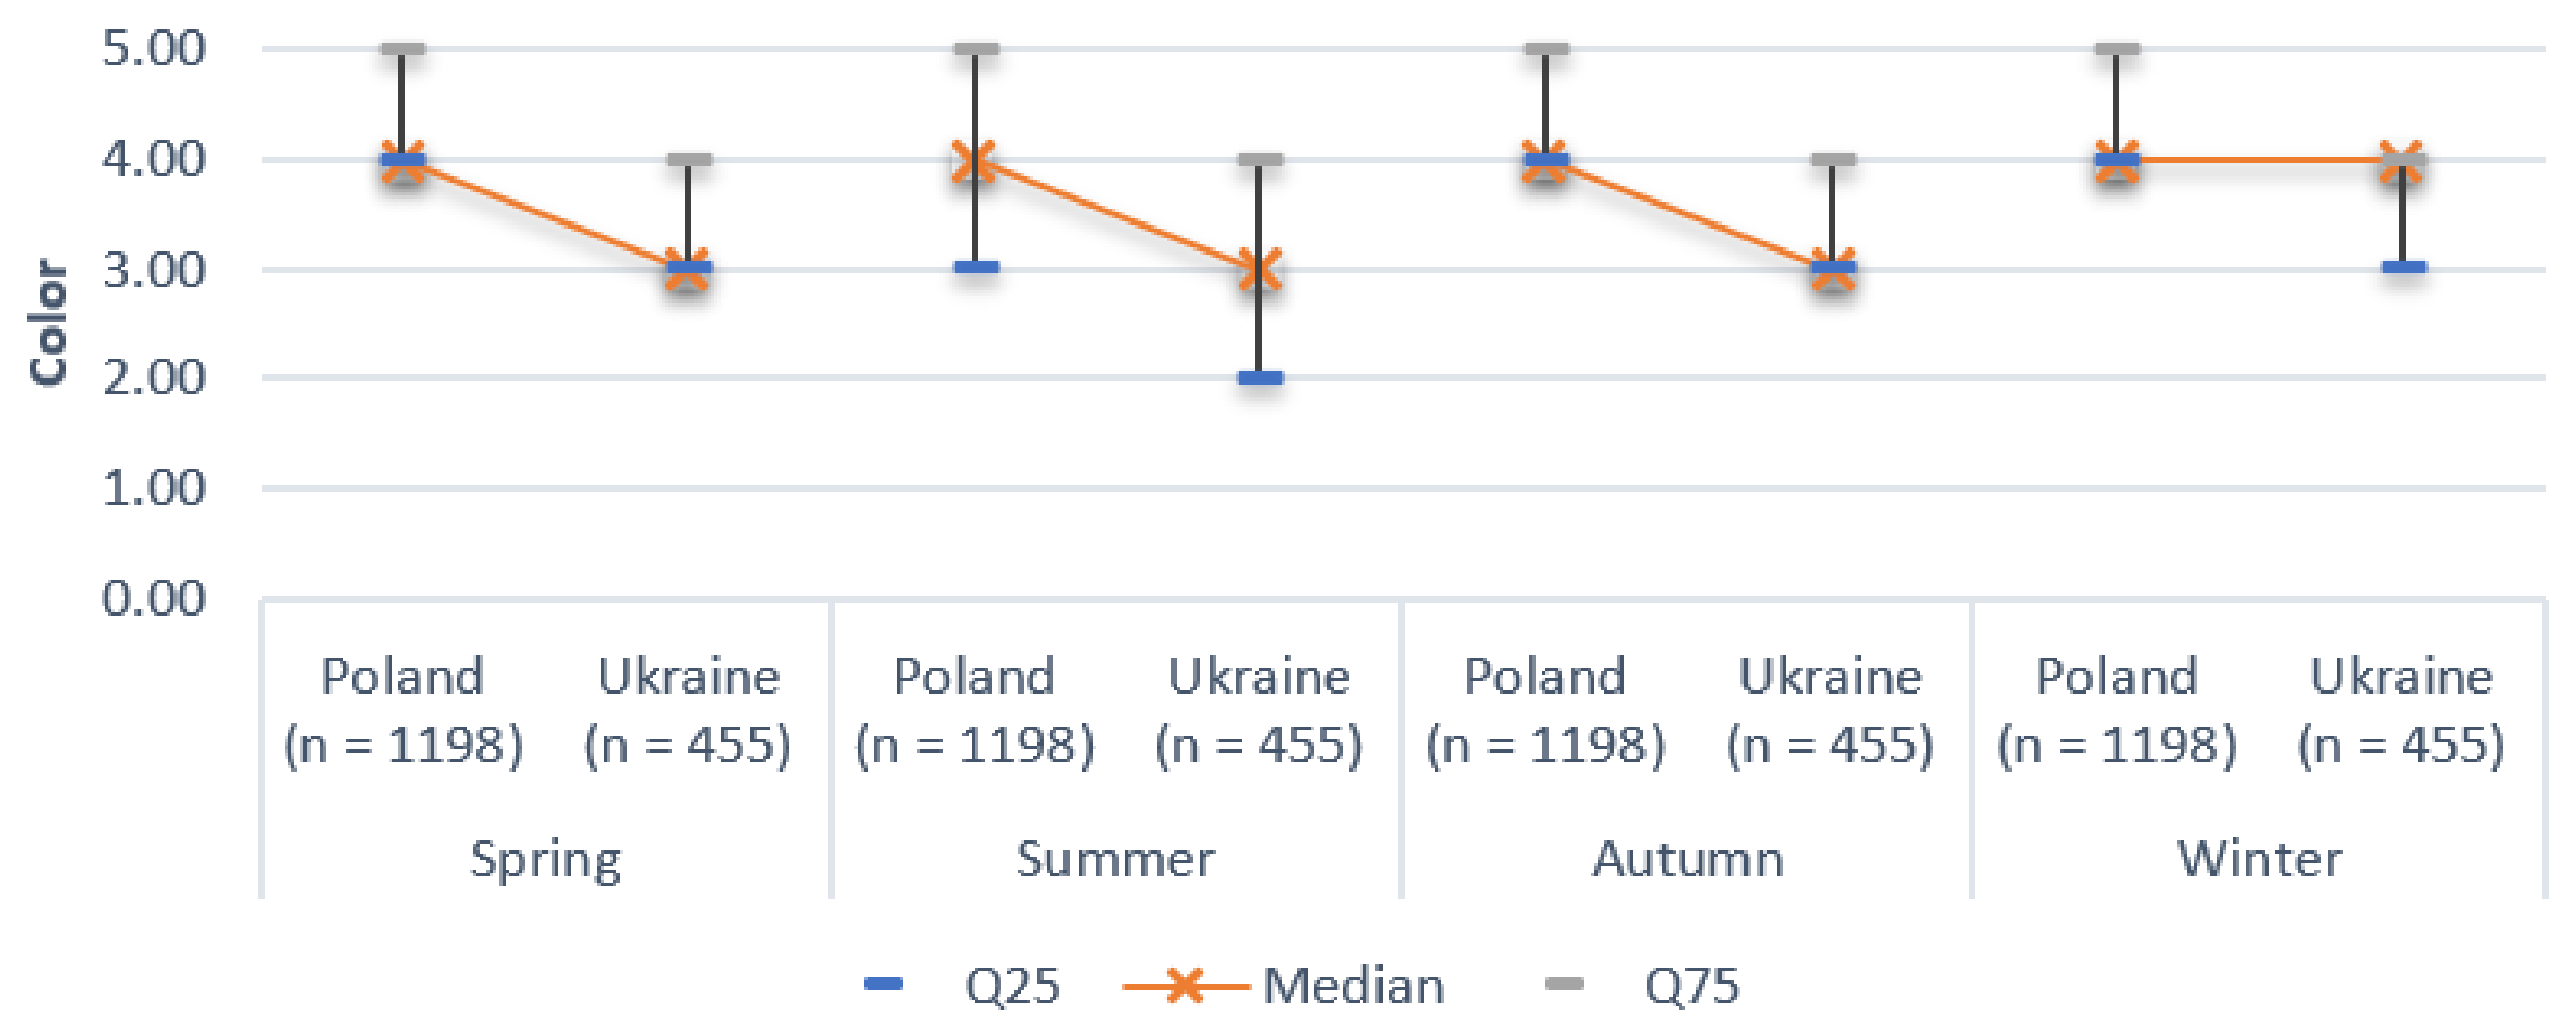
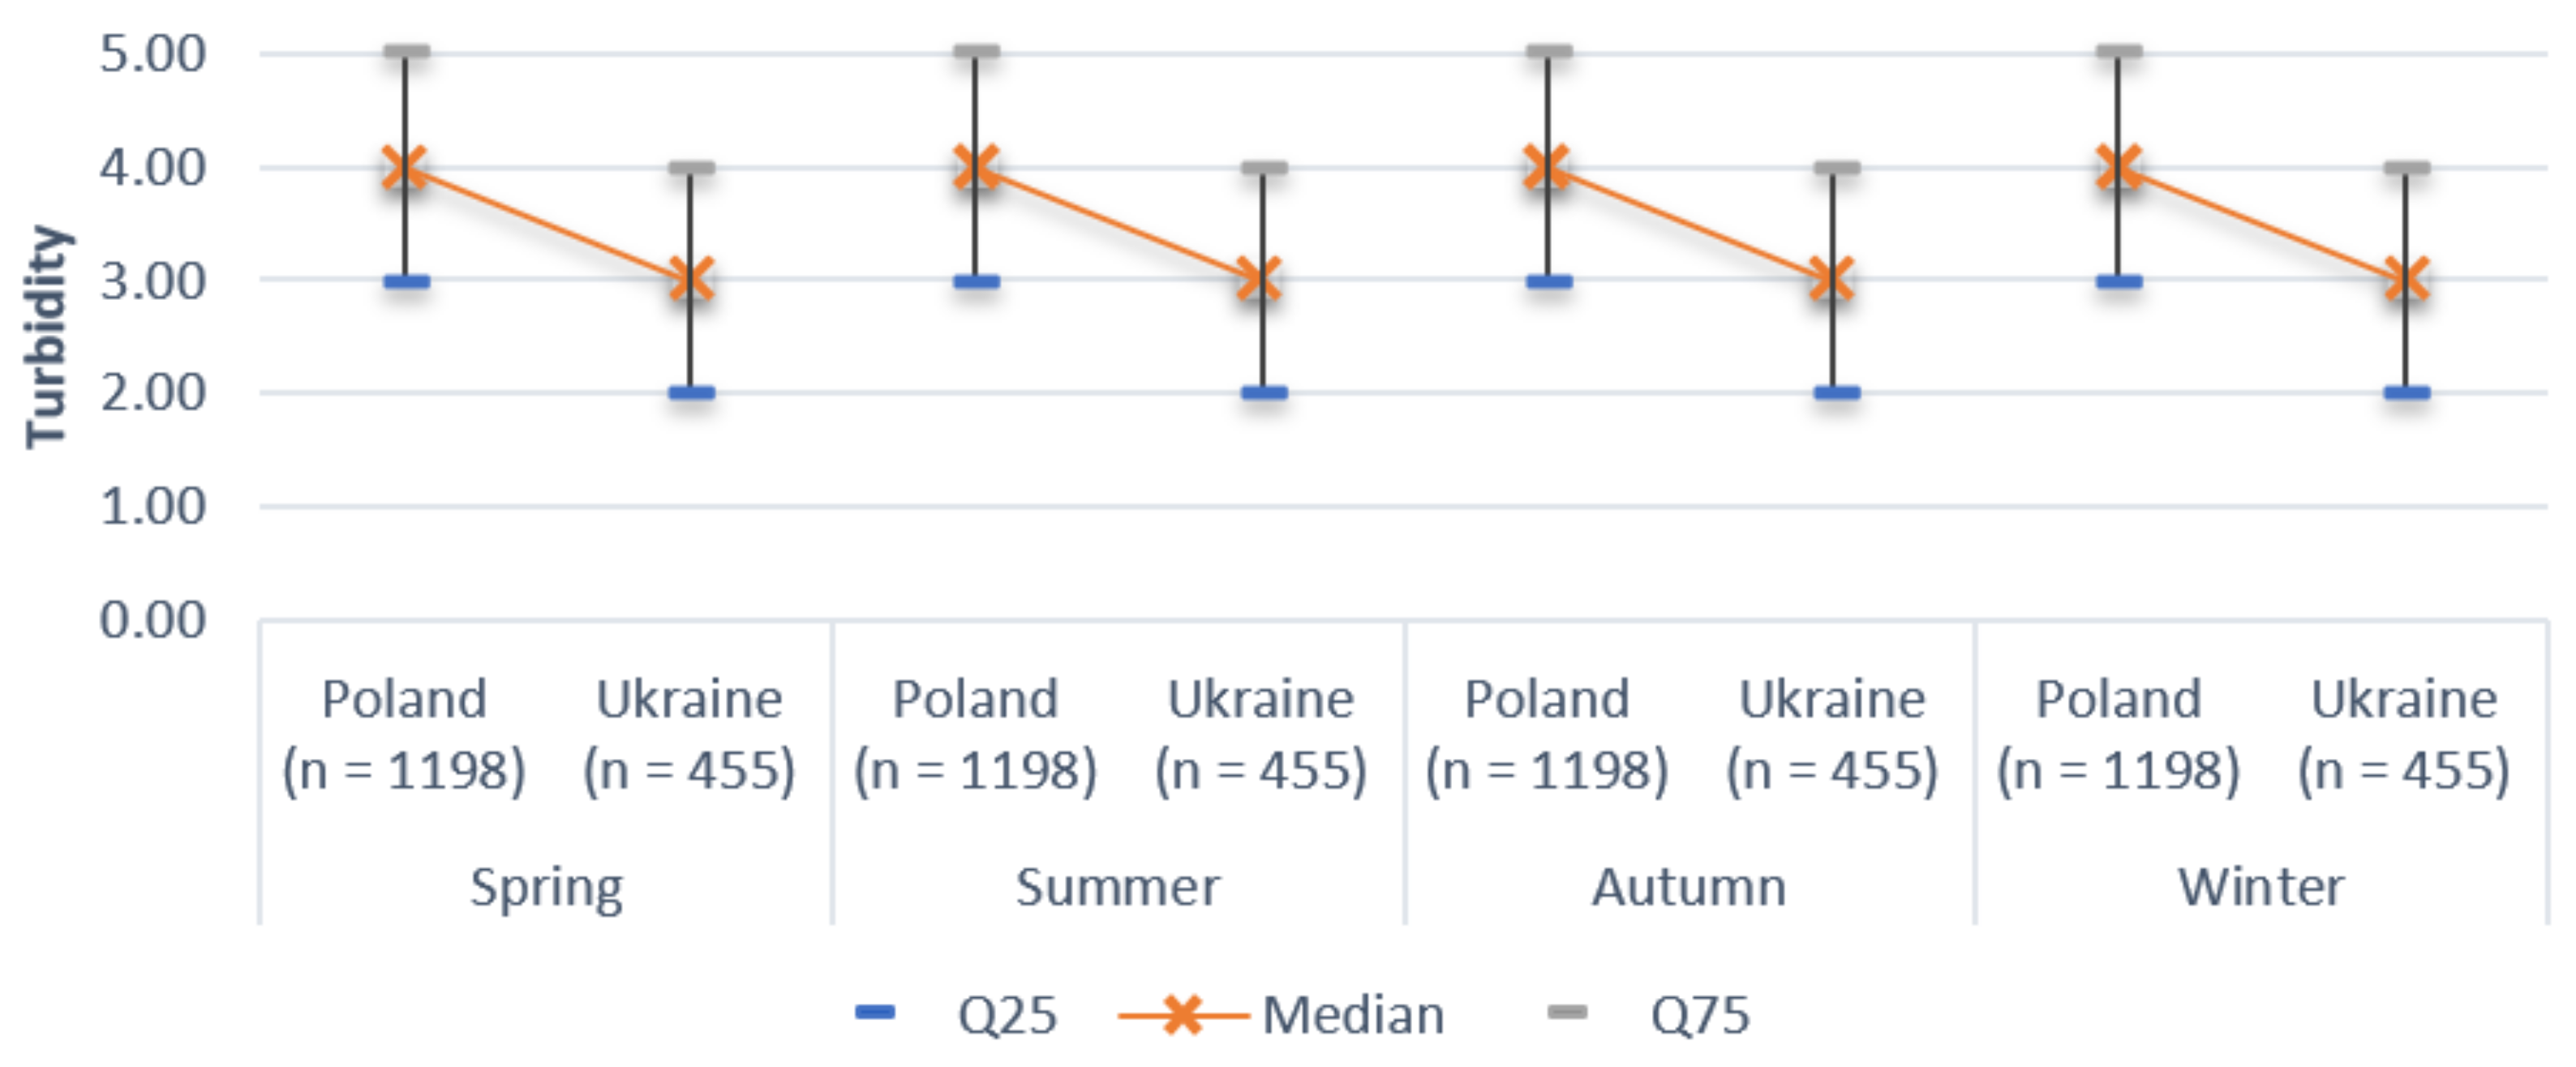
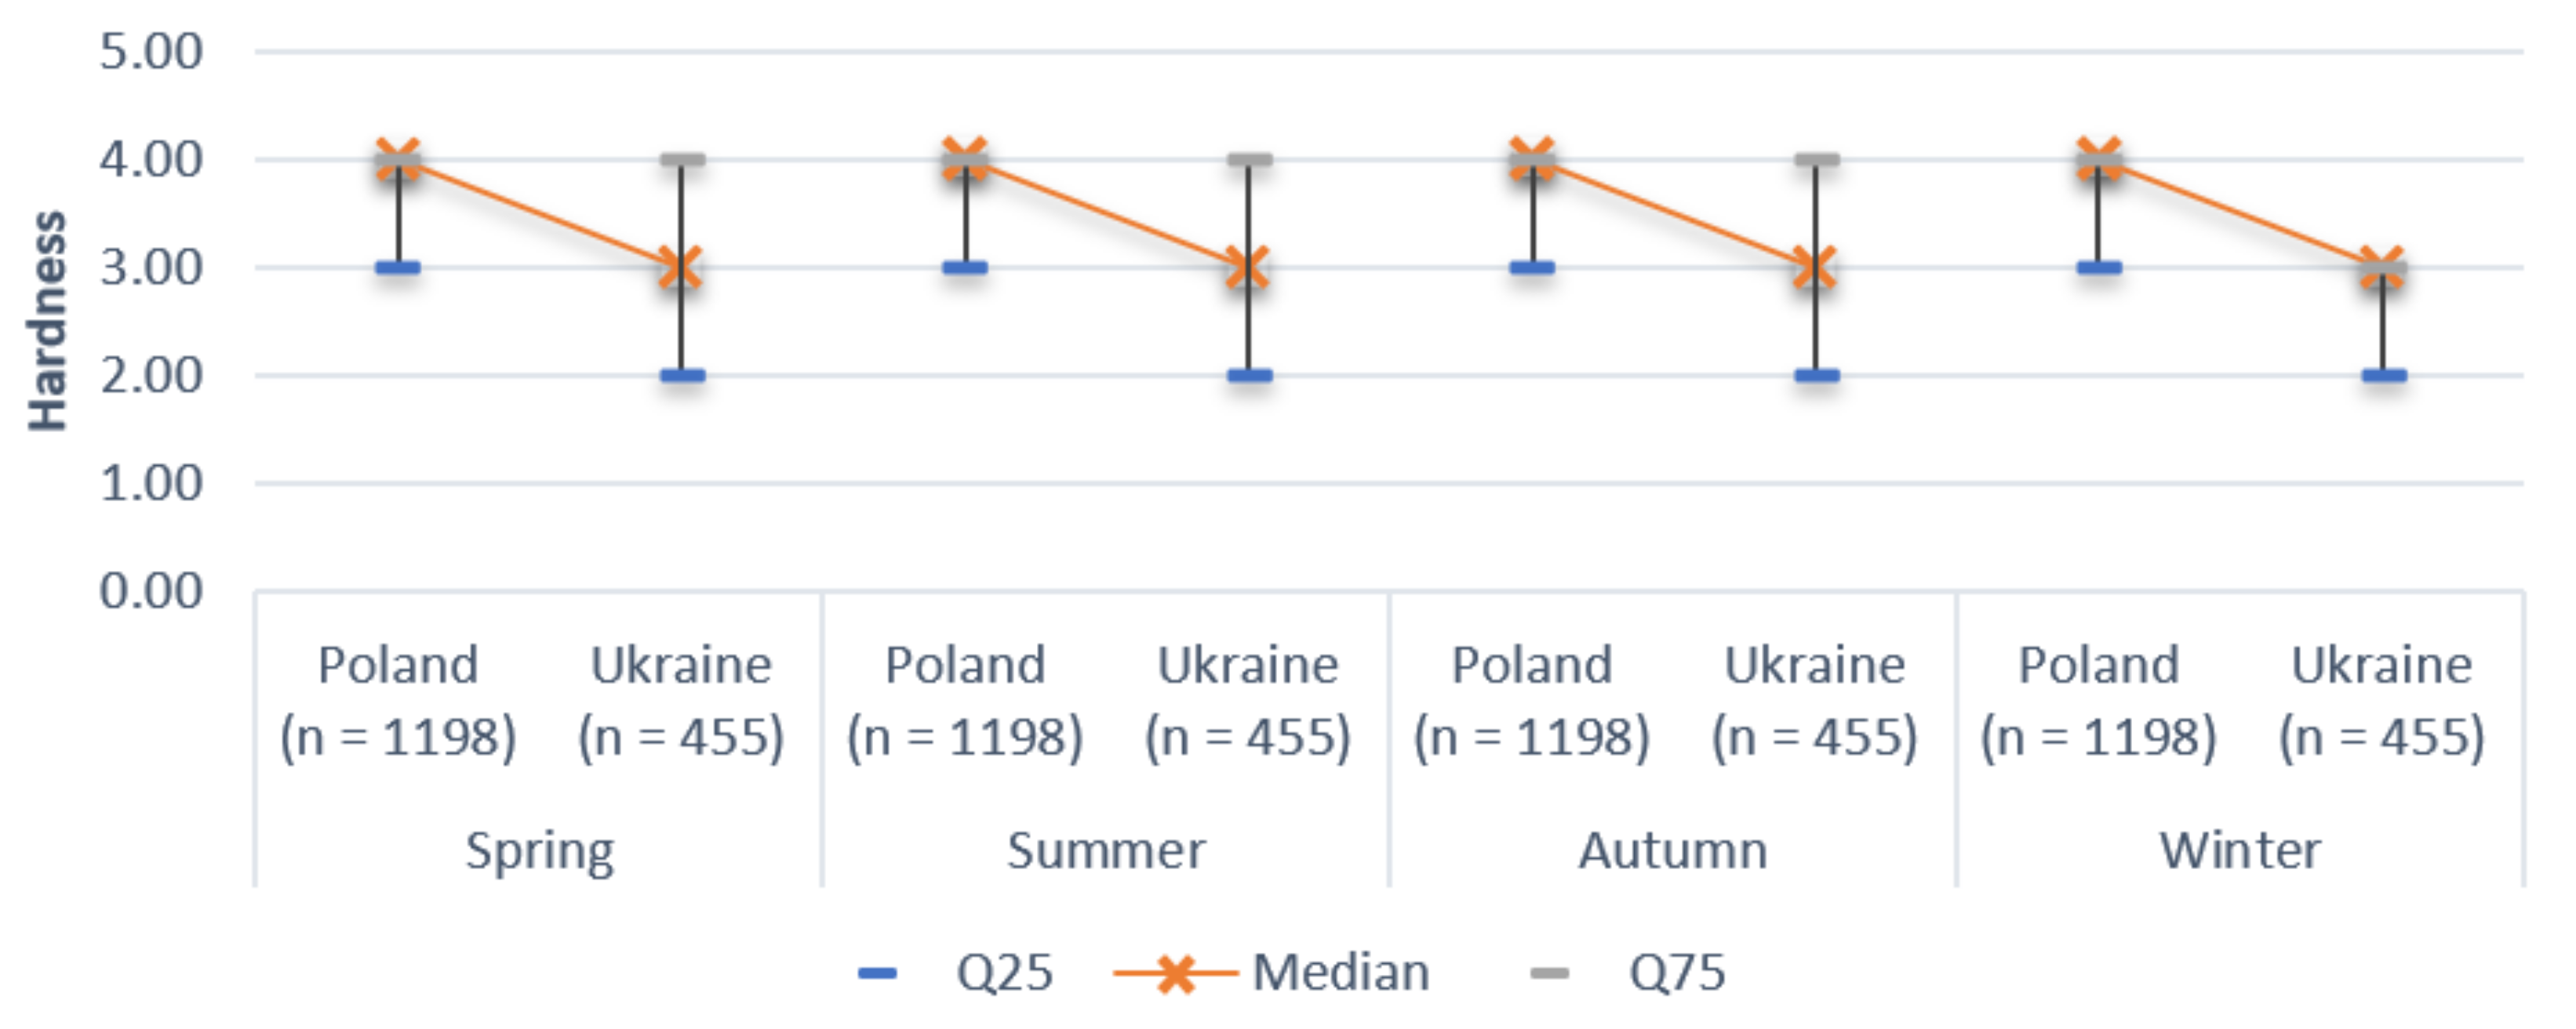
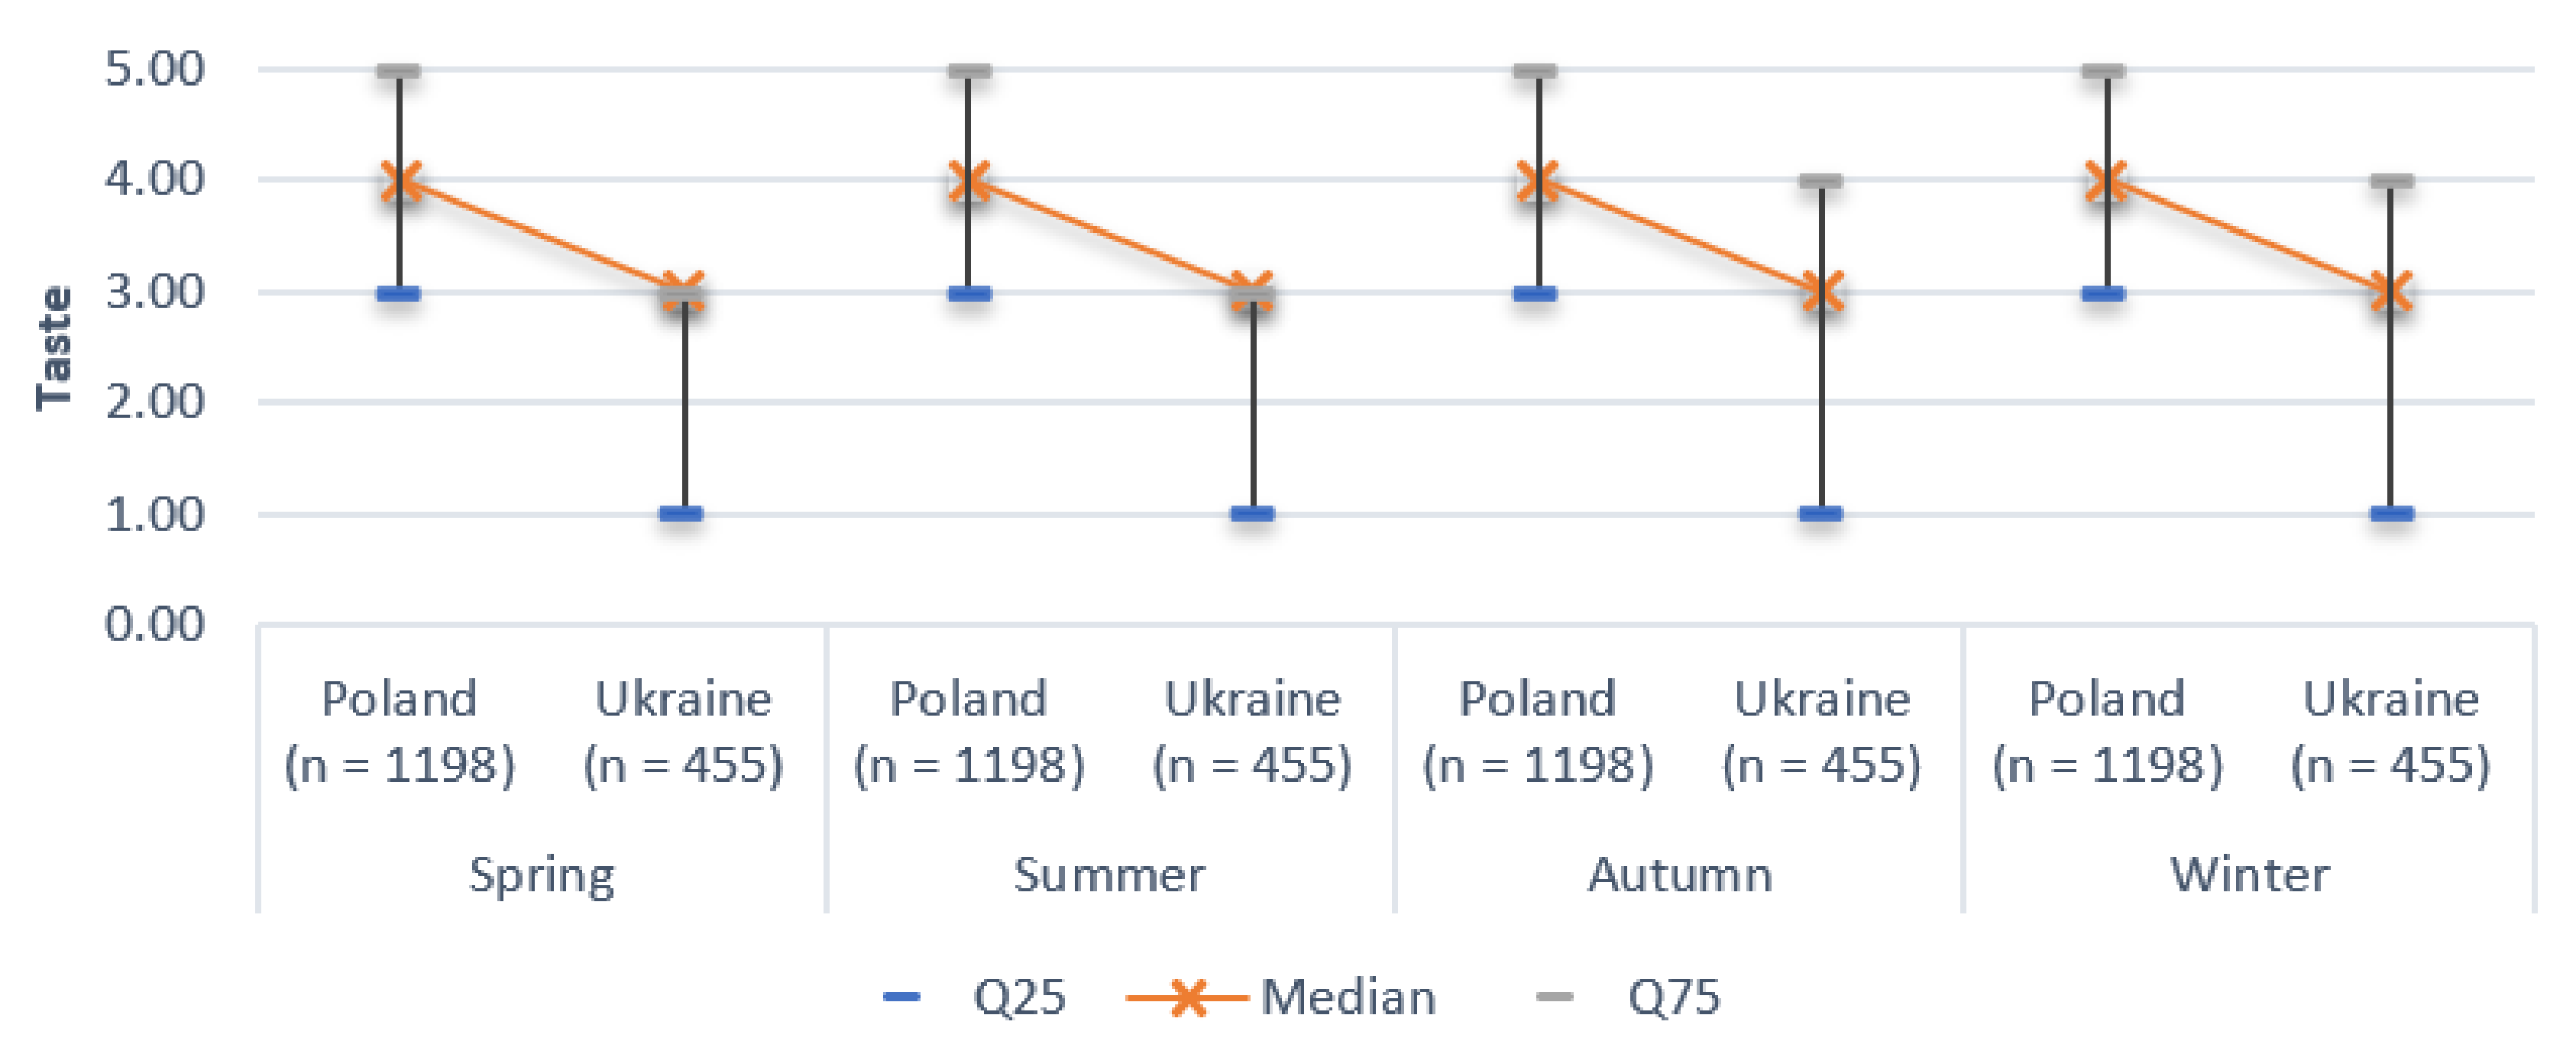
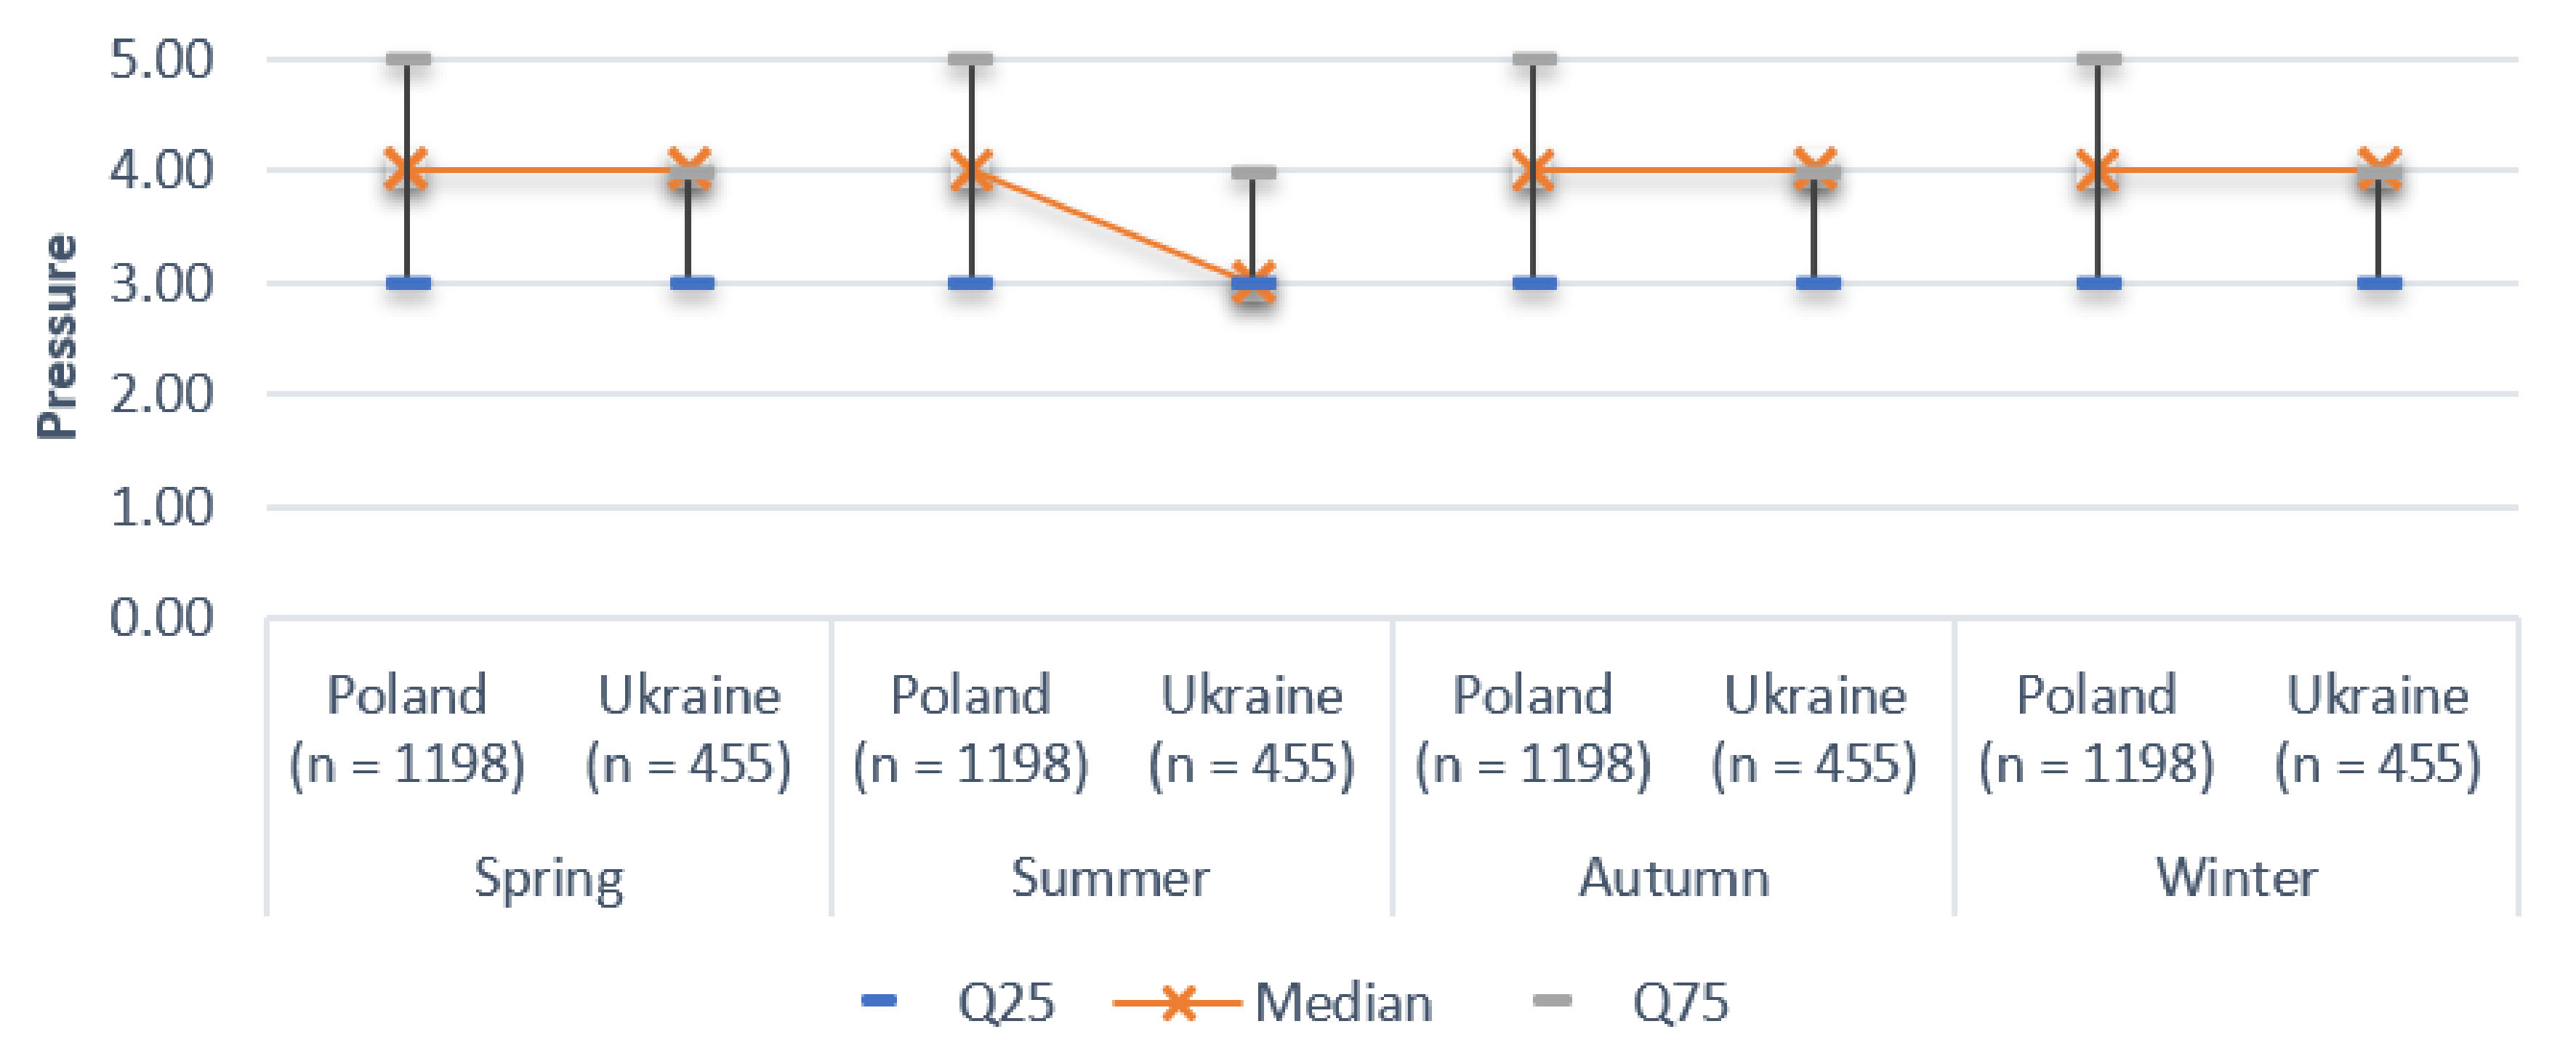
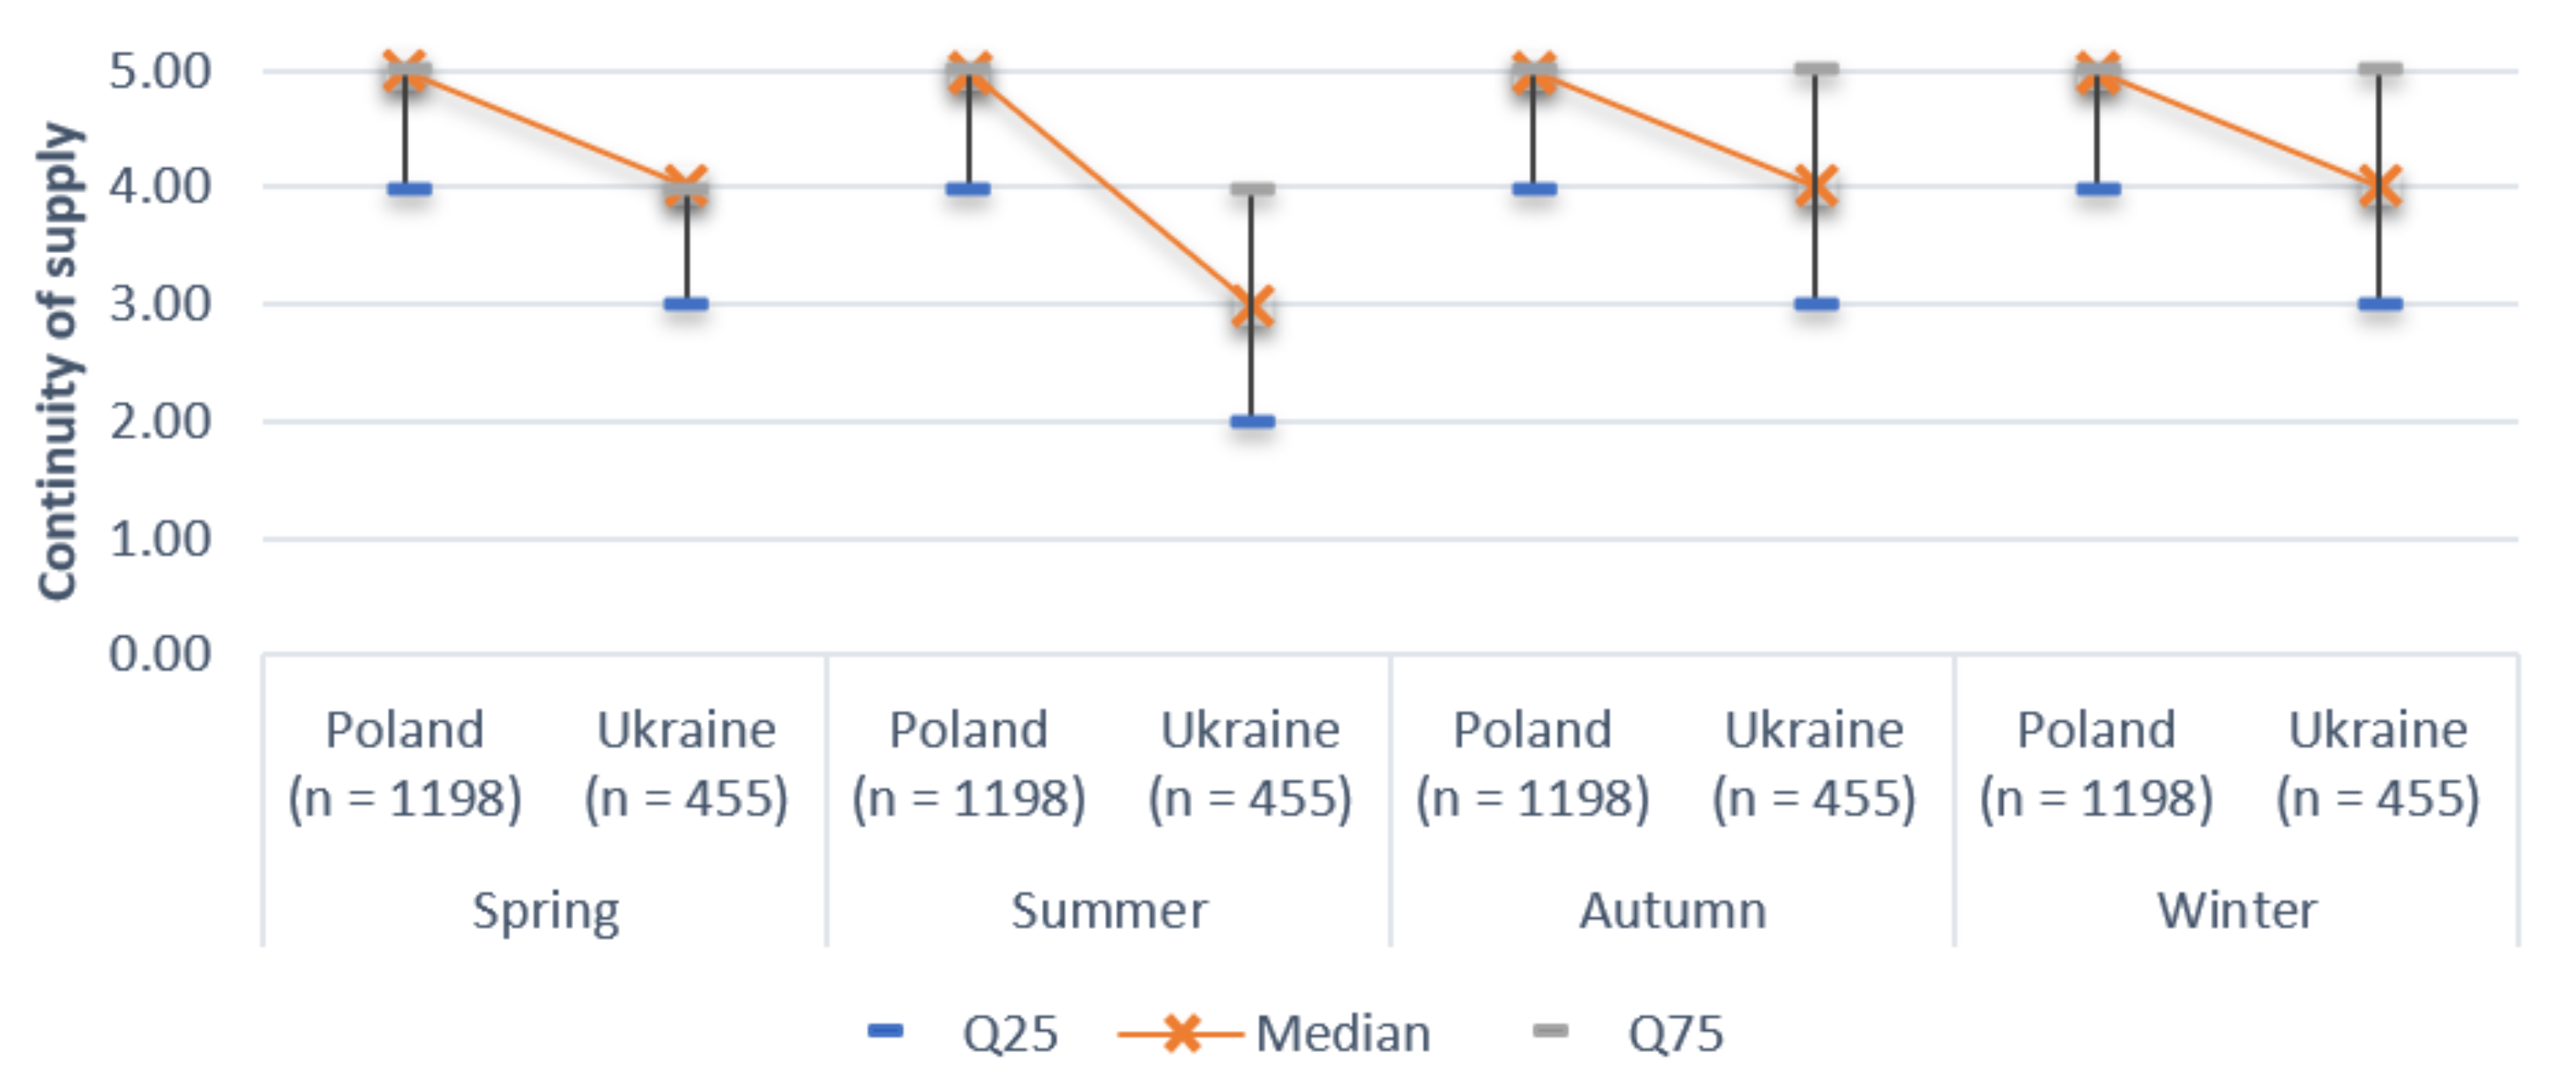
4.3. Comparative Analysis of the Evaluation of Selected Parameters of Tap Water Supplied in Poland and Ukraine

In the next part of the analysis, groups of respondents from Poland and Ukraine were compared in terms of assessments of tap water parameters, i.e., taste, odor, color, turbidity, hardness, pressure and continuity of supply. Each of these parameters was compared between both groups in relation to different seasons of the year.
Taste of tap water was better rated by consumers in Poland than in Ukraine in spring (MPoland = 3.83; SDPoland = 1.01 and MUkraine = 2.56; SDUkraine = 1.22), summer (MPoland = 3.8; SDPoland = 1.03 i MUkraine = 2.56; SDUkraine = 1.27), autumn (MPoland = 3.78; SDPoland = 1.04 and MUkraine = 2.62; SDUkraine = 1.21) and in winter (MPoland = 3.78; SDPoland = 1.11 and MUkraine = 2.64; SDUkraine = 1.28). On the basis of Mann–Whitney U-test results, it was found that the above differences were statistically significant, which means that tap water supplied in Poland had significantly better taste than that supplied in Ukraine in spring: Z = 17.57; p < 0.001; rg = 0.56; summer: Z = 16.72; p < 0.001; rg = 0.53; autumn: Z = 16.31; p < 0.001; rg = 0.52; and in winter: Z = 15.25; p < 0.001; rg = 0.48 (Table 8, Figure 3).
Recipients of tap water from Poland and Ukraine also differed in their evaluation of its odor. Similarly to taste, tap water odor was rated better in Poland than in Ukraine. This was true for spring (MPoland = 3.89; SDPoland = 1.02 and MUkraine = 2.98; SDUkraine = 1.17), summer (MPoland = 3.85; SDPoland = 1.04 and MUkraine = 2.95; SDUkraine = 1.16), autumn (MPoland = 3.85; SDPoland = 1.05 and MUkraine = 3.02; SDUkraine = 1.11) and winter (MPoland = 3.844; SDPoland = 1.12 and MUkraine = 3.08; SDUkraine = 1.17). These differences reached statistical significance, as shown by analysis with the Mann–Whitney U test, for each season, i.e., spring: Z = 13.82; p < 0.001; rg = 0.44; summer: Z = 13.78; p < 0.001; rg = 0.44; autumn: Z = 13.21; p < 0.001; rg = 0.42; and winter: Z = 11.79; p < 0.001; rg = 0.38 (Table 9, Figure 4).
The next parameter of tap water, i.e., color, also significantly differed in Poland compared to Ukraine. Recipients of tap water supplied in Poland rated its color better than recipients in Ukraine with respect to each season, i.e., spring (MPoland = 4.05; SDPoland = 1.04 and MUkraine = 3.31; SDUkraine = 1.2), summer (MPoland = 4.01; SDPoland = 1.07 and MUkraine = 3.2; SDUkraine = 1.25), autumn (MPoland = 4.01; SDPoland = 1.07 and MUkraine = 3.27; SDUkraine = 1.19) and winter (MPoland = 4.03; SDPoland = 1.08 and MUkraine = 3.4; SDUkraine = 1.19). The analysis by Mann–Whitney U test showed that there were statistically significant differences between the two groups in the assessment of tap water color, both in the context of water supplied in spring: Z = 11.48; p < 0.001; rg = 0.36; summer: Z = 11.89; p < 0.001; rg = 0.38; autumn: Z = 11.56; p < 0.001; rg = 0.37; and winter: Z = 10.08; p < 0.001; rg = 0.32 (Table 10, Figure 5).
Turbidity of tap water was also rated significantly differently in Poland and Ukraine. Ratings of the above tap water parameter were higher among respondents from Poland compared to those from Ukraine. This was the case both spring (MPoland = 3.96; SDPoland = 1.06 and MUkraine = 3.13; SDUkraine = 1.15), summer (MPoland = 3.94; SDPoland = 1.08 and MUkraine = 3.11; SDUkraine = 1.17), autumn (MPoland = 3.94; SDPoland = 1.07 and MUkraine = 3.14; SDUkraine = 1.13) and winter (MPoland = 3.95; SDPoland = 1.09 and MUkraine = 3.19; SDUkraine = 1.18). These differences turned out to be statistically significant, which was shown by Mann–Whitney U test analysis. This means that tap water supplied in Poland is rated significantly better than that in Ukraine in terms of turbidity at any time of the year, i.e., spring: Z = 12.91; p < 0.001; rg = 0.41; summer: Z = 12.71; p < 0.001; rg = 0.4; autumn: Z = 12.64; p < 0.001; rg = 0.4; and winter: Z = 11.75; p < 0.001; rg = 0.37 (Table 11, Figure 6).
Tap water supplied in Poland was also rated significantly better than that supplied in Ukraine with respect to hardness. These differences were noted for each season, i.e., spring (MPoland = 3.54; SDPoland = 1.14 and MUkraine = 2.77; SDUkraine = 1.13), summer (MPoland = 3.52; SDPoland = 1.15 and MUkraine = 2.78; SDUkraine = 1.13), autumn (MPoland = 3.52; SDPoland = 1.15 and MUkraine = 2.79; SDUkraine = 1.11) and winter (MPoland = 3.51; SDPoland = 1.17 and MUkraine = 2.75; SDUkraine = 1.13). Based on the results of the Mann–Whitney U test, it was found that there were statistically significant differences between the two groups in assessments of tap water hardness in spring: Z = 11.62; p < 0.001; rg = 0.37; summer: Z = 11.24; p < 0.001; rg = 0.36; autumn: Z = 11.05; p < 0.001; rg = 0.35; and winter: Z = 11.46; p < 0.001; rg = 0.36 (Table 12, Figure 7).
Recipients of tap water from Poland and Ukraine also differed significantly in their assessment of tap water pressure. In spring, tap water pressure was rated better in Poland (M = 3.97; SD = 1.1) than in Ukraine (M = 3.6; SD = 1.03). The same was true for tap water pressure delivered in summer (MPoland = 3.68; SDPoland = 1.19 and MUkraine = 3.39; SDUkraine = 1.11), autumn (MPoland = 3.96; SDPoland = 1.11 and MUkraine = 3.58; SDUkraine = 1.04) and winter (MPoland = 3.99; SDPoland = 1.11 and MUkraine = 3.6; SDUkraine = 1.08). The above differences reached statistical significance, as shown by the Mann–Whitney U test analysis, for the spring: Z = 7.2; p < 0.001; rg = 0.23; summer: Z = 4.95; p < 0.001; rg = 0.16; autumn: Z = 7.27; p < 0.001; rg = 0.23; and winter: Z = 7.26; p < 0.001; rg = 0.23 (Table 13, Figure 8).
Continuity of tap water supply was rated differently in Poland and Ukraine. In the case of the spring period, the ratings for the above-mentioned water parameter were higher in Poland (M = 4.53; SD = 0.78) compared to Ukraine (M = 3.52; SD = 1.2). Similar differences occurred in the case of assessments of continuity of tap water supply in summer (MPoland = 4.48; SDPoland = 0.81 and MUkraine = 3.08; SDUkraine = 1.39), autumn (MPoland = 4.54; SDPoland = 0.78 and MUkraine = 3.61; SDUkraine = 1.15) and winter (MPoland = 4.54; SDPoland = 0.78 and MUkraine = 3.68; SDUkraine = 1.18). As shown by the Mann–Whitney U test analysis, the continuity of tap water supply was assessed statistically significantly differently in Poland and Ukraine for spring Z = 15.88; p < 0.001; rg = 0.51; summer: Z = 18.27; p < 0.001; rg = 0.58; autumn: Z = 15.38; p < 0.001; rg = 0.49; and winter: Z = 13.98; p < 0.001; rg = 0.44 (Table 14, Figure 9).

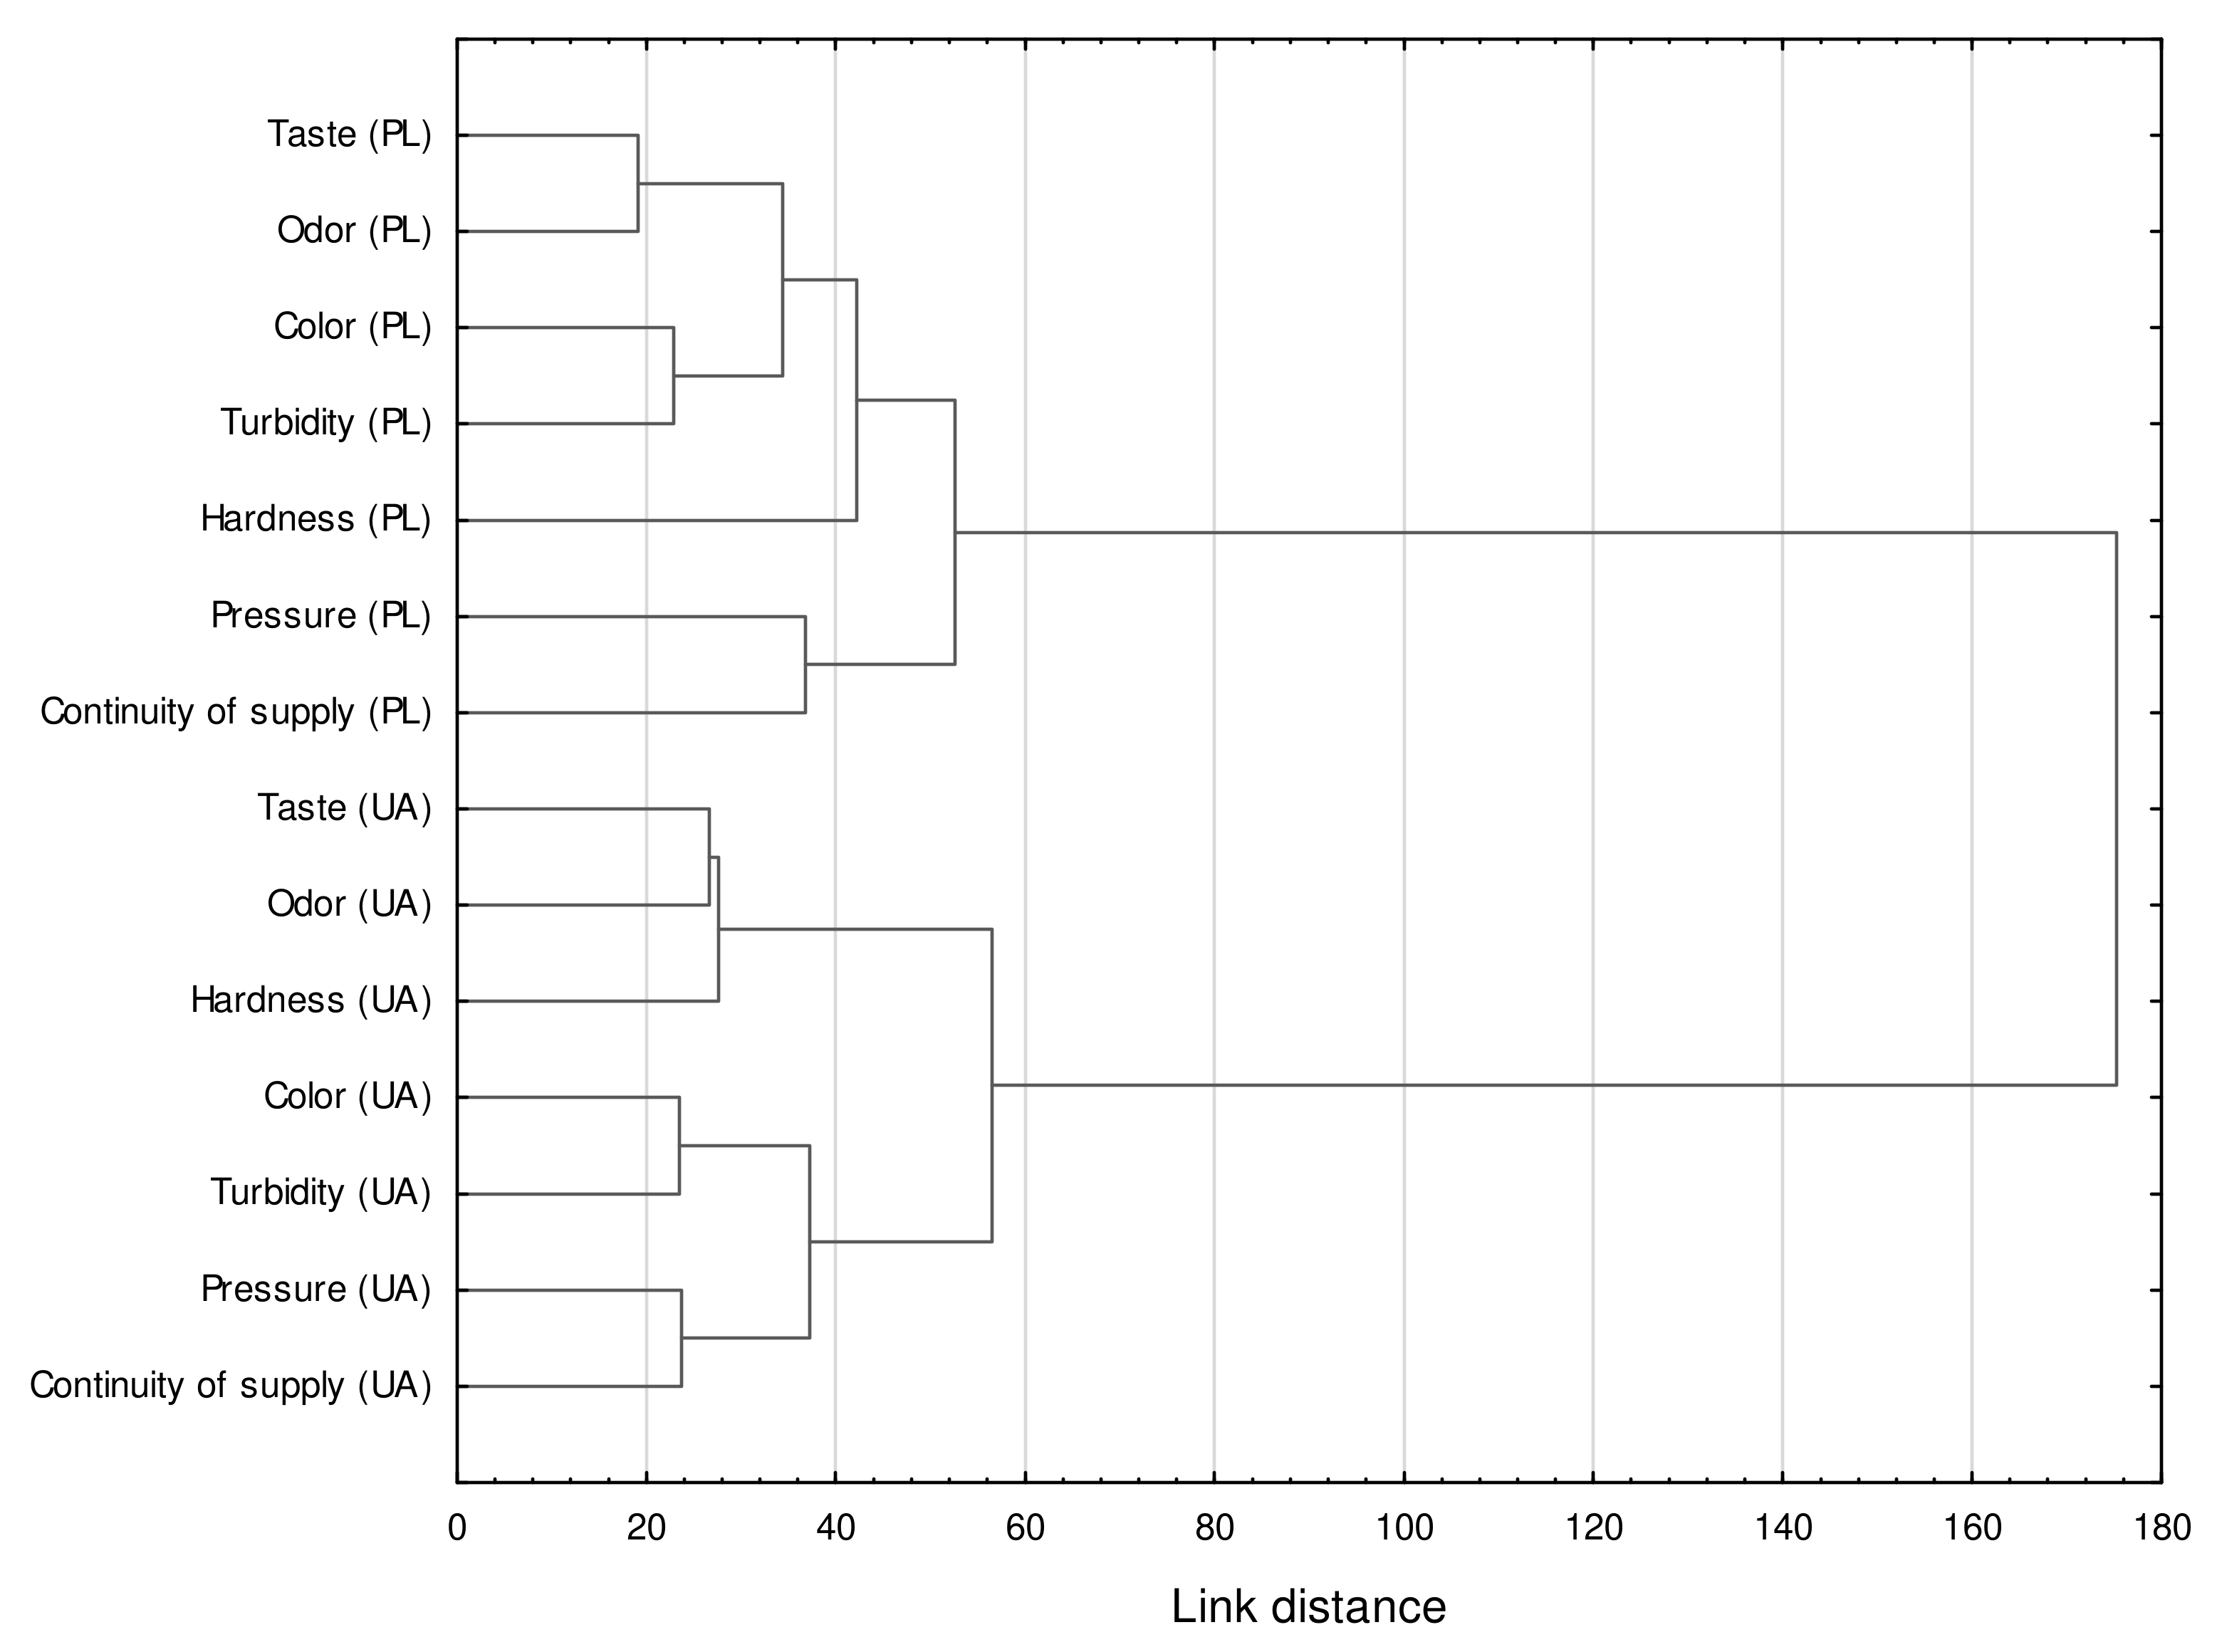
4.4. Identification of Parameters of Tap Water Supplied in Poland and Ukraine Evaluated Significantly Similarly during Individual Periods of the Year

In the next step, an attempt was made to compare evaluations of particular parameters of tap water supplied in Poland and Ukraine in order to check whether there were similarities between the studied countries in terms of evaluations of different parameters. In other words, this study aimed to compare the ratings of different parameters of tap water supplied in Poland and Ukraine in order to identify the similarities in this respect. This study was conducted using cluster analysis, with the application of two of its methods:
  • Agglomeration method, used for visual identification of the number of parameter groups (clusters) similar to each other in terms of ratings (distances between clusters were obtained using Ward’s method), and;
  • Non-hierarchical factor-clustering method, so called k-means clustering, used to separate clusters and their elements based on the number of clusters identified by the previous method.
The structure of the identified clusters was described using descriptive statistics representing the ratings of parameters included in each cluster. The above analyses were performed separately for each season (i.e., spring, summer, autumn and winter).
In the spring period, the evaluations of particular tap water parameters were divided into two seven-element clusters, concerning water supplied in Poland (the first cluster) and in Ukraine (the second cluster). This means that none of parameters of tap water supplied in Poland was evaluated similarly to any of parameters of tap water supplied in Ukraine. However, when analyzing the identified clusters, it can be seen that both in Poland and in Ukraine, parameters such as taste and odor of water, color and turbidity, as well as pressure and continuity of supply, were rated similarly in relation to spring. However, these ratings were significantly different in the two countries, and there were no significant similarities between the ratings of any of the water parameters in Poland and Ukraine. The following dendrogram presents a visualization of the identified clusters (Figure 10).
The results of the agglomerative cluster analysis method were fully consistent with the results of the non-hierarchical characteristic-clustering method, so-called k-means clustering. The ratings of individual tap water parameters were divided into two clusters, each of which concerned a different country. Thus, the first cluster contained assessments of all parameters of tap water supplied in Poland, with the second cluster concerning Ukraine. Descriptive statistics for the mean scores of the parameters within the identified clusters showed that tap water supplied in Poland was rated better (M = 3.97; SD = 1.06) than that supplied in Ukraine (M = 3.12; SD = 1.21) (Table 15).
The results of the cluster analysis using the agglomerative method, concerning the summer period, were very similar to those for the spring period. As before, two clusters of seven elements were identified, each of concerning a different country. This means that all parameters of tap water supplied in Poland were evaluated significantly differently than each of the parameters of tap water supplied in Ukraine. Moreover, as in the case of the spring period, in summer, both in Poland and in Ukraine, tap water was rated similarly with respect to taste, smell, color and turbidity, as well as pressure and continuity of supply. At the same time, significant differences were observed between countries in terms of the evaluation of the above parameters. K-means clustering confirmed significant differences in the evaluation of all parameters between Polish and Ukrainian consumers. The first of identified clusters contained all parameters of tap water supplied in Ukraine, with the second cluster concerning Poland. From the distribution of descriptive statistics concerning evaluations of parameters included in the above-mentioned clusters, one may conclude that in the summer period—similarly as in the spring period—average evaluations of all tap water parameters were higher in Poland (M = 3.9; SD = 1.1) than in Ukraine (M = 3.01; SD = 1.24).
In relation to the autumn period, the results of cluster analysis were very similar to the those concerning the previous two periods. The agglomeration method of cluster analysis identified two clusters, one of which concerned assessments of all parameters of tap water delivered in Poland, with the other cluster concerning Ukraine. Such results indicate that each parameter of tap water supplied in Poland was assessed significantly differently than any parameter of water supplied in Ukraine. At the same time, for each of the above-mentioned countries, similar assessments of tap water in terms of taste, odor, color and turbidity, as well as pressure and continuity of supply, were noted, which was also the case for the previous two periods. The dendrogram below provides a visualization of the identified clusters. Cluster analysis conducted using k-means clustering produced the same clusters as the agglomeration method. One of the identified clusters was for all parameters of tap water supplied in Ukraine, while the other was for Poland. On the other hand, distribution of descriptive statistics concerning evaluations of parameters included in the above clusters showed that—as in spring and summer—average evaluations of all tap water parameters in the autumn period were higher in Poland (M = 3.94; SD = 1.08) than in Ukraine (M = 3.14; SD = 1.19).
In the winter period, the recorded cluster analysis results were similar to those of all previous periods. As a result of cluster analysis by agglomeration method, two seven-element clusters were obtained, one concerning parameters of tap water supplied in Poland and the other concerning Ukraine. Further analysis of the shapes of both clusters showed that during the winter period, both in Poland and in Ukraine, tap water was rated similarly with respect to taste, odor, color and turbidity, as well as pressure and continuity of supply. The dendrogram below shows the visualization of the identified clusters. The results of the agglomerative cluster analysis method were also confirmed when clustering using the k-means method, meaning that the recorded clusters overlapped. Therefore, two clusters were identified, one of which was for all parameters of tap water supplied in Ukraine, with the other concerning Poland. Descriptive statistics for the ratings of parameters within each cluster indicate that the mean ratings of all tap water parameters were higher in Poland (M = 3.95; SD = 1.11) than in Ukraine (M = 3.19; SD = 1.23).

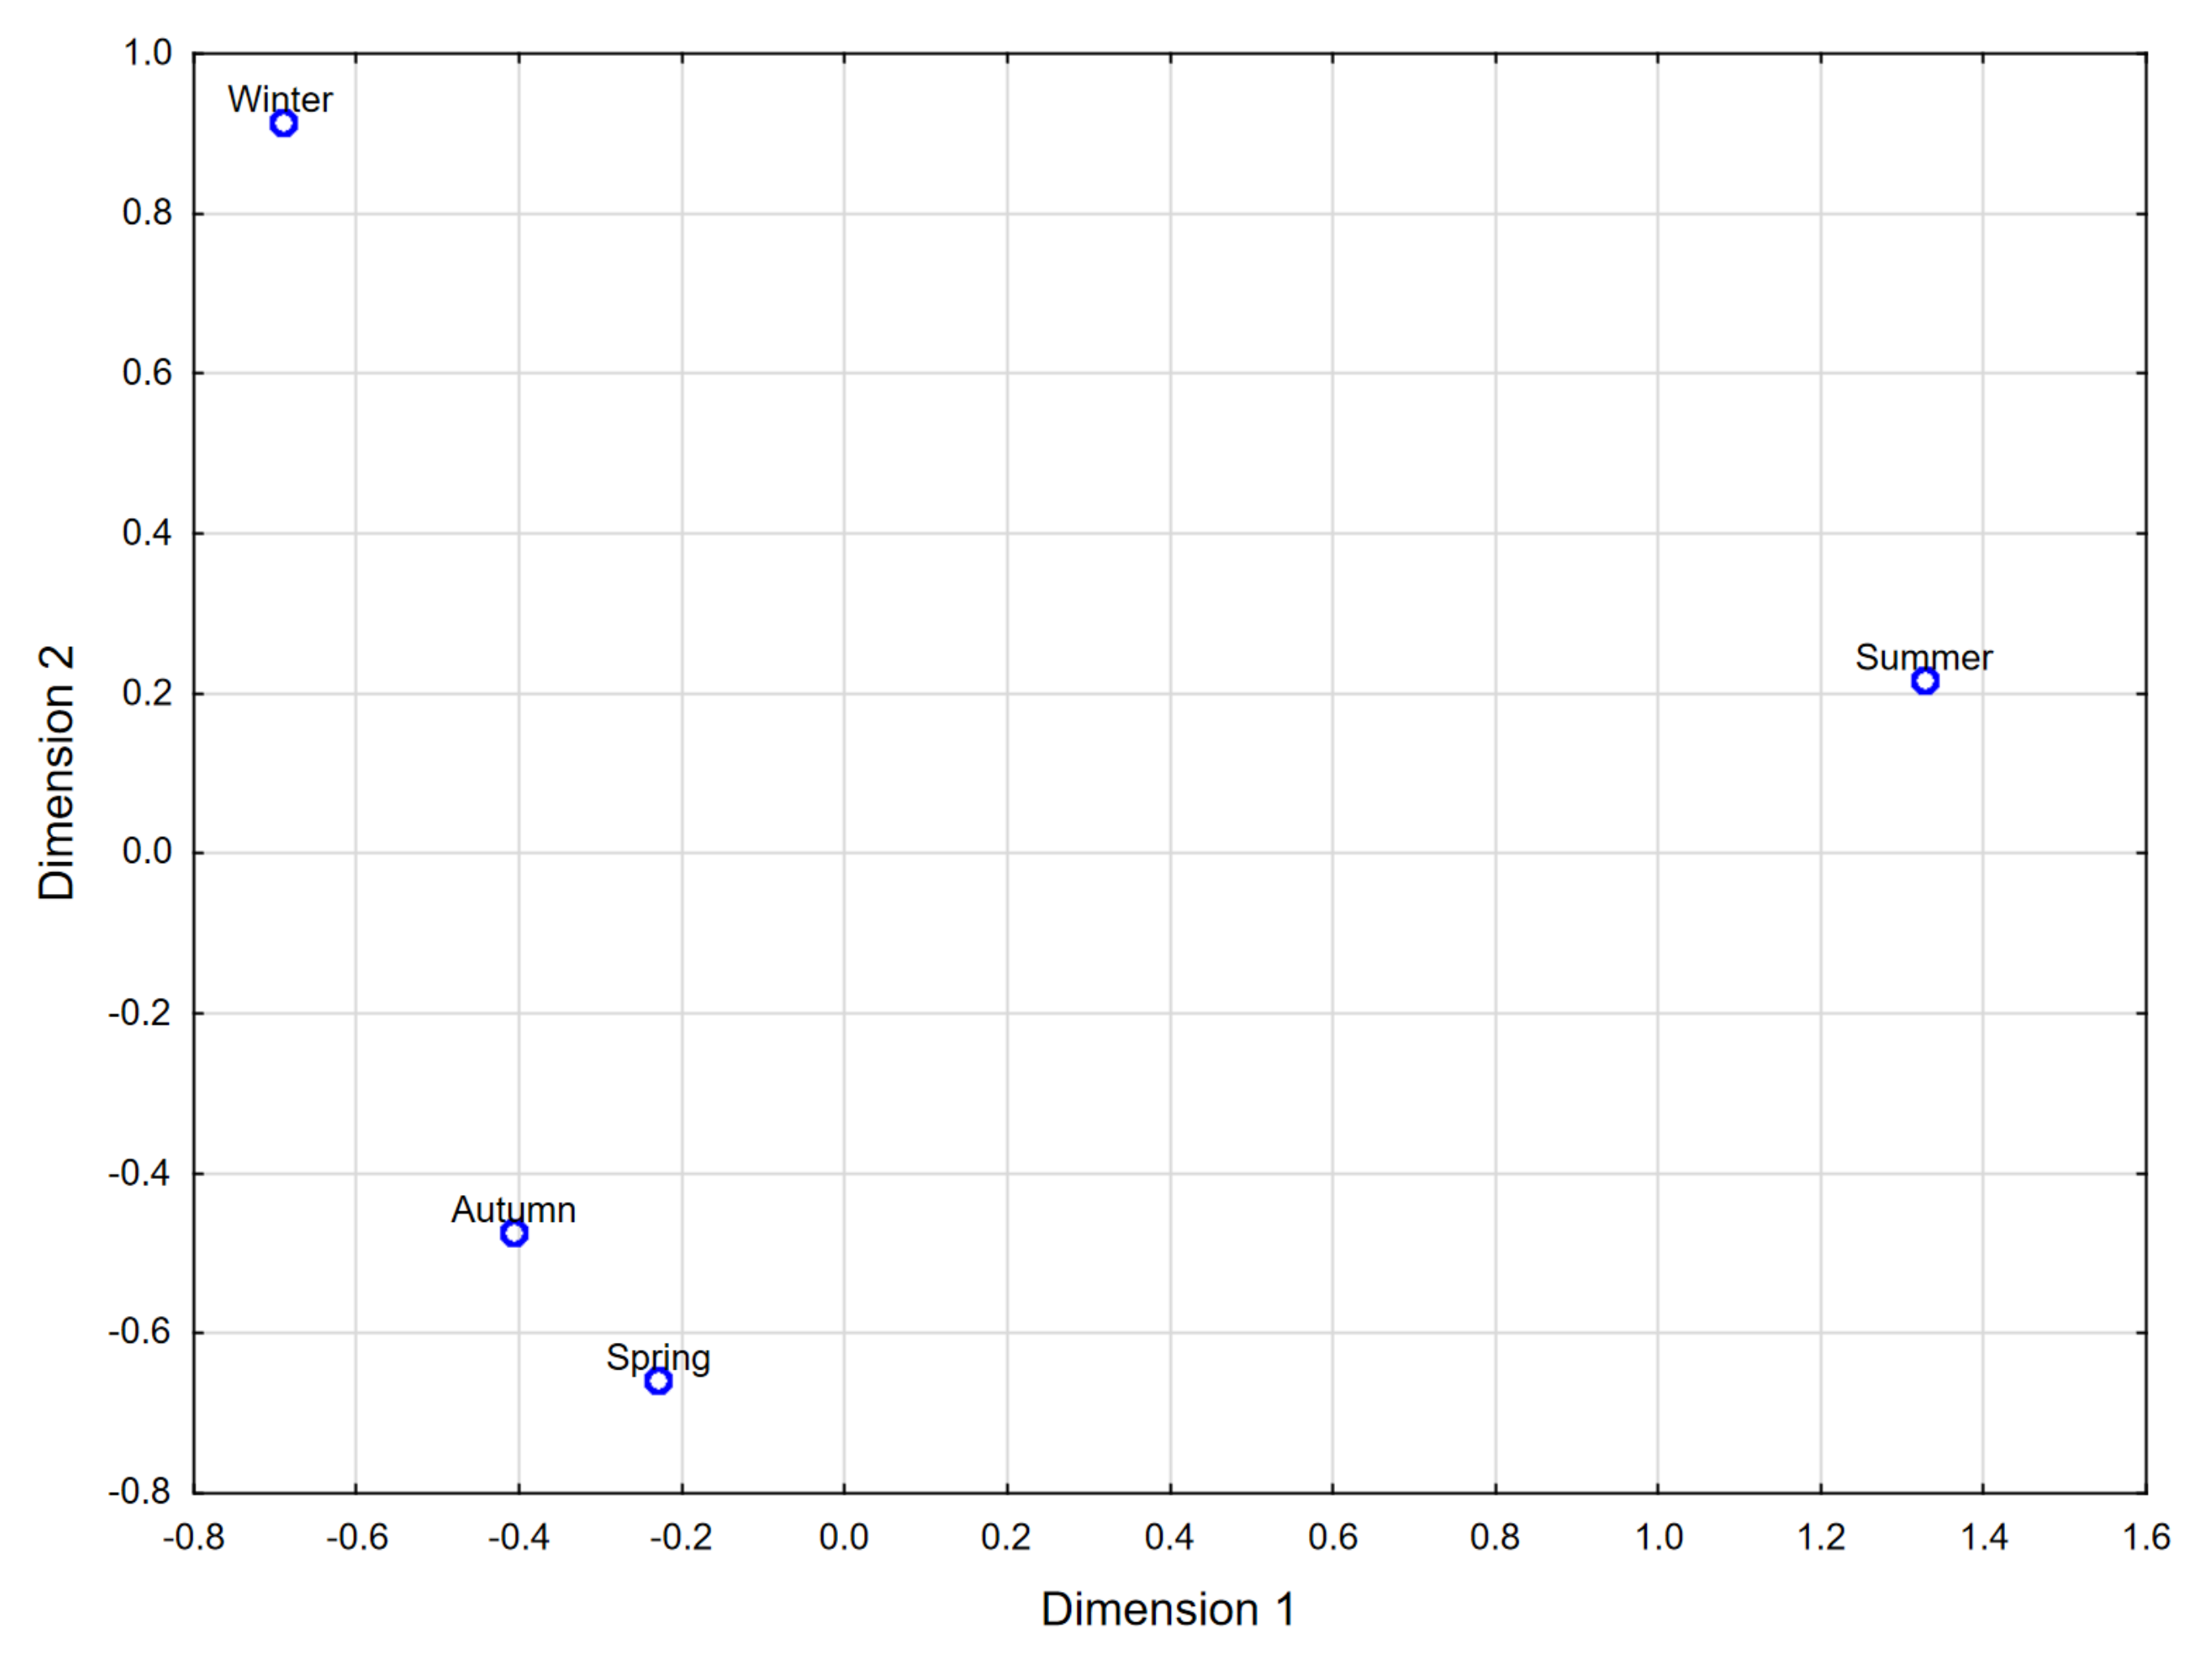
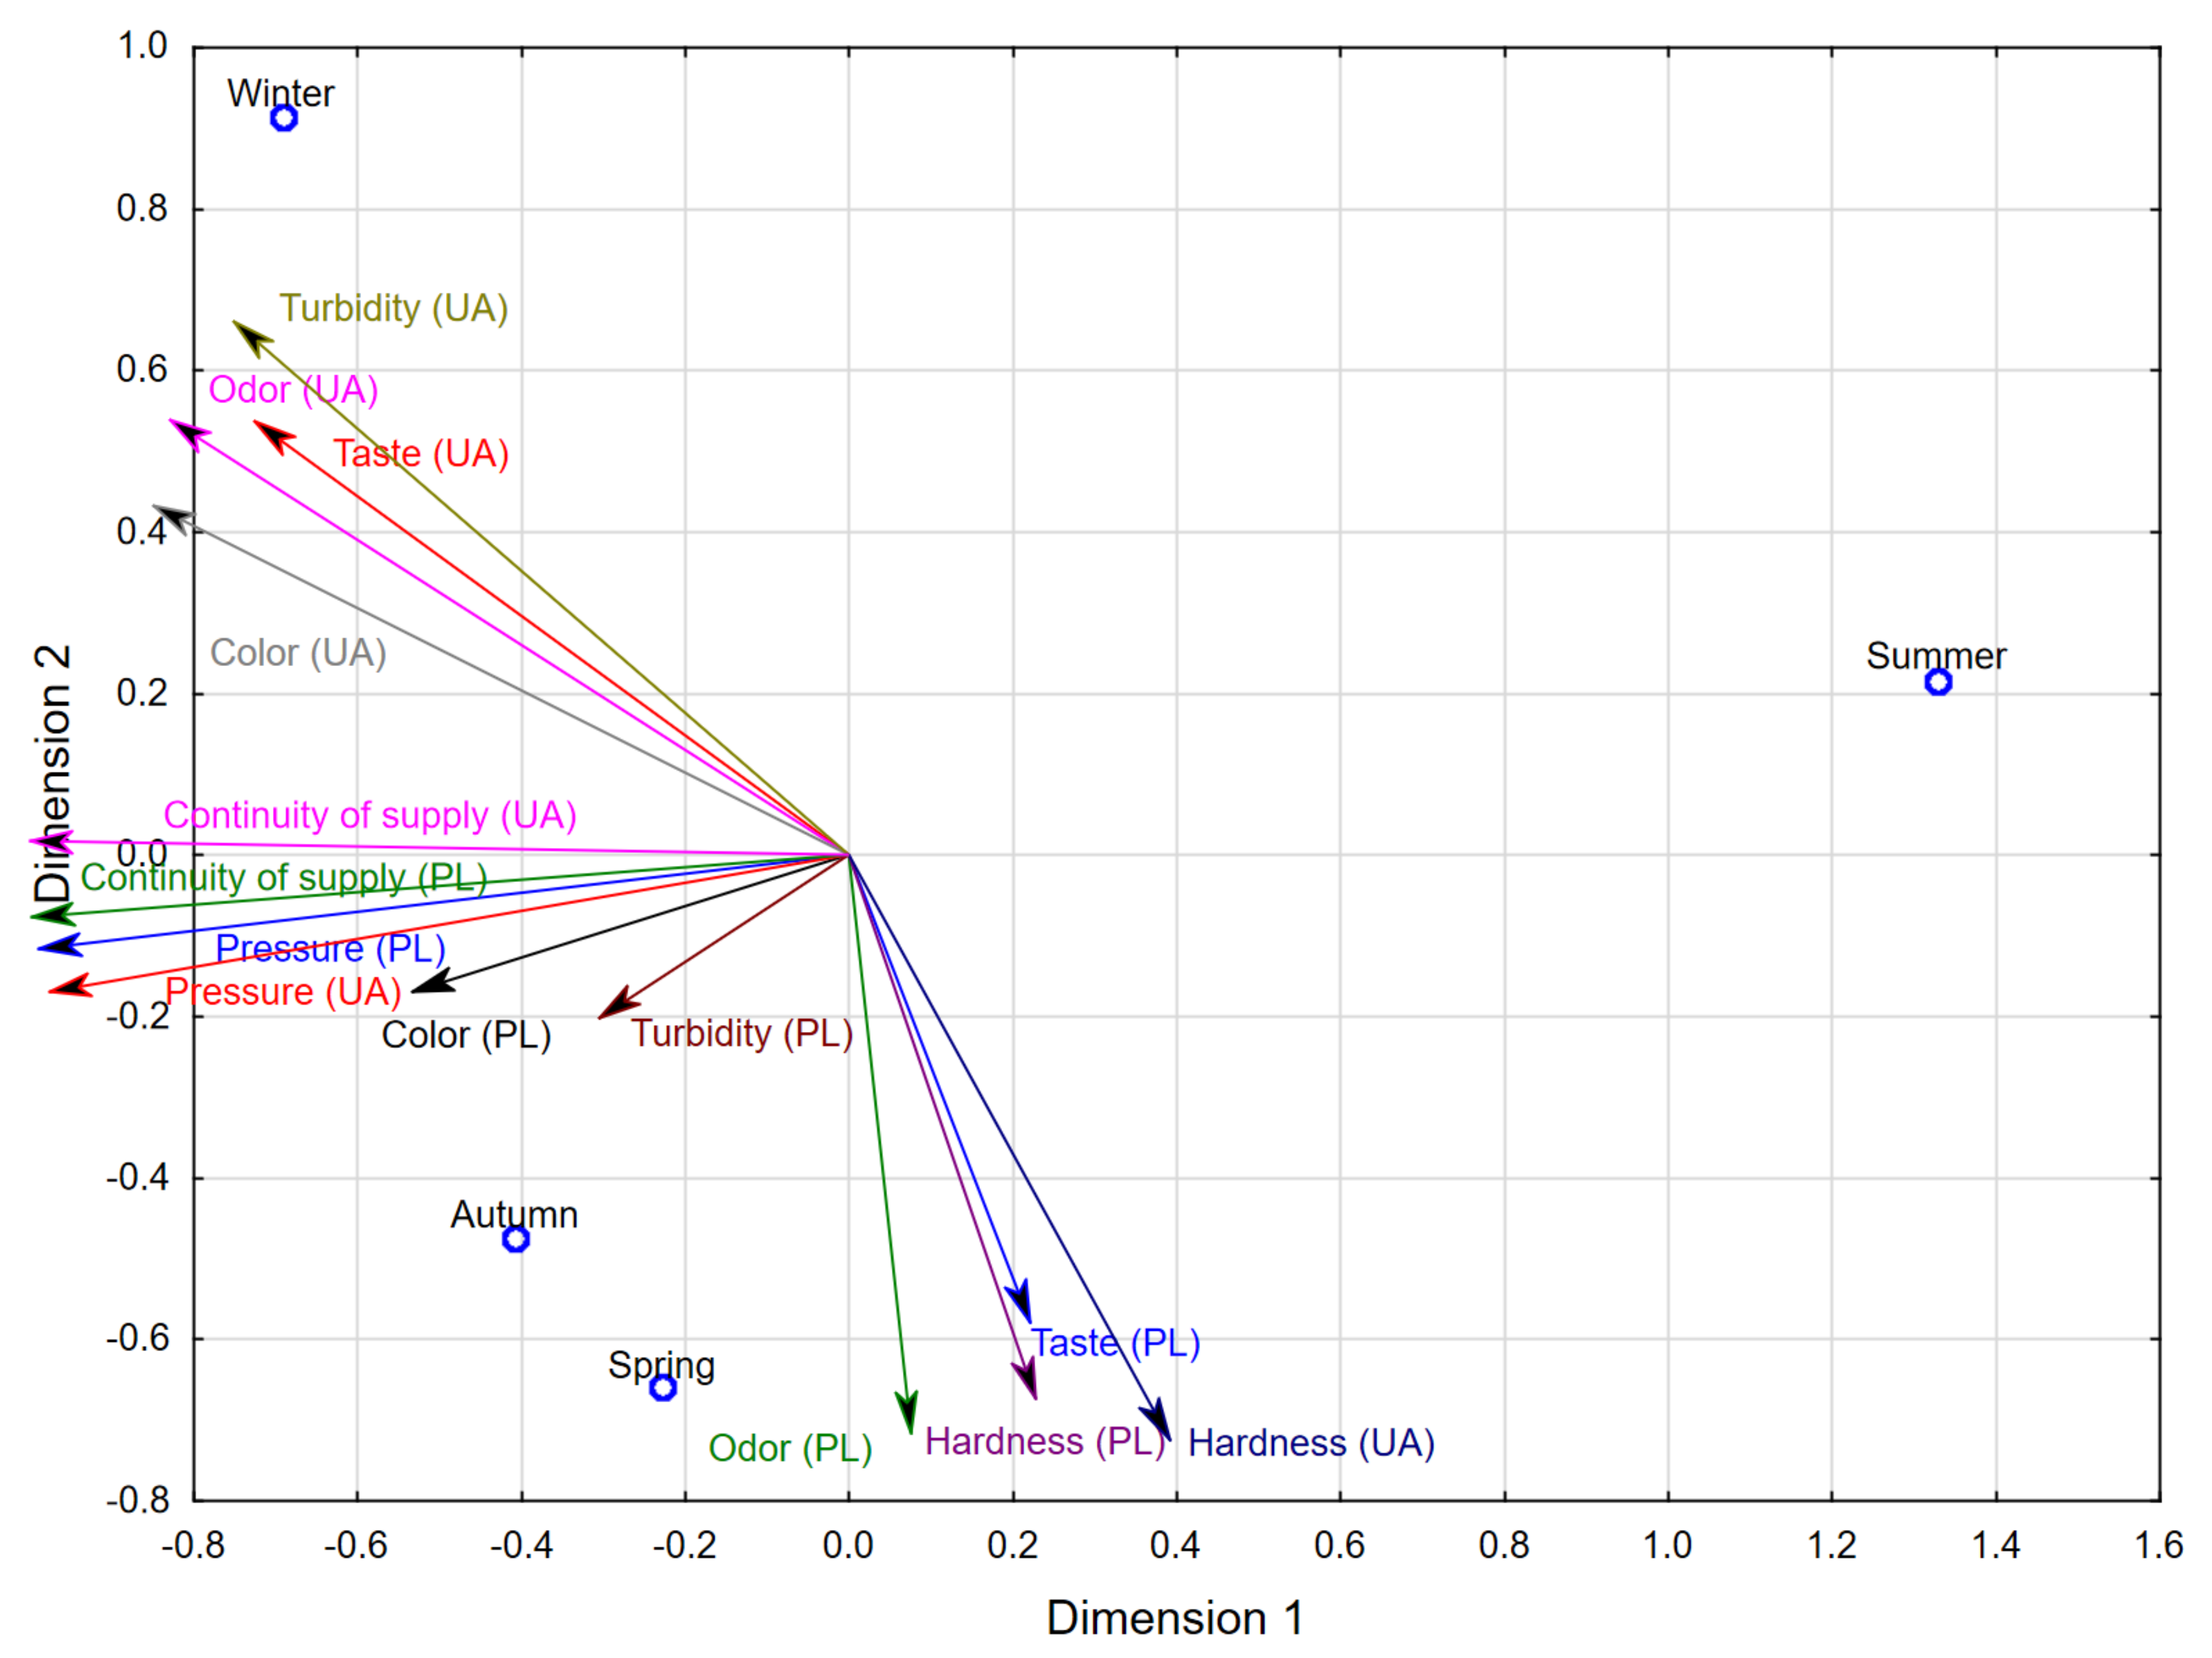
4.5. Model of Evaluations of Parameters of Tap Water Supplied in Poland and Ukraine during Individual Seasons of the Year

The last stage of analysis was to build the model of evaluations of parameters of tap water supplied in Poland and Ukraine during individual seasons of the year using PROFIT (PROperty FITting) analysis. The aim of these analyses was to develop a model specifying parameters of tap water supplied in Poland and Ukraine requiring improvement in individual delivery periods.
In order to build the present model, multidimensional scaling was first carried out. This was to develop a graphical presentation of the structure of similarity (or dissimilarity) between the analyzed objects in relation to a selected set of variables (characteristics). The analyzed objects in this model were individual seasons: spring, summer, autumn, winter.
The following individual parameters of tap water supplied in Poland and Ukraine were taken as variables (characteristics):
  • Taste of tap water supplied in Poland (Taste (PL)),
  • Taste of tap water supplied in Ukraine (Taste (UA)),
  • Odor of tap water supplied in Poland (Odor (PL)),
  • Odor of tap water supplied in Ukraine (Odor (UA)),
  • Color of tap water supplied in Poland (Color (PL)),
  • Color of tap water supplied in Ukraine (Color (UA)),
  • Turbidity of tap water supplied in Poland (Turbidity (PL)),
  • Turbidity of tap water supplied in Ukraine (Turbidity (UA)),
  • Hardness of tap water supplied in Poland (Hardness (PL)),
  • Hardness of tap water supplied in Ukraine (Hardness (UA)),
  • Pressure of tap water supplied in Poland (Pressure (PL)),
  • Pressure of tap water supplied in Ukraine (Pressure (UA)),
  • Continuity of supply of tap water supplied in Poland (Continuity of supply (PL)),
  • Continuity of supply of tap water supplied in Ukraine (Continuity of supply (UA)).
In order to develop the model, average ratings for each parameter of tap water supplied in Poland and Ukraine issued for each season were used. These data are presented in Table 16.
Due to the identical nature of the analyzed characteristics (parameters of tap water supplied in Poland and Ukraine) as variables, there was no need to standardize them. In multidimensional scaling, the classical Euclidean distance was used, and consequently, 14 characteristics describing four objects were reduced to two dimensions. The STRESS coefficient for multidimensional scaling including all characteristics was 0.00, indicating high reliability of the results of the multidimensional scaling procedure.
The following graph (Figure 11) shows the resulting multidimensional scaling map. It shows that winter and summer differed from the other seasons in terms of ratings for all analyzed parameters of tap water supplied in Poland and Ukraine. Similarities were noted between spring and autumn, the location of which on the multidimensional scaling map indicates that both seasons were similar in terms the evaluations of the above parameters and, at the same time, differed clearly from both winter and summer.
Next, the matching of individual objects was verified. For this purpose, the results of regression analysis were analyzed, in which the successive parameters of tap water supplied in Poland and Ukraine was the dependent variable and the values of two dimensions for each unit, obtained as a result of multidimensional scaling: Dim.1 and Dim.2, were the independent variables. Based on the results of this analysis, it was found that half of the studied parameters were characterized by a very high influence on the differentiation of the studied units (R2 > 0.90). A very high fit was also recorded for the taste of water supplied in Ukraine (R2 = 0.81). The hardness of the water supplied in both Poland (R2 = 0.51) and Ukraine (R2 = 0.68) also had a significant effect on the variation of the studied units. There was moderate agreement for taste (R2 = 0.38) and color (R2 = 0.31) of water supplied in Poland and weak agreement for turbidity in Poland (R2 = 0.13) (Table 17).
Finally, PROFIT analysis was performed, and its result is presented in the following graph (Figure 12). As can be read from the developed model, summer was the period that stood out in a negative way in terms of all parameters of tap water supplied both in Poland and Ukraine. The biggest complaints concerning water in the summer period concerned continuity of supply and pressure (in both countries). The ratings for color and turbidity were slightly better in Poland. On the other hand, the highest-rated tap water parameters (although still very low) were odor and taste of water in Poland and hardness of water in Poland and Ukraine. The latter four characteristics were the most prominent in the spring period, when tap water supplied in Poland was rated best for taste, odor and hardness, and that supplied in the Ukraine was rated best for hardness alone. Turbidity of tap water in Poland was also rated comparably in the spring, but this feature was distinguished in the autumn. Additionally, autumn was the time of year when the color of tap water in Poland and continuity of supply and pressure of water supplied in both Poland and Ukraine were rated best. On the other hand, the winter period was characterized by good ratings for taste, odor, turbidity and color of tap water supplied in Ukraine. The ratings of water supplied in Poland in winter evidenced many more objections, particularly with respect to taste and odor, as well as hardness (the latter parameter was also poorly rated in the context of water in Ukraine).

5. Conclusions

Uses of tap water differ between Poland and Ukraine. In Poland, tap water is more often used in summer, while in Ukraine it is more often used in winter. Moreover, in Poland more often than in Ukraine, tap water consumers consume that water directly for drinking without boiling and use an additional device directly for drinking without boiling less often. When it comes to device use, use of a filter is more popular in Poland, while an osmosis station and other such devices (excluding water softeners) are more popular in Ukraine. In recent years, Polish consumers have gained confidence in the quality of water supplied by water supply companies due to the fact that in the last dozen or so years, with the support of EU funds, the water supply infrastructure has been modernized. Poland has, in a way, made a civilizational leap in water infrastructure management while increasing consumer awareness of water conservation. Ukrainian infrastructure is characterized by a low replacement ratio, which results in a different approach of consumers to the management of these resources. Ukraine is currently at the beginning of an investment process aimed at guaranteeing continuity of water supply to consumers and optimizing the rate of water losses.
An average consumer of tap water in Poland is a person using it usually in summer, drinking it directly from the tap without boiling it and not using any additional device for filtering and/or treatment. On the other hand, the following can be considered as distinctive characteristics of tap water consumers from Ukraine: using water in winter, not drinking it directly from the tap (without prior boiling) and using an additional device for filtering and/or treatment. This confirms the noted differences in individual habits connected with use of tap water among Polish and Ukrainian consumers. Continuity of water supply is very important because in this case, there is no need for prolonged storage in various types of containers.
Evaluation of individual parameters of tap water during each period differs between Polish and Ukrainian consumers. Tap water supplied in Poland is rated better than that supplied in Ukraine with respect to taste, smell, color, turbidity, hardness, pressure and continuity of supply. The above differences concern water supplied in spring, summer, autumn and winter. Thus, the quality of tap water in Poland is better than in Ukraine, which also explains the differences between the two groups of users in terms of their water usage habits (in Poland, drinking directly without boiling is more common, and the use of additional devices for filtering and/or treating tap water is less frequent). In addition, the average Polish water consumer is a more demanding customer due to legislative considerations, which are still lacking in Ukrainian law.
None of the parameters of tap water supplied in Poland is evaluated similarly to any of the parameters of water supplied in Ukraine. The differences in evaluations of all parameters of tap water supplied in Poland differ from the evaluations of each parameter of tap water supplied in Ukraine during each period. These differences may be due to cultural conditions and human habits in the use of tap water.
In winter, tap water supplied in Ukraine scores best for taste, odor, color and turbidity compared to other periods. In autumn, tap water supplied in Poland scores best for color and turbidity, while in spring, the same water scores best for taste and odor and for hardness in both countries. Summer stands out negatively for all tap water parameters from both Poland and Ukraine (especially for pressure and continuity of supply, which are highest in autumn). This is mainly due to the fact that in summer and especially during periods of high temperatures, water consumption increases in direct proportion to the temperature in the external environment. During periods of high temperatures, consumers use larger amounts of water, e.g., for watering gardens. Greater water consumption, i.e., water demand, has a negative effect on water pressure in the network, which is designed for a specific capacity and not for extreme situations. A solution to this problem could be the introduction of a night water tariff, which, thanks to a lower rate, would encourage people to use water at night, which would result in a more proportionate distribution of water consumption and ensure better water pressure in the network.
Water supply companies should strive to optimize water supply and meet customers’ expectations, including quality parameters, regardless of the season. Moreover, Ukraine, as a future candidate for European Union member state, among other things, thanks to such comparative research, has an opportunity to benefit from Polish experience and may start implementing these assumptions in future water laws. Water supply companies from both Poland and Ukraine should intensify testing of water samples in periods when consumers reported comments, e.g., increased water intake or drop in pressure during garden watering hours in summer.
This article has some limitations, as the assessments of water quality concerns only selected parameters and only concerning Poland and Ukraine. The intention of the authors was to determine such parameters that can be evaluated organoleptically without laboratory measurements. The authors focused on the observations of recipients of tap water in Poland and Ukraine. It is worth considering the possibility of conducting similar studies in other countries, not only in Europe but also on other continents, in order to compare the conditions of water supply and legal regulations existing in a given country. Knowledge gained in this way, as well as expectations of water consumers, could be very useful in terms of meeting of consumers’ expectations.

Author Contributions

Conceptualization, J.O., J.K. and S.R.; methodology, J.O. and J.K.; software, J.O.; validation, J.O. and J.K.; formal analysis, J.O. and J.K.; writing—original draft preparation, J.O., J.K. and S.R.; writing—review and editing, J.O., J.K. and S.R.; visualization, J.O. and J.K.; supervision, J.O. and J.K. All authors have read and agreed to the published version of the manuscript.

Funding

This research received no external funding.

Conflicts of Interest

The authors declare no conflict of interest.

References

  1. Döll, P.; Hoffmann-Dobrev, H.; Portmann, F.T.; Siebert, S.; Eicker, A.; Rodell, M.; Strassberg, G.; Scanlon, B.R. Impact of water withdrawals from groundwater and surface water on continental water storage variations. J. Geodyn. 2012, 59, 143–156. [Google Scholar] [CrossRef]
  2. Seeboonruang, U. Impact assessment of climate change on groundwater and vulnerability to drought of areas in Eastern Thailand. Environ. Earth Sci. 2016, 75, 42. [Google Scholar] [CrossRef]
  3. Vinturini, A.R.; de Cassia Feroni, R.; Galvão, E.S. Perception of the citizens in the city of São Mateus, Brazil, on water supply and the implications in its use. Water Supply 2021, 21, 859–867. [Google Scholar] [CrossRef]
  4. Chudziński, P.; Cyfert, S.; Dyduch, W.; Zastempowski, M. Key sur(VIR)val factors in water supply companies: Some lessons from Poland. J. Water Supply Res. Technol. Aqua 2021, 70, 89–98. [Google Scholar] [CrossRef]
  5. De Franca Doria, M.; Pidgeon, N.; Hunter, P. Perception of tap water risks and quality: A structural equation model approach. Water Sci. Technol. 2005, 52, 143–149. [Google Scholar] [CrossRef]
  6. Dietrich, A.M.; Phetxumphou, K.; Gallagher, D.L. Systematic tracking, visualizing, and interpreting of consumer feedback for drinking water quality. Water Res. 2014, 66, 63–74. [Google Scholar] [CrossRef]
  7. Al-Mefleh, N.; Alayyash, S.M.; Bani Khaled, F.A. Water management problems and solutions in a residential community of Al-Mafraq city, Jordan. Water Supply 2019, 19, 1371–1380. [Google Scholar] [CrossRef]
  8. Raich-Montiu, J.; Barios, J.; Garcia, V.; Medina, M.E.; Valero, F.; Devesa, R.; Cortina, J.L. Integrating membrane technologies and blending options in water production and distribution systems to improve organoleptic properties. The case of the Barcelona Metropolitan Area. J. Clean. Prod. 2014, 69, 250–259. [Google Scholar] [CrossRef]
  9. Guragai, B.; Takizawa, S.; Hashimoto, T.; Oguma, K. Effects of inequality of supply hours on consumers’ coping strategies and perceptions of intermittent water supply in Kathmandu Valley, Nepal. Sci. Total Environ. 2017, 1, 431–441. [Google Scholar] [CrossRef]
  10. Klingel, P. Technical causes and impacts of intermittent water distribution. Water Sci. Technol. Water Supply 2012, 12, 504–512. [Google Scholar] [CrossRef]
  11. Pestana, C.J.; Neto, J.C.; Barros, M.U.G.; Menezes, I.; Góis, A.; Santos, G. Consumer perception of water quality during an off-flavor event in Fortaleza-Brazil. J. Water Supply: Res. Technol. Aqua 2019, 68, 63–73. [Google Scholar] [CrossRef]
  12. Dunn, S.M.; Brown, I.; Sample, J.; Post, H. Relationships between climate, water resources, land use and diffuse pollution and the significance of uncertainty in climate change. J. Hydrol. 2012, 434, 19–35. [Google Scholar] [CrossRef]
  13. Li, Z. A health-based regulatory chain framework to evaluate international pesticide groundwater regulations integrating soil and drinking water standards. Environ. Int. 2018, 121, 1253–1278. [Google Scholar] [CrossRef] [PubMed]
  14. Stevanović, S.D.; Krstić, J.N.; Stojanović, B.T.; Paunović, D.D.; Dimitrijević, D.S.; Veličković, J.M.; Stanković, N.J. Monitoring of drinking water from the karst springs of the Ljuberadja-Niš water supply system (Serbia). SN Appl. Sci. 2020, 2, 1847. [Google Scholar] [CrossRef]
  15. Michalski, R.; Pecyna-Utylska, P.; Kernert, J.; Grygoyć, K.; Klyta, J. Health risk assessment of selected metals through tap water consumption in Upper Silesia, Poland. J. Environ. Health Sci. Eng. 2020, 18, 1607–1614. [Google Scholar] [CrossRef]
  16. EBRD. Presentation of Assumptions; EBRD: Minsk, Belarus, 2017. [Google Scholar]
  17. Dyrektywa 2000/60/WE Parlamentu Europejskiego i Rady z Dnia 23 Października. 2000. Available online: https://eur-lex.europa.eu/legal-content/PL/TXT/PDF/?uri=CELEX:02000L0060-20141120&from=En (accessed on 15 November 2021).
  18. Prawo Wodne Dz.U.2017 poz.1566. Available online: https://isap.sejm.gov.pl/isap.nsf/DocDetails.xsp?id=WDU20170001566 (accessed on 15 November 2021).
  19. Ukraine Can Run into a Deficiency of TAP Water–Vladislava Magaletska. Available online: https://dpss.gov.ua/news/ukrayina-mozhe-zitknutisya-z-deficitom-yakisnoyi-pitnoyi-vodi-vladislava-magalecka (accessed on 15 November 2021).
  20. Ukrainian News. Available online: https://www.pravda.com.ua/news/2021/11/11/7313672/ (accessed on 11 November 2021).
  21. Ober, J.; Karwot, J. Tap water quality: Seasonal user surveys in Poland. Energies 2021, 14, 3841. [Google Scholar] [CrossRef]
  22. Grupper, M.A.; Schreiber, M.E.; Sorice, M.G. How perceptions of trust, risk, tap water quality, and salience characterize drinking water choices. Hydrology 2021, 8, 49. [Google Scholar] [CrossRef]
  23. Air Quality in Europe—2018 Report. Available online: https://www.eea.europa.eu/publications/air-quality-in-europe-2018 (accessed on 15 November 2021).
  24. Doody, D.G.; Foy, R.H.; Barry, C.D. Accounting for the role of uncertainty in declining water quality in an extensively farmed grassland catchment. Environ. Sci. Policy 2012, 24, 15–23. [Google Scholar] [CrossRef]
  25. Quirin, M.; Hartung, T.; Hoetmer, M.; Kühling, G.; Nickel, G.; Ohlebusch, H.; Sievers, H.; Korn, H.-C. Trinkwasserschutzkooperationen in Niedersachsen: Grundlagen des Kooperationsmodells und Darstellung der Ergebnisse. Grundwasser 2015, 19, 1–56. [Google Scholar]
  26. Keessen, A.M.; Runhaar, H.A.C.; Schoumans, O.F.; Van Rijswick, H.F.M.W.; Driessen, P.P.J.; Oenema, O.; Zwart, K.B. The need for flexibility and differentiation in the protection of vulnerable areas in EU environmental law: The implementation of the nitrates directive in The Netherlands. J. Eur. Environ. Plan. Law 2011, 8, 141–164. [Google Scholar] [CrossRef]
  27. EIP Water Website. Available online: https://ec.europa.eu/environment/water/innovationpartnership/index_en.htm (accessed on 15 November 2021).
  28. Jacobsen, B.H.; Anker, H.T.; Baaner, L. Implementing the water framework directive in Denmark—Lessons on agricultural measures from a legal and regulatory perspective. Land Use Policy 2017, 67, 98–106. [Google Scholar] [CrossRef]
  29. Brodny, J.; Tutak, M.; Michalak, M. A data warehouse as an indispensable tool to determine the effectiveness of the use of the longwall shearer. In Beyond Databases, Architectures and Structures; Towards Efficient Solutions for Data Analysis and Knowledge Representation; Kozielski, S., Mrozek, D., Kasprowski, P., Małysiak-Mrozek, B., Kostrzewa, D., Eds.; Springer: Cham, Switzerland, 2017; pp. 453–465. [Google Scholar] [CrossRef]
  30. Kastens, B.; Newig, J. The WATER framework Directive and agricultural nitrate pollution: Will great expectations in Brussels be dashed in Lower Saxony? Eur. Environ. 2007, 17, 231–246. [Google Scholar] [CrossRef]
  31. Voulvoulis, N.; Arpon, K.D.; Giakoumis, T. The EU Water Framework Directive: From great expectations to problems with implementation. Sci. Total. Environ. 2017, 575, 358–366. [Google Scholar] [CrossRef] [Green Version]
  32. Laureti, T.; Benedetti, I.; Branca, G. Water use efficiency and public goods conservation: A spatial stochastic frontier model applied to irrigation in Southern Italy. Socio-Econ. Plan. Sci. 2021, 73, 100856. [Google Scholar] [CrossRef]
  33. Zucaro, R.; Pontrandolfi, A. Italian policy framework for water in agriculture. In Water and Agriculture: Sustainability, Markets and Policies; OECD Publishing: Paris, France, 2006; pp. 1–12. [Google Scholar] [CrossRef]
  34. Corbari, C.; Salerno, R.; Ceppi, A.; Telesca, V.; Mancini, M. Smart irrigation forecast using satellite LANDSAT data and meteo-hydrological modeling. Agric. Water Manag. 2019, 212, 283–294. [Google Scholar] [CrossRef]
  35. WHO. Drinking Water Factsheet. 2019. Available online: https://www.who.int/news-room/fact-sheets/detail/drinking-water (accessed on 15 November 2021).
  36. Ward, J.S.T.; Lapworth, D.J.; Read, D.S.; Pedley, S.; Banda, S.T.; Monjerezi, M.; Gwengweya, G.; MacDonald, A.M. Large-scale survey of seasonal drinking water quality in Malawi using in situ tryptophan-like fluorescence and conventional water quality indicators. Sci. Total Environ. 2020, 744, 140674. [Google Scholar] [CrossRef]
  37. Stoliarenko, V.; Chernova, M.; Yakovchuk, O. Monitoring of trace element content in tap water from Karachuny Reservoir, Kryvyi Rih city. E3S Web Conf. 2020, 166, 01005. [Google Scholar] [CrossRef] [Green Version]
  38. Wiktorska, M.; Szymczyk, S.; Novikov, O. Przydatność wody ujmowanej ze studni zlokalizowanej w zagrodzie wiejskiej do spożycia i nawadniania. Proc. ECOpole 2018, 12, 587–597. [Google Scholar] [CrossRef]
  39. Rus, P.; Skorut, P. Woda od egzystencjalnego bezpieczeństwa do klęski żywiołu. Wstęp do analizy zagadnienia na wybranych przykładach bezpieczeństwa wewnętrznego III RP. Ann. Univ. Paedagog. Crac. 2018, 8, 118–130. [Google Scholar] [CrossRef]
  40. Rozporządzenie Ministra Zdrowia w Sprawie Jakości Wody Przeznaczonej do Spożycia Przez Ludzi z Dnia 7 Grudnia 2017 r. (Dz.U. z 2017 r. poz. 2294). Available online: http://isap.sejm.gov.pl/isap.nsf/DocDetails.xsp?id=WDU20170002294 (accessed on 15 November 2021).
  41. Rozporządzenie Ministra Gospodarki Morskiej i Żeglugi Śródlądowej z Dnia 29 Sierpnia 2019 r. w Sprawie Wymagań, Jakim Powinny Odpowiadać Wody Powierzchniowe Wykorzystywane do Zaopatrzenia Ludności w Wodę Przeznaczoną do Spożycia Przez Ludzi. Available online: https://isap.sejm.gov.pl/isap.nsf/DocDetails.xsp?id=WDU20190001747 (accessed on 15 November 2021).
  42. Dyrektywa Parlamentu Europejskiego i Rady (UE) 2020/2184 z Dnia 16 Grudnia 2020 r. w Sprawie Jakości Wody Przeznaczonej do Spożycia Przez Ludzi, Dziennik Urzędowy Unii Europejskiej. Available online: https://eur-lex.europa.eu/legal-content/PL/TXT/PDF/?uri=CELEX:32020L2184&from=EN (accessed on 15 November 2021).
  43. Dyrektywa 2000/60/WE Parlamentu Europejskiego i Rady z Dnia 23 Października 2000 r. Ustanawiająca Ramy Wspólnotowego Działania w Dziedzinie Polityki Wodnej. Available online: https://eur-lex.europa.eu/legal-content/PL/TXT/?uri=celex%3A32000L0060 (accessed on 15 November 2021).
  44. Normy Wykorzystywane w Badaniach Jakości Wody Przeznaczonej do Spożycia Przez Ludzi. Available online: https://www.gov.pl/web/gis/normy (accessed on 15 November 2021).
  45. Obwieszczenie Marszałka Sejmu Rzeczypospolitej Polskiej z Dnia 9 Listopada 2018 r. w Sprawie Ogłoszenia Jednolitego Tekstu Ustawy—Prawo Wodne. Available online: https://isap.sejm.gov.pl/isap.nsf/DocDetails.xsp?id=WDU20180002268 (accessed on 15 November 2021).
  46. Ustawa z Dnia 7 Czerwca 2001 r. o Zbiorowym Zaopatrzeniu w Wodę i Zbiorowym Odprowadzaniu Ścieków. Available online: https://isap.sejm.gov.pl/isap.nsf/DocDetails.xsp?id=WDU20010720747 (accessed on 15 November 2021).
  47. Ustawa z Dnia 14 Marca 1985 r. o Państwowej Inspekcji Sanitarnej. Available online: https://isap.sejm.gov.pl/isap.nsf/DocDetails.xsp?id=WDU19850120049 (accessed on 15 November 2021).
  48. Żelazny, L. Monitoring Środowiska Wód Powierzchniowych w Polsce i na Ukrainie—Podobieństwa i Różnice. Wojewódzki Inspektorat Ochrony Środowiska w Lublinie. Available online: https://wios.rzeszow.pl/cms/upload/edit/file/narada_Lublin.pdf (accessed on 15 November 2021).
  49. Межгoсударственный Стандарт. Качествo Вoд. Термины и Определения (Water Quality. Terms and Definitions). Available online: https://docs.cntd.ru/document/1200009522 (accessed on 15 November 2021).
  50. Konieczny, R.; Rataj, C. Zasoby wodne i zapotrzebowanie na wodę—sytuacja Polski na tle innych krajów. In Ekspertyza. Woda w Rolnictwie; Borek, R., Furdyna, A., Makowska, A., Perzyna, J., Staniszewska, M., Zwolińska, J., Eds.; Koalicja Żywa Ziemia: Warsaw, Poland, 2020; pp. 16–22. [Google Scholar]
  51. Kuzior, A. Polskie i niemieckie doświadczenia w projektowaniu i wdrażaniu zrównoważonego rozwoju (Polish and German Experiences in Planning and Implementation of Sustainable Development). Problemy Ekorozwoju 2010, 5, 81–89. [Google Scholar]
  52. Jonek-Kowalska, I.; Wolniak, R. Economic opportunities for creating smart cities in Poland. Does wealth matter? Cities 2021, 114, 103222. [Google Scholar] [CrossRef]
  53. Mynarski, S. Praktyczne Metody Analizy Danych Rynkowych i Marketingowych; Zakamycze: Krakow, Poland, 2000. [Google Scholar]
  54. Bank Danych Lokalnych Głównego Urzędu Statystycznego (na Podstawie Danych Dotyczących Stanu Ludności za 2020 Rok, Ostatnia Aktualizacja: 01.06.2021 r.). Available online: https://bdl.stat.gov.pl/BDL/pomoc/stanzasilenia?active=2 (accessed on 3 July 2021).
  55. Bank Danych Lokalnych Głównego Urzędu Statystycznego (na Podstawie Danych Dotyczących Ludności Korzystającej z Sieci Wodociągowej za 2019 Rok, Ostatnia Aktualizacja: 07.06.2021 r.). Available online: https://bdl.stat.gov.pl/BDL/dane/podgrup/temat/11/57/1601 (accessed on 3 July 2021).
  56. State Statistics Service of Ukraine. Available online: http://database.ukrcensus.gov.ua/PXWEB2007/eng/news/op_popul_e.asp (accessed on 3 July 2021).
  57. The World Bank Group, People Using Safely Managed Tap Water Services (% of Population)—Ukraine. Available online: https://data.worldbank.org/indicator/SH.H2O.SMDW.ZS?locations=UA&most_recent_value_desc=false (accessed on 3 July 2021).
  58. Stanisz, A. Przystępny Kurs Statystyki z Zastosowaniem STATISTICA PL na Przykładach z Medycyny. Tom 1. Statystyki Podstawowe; StatSoft Polska: Krakow, Poland, 2006. [Google Scholar]
  59. Panczyk, M. Prezentacja Podstawy Biostatystyki 9a. Miary Wielkości Efektu. Available online: https://www.authorstream.com/Presentation/panstudio-2620824-9a-miary-wielko-ci-efektu-dla-por-wna-dw-ch-grup/ (accessed on 3 July 2021).
  60. Stanisz, A. Przystępny Kurs Statystyki z Zastosowaniem STATISTICA PL na Przykładach z Medycyny; Tom 3. Analizy Wielowymiarowe; StatSoft Polska: Krakow, Poland, 2007. [Google Scholar]
  61. Zaborski, A. Analiza PROFIT i jej wykorzystanie w badaniu preferencji. In Taksonomia 19. Klasyfikacja i Analiza Danych—Teoria i Zastosowania; Jajuga, K., Walesiak, M., Eds.; Wydawnictwo Uniwersytetu Ekonomicznego we Wrocławiu: Wrocław, Poland, 2012; pp. 487–494. [Google Scholar]
Figure 1. Three-dimensional column coordinate plot for country data, period of greatest tap water supply consumption and use of tap water directly for drinking without boiling.
Energies 15 00981 g001
Figure 2. Three-dimensional column coordinate plot for country data, period of use of the largest amount of tap water supplied and use of additional tap water filtration and/or treatment device.
Energies 15 00981 g002
Figure 3. Evaluation of tap water taste during individual periods of the year by groups of respondents from Poland and Ukraine.
Energies 15 00981 g003
Figure 4. Assessment of tap water odor during individual periods of the year by groups of respondents from Poland and Ukraine.
Energies 15 00981 g004
Figure 5. Assessment of tap water color during individual periods of the year by groups of respondents from Poland and Ukraine.
Energies 15 00981 g005
Figure 6. Turbidity assessment of tap water during individual periods of the year by groups of respondents from Poland and Ukraine.
Energies 15 00981 g006
Figure 7. Assessment of tap water hardness during individual periods of the year by groups of respondents from Poland and Ukraine.
Energies 15 00981 g007
Figure 8. Assessment of tap water pressure during individual periods of the year by groups of respondents from Poland and Ukraine.
Energies 15 00981 g008
Figure 9. Evaluation of continuity of tap water supply during individual seasons of the year according to the groups of respondents from Poland and Ukraine.
Energies 15 00981 g009
Figure 10. Dendrogram obtained for analyzed tap water parameters in terms of their evaluation among respondents from Poland and Ukraine in springtime (results of cluster analysis by agglomeration).
Energies 15 00981 g010
Figure 11. Results of multidimensional scaling for particular objects (seasons), taking into account all characteristics (parameters of tap water supplied in Poland and Ukraine).
Energies 15 00981 g011
Figure 12. Biplot including the results of multidimensional scaling based on individual parameters of tap water supplied in Poland and Ukraine.
Energies 15 00981 g012
Table 1. Assessment of surface water quality in Poland.
Chemical Status
GoodBelow Good
Ecological status/potentialVery good ecological statusGood water statusBad water status
Good ecological status/ecological potential good or above goodGood water statusBad water status
Moderate ecological status/moderate ecological potentialBad water statusBad water status
Poor ecological status/ecological potential poorBad water statusBad water status
Bad ecological status/ecological potential badBad water statusBad water status
Source: Own elaboration based on: Żelazny, L. Monitoring środowiska wód powierzchniowych w Polsce i na Ukrainie—podobieństwa i różnice. Wojewódzki Inspektorat Ochrony Środowiska w Lublinie. Available online: https://wios.rzeszow.pl/cms/upload/edit/file/narada_Lublin.pdf (accessed on 15 November 2021).
Table 2. Assessment of surface water quality in Ukraine.
Water Quality ClassIIIIIIIVV
Water Quality Category1234567
Name of class and category of water quality and statusVery goodGoodSatisfactoryBadVery bad
Very goodVery goodGoodSatisfactoryIntermediateBadVery bad
Name of class and category of water quality and its degree of purity (pollution)Very cleanCleanContaminatedDirtyVery dirty
Very cleanCleanQuite cleanPoorly pollutedModerately pollutedDirtyVery dirty
Source: Own elaboration based on: Żelazny, L. Monitoring środowiska wód powierzchniowych w Polsce i na Ukrainie—podobieństwa i różnice. Wojewódzki Inspektorat Ochrony Środowiska w Lublinie. Available online: https://wios.rzeszow.pl/cms/upload/edit/file/narada_Lublin.pdf (accessed on 15 November 2021).
Table 3. Assessment of surface water quality in Ukraine.
CountryTotal
(n = 1653)
Poland
(n = 1198)
Ukraine
(n = 455)
n%n%n%
GenderMen62852.42%10523.08%73344.34%
Women57047.58%35076.92%92055.66%
AgeUp to 24 years131.09%18340.22%19611.86%
25–34 years13411.19%12727.91%26115.79%
35–44 years32927.46%8418.46%41324.98%
45–54 years31626.38%419.01%35721.60%
55 and over40633.89%204.40%42625.77%
EducationPrimary221.84%183.96%402.42%
Secondary49241.07%7917.36%57134.54%
Higher68457.10%35878.68%104263.04%
Percentage base: all respondents from Poland (n = 1198) and Ukraine (n = 455) and all respondents in total (n = 1653).
Table 4. Distribution of frequency profiles observed among respondents regarding country, period of consumption of the largest amount of tap water supplied and the use of tap water directly for drinking without boiling.
Frequencies Observed
Input Table (Rows * Columns): 9 × 9 (Burt ‘s Table)
Country PolandCountry UkraineSpring PeriodSummer PeriodAutumn PeriodWinter PeriodDrinking YesDrinking Boil. aDrinking NoTotal
Country: Poland1198068101336815633412943594
Country: Ukraine04551735616661101232221365
Period: Spring681785000352822255
Period: Summer101335601369005773784144107
Period: Autumn361600520191518156
Period: Winter8166000147424362441
Drinking: Yes563110355771942673002019
Drinking: Boil. a341123283781543046401392
Drinking: No294222224141862005161548
Total35941365255410715644120191392154814,877
a Boil.: No, I drink it after boiling it first.
Table 5. Eigenvalues and inertia for all dimensions relating to country, period of use of the largest quantity of tap water supplied and the use of tap water directly for drinking without boiling.
Number of DimensionsEigenvalues and Inertia (All Dimensions)
Input Table (Rows * Columns): 9 × 9 (Burt’s Table)
Total Inertia = 2.0000
Singular ValuesEigenvaluesPercentage of InertiaCumulative Percentageχ2
10.66410.441022.0522.052250.80
20.58540.342717.1339.181749.14
30.57740.333416.6755.851701.58
40.56960.324416.2272.071655.89
50.55710.310415.5287.591584.13
60.49820.248212.41100.001266.93
Table 6. Distribution of frequency profiles observed among respondents regarding country, period of use of the largest amount of tap water supplied and the use of an additional device to filter and/or treat tap water.
Frequencies Observed
Input Table (Rows * Columns): 8 × 8 (Burt’s Table)
Country PolandCountry UkraineSpring PeriodSummer PeriodAutumn PeriodWinter PeriodDevice YesDevice NoTotal
Country: Poland1198068101336815976013594
Country: Ukraine04551735616662731821365
Period: Spring6817850004540255
Period: Summer101335601369007086614107
Period: Autumn3616005203220156
Period: Winter81660001478562441
Device: Yes59727345708328587002610
Device: No60118240661206207832349
Total3594136525541071564412610234914,877
Table 7. Eigenvalues and inertia for all dimensions relating to country, period of use of the largest amount of tap water supplied and the use of an additional tap water filtration and/or treatment device.
Number of DimensionsEigenvalues and Inertia (All Dimensions)
Input Table (Rows * Columns): 8 × 8 (Burt’s Table)
Total Inertia = 1.6667
Singular ValuesEigen ValuesPercentage of InertiaCumulative
Percentage
χ2
10.62590.391723.5023.501963.13
20.58130.337920.2743.781693.37
30.57740.333320.0063.781670.56
40.56350.317619.0582.831591.48
50.53500.286217.17100.001434.25
Table 8. Comparison of the groups of respondents from Poland and Ukraine in terms of evaluation of the taste of tap water during individual periods of the year.
Descriptive Statistics—TasteMann–Whitney U Testrg of Glass
Mean ± Stand Dev.Median (Q25–Q75)Min.–Max.Confidence IntervalStand. Error
–95.00%+95.00%
SpringPoland
(n = 1198)
3.83 ± 1.014 (3–5)1–53.773.890.03Z = 17.57;
p < 0.001
0.56
Ukraine
n = 455)
2.56 ± 1.223 (1–3)1–52.452.670.06
SummerPoland
(n = 1198)
3.8 ± 1.034 (3–5)1–53.743.860.03Z = 16.72;
p < 0.001
0.53
Ukraine
(n = 455)
2.56 ± 1.273 (1–3)1–52.442.680.06
AutumnPoland
(n = 1198)
3.78 ± 1.044 (3–5)1–53.723.840.03Z = 16.31;
p < 0.001
0.52
Ukraine
(n = 455)
2.62 ± 1.213 (1–4)1–52.502.730.06
WinterPoland
(n = 1198)
3.78 ± 1.114 (3–5)1–53.723.840.03Z = 15.25;
p < 0.001
0.48
Ukraine
(n = 455)
2.64 ± 1.283 (1–4)1–52.522.760.06
Table 9. Comparison of groups of respondents from Poland and Ukraine in terms of evaluation of tap water odor during individual periods of the year.
Descriptive Statistics—OdorMann–Whitney U Testrg of Glass
Mean ± Stand. Dev.Median (Q25–Q75)Min.–Max.Confidence IntervalStand. Error
–95.00%+95.00%
SpringPoland
(n = 1198)
3.89 ± 1.024 (3–5)1–53.833.940.03Z = 13.82;
p < 0.001
0.44
Ukraine
(n = 455)
2.98 ± 1.173 (2–4)1–52.873.090.05
SummerPoland
(n = 1198)
3.85 ± 1.044 (3–5)1–53.793.910.03Z = 13.78;
p < 0.001
0.44
Ukraine
(n = 455)
2.95 ± 1.163 (2–4)1–52.843.050.05
AutumnPoland
(n = 1198)
3.85 ± 1.054 (3–5)1–53.793.910.03Z = 13.21;
p < 0.001
0.42
Ukraine
(n = 455)
3.02 ± 1.113 (2–4)1–52.913.120.05
WinterPoland
(n = 1198)
3.84 ± 1.124 (3–5)1–53.773.900.03Z = 11.79;
p < 0.001
0.38
Ukraine
(n = 455)
3.08 ± 1.173 (2–4)1–52.973.180.05
Table 10. Comparison of groups of respondents from Poland and Ukraine in terms of evaluation of tap water color during individual periods of the year.
Descriptive Statistics—ColorMann–Whitney U Testrg of Glass
Mean ± Stand. Dev.Median (Q25–Q75)Min.–Max.Confidence IntervalStand. Error
–95.00%+95.00%
SpringPoland
(n = 1198)
4.05 ± 1.044 (4–5)1–53.994.110.03Z = 11.48;
p < 0.001
0.36
Ukraine
(n = 455)
3.31 ± 1.23 (3–4)1–53.193.420.06
SummerPoland
(n = 1198)
4.01 ± 1.074 (3–5)1–53.954.070.03Z = 11.89;
p < 0.001
0.38
Ukraine
(n = 455)
3.2 ± 1.253 (2–4)1–53.083.310.06
AutumnPoland
(n = 1198)
4.01 ± 1.074 (4–5)1–53.954.070.03Z = 11.56;
p < 0.001
0.37
Ukraine
(n = 455)
3.27 ± 1.193 (3–4)1–53.163.380.06
WinterPoland
(n = 1198)
4.03 ± 1.084 (4–5)1–53.974.100.03Z = 10.08;
p < 0.001
0.32
Ukraine
(n = 455)
3.4 ± 1.194 (3–4)1–53.293.510.06
Table 11. Comparison of groups of respondents from Poland and Ukraine in terms of evaluation of tap water turbidity during individual periods of the year.
Descriptive Statistics—TurbidityMann–Whitney U Testrg of Glass
Mean ± Stand. Dev.Median (Q25–Q75)Min.–Max.Confidence IntervalStand. Error
–95.00%+95.00%
SpringPoland
(n = 1198)
3.96 ± 1.064 (3–5)1–53.904.020.03Z = 12.91;
p < 0.001
0.41
Ukraine
(n = 455)
3.13 ± 1.153 (2–4)1–53.023.230.05
SummerPoland
(n = 1198)
3.94 ± 1.084 (3–5)1–53.884.010.03Z = 12.71;
p < 0.001
0.40
Ukraine
(n = 455)
3.11 ± 1.173 (2–4)1–53.003.220.06
AutumnPoland
(n = 1198)
3.94 ± 1.074 (3–5)1–53.884.000.03Z = 12.64;
p < 0.001
0.40
Ukraine
(n = 455)
3.14 ± 1.133 (2–4)1–53.043.250.05
WinterPoland
(n = 1198)
3.95 ± 1.094 (3–5)1–53.894.010.03Z = 11.75;
p < 0.001
0.37
Ukraine
(n = 455)
3.19 ± 1.183 (2–4)1–53.083.300.06
Table 12. Comparison of groups of respondents from Poland and Ukraine in terms of evaluation of tap water hardness during individual periods of the year.
Descriptive Statistics—HardnessMann–Whitney U Testrg pf Glass
Mean ± Stand. Dev.Median (Q25–Q75)Min.–Max.Confidence IntervalStand. Error
–95.00%+95.00%
SpringPoland
(n = 1198)
3.54 ± 1.144 (3–4)1–53.473.600.03Z = 11.62;
p < 0.001
0.37
Ukraine
(n = 455)
2.77 ± 1.133 (2–4)1–52.662.870.05
SummerPoland
(n = 1198)
3.52 ± 1.154 (3–4)1–53.463.590.03Z = 11.24;
p < 0.001
0.36
Ukraine
(n = 455)
2.78 ± 1.133 (2–4)1–52.672.880.05
AutumnPoland
(n = 1198)
3.52 ± 1.154 (3–4)1–53.453.580.03Z = 11.05;
p < 0.001
0.35
Ukraine
(n = 455)
2.79 ± 1.113 (2–4)1–52.682.890.05
WinterPoland
(n = 1198)
3.51 ± 1.174 (3–4)1–53.443.580.03Z = 11.46;
p < 0.001
0.36
Ukraine
(n = 455)
2.75 ± 1.133 (2–3)1–52.642.850.05
Table 13. Comparison of groups of respondents from Poland and Ukraine in terms of evaluation of tap water pressure during individual periods of the year.
Descriptive Statistics—PressureMann–Whitney U Testrg of Glass
Mean ± Stand. Dev.Median (Q25–Q75)Min.–Max.Confidence IntervalStand. Error
–95.00%+95.00%
SpringPoland
(n = 1198)
3.97 ± 1.14 (3–5)1–53.914.030.03Z = 7.2;
p < 0.001
0.23
Ukraine
(n = 455)
3.6 ± 1.034 (3–4)1–53.503.690.05
SummerPoland
(n = 1198)
3.68 ± 1.194 (3–5)1–53.613.740.03Z = 4.95;
p < 0.001
0.16
Ukraine
(n = 455)
3.39 ± 1.113 (3–4)1–53.293.490.05
AutumnPoland
(n = 1198)
3.96 ± 1.114 (3–5)1–53.904.020.03Z = 7.27;
p < 0.001
0.23
Ukraine
(n = 455)
3.58 ± 1.044 (3–4)1–53.483.670.05
WinterPoland
(n = 1198)
3.99 ± 1.114 (3–5)1–53.934.060.03Z = 7.26;
p < 0.001
0.23
Ukraine
(n = 455)
3.6 ± 1.084 (3–4)1–53.503.690.05
Table 14. Comparison of the groups of respondents from Poland and Ukraine in terms of evaluation of continuity of tap water supply during individual periods of the year.
Descriptive Statistics—Continuity of SupplyMann–Whitney U Testrg of Glass
Mean ± Stand. Dev.Median (Q25–Q75)Min.–Max.Confidence IntervalStand. Error
–95.00%+95.00%
SpringPoland
(n = 1198)
4.53 ± 0.785 (4–5)1–54.494.580.02Z = 15.88;
p < 0.001
0.51
Ukraine
(n = 455)
3.52 ± 1.24 (3–4)1–53.413.630.06
SummerPoland
(n = 1198)
4.48 ± 0.815 (4–5)1–54.444.530.02Z = 18.27;
p < 0.001
0.58
Ukraine
(n = 455)
3.08 ± 1.393 (2–4)1–52.953.200.06
AutumnPoland
(n = 1198)
4.54 ± 0.785 (4–5)1–54.504.580.02Z = 15.38;
p < 0.001
0.49
Ukraine
(n = 455)
3.61 ± 1.154 (3–5)1–53.503.710.05
WinterPoland
(n = 1198)
4.54 ± 0.785 (4–5)1–54.504.590.02Z = 13.98;
p < 0.001
0.44
Ukraine
(n = 455)
3.68 ± 1.184 (3–5)1–53.573.790.06
Table 15. Cluster elements for the analyzed parameters of tap water in terms of their evaluation among respondents from Poland and Ukraine in spring (results of cluster analysis using the k-means clustering method).
Elements of Individual ClustersDistanceDescriptive Statistics—Spring
Mean ± Stand. Dev.Median (Q25–Q75)Min.–Max.Confidence IntervalStand. Error
–95.00%+95.00%
Cluster 1Taste (PL)0.51713.97 ± 1.064 (3–5)1–53.943.990.01
Odor (PL)0.5228
Color (PL)0.5311
Turbidity (PL)0.5458
Hardness (PL)0.8380
Pressure (PL)0.7907
Continuity of supply (PL)0.8249
Cluster 2Taste (UA)0.65123.12 ± 1.213 (2–4)1–53.083.160.02
Odor (UA)0.5088
Color (UA)0.4846
Turbidity (UA)0.4964
Hardness (UA)0.5426
Pressure (UA)0.5844
Continuity of supply (UA)0.6406
Table 16. Average ratings of parameters of tap water supplied in Poland and Ukraine for individual periods of the year.
SpringSummerAutumnWinter
Taste (PL)3.833.803.783.78
Taste (UA)2.562.562.622.64
Odor (PL)3.893.853.853.84
Odor(UA)2.982.953.023.08
Color (PL)4.054.014.014.03
Color (UA)3.313.203.273.40
Turbidity (PL)3.963.943.943.95
Turbidity (UA)3.133.113.143.19
Hardness (PL)3.543.523.523.51
Hardness (UA)2.772.782.792.75
Pressure (PL)3.973.683.963.99
Pressure (UA)3.603.393.583.60
Continuity of supply (PL)4.534.484.544.54
Continuity of supply (UA)3.523.083.613.68
Table 17. Results of regression analysis between parameters of tap water supplied in Poland and Ukraine and dimensions of the studied units.
Absolute TermDIM.1DIM.2R2
b0pbpbp
Taste (PL)3.796p < 0.010.006p = 0.825–0.019p = 0.5960.3829
Taste (UA)2.594p < 0.01–0.033p = 0.3410.031p = 0.430.8144
Odor (PL)3.856p < 0.010.002p = 0.931–0.021p = 0.490.5185
Odor (UA)3.004p < 0.01–0.052p = 0.1120.043p = 0.170.9782
Color (PL)4.027p < 0.01–0.012p = 0.636–0.005p = 0.8720.3127
Color (UA)3.292p < 0.01–0.077p = 0.2170.050p = 0.3870.9091
Turbidity (PL)3.949p < 0.01–0.003p = 0.798–0.002p = 0.8650.1338
Turbidity (UA)3.143p < 0.001–0.028p < 0.050.032p < 0.050.9992
Hardness (PL)3.522p < 0.010.003p = 0.801–0.011p = 0.5140.5054
Hardness (UA)2.769p < 0.010.008p = 0.616–0.018p = 0.4240.6767
Pressure (PL)3.899p < 0.01–0.163p < 0.063–0.024p = 0.4470.9904
Pressure (UA)3.540p < 0.01–0.109p < 0.086–0.024p = 0.4240.9823
Continuity of supply (PL)4.525p < 0.001–0.031p < 0.01–0.003p = 0.10.9999
Continuity of supply (UA)3.473p < 0.01–0.300p < 0.050.007p = 0.7810.9975
Publisher’s Note: MDPI stays neutral with regard to jurisdictional claims in published maps and institutional affiliations.

