Article

The Inhibitory Effect of Free Nitrous Acid and Free Ammonia on the Anoxic Phosphorus Uptake Rate of Polyphosphate-Accumulating Organisms

Sanitary Engineering Laboratory, Department of Water Resources and Environmental Engineering, School of Civil Engineering, National Technical University of Athens, 5 Iroon Polytechniou, 15780 Athens, Greece
*
Author to whom correspondence should be addressed.
Energies 2022, 15(6), 2108; https://doi.org/10.3390/en15062108
Submission received: 11 February 2022 / Revised: 7 March 2022 / Accepted: 10 March 2022 / Published: 14 March 2022
(This article belongs to the Special Issue Wastewater, Water and Energy)

Abstract

:
The purpose of this study is to investigate the effect of free nitrous acid (FNA) and free ammonia (FA) on the anoxic phosphorus uptake rate (PUR) of polyphosphate-accumulating organisms (PAOs) via the utilization of nitrite. With this goal, upon developing a PAO-enriched culture in a sequential batch reactor, a series of batch experiments were conducted to examine the effects of nitrite and ammonium on the anoxic phosphorus uptake rate at different pH levels. According to the results, both free nitrous acid and free ammonia were found to inhibit anoxic PUR to a degree similar to their respective effects on aerobic PUR reported in previous studies, suggesting that phosphorus removal via the anoxic pathway may be just as susceptible as that via the aerobic pathway. The effect of FNA on anoxic PUR is optimally described by a non-competitive inhibition model with a KiFNA value of 1.6 μg N L−1, while the Levenspiel model with an SFA* value of 37 mg N L−1 provided the best fit for the FA effect on PAOs anoxic activities. The results of this study provide new insights regarding the viability of EBPR under high nitrogen loading conditions.

Graphical Abstract

1. Introduction

Enhanced biological phosphorus removal (EBPR) is rightfully considered a simple and effective method for the removal of phosphorus from wastewater. EBPR relies on the selective growth of polyphosphate-accumulating organisms (PAOs) achieved with the inclusion of an anaerobic phase prior to the aerobic and/or anoxic phases in activated sludge systems. During the anaerobic phase, PAOs uptake volatile fatty acids (VFAs) and store them intracellularly as polyhydroxyalkanoates (PHAs) by hydrolyzing their intracellular polyphosphate chains. Once in the presence of an electron donor, PAOs oxidize the stored PHAs, taking up orthophosphates in the process for the reformation of their polyphosphate chains [1]. By enriching the biomass with PAOs, phosphorus removal is achieved via the net removal of excess sludge.
In conventional wastewater treatment plants (WWTPs), ammonium is primarily removed via nitrification/denitrification. In aerobic conditions, ammonium is converted to nitrite using ammonium oxidizing bacteria (AOB) before being further oxidized to a nitrate using nitrite oxidizing bacteria (NOB). The produced nitrate may then be reduced to nitrogen gas using common heterotrophs under anoxic conditions, effectively removing it from the medium. In some cases, it is possible to partially or completely bypass the nitratation process by inhibiting NOB, allowing ammonium to be removed by nitritation/denitritation. This may be achieved by a number of strategies, such as maintaining a low aerobic solid retention time (SRT) and/or maintaining lower DO concentrations during the aerobic phase. This short-cut pathway for ammonium removal provides certain benefits, namely a lower oxygen demand and a lower demand for carbon [2]. Recently, the sidestream treatment of the reject water produced during the sludge anaerobic stabilization processes and the subsequent dewatering process has emerged as an attractive strategy to relieve nutrient loading in the WWTP’s mainstream. This reject water, particularly that produced during dewatering following anaerobic digestion, contains significant ammonium and phosphorus concentrations, as high as 1300 mg L−1 and 72 mg L−1, respectively [3]. The abundance of ammonium in the sludge reject water stream, in regard to its pH, would create high concentrations of free ammonia (FA), which is known to severely inhibit NOB, and to a lesser, though substantial extent, AOB activity [4]. Therefore, the removal of ammonium in such systems via nitritation/denitritation as opposed to the use of conventional nitrification/denitrification may actually be the only feasible pathway.
While the removal of ammonium via nitritation/denitritation appears to be advantageous due to both the lower energy demand for the required aeration and the lower requirements for external carbon dosage (to the order of 25% and 40%, respectively), this process may have a significantly deteriorating effect on EBPR, since nitrite, and more specifically its protonated form (free nitrous acid—FNA), has been found to severely inhibit PAO activity [5]. The effect of free nitrous acid on the phosphorus uptake rate (PUR) of PAOs under aerobic conditions has been reported in a number of studies, and the degree of PUR inhibition appears to vary with regard to the studied biomass’s acclimation to FNA. For an acclimatized biomass, aerobic PUR has been reported to be fully inhibited for FNA concentrations of 10 μg N L−1 [6] and 13 μg N L−1 [7]. Andreadakis et al. [7] also reported that aerobic PUR inhibition may be accurately described by a non-competitive inhibition model with an FNA inhibition constant of 1.5 μg N L−1. In regard to the effect of FNA on anoxic P-removal, Zhou et al. [8] reported that the process was fully inhibited by the FNA concentration of 37 μg L−1, a concentration considerably greater than those that had been previously reported as capable of fully inhibiting aerobic PUR [5,9,10]. However, Zhou et al. [6] reported that anoxic PUR was fully inhibited at the FNA concentration of 5 μg N L−1, which would indicate that anoxic P-uptake is more sensitive to FNA than aerobic P-uptake, in agreement with the observations of Meinhold et al. [11], but in contrast with those of Saito et al. [10]. The authors suggested that the contradictory results may be due to differences in the microbial populations of the studied biomass and their respective tolerance to FNA. Further evidence for this may be provided by the findings of Frison et al. [12], who investigated the integration of nitritation-denitritation with EBPR at a pilot scale using the fermented products of municipal solid waste as a carbon source. The authors reported that while aerobic phosphorus uptake was significantly low, anoxic P-removal reached PURs of up to 9–12 mg P g−1 VSS h−1 under nitrite concentrations of up to 140 mg L−1 (approximately 9 μg HNO2-N L−1).
Additionally, it has been recently reported that free ammonia (FA) may also be an inhibitor of PAOs [7,13,14]. Zheng et al. [14] reported that PAOs were fully inhibited under an FA concentration of 17.76 mg N L−1, and that analysis before and after exposure revealed a significant deterioration of the PAO population. Similarly, Yang et al. [13] noticed a severe inhibition of PAO activity (>90%) after their exposure to 16 mg N L−1. Andreadakis et al. [7] studied the effect of FA on aerobic PUR and reported that the inhibition may be described as satisfactory by an un-competitive inhibition model, while observing severe PUR inhibition (>90%) at the FA concentration of 29 mg N L−1. In light of this, it appears that high FA concentrations may have a significant negative effect on EBPR.
Considering the few and rather contradictory reports for the inhibitory effect of FNA on anoxic PUR, questions regarding the degree of inhibition and the tolerance of the anoxic pathway in comparison with the aerobic pathway are still prevalent. Moreover, the exact mode of anoxic PUR inhibition by FNA is, at this point, yet to be determined. On the other hand, the effect of FA on EBPR has only recently come to light, and information on its effect on anoxic P-uptake is practically non-existent. In this study, the inhibitory effect of free nitrous acid and free ammonia on the phosphorus uptake rate of PAOs under anoxic conditions is evaluated, and appropriate inhibition models for both FA and FNA are proposed. With this goal in mind, a PAO-enriched biomass was developed in a sequencing batch reactor (SBR) that was used to fuel a series of ex situ batch experiments. The results of this study may provide valuable information for the optimization of EBPR in nitritation/denitritation systems with special regard to nitrogen loading and pH control.

2. Materials and Methods

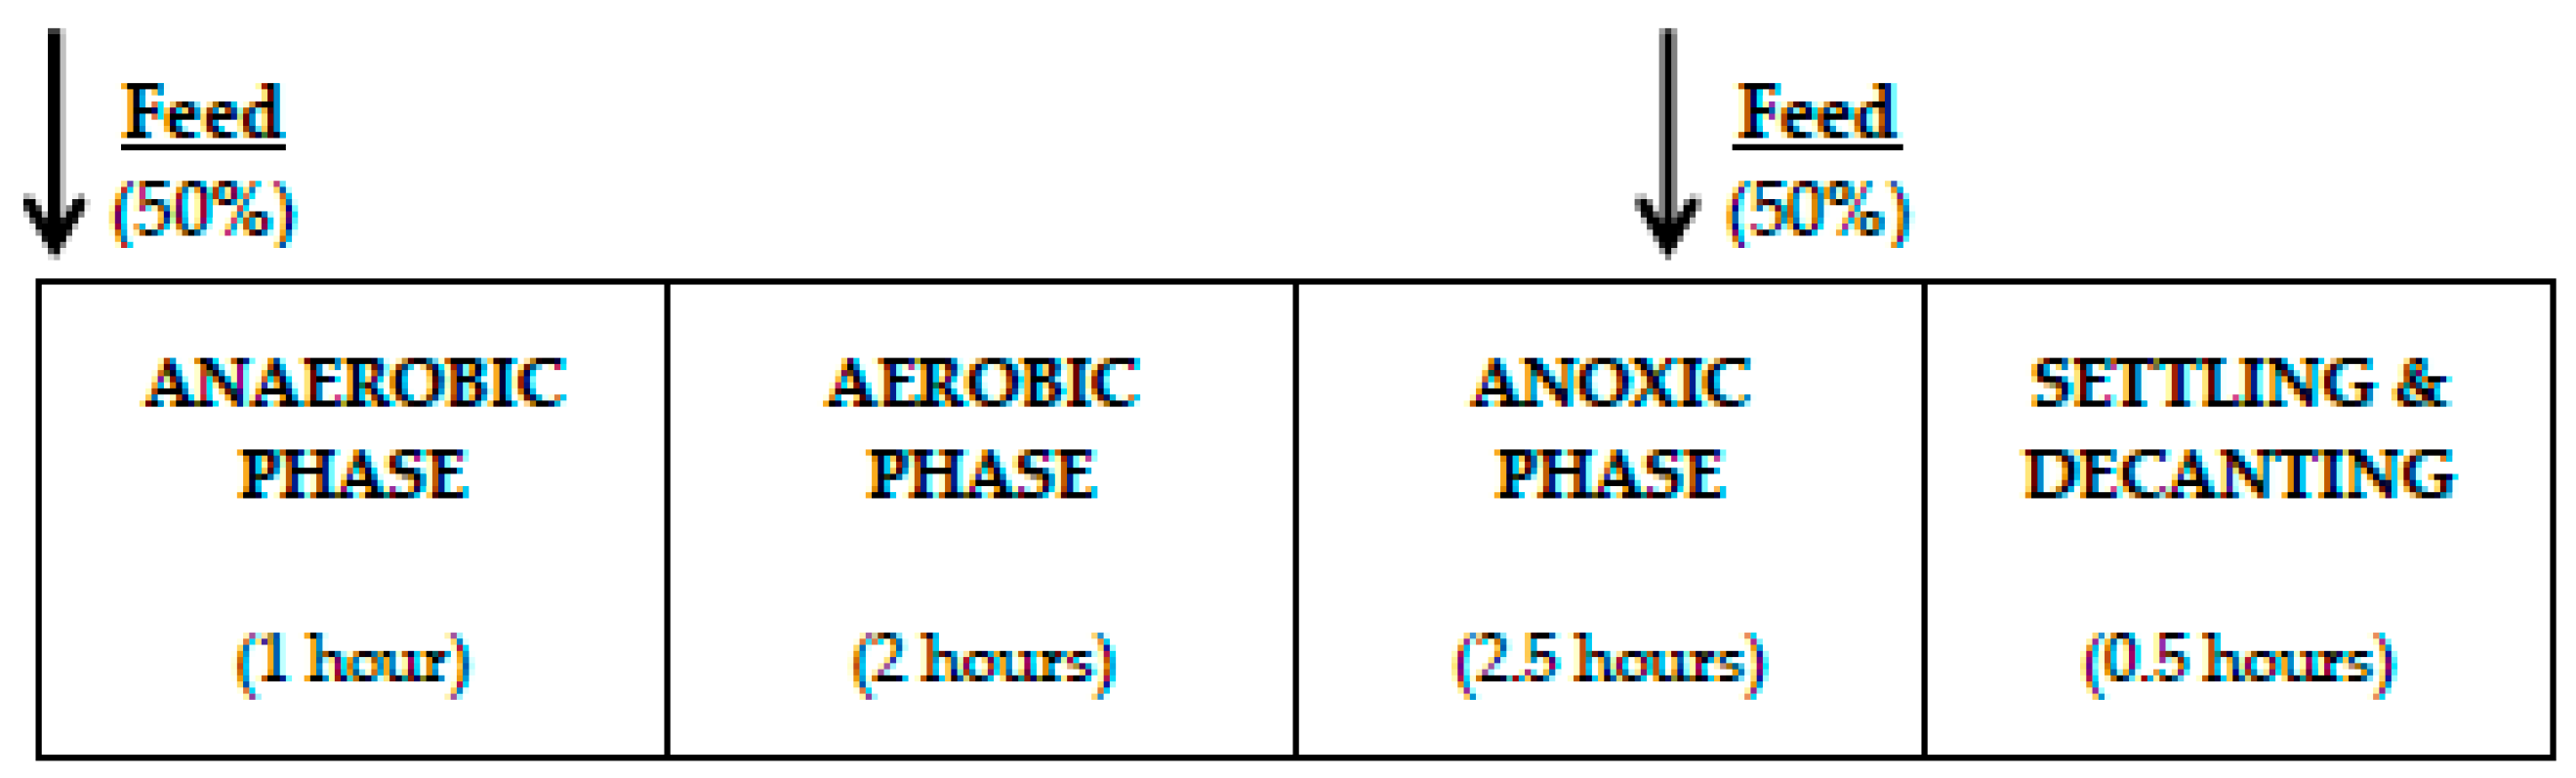
2.1. Experimental Set-Up

A sequencing batch reactor (SBR) was set up at the National Technical University of Athens and was operated for 240 days. The SBR with a working volume of 10 L was seeded with biomass from a conventional activated sludge unit in Athens, Greece. The SBR was operated with a cycle time of 6 h consisting of an anaerobic, an aerobic, and an anoxic phase, with feed in the form of synthetic wastewater, occurring twice per cycle. Specifically, each cycle commenced with the introduction of feed over a period of one minute, after which the SBR was left under anaerobic conditions for 1 h. Following that, the SBR was aerated over a 2 h period via an air pump, providing a dissolved oxygen (DO) concentration that consistently exceeded 3 mg L−1 after 0.5 h of aeration to ensure adequate aerobic conditions. With the ceasing of aeration, the SBR was left without feed over a 1.5 h period to give the existing desired PAO population priority over common heterotrophs to denitrify. An equal amount of feed was then reintroduced, followed by a 1 h anoxic/anaerobic phase. Figure 1 displays a complete schematic of each cycle. The carbon source of the synthetic feed consisted solely of readily biodegradable organic carbon in the form of propionate, as it has been demonstrated that the integration of nitritation/denitritation with EBPR, when propionate is the sole carbon source, favours the prevalence of PAOs [15]. The dose of the feed was adjusted in order to establish a food to microorganisms ratio of 0.25 mg COD g−1 VSS d−1. Ammonium was added to the feed as ammonium chloride at a loading rate of 0.12 kg NH4-N m−3 d−1 in order to partially inhibit full nitrification, apart from providing the biomass its growth requirements. Phosphorus was added as potassium phosphate at a loading rate of 0.05 kg PO4-P m−3 d−1, in order to provide an abundance of phosphorus for the selective growth of PAOs. The hydraulic retention time (HRT) and solid retention time (SRT) were kept constant at 2 and 10 d, respectively. The temperature in the reactor was maintained at 20 ± 2 °C. Routine monitoring included the analysis of pH, phosphorus, ammonium, nitrite, nitrate, COD, TSS, and VSS concentrations throughout all phases.

2.2. Batch Experiments

2.2.1. Investigation of the Effect of FNA on Anoxic PUR

The inhibitory effect of FNA on anoxic PUR was evaluated for nitrite concentrations in the range of 25–350 mg NO2-N L−1. In each experiment, biomass was withdrawn before feed and distributed into four 0.5 L reactors. The pH in each reactor was set to 8 ± 0.05 and kept constant over the duration of each experiment with the frequent addition of a 0.1 N H2SO4 solution. Each reactor was fed with readily biodegradable organic carbon, in the form of a sodium acetate solution, in order to establish a starting COD content of 100 mg L−1 and was stirred for 1 h under anaerobic conditions. Following the anaerobic phase, nitrite (as a sodium nitrite solution) was introduced to the bioreactors in order to study phosphorus removal via denitritation. In each experiment, one of the bioreactors served as a control and received a nitrite concentration of 10 mg NO2-N L−1. Throughout the experiment, the control’s nitrite concentration was kept constant at 8 ± 2 mg N L−1 by regular sodium nitrite addition. In each experiment, the effect of a specific NO2-N concentration on anoxic PUR was evaluated in triplicate over a 2.5 h period. Samples from each reactor (~20 mL) were retrieved every 30 min and were immediately centrifuged and filtered. The parameters measured were temperature, pH, NH4-N, NO2-N, PO4-P, and dissolved oxygen. The inhibitory effect of FNA was evaluated for the NO2-N concentrations of 25, 35, 75, 170, 270, and 350 mg NO2-N L−1, at pH = 8. The specific nitrite concentrations were chosen in order to provide an appreciable range of degrees of inhibition. The respective FNA concentrations were 0.58, 0.82, 1.82, 4.73, 7.12, and 8.51 μg HNO2-N L−1. Equation (1), proposed by Anthonisen et al. [16], was used to calculate the free nitrous acid concentration:
[ HNO 2 - N ] = [ NO 2 - N ] 10 pH × exp ( 2300 273 + T )
where NO2-N is the total concentration of nitrite.
The effect of FNA on anoxic PUR at lower pH values was also evaluated through a similar experiment in which the performance of a control reactor, as described above, was compared to that of two bioreactors under the same nitrite concentration of 30 mg NO2-N L−1 at the different pH values of 7 and 8. The experiment was replicated twice to ensure repeatability.

2.2.2. Investigation of the Effect of FA on Anoxic PUR

The inhibitory effect of FA on anoxic PUR was evaluated for ammonium concentrations in the 140–530 mg N L−1 range at pH 8 and 8.5. Anoxic batch experiments were conducted on activated sludge from the SBR, similar to the batch experiments investigating the inhibitory effect of FNA on PUR. Ammonium, in the form of an ammonium chloride solution, was added to each batch reactor in order to achieve a specific ammonium concentration. The pH of each reactor was then adjusted to the desired value and kept constant throughout the batch test. Each reactor was fed with readily biodegradable organic carbon, in the form of a sodium acetate solution, in order to establish a starting COD content of 100 mg L−1 and was stirred for 1 h under anaerobic conditions. Following this 1 h anaerobic period, a sodium nitrite solution was introduced to the bioreactors in order to establish an initial nitrite concentration of 10 mg NO2-N L−1 that was kept constant at 8 ± 2 mg L−1 over the duration of the experiment with the frequent addition of sodium nitrite every 15 min. Anoxic P-removal was studied over a period of 2.5 h. Starting with the introduction of nitrite, samples from each reactor (~20 mL) were retrieved every 30 min and were immediately centrifuged and filtered. Targeted monitoring parameters were temperature, pH, NH4-N, NO2-N, PO4-P, and dissolved oxygen. In each experiment one of the reactors served as a control (with a low NH4-N concentration of 10 mg L−1), while three other reactors were employed to evaluate the effect of a specific ammonium concentration on anoxic PUR in triplicate. The NH4-N concentrations investigated were 140, 360, and 530 mg L−1 at the pH of 8; and 70, 100, 130, 180, and 240 mg L−1 at the pH of 8.5, in order to provide an appreciable range of degrees of inhibition at each pH level. Equation (2), proposed by Anthonisen et al. [16], was used to calculate the free ammonia concentration:
[ NH 3 - N ] = [ NH 4 + - N + NH 3 - N ] × 10 pH 10 pH + exp ( 6344 273 + T )
where: [NH4-N + NH3-N] is the total ammonia nitrogen concentration.

2.3. Chemical and Microbiological Analyses

Upon collection, mixed liquor samples underwent filtration through disposable Millipore filter units (0.22 μm). COD, PO43-P, NH4-N, NO2-N, NO3-N, TSS, and VSS, were analysed in accordance with standard methods [17]. A portable WTW pH 3110 meter was used to measure pH, while DO was measured using a WTW Oxi 330i handheld meter, manufactured by Xylem.
Fluorescence in situ hybridization (FISH) analysis [18] was carried out for the identification of PAOs using Cy-3 labelled PAOMIX (comprising PAO651, PAO462, and PAO846) to target most PAOs [19], and Cy-3 labelled EUBMIX (comprising EUB338, EUB338-II and EUB338-III) to target most bacteria [20].

2.4. Modelling Approach

A modified approach of the direct linear plot method [21], as adjusted by Andreadakis et al. [7], was used to define the type of inhibition based on the experimental results. For more details, one can refer to Andreadakis et al. [7]. Briefly, the Michaelis–Menten equation is fitted for the case of anoxic PUR, which after linear transformation, results in the following:
PUR max app = PUR S K m app + PUR
where
  • PUR: the phosphorus uptake rate observed in the anoxic batch tests;
  • S: the initial phosphate concentration;
  • PUR max app : the maximum apparent phosphorus uptake rate, and
  • K m app : the half saturation apparent concentration, which accounts for the toxic effect of either free ammonia or free nitrous acid.
For the examination of the type of inhibition caused by FNA or FA to the anoxic activity of the PAOs, three series of batch experiments were conducted for each inhibitor. In the case of the FA batch experiments, the first experimental series examined anoxic PUR in the absence of FA for three different initial PO4-P concentrations. In the two following experimental series, anoxic PUR was examined for the same alternative initial phosphate concentrations in the presence of an initial FA concentration of 3.2 mg N L−1 and 12.5 mg N L−1, respectively. Accordingly, in the FNA batch tests, the first experimental series examined anoxic PUR in the absence of FNA for three different initial phosphate concentrations and its results were compared to the two follow-up experimental series that were carried out for the FNA concentrations of 1 μg N L−1 and 3.1 μg N L−1, respectively. Setting up axes K m app and PUR max app as x-y axes, respectively, for each batch experiment, a straight line is produced for each initial PO4-P concentration. The three lines produced (corresponding to the three phosphate concentrations examined at each experimental series) should theoretically intersect at a common point, whose coordinates provide the PUR max app (y-axes) and K m app (x-axes) for each FA or FNA concentration examined. Nevertheless, in practice, a unique intersection point does not exist due to errors. In order to tackle this problem, the K m app value was determined by applying best fit analysis to minimize the sum of square errors (SSE) between the calculated values of PUR max app for each batch experiment (Equation (3)) and the average PUR max app of each experimental series. Depending on the variation of both the maximum apparent PUR and the half saturation apparent concentration, the type of inhibition can be derived (e.g., competitive, non-competitive, un-competitive, mixed). For example, in the case of non-competitive inhibition, the extent of inhibition depends only on the concentration of the inhibitor, so the maximum apparent PUR will decrease with an increasing inhibitor concentration, while the half saturation apparent concentration will remain constant. Contrastingly, in the case of un-competitive inhibition, both apparent values decrease with the increase in the inhibitor.

3. Results

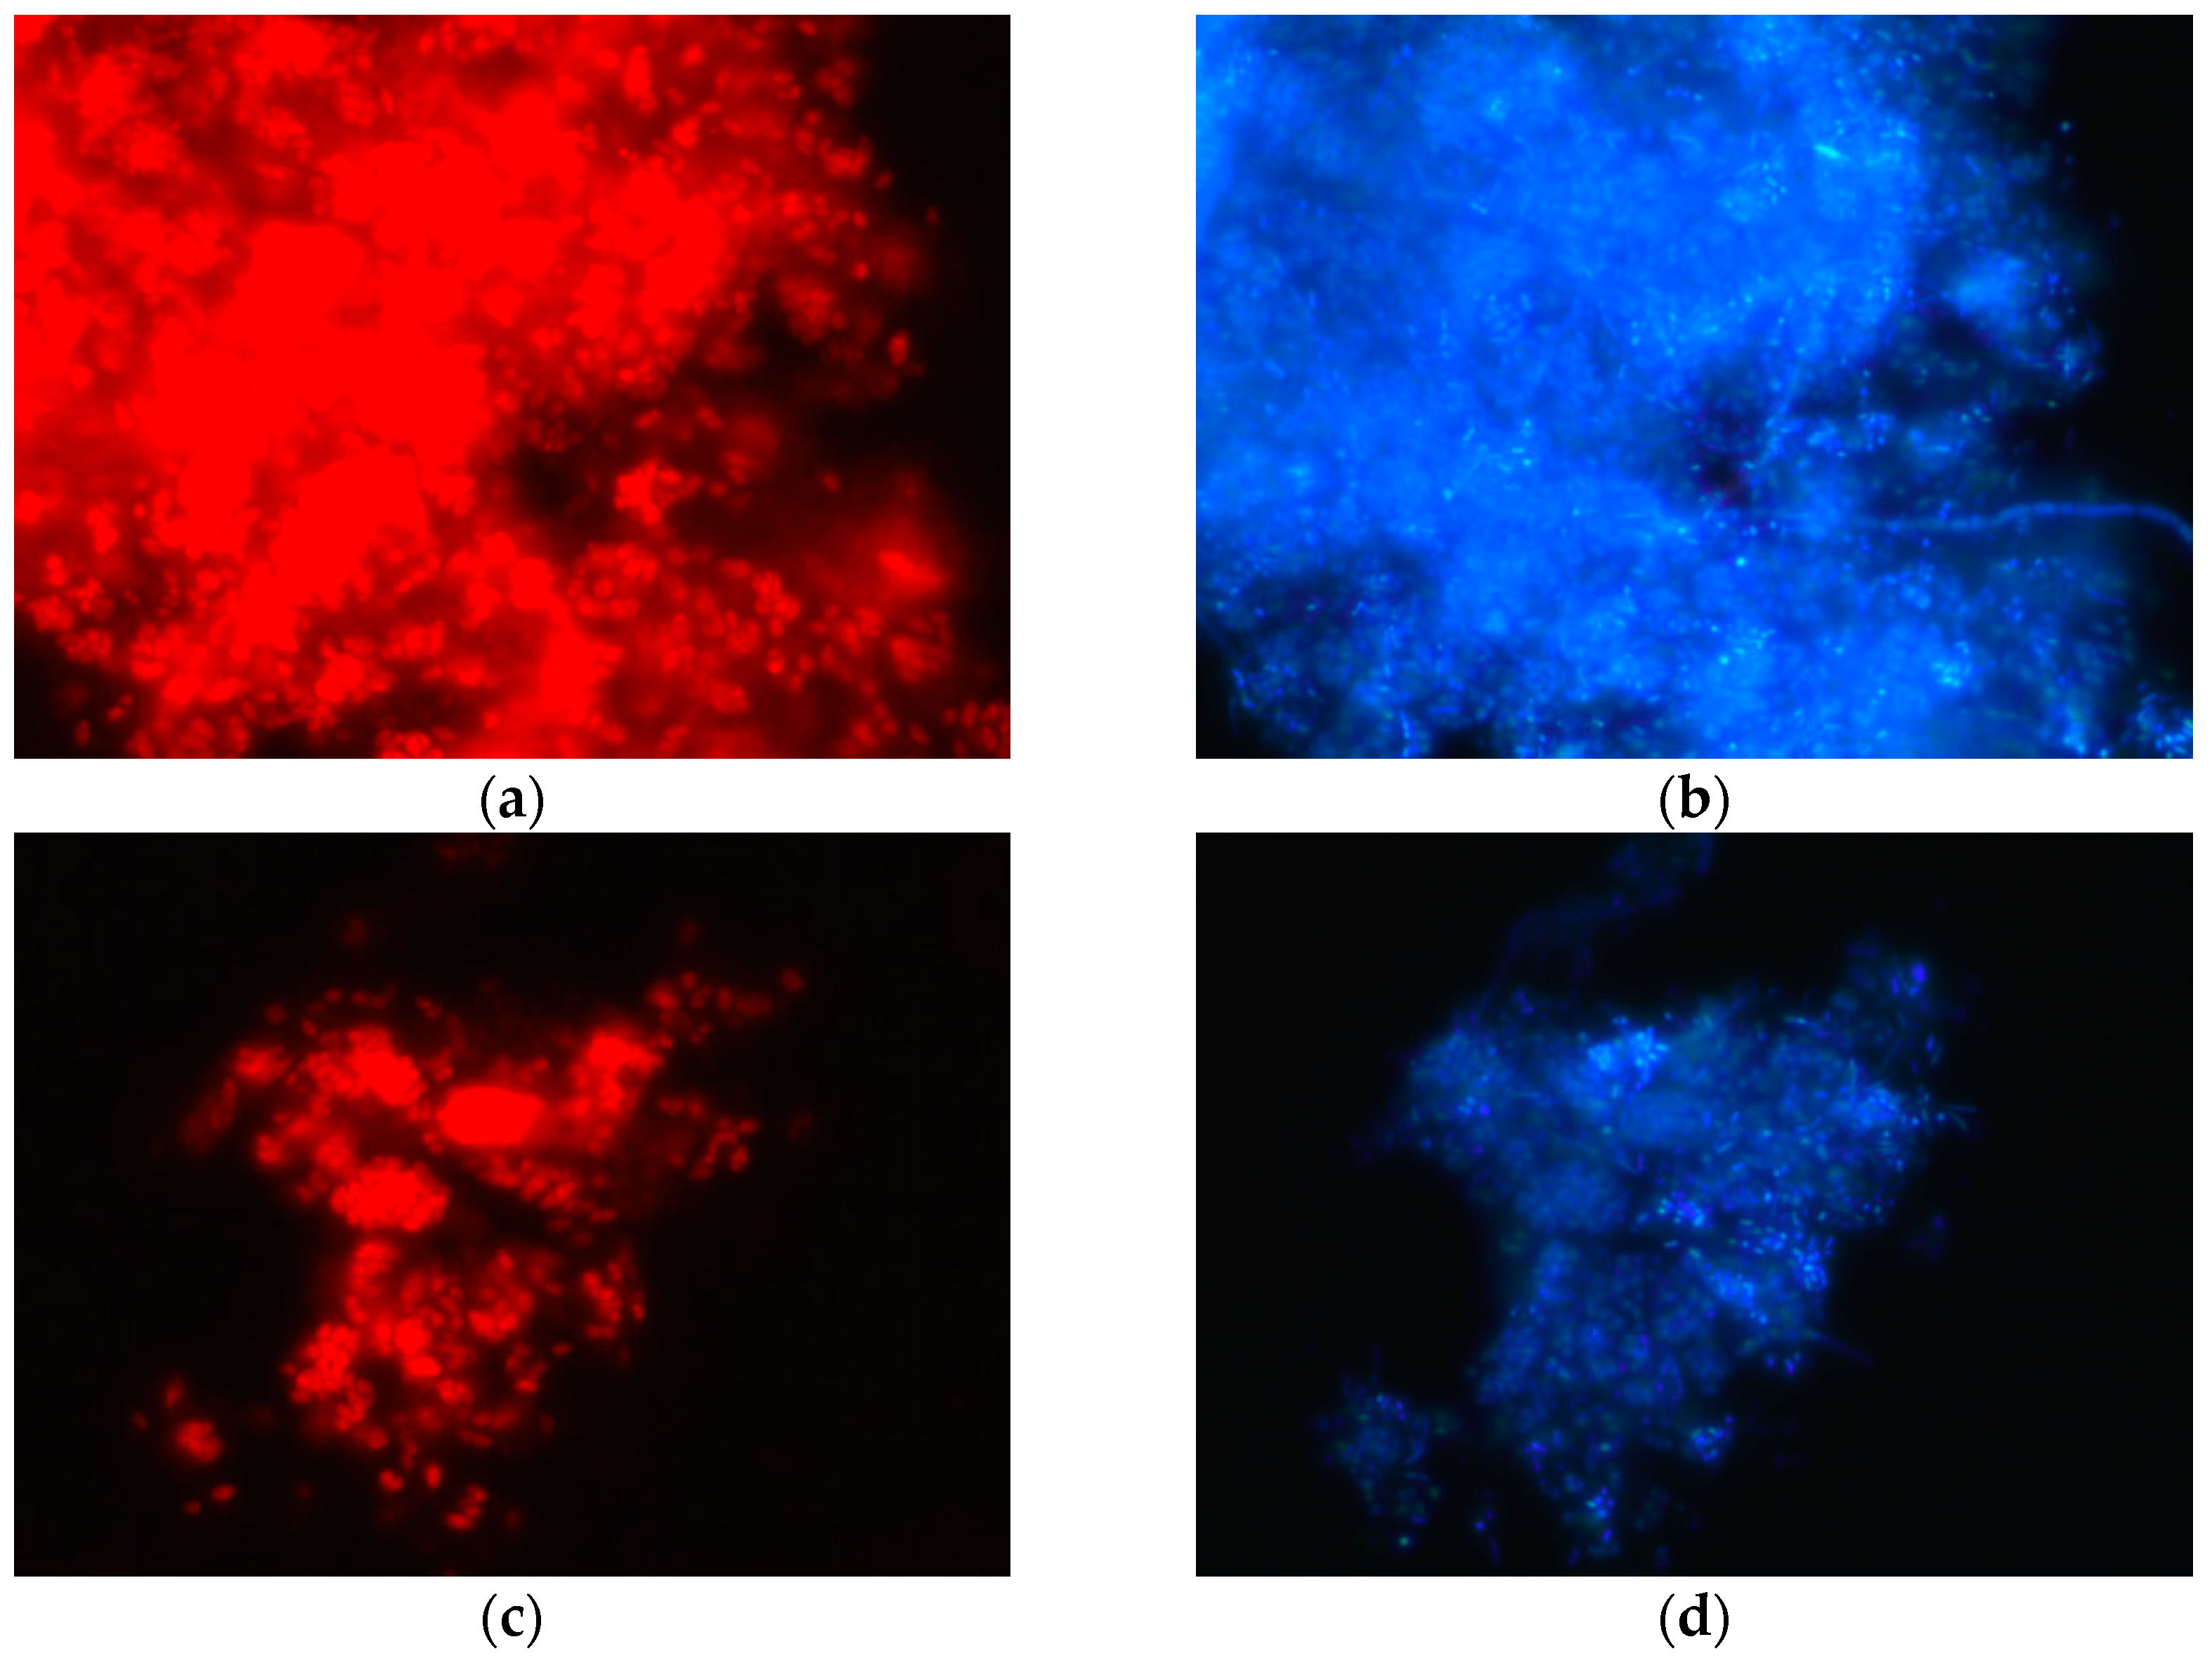
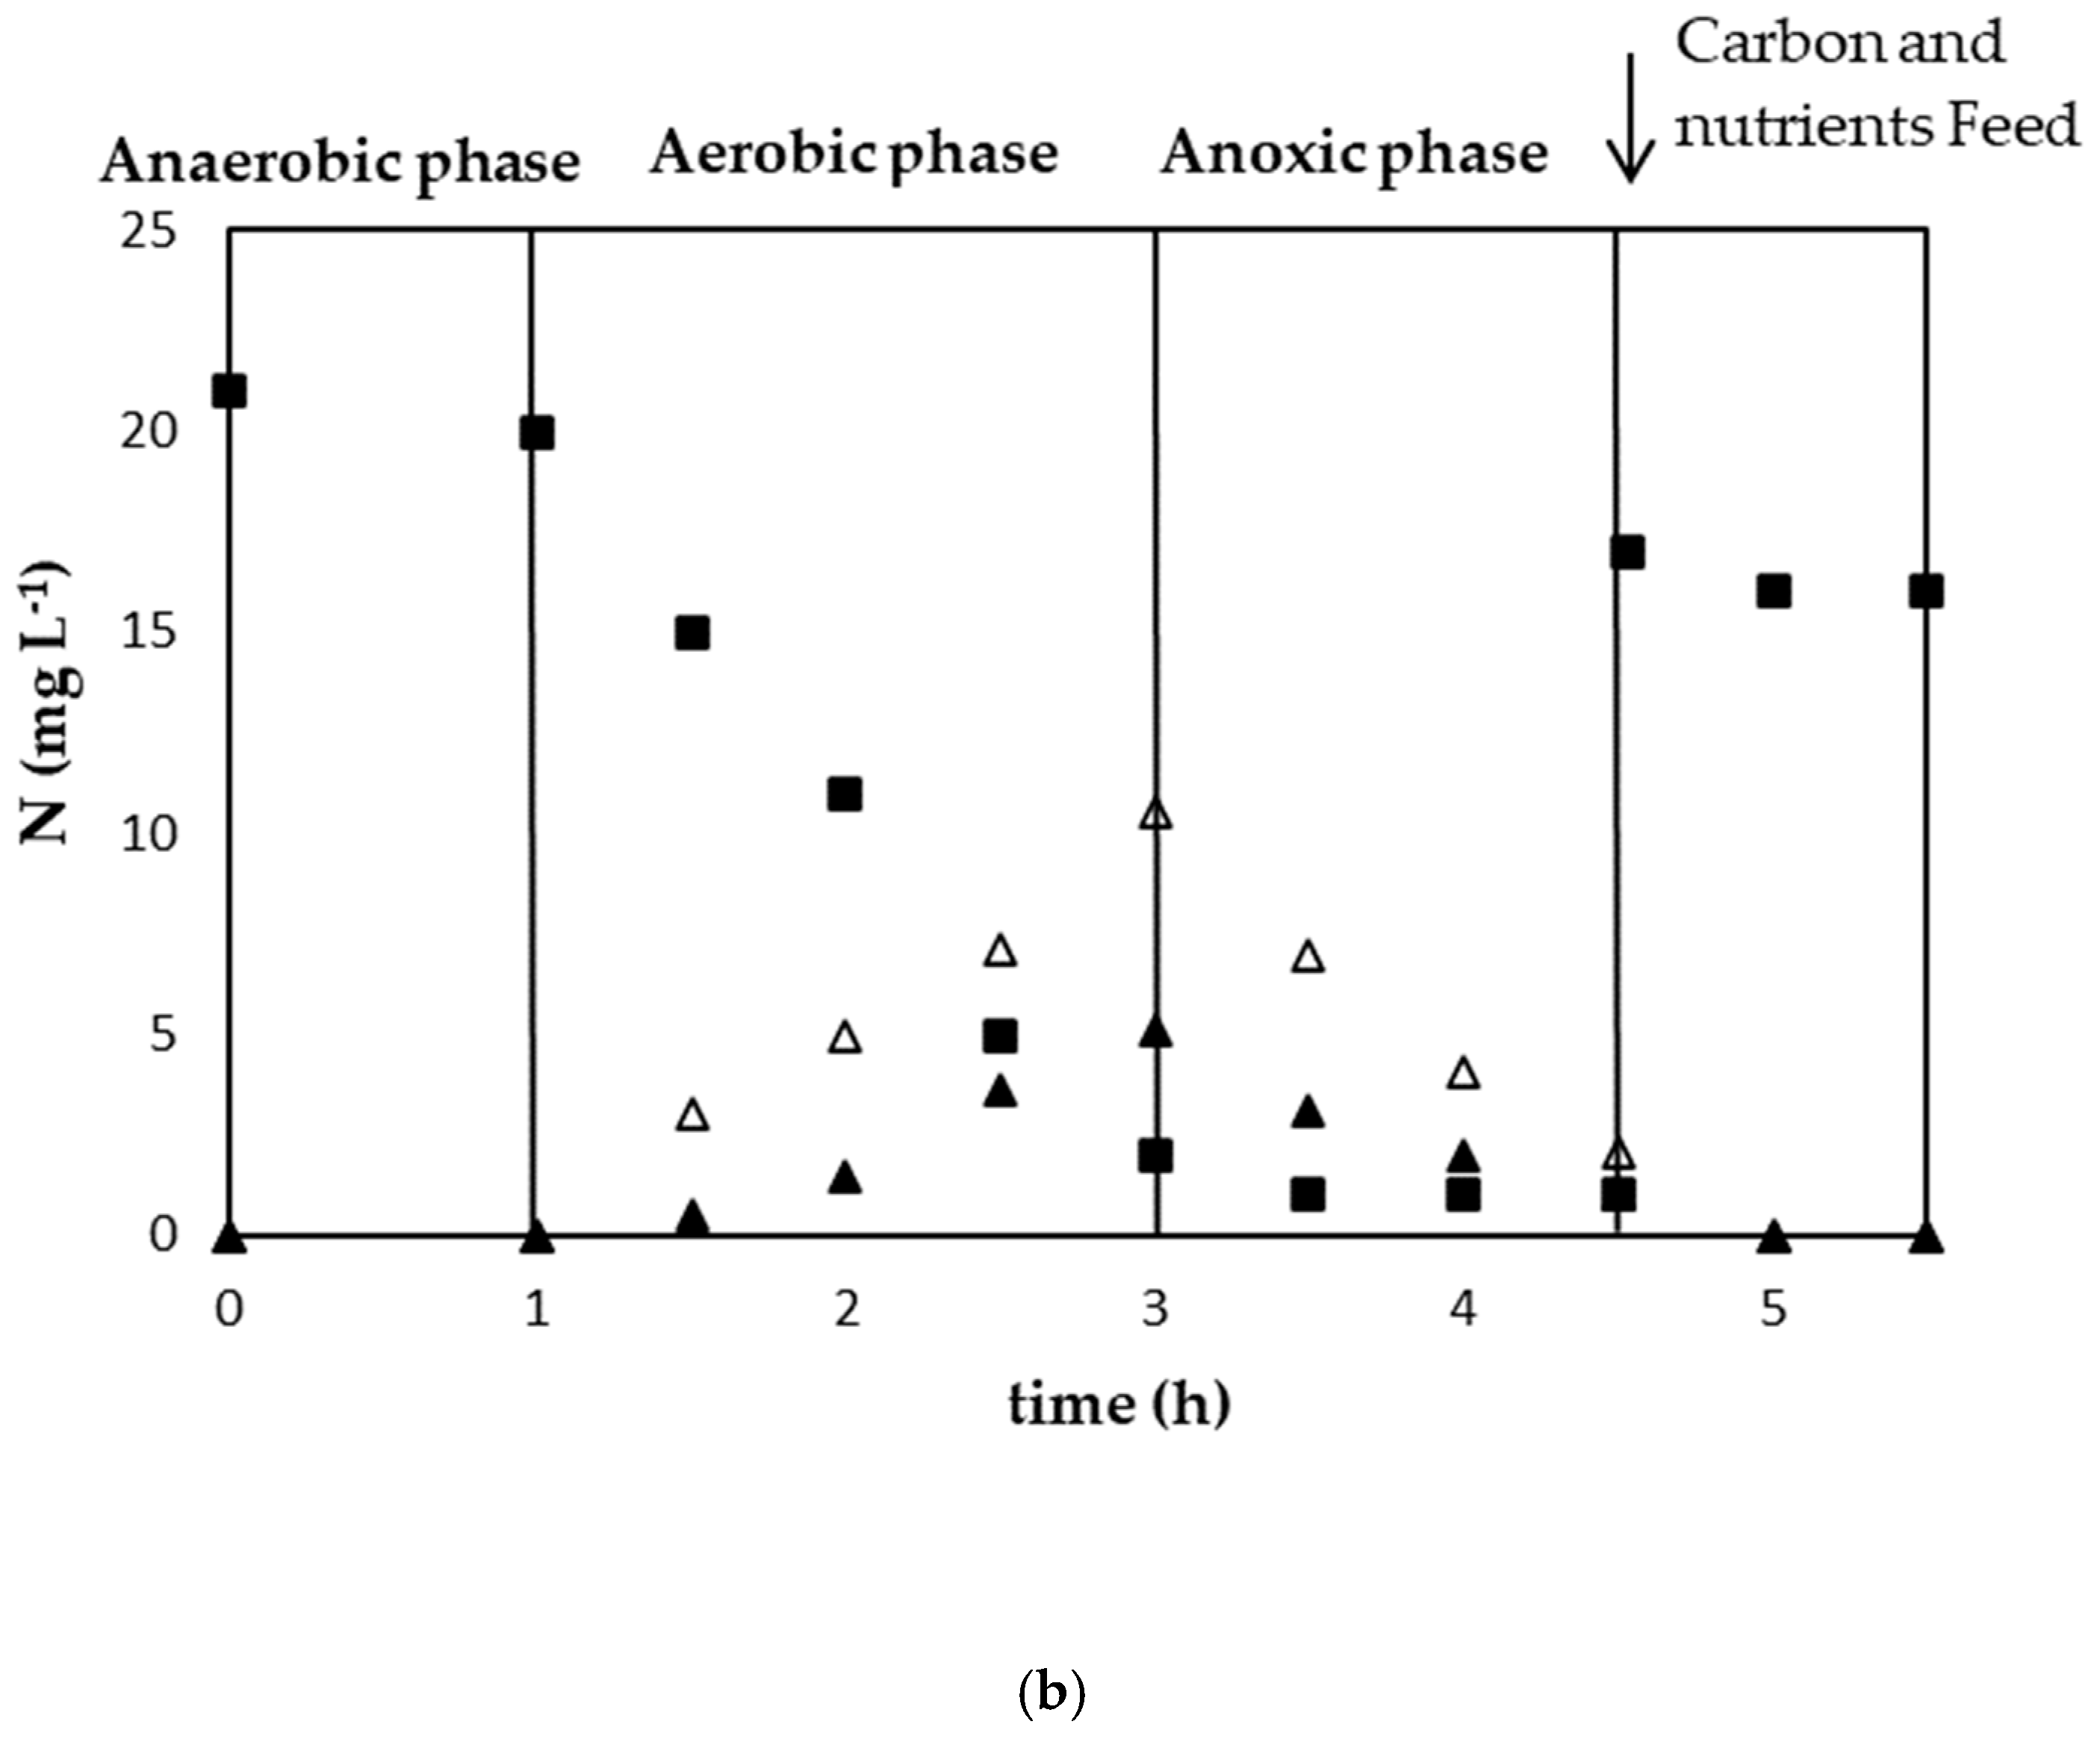
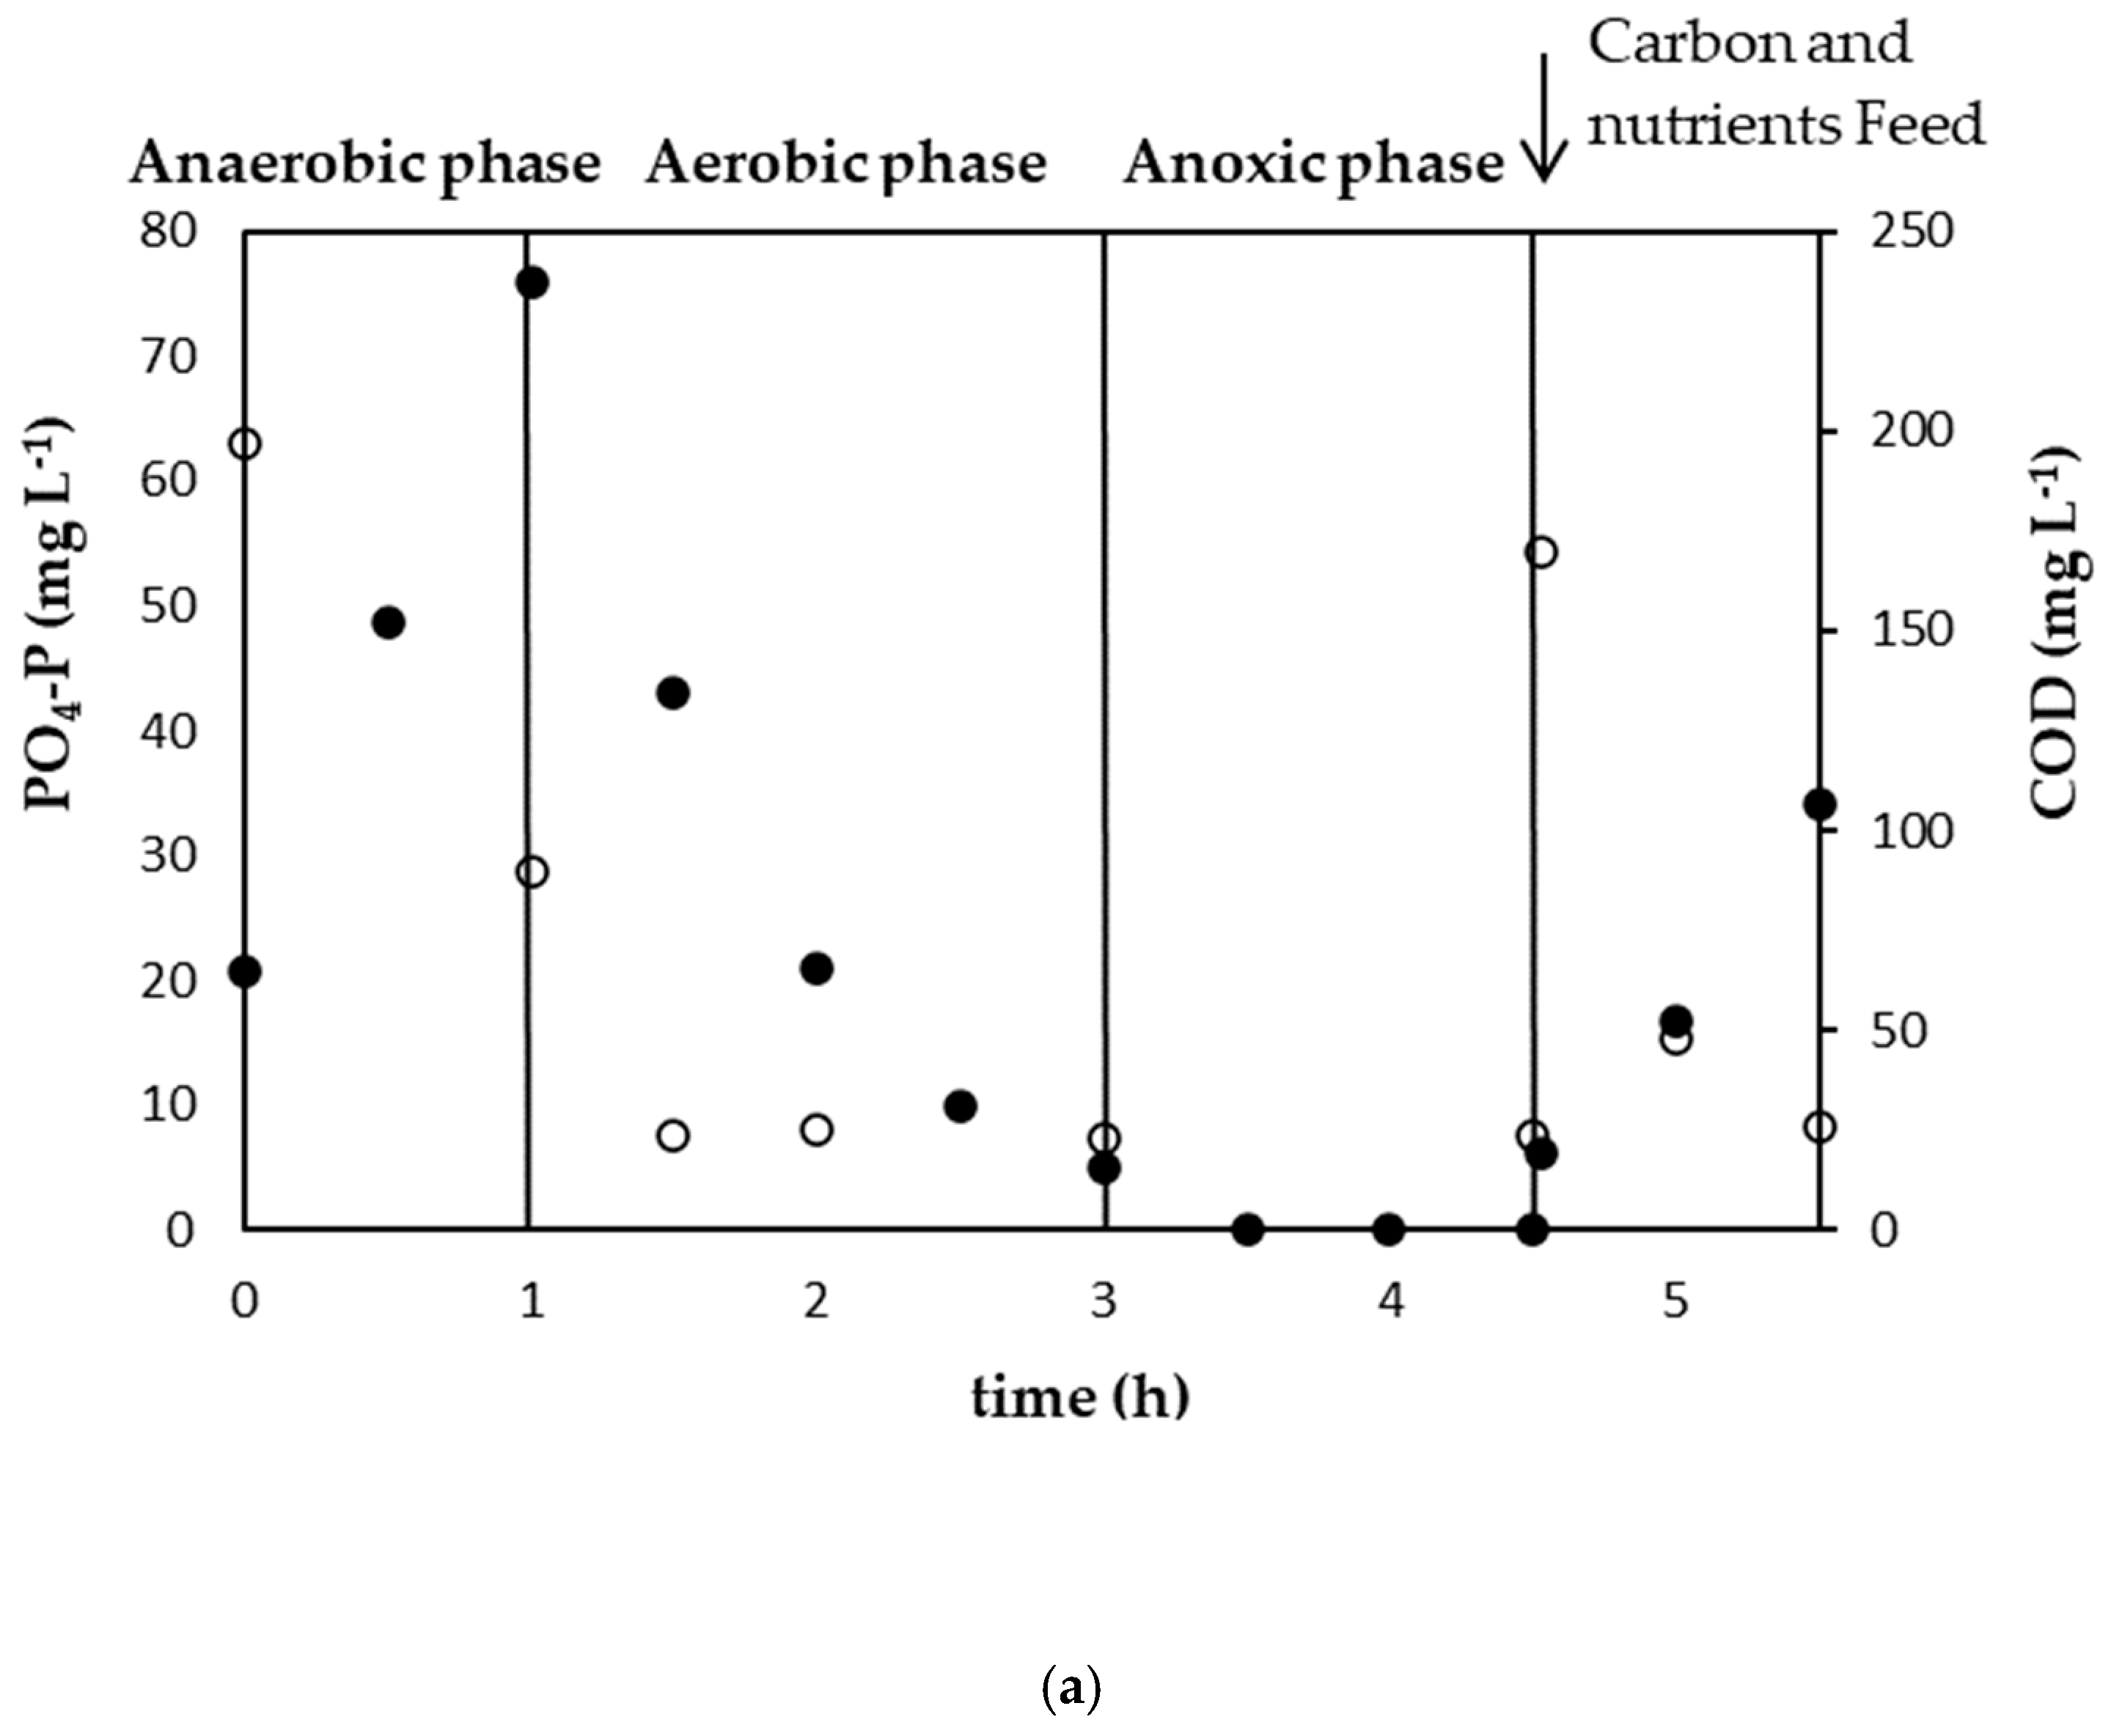
3.1. Establishment of a Strong PAO Culture
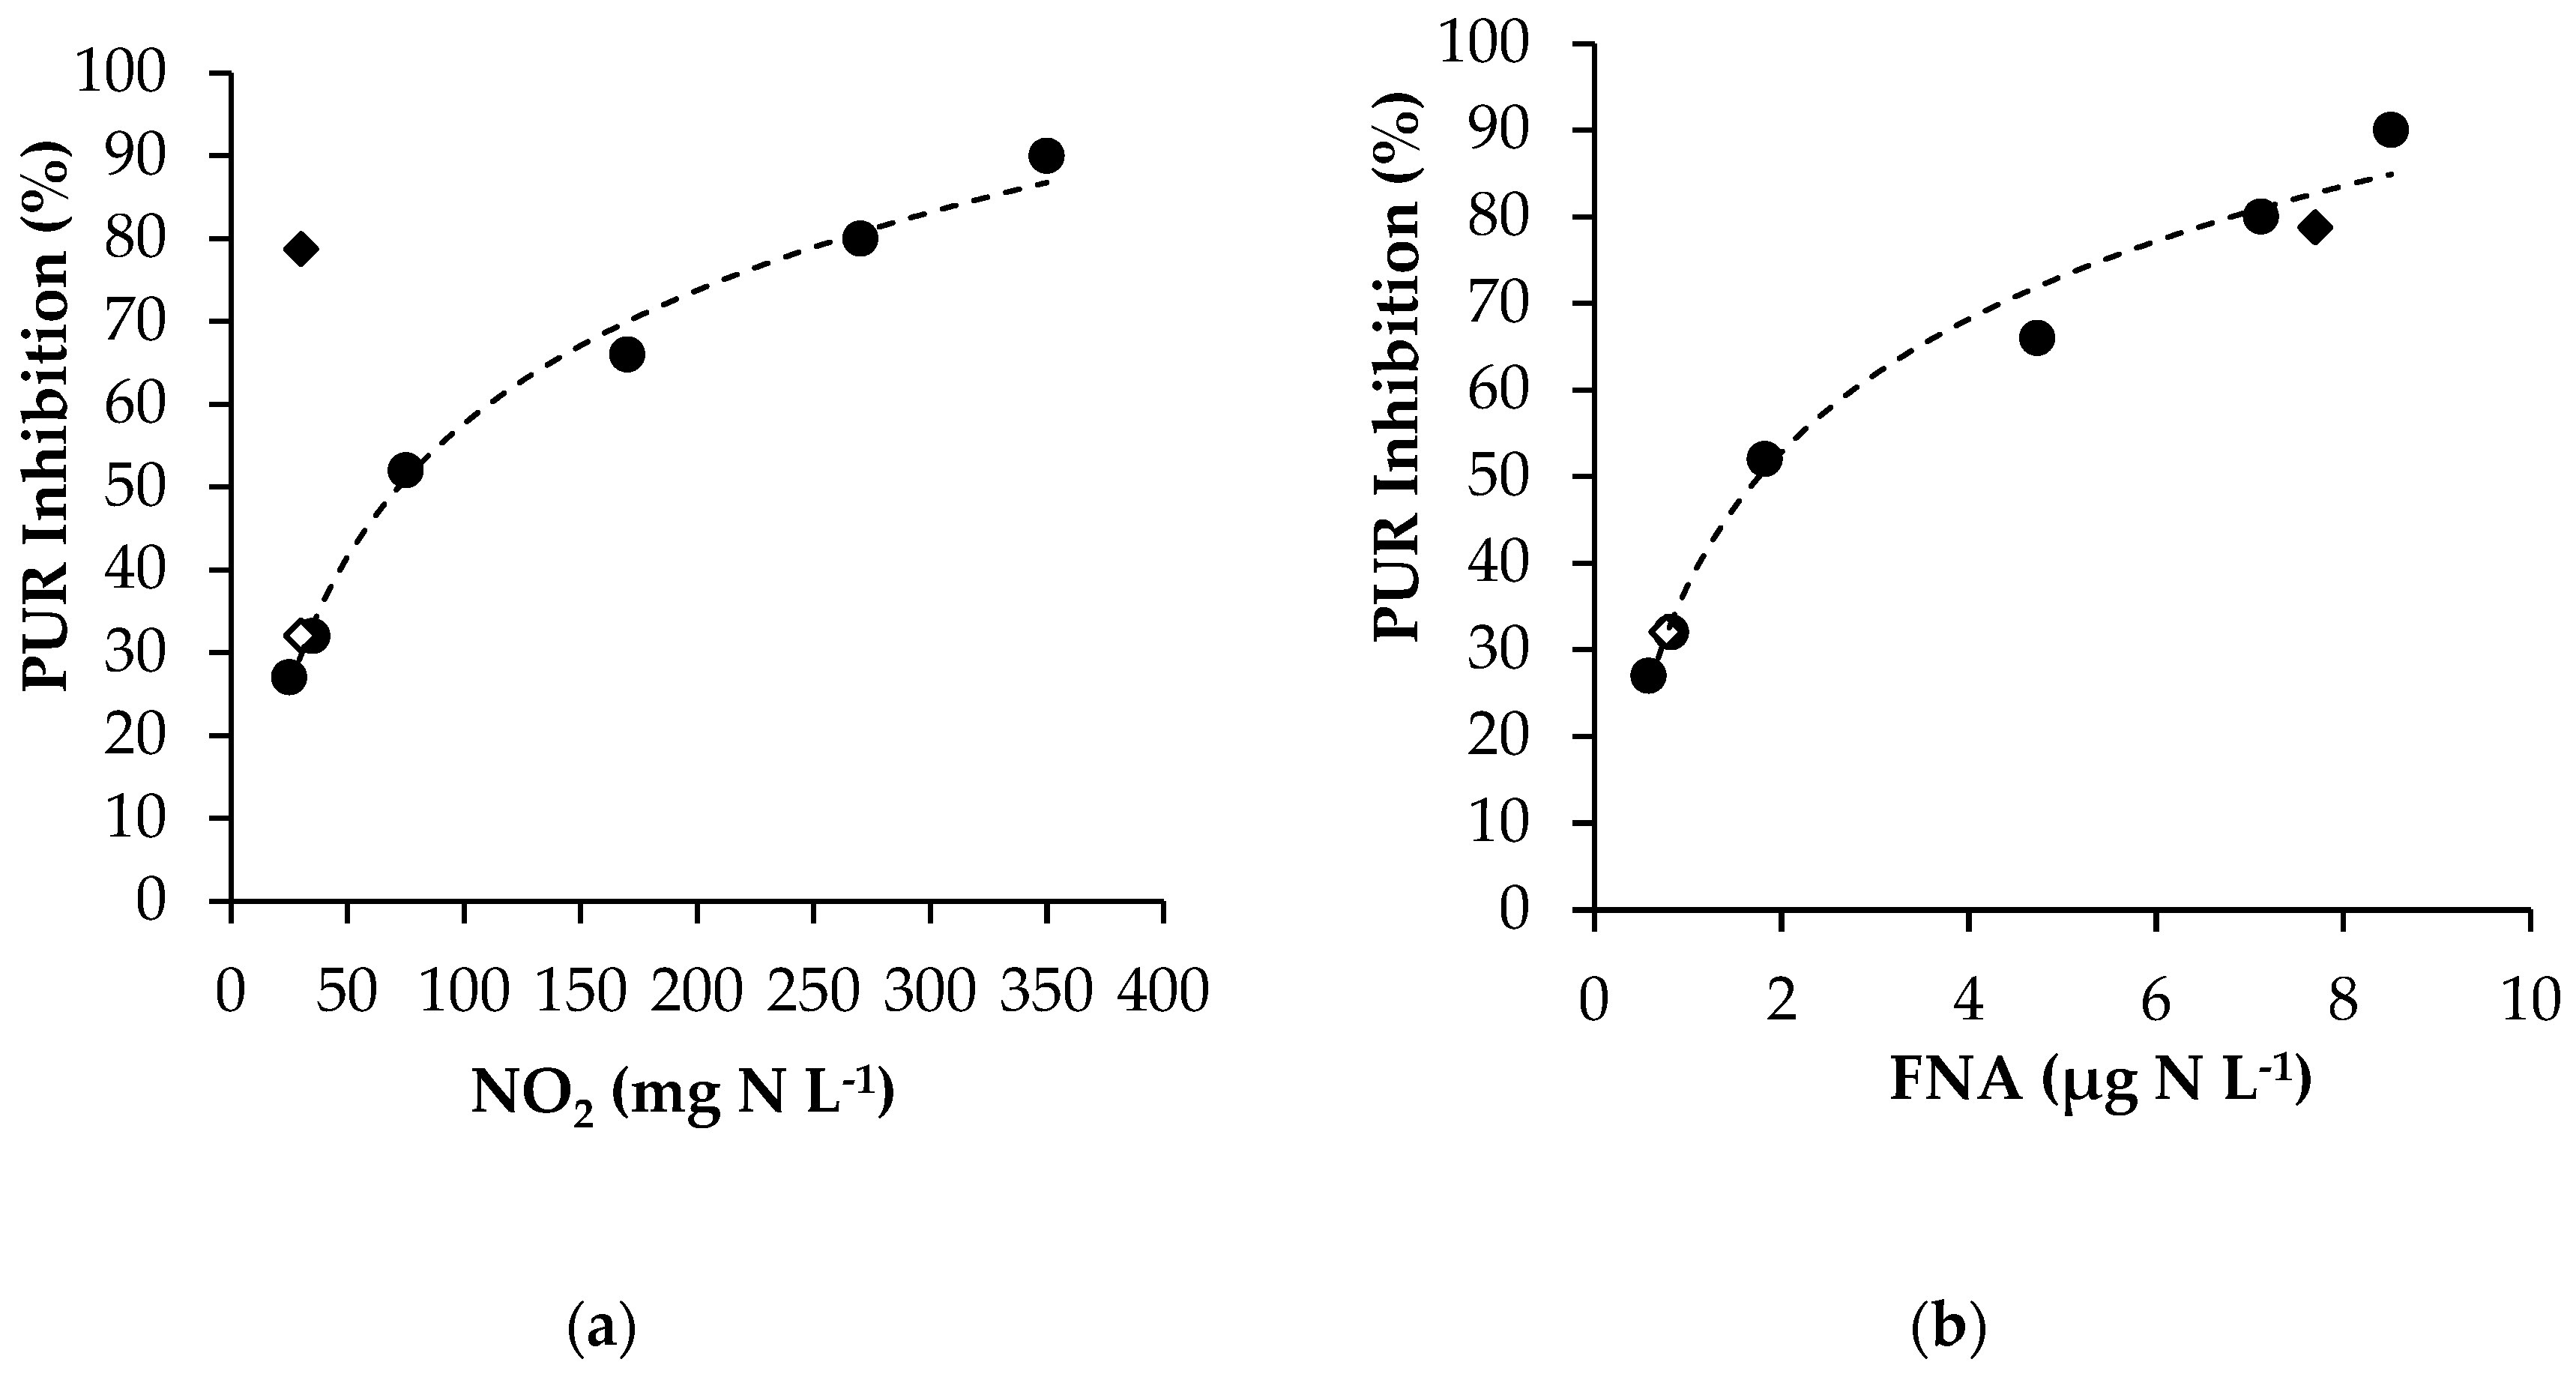
After a 50-day start-up period, the SBR achieved steady state conditions and demonstrated significant PAO activity. During operation, the pH ranged from 7.5 to 8.2, and the SBR temperature was maintained at 20 ± 2 °C. The VSS and TSS averaged 2500 ± 200 mg L−1 and 2800 ± 200 mg L−1, respectively. The SBR’s configuration was successful in developing a highly PAO-enriched biomass, as confirmed by FISH analyses (Figure 2), and high PURs that were observed throughout operation. The quantification of a total of 52 pairs of FISH images (16 pairs for each duplicate of 2 separate samples) showed that Accumulibacter (the main PAO species) accounted for approximately 54% of the total microbial community. Figure 3 displays the variation of the main parameters throughout a typical operation cycle. During the anaerobic phase, practically all of the readily biodegradable COD was utilized by the PAOs, releasing P in the process at an average rate of approximately 22 mg P g−1 VSS h−1, which would correspond to a Prelease/CODuptake ratio of 0.5. At the beginning of the aerobic phase, PO4-P averaged 70 ± 10 mg L−1. During aeration, phosphorus was rapidly removed, while nitrite and nitrate concentrations reached 9.5 ± 1 mg N L−1 and 2.5 ± 0.5 mg N L−1, respectively, at the end of this phase. The abundance of nitrite over nitrate was due to the suppression of NOB that was achieved mainly by the low aerobic SRT. The concentration of ammonium was reduced from 20 ± 2 mg N L−1 to 2 ± 1 mg N L−1 during aeration due to nitrification and its utilization for microbial synthesis. The FNA concentrations in the SBR that were calculated with regard to nitrite concentration, pH, and temperature were found to reach 0.12 ± 0.02 μg N L−1. With the cessation of aeration and the depletion of the remaining DO, nitrite was removed at an average rate of 1.8 ± 0.4 mg N g−1 VSS h−1. By the end of the aerobic phase, little phosphorus was available to be taken up by PAOs during the following anoxic phase. In order to evaluate the biomass’s capacity to remove phosphorus via denitritation, ex situ batch tests were regularly conducted (similarly to the control of the batch experiments investigating the effect of FNA mentioned in the “Materials and Methods” section). Aerobic P-removal was also evaluated ex situ under constant pH, as the pH changes in the SBR could influence water chemistry and the phosphorus dissolution/precipitation reactions. At steady-state conditions, the aerobic PUR averaged 25 ± 4 mg P g−1 VSS h−1, while the anoxic PUR averaged 10 ± 3 mg P g−1 VSS h−1. Throughout operation, the biomass anoxic PUR capacity was observed to occur at approximately 40% of the aerobic PUR. It is possible that not all PAOs were capable of denitritation, although given the SBR’s configuration and its stable performance, it is more likely that all PAOs had this capacity, and that anoxic P-removal is thermodynamically considerably slower than aerobic P-removal [1]. Based on this finding, it is anticipated that upon modelling biological phosphorus removal processes, a nNOx coefficient of around 0.4 can be used to simulate anoxic phosphorus removal in regard to the respective aerobic process. This value is lower than that proposed in the ASM2d (0.6) to simulate biological phosphorus removal in conventional activated sludge systems [22].

3.2. Effect of FNA

3.2.1. Experimental Results

The results of the experiments investigating the effect of FNA on anoxic PUR are presented in Figure 4. As expected, FNA appears to be a strong inhibitor of the anoxic metabolism of PAOs, with 50% inhibition of the anoxic PUR being observed at the FNA concentration of 1.8 μg HNO2-N L−1 (75 mg L−1 NO2-N at pH = 8).
At the pH of 7, the concentration of 30 mg NO2-N L−1 inhibited anoxic PUR by 80%, with the biomass performing at a rate of 2.2 mg P g−1 VSS h−1 compared to the control’s rate of 10.5 mg P g−1 VSS h−1, while at the pH of 8, the same concentration inhibited PUR by 33%, with the biomass performing at a rate of 7.1 mg P g−1 VSS h−1. The corresponding denitritation rates were 2.8 mg N g−1 VSS h−1 at the pH of 7 and 5.5 mg N g−1 VSS h−1 at the pH of 8. While the performances in denitritation do not directly correlate to the respective performances in phosphorus removal, this is to be expected, as it is likely that a portion of nitrite is denitrified by other heterotrophic organisms present via endogenous respiration.
Interestingly, the inhibitory effect of FNA on anoxic PUR was found to be very similar to that observed on aerobic PUR [7], as shown in Figure 4c. At first glance it would appear that anoxic phosphorus removal has a slightly greater tolerance to FNA than aerobic P removal. However, it should be pointed out that the control reactors in the experiments regarding anoxic inhibition maintained a nitrite concentration of 8 ± 2 mg L−1 NO2-N in order to allow sufficient denitritation. At pH = 8 at room temperature, this nitrite concentration has been found to inhibit aerobic PUR by approximately 10% [7]. Assuming that the anoxic pathway has the same tolerance to FNA as the aerobic pathway, the inhibitions observed in the anoxic experiments may be thus corrected according to the following equation:
Inhibition ( % ) = Control inh + ( 100 % Control inh ) × Inhibition observed ,
where Controlinh: the inhibition of the control’s anoxic PUR due to the required nitrite concentration (more information regarding the derivation of this equation can be found in Appendix A).
The modified FNA anoxic inhibition values are presented in Figure 4d and are compared to the aerobic inhibition values reported by Andreadakis et al. [7]. As shown, FNA appears to inhibit both anoxic and aerobic PUR to the same degree. This would contradict the findings of Zhou et al. [6], who reported 100% inhibition at the FNA concentration of 10 μg N L−1 for aerobic PUR and 5 μg N L−1 for anoxic PUR, suggesting that the anoxic pathway is less tolerant to the presence of FNA. While it is plausible that this disagreement may be attributed to differences in the biomass’s acclimation to nitrite, it is more likely to be due to the different experimental protocols of each study. As mentioned, in this study, phosphorus removal via denitritation in each batch test was observed over a 2.5 h period. When the higher FNA concentrations (4.73 μg N L−1 and above) were examined, phosphorus was observed to either remain stable or increase slightly during the first 30–60 min of the experiment. Following this, phosphorus removal occurred at a steady rate for the remainder of the experiment. This initial lag time was not taken into consideration in the calculation of PUR and was interpreted as a reaction to an FNA shock-load, which would have little relevance in a normal application. As opposed to this, the duration of the experiments by Zhou et al. [6] was lower (1 h), and therefore, the results had probably embedded such a lag-response, thus producing higher inhibitions.

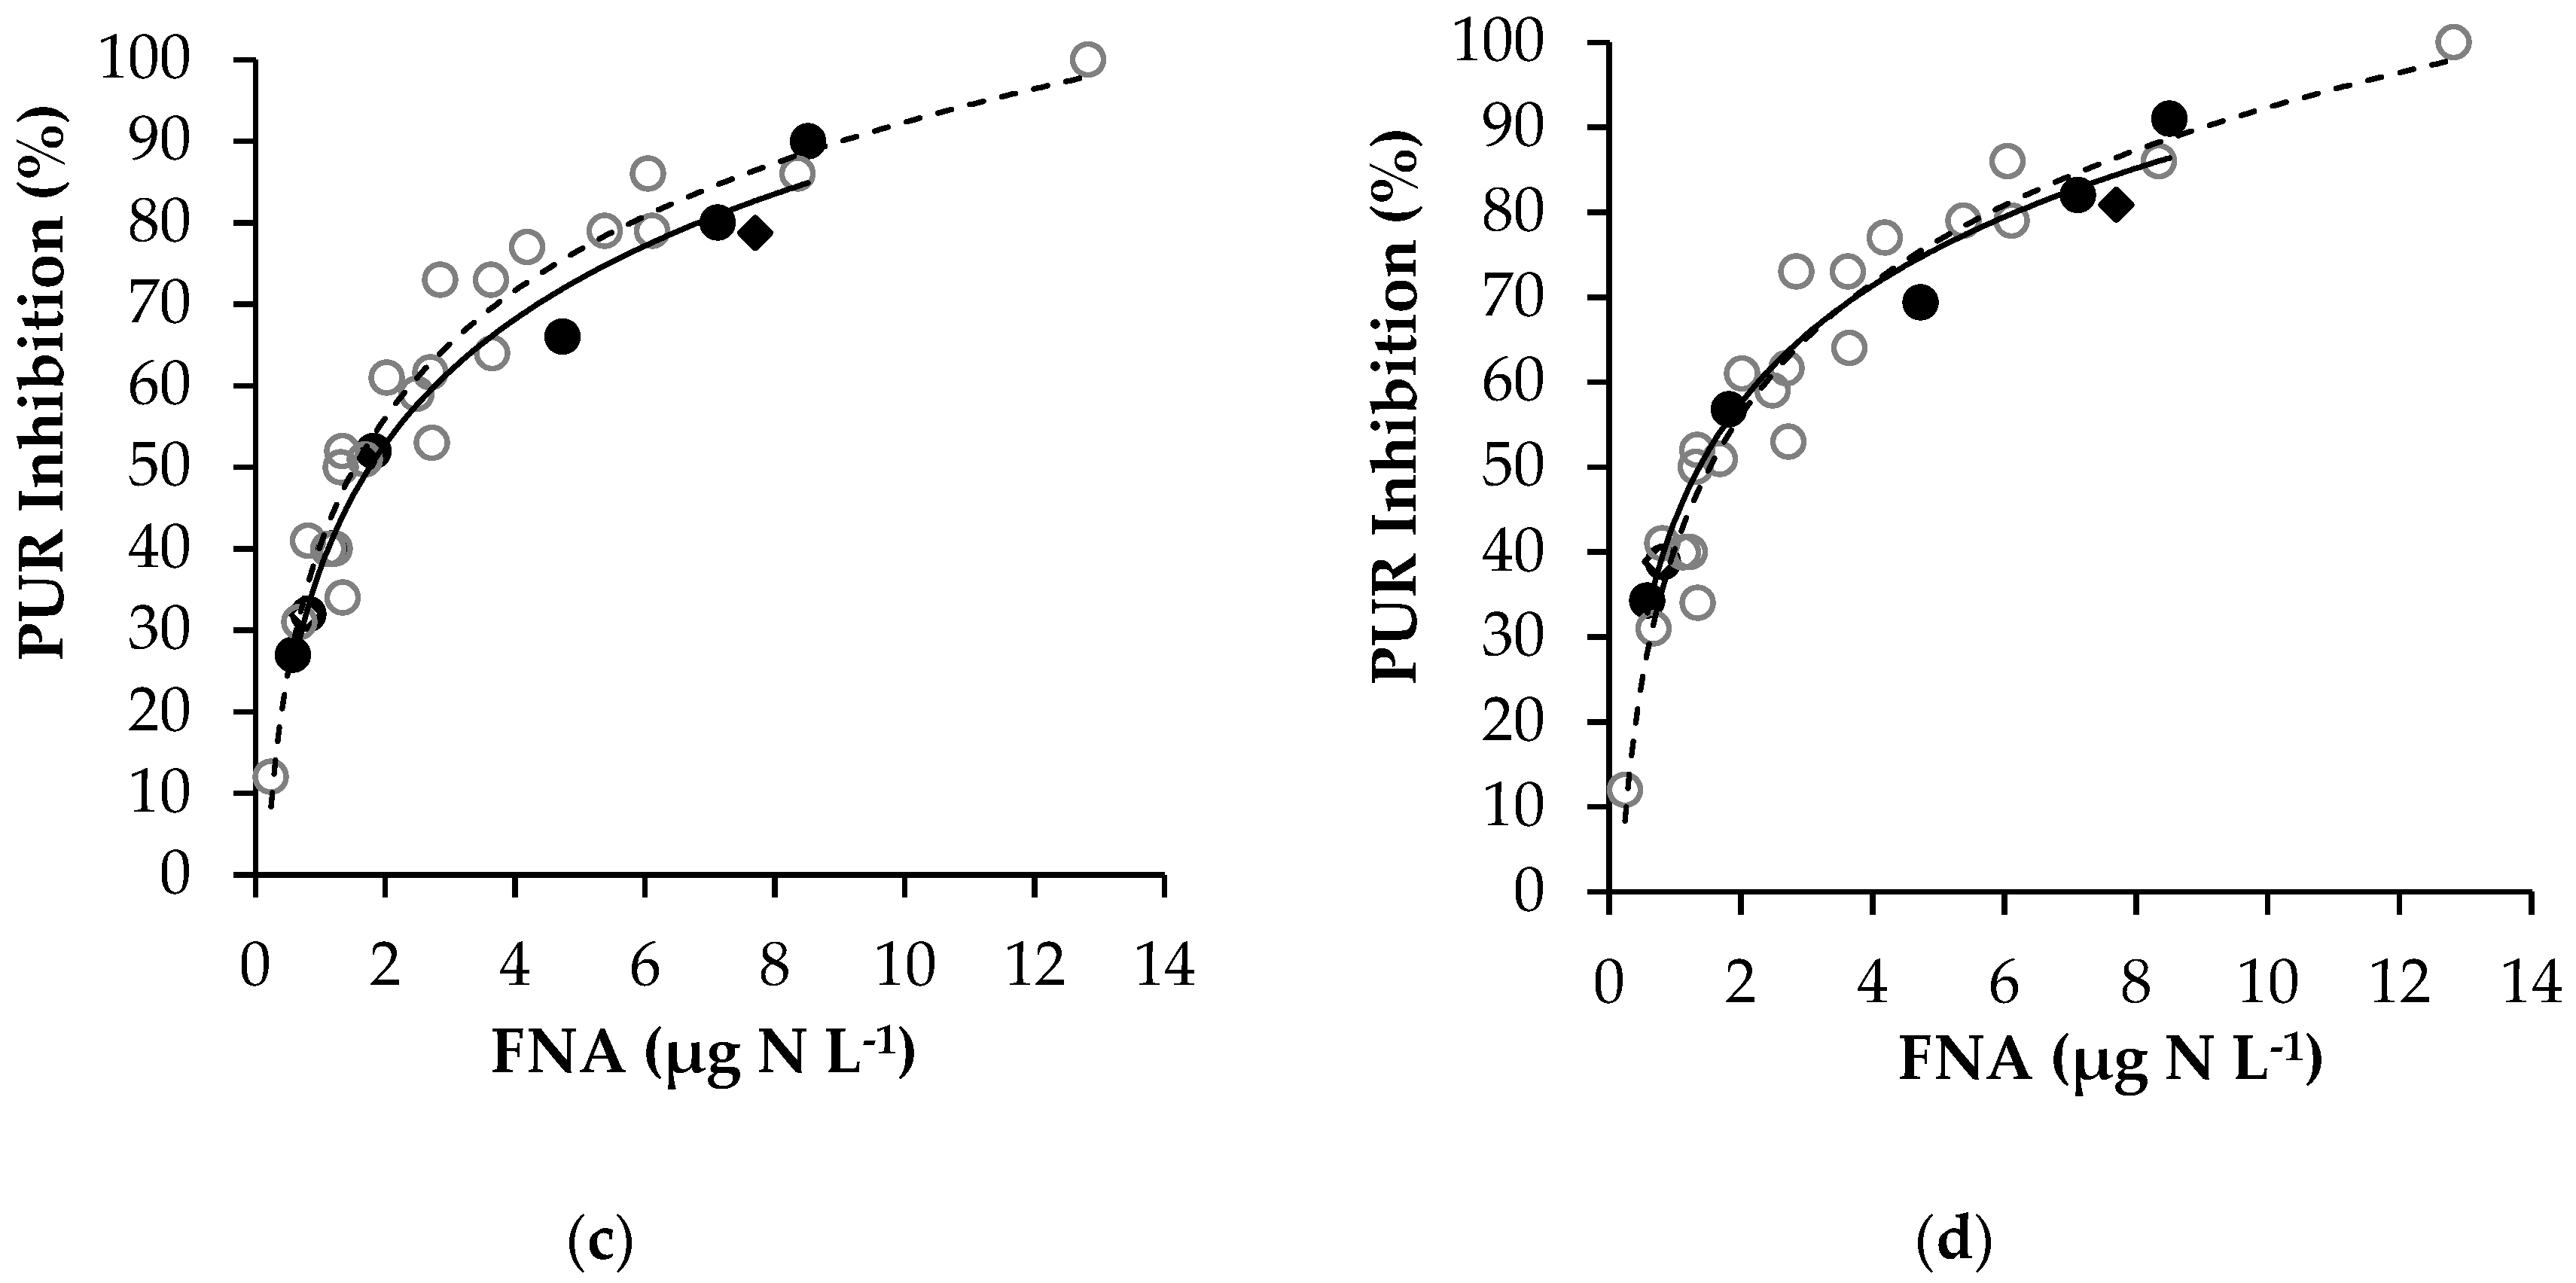
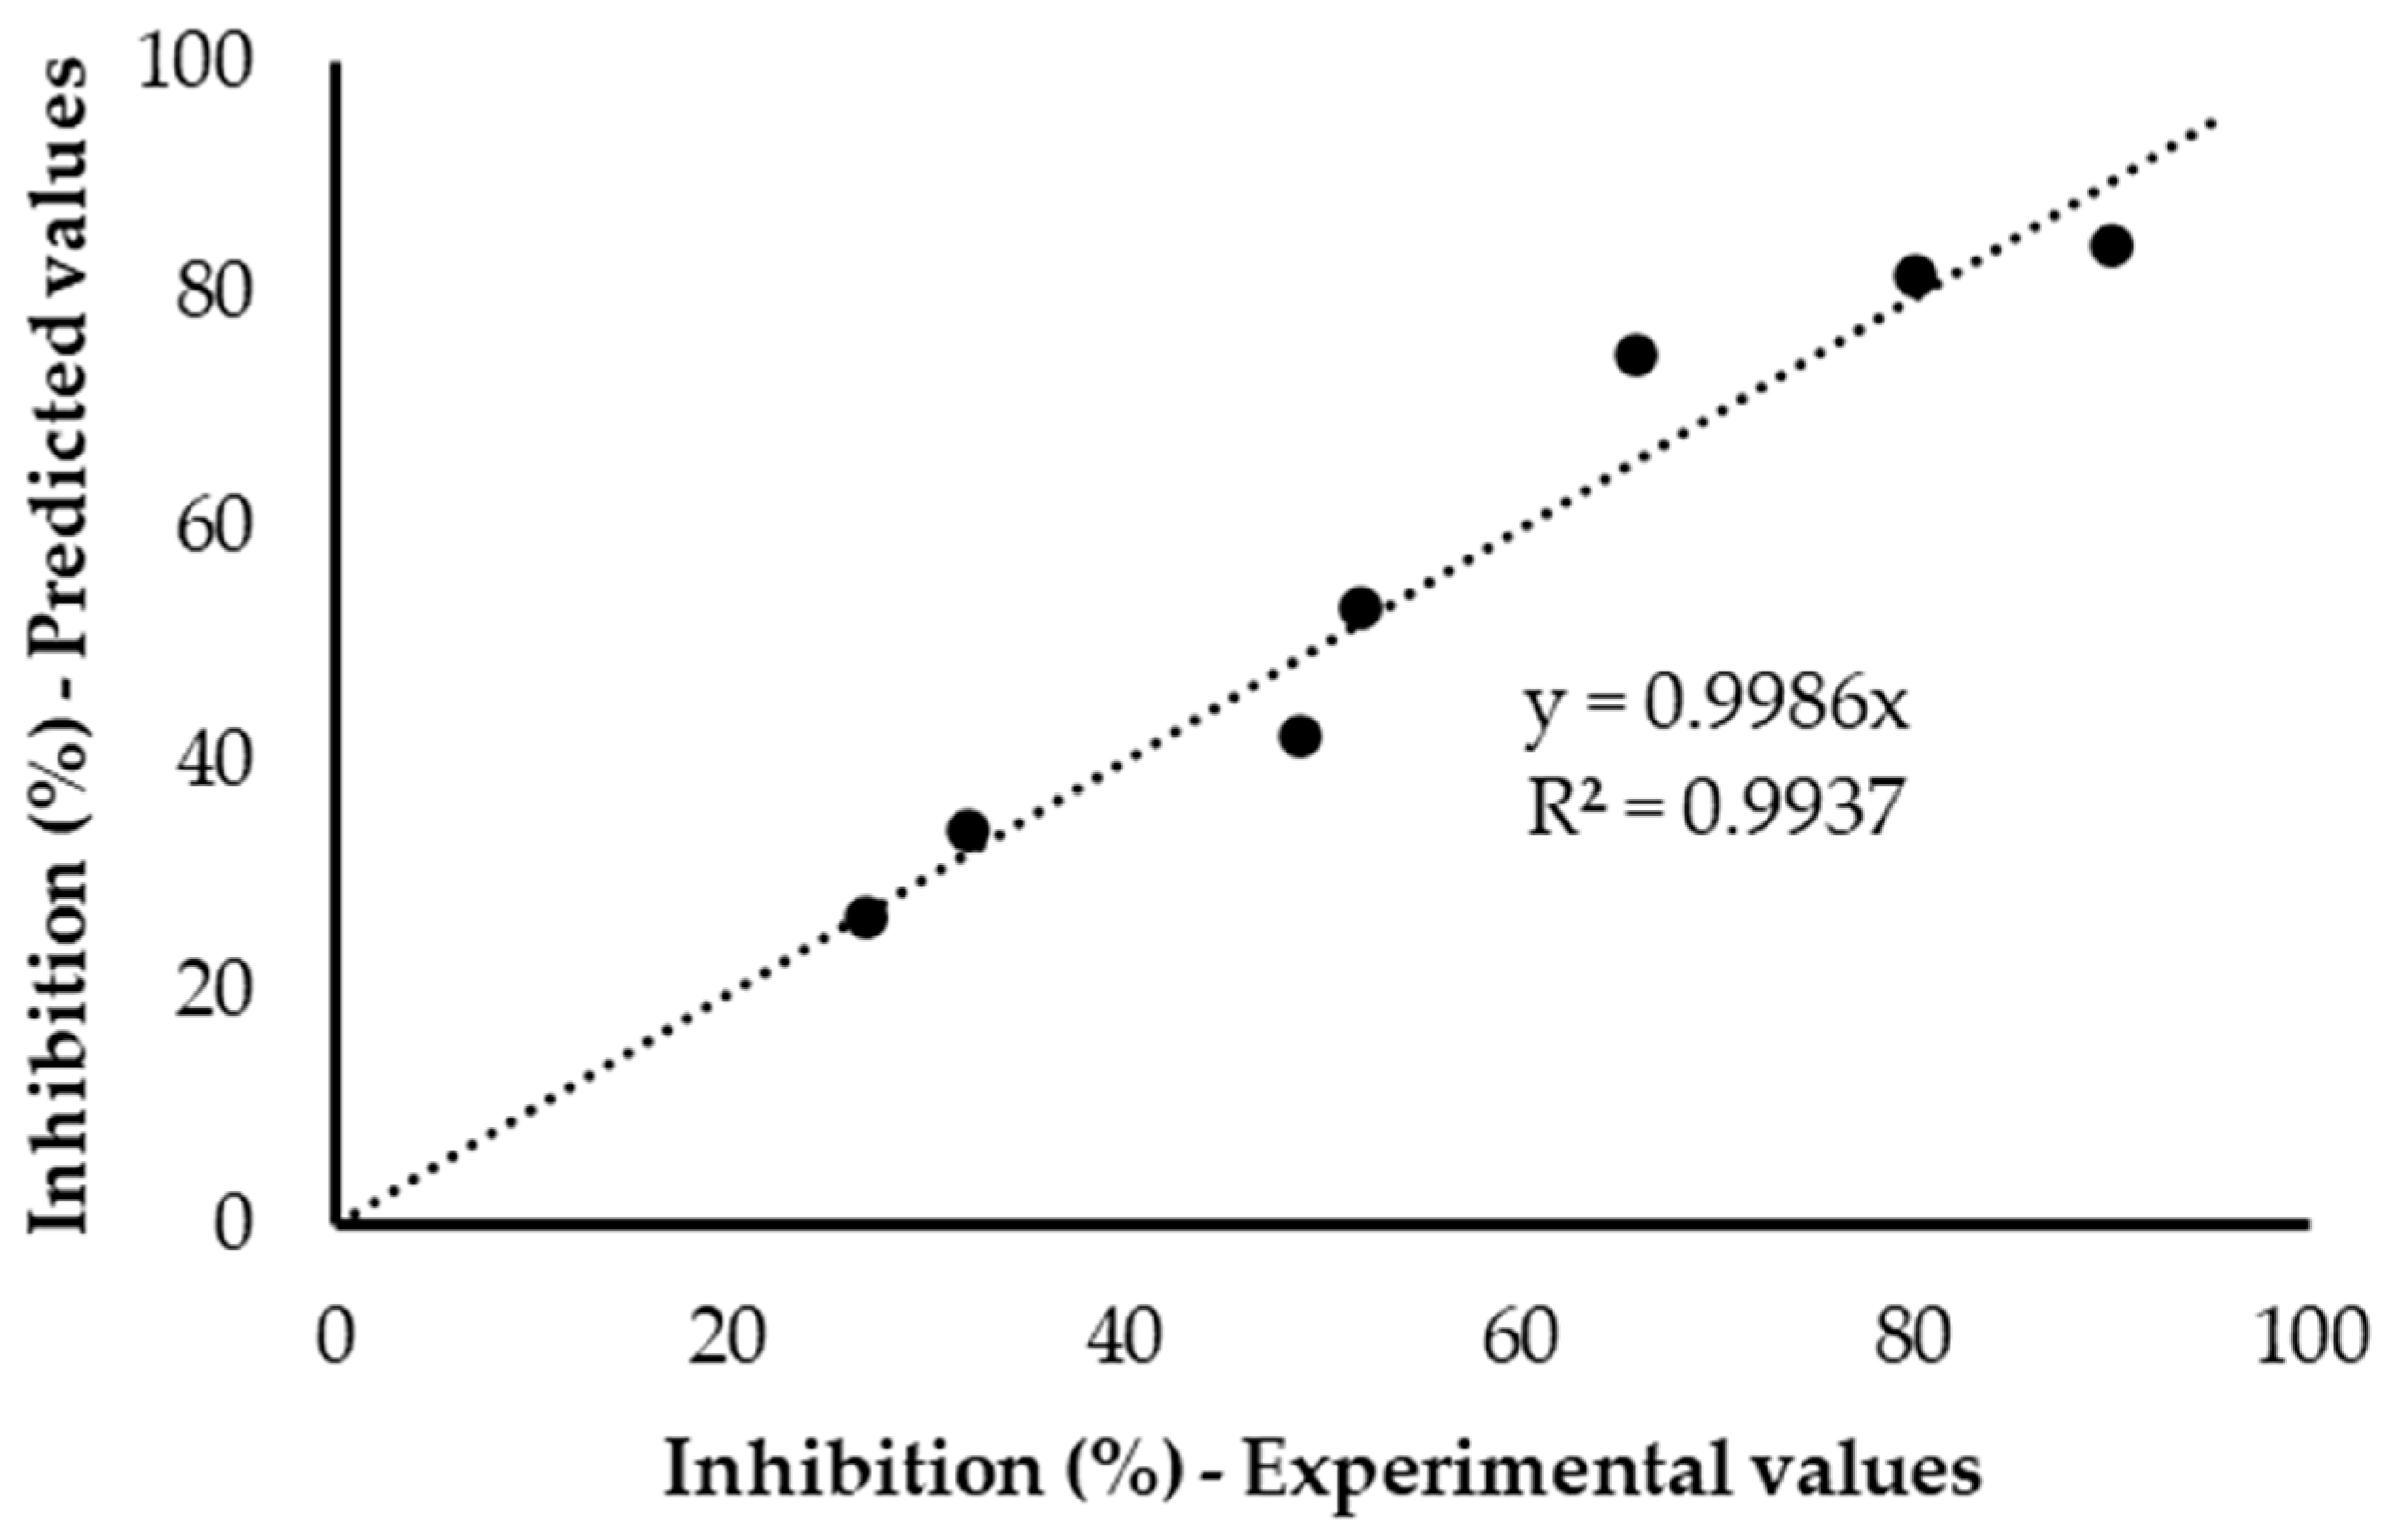
3.2.2. Modelling FNA Inhibition on Anoxic PUR

Following the methodology detailed in Section 2.4, the values of PUR max app and K m app were calculated for all experimental series. According to the results, in the experiment with the zero FNA concentration, PUR max app was calculated at 11.9 mg PO4-P g−1 VSS h−1. Under the influence of 1 μg HNO2-N L−1, PUR max app decreased to 9.8 mg PO4-P g−1 VSS h−1, and while in the presence of 3.1 μg HNO2-N L−1, PUR max app further decreased to 2.9 mg PO4-P g−1 VSS h−1. On the contrary, the K m app was constant for the three experimental series, averaging 6.4 mg L−1 (coefficient of variation equal to 2%). These results (decrease in PUR max app and constant K m app ) clearly point to a non-competitive inhibition model. Recently, Andreadakis et al. [7] concluded the same type of inhibition with respect to the FNA effect on aerobic PAOs activity. Similar findings are recorded regarding the effect of FNA on AOB and anammox activities as well [23,24].
The non-competitive inhibition kinetics can be mathematically described as follows:
PUR = PUR max K iFNA S FNA + K iFNA ,
where,
  • PURmax: the non-inhibited (maximum) anoxic phosphorus uptake rate (which essentially may be regarded as the PUR displayed by the control reactor of each batch series);
  • SFNA: the concentration of FNA;
  • KiFNA: the FNA concentration inhibiting anoxic PUR by 50%.
In order to determine the mathematical expression that optimally describes the inhibition phenomenon, the simple non-competitive model described in Equation (5) was compared with other inhibition models, such as the models proposed by Levenspiel [25] and Andrews [26], the Hill-type model [27], and the model proposed by Zhou et al. [28], which are described in Equations (6)–(9), respectively:
PUR = PUR max   ( 1 S FNA S FNA * ) m ,
PUR = PUR max S FNA K S + S FNA + S FNA 2 K iFNA ,
PUR = PUR max K iFNA n S FNA n + K iFNA n
PUR = PUR max S FNA K S + S FNA   e aS FNA
where,
  • SFNA*: the FNA concentration above which PUR is completely inhibited;
  • Ks: the affinity coefficient constant;
  • m, α: constants (constant m describes how the observed rate decreases as the inhibitor concentration increases, α is an empirical constant);
  • n: the Hill coefficient representing the number of bound ligands.
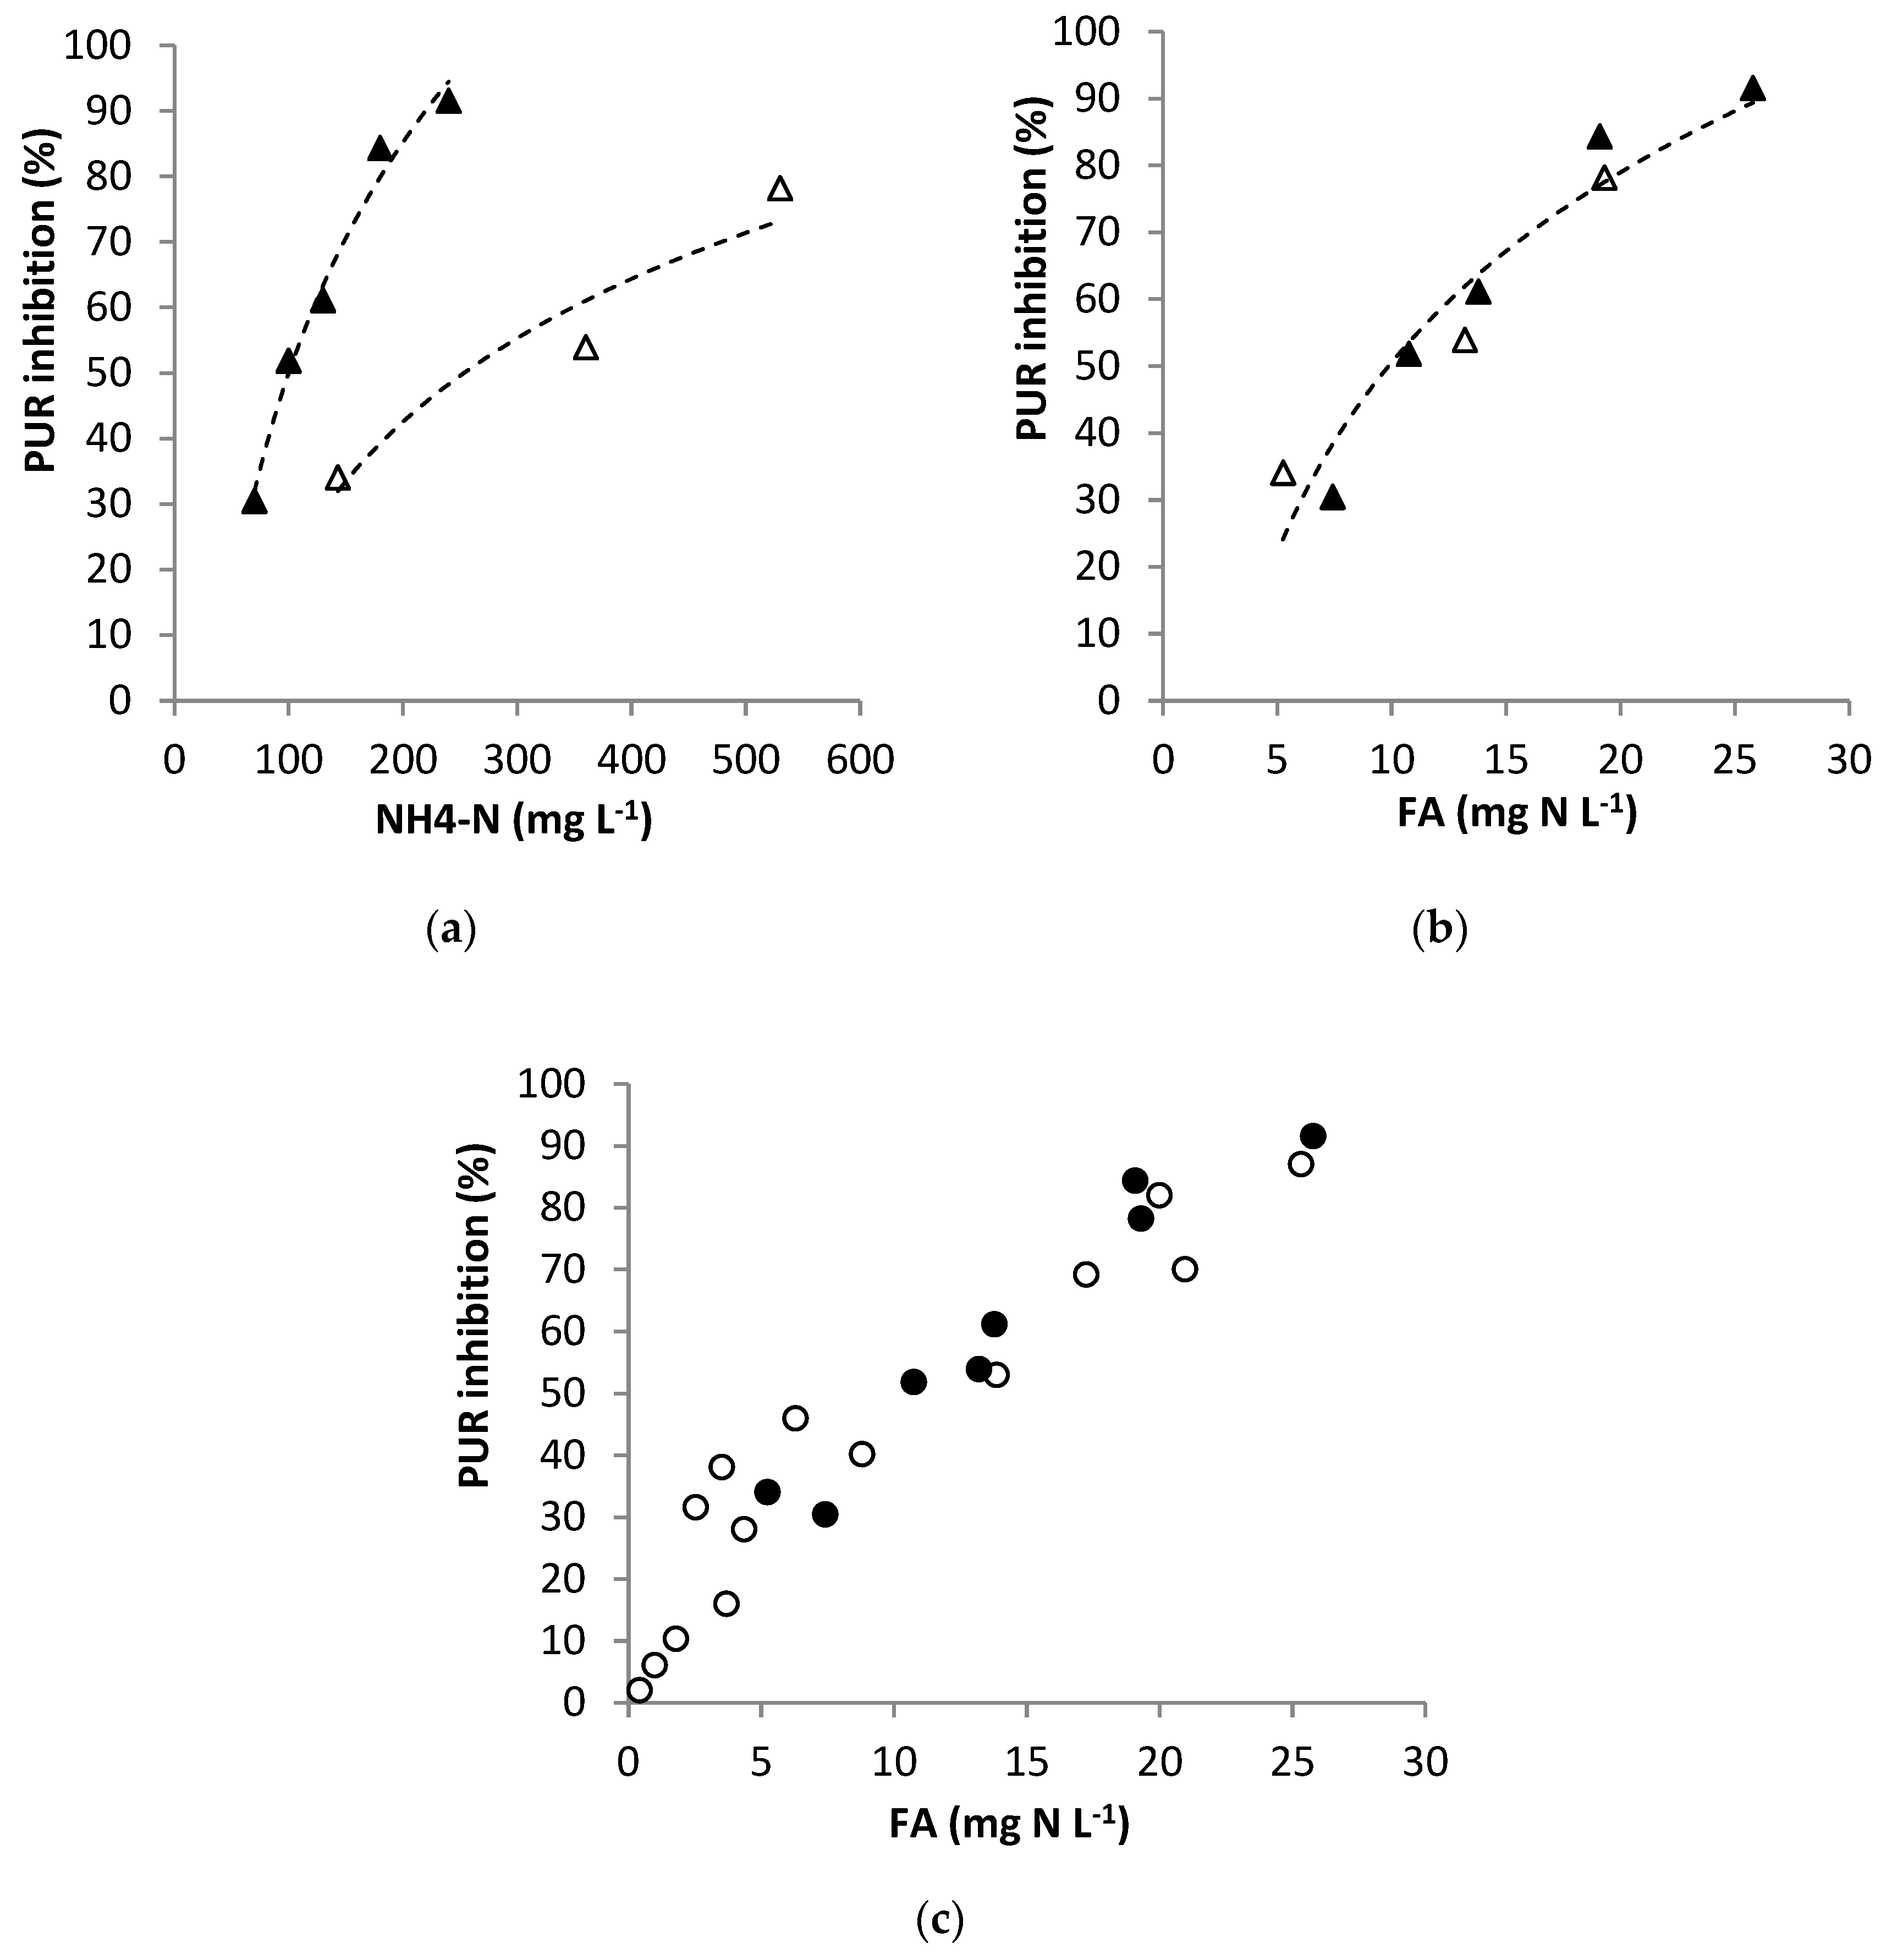
Each model’s performance was evaluated with the use of the sum of squared errors (SSE), the Nash–Sutcliffe Efficiency (NSE) coefficient, and the percent bias (PBIAS), as suggested by Moriasi et al. [29], by setting minimum performance criteria for NSE values greater than 0.8 and PBIAS values within ±20%.
The criterium of minimum sum of squared errors (SSE) was used to calculate the values of the models’ parameters. By applying this best fit analysis, a KiFNA of 1.6 μg N L−1 was calculated both for the simple non-competitive inhibition model and the Andrews model (Equations (5) and (7)), a value which is practically identical to the one reported by Andreadakis et al. [7] for the case of FNA inhibition on aerobic PUR (1.5 μg N L−1). In the case of Levenspiel’s model, by using an SFNA* value of 12.8 μg L−1 (derived from the experimental data), best fit analysis resulted in an m value of 4.5. The Andrews [26] and Zhou et al. [28] models were applied by adopting a Ks value of 0.031 μg L−1, as suggested by Zhou et al. [28], which in the latter case, resulted in an optimum α value of −355. The optimum fitting of the dose-response Hill-type model (Equation (8)) was achieved for a Hill coefficient value of 1.15, which approximates the simple non-competitive inhibition model (n = 1) and indicates non-cooperative inhibition (independent binding). The statistics for the five inhibition models are presented in Table 1.
Under best fit conditions, the simple non-competitive model and the dose response Hill-type model can equally describe the FNA inhibition on anoxic PUR very satisfactorily, as evidenced from the statistical indices (Table 1). Figure 5 provides a graphical comparison between the experimental data and the simulation values based on the simple non-competitive model.

3.3. Effect of FA

3.3.1. Experimental Results

The results of the experiments investigating the effect of FA on anoxic PUR are presented in Figure 6. The results clearly illustrate that ammonium inhibited anoxic PUR significantly more at the pH of 8.5 compared to the pH of 8. The higher inhibition observed at higher pH values demonstrates that free ammonia is most likely the actual inhibitor of the process (as indicted by Figure 6b). This could be expected, as FA is a known inhibitor of several microbial groups such as AOB and NOB. A free ammonia concentration of 10 mg NH3-N L−1 results in a 50% inhibition of anoxic PUR, while the process was found to be inhibited by over 90% for the FA concentration of 26 mg NH3-N L−1.
One limitation of studies aiming to evaluate FA inhibition on anoxic PUR is the inability to conduct anoxic PUR experiments at lower pH values due to FNA toxicity. In order to examine P-removal via denitritation, a sufficient nitrite concentration is required, which has been found to severely inhibit EBPR at low pH due to greater FNA concentrations. As mentioned in the “Materials and Methods” section, a nitrite concentration of 10 mg N L−1, as was maintained in order to study anoxic P-removal, would have little effect on the process for the pH investigated. The same concentration, however, would inhibit PUR by about 50% at the pH of 7. Thus, studying the sole effect of FA on PUR under these conditions is problematic. However, in the case of aerobic phosphorus removal, the effect of ammonium on PUR has been studied at a pH as low as 7, and the results have suggested that FA is indeed the actual inhibitor of EBPR [7]. Coupled with the results of this study, this would suggest that FA, rather than ammonium, is the actual inhibitor of anoxic P-removal; thus, the effect of ammonium at low pH may be accurately predicted. Figure 6c displays a comparison of the effect of FA on aerobic PUR with its effect on anoxic PUR observed in this study. It appears that P-removal via denitritation shows no greater tolerance to FA than that displayed in the case of aerobic P-removal.
It should be pointed out that in nitritation-denitritation systems, most of the ammonium is converted to nitrite during aeration; therefore, the inhibitory effect of ammonium on EBPR mainly concerns the aerobic pathway. However, the residual ammonium at the beginning of the denitritation phase may prove to have a considerable adverse effect on anoxic P-removal as well, especially if the medium’s pH is high. Therefore, while a high pH may be beneficial in lowering the FNA concentration due to the significant nitrite content at the start of the anoxic phase, the residual ammonium concentration should also be taken into consideration.

3.3.2. Modelling FA Inhibition on Anoxic PUR

Following the methodology detailed in Section 2.4, the values of PUR max app and K m app were calculated for all experimental series. Based on the experimental data obtained, the increase in FA concentration from 0 to 2.5 mg N L−1 and 12.5 mg N L−1 resulted in a decrease in PUR max app from 11 mg PO4-P g−1 VSS h−1 to 6.1 mg PO4-P g−1 VSS h−1 and 4.5 mg PO4-P g−1 VSS h−1, respectively, and a gradual decrease in the K m app value, from 5.6 mg L−1 to 5.0 mg L−1 and 3.2 mg L−1, respectively. The decrease in both PURmax and Km apparent values with the increase in the inhibitor (FA) strongly indicates an un-competitive type of inhibition. Therefore, in order to model the effect of FA on anoxic PUR, the simple un-competitive inhibition model was used (Equation (10)):
PUR = PUR max S S · ( 1 + S FA K iFA ) + K S
where,
  • PURmax: the non-inhibited (maximum) anoxic phosphorus uptake rate (which essentially may be regarded as the PUR displayed by the control reactor of each batch series);
  • SFA: the free ammonia concentration;
  • S: the concentration of phosphates;
  • KS: the half saturation coefficient for phosphates;
  • KiFA: the FA concentration that results in 50% inhibition of the process.
The predictive capacity of the simple un-competitive inhibition model was compared to that of Levenspiel’s model [25] described by Equation (6) and the dose-response Hill-type model described by Equation (8) by substituting SFNA, SFNA* and KiFNA with SFA, SFA*, and KiFA.
Based on the methodology followed in the case of FNA, the calculation of the models’ parameters was performed by minimizing the SSE between the experimental and predicted values. According to the results, a KiFA value of 8 mg L−1 was assessed for the simple un-competitive model (Equation (10)), a value very similar to the one reported by Andreadakis et al. [7], for the case of FA inhibition on aerobic PUR. In the case of Levenspiel’s model, by adopting an SFA* value of 37 mg L−1, best fit analysis resulted in an m value of 2.5. For the Hill-type model, an n coefficient of 1.5 resulted in best fitting, thus suggesting positively cooperative binding. The statistics of the three inhibition models are presented in Table 2. The results suggest that the predictive capacity of Levenspiel’s model is better than either the simple un-competitive model or the dose-response model.
Figure 7 presents the very satisfactory comparison between the experimental results and the predicted values based on Levenspiel’s model.

4. Discussion

Both FNA and FA were found to inhibit anoxic phosphorus removal. The mode of inhibition in anoxic PUR by FNA was determined to be best described by a non-competitive model, while the effect of FA on anoxic PUR was established to follow an un-competitive mode of inhibition. To the best of our knowledge, this is the first study which specifies the type of FNA and FA inhibition on PAO activity under anoxic conditions. The degree of anoxic PUR inhibition in the case of each inhibitor appears to be very similar to that observed under aerobic conditions, indicating that the uptake of phosphorus is affected to the same extent, regardless of the electron acceptor.
As already mentioned, nitrogen removal via nitritation/denitritation provides a significant advantage towards energy demand compared to conventional nitrification/denitrification. The application of this method relies on the suppression of NOB by high FA and FNA concentrations that are governed by the nitrogen loading rate, along with DO concentration and the aerobic SRT. These conditions may prove to limit the application of EBPR, as both FA and FNA have been found to severely inhibit PAO activity, both under aerobic and anoxic conditions. While it is clear that FNA is a much stronger inhibitor than FA in terms of nitrogen (with 1.5 μg HNO2-N L−1 essentially having the same effect as 6400 μg NH3-N L−1), this does not constitute the effect of FA as insignificant, since in the typical pH range of the treated media, the percentage of ammonium nitrogen in the form of FA is much higher than the percentage of nitrite nitrogen in the form of FNA (for example, at the pH of 8 at 20 °C, approximately 4.7% of ammonium nitrogen is in the form of FA, while a mere 0.0026% of nitrite nitrogen is in the form of FNA). The results of this work suggest that anoxic phosphorus removal is inhibited by FNA and FA to the same degree as aerobic phosphorus removal. Operating at a high pH would likely allow greater PAO activity under anoxic conditions compared to aerobic ones, as it would diminish the FNA concentration without contributing significant FA, due to the low residual ammonium concentrations expected. However, this may not prove to allow greater anoxic phosphorus removal, as the anoxic PUR of PAOs appears to be at approximately 40% of their aerobic PUR. In addition, PAOs denitritation rates were significantly lower compared to the typical denitritation rates of common heterotrophs, even when displaying good P-removal (e.g., 5.5 mg NO2-N g−1 VSS h−1 at a PUR of 7.1 mg P g−1 VSS h−1). As such, effective denitritation requires a strong presence of common heterotrophs regardless of EBPR and consequently, the addition of an external carbon source at this stage to support bacterial growth under anoxic conditions. Carbon addition at this phase may be of strategic importance for the achievement of EBPR. For instance, a dosage may be regulated in order to reduce most of the nitrite, leaving a residual concentration of 30 mg N L−1 to be reduced by PAOs with the use of internal PHA reserves. Due to the natural increase in pH during denitritation, the associated FNA concentration would be relatively low, allowing for PAO activity. At the pH of 8.2, for example, the relative FNA concentration is 0.5 μg N L−1 at 20 °C, which would inhibit PUR by approximately 25%. This degree of inhibition would further decrease with time as nitrite is removed. While this would require longer anoxic retention times, it could provide sufficient phosphorus removal, as PAOs have displayed relatively high P-removal/nitrite-reduction ratios. However, the recoverability potential of PAOs should also be taken into consideration, as some time may be required to resume normal function following the removal of FNA.
While the abundance or absence of NOB is dictated by their growth under these conditions with regard to the aerobic SRT, the presence of PAOs is also dependent on the resilience of competitive groups under these conditions. The main PAO competitors are glycogen accumulating organisms (GAOs). Like PAOs, GAOs can take up VFAs under anaerobic conditions and store them intracellularly as PHAs. Unlike PAOs, however, they do not possess polyphosphate chains, and the energy required for the reception and storage of VFAs is provided via the hydrolysis of intracellular glycogen followed by glycolysis of the produced glucose [1,30]. Therefore, GAOs do not contribute to the removal of phosphorus, and their proliferation over PAOs may be considered a significant bottleneck of the EBPR process.
The most prominent GAOs are the gammaproteobacterial Candidatus competibacter and the alphaproteobacterial Defluviicoccus vanus [31,32]. Competibacter spp. are favoured when the carbon source is acetate, while Defluviicoccus spp. have a higher affinity for propionate. Therefore, the use of acetate as a carbon source would promote the prevalence of Competibacter spp., which has been found to possess a higher tolerance to FNA than PAOs [33], ultimately leading to the wash-out of PAOs. The use of propionate would not allow the growth of Competibacter, indicating Defluviicoccus spp. as the main antagonistic group. The effect of FNA and FA on Defluviicoccus spp. has yet to be fully investigated at this point. However, it has been reported that all known strains of Defluviicoccus (DFI, DFII) are unable to use nitrite as an electron acceptor when propionate is the sole carbon source [31], and Tayà et al. [15] demonstrated that the integration of denitritation with EBPR favours the suppression of Defluviicoccus GAOs. While the use of propionate as an external carbon source may not prove to be feasible in full-scale applications, it may be made available via the anaerobic degradation of certain by-products such as glycerol [34].
For effective EBPR coupled with nitritation/denitritation, appropriate loading rates should be determined with regard to the N/P ratio of the influent as to allow the prevalence of a sufficient PAO community under the inhibitory conditions associated with the nitrogen loading. The results of this study may provide useful information to this end.

5. Conclusions

Free nitrous acid appears to inhibit anoxic PUR to a similar degree as it has been proven to inhibit aerobic PUR, with 50% inhibition observed at the concentration of 1.8 μg HNO2-N L−1. Accordingly, free ammonia was found to inhibit PAOs activity under anoxic conditions, with this effect being similar to the respective inhibitory effect assessed by previous studies under aerobic conditions. A FA concentration of 10 μg NH3-N L−1 results in a 50% inhibition of anoxic PUR. A non-competitive inhibition model with a KiFNA value of 1.6 μg N L−1 best describes the effect of FNA on anoxic PUR, while Levenspiel’s model with an SFA* value of 37 mg N L−1 provides the best fit for FA. Phosphorus removal via denitritation under negligible inhibitory conditions appears to occur at approximately 40% of the relevant aerobic phosphorus removal rate.

Author Contributions

Conceptualization, C.N. and D.A.; methodology, C.N., D.M. and S.M.; validation, A.K., V.C. and D.A.; formal analysis, D.A. and C.N.; investigation, A.K., V.C. and D.A.; writing—original draft preparation, D.A.; writing—review and editing, C.N., D.M. and S.M.; visualization, D.A.; supervision, C.N. All authors have read and agreed to the published version of the manuscript.

Funding

This research received no external funding.

Data Availability Statement

Not applicable.

Conflicts of Interest

The authors declare no conflict of interest.

Appendix A

Derivation of Equation (4):
PUR c = ( 1 Control inh ) × PUR max
Inhibition obs = PUR c PUR inh PUR c
Inhibition = PUR max PUR inh PUR max
where: PURc: the PUR displayed by the control reactor; Controlinh: the inhibition of the control reactor due to the presence of FNA (approximately 0.1 or 10%); PURinh: the PUR displayed by the triplicate reactors; Inhibitionobs: The inhibition upon comparing the PUR of the triplicate reactors with that of the control; Inhibition: the actual inhibition of PUR due to the FNA concentration of the triplicate reactors
( A 2 ) ( A 1 ) Inhibition obs = ( 1 Control inh ) × PUR max PUR inh ( 1 Control inh ) × PUR max
PUR inh = ( 1 Control inh ) × PUR max × ( 1 Inhibition obs )
( A 3 ) Inhibition = 1 PUR inh PUR max ( A 5 )
Inhibition = 1 ( 1 Control inh ) × ( 1 Inhibition obs )
Inhibition = Control inh + ( 1 Control inh ) × Inhibition obs ,
or Equation (4).

References

  1. Mino, T.; van Loosdrecht, M.C.M.; Heijnen, J.J. Microbiology and Biochemistry of the Enhanced Biological Phosphate Removal Process. Water Res. 1998, 32, 3193–3207. [Google Scholar] [CrossRef]
  2. Guo, J.; Peng, Y.; Huang, H.; Wang, S.; Ge, S.; Zhang, J.; Wang, Z. Short- and Long-Term Effects of Temperature on Partial Nitrification in a Sequencing Batch Reactor Treating Domestic Wastewater. J. Hazard. Mater. 2010, 179, 471–479. [Google Scholar] [CrossRef] [PubMed]
  3. Noutsopoulos, C.; Mamais, D.; Statiris, E.; Lerias, E.; Malamis, S.; Andreadakis, A. Reject Water Characterization and Treatment through Short-Cut Nitrification/Denitrification: Assessing the Effect of Temperature and Type of Substrate: Reject Water Characterization and Treatment via Nitritation/Denitritation. J. Chem. Technol. Biotechnol. 2018, 93, 3638–3647. [Google Scholar] [CrossRef]
  4. Gu, A.Z.; Pedros, P.B.; Kristiansen, A.; Onnis-Hayden, A.; Schramm, A. Nitrifying Community Analysis in a Single Submerged Attached-Growth Bioreactor for Treatment of High-Ammonia Waste Stream. Water Environ. Res. 2007, 79, 2510–2518. [Google Scholar] [CrossRef] [PubMed]
  5. Pijuan, M.; Ye, L.; Yuan, Z. Free Nitrous Acid Inhibition on the Aerobic Metabolism of Poly-Phosphate Accumulating Organisms. Water Res. 2010, 44, 6063–6072. [Google Scholar] [CrossRef] [PubMed]
  6. Zhou, Y.; Ganda, L.; Lim, M.; Yuan, Z.; Ng, W.J. Response of Poly-Phosphate Accumulating Organisms to Free Nitrous Acid Inhibition under Anoxic and Aerobic Conditions. Bioresour. Technol. 2012, 116, 340–347. [Google Scholar] [CrossRef] [PubMed]
  7. Andreadakis, D.; Noutsopoulos, C.; Fragkiskatos, G.; Mamais, D.; Misirli, T.; Argyropoulou, K.; Themeli, E.; Malamis, S. Inhibition of Free Nitrous Acid and Free Ammonia on Polyphosphate Accumulating Organisms: Evidence of Insufficient Phosphorus Removal through Nitritation-Denitritation. J. Environ. Manag. 2021, 297, 113390. [Google Scholar] [CrossRef]
  8. Zhou, Y.; Ganda, L.; Lim, M.; Yuan, Z.; Kjelleberg, S.; Ng, W.J. Free Nitrous Acid (FNA) Inhibition on Denitrifying Poly-Phosphate Accumulating Organisms (DPAOs). Appl. Microbiol. Biotechnol. 2010, 88, 359–369. [Google Scholar] [CrossRef]
  9. Yoshida, Y.; Takahashi, K.; Saito, T.; Tanaka, K. The Effect of Nitrite on Aerobic Phosphate Uptake and Denitrifying Activity of Phosphate-Accumulating Organisms. Water Sci. Technol. 2006, 53, 21–27. [Google Scholar] [CrossRef]
  10. Saito, T.; Brdjanovic, D.; van Loosdrecht, M.C.M. Effect of Nitrite on Phosphate Uptake by Phosphate Accumulating Organisms. Water Res. 2004, 38, 3760–3768. [Google Scholar] [CrossRef]
  11. Meinhold, J.; Arnold, E.; Isaacs, S. Effect of Nitrite on Anoxic Phosphate Uptake in Biological Phosphorus Removal Activated Sludge. Water Res. 1999, 33, 1871–1883. [Google Scholar] [CrossRef]
  12. Frison, N.; Katsou, E.; Malamis, S.; Fatone, F. A Novel Scheme for Denitrifying Biological Phosphorus Removal via Nitrite from Nutrient-Rich Anaerobic Effluents in a Short-Cut Sequencing Batch Reactor: Via-Nitrite Phosphorus Removal in a Sequencing Batch Reactor. J. Chem. Technol. Biotechnol. 2016, 91, 190–197. [Google Scholar] [CrossRef]
  13. Yang, G.; Xu, Q.; Wang, D.; Tang, L.; Xia, J.; Wang, Q.; Zeng, G.; Yang, Q.; Li, X. Free Ammonia-Based Sludge Treatment Reduces Sludge Production in the Wastewater Treatment Process. Chemosphere 2018, 205, 484–492. [Google Scholar] [CrossRef] [PubMed]
  14. Zheng, X.; Sun, P.; Lou, J.; Cai, J.; Song, Y.; Yu, S.; Lu, X. Inhibition of Free Ammonia to the Granule-Based Enhanced Biological Phosphorus Removal System and the Recoverability. Bioresour. Technol. 2013, 148, 343–351. [Google Scholar] [CrossRef] [PubMed]
  15. Tayà, C.; Garlapati, V.K.; Guisasola, A.; Baeza, J.A. The Selective Role of Nitrite in the PAO/GAO Competition. Chemosphere 2013, 93, 612–618. [Google Scholar] [CrossRef] [PubMed] [Green Version]
  16. Anthonisen, A.C.; Loehr, R.C.; Prakasam, T.B.S.; Srinath, E.G. Inhibition of Nitrification by Ammonia and Nitrous Acid. J. (Water Pollut. Control Fed.) 1976, 48, 835–852. [Google Scholar]
  17. APHA. Standard Methods for the Examination of Water and Wastewater, 21st ed.; American Public Health Association; American Water Works Association; Water Environment Federation: Washington, DC, USA, 2005. [Google Scholar]
  18. Amann, R.I. Fluorescently Labelled, RRNA-Targeted Oligonucleotide Probes in the Study of Microbial Ecology. Mol. Ecol. 1995, 4, 543–554. [Google Scholar] [CrossRef]
  19. Crocetti, G.R.; Hugenholtz, P.; Bond, P.L.; Schuler, A.; Keller, J.; Jenkins, D.; Blackall, L.L. Identification of Polyphosphate-Accumulating Organisms and Design of 16S RRNA-Directed Probes for Their Detection and Quantitation. Appl. Environ. Microbiol. 2000, 66, 1175–1182. [Google Scholar] [CrossRef] [Green Version]
  20. Daims, H.; Brühl, A.; Amann, R.; Schleifer, K.-H.; Wagner, M. The Domain-Specific Probe EUB338 Is Insufficient for the Detection of All Bacteria: Development and Evaluation of a More Comprehensive Probe Set. Syst. Appl. Microbiol. 1999, 22, 434–444. [Google Scholar] [CrossRef]
  21. Eisenthal, R.; Cornish-Bowden, A. The Direct Linear Plot. A New Graphical Procedure for Estimating Enzyme Kinetic Parameters. Biochem. J. 1974, 139, 715–720. [Google Scholar] [CrossRef]
  22. Henze, M.; Gujer, W.; Mino, T.; Van Loosdrecht, M.C.M. Activated Sludge Models ASM, ASM2, ASM2d and ASM3; IWA Scientific and Technical Report 9; IWA Publishing: London, UK, 2000. [Google Scholar]
  23. Jiménez, E.; Giménez, J.B.; Seco, A.; Ferrer, J.; Serralta, J. Effect of PH, Substrate and Free Nitrous Acid Concentrations on Ammonium Oxidation Rate. Bioresour. Technol. 2012, 124, 478–484. [Google Scholar] [CrossRef] [PubMed]
  24. Puyol, D.; Carvajal-Arroyo, J.M.; Sierra-Alvarez, R.; Field, J.A. Nitrite (Not Free Nitrous Acid) Is the Main Inhibitor of the Anammox Process at Common PH Conditions. Biotechnol Lett. 2014, 36, 547–551. [Google Scholar] [CrossRef] [PubMed]
  25. Levenspiel, O. The Monod Equation: A Revisit and a Generalization to Product Inhibition Situations. Biotechnol. Bioeng. 1980, 22, 1671–1687. [Google Scholar] [CrossRef]
  26. Andrews, J.F. A Mathematical Model for the Continuous Culture of Microorganisms Utilizing Inhibitory Substrates. Biotechnol. Bioeng. 1968, 10, 707–723. [Google Scholar] [CrossRef]
  27. Prinz, H. Hill Coefficients, Dose–Response Curves and Allosteric Mechanisms. J. Chem. Biol. 2010, 3, 37–44. [Google Scholar] [CrossRef] [Green Version]
  28. Zhou, Y.; Pijuan, M.; Yuan, Z. Free Nitrous Acid Inhibition on Anoxic Phosphorus Uptake and Denitrification by Poly-Phosphate Accumulating Organisms. Biotechnol. Bioeng. 2007, 98, 903–912. [Google Scholar] [CrossRef]
  29. Moriasi, D.N.; Arnold, J.G.; van Liew, M.W.; Bingner, R.L.; Harmel, R.D.; Veith, L.T. Model Evaluation Guidelines for Systematic Quantification of Accuracy in Watershed Simulations. Trans. ASABE 2007, 50, 885–900. [Google Scholar] [CrossRef]
  30. Dai, Y.; Yuan, Z.; Wang, X.; Oehmen, A.; Keller, J. Anaerobic Metabolism of Defluviicoccus Vanus Related Glycogen Accumulating Organisms (GAOs) with Acetate and Propionate as Carbon Sources. Water Res. 2007, 41, 1885–1896. [Google Scholar] [CrossRef]
  31. Oehmen, A.; Carvalho, G.; Lopez-Vazquez, C.M.; van Loosdrecht, M.C.M.; Reis, M.A.M. Incorporating Microbial Ecology into the Metabolic Modelling of Polyphosphate Accumulating Organisms and Glycogen Accumulating Organisms. Water Res. 2010, 44, 4992–5004. [Google Scholar] [CrossRef]
  32. Shen, N.; Zhou, Y. Enhanced Biological Phosphorus Removal with Different Carbon Sources. Appl. Microbiol. Biotechnol. 2016, 100, 4735–4745. [Google Scholar] [CrossRef]
  33. Ye, L.; Pijuan, M.; Yuan, Z. The Effect of Free Nitrous Acid on the Anabolic and Catabolic Processes of Glycogen Accumulating Organisms. Water Res. 2010, 44, 2901–2909. [Google Scholar] [CrossRef] [PubMed]
  34. Guerrero, J.; Tayà, C.; Guisasola, A.; Baeza, J.A. Glycerol as a Sole Carbon Source for Enhanced Biological Phosphorus Removal. Water Res. 2012, 46, 2983–2991. [Google Scholar] [CrossRef] [PubMed]
Figure 1. The schematic illustration of the sequencing batch reactor (SBR) operation cycle.
Energies 15 02108 g001
Figure 2. The fluorescence in situ hybridization (FISH) identification of polyphosphate-accumulating organisms (PAOs) with Cy-3 labelled PAOMIX (PAOs depicted in red in (a,c), all microorganisms stained with DAPI depicted in blue in (b,d)).
Energies 15 02108 g002
Figure 3. The variation of PO4-P (●) and COD (○) (presented in (a)) and NH4-N (■), NO2-N (∆), and NO3-N (▲) (presented in (b)) during a typical SBR operation cycle.
Energies 15 02108 g003aEnergies 15 02108 g003b
Figure 4. (a) The effect of nitrite on the anoxic phosphorus uptake rate (PUR); (b) The effect of free nitrous acid (FNA) on anoxic PUR; (c) The comparison of anoxic PUR inhibition with aerobic PUR inhibition; (d) The comparison of modified anoxic PUR inhibition with aerobic PUR inhibition. (●)—anoxic inhibition for first series of experiments (pH = 8), (♦), (◊)—anoxic inhibition by 30 mg NO2-N L−1 at the pH of 7 and 8, respectively, (○)—aerobic inhibition [7].
Energies 15 02108 g004aEnergies 15 02108 g004b
Figure 5. The predicted versus the experimental values for the free nitrous acid inhibitive effect on PAOs anoxic activity (predicted values were calculated based on the simple non-competitive model).
Energies 15 02108 g005
Figure 6. (a) The effect of ammonium on anoxic PUR for the pH of 8 (∆) and 8.5 (▲); (b) The effect of free ammonia (FA) on anoxic PUR for the pH of 8 (∆) and 8.5 (▲); (c) the comparison of anoxic PUR inhibition by FA (●) with aerobic PUR inhibition by FA (○) [7].
Energies 15 02108 g006
Figure 7. The predicted versus experimental values for the free ammonia inhibitive effect on the PAOs anoxic activity (predicted values were calculated based on Levenspiel’s model).
Energies 15 02108 g007
Table 1. The statistic indices for the FNA inhibition models examined.
Statistical IndexSimple Non-CompetitiveLevenspiel [25]Andrews [26]Hill-Type [27]Zhou et al. [28]
SSE1621154168160634
NSE0.950.650.950.950.81
PBIAS−0.12%−4.45%−1.56%0.43%−1.90%
Table 2. The statistic indices for the FA inhibition models examined.
Statistical IndexSimple Un-CompetitiveLevenspiel [25]Hill-Type [27]
SSE1053678734
NSE0.700.800.79
PBIAS2.2%0.42%−0.37%
Publisher’s Note: MDPI stays neutral with regard to jurisdictional claims in published maps and institutional affiliations.

