Article

Effect of the Substrate to Inoculum Ratios on the Kinetics of Biogas Production during the Mesophilic Anaerobic Digestion of Food Waste

1
Resource Recovery Research Group (Re3G), Department of Environmental Science and Engineering, Kathmandu University, Dhulikhel 45200, Nepal
2
Soil Water and Air Testing Laboratories Pvt. Ltd., GPO 25752, Babarmahal, Kathmandu 44600, Nepal
3
Nawa Paila, Sisir-Marg-11, Babarmahal, Kathmandu 44600, Nepal
4
EnergizeNepal, School of Engineering, Kathmandu University, Dhulikhel 45200, Nepal
5
CIRCE-Research Centre for Energy Resources and Consumption (CIRCE Foundation—University of Zaragoza), Parque Empresarial Dinamiza, Avenida Ranillas 3D, 1a Planta, 50018 Zaragoza, Spain
*
Authors to whom correspondence should be addressed.
Energies 2022, 15(3), 834; https://doi.org/10.3390/en15030834
Submission received: 23 December 2021 / Revised: 17 January 2022 / Accepted: 20 January 2022 / Published: 24 January 2022

Abstract

:
This study evaluates the effects of the varying substrate to inoculum ratios (S:I) of 0.5, 1, 2, 3, 4, 5, and 6 (volatile solids/VS basis) on the kinetics of biogas production during batch mesophilic (35 ± 1 °C) anaerobic digestion (AD) of simulated food waste (FW), using anaerobic digestate as the inoculum. Kinetic parameters during biogas production (scrubbed with NaOH solution) are predicted by the first-order and the modified Gompertz model. The observed average specific biogas yields are in descending order corresponding to the S:I ratios 1, 2, 4, 6, 3, 5, and 0.5, respectively, and the significant effect of the S:I ratio was observed. The tests with the S:I of 1 have the maximum average biogas production rates of 88.56 NmL/gVS.d, whereas tests with the S:I of 6 exhibited the lowest production rates (24.61 NmL/gVS.d). The maximum biogas yields, predicted by the first order and the modified Gompertz model, are 668.65 NmL/gVS (experimental 674.40 ± 29.10 NmL/gVS) and 653.17 NmL/gVS, respectively. The modified Gompertz model has been proven to be suitable in predicting biogas production from FW. VS removal efficiency is greater in higher S:I ratios, with a maximum of 78.80 % at the S:I ratio of 6, supported by the longer incubation time. Moreover, a significant effect of the S:I ratio is seen on kinetics and energy recovery from the AD of FW.

1. Introduction

Anaerobic digestion (AD) is a mature technology with substantial application in sludge and organic waste management [1]. AD of organic waste could yield renewable energy (as methane) and biofertilizers (as digestate). AD is vital for reducing greenhouse gas emissions from waste sectors, combating climate change, and sustaining life on earth [1,2]. AD also plays an integral role in managing organic waste. Food waste (FW) is abundantly available waste biomass that contains high moisture and readily degradable organic matter. Both characteristics make it an attractive feedstock for energy recovery from the AD process [3]. The performance of AD relies on the optimization of major process parameters such as substrate concentration, the substrate to inoculum ratio, retention time, and temperature [4,5]. Moreover, the microbial community dynamics, their acclamations to changing operating conditions, and inhibitory conditions in the reactors determine the process stability [6,7]. Major efforts are put under the development of eco-friendly and sustainable technologies for the up-gradation of single and multi-stage methanation systems [8,9]. FW is actively connected to waste of energy and production of greenhouse gases, and various attempts are being made to optimize energy recovery from it via the application of AD [10,11].
Among the several process parameters, optimization of the substrate to inoculum ratio (referred as S:I hereafter) plays a vital role in enhancing biomethane production [12,13]. The substrate fed to the anaerobic reactors can significantly alter the digestion process because of the difference in the quantity of three principal organic components: carbohydrates, lipids, and proteins [2,14]. Similarly, the inoculum, when supplied to the substrate, provides digestion stability [15,16]. This suggests that the S:I plays a vital role in driving the biochemical pathways and kinetics of the AD process [5,17]. Furthermore, the study of the effects of the S:I ratios on the kinetics of AD processes is useful to determine the analytical, design-based, and operational information regarding the digestion processes [18].
Kinetic modeling is an accepted approach to describe the specific parameters of the system performance. The different kinetic models have been applied to simulate the AD process to predict the accuracy and complexity of biogas production rate [16]. The kinetic studies include the analysis of potential methane production, maximum production rates, and the lag phase obtained from the experimental observations [12]. Therefore, it becomes important to study the effects of S:I ratios on the kinetics parameters during the AD of readily degradable substrates like FW. The outcomes of the study can be used for estimating treatment efficiencies of higher-scale reactors with similar operational conditions [19].
As such, we hypothesized that the S:I ratio will significantly affect the biogas production in the AD of the readily biodegradable substrate, FW. Therefore, this study aimed to assess the effect of different S:I ratios on biogas production during the mesophilic AD of FW. The study also characterizes the impact of S:I on the kinetics of the AD process. The kinetic models are used to simulate the AD processes because of the role of microorganisms in the degradation processes. The performance during the AD of FW is analyzed by evaluating the kinetic parameters, such as potential methane production, maximum production rates, and the lag phase. The first-order kinetics and the modified Gompertz models are used to predict the kinetic parameters using the batch AD tests. The predictions of the two models are then used to compare with the obtained values to determine the efficacy of the models to describe the mesophilic AD of FW.
The research article is based on the experimental evaluation of the effect of seven different S:I ratios on biogas production performance carried out in batch AD tests under mesophilic conditions. The biogas production is thoroughly studied over the experimental period and the data are fitted with the two models for the determination of biogas production kinetics. The errors born by the models are calculated based on the deviations of modeled data with the experimental data. Characterization of FW as feedstock, inoculum, generated biogas, as well as digestate, is carried out throughout the experimental operation. The suitability of the model is then evaluated and recommended for assessing the biogas production kinetics in mesophilic AD of FW.

2. Materials and Methods

2.1. Substrate and Inoculum

A food waste (FW) similar to that of kitchen waste [20] was prepared in the laboratory using 14 ingredients. The FW was composed of (wet weight basis): 50% vegetables, 20% fruits, 20% rice and noodles, 5% meat, and 2.5% each of fish and eggs. The impurities like plastic pieces and neutrals like bones and barks in the substrate sample were removed before storing at −4 °C for further use. Anaerobic digestate from a functional household-scale AD plant receiving FW was used as the inoculum in all the experiments. The household AD is a 3000 L reactor operating at ambient temperature conditions (Kathmandu, Nepal). No pretreatment was adopted for either the feedstock or the inoculum. The inoculum, however, was starved for 36 h before the initiation of the experimental setup. The inoculum was stored at a controlled temperature of less than 4 °C. The characteristics of FW and inoculum used in the study are presented in Table 1.

2.2. Experimental Setup

To maintain the anaerobic conditions, 500 mL borosilicate bottles (Omsons® Haryana 133004, India) with airtight polypropylene screw caps with valves in the gas outlets (GL 45 PP) were used. S:I ratios of 0.5, 1, 2, 3, 4, 5, and 6 based on VS compositions (i.e., g VS of FW per g VS of inoculum) were maintained in the seven sets of AD batch tests. A test with blank (inoculum only) was carried out to measure the methane production due to inoculum and subtracted from the biogas produced in all the tests with varying S:I ratios. The pH of the experiments was not controlled during the tests. All the experiments were carried out in duplicates. The reactors were kept in a water bath to maintain mesophilic conditions (35 ± 0.5 °C). The experiments were terminated when the cumulative biogas production reached a plateau.

2.3. Analytical Methods

The preliminary characterizations are conducted majorly based on standard methods for the examination of water and wastewater [21]. TS and VS content was determined based on the gravimetric method [21]. Similarly, COD was measured following the closed reflux method [21]. The pH of the samples was sought out using a calibrated pH meter. The pH meter used was HI2020-01 Edge® by Hanna (Woonsocket, RI, United States), which supported 5-standard calibration; pH 4.01, pH 3.00, pH 6.86, pH 7.01, pH 9.18 and pH 10.01. TOC was calculated using the equation TOC = TVS/1.8, based on the TVS calculated [22]. For the determination of VFA, Kapp’s triple point titration was selected as the primary method as it was presented to be the most accurate over a wide concentration range on anaerobic digestate [23]. This method was based on three iterations (pH 4, 4.3, and 5) and measured alkalinity to eliminate errors. TA of the samples was calculated in terms of mgCaCO3/L by the titrimetric procedure [21]. The density of the FW and inoculum were measured according to the mass present in its unit volume. Daily biogas production was measured by the water displacement method using a 12% NaOH solution to scrub CO2 from the biogas [24]. Biogas composition was confirmed by using a portable biogas analyzer (Ruiyi® Gasboard-3200Plus, GuangDong, China).
The measured volumes of biogas were normalized to standard temperature (0 °C) and pressure (1 atm) conditions and expressed as NmL according to the operating temperature of the laboratory when the measurement was done as follows:
V S T P = [ ( V T 273 ( 760 P W ) ] ( 270 + T ) 760
where,
  • VSTP = Gas volume of standard temperature and pressure (L);
  • VT = Volume of gas measured at temperature T (L);
  • T = Temperature of the gas or ambient space (°C); and
  • PW = Vapor pressure of the water as a function of temperature (mm Hg).
Standard deviation is calculated to visualize the soundness of the experimentally obtained data as the likeness of duplicates’ data. The graph is plotted along with the standard deviation of the mean from each data point and presented in the cumulative yield graphs. The p-value was set at 0.05 and the significance of the results was tested with p values: < 0.05, while no significant results were with p > 0.05 during the analysis of variance (ANOVA). The analytics adopted for applying the kinetic models are further described as follows.

2.4. Kinetic Study

The kinetic study simulates the anaerobic digestion scenario [16]. The kinetics were studied through the analysis of parameters such as the potential methane production, maximum rate, and the lag phase obtained from the adjustment of the practical observations [12].

2.4.1. First-Order Kinetics

Assuming first-order kinetics for the hydrolysis of particulate organic matter, the cumulative methane production was described through Equation (1).
G(t) = Go(1 − ekt)
where,
  • G(t) = Cumulative biogas yield at digestion time of t days;
  • Go = Methane potential of the substrate (mL/gVS added);
  • k = Biogas production rate constant (first order disintegration rate constant) (1/day); and
  • t = Time (days).

2.4.2. Modified Gompertz Model

The kinetic modeling of the growth of bacterial population, and thus, the biogas production in the anaerobic digester, can be modeled by the Gompertz model [6,25]. First developed to study and describe the mortality rate of humans, the Gompertz model was later modified to reflect the bacterial growth kinetics [26,27]. The modified Gompertz model is widely used to determine the biogas production kinetics to determine the efficiency of an AD. The modified Gompertz model is given by Equation (2).
M ( t ) = P · e x p { e x p [ R m a x e P ] ( λ t ) + 1 }
where,
  • M(t) = Cumulative biogas yield at digestion time of t days (mL/g VS);
  • P = Methane production potential (mL/g VS);
  • Rmax = Maximum methane production rate (mL/g VS.d);
  • λ = Lag phase (day);
  • t = Time (day); and
  • e = exp (1) = 2.7183.
The Solver operation in MS-Excel® was used to determine the kinetic parameters during the batch tests. A dataset of the kinetic equation as a function of time and the set values of constants was generated. Methane potential of the substrate (Go) and biogas production rate constant (k) were set as constants while applying the first-order kinetic model, whereas methane production potential (P), maximum methane production rate (Rmax) and lag phase (λ) were that of the modified Gompertz model. The Solver function in Excel iterated the values of constants such that the root means square error (RMSE) between the two graphs was the least possible. A graph, based on the simulated dataset, was constructed along with the experimental values of cumulative yield. The optimum values of the constants were identified as the model’s outputs based on the iterations. Correspondingly, the standard error and coefficient of determination or correlation coefficient (R2) were also obtained. The RMSE was calculated using Equation (3) [7].
( 1 m ) ( j = 1 m ( d j Y j ) 2 ) R M S E =
where,
  • m = number of data pairs;
  • j = jth values;
  • Y = measured biogas yield (mL/gVS); and
  • d = deviations (differences) between experimental and predicted biogas yield.
Equation (4) determines t95, which corresponds to a rearrangement of the modified Gompertz Equation (2) [25,27]. The parameter t95 is the time required to undergo 95% of the maximum yield.
t 95 = P R m . e ( 1 l n   ( l n 0.95 )   ) + λ
where,
  • P = Biogas production potential (mL/g VS);
  • Rm = Maximum methane production rate (mL/g VS.d); and
  • e = exp (1) = 2.7183.
The value of t95 is calculated based on the outputs (values of constants) of the application of the modified Gompertz’ kinetic model (Equation (2)).

3. Results and Discussions

3.1. Effect of S:I Ratios on Biogas Yields

Figure 1 shows the comparison of biogas (CO2 scrubbed with 12% NaOH) yields (NmL/gVS) based on different S:I ratios. The observed specific scrubbed biogas (mainly CH4) yields in the descending order of S:I ratios is 1 > 2 > 4 > 6 > 3 > 5 > 0.5. The statistical analysis (ANOVA) shows that the effect of S:I ratio was significant (p < 0.5). The S:I ratio of 1 has a specific yield of 674.37 ± 29.10 NmL/gVS, whereas the S:I 0.5 has 464.00 ± 4.34 NmL/gVS as a specific yield. Table 2 shows the removal of volatile solid (VS), and the initial and final pH in the digesting mixture in the different tests. The lower values of end pH (after digestion) seen in the higher S:I ratio test suggests the accumulation of volatile fatty acids (VFAs) in a greater degree compared to the tests with lower S:I ratios (Table 2). This confirms that the higher S:I ratios can lead to the potential accumulation of VFAs during the first days of the AD process [28,29]. Accumulation of VFAs as a major product of hydrolysis, the first process of nutrient breakdown, is often indicated by a drop in batch reactor pH right after the setup [13,30].
The influence of higher VS addition can be seen as lower end pH is obtained in the tests with the higher S:I ratios, which indicate a pH decrease via VFA accumulation. Low pH does not favour the growth of methanogens as they are habitually seen to require a pH value ranging from 7.00 to 8.50 [24]. The differences in pH also indicate that it took longer for the methanogens to grow and acclimatize in the reactors hosting low pH and high VS addition at higher S:I ratios [31]. This is also connected to variable biochemical properties of the food substrate [32]. The consequences of this latency could include lower yields of methane in the growth phase of bacteria and a longer incubation period required in reactors with higher S:I ratios.
The lab-scale batch experiments lasted for 57 days. The completion of the tests is signified by a plateau in the cumulative biogas production brought by the no further biogas production. S:I ratio 1 proved to be the optimum ratio with an average yield of 674.37 Nml/gVS added, whereas the lowest yield represented by S:I ratio 0.5 is 464.10 Nml/gVS added. The result of S:I ratio 1 found to be the optimum S:I ratio for biogas production is in concordance with earlier studies [12,20,33], where AD with different S:I ratios (1 to 6) were performed on swine wastewater and vinegar residue, respectively [33]. The experimental yield in methane in the current study also coincides with the results obtained from a study whose methane production fell in the order of S:I ratios 1 > 6 > 3 [12]. The maximum specific biogas yield obtained from this study (750.24 ± 34.00 mL/gVS added) at the S:I ratio of 1 is higher than that of the maximum yields reported in the previous studies conducted with AD of FW, 242.69 mL CH4/gVS added [34] and 554.00 ± 75.00 mL CH4/gVS added [12]. This variation in methane yields could be due to the difference in composition of the FW and experimental conditions. A review of biogas production from crop straw [17] obtained the highest cumulative methane yield of 209.10 mL/gVS added and the highest volumetric methane production of 0.40 L/L.d at the S:I ratios of 2:3 and 2:1, respectively. However, the highest cumulative yield in this study is obtained at the S:I of 1, which is substantially higher, possibly due to the reactive nature of readily biodegradable FW used in this study. The results obtained in this study can signify that the S:I ratio can be crucial in obtaining the higher energy recovery from the AD of FW.
A study conducted with prepared and leftover food as feedstock has concluded in a specific methane yield of 869.00 mL of CH4.g /TVS [35]. Similarly, another study [33,36] has signalled the biomethane potential and specific methane yields of 725.00 and 683.00 mL/gVS added, respectively, for kitchen waste as a feedstock. The 2019 study [37] shows that specific biogas and methane yields were recorded to be 655.00 and 410.20 mL/gVS at an S:I ratio of 0.5.
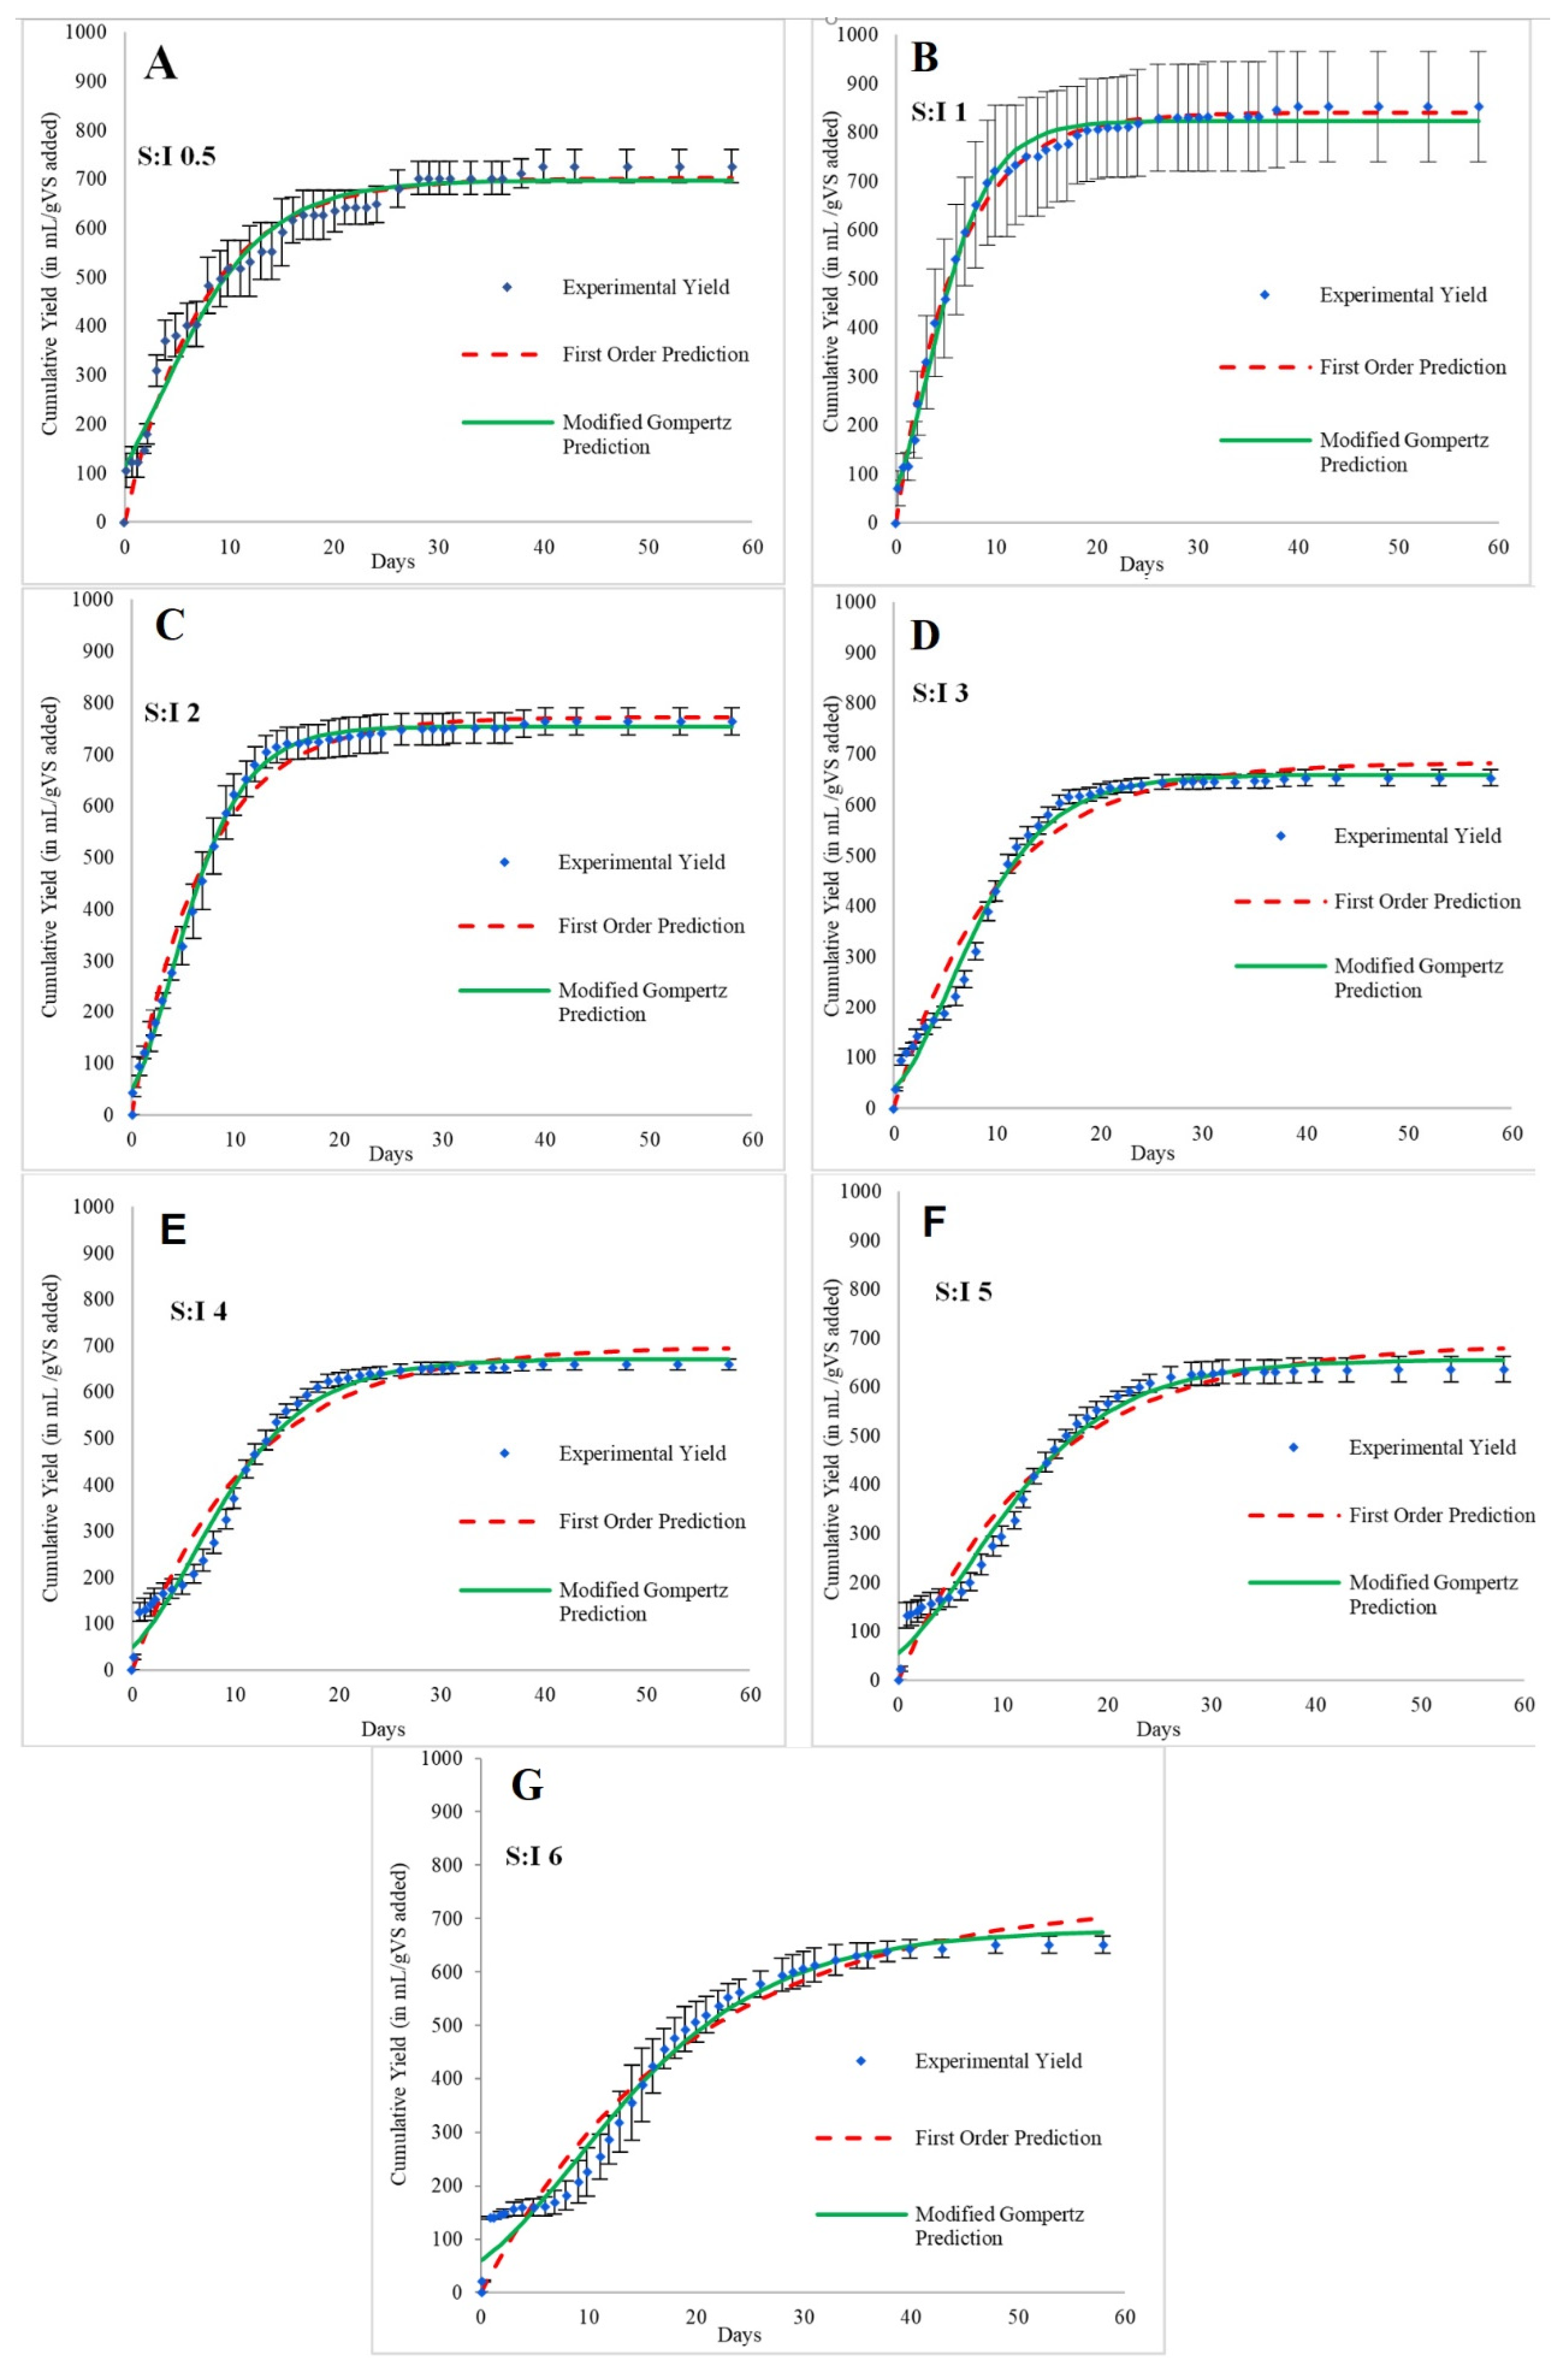
Table 2 shows the VS removal efficiencies, initial pH, and final pH readings of the experiments at the test points. It is seen that the tests with higher S:I ratios took longer to stabilize the biogas production than the ones with lower S:I ratios. In addition, higher VS removal is seen in higher ratios, corresponding to longer incubation periods (Table 2). Figure 2 shows the cumulative observed and predicted biogas (scrubbed) yields at different S:I ratios with the required time to reach the plateau or maximum biogas yields. This can be linked to the organic matter removal, methane production, and heterogeneity of the substrate [33]. The biogas production decreased along with the rise in S:I ratios signalling the increased formation of volatile fatty acids (VFAs). This lead to a decrease in pH in the first weeks of incubation and also longer incubation times [37].
It is also visible in the study that the cumulative yields of the reactors representing lower S:I ratios have a lower incubation time compared to higher S:I ratios. The variations in bacterial growth phases also rely on the increase or decrease in the S:I ratio. This might be due to different balances in nutrient to microorganism composition. Therefore, different S:I ratios offer different quantities of substrates, allowing differences in numerous factors including accumulation of VFAs, incubation periods, microorganism growth rates, removal efficiencies, yield, etc. These differences result in variations in factors like maximum gas yield rate, disintegration rate constants, and lag phases shown as the outputs of kinetic modeling.
The analogy of various similar studies [11,36,38,39,40,41] suggests that the inoculation during startup of an anaerobic digester with FW as the primary feedstock should be done around the S:I ratio of 0.5 to 1.5. A study conducted in 2017 [40] concluded that the optimum start S:I ratio should be less than 1. Similarly, a study with test points being S:I ratios 0, 0.25, 0.5, 1, 2, and 4 demonstrated that 1 was the most optimum parameter. However, it also mentioned that specific biogas production (Rm) and maximum biogas production potential increased with increasing the S:I ratios as predicted by kinetic models. Likewise, another study [36] has stated 1.5 to be the optimum S:I ratios among the three test points (0.5, 1.5, 3) adopted. Therefore, considering the statistical analysis of standard deviation of results, the optimum S:I ratio for mesophilic AD of FW is in the range of 1–2 (VS basis).

3.2. Effect of S:I Ratios on Biogas Production Kinetics

Figure 2 presents the observed and predicted biogas (scrubbed) yields at S:I ratios 0.5, 1, 2, 3, 4, 5 and 6 using the first-order kinetic and the modified Gompertz model. Cumulative yields throughout the experiment duration are plotted against the cumulative yield obtained from the outputs of the kinetic models adopted. As the experiments were conducted in duplicates, the minimum and maximum deviation from the average values were reported as vertical error bars. It is demonstrated that both the first order and modified Gompertz equations have been able to predict the cumulative yields without major deviation from the experimental data.
Table 3 summarizes the kinetic parameters and performance of the tests obtained from fitting the observed biogas (scrubbed) productions by the first-order and the modified Gompertz model. The kinetic parameters in the study were estimated based on batch experimental results. The highest value of biogas production constant (k) was found to be 0.17/d at the test with S:I ratio 1, which is also characterized by maximum specific biogas yield. The lowest value of k is found to be 0.052/d at the S:I ratio of 6. Moreover, the S:I ratios affected the time taken to achieve 95% biogas production, i.e., t95. The S:I of 1 has the shortest t95 (13.30 days) and 6 has the longer t95 (39.00 days), as shown in Table 3. The higher S:I ratios may have led to the inhibition of the methanogens by the VFAs accumulations causing a decrease in pH. A similar phenomenon of VFA accumulation at a higher S:I ratio was observed in a previous study [17] where the methanogenic microbial community undergo inhibition, resulting in kinetic latency. Likewise, in another study, a similar phenomenon was experienced at high S:I, caused by an imbalance between acidification and methanogenesis, as indicated by the low methane content [5]. The cumulative biogas yields in the reactors representing lower S:I ratios have shorter incubation times compared to higher S:I ratios. This further strengthens the fact that inhibition of methanogens was prevalent due to VFA accumulation. Hence, the variation in bacterial growth phases relies on the increase or decrease in the S:I ratio as mentioned in a previous study [16].
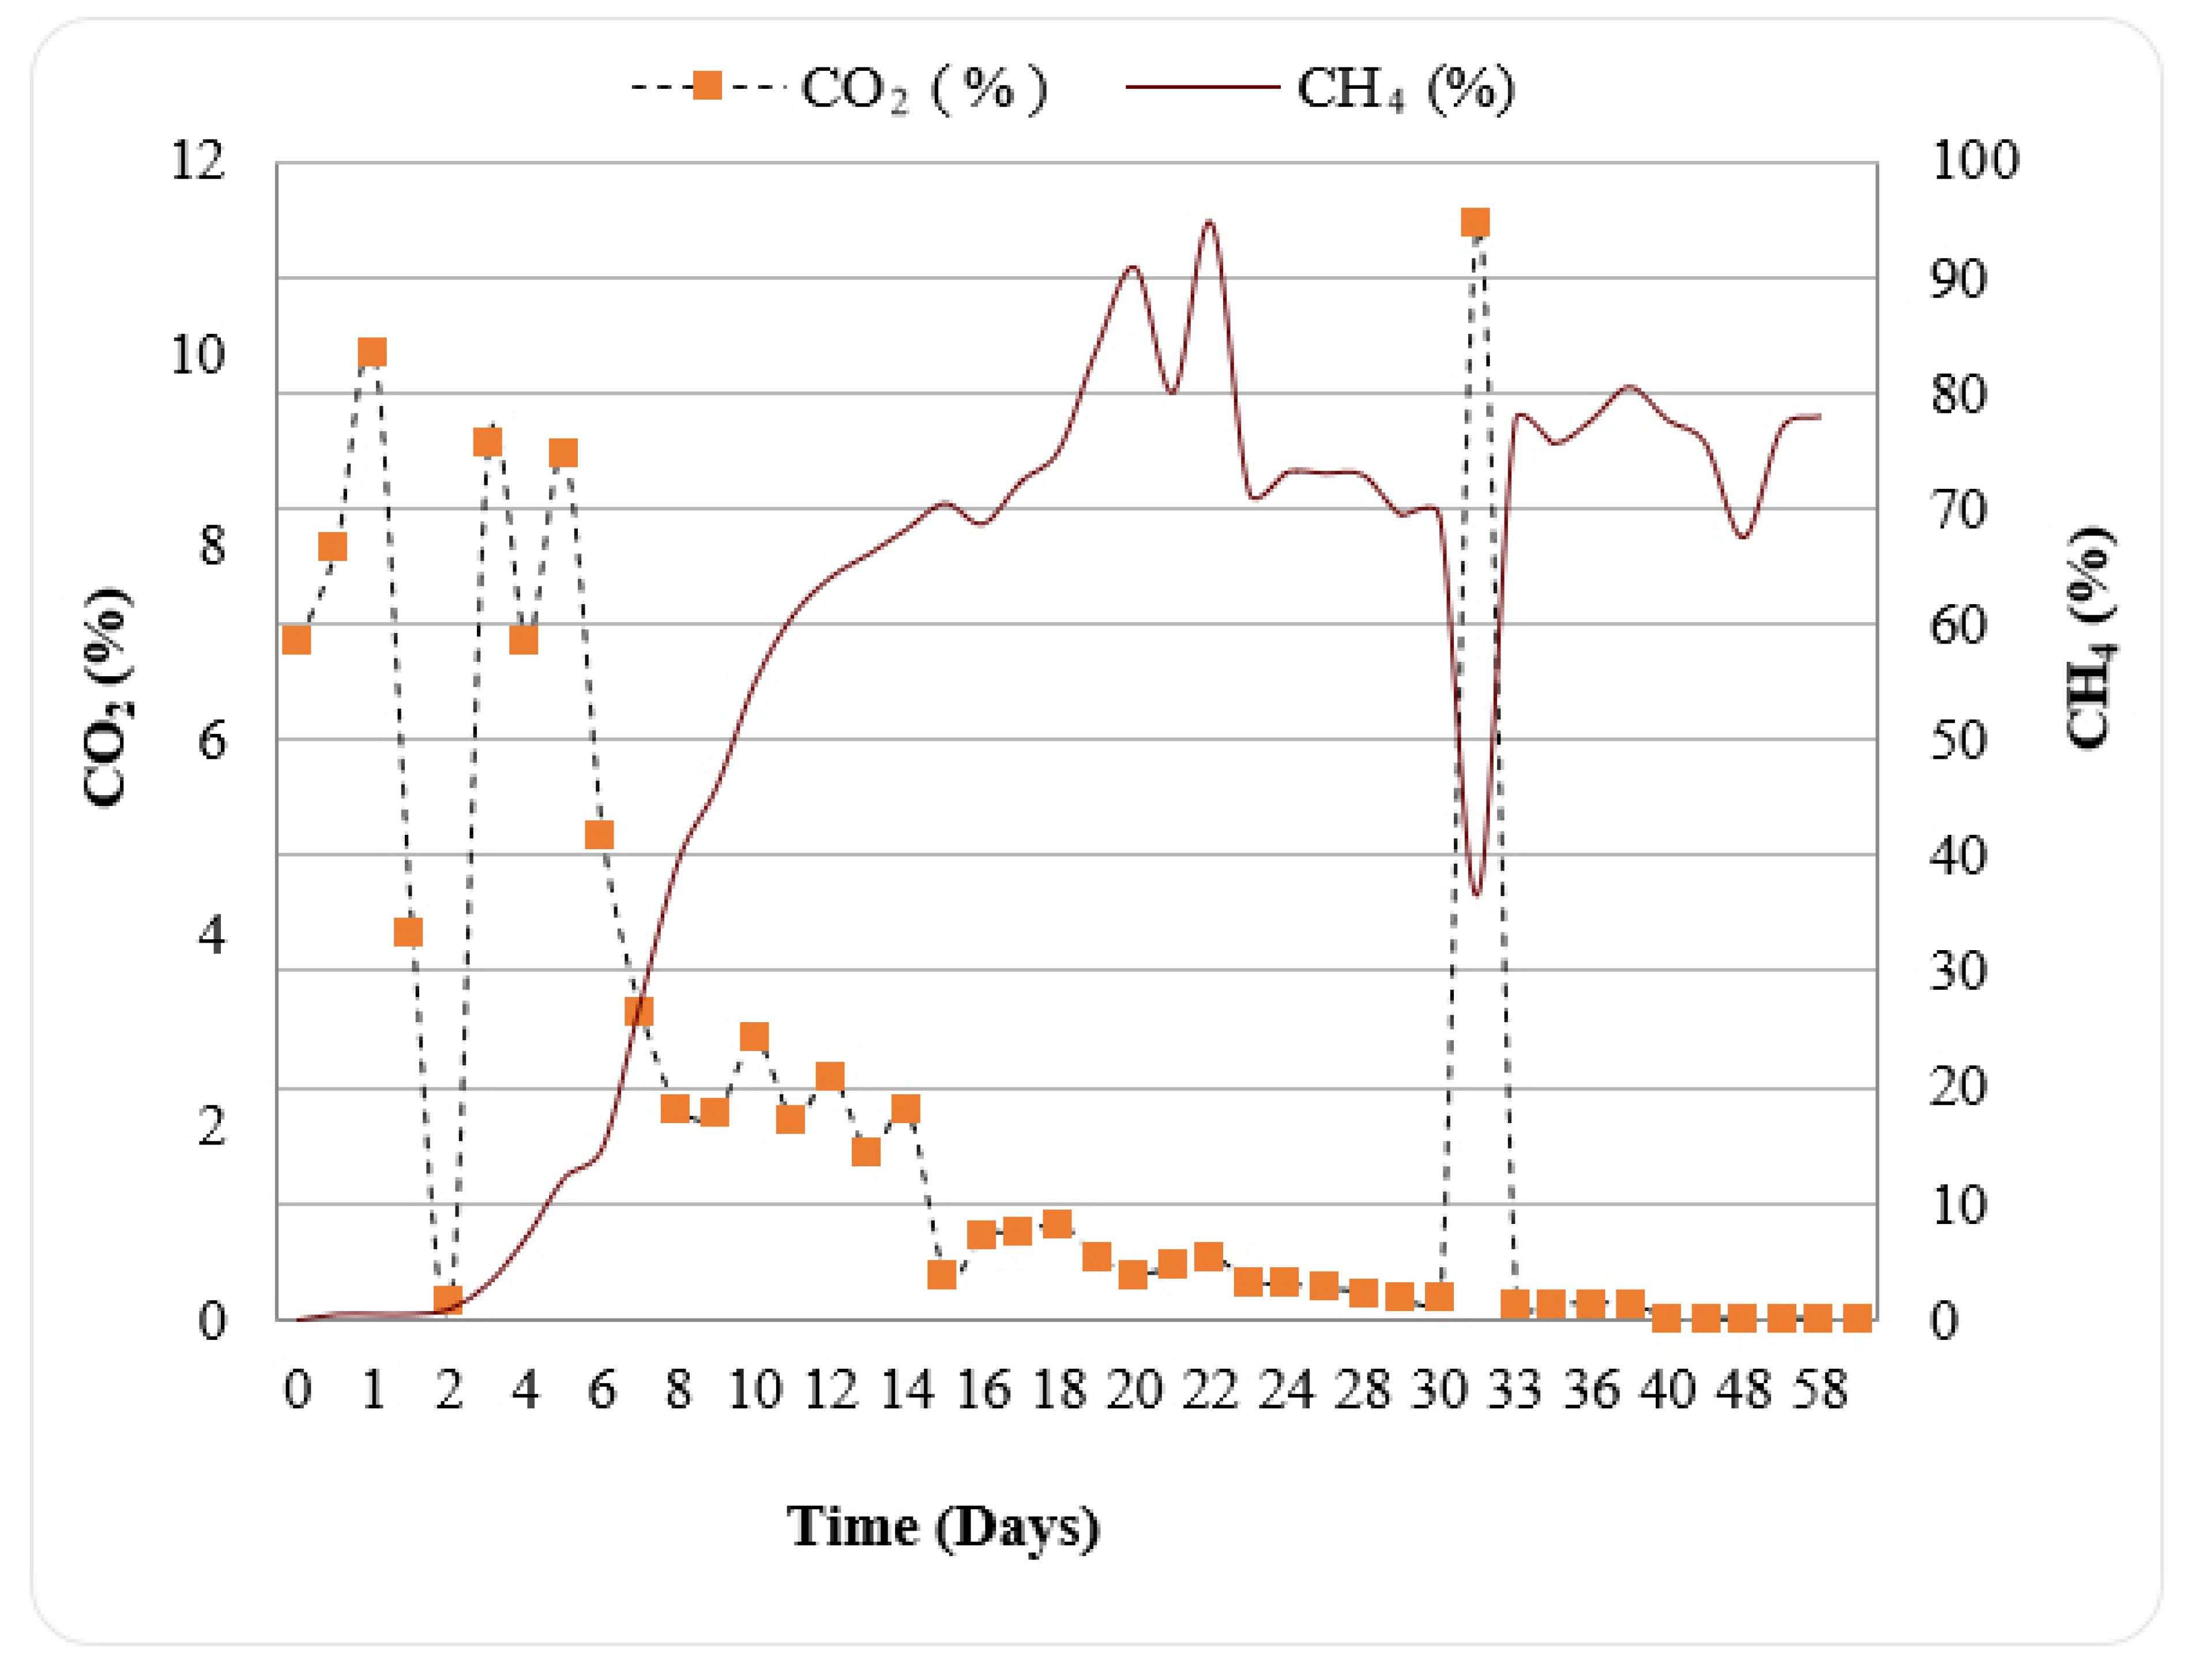
The change in methane and carbon dioxide composition of the collective yields in all tests were analysed using a gas analyser to see the effectiveness of the scrubbing (Figure 3). The entire volume of produced biogas cannot be related to specific methane production as the biogas was scrubbed with a NaOH (10.00–12.00%) solution throughout the operation and it was not 100% efficient for CO2 removal from the biogas. As a partial scrubber of CO2, the efficiency of the scrubbing unit was also evaluated based on the CO2 composition of the scrubbed biogas. Initially, the scrubber’s NaOH concentration was set to 10.00%. Upon a visible rise in CO2 composition upon gas analysis of the scrubbed biogas, the concentration of the scrubber was slightly increased to 12.00% until CO2 was eliminated. As seen in Figure 3, the absence of CO2 was seen on the gas analysis of scrubbed biogas after the 36th day from installation. This signalled the efficient operation of the laboratory scrubber unit at a NaOH concentration of 12.00%. As the rise in CO2 composition was no longer visible in gas analysis (Figure 3), the scrubber concentration was left unaltered.
The entire volume of biogas produced cannot be related directly to specific methane production due to the evaluative change in scrubber potential. However, insight is received about the specific methane yield from the daily gas analysis. The weighted average CH4 composition in regards to the daily gas analysis conducted throughout the incubation period (44.95%) signals the specific CH4 yield to be approximately the same fraction of the total biogas produced from the specific reactor. For the optimum S:I ratio of 1, the specific methane yield can be approximated to be 303.13± 3.08 NmL CH4/gVS added.
The scrubbed biogas production rates of the reactors are highest in the first four days of the experiment, which indicate short lag phases, as exhibited by Figure 2. The pH of the inoculum being more than 7 also adds that the digestate is stable and falls within the range of methanogenic bacterial growth [41,42]. The methane composition of the produced gas is very low suggests that the peak of the first three days is of fermentation via acidogenesis and acetogenesis, and largely represents hydrogen production [43,44]. The methane percentage is seen to increase to a maximum of 94.74% on the 22nd day of the tests.
15–26 days show declining gas production because of the unavailability of the food substrate. The production in periods of days 27–28 and 38–41 exhibit an ascend followed by a decline in methane composition. The peaks of the production graph at those periods can be considered to be the endogenous decay of microorganisms due to the lack of degradable food substrate available. After the decay phases, the methane composition is observed to be slightly decreasing, which is represented by the inverse peaks in the methane composition graph during periods of days 29–32 and 41–44. The methane composition is seen to elevate to a constant composition of around 77.00%.
The maximum lag phase is sought out to be 0.20 days in the tests, representing an S:I ratio of 3. An S:I ratio of 2 showed negative or null lag phases. The negative lag phase confirms that the biogas production started from day one representing favourable conditions for the microorganisms to grow [33]. Therefore, it can be concluded that there is a strong decrease of the lag phase values with a relative increase of the inoculum, which highlights the importance of selecting an effective S:I ratio to optimize the process performance [6]. An S:I ratio of 1 had the maximum CH4 production rate of 88.56 NmL/gVS.d, whereas tests with S:I ratio 6 exhibit the lowest CH4 production rates, corresponding to 24.61 NmL/gVS.d (Table 3), which clearly shows the rate of biogas production, i.e., related to the methanogenic activity, is affected by the accumulation of the VFA.
In all the tests, the standard errors and R values of the first-order kinetic model are found in the range of 0.69 to11.56 and 0.55 to 0.87, respectively, whereas those of the modified Gompertz model are found in the range of 0.77 to 8.08 and 0.56 to 0.88, respectively. This signifies acceptable precision in fitting both models. The comparison of the two models based on the standard error shows that the modified Gompertz model can give better predictions of the biogas productions in the tests. This interpretation is drawn out based on the average of errors obtained from all the tests. The average standard errors of the two models were 5.13% and 3.50%, with a standard deviation of 3.87% and 2.61%, respectively. Higher standard errors are seen in tests representing higher S:I ratios using both models. Moreover, the standard errors measured in the five tests modeled with first-order kinetic show higher errors compared with only two tests modeled using the modified Gompertz equation, signifying the better fitting of the latter. The soundness of the model results can also be seen from the graphs of predicted and observed values of biogas yield (Figure 2).
The maximum specific biogas yield predicted by both the kinetic models was S:I ratio 1, which also matches the experimental results. The maximum yields predicted by the first order and the modified Gompertz models were 668.65 and 653.17 NmL/gVS added, respectively. The experimental yield of S:I ratio 1 was 674.37 NmL/gVS. Both the models predicted slightly less biogas yield for S:I 1. It is seen that for S:I ratios less than 2, the models have predicted gas yield lower than the experimental value, whereas, for S:I ratios greater than 2, it is the opposite. The maximum difference calculated is 15%, representing the first-order model at S:I ratio 6. The modified Gompertz model for the same S:I ratio shows only an error of 5.68% for maximum yield prediction. On comparing the average maximum yield prediction errors of both models, it can be concluded that the modified Gompertz model is accurate in predicting maximum values. The average errors of the first-order and the modified Gompertz model are 5.84% and 2.76%, respectively. Similarly, the standard error in prediction is also seen greater in first-order models, except for the same two S:I ratios, 0.5 and 1. Regarding the S:I ratio of 0.5, the error differs between 2.67% and 1.74%, which is not substantial. Regarding S:I ratio 1, a high standard deviation can be the reason for the inconsistency.
Similar studies [40,45,46] have considered modified Gompertz as one of the most accurate models to predict the kinetics of AD of FW. The studies also state that the predicted kinetic parameters depend on the substrate characteristics. According to a study in 2018, among various kinetic models, the AD of single substrates was fit more accurately to the modified Gompertz model (R2: 0.930–0.997), which highlights the differences in lag phase and biogas production rate prediction.
The results show that the modified Gompertz model gives a better prediction. Though the first-order model showed better approximation for the S:I ratios 0.5 and 1, the modified Gompertz model can be still considered better considering the highest standard deviation of cumulative yield (S:I 1), i.e., ± 29.10 NmL/gVS. Moreover, the errors presented by the modified Gompertz model of S:I ratios 0.5 and 1 are 0.77 and 1.03, respectively. This is not substantially higher than that obtained from the first-order model. Hence, the modified Gompertz model can be considered to model a batch AD process over the first-order kinetic model. The process kinetics mainly influence the energy recovery potential via bio-degradability, as the yield and decay variables indicate degrees of microbial accumulation [47]. Lag phase and VS’s disintegration constant predicted through this model can be employed to scale up, as well as upgrade, the system to continuous and multi-staged energy recovery systems [19].

3.3. Considerations of S:I Ratios in the Context of a Circular Economy Scenario

With the potential to replace almost every kind of energy need of the modern society via up-gradation, manifested biogas could be a very purposeful part of the energy supply system and waste management chain, helping to sustain a circular economy scenario. In the context of developing countries like Nepal, the application of AD could be further realised if the process is optimized for waste biomass. As FW is considered one of the most efficient feedstocks for biogas production, the optimum parameters sought from this study could aid in the further development of standard parameters for full-scale anaerobic digesters for the management of organic waste like FW. The outcomes of this study can aid as fundamentals to further research projects in AD of FW like the effects of various pretreatment methods, physical operational alterations (temperature, stirring mechanism, etc.), co-digestion, or even up-gradation to multi-staged continuous feeding systems. The rate of biogas production from food waste as predicted by kinetic models used in this study can be used to compare with large-scale plants and their efficiency.
Application of urban biogas plants can mitigate greenhouse gas emissions as they limit the production of gases like methane and carbon dioxide which are emitted into the atmosphere from landfills or incineration, and instead, can be used as fuel for various purposes. Moreover, using waste to produce energy and the absence of greenhouse gases’ formation via biogas production can help combat global warming issues in the long run.
The digestate of a biogas plant can also be used as a bio-fertilizer which accelerates plant growth. Although the scope of the study does not quantify the characteristics of the digestate, thorough characterization of feed and regularly scanning for toxic attributes could ensure the production of fertilizers with satisfactory quality grades. The leftover slurry of AD is considered to improve soil quality for enhancing agricultural food production, and is also used commercially. As this study is based on synthesized food waste prepared in the laboratory, more research directed to enhance the fertilizer value of the digestate should follow.
The switch to renewable biogas energy would help balance the global energy crisis, waste management issues, and greenhouse gases emissions, hence indicating a switch from a linear to a circular economy.

4. Conclusions

S:I ratios can affect the biogas yields and process kinetics during AD of FW significantly. In this study, the S:I ratio of 1 proved to yield the highest average biogas yields (674.40 ± 29.10 NmL/gVS) among the six S:I ratios. However, considering the standard deviation and literature comparison, the suitable S:I ratio for the AD of FW is concluded to be in the range of 1 to 2 (VS basis). The results of the kinetic study presented the modified Gompertz model to be more accurate and better fitting than the first-order kinetic model, both in terms of maximum yield prediction and minimum standard error. The average error of 2.76% and 5.84% was observed in maximum biogas yield prediction from the modified Gompertz and the first-order kinetic model, respectively. With a maximum VS removal efficiency of 78.80% at an S:I ratio of 6, it is observed that higher S:I ratios correspond to higher VS removal efficiencies; however, a longer time is needed in order to achieve 95.00% of biogas production.
The study of the kinetics of biogas production provides evidence for the chemical processes governed by bacterial growth, and can furthermore be regarded to optimize the energy production rate from AD processes.

Author Contributions

A.P. and A.K., as the main authors, performed the experimental investigation, formal analysis, and wrote the original manuscript draft. B.T. and L.S. have been involved in the conceptualization of the research and were in charge of the resources, funding, and were responsible for administering the project. A.A.C.-M. and S.D. supported data analysis and interpretation of results, and reviewed and revised the manuscript. A.G. conceptualized, supervised the research contributed to writing, and reviewed and edited the draft manuscript. All authors have read and agreed to the published version of the manuscript.

Funding

This research was financed by EnergizeNepal Project which is funded by The Norwegian Ministry of Foreign Affairs (MFA) and is managed by Kathmandu University (KU), Nepal in partnership with Hydrolab Nepal, NTNU, Norway and SINTEF, Norway. The project grant [PID ENEP-RENP-II-19-01] was provided to Nawa Paila and SWAT Labs.

Institutional Review Board Statement

Not applicable.

Informed Consent Statement

Not applicable.

Data Availability Statement

The data generated by the research contained within the article and additional data is available upon request to the corresponding author.

Acknowledgments

We also acknowledge JUAS Nepal for providing us with anaerobic digestate. We would like to thank the chief editors for the comments and the reviewers for their insightful suggestions and careful reading of the manuscript.

Conflicts of Interest

The authors declare no conflict of interest. The funders had no role in the design of the study; in the collection, analyses, or interpretation of data; in the writing of the manuscript, or in the decision to publish the results.

References

  1. Bedoić, R.; Smoljanić, G.; Pukšec, T.; Čuček, L.; Ljubas, D.; Duić, N. Geospatial Analysis and Environmental Impact Assessment of a Holistic and Interdisciplinary Approach to the Biogas Sector. Energies 2021, 14, 5374. [Google Scholar] [CrossRef]
  2. Li, Y.; Jin, Y.; Borrion, A.; Li, H.; Li, J. Effects of Organic Composition on Mesophilic Anaerobic Digestion of Food Waste. Bioresour. Technol. 2017, 244, 213–224. [Google Scholar] [CrossRef] [PubMed]
  3. Dhamodharan, K.; Kumar, V.; Kalamdhad, A.S. Effect of Different Livestock Dungs as Inoculum on Food Waste Anaerobic Digestion and Its Kinetics. Bioresour. Technol. 2015, 180, 237–241. [Google Scholar] [CrossRef]
  4. Amani, T.; Nosrati, M.; Sreekrishnan, T.R. Anaerobic Digestion from the Viewpoint of Microbiological, Chemical, and Operational Aspects—A Review. Environ. Rev. 2010, 18, 255–278. [Google Scholar] [CrossRef]
  5. Slimane, K.; Fathya, S.; Assia, K.; Hamza, M. Influence of Inoculums/Substrate Ratios (ISRs) on the Mesophilic Anaerobic Digestion of Slaughterhouse Waste in Batch Mode: Process Stability and Biogas Production. Energy Procedia 2014, 50, 57–63. [Google Scholar] [CrossRef] [Green Version]
  6. Zeb, I.; Ma, J.; Mehboob, F.; Kafle, G.K.; Amin, B.A.Z.; Nazir, R.; Ndegwa, P.; Frear, C. Kinetic and Microbial Analysis of Methane Production from Dairy Wastewater Anaerobic Digester under Ammonia and Salinity Stresses. J. Clean. Prod. 2019, 219, 797–808. [Google Scholar] [CrossRef]
  7. Deepanraj, B.; Sivasubramanian, V.; Jayaraj, S. Kinetic Study on the Effect of Temperature on Biogas Production Using a Lab Scale Batch Reactor. Ecotoxicol. Environ. Saf. 2015, 121, 100–104. [Google Scholar] [CrossRef] [PubMed]
  8. Piechota, G. Multi-Step Biogas Quality Improving by Adsorptive Packed Column System as Application to Biomethane Upgrading. J. Environ. Chem. Eng. 2021, 9, 105944. [Google Scholar] [CrossRef]
  9. Piechota, G. Removal of Siloxanes from Biogas Upgraded to Biomethane by Cryogenic Temperature Condensation System. J. Clean. Prod. 2021, 308, 127404. [Google Scholar] [CrossRef]
  10. Kazimierowicz, J.; Zieliński, M.; Dębowski, M. Influence of the Heating Method on the Efficiency of Biomethane Production from Expired Food Products. Fermentation 2021, 7, 12. [Google Scholar] [CrossRef]
  11. Kazimierowicz, J.; Dzienis, L.; Dębowski, M.; Zieliński, M. Optimisation of Methane Fermentation as a Valorisation Method for Food Waste Products. Biomass Bioenergy 2021, 144, 105913. [Google Scholar] [CrossRef]
  12. Córdoba, V.; Fernández, M.; Santalla, E. The Effect of Substrate/Inoculum Ratio on the Kinetics of Methane Production in Swine Wastewater Anaerobic Digestion. Environ. Sci. Pollut. Res. 2018, 25, 21308–21317. [Google Scholar] [CrossRef] [PubMed]
  13. Ma, X.; Jiang, T.; Chang, J.; Tang, Q.; Luo, T.; Cui, Z. Effect of Substrate to Inoculum Ratio on Biogas Production and Microbial Community During Hemi-Solid-State Batch Anaerobic Co-Digestion of Rape Straw and Dairy Manure. Appl. Biochem. Biotechnol. 2019, 189, 884–902. [Google Scholar] [CrossRef]
  14. Li, Y.; Jin, Y.; Borrion, A.; Li, J. Influence of Feed/Inoculum Ratios and Waste Cooking Oil Content on the Mesophilic Anaerobic Digestion of Food Waste. Waste Manag. 2018, 73, 156–164. [Google Scholar] [CrossRef] [PubMed]
  15. Kim, H.W.; Han, S.K.; Shin, H.S. The Optimisation of Food Waste Addition as a Co-Substrate in Anaerobic Digestion of Sewage Sludge. Waste Manag. Res. 2003, 21, 515–526. [Google Scholar] [CrossRef]
  16. Raposo, F.; Borja, R.; Martín, M.A.; Martín, A.; de la Rubia, M.A.; Rincón, B. Influence of Inoculum–Substrate Ratio on the Anaerobic Digestion of Sunflower Oil Cake in Batch Mode: Process Stability and Kinetic Evaluation. Chem. Eng. J. 2009, 149, 70–77. [Google Scholar] [CrossRef]
  17. Yu, Q.; Liu, R.; Li, K.; Ma, R. A Review of Crop Straw Pretreatment Methods for Biogas Production by Anaerobic Digestion in China. Renew. Sustain. Energy Rev. 2019, 107, 51–58. [Google Scholar] [CrossRef]
  18. Mu, Y.; Wang, G.; Yu, H.-Q. Kinetic Modeling of Batch Hydrogen Production Process by Mixed Anaerobic Cultures. Bioresour. Technol. 2006, 97, 1302–1307. [Google Scholar] [CrossRef]
  19. Ghimire, A.; Luongo, V.; Frunzo, L.; Lens, P.N.L.; Pirozzi, F.; Esposito, G. Biohythane Production from Food Waste in a Two-Stage Process: Assessing the Energy Recovery Potential. Environ. Technol. 2021, 1–7. [Google Scholar] [CrossRef]
  20. Park, Y.; Hong, F.; Cheon, J.; Hidaka, T.; Tsuno, H. Comparison of Thermophilic Anaerobic Digestion Characteristics between Single-Phase and Two-Phase Systems for Kitchen Garbage Treatment. J. Biosci. Bioeng. 2008, 105, 48–54. [Google Scholar] [CrossRef]
  21. Baird, R.; Bridgewater, L. Standard Methods for the Examination of Water and Wastewater, 23rd ed.; American Public Health Association Water Works Association (APHA), American Water Works Association (AWWA), Environment Federation (WEF): Washington, DC, USA, 2017. [Google Scholar]
  22. Iglesias Jiménez, E.; Pérez García, V. Relationships between Organic Carbon and Total Organic Matter in Municipal Solid Wastes and City Refuse Composts. Bioresour. Technol. 1992, 41, 265–272. [Google Scholar] [CrossRef]
  23. Mota, V.T.; Santos, F.S.; Araújo, T.A.; Amaral, M.C.S. Evaluation of Titration Methods for Volatile Fatty Acids Measurement: Effect of the Bicarbonate Interference and Feasibility for the Monitoring of Anaerobic Reactors. Water Pract. Technol. 2015, 10, 486–495. [Google Scholar] [CrossRef]
  24. Esposito, G.; Frunzo, L.; Panico, A.; Pirozzi, F. Enhanced Bio-Methane Production from Co-Digestion of Different Organic Wastes. Environ. Technol. 2012, 33, 2733–2740. [Google Scholar] [CrossRef] [PubMed] [Green Version]
  25. Chatterjee, T.; Chatterjee, B.K.; Majumdar, D.; Chakrabarti, P. Antibacterial Effect of Silver Nanoparticles and the Modeling of Bacterial Growth Kinetics Using a Modified Gompertz Model. Biochim. Biophys. Acta Gen. Subj. 2015, 1850, 299–306. [Google Scholar] [CrossRef]
  26. Gibson, A.M.; Bratchell, N.; Roberts, T.A. Predicting Microbial Growth: Growth Responses of Salmonellae in a Laboratory Medium as Affected by PH, Sodium Chloride and Storage Temperature. Int. J. Food Microbiol. 1988, 6, 155–178. [Google Scholar] [CrossRef]
  27. Gompertz, B. On the Nature of the Function Expressive of the Law of Human Mortality, and on a New Mode of Determining the Value of Life Contingencies. R. Soc. 1825, 115, 1–23. [Google Scholar]
  28. Ghimire, A.; Sposito, F.; Frunzo, L.; Trably, E.; Escudié, R.; Pirozzi, F.; Lens, P.N.L.; Esposito, G. Effects of Operational Parameters on Dark Fermentative Hydrogen Production from Biodegradable Complex Waste Biomass. Waste Manag. 2016, 50, 55–64. [Google Scholar] [CrossRef]
  29. Cheah, Y.K.; Vidal-Antich, C.; Dosta, J.; Mata-Álvarez, J. Volatile Fatty Acid Production from Mesophilic Acidogenic Fermentation of Organic Fraction of Municipal Solid Waste and Food Waste under Acidic and Alkaline pH. Environ. Sci. Pollut. Res. 2019, 26, 35509–35522. [Google Scholar] [CrossRef] [Green Version]
  30. Li, L.; He, Q.; Zhao, X.; Wu, D.; Wang, X.; Peng, X. Anaerobic Digestion of Food Waste: Correlation of Kinetic Parameters with Operational Conditions and Process Performance. Biochem. Eng. J. 2018, 130, 1–9. [Google Scholar] [CrossRef]
  31. Yin, D.; Liu, W.; Zhai, N.; Li, J. Influence of pH Controlling on Fermentation Performance in Kitchen Waste and Cow Manure. Energy Sources Part A Recover. Util. Environ. Eff. 2019, 43, 2339–2351. [Google Scholar] [CrossRef]
  32. Souli, I.; Liu, X.; Lendormi, T.; Chaira, N.; Ferchichi, A.; Lanoisellé, J.L. Anaerobic Digestion of Waste Tunisian Date (Phoenix Dactylifera L.): Effect of Biochemical Composition of Pulp and Seeds from Six Varieties. Environ. Technol. 2020, 102, 1–13. [Google Scholar] [CrossRef] [PubMed]
  33. Feng, L.; Li, Y.; Chen, C.; Liu, X.; Xiao, X.; Ma, X.; Zhang, R.; He, Y.; Liu, G. Biochemical Methane Potential (BMP) of Vinegar Residue and the Influence of Feed to Inoculum Ratios on Biogas Production. BioResources 2013, 8, 2487–2498. [Google Scholar] [CrossRef]
  34. Chen, Y.; Luo, J.; Yan, Y.; Feng, L. Enhanced Production of Short-Chain Fatty Acid by Co-Fermentation of Waste Activated Sludge and Kitchen Waste under Alkaline Conditions and Its Application to Microbial Fuel Cells. Appl. Energy 2013, 102, 1197–1204. [Google Scholar] [CrossRef]
  35. Blasius, J.P.; Contrera, R.C.; Maintinguer, S.I.; Alves de Castro, M.C.A. Effects of Temperature, Proportion and Organic Loading Rate on the Performance of Anaerobic Digestion of Food Waste. Biotechnol. Rep. 2020, 27, e00503. [Google Scholar] [CrossRef] [PubMed]
  36. Li, Y.; Zhang, R.; Liu, X.; Chen, C.; Xiao, X.; Feng, L.; He, Y.; Liu, G. Evaluating Methane Production from Anaerobic Mono- and Co-Digestion of Kitchen Waste, Corn Stover, and Chicken Manure. Energy Fuels 2013, 27, 2085–2091. [Google Scholar] [CrossRef]
  37. Shahbaz, M.; Ammar, M.; Zou, D.; Korai, R.M.; Li, X.J. An Insight into the Anaerobic Co-Digestion of Municipal Solid Waste and Food Waste: Influence of Co-Substrate Mixture Ratio and Substrate to Inoculum Ratio on Biogas Production. Appl. Biochem. Biotechnol. 2019, 187, 1356–1370. [Google Scholar] [CrossRef]
  38. Jiang, J.; Zhang, Y.; Li, K.; Wang, Q.; Gong, C.; Li, M. Volatile Fatty Acids Production from Food Waste: Effects of PH, Temperature, and Organic Loading Rate. Bioresour. Technol. 2013, 143, 525–530. [Google Scholar] [CrossRef]
  39. Liang, Y.; Yin, S.; Si, Y.; Zheng, Z.; Yuan, S.; Nie, E.; Luo, X. Effect of Pretreatment and Total Solid Content on Thermophilic Dry Anaerobic Digestion of Spartina Alterniflora. Chem. Eng. J. 2014, 237, 209–216. [Google Scholar] [CrossRef]
  40. Parra-Orobio, B.; Donoso-Bravo, A.; Torres-Lozada, P. Anaerobic Digestion of Food Waste. Predicting of Methane Production by Comparing Kinetic Models. Ing. y Compet. 2017, 19, 219–227. [Google Scholar]
  41. Srisowmeya, G.; Chakravarthy, M.; Nandhini Devi, G. Critical Considerations in Two-Stage Anaerobic Digestion of Food Waste—A Review. Renew. Sustain. Energy Rev. 2020, 119, 109587. [Google Scholar] [CrossRef]
  42. Lin, C.Y.; Chai, W.S.; Lay, C.H.; Chen, C.C.; Lee, C.Y.; Show, P.L. Optimization of Hydrolysis-Acidogenesis Phase of Swine Manure for Biogas Production Using Two-Stage Anaerobic Fermentation. Processes 2021, 9, 1324. [Google Scholar] [CrossRef]
  43. Dareioti, M.A.; Vavouraki, A.I.; Tsigkou, K.; Kornaros, M. Assessment of Single-vs. Two-Stage Process for the Anaerobic Digestion of Liquid Cow Manure and Cheese Whey. Energies 2021, 14, 5423. [Google Scholar] [CrossRef]
  44. Rivière, D.; Desvignes, V.; Pelletier, E.; Chaussonnerie, S.; Guermazi, S.; Weissenbach, J.; Li, T.; Camacho, P.; Sghir, A. Towards the Definition of a Core of Microorganisms Involved in Anaerobic Digestion of Sludge. ISME J. 2009, 3, 700–714. [Google Scholar] [CrossRef] [PubMed] [Green Version]
  45. Owamah, H.I.; Ikpeseni, S.C.; Alfa, M.I.; Oyebisi, S.O.; Gopikumar, S.; David Samuel, O.; Ilabor, S.C. Influence of Inoculum/Substrate Ratio on Biogas Yield and Kinetics from the Anaerobic Co-Digestion of Food Waste and Maize Husk. Environ. Nanotechnol. Monit. Manag. 2021, 16, 100558. [Google Scholar] [CrossRef]
  46. Zahan, Z.; Othman, M.Z.; Muster, T.H. Anaerobic Digestion/Co-Digestion Kinetic Potentials of Different Agro-Industrial Wastes: A Comparative Batch Study for C/N Optimisation. Waste Manag. 2018, 71, 663–674. [Google Scholar] [CrossRef]
  47. López, I.; Benzo, M.; Passeggi, M.; Borzacconi, L. A Simple Kinetic Model Applied to Anaerobic Digestion of Cow Manure. Environ. Technol. 2021, 42, 3451–3462. [Google Scholar] [CrossRef]
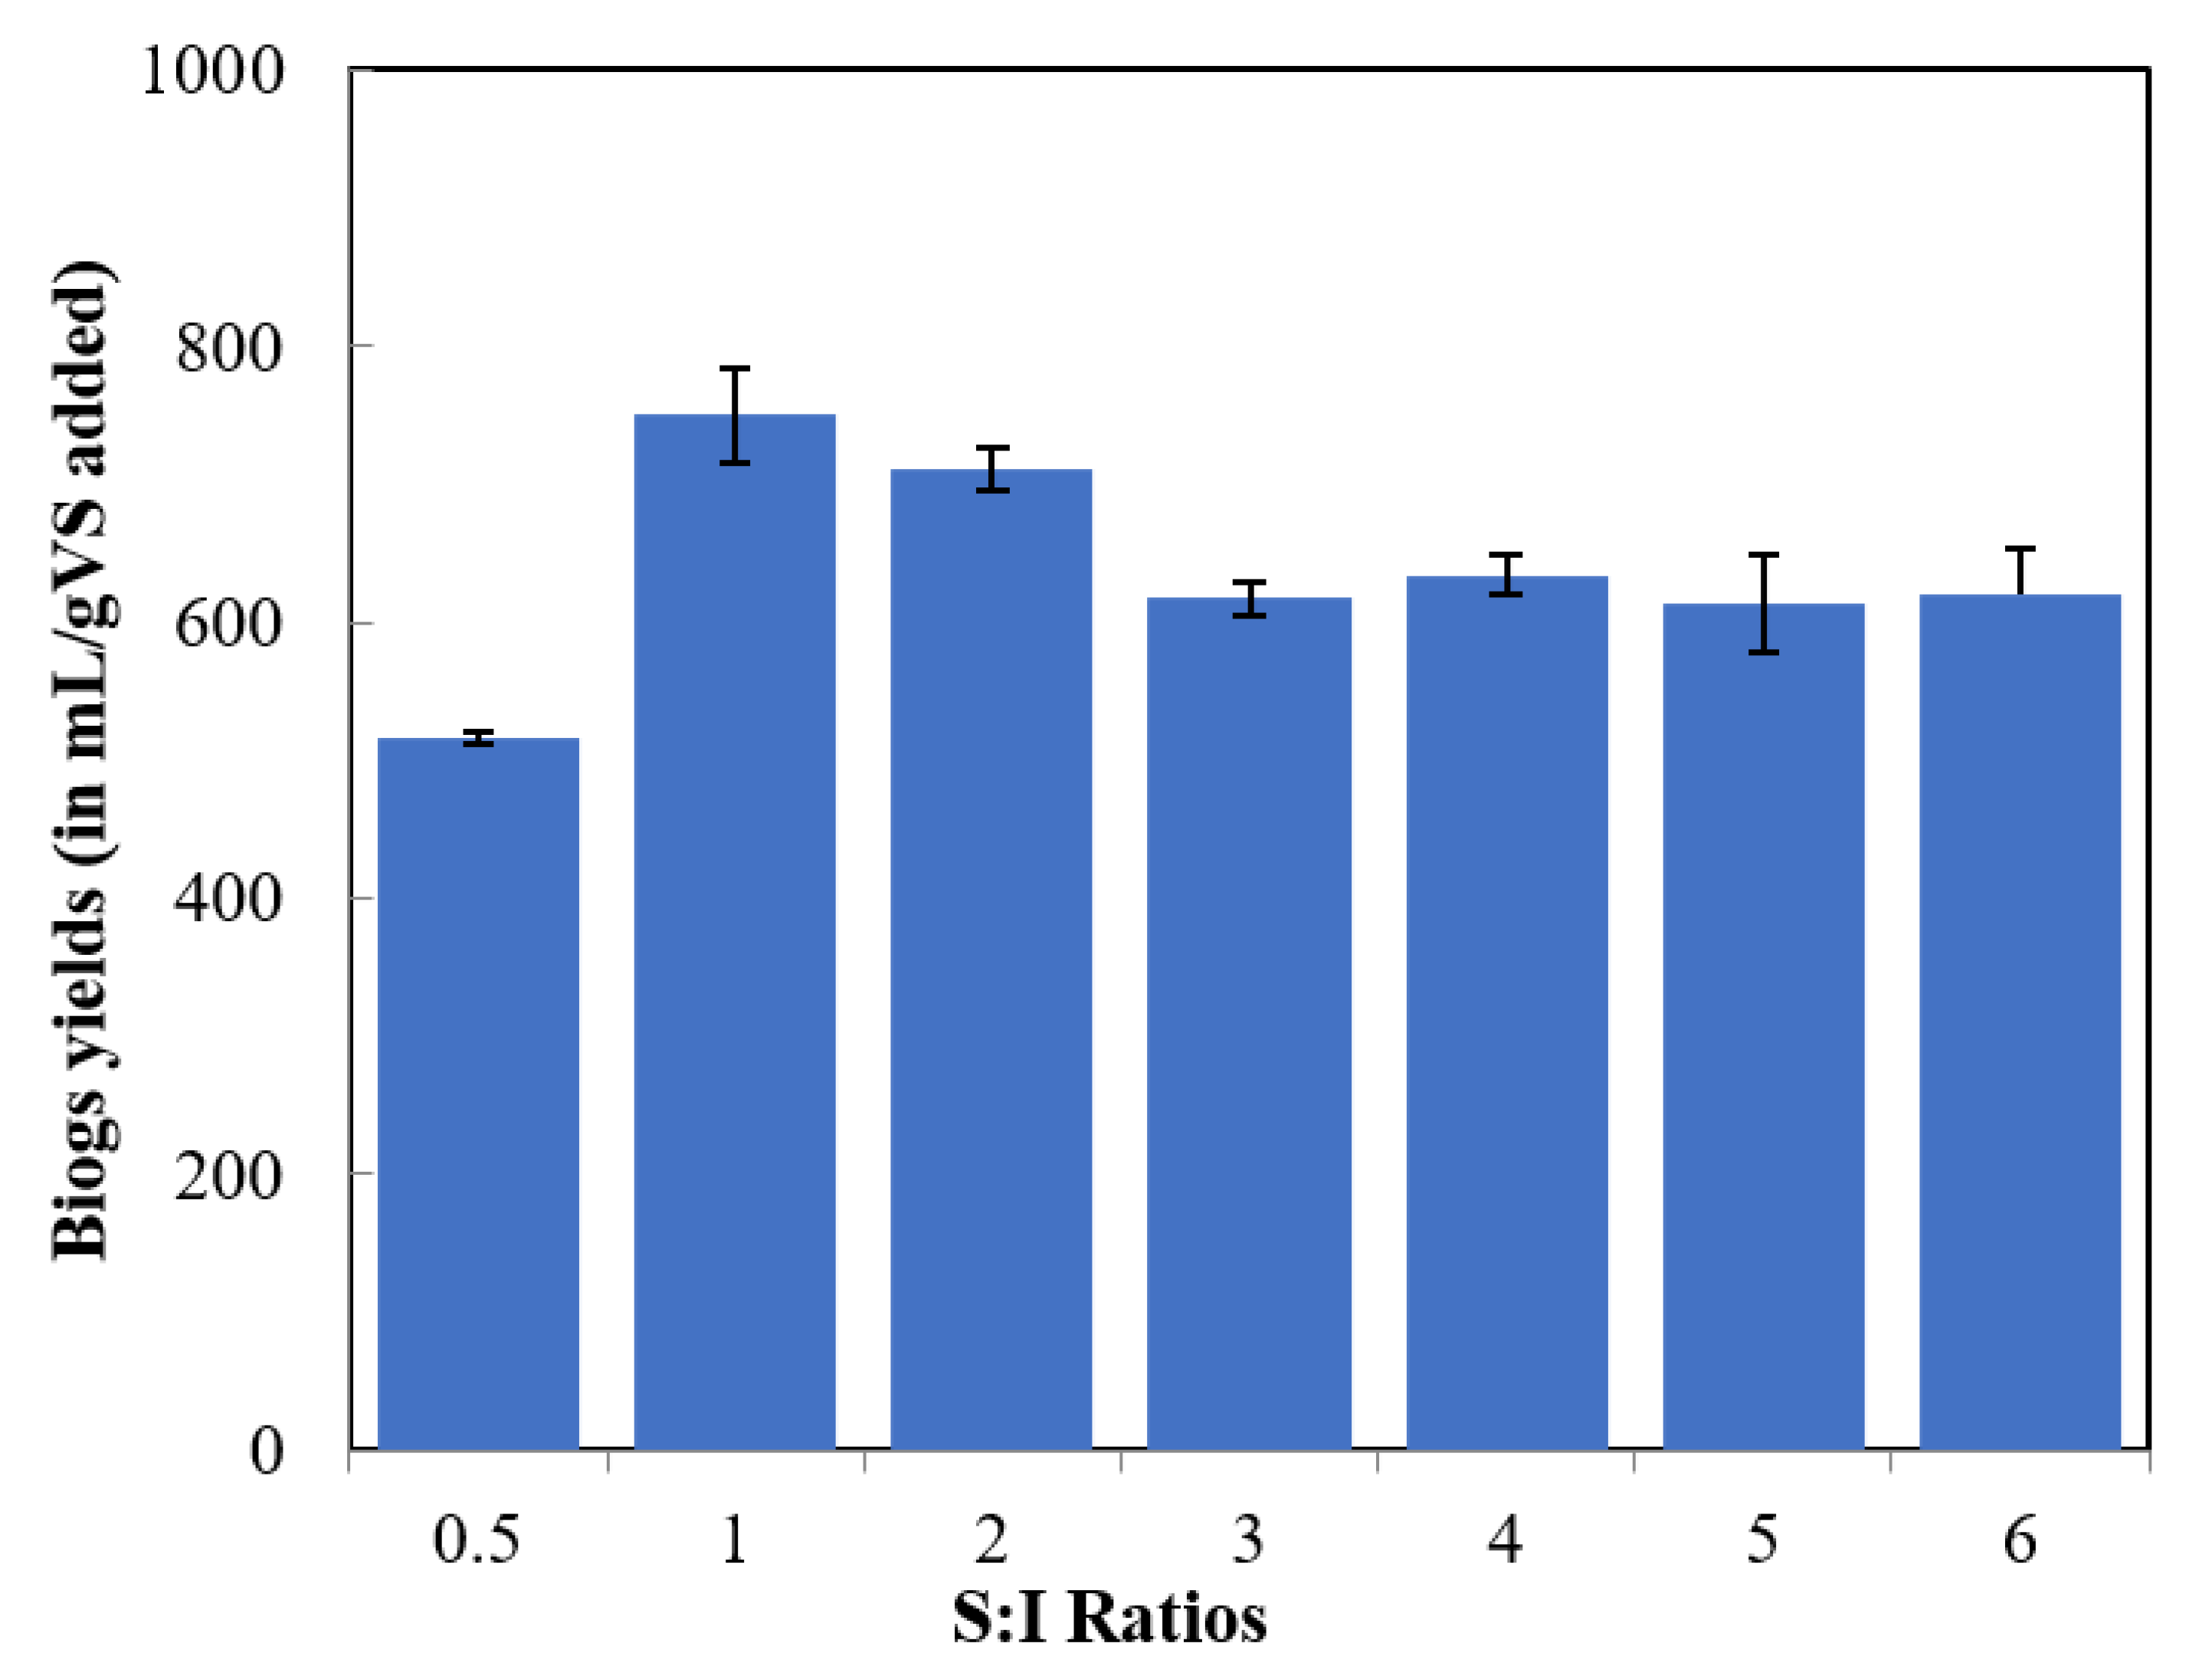
Figure 1. Biogas (Carbon dioxide scrubbed) yields per g volatile solids (VS) of food waste (FW) added at different S:I (Substrate: Inoculum) ratios.
Energies 15 00834 g001
Figure 2. Observed and predicted biogas (scrubbed) yields at S:I ratios (A) 0.5, (B) 1, (C) 2, (D) 3, (E) 4, (F) 5 and (G) 6, using the first-order kinetic and the modified Gompertz model.
Energies 15 00834 g002
Figure 3. Methane and carbon dioxide composition of daily biogas (scrubbed) production from experiments.
Energies 15 00834 g003
Table 1. Characteristics of the FW and inoculum used in the study.
ParametersUnitsFWInoculum
Total solids (TS)%15.94 ± 0.040.22 ± 0.01
Volatile solids (VS)%14.50 ± 0.160.09 ± 0.01
VS/TS 90.84 ± 1.2043.05 ± 0.96
pH 4.36 ± 0.018.08 ± 0.01
Total chemical oxygen demand (TCOD)mg/L1202.00 ± 54.00NA
Total organic carbon (TOC)mg/L80,432.15 ± 87.00526.99 ± 1.00
Total volatile fatty acids (TVFA)mg/LNA364.00 ± 7.00
Total alkalinity (TA)mg/LNA2000.00 ± 16.00
TVFA/TA ratio NA0.18 ± 0.01
Densityg/cm31.06 ± 0.020.99 ± 0.01
NA—Not analyzed.
Table 2. VS removal efficiencies and end pH change in tests with different S:I ratios.
S:IVS Removal %Initial pH of Digestion MixtureFinal pH of Digestion MixtureTime Required for 95% of Biogas Yield (in Days)
0.526.21 ± 0.217.847.2120.26
151.87 ± 0.907.797.1913.27
262.97 ± 4.297.707.1915.41
374.71 ± 0.627.717.3720.95
470.66 ± 0.117.587.5224.24
576.97 ± 1.647.477.6029.69
678.80 ± 1.177.457.8638.96
010.43 ± 9.698.089.12
Table 3. Parameters estimated from the fitting of the first-order kinetic and the modified Gompertz model with observed data from tests with AD of FW under mesophilic conditions and different S:I ratios.
ParametersUnitsS:I Ratios
0.5123456
First-order kinetic model
Biogas production rate constant (first order disintegration rate constant) (k)1/d0.140.170.140.100.090.070.05
Standard error 0.670.792.324.857.038.7711.55
R2 0.730.550.630.730.750.800.87
Experimental biogas yieldNmL/gVS 464.01674.37638.88555.13570.14551.58556.78
Predicted biogas yield (Go)NmL/gVS455.97668.65650.40584.85605.27601.64645.12
Difference between measured and predicted gas yield%1.730.851.805.356.169.0815.87
Modified Gompertz model
Maximum biogas production rate (Rmax)NmL/d6.4325.2040.7539.6045.5844.8342.03
RmaxNmL/gVS.d45.2188.5671.6046.3840.0531.5124.62
Lag phase (L)d−2.76−0.310.0300.20−0.25−0.72−1.15
Standard error 0.771.031.182.854.685.988.08
R2 0.680.650.560.670.720.790.88
Experimental biogas yieldNmL/gVS 464.01674.37638.88555.13570.14551.58556.78
Predicted biogas yield (M)NmL/gVS451.62653.17634.02563.04581.61571.41588.40
Difference between measured and predicted gas yield%2.673.140.761.422.013.605.68
Time to undergo 95% of yield (t95)d20.2613.2715.4120.9524.2429.6938.96
Publisher’s Note: MDPI stays neutral with regard to jurisdictional claims in published maps and institutional affiliations.