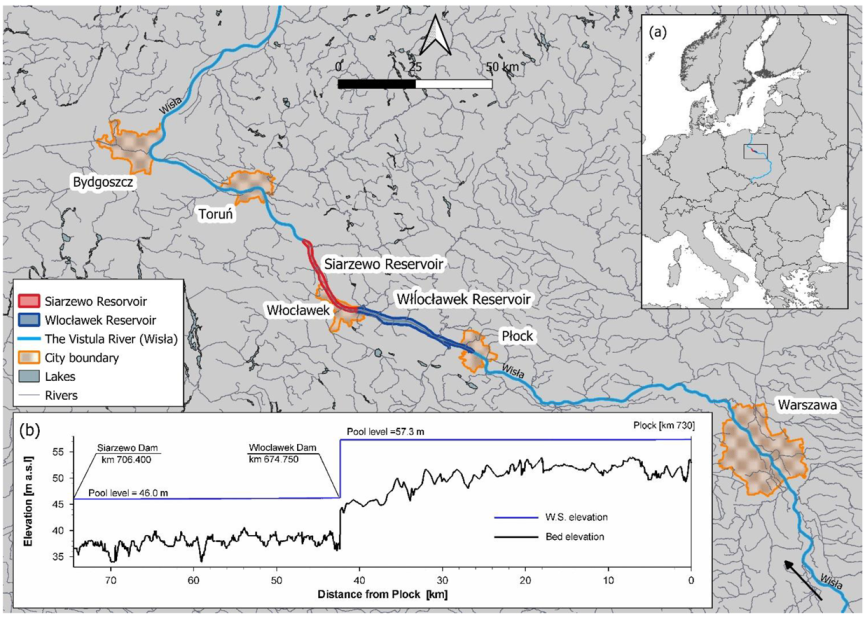
Article

The Application of the Thermal Stabilization Prompted by the Ice Cover Expansion Considering the Energy Production Optimization in the Dam-Reservoir Coupled Systems on the Vistula River

Department of Civil and Environmental Engineering, Gdańsk University of Technology, Narutowicza 11/12, 80-233 Gdańsk, Poland
*
Author to whom correspondence should be addressed.
Energies 2022, 15(3), 823; https://doi.org/10.3390/en15030823
Submission received: 11 December 2021 / Revised: 17 January 2022 / Accepted: 18 January 2022 / Published: 24 January 2022
(This article belongs to the Special Issue Hydropower in the East European Region: Challenges and Opportunities)

Abstract

:
In this study, the thermal stabilization of a water resource together with an energy production optimization in the power plant of the dam–reservoir coupled system is conducted. This coupled dam system is designed to consist of a primary (Włocławek) and secondary (Siarzewo) dam due to the erosion control aspect. The other beneficial aspect of this coupled dam design is to have an additional power plant, with the aim of achieving more efficient renewable energy production. One of the factors to be included in the conditions influencing the energy production is the ice formation in the reservoir and tailwater due to the hydrodynamic and meteorological conditions of the site location. Frazil formation and jam may reduce the power plant efficiency. The concept of thermal stabilization, based on the previous studies, refers to providing the ice cover in the reservoir section of a dam to isolate the water from thermal condition. In this research, the ice cover expansion is triggered by the discharge reduction over a specific time and the entire study site. The optimized discharge for stimulating the ice cover through the night was found based on the results, leading to the desired thermal stabilization. This power loss emerged by reduced water withdrawal in the specific time during the day (nighttime), and will be remedied by the more suitable hydrodynamic condition over winter.

1. Introduction

River ice is usually considered as a phenomenon which needs to be controlled to eliminate damage to the water basins of the water bodies and the structures installed in those areas. Needless to say, accounting for physical properties of the ice, it appears feasible to take advantage of its typical characteristics associated with its specific type of area enlargement at the water bodies. At the duration of freeze up (water surface thermal reduction to 0 °C, and continuing the process), diverse types of river ice are expected based upon water turbulence intensification. In low flow velocities, on account of insignificant turbulence, the static ice is distributed across the surface in either stationary or moving ice sheets, whereby the ice sheet emergence establishes prior to the cross-sectional average water temperature reaching the freezing point [1,2].
Static ice formation in low-velocity of the flow is observed in reservoirs of the dams. Changing the water supply in hydropower facility reservoirs is a common practical aspect. Throughout freeze up process, discharge depletion is spotted [3]. This reduction of the discharge may comfort the ice cover expansion. As soon as the ice cover take shape, its underside is moderately smoothed, resulting in remarkable hydraulic resistance. This presents utility in hydropower production during higher water release, to eliminate the risk of elevated water surface causing ice break up [4].
It should be noted that flowing skim ice and frazil are the fundamental types of ice run [5]. These two classifications of ice running can be associated to the reservoirs. In supercooled water, frazil is often in the active zone, and can conglomerate in larger particles and attach to different turbine modules and penstock [6]. The advanced continuation of this pattern of ice flow in the backwater ice jam zone leads to the emergence of hanging dams, significant water level changes, and difficulties in hydropower station operation [7]. In winter, the inflow to the reservoir can be blocked by ice jam resulting from break ups, diminishing the flow and disrupting power generation [8]. It is also noteworthy to mention that one of the major complications is related to frazil ice accumulation in trash racks, which may happen immediately, and results in blocking the flow to the intake [9]. Moreover, in this season, the storage capacity of the reservoir is only partially utilized due to the ice formation in the reservoir and the winter baseflow reduction [10]. Bo et al. suggested that more water needs to be carried before than during the ice period, per se, to keep the ice cover continuous [3].
Once the water is covered by the ice, the temperature remains the same at roughly 4 °C. Ice cover isolates water from exchanging energy with the atmosphere. In the meantime, the water is more prone to be heated by the bed and balanced at this temperature [11]. The isolation also dissipates the frazil ice under cover. Stable ice cover needs to be developed in the low flow section of the reservoir to the furthest section upstream wherein higher velocity is observed. At these reaches, it is difficult for a stable ice cover to form due to high turbulence [12]. In terms of shortening the energy losses related to ice cover development, it is of the utmost importance to generate a steady and smooth cover to the farthest extent possible. After the ice cover is formed, the next step of raising power production efficiency is to regulate discharge of the dam which does not necessarily mean escalating the discharge [13]. Instant discharge elevation destabilizes and fragments the ice cover and gives rise to subsequent ice jamming downstream of the water intake [14]. Regulating the large capacity of reservoirs can be performed through the high head operation system since the temperature stratification is more likely to happen at higher capacities [15]. It is also advantageous from a power production point of view since the head water is less likely to be very low. Feasible conditions to generate ice cover would include low temperatures, due to the applicability of heat exchange between the water surface and the atmosphere. During the winter time in the Northern hemisphere, the long wave radiation is the most prominent type. The short solar radiation in this season is reduced due to the low solar altitude, leading to the shorter operation of the sun during the day time and significant attenuation. Therefore, a resultant condition would be the nighttime, thanks to the lack of short-wave radiation. Furthermore, at this time of the day, a clear sky on account of the absence of back radiation may further soothe the cover progression [16,17].
Previous studies have taken into account the method of water level fluctuation in the reservoir storage with the aim of regulating ice jam formation behind the dam. Apart from the climate effect, the hydropower facilities’ plans and the level of power generation are likely to affect the ice process in regulated rivers. Therefore, Timalsina et al. scrutinized the climate fluctuation in terms of precipitation and temperature in the arrangement of various climate models on the river ice. They employed process based models for an assessment of reservoir outlet and watersheds [18]. Due to the ice jamming in NYPA and OH power generating facilities and lack of existing suitable ice transport numerical models, Su et al. performed a 2-D dynamic ice transport and jamming simulations, at the aim of enhancement the river ice movement features. They resolved to shorten the diversion of ice escape channels with the aim to reduce possible ice groundings and facilitate ice passage through the intake, in turn raising the ice carrying capacity. The diversion trimming correlated to the peak discharge volume and the duration [19]. For the coupled aims of ice flooding control and sufficient power production, Chang et al. addressed an optimization model for the linked operation of two reservoirs in the Yellow River. This approach involved maintaining a practicable ice control storage volume of one of the reservoirs by means of reaching the maximum water level in each of the late months, so as to both pacify and maximize the flow output [20].
Huang et al. reviewed the existing formulation by means of 2-D thermodynamic river ice simulation for border ice development, taking into account field data related to the St. Lawrence upper reach in the vicinity of the power dam location whose condition was suitable for examining a freeze up model. At the initial stage of the examination, border ice progressed prior to the ice run, progressing upstream of the dam, due to the accumulation of the ice floes. The ice cover could not develop in the high velocity area, downstream of the upper part dam, so the outflow was reduced with the aim of further expansion of the ice cover [21].
Vyshnevskyi and Shevchuk employed Sentinel-2, Landsat satellite image data in addition to hydrological and meteorological data to study the ice cover data in Dnipro reservoir regarding the effect of hydropower plants upstream and the river runoffs [22]. Lindenchmidt et al. aimed to alleviate the ice breakup and jamming along the Red River by cutting the ice cover, using RADARSAT-2 satellite images which were collected to analyze the ice thickness [23]. To establish an illustration of the ice break up phenomena, Altena and Kääb excluded river ice velocities from the remote sensing data. Implementing resolution imagery of PROBA-V, they faced difficulties in tracking sparse ice debris at the later stage of ice break up with a reduced diameter of ice particles at the surface [24]. Kouraev et al. studied the long-term development of the ice regime, taking into account historical data and the recent satellite altimetry and radiometry for Lake Baikal. Longer ice duration is parallel to the long period of time sequences. Estimation of the relationship between ice formation variables and duration of the ice events suggests that the air temperature is the most influential factor affecting the ice regime [25].
This approach for the stimulation of ice cover expansion, by means of the increasing the water level in the reservoirs, has been previously implemented in the St. Lawrence River of the United States [13] and Canada [26,27]. Less et al., regarding the effect of frazil formation in the blockage of a power plant system and hydropower production loss, observed the leading edge movement of the ice under the influence of dampened hydraulic conditions in the Nelson River of Manitoba. These types of studies can support numerical simulations with the aim of discharge optimization [27]. This method has not commonly been adopted in Eastern Europe [28,29]. However, this concept was implemented in Scandinavia for hydropower development [8,30]. In this study, a series of simulations were planned in order to find the optimum outflow. The focus of study was also on the expansion and thickness of the ice cover for hydropower generation incentives, and to eliminate the power production losses.
The main goal of this study was to find the optimized discharge for the wintertime energy production in the dam–reservoir coupled system. The goal was achieved by applying validated numerical modelling to estimate the energy loss due to the lack of maintaining the water discharge in the system, over the winter season. The cost–benefit analysis for the energy production was performed.

2. Materials and Methods

2.1. Site Description

Włocławek reservoir is located in the Lower Vistula River (674,750 km), with a water body volume of 400 million m 3 and an approximate length of 40 km (Figure 1) [31]. This reservoir is a part of a hydropower system on the Vistula River which consists of 8 low-headed dams in the lower reach of the river. Downstream of the Włocławek reservoir, a hydraulic support facility is required for the minimizing the erosion and reducing the tailwater level. About 31 km from the existing dam, a secondary dam is planned (in km 706,400), which holds a head of 7.8 m. One bridge structure is positioned (at about 4.5 km from the Włocławek dam) between the two existing and secondary dam [32]. In the winter season, the water level increases due to the different types of ice formation. To prohibit frazil formation and supercooling condition in the reservoir (isolating the water from the severe meteorological condition and heat loss), a stable, smooth ice cover needs to be extended along the planned reservoir surface. In this study, the ice cover extension in this mentioned reservoir is evaluated to prevent noticeable head loss in the power plant energy production set in the Włocławek dam. The ice phenomena and ice cover duration in the Lower Vistula River has a decreasing trend based on the historical observations [33]. The creation of the dams changes the thermal regime and causes further impacts on the ice phenomena.
These coupled dams are going to be arranged so that the tailwater of the existing dam forms the reservoir zone of the secondary dam. For a stable ice cover development along the reservoir surface, the water discharge needs to be decreased, resulting in the power production loss at the Włocławek Dam. As the main object of the study, different expansion areas of the ice cover and the assigned head-loss will be evaluated. The optimum cover extension will be found accordingly. To perform the numerical simulation for the stationary ice evolution (progression from border ice to the ice cover by the influence of thermal exchange), the mathematical DynaRICE model is implemented [34]. Power production based on the simulated water head can be calculated as followed:
P = η ρ Q g H
where P is power ( MW ), Q water discharge through the power plant ( m 3 / s ) , η is the plant efficiency, ρ is the water density ( kg / m 3 ), g is acceleration due to gravity ( m / s 2 ), and H is head level at the power plant ( m ). Power plant efficiency parameter is not known, especially for the Siarzewo Dam. Thus, to avoid any further confusion, this parameter is assumed to be η = 1 .

2.2. Heat Exchange and the Ice Cover Formation

The ice cover increases the wetted perimeter, reduces the hydraulic radius, and decreases the cross-sectional area, which leads to resistance increment due to the additionally rough surface [16]. The increased resistance causes a rise of the water surface elevation along the river. Therefore, the cover formation and the increasing thickness during the process (frazil formation and border ice expansion) affects the extension of the backwater in the reservoir.
In rivers, heat is primarily exchanged through top water surface between air and water or ice. Net thermal radiation is bound up with solar and back radiation and evaporation, precipitation and conductive heat transmission. Due to the different terms required to be calculated based on this formulation, a linearized approach considering the air–water temperature difference and short wave radiation components comes in handy [35]. This modified model is known for the simplicity and well applicability, especially in long term simulations. The shortcoming of this method is in the daytime calculations, which does not concern this current study [36] due to the lack of cloudiness and nighttime. In view of all the components, long-wave radiation surpasses the remaining components in terms of magnitude [36]. Ice cover formation in this study occurred during the nighttime by the superiority of long-wave radiation, which illustrates the higher budget of this type of thermal exchange. Furthermore, long wave radiations are nonlinear components of thermal budget exchange [37]. Liu and Shen identified the simplified net rate heat emission formula as followed:
ϕ w a * = ϕ R w + α + β ( T w T a )
where ϕ R w is the short wave radiation dissipation rate from the water surface outside the atmosphere, while α , β and T w , T a are constants, and water and air temperature, respectively [37]. To this form, day temperature variations are not of significant importance. Therefore, the further simplified formulation is executed as follows. Since wind velocity is not calculated as part of this study, a constant value for α = 20 is taken into consideration [37].
ϕ * = α ( Τ W T a )
Border ice appears in low flow velocity and turbulence along the bank. Expansion of the border ice continues with the ice crystal nucleation at the adjacent of the initial super cooled layer subjected to the requisite temperature. The further extension of border ice cover links with thermal growth and frazil ice accumulation; the former identifies with static while the latter with dynamic ice cover formation [38]. Based on the higher depth of reservoirs in comparison with the rivers, minor velocity prevails, which leads to the reduced turbulence. Therefore, this investigation is dedicated to static ice cover formation and its impact on hydro power production. In this survey, the subsequent formula is used to examine the adequacy of the static ice formation condition [2,5]:
T w s = T w ϕ * 1130 u + b W
where T w s and T w   are the water surface and vertical directional averaged water temperature, respectively. Furthermore, ϕ is the heat loss rate to the atmosphere, u is the local depth-averaged water velocity, and W is the wind velocity at the 2 m elevation on the water surface. The b parameter correlates with surface width in the direction of the wind. To determine the stability of frazil particles, the values for turbulent fluctuation and ice crystal buoyant velocities ( υ z and   υ b , sequentially) are compared against [37]. For T w > 0   ° C , static ice cover forms, on the condition that T w s T c r ( T c r is the supercooled surface temperature threshold for skim ice development which needs to be calibrated for various sites). Meanwhile, at the same condition for depth-averaged temperature, skim ice run takes place, if   T c r < T w s < 0   ° C , and   υ b > υ z . υ b and υ z are turbulent fluctuation and ice crystal buoyant velocity, respectively, which are given as Equations (5) and (6) [2].
υ b = 0.025 T w s + 0.005
υ z = g 5 ( 0.7 C + 6 ) C u
where u is depth-averaged water velocity, C is Chezy’s coefficient, and g is gravitational acceleration. Equation (6) does not regard the effect of wind on the turbulent fluctuation velocity. Instead of the previous formula for υ z ,   Equation (6) is developed in terms of flow resistance connected to channel geometry and wind drag force [34].
υ z = [ ( C * g u n b R 1 / 6 ) + ( C D ρ a ρ w ) 3 / 2 W 3 ] 1 / 3
where, in the right-hand side term, C * is the ratio of fluctuation velocity to the shear velocity, while n b and R are bed Manning’s roughness coefficient and hydraulic radius, respectively. In the left-hand side term, C D = 1.55 × 10 3 and W are the wind drag coefficient 10 m above the water surface and wind velocity, respectively. ρ w and ρ a are the water and air density [2].
Calculating ice cover growth and water flow below floating ice cover connected with parameters, namely water depth, undersurface ice elevation, ice thickness, ice concentration, water and ice discharge, etc., is implemented by the DynaRICE model. Since the stress wave of the ice layer is dependent on water wave speed together with different characteristic wave speeds of water and ice equations, the two equations are not solved simultaneously [39]. For the more compound flow patterns, a two dimensional model is required [37]. The DynaRICE model makes use of Lagrangian smoothed particle hydrodynamics (SPH), for ice dynamic simulation with the advantage of importing the empirical indicators in transition conditions that cannot be simply imported in differential equations; e.g., converting the frazil into the ice cover [40].
If υ b < υ z and T w 0   ° C , then the frazil formation condition is satisfied. Frazil ice develops in flowing or turbulent water in supercooled condition. Ice crystals or nuclei are sourced from the seed ice crystals, e.g., ice fragments, cold airborne dust, and ice particles from the border ice entraining supercooled water. Next, in the flowing water, the frazil crystals are able to enter a deeper level of water and be carried downstream. Once seeded, particles will conglomerate in a dynamic temporal balance between heat release from frazil clustering and heat exchange among channel bed and overlying air [41,42].

2.3. Validation

The validation of the numerical simulation was achieved by the comparison between open water condition on 6 February 2021 (the satellite image, covering the area of the study) and the numerical model (Figure 2). With the aim of modelling validation, the row data were obtained from the Institute of Meteorology database. Based on the achieved data, the discharge at the upstream boundary was considered to be 830 m3/s, regarding the Włocławek gauging station data. This station is actually downstream of the reservoir, although due to the absence of tributaries between the two intake and outlet boundaries and the steady state condition for the simulation, the downstream discharge value used was the same as the input boundary condition. Downstream, the normal pool level of 57.3 was applied. Since the bed roughness of the reservoir was not reported, the conservative value of the 0.025 was applied for the Manning’s roughness coefficient on the entire bed. Furthermore, due to the fact that the ice thickness did not vary by time, Manning’s coefficients for the smooth cover and the frazil ice accumulation were calibrated to be 0.02 and 0.07 as the minimum and maximum value of ice roughness, respectively. In Figure 2, the thermal cover expansion is indicated by a border line. At the leading edge of the ice cover, an area of loose frazil accumulation was spotted, although it was still located on the surface. Up to this area was considered to be the open water zone. Passing the leading edge of the ice (beyond the border line tip), the ice cover with the hanging dam formation was noticed.
In Figure 2c, the border line of the open water area related to the observation date is located on the simulated cover expansion plan. On account of both observation (black line) and numerical simulation (Figure 2c), it has been found that both data show nearly the same location of the open water border. It can also be observed that the extension of the leading edge of the cover at the upstream is well reproduced by the numerical simulation. Moreover, the extension of the open water area and the border ice expansion seems roughly equivalent. The open water area for the numerical simulation and the observation are approximately 32.96 and 30.27 km 2 , respectively (It only shows 8% error for the modeling). This mentioned error can be referred to the old bathymetric related geometry (dating back to 1990s) and the errors in reading the blurred black ice extension from the satellite image.

3. Results

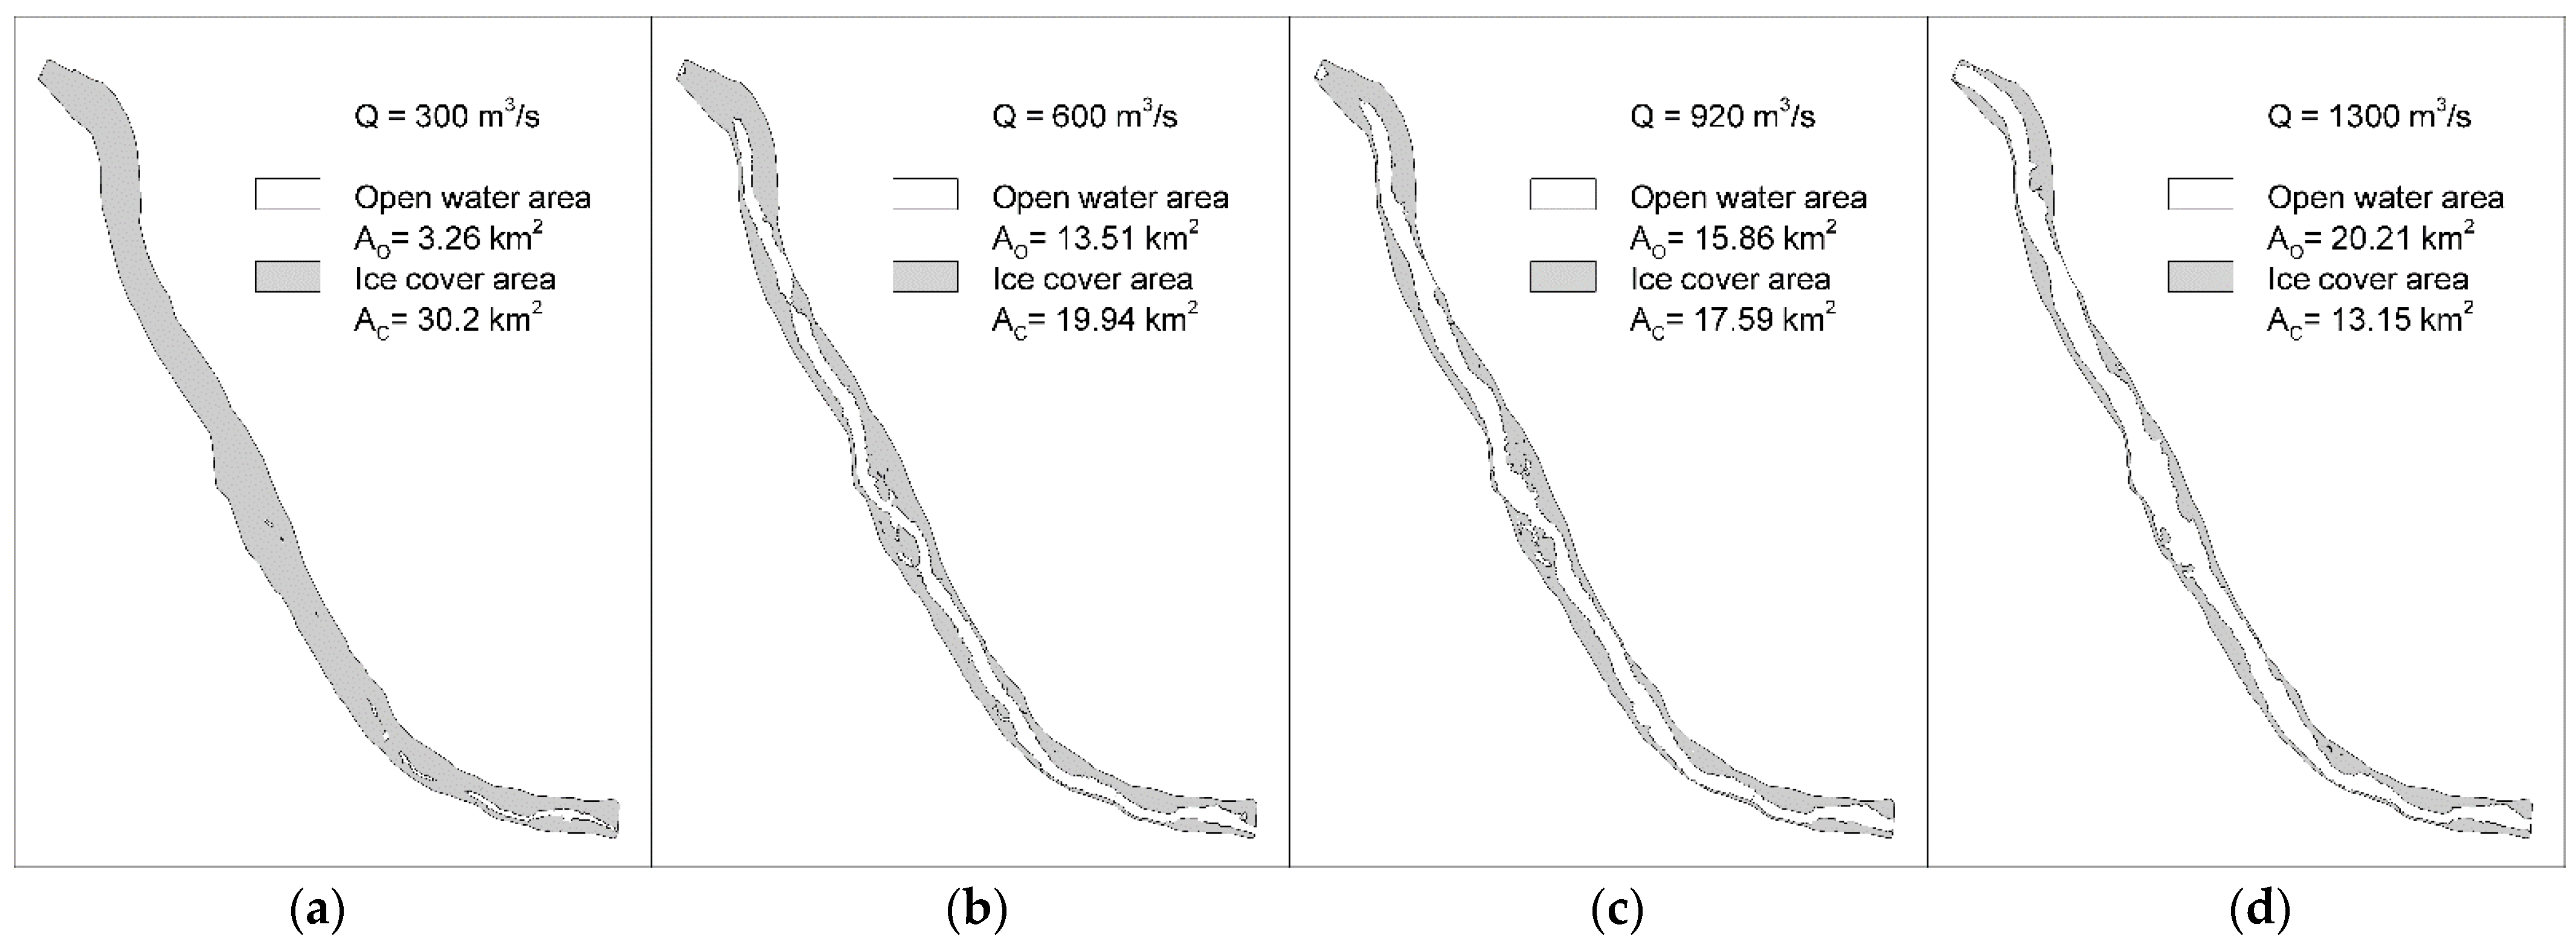
The effect of cover expansion on the downstream reservoir (Siarzewo) was studied. The aim was to evaluate the resultant open water area and jamming formation by means of low flow discharge of 300 m3/s from the Włocławek Dam, and following increasing outflow discharge through the whole domain (600, 920, and 1300 m3/s).
To develop a smoothed ice cover at the beginning of the winter season, thermal thickening is the most important process to be considered. This process starts with the frazil formation, forming the border ice along the domain. The exposure of the surface water to the atmosphere triggers the formation of the frazil ice (due to the reduction in the depth-averaged water temperature), especially in the temperatures closer to zero. In the low flow condition, frazil ice stays on the water surface, forming a thin, stationary ice sheet due to the no turbulence condition. In this situation, this ice cover isolates the water from the additional cooling process. On the other hand, if the water velocity increases, i.e., the cases of 600, 920, and 1300 m3/s, and as a result of water mixture over the depth, the frazil particles move to the surface. This action reduces the frazil concentration. For the different discharge magnitude, the extent of frazil accumulation near the borders was greater, by virtue of less turbulence, leading to the border ice formation. In line with the border ice formation, dynamic border ice may occur, due to the ice accumulation of surface ice particles along the channel or the main border ice line. The forces causing the accumulation are gravity and drag forces, as well as the interaction forces between the ice parcels [2].
To find the expansion of the static ice cover for the discharges, 300 (low flow), 600, 920 (average flow), and 1300 m3/s were evaluated. After the border ice is formed, it needs to remain for the whole winter, if the both hydrological and meteorological conditions remain the same. By the hydrological condition, it means the release of a large amount of water from Włocławek dam, leading to a surge in the water level and causing forced break up. Moreover, heat fluxes resulting from thermal condition variation lead to the ice cover deterioration. Simulated ice cover expansion at the reach section between two dams is presented in Figure 3. The simulation has been processed with the constant downstream water level (pool level equals to 46.0 m a.s.l.) and discharge (300, 600, 920 and 1300 m3/s), in line with the constant air temperature of −10 ° C . The results showed that the outflow discharge was capable of producing an open water channel along the domain, which was considered to be an area for frazil ice formation. Meanwhile, this open water area was minor if the discharge dropped to 300 m3/s, leading to the wrapping of nearly the entire domain with the smooth ice cover (the percentage of the ice cover on the entire area of the reservoir was 90.25%). The open water area was larger if the discharge level was at 1300 m3/s (the percentage of the ice cover area was 39.28%). Analysis indicated that the discharge of 1300 m3/s generated the greatest expansion of open water area and decrease of the ice cover after the full ice cover expansion. The cases of outflow discharges of 600 and 920 m3/s showed the most compatibility with the aim of this study. Ice cover percentages for the 600 and 920 m3/s of the discharge were 59.6% and 52.54%, respectively. The discharges of 600 and 920 m3/s were commonly observed during the core winter months. The lack of leading edge of the cover means the frazil crystals move downwards to the power plant intake and attach to the trash racks. This situation was not allowed. Thus, the 1300 m3/s discharge case is removed from the further analysis.
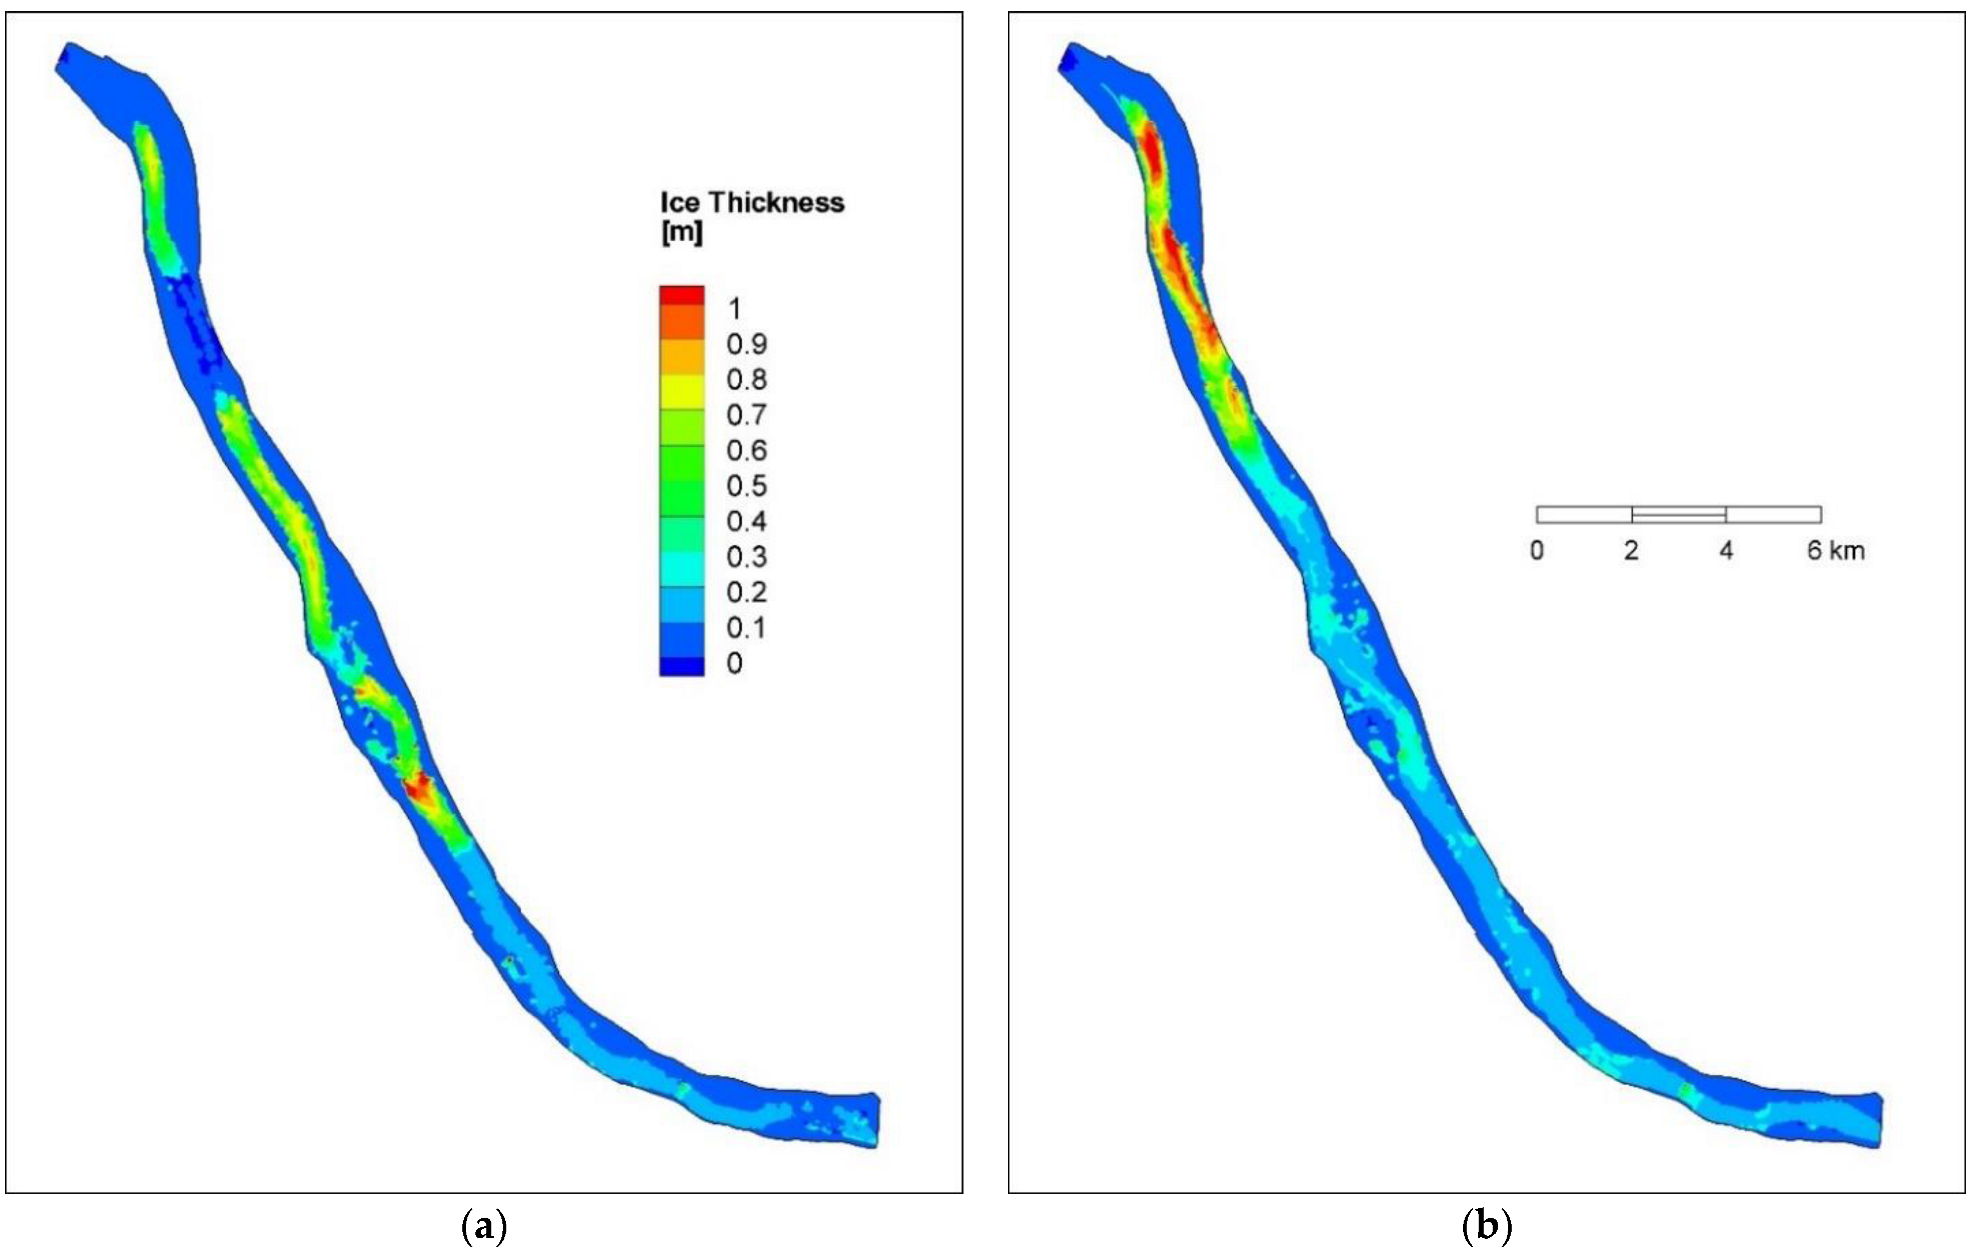
Another cause could be the inflowing ice affected by the water velocity and drag, giving rise to the downstream accumulation. In this study, the open water area is considered to be the frazil ice formation zone, and the dynamic ice processes cause the ice accumulation downstream of the reservoir. In Figure 4, the ice thickness after 600 and 920 m3/s discharge, without reducing the discharge to 300 m3/s, is provided. Needlesss to say, the water discharge for the both reservoirs was considered to be the same for each case. Therefore, the water discharge in the domain was considered to be constant. It can be observed in the Figure 4 that the ice accumulation in the case of 600 m3/s discharge was less regulated as a result of narrowness in the open water area, wherein the reservor section of the Siarzewo Dam is located.
As shown in Figure 4a, two thicker ice accumulation sections were observed in the reservoir section of the Siarzewo Dam. The upper section extended over the middle part of the domain. The extension of the concentrated ice accumulation to the upper section may have resulted in the backwater rise in the tailwater of the Włocławek Dam, reducing the head level of the dam. On the contrary, in the discharge of 920 m3/s, the ice accumulation was more regulated. However, thicker overall ice accumulation was observed (maximum 1 m) in the whole downstream domain. One reason leading to the more uniform ice accumulation in the case of 920 m3/s outflow was the open water channel in the middle longitudinal section of the domain producing a greater amount of frazil (in Figure 3 different open water area for frazil formation was observed). The other reason to be mentioned is that the hydrodynamic condition related to the 920 m3/s discharge case did not produce narrowness in the ice cover. In this wider open water area, the larger frazil amount moving to the surface flowed downstream of the doamin. Since the leading edge of the ice was located in a farther spot on the domain, the frazil starts to turn into cover, right behind the dam. Last but not least, the higher drag force on the underside of the ice caused the frazil parcels to proceed further downstream and the ice toe formation at the leading edge of the ice cover. The further accumulation upstream of the one near the leading edge of the ice could be related to the secondary circulation of the bending section of the domain, which shifted the accumulation towards the right bank. Due to the concentrating accumulation downstream of the domain, the backwater effect was less observed in the 920 m3/s discharge case, showing roughly the same tailwater level downstream of the Włocławek Dam. This can be observed in Figure 4 and Figure 5 and Table 1.

4. Discussion

Yapa and Shen concluded that reduced open water area leads to less frazil production and roughness, as well as power production loss (by forming the ice cover, the undercover frazil formation is less considered) [13]. The same trend was observed for the power production in this study. However, the power loss reduction following the ice cover formation may be observed after specific periods in the case of each discharge magnitude, as will be further discussed, based on the following tables.
In Table 1, power generation in both Włocławek and Siarzewo dams, in line with the power generation loss in Włocławek Dam, are provided (in the duration of 1 day and 60 days). The power production loss was based on the comparison between the power production under the condition of triggered ice cover formation and frazil ice formation. The power generation calculations were based on Equation (1), considering η = 1 . As shown in the tables, the pool level for both Włocławek and Siarzewo dams were assumed to be constant, considered as 46.0 and 57.3 m, respectively. The tailwater of the Siarzewo Dam was based on the existing reported data [43], and that of the Włocławek was according to the calculation. A slight difference between the pool level of Siarzewo and tailwater of Włocławek Dam was observed in the table, which was due the backwater effect. The head level implemented in the power production formula is the pool level subtracted by the tailwater. As determined from the results, tailwater was increased in the Włocławek Power Plant following the formation of the frazil ice. As a consequence, the head level was decreased, decreasing the power production amount. Although the changes in the instant power production efficiency may not be noticeable, the further modification during a day and a month were of a larger extent (Table 2). The head level of the Włocławek Dam could be due to the regulation of the tailwater of Włocławek Dam by means of planning a secondary dam (Siarzewo Dam), since this modification of energy production was not observed in Siarzewo Dam. The power production losses provided in the Table 1 are 22.6 and approximately 26 MWh per day at 600 and 920 m3/s. In comparison to the open water condition, the capacity of the Włocławek Dam decreased by 0.2 MW and 0.4 MW at 600 and 920 m3/s, respectively (which are roughly 0.3% and 0.4% differences), due to the existence of the ice cover.
The reduction of the tailwater was achieved through the nighttime operation, which was assumed to take 8 h. During these hours, flow on both dams was reduced, leading to less power generation. Since the power generation at two magnitudes of discharge (600 and 920 m3/s) was calculated, different amounts of power were lost, i.e., 796.9 MWh at 920 m3/s in comparison to 403.1 MWh at 600 m3/s of discharge were calculated for the 8 h duration of cover formation.
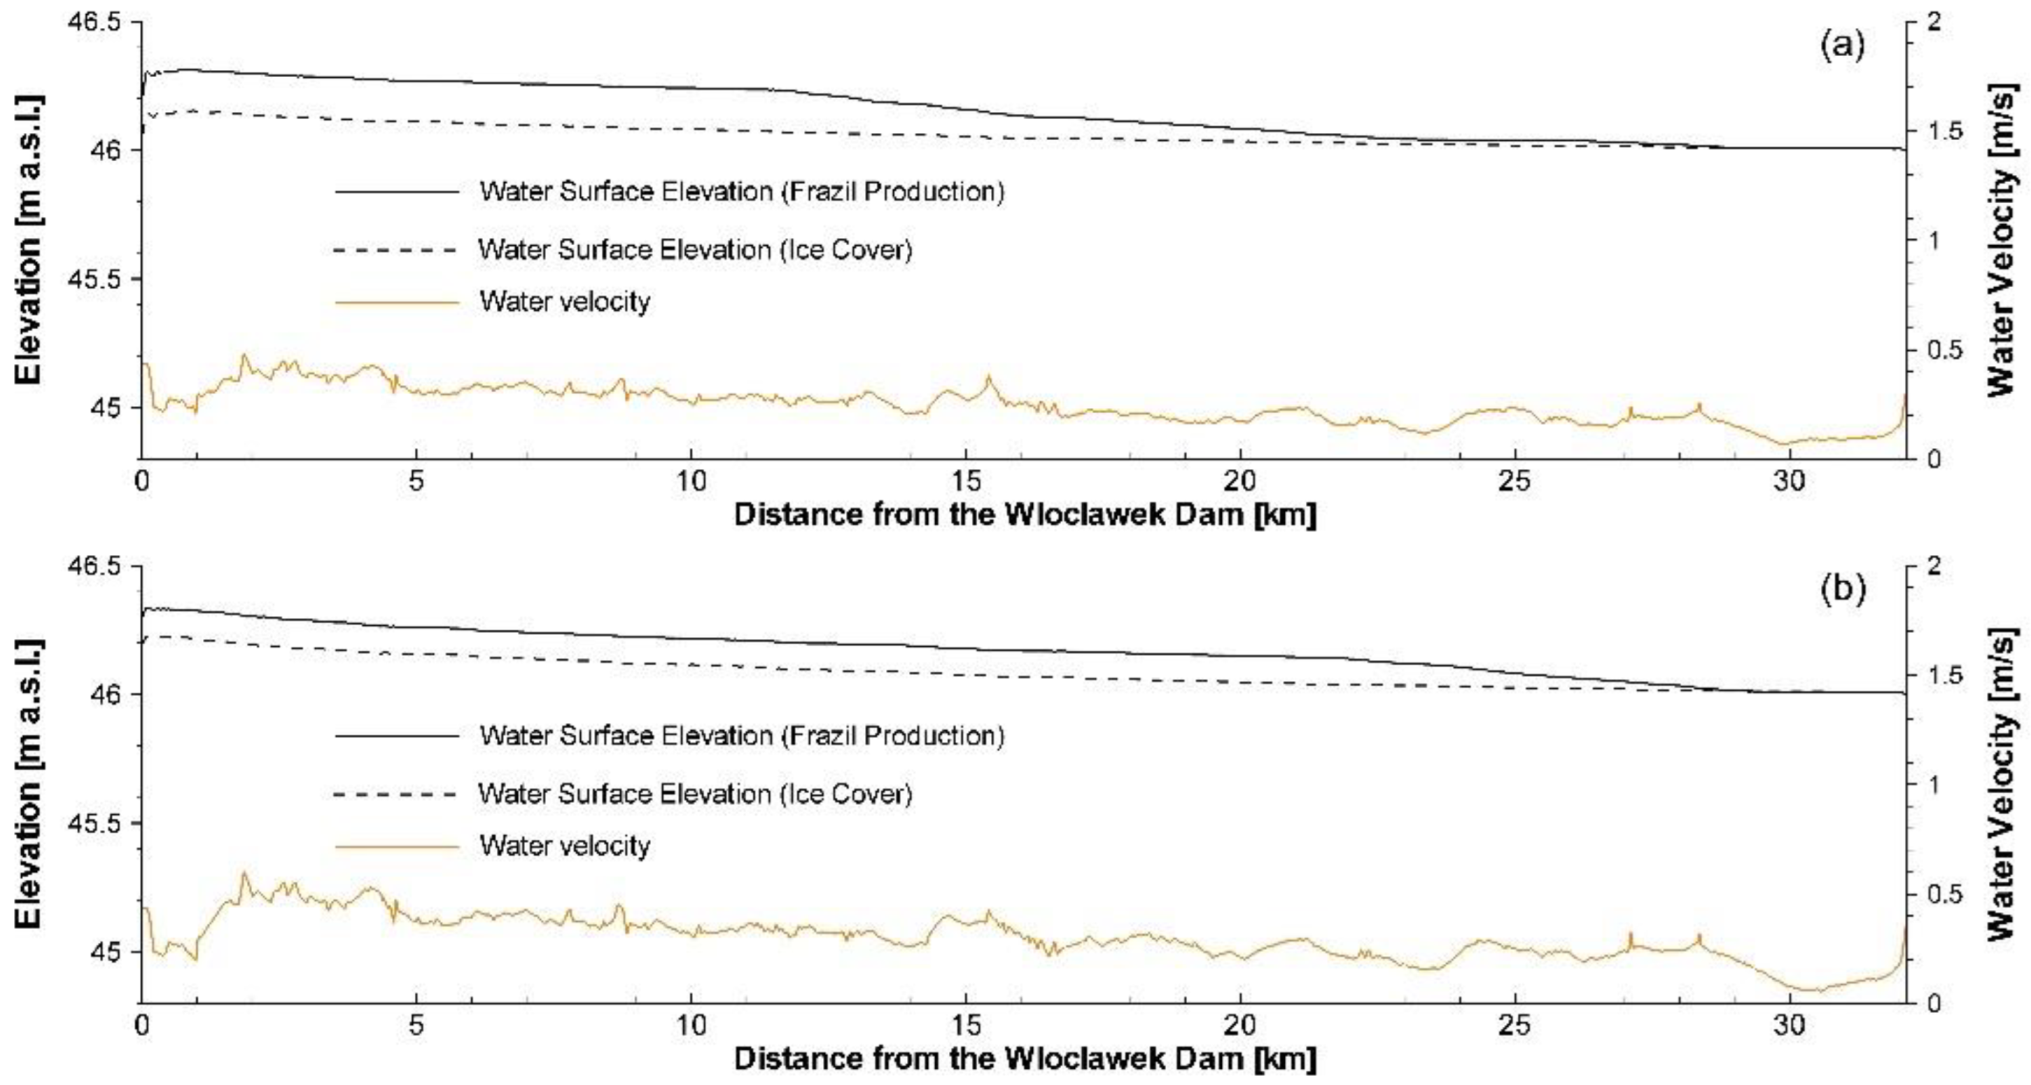
Regarding Figure 5, if the ice cover production following the 8 h of water discharge decrease over the dams was not performed, the tailwater level would be higher, resulting in the head level decrease. This head level reduction caused a lower amount of energy production, continuously during the winter, in comparison with the larger head in the cases of tailwater reduction for the cover formation.
In Table 2, the calculation related to the compensation period of the energy production loss is provided. Reached from the calculations for both discharges of 600 and 920 m3/s, it took 18 and 31 days to compensate the losses for the cover formation operation, respectively. However, these 31 days for 920 m3/s discharge seemed to be a long time to achieve. Therefore, the operation procedure should be thought through and initiated with care. If the stimulation of the ice cover is not performed, the ice formation in the reservoir is not regulated (Figure 4). The resultant cover in the reservoir that may reach 1 m in thickness can raise a problem in the breakup time for the ice sluicing operation on the spillways. The situation can be more challenging with the formation of hanging dams. In the case of mechanical breaking of the ice, thicker accumulation and under cover ice deposition will be troublesome for ice breakers.

5. Conclusions

In this study, the effect of various magnitudes of discharge for the cover extension over the reservoir of a downstream (Siarzewo) dam in a coupled dam system of the Vistula River was evaluated. The extended smooth ice cover can isolate the water body from the formation of different types of ice. To produce the ice cover on the Siarzewo Reservoir, the water discharge was decreased for 8 h during the night. This procedure was considered to prevent discharge reduction to a noticeable extent, which in turn would result in power production loss in the system. The DynaRICE mathematical model was applied to simulate the ice cover formation. Both border ice and dynamic ice due to the ice accumulation were considered in the process of the ice cover creation. Following the expansion of the ice cover, it can stay put for the entire winter season if the hydrological and meteorological conditions do not deteriorate or break the cover. Among the various discharges (of 300, 600, 920, and 1300 m 3 / s ), the discharge of 300 m 3 / s left the largest area of ice coverage due to decreased turbulence. This magnitude of discharge (300 m 3 / s ) was taken into account as a low flow and not efficient from the power production point of view. However, this amount of discharge was considered during the 8 h of night for the water level increase. The 1300 m 3 / s discharge provided the largest open water area for the frazil ice production, advancing the frazil movement downstream of the reservoir without stoppage, while 600 and 920 m 3 / s discharges were observed in the core winter months.
In the case of not reducing the discharge over the nighttime for the cover production, the discharge of 600 m 3 / s showed less ice jam regulation in comparison to the 920 m 3 / s in the Siarzewo Dam reservoir. This caused head loss in the Włocławek Dam. The reason for this could be the extension of the ice jam to the upstream reservoir section, producing a backwater effect at the tailwater of the Włocławek Dam. The other reason was the wider open water area in the 920 m 3 / s discharge case. This could be due to the fact that in the situation mentioned, ice accumulation can be formed in the vicinity of the downstream dam, developing the ice toe formation at the leading edge of the ice. Due to the ice jam formation downstream of the domain in this magnitude of outflow, the backwater effect was less observed at the tailwater of the Włocławek Dam, resulting in the same value for the head level (compared to the case of decreasing discharge for the ice cover formation). Furthermore, due to the frazil and ice cover formation in the reservoir of Siarzewo Dam, the head level at the Włocławek Dam was decreased due to the presence of a secondary dam for the tailwater regulation.
The head level changes for the stimulated ice cover did not induce noticeable power production loss for a short time. This was more perceptible during longer time periods. It needs to be considered whether, if the regulation with ice cover formation is not performed, the tailwater level of the dams would increase, leading to greater power loss during the whole winter season. Therefore, it seems to be efficient to apply this approach to thermal stabilization on a coupled dam system. A compensation period needs to be considered for the implementation of this method to notice in what duration of time the power production loss will be remedied. On account of a thorough site condition evaluation, the further ice jamming complications can be prevented. To reduce the cost of the cover formation procedure, it is necessary for this to be performed during the lower discharges.

Author Contributions

Conceptualization, T.K.; methodology, T.K.; software, T.K.; validation, T.K. and P.R.; formal analysis, P.R.; investigation, T.K.; resources, T.K.; data curation, P.R.; writing—original draft preparation, P.R.; writing—review and editing, T.K.; visualization, T.K.; supervision, T.K. All authors have read and agreed to the published version of the manuscript.

Funding

This research received no external funding.

Institutional Review Board Statement

Not applicable.

Informed Consent Statement

Not applicable.

Data Availability Statement

Hydrological data was obtained from the Institute of Meteorology and Water Resources webpage. https://hydro.imgw.pl/ (accessed on 10 December 2021).

Acknowledgments

Not applicable.

Conflicts of Interest

The authors declare no conflict of interest.

References

  1. Hammar, L.; Shen, H.; Evers, K.; Kolerski, T.; Yuan, Y.; Sobczak, L. A Laboratory Study on Freeze up Ice Runs in River Channels. In Ice in the Environments, Proceedings of the 16th International Association of Hydraulic Research Symposium on Ice, Dunedin, New Zealand, 2–6 December 2002; International Association of Hydraulic Engineering and Research: Dunedin, New Zaeland, 2002; Volume 3, pp. 36–39. [Google Scholar]
  2. Lal, A.W.; Shen, H.T. Mathematical Model for River Ice Processes. J. Hydraul. Eng. 1991, 117, 851–867. [Google Scholar] [CrossRef] [Green Version]
  3. Bo, Q.; Cheng, W.; Sun, T. Flow Capacity and Ice Cap Stability of River Channel in the Daqing River Basin of the South-to-North Water Diversion Project during the Ice Period. Alex. Eng. J. 2021, 61, 3657–3663. [Google Scholar] [CrossRef]
  4. Beltaos, S. River Ice Jams; Water Resources Publication: Littleton, CO, USA, 1995; ISBN 0-918334-87-X. [Google Scholar]
  5. Matousek, V. Types of Ice Run and Conditions for Their Formation. In Proceedings of the IAHR International Symposium on Ice, Hamburg, Germany, 27–31 August 1984; Volume 1, pp. 315–327. [Google Scholar]
  6. Ettema, R.; Kirkil, G.; Daly, S. Frazil Ice Concerns for Channels, Pump-Lines, Penstocks, Siphons, and Tunnels in Mountainous Regions. Cold Reg. Sci. Technol. 2009, 55, 202–211. [Google Scholar] [CrossRef]
  7. Rossinsky, K.; Lubomirova, K. The Effect of Hydro-Power Systems on Ice and Thermal Regimes of Water Reservoirs and Afterbays. In Proceedings of the International Symposium on the Hydrological Characteristics of River Basins, Tokyo, Japan, 27–28 October 1975; pp. 1–8. [Google Scholar]
  8. Gebre, S.; Alfredsen, K.; Lia, L.; Stickler, M.; Tesaker, E. Review of Ice Effects on Hydropower Systems. J. Cold Reg. Eng. 2013, 27, 196–222. [Google Scholar] [CrossRef]
  9. Daly, S.F. Frazil Ice Blockage of Intake Trash Racks; Cold Regions Research and Engineering Lab Hanover: Hanover, NH, USA, 1991. [Google Scholar]
  10. Huokuna, M.; Morris, M.; Beltaos, S.; Burrell, B.C. Ice in Reservoirs and Regulated Rivers. Int. J. River Basin Manag. 2020, 1–16. [Google Scholar] [CrossRef]
  11. O’Neill, K.; Ashton, G.D. Bottom Heat Transfer to Water Bodies in Winter; Special Report 81-18; U.S. Army Cold Regions Research and Engineering Laboratory Hanover: Hanover, NH, USA, 1981. [Google Scholar]
  12. Shen, H.T.; Ruggles, R.W. Winter Heat Budget and Frazil Ice Production in the Upper St. Lawrence River. JAWRA J. Am. Water Resour. Assoc. 1982, 18, 251–256. [Google Scholar] [CrossRef]
  13. Yapa, P.D.; Shen, H.T. Effect of Ice Cover on Hydropower Production. J. Energy Eng. 1984, 110, 231–234. [Google Scholar] [CrossRef]
  14. Shen, H.T. Research on River Ice Processes: Progress and Missing Links. J. Cold Reg. Eng. 2003, 17, 135–142. [Google Scholar] [CrossRef]
  15. Heggenes, J.; Alfredsen, K.; Bustos, A.A.; Huusko, A.; Stickler, M. Be Cool: A Review of Hydro-Physical Changes and Fish Responses in Winter in Hydropower-Regulated Northern Streams. Environ. Biol. Fishes 2018, 101, 1–21. [Google Scholar] [CrossRef]
  16. Ashton, G.D. River and Lake Ice Engineering; Water Resources Publication: Littleton, CO, USA, 1986; ISBN 0-918334-59-4. [Google Scholar]
  17. Iqbal, M. An Introduction to Solar Radiation; Academic Press: Toronto, ON, Canada, 1983; ISBN 0-323-15181-7. [Google Scholar]
  18. Timalsina, N.P.; Alfredsen, K.T.; Killingtveit, Å. Impact of Climate Change on Ice Regime in a River Regulated for Hydropower. Can. J. Civ. Eng. 2015, 42, 634–644. [Google Scholar] [CrossRef]
  19. Su, J.; Shen, H.T.; Crissman, R.D. Numerical Study on Ice Transport in Vicinity of Niagara River Hydropower Intakes. J. Cold Reg. Eng. 1997, 11, 255–270. [Google Scholar] [CrossRef]
  20. Chang, J.; Meng, X.; Wang, Z.; Wang, X.; Huang, Q. Optimized Cascade Reservoir Operation Considering Ice Flood Control and Power Generation. J. Hydrol. 2014, 519, 1042–1051. [Google Scholar] [CrossRef]
  21. Huang, F.; Shen, H.T.; Knack, I. Modeling Border Ice Formation and Cover Progression in Rivers. In Proceedings of the Proceedings of the 21st IAHR International Symposium on Ice, Dalian, China, 11–15 June 2012. [Google Scholar]
  22. Vyshnevskyi, V.I.; Shevchuk, S.A. Use of Remote Sensing Data to Study Ice Cover in the Dnipro Reservoirs. J. Geol. Geogr. Geoecol. 2020, 29, 206–216. [Google Scholar] [CrossRef]
  23. Lindenschmidt, K.-E.; Syrenne, G.; Harrison, R. Measuring Ice Thicknesses along the Red River in Canada Using RADARSAT-2 Satellite Imagery. J. Water Resour. Prot. 2010, 2, 923. [Google Scholar] [CrossRef] [Green Version]
  24. Altena, B.; Kääb, A. Quantifying River Ice Movement through a Combination of European Satellite Monitoring Services. Int. J. Appl. Earth Obs. Geoinf. 2021, 98, 102315. [Google Scholar] [CrossRef]
  25. Kouraev, A.V.; Semovski, S.V.; Shimaraev, M.N.; Mognard, N.M.; Legrésy, B.; Rémy, F. The Ice Regime of Lake Baikal from Historical and Satellite Data: Relationship to Air Temperature, Dynamical, and Other Factors. Limnol. Oceanogr. 2007, 52, 1268–1286. [Google Scholar] [CrossRef]
  26. Morse, B.; Stander, E.; Coté, A.; Morse, J.; Beaulieu, P.; Tarras, A.; Noël, P.; Pratt, Y. Ice Interactions at a Dam Face; Newfoundland and Labrador: St. John’s, NA, Canada, 2009; pp. 15–17. [Google Scholar]
  27. Lees, K.; Clark, S.P.; Malenchak, J.; Chanel, P. Characterizing Ice Cover Formation during Freeze-Up on the Regulated Upper Nelson River, Manitoba. J. Cold Reg. Eng. 2021, 35, 04021009. [Google Scholar] [CrossRef]
  28. Kolerski, T. Ice Cover Progression Due to Flow Regulation at the Wloclawek Dam. Acta Sci. Pol. Form. Circumiectus 2015, 14, 229–240. [Google Scholar] [CrossRef]
  29. Walczak, N.; Walczak, Z.; Nieć, J. Assessment of the Resistance Value of Trash Racks at a Small Hydropower Plant Operating at Low Temperature. Energies 2020, 13, 1775. [Google Scholar] [CrossRef] [Green Version]
  30. Asvall, R.P. Selective Withdrawal to Reduce Regulation Effects on Ice Cover Downstream Outlet of Alta Power Plant. In Proceedings of the 14th Workshop on the Hydraulics of Ice Covered Rivers, Quebec City, QC, Canada, 19–22 June 2007. [Google Scholar]
  31. Kolerski, T. Numerical Modeling of Ice Jam Formation in the W\loc\lawek Reservoir. Task Q. 2011, 15, 283–295. [Google Scholar]
  32. Kolerski, T. Modeling of Ice Passage through Reservoirs System on the Vistula River. In Hydrodynamic and Mass Transport at Freshwater Aquatic Interfaces; Springer: Cham, Switzerland, 2016; pp. 35–47. [Google Scholar]
  33. Pawłowski, B. Determinants of Change in the Duration of Ice Phenomena on the Vistula River in Toruń. J. Hydrol. Hydromech. 2015, 63, 145–153. [Google Scholar] [CrossRef] [Green Version]
  34. Lal, A.W.; Shen, H.T. A Mathematical Model for River Ice Processes; Cold Regions Research and Engineering Laboratory Hanover: Hanover, NH, USA, 1993. [Google Scholar]
  35. Shen, H.T.; Wang, D.S.; Lal, A.W. Numerical Simulation of River Ice Processes. J. Cold Reg. Eng. 1995, 9, 107–118. [Google Scholar] [CrossRef]
  36. Shen, H.T.; Wang, D.S. Frazil and Anchor Ice Evolution in Rivers; Clarkson University, Department of Civil and Environmental Engineering: New York, NY, USA, 1993. [Google Scholar]
  37. Liu, L.; Shen, H.T. CRISSP2D Version 1.0 Programmer’s Manual; CEE Report; CEE: Quebec, QC, Canada, 2005; pp. 5–19. [Google Scholar]
  38. Miles, T.M. A Study of Border Ice Growth on the Burntwood River. Master’s Thesis, University of Manitoba, Winnipeg, MB, Canada, 1993. [Google Scholar]
  39. Liu, L.; Shen, H.T. Numerical Simulation of River Ice Control with Booms; Technical Report ERDC/CRREL TR-00-10; US Army Corps of Engineers® Cold Regions Research & Engineering Laboratory: Hanover, NH, USA, 2000. [Google Scholar]
  40. Shen, H.T. Mathematical Modeling of River Ice Processes. Cold Reg. Sci. Technol. 2010, 62, 3–13. [Google Scholar] [CrossRef]
  41. Ettema, R.; Karim, M.F.; Kennedy, J.F. Frazil Ice Formation; Iowa Inst of Hydraulic Research Iowa City: Philadelphia, PA, USA, 1984. [Google Scholar]
  42. Hammar, L.; Shen, H.T. Frazil Evolution in Channels. J. Hydraul. Res. 1995, 33, 291–306. [Google Scholar] [CrossRef]
  43. Kuźniar, P. Veryfication of the Hydrological Data for Siarzewo Dam; State Water Holding Polish Waters: Warsaw, Poland, 2019. [Google Scholar]
Figure 1. Location configuration of the coupled dams (Włocławek and Siarzewo) (a), along with the bed and the water surface longitudinal profiles for the reservoirs (b).
Energies 15 00823 g001
Figure 2. Ice cover expansion at the site area (Włocławek Reservoir) in 6 February 2021 (Sourced: Land Viewer Website) (a), zoomed in open water boundary (b), comparison between open water borders in numerical simulation and satellite imagery photo (c).
Energies 15 00823 g002
Figure 3. Ice cover expansion following the water withdrawal with outflows of 300 (a), 600 (b), 920 (c) and 1300 m3/s (d).
Energies 15 00823 g003
Figure 4. Ice cover expansion for 600 (a) and 920 m3/s (b) of water discharge at Siarzewo Reservoir, without prior ice cover expansion over night.
Energies 15 00823 g004
Figure 5. Thalweg longitudinal profiles of the water surface elevation for ice cover formation and frazil production conditions in Siarzewo reservoir, in the water discharge of 600 (a) and 920 m3/s (b) settings, from the Włocławek Dam.
Energies 15 00823 g005
Table 1. Energy production and head level changes in cover and frazil formation conditions in Siarzewo and Włocławek dams.
Siarzewo DamWłocławek DamCoupled Dams
DischargeIce
Condition
Tail
Water
Head PowerTail
Water
Head PowerEnergy ProductionEnergy Production Loss
(1 day)(60 days)(1 day)(60 days)
m3/s mmMWmmMWMWhGWhMWhGWh
300Cover38.207.8023.046.0811.2233.01343.4280.61
600Cover39.106.9040.646.1311.1765.72552.64153.16
Frazil39.106.9040.646.2911.0164.82530.04151.8022.6021.356
920Cover39.806.2056.046.2611.0499.63734.27224.06
Frazil 39.806.2056.046.3810.9298.63708.27222.5025. 9931.560
Table 2. Calculation for the energy compensation period at discharge situations of 600 and 920 m3/s.
600 m3/s 920 m3/s
UnitCoverFrazilCoverFrazil
Loss at the both dams (during 8 h) MWh403.10796.90
Head (at Wloclawek)m11.1711.0111.0410.92
10 daysProduction MWh15,77915,55323,91323,653
Difference 226.0259.9
Gain−177.1 *−537.0 *
18 daysProductionMWh28,40327,99643,04442,576
Difference406.8467.9
Gain3.8−329.1 *
20 daysProductionMWh31,55831,10647,82647,306
Difference452.0519.9
Gain49.0−277.1 *
30 daysProductionMWh47,33846,65971,74070,960
Difference678.1779.8
Gain275.0−17.2 *
31 daysProductionMWh48,91548,21574,13173,325
Difference700.7805.8
Gain297.68.8
40 daysProductionMWh63,11762,21395,65394,613
Difference904.11039.7
Gain501.0242.8
* Negative values indicate the power production loss surpasses the benefits of the power production.
Publisher’s Note: MDPI stays neutral with regard to jurisdictional claims in published maps and institutional affiliations.

