Article

Inventory of Reservoirs of Key Significance for Water Management in Poland—Evaluation of Changes in Their Capacity

1
Doctoral School, University of Silesia in Katowice, 40-007 Katowice, Poland
2
National Water Management Authority, State Water Holding Polish Waters, 00-848 Warszawa, Poland
3
Silesian Water Centre, University of Silesia in Katowice, 40-007 Katowice, Poland
4
Institute of Geography, Kazimierz Wielki University, 85-033 Bydgoszcz, Poland
*
Author to whom correspondence should be addressed.
Energies 2021, 14(23), 7951; https://doi.org/10.3390/en14237951
Submission received: 22 October 2021 / Revised: 18 November 2021 / Accepted: 24 November 2021 / Published: 28 November 2021
(This article belongs to the Special Issue Hydropower in the East European Region: Challenges and Opportunities)

Abstract

:
Dam reservoirs constitute an important element of protection against floods and hydrological droughts, and they ensure the possibility of producing electricity. Loss of reservoirs’ storage capacity has a significant impact on the management of their water resources, including flood protection and counteracting the effects of drought and the possibility of producing electricity. The paper presents changes in the capacity of 47 reservoirs in Poland that have the status of key objects of protection against floods and hydrological drought. Based on the collected, unpublished data, the changes in capacity from the beginning of the reservoirs’ existence to 31 March 2021 were calculated, which allowed us to determine the total amount of lost capacity and the pace of the processes taking place. From the beginning of operation (average operation time 48 years), the capacity has decreased by about 5%, which means that almost 200 million m3 less water is stored. Detailed analyses of the lost capacity also allowed for an illustrative presentation of forecasts for further changes in the short and long term. The results obtained represent a unique contribution to future national strategies for the management of sediment and reservoirs’ flood reserve and reduction of drought. The presentation of this problem seems to be important also in the context of climate change.

1. Introduction

For centuries, water reservoirs have constituted infrastructure necessary to manage water resources. A particularly important problem in their operation is their filling with sediments [1]. The volume of bed load retained in the reservoir limits its water storage functions, and then its efficiency in terms of retention and energy provided by it. It is estimated that 1% of the world’s gross reservoir capacity is lost each year [2]. This generates an economic loss of USD 6 to 10 billion per year [3,4]. According to information provided by the International Commission on Large Dams [4], the annual mass of bed load carried by rivers (both dragged and suspended material) has been estimated at around 24–30 billion tones and it has been estimated that around 1400 million m3 of sediment accumulates each year in reservoirs operating for 30–40 years. [4].
The reservoirs constitute a local sedimentation basin for the sediment transported by rivers [5]. The silting dynamics of a particular reservoir are determined by many abiotic [6] and sometimes also biotic factors. In addition, such processes take place most intensively in river valleys subject to a high human impact [7]. Depending on the geographic location of the reservoir, the impact of human activity varies. Humans significantly impact the specific character of the course of limnic processes, e.g., water cycle, fluctuations in water levels, thermal and oxygen processes, the course of ice phenomena, changes in water fertility, shore processes, accumulation of pollutants, but also significant in the context of this article, the formation of sediment and service life of the reservoirs [8,9,10,11]. The possibility of filling a given body of water with sediments may also depend on the characteristics of river load, parameters of the geometry and structure of the reservoir, as well as water management manuals on the dam [12]. River load is an important, moving and often a very dynamic element in the functioning of the basin. In catchments where human activities influence the change in balance, quantity, or quality of sediments, their management may prove necessary [13]. Most of the river load transported to the reservoir accumulates in its lower part, while the suspended and dissolved load is only partially retained [14]. All reservoirs are a good place for the accumulation of sediments transported by the river on which they were created—they act as sedimentation basins with the functions of a local erosion base. In the contact zones of river and reservoir waters (in the backwater), alluvial cones or even deltas are formed [5,8].
As societies have developed, river control technology has developed to maximize the use of rivers’ resources [15]. Especially in areas with a high level of land development, the number of reservoirs with the flood protection function increased. Currently, it is estimated that about 16.7 million reservoirs with an area of over 0.01 ha operate in the world, and this number is constantly growing [16]. The total number of dams with reservoirs in Europe alone is estimated at 0.6–1.8 million [17]. In the period 2011–2019 alone, 172 new dams were built [18].
Currently, research on water resources, including reservoirs on rivers, is potentially easier to implement due to the development of hydrological databases at national levels, such as the National Inventory of Dams database, and global ones, such as Global Reservoir and Dam (GRanD) [16]. In particular, open-access national datasets can contribute to reducing the information gap. Managers of water resource systems usually consider two types of actions: increasing infrastructure or improving water management efficiency. Recent studies also show a trend of shrinking potential locations for new facilities [19]; however, Central and Eastern European countries such as Poland still have considerable opportunities in this respect. The removal of dams and reservoirs by the richest countries applies only to poorly maintained and unnecessary facilities [20]. The existing infrastructure is expected to provide water services under changing hydrological and socioeconomic conditions [21]. Operational activities are more and more often based on water resource management models [22], and an example of new solutions introduced in large areas are the global hydrological models (GHMs) implemented in recent years, which enable water cycle and water transfer simulation. GHMs allow for the identification of current and future water scarcity and stress problems [23]. Therefore, access to reliable and up-to-date data on the basic characteristics of reservoirs seems to be of key importance. However, it should be remembered that rivers feeding the reservoirs can be very active in terms of sediment supply. Therefore, it should be remembered when planning their resources in the constantly changing available capacity of reservoirs [24]. The volume of the sediment permanently retained in the reservoir may reduce its capacity and, consequently, limit its functions, including flood control, retention, or hydropower functions. There are numerous known cases where the change of capacity triggered the necessity of its original restoration through technical measures or even the abandonment of the object [25]. Recently, classifications of available strategies have been known to counteract the excessive accumulation of sediments in reservoirs [26]. In addition, Kondolf et al. [1] summarize the global experience in reservoir sediment management. Unfortunately, there is still a lack of national policies for sediment management in river basins [13], and this has a real impact on reservoir capacity.
The legislation of the European Union obliges Poland to implement the provisions of Art. 13 of Directive 2000/60/EC of the European Parliament and of the council of 23 October 2000 establishing a framework for community action in the field of water policy [27] (the so-called Water Framework Directive), which recommends the development of more detailed water management programs and plans. Hence, water management plans in river basins and flood risk management plans with updates are being prepared in Poland. On the other hand, the need to prepare and implement a drought planning document has resulted, among others, from the communication from the commission to the European parliament and the council entitled ‘Addressing the problem of water scarcity and droughts in the European Union’ of 18 July 2007 [28]. Therefore, a draft regulation of the minister of infrastructure on the adoption of the Drought Effects Counteracting Plan [29] was developed, according to which currently large retention reservoirs in Poland store three times less water than the volume considered in Europe to be sufficient for safe supply to consumers and ensuring a sufficient level of flood protection. Therefore, assuming that the usable capacity of reservoirs operating in Poland is insufficient in the context of rational management of water resources, systematic storage of new water resources is needed, and at the same time appropriate management of the existing ones. Therefore, the main purpose of the article was to create a database containing archival and modern parameters for 47 water reservoirs of key importance for water management in Poland. Information was collected from individual units of the main entity responsible for national water management and the enterprise managing the selected facilities. On this basis, calculations were made for indicators describing the quantitative and qualitative change in reservoir capacity, along with short and long-term forecasts.

2. Materials and Methods
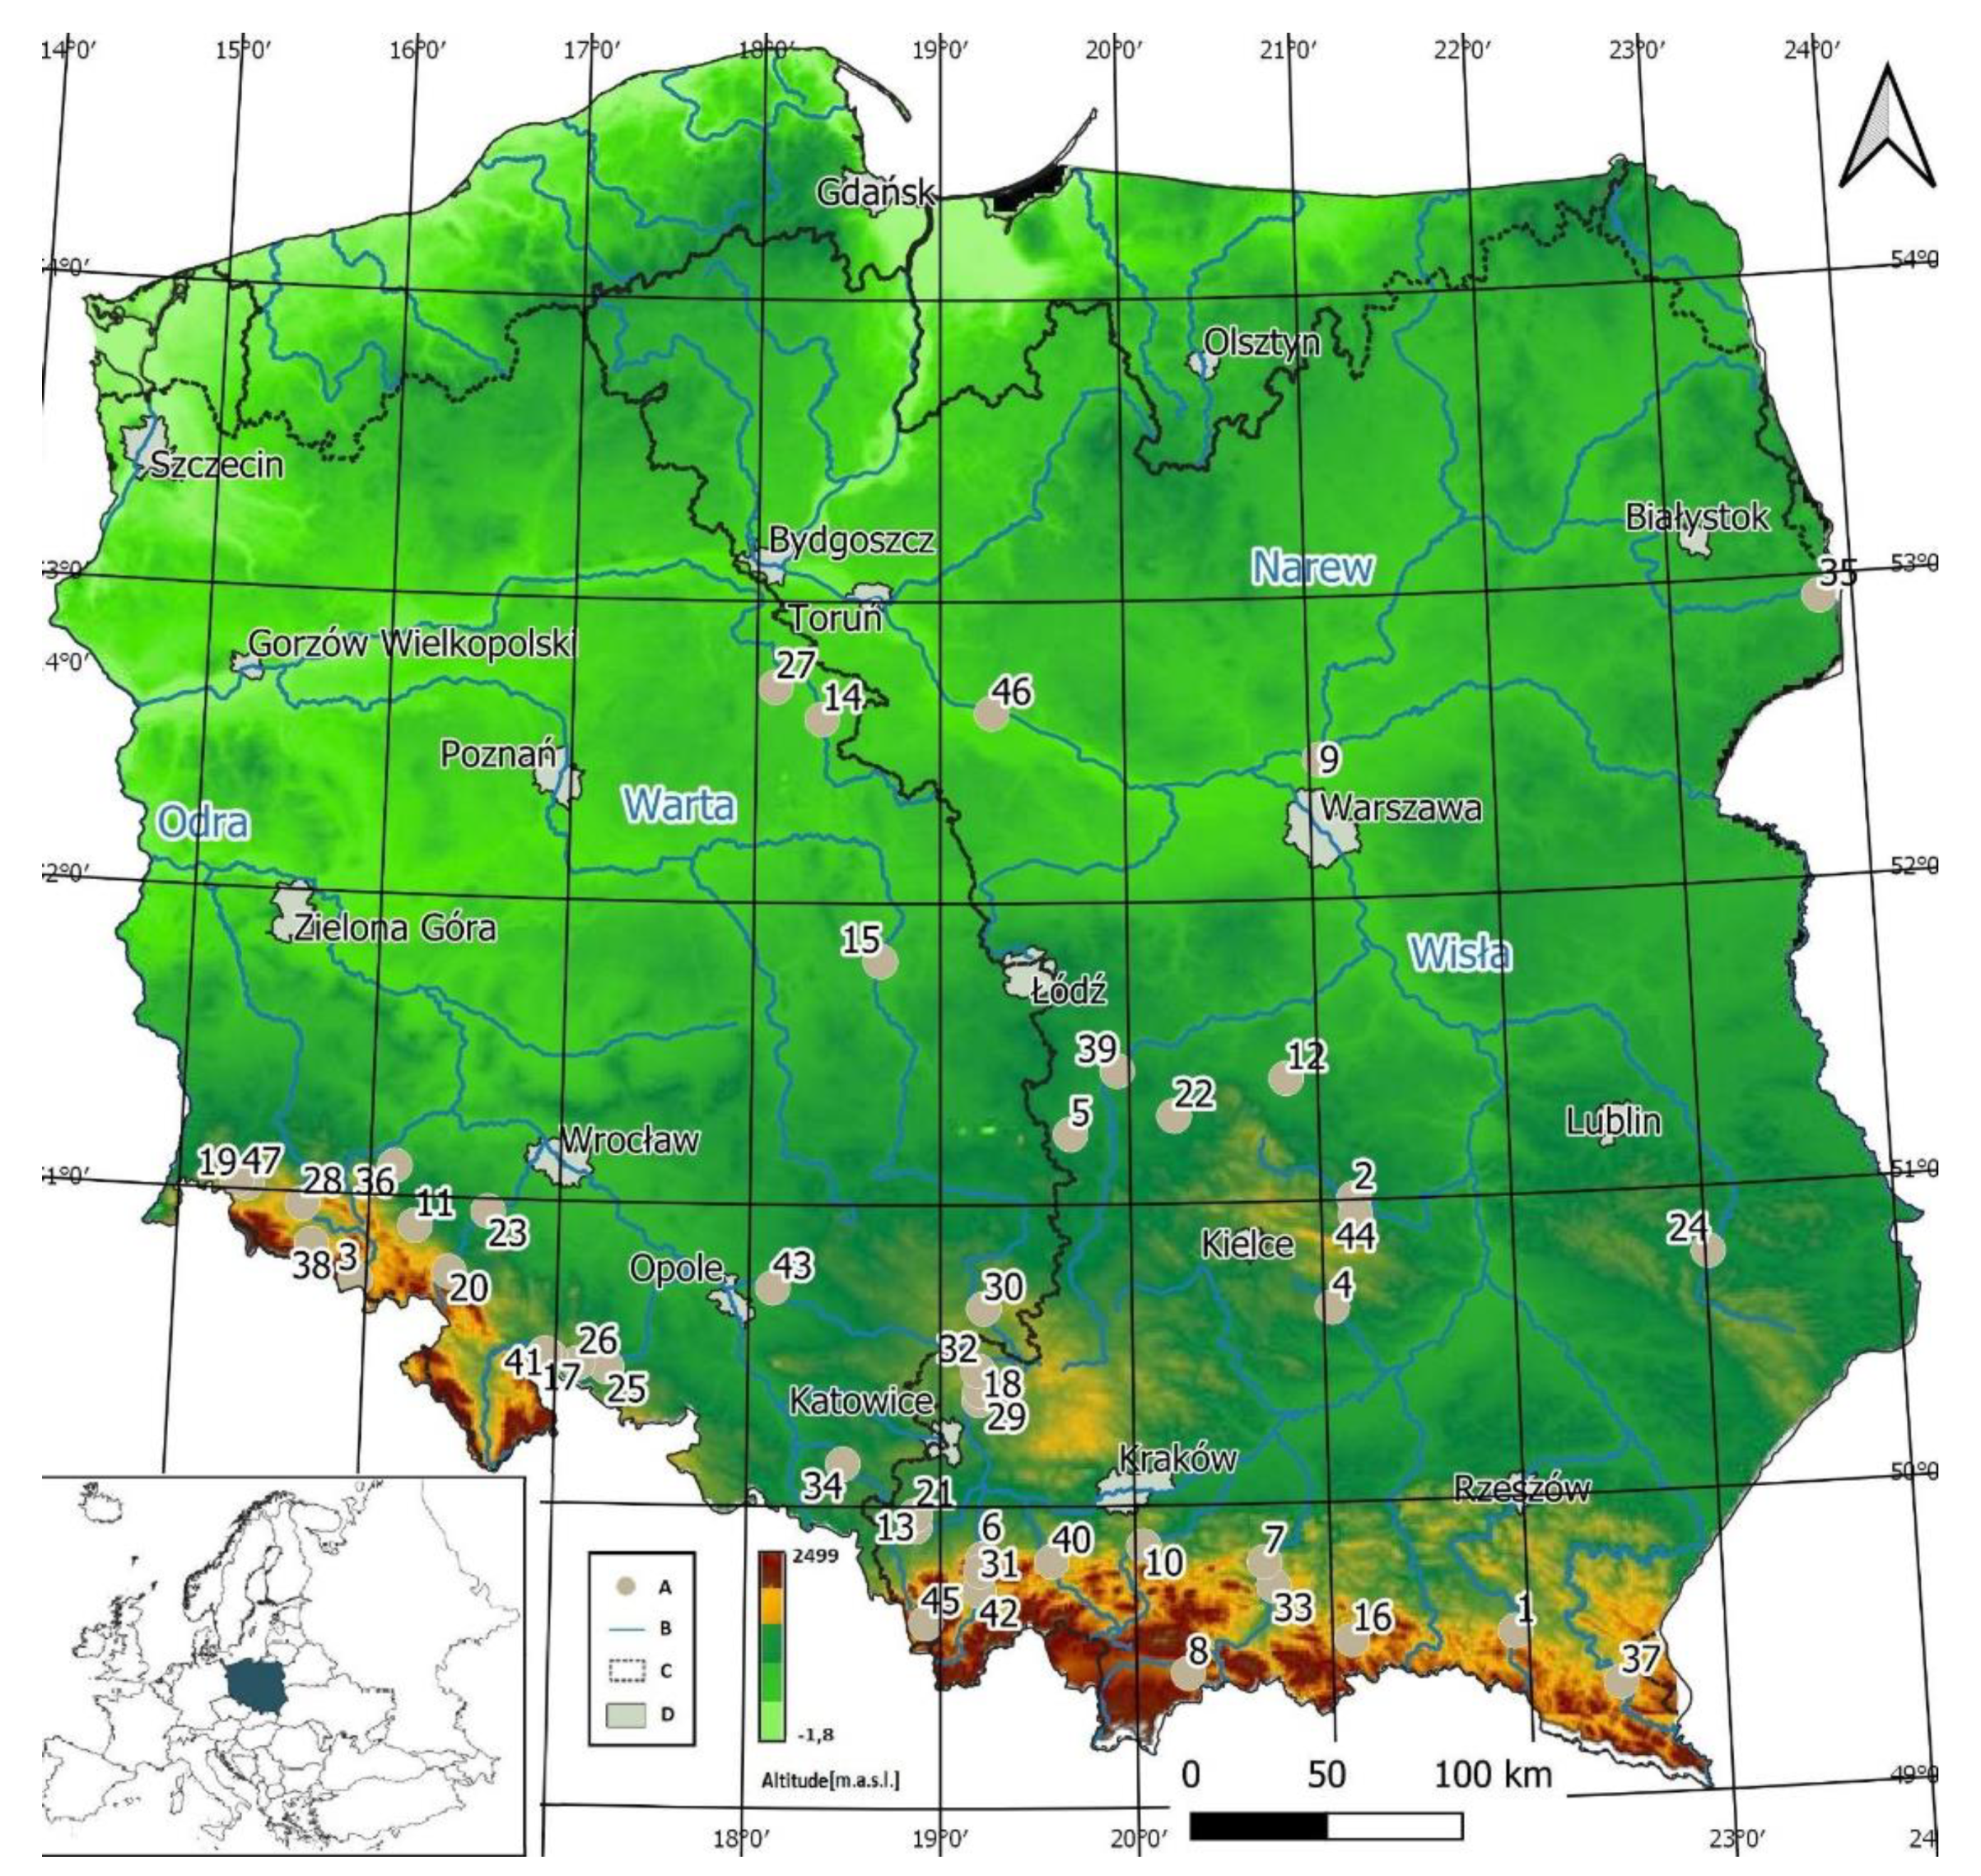
2.1. Study Area

A number of 47 reservoirs of key importance for flood protection, hydropower engineering, and counteracting the effects of drought in Poland were analyzed (Table A1). They are located mainly in the southern part of the country, and almost 45% of them are located in the area of only two provinces: Silesian Voivodeship and Lower Silesian Voivodeship—11 and 10 sites, respectively. In terms of hydrographic division, 28 reservoirs are located in the Vistula basin, and 19 are part of the Oder basin (Figure 1). Most of the analyzed reservoirs were created as a result of damming the waters of the Eastern Neisse (Nysa Kłodzka) river (4 reservoirs), while three are located on each of the rivers: the Dunajec, the Soła, and the Vistula. The calculated average lifetime of the analyzed reservoirs is 48 years. The longest operating reservoir is Leśna, which was launched in 1907, while the youngest one, put into operation in 2016, is Świnna Poręba. The construction of reservoirs was most intense in the 1970s (28% of the reservoirs). It is also worth adding that the Racibórz Dolny reservoir, which plays the key role in protecting the areas along the Oder river from flooding, was not included in the list as it was built as a dry flood protection reservoir in 2020.
All analyzed reservoirs are multi-purpose reservoirs. The dominant and basic function for most of them is to provide flood protection by reducing the risk of flooding due to reducing (the so-called flattening) of the flood wave and controlling its size. The fact that they play a large role in this respect is evidenced by, inter alia, their inclusion in the Flood Risk Management Plan for the Oder river basin area and in the Flood Risk Management Plan for the Vistula river basin area, adopted by Poland in 2016 [30]. The damming of water is also an important role, for preventing the effects of drought. On the one hand, significant water resources are retained—especially in the period of higher flows, while the second important factor in this aspect is the possibility of using them during low water levels and providing water to the section of the river located downstream of the barrage. In addition to shaping water management, many reservoirs have an energy-providing function, i.e., the stored water is used by classic hydroelectric power plants or pumped-storage power plants, but also, for example, the Turawa reservoir supplies the intake of the Opole conventional thermal power plant [31]. The total capacity of the hydroelectric power plants installed on these reservoirs is about 627 MW (almost 31% of the national hydropower capacity, with nearly 67% attributable to pumped-storage power plants [32]. Of all the analyzed reservoirs, the hydropower functions are not performed by: Dobromierz, Goczałkowice, Gopło, Kuźnica Warężyńska, Łąka, Pakość, Pogoria III, Przeczyce, Rybnik, or Sosnówka. In addition, many reservoirs are additionally used for recreational and tourist purposes as well as for water supply for residents and industrial enterprises (e.g., Czaniec, Goczałkowice, Kozłowa Góra, Pławniowice, Wisła Czarne). Some of them are used as fisheries (e.g., Goczałkowice, Jeziorsko, and Rybnik), and in the case of the Besko reservoir, water is collected for the purposes of fish farming [33]. Some reservoirs are also sections of inland waterways (Włocławek—class Va, Dębe—class II, and Pakość class—Ia), and, additionally the reservoirs, Mietków, Nysa, Otmuchów and Turawa, are responsible for supplying the Oder flows for the needs of inland navigation [34]. The analyzed reservoirs play an important environmental role, including their capacity to adapt to climate change, and when managing water, e.g., on the Jeziorsko reservoir, it is important to maintain the habitat conditions for waterfowl in its upper part [35]. Bed load accumulation leading to a reduction in the reservoirs’ capacity influences the functions performed by the reservoirs, including flood control, retention, and hydropower functions [36].

2.2. Data

The characteristics of catchment parameters of the studied reservoirs were developed based on the digital map of the Polish Hydrographic Division [37]. Initial and current capacities as well as the course of dredging works were based on the results of the query carried out in the archives of the organizational units of the State Water Holding Polish Waters: regional water management authority in Białystok, Bydgoszcz, Gliwice Kraków, Lublin, Poznań, Rzeszów, Warsaw, Wrocław [31,33,35,38,39,40,41,42,43] in the period from 19 March to 28 April 2021 and the data of TAURON Ekoenergia Ltd. [34] (exchange of e-mail on 28 April 2021). Ready capacity calculations were obtained based on cyclically commissioned bathymetric tests, and our own calculations were made based on the obtained cartographic materials (bathymetric maps). Based on the obtained data, the initial and current capacity were determined. Calculations were made of the overall change in capacity (1), the percentage of the reduced initial capacity of the reservoir (2), the rate of changes in capacity (3), the average annual reservoir silting rate (4), and the illustrative service life of reservoirs (5). The capacity loss forecast was also calculated.
∆V = Vi − Va,
where:
  • ∆V—loss in the capacity of the dam reservoir in the balance period [million m3];
  • Vi—initial capacity [million m3];
  • Va—current capacity [million m3].
The percentage of the reduced initial capacity of the reservoir in % was calculated on the basis of the formula in which the above-mentioned determinations were used:
∆V/Vi,
The rate of capacity changes, i.e., the average annual silting, was calculated based on the formula:
S = ∆V/n,
where:
  • S—mean annual siltation (sedimentation) [million m3];
  • ∆V—loss in the capacity of the dam reservoir in the balance period [million m3];
  • n—number of years of the reservoir’s operation.
On the other hand, the average annual silting in relation to the initial capacity was obtained from the equation:
S/Vi × 100%,
The following formula was used to determine the illustrative service life of the reservoirs:
V50 = (Vi/2)/S − n,
where:
  • 50—loss of 50% of the initial capacity [years];
  • Vi—initial capacity [million m3];
  • S—mean annual siltation (sedimentation) [million m3];
  • n—number of years of the reservoir’s operation.
Spearman’s statistics were applied to assess the relationship between individual classes of capacity changes and the reservoirs’ features. We chose Spearman’s statistics because analysis of the distribution (e.g., the Shapiro–Wilk test) showed that the variables have a non-normal distribution (p < 0.05) (probably due to the small number of sets). We statistically assessed the strength of correlation and statistical significance between calculated indicators: capacity changes and the average annual rate of capacity loss in reservoirs with the general characteristic features of reservoirs (hydraulic resistance time and basin area).

3. Results

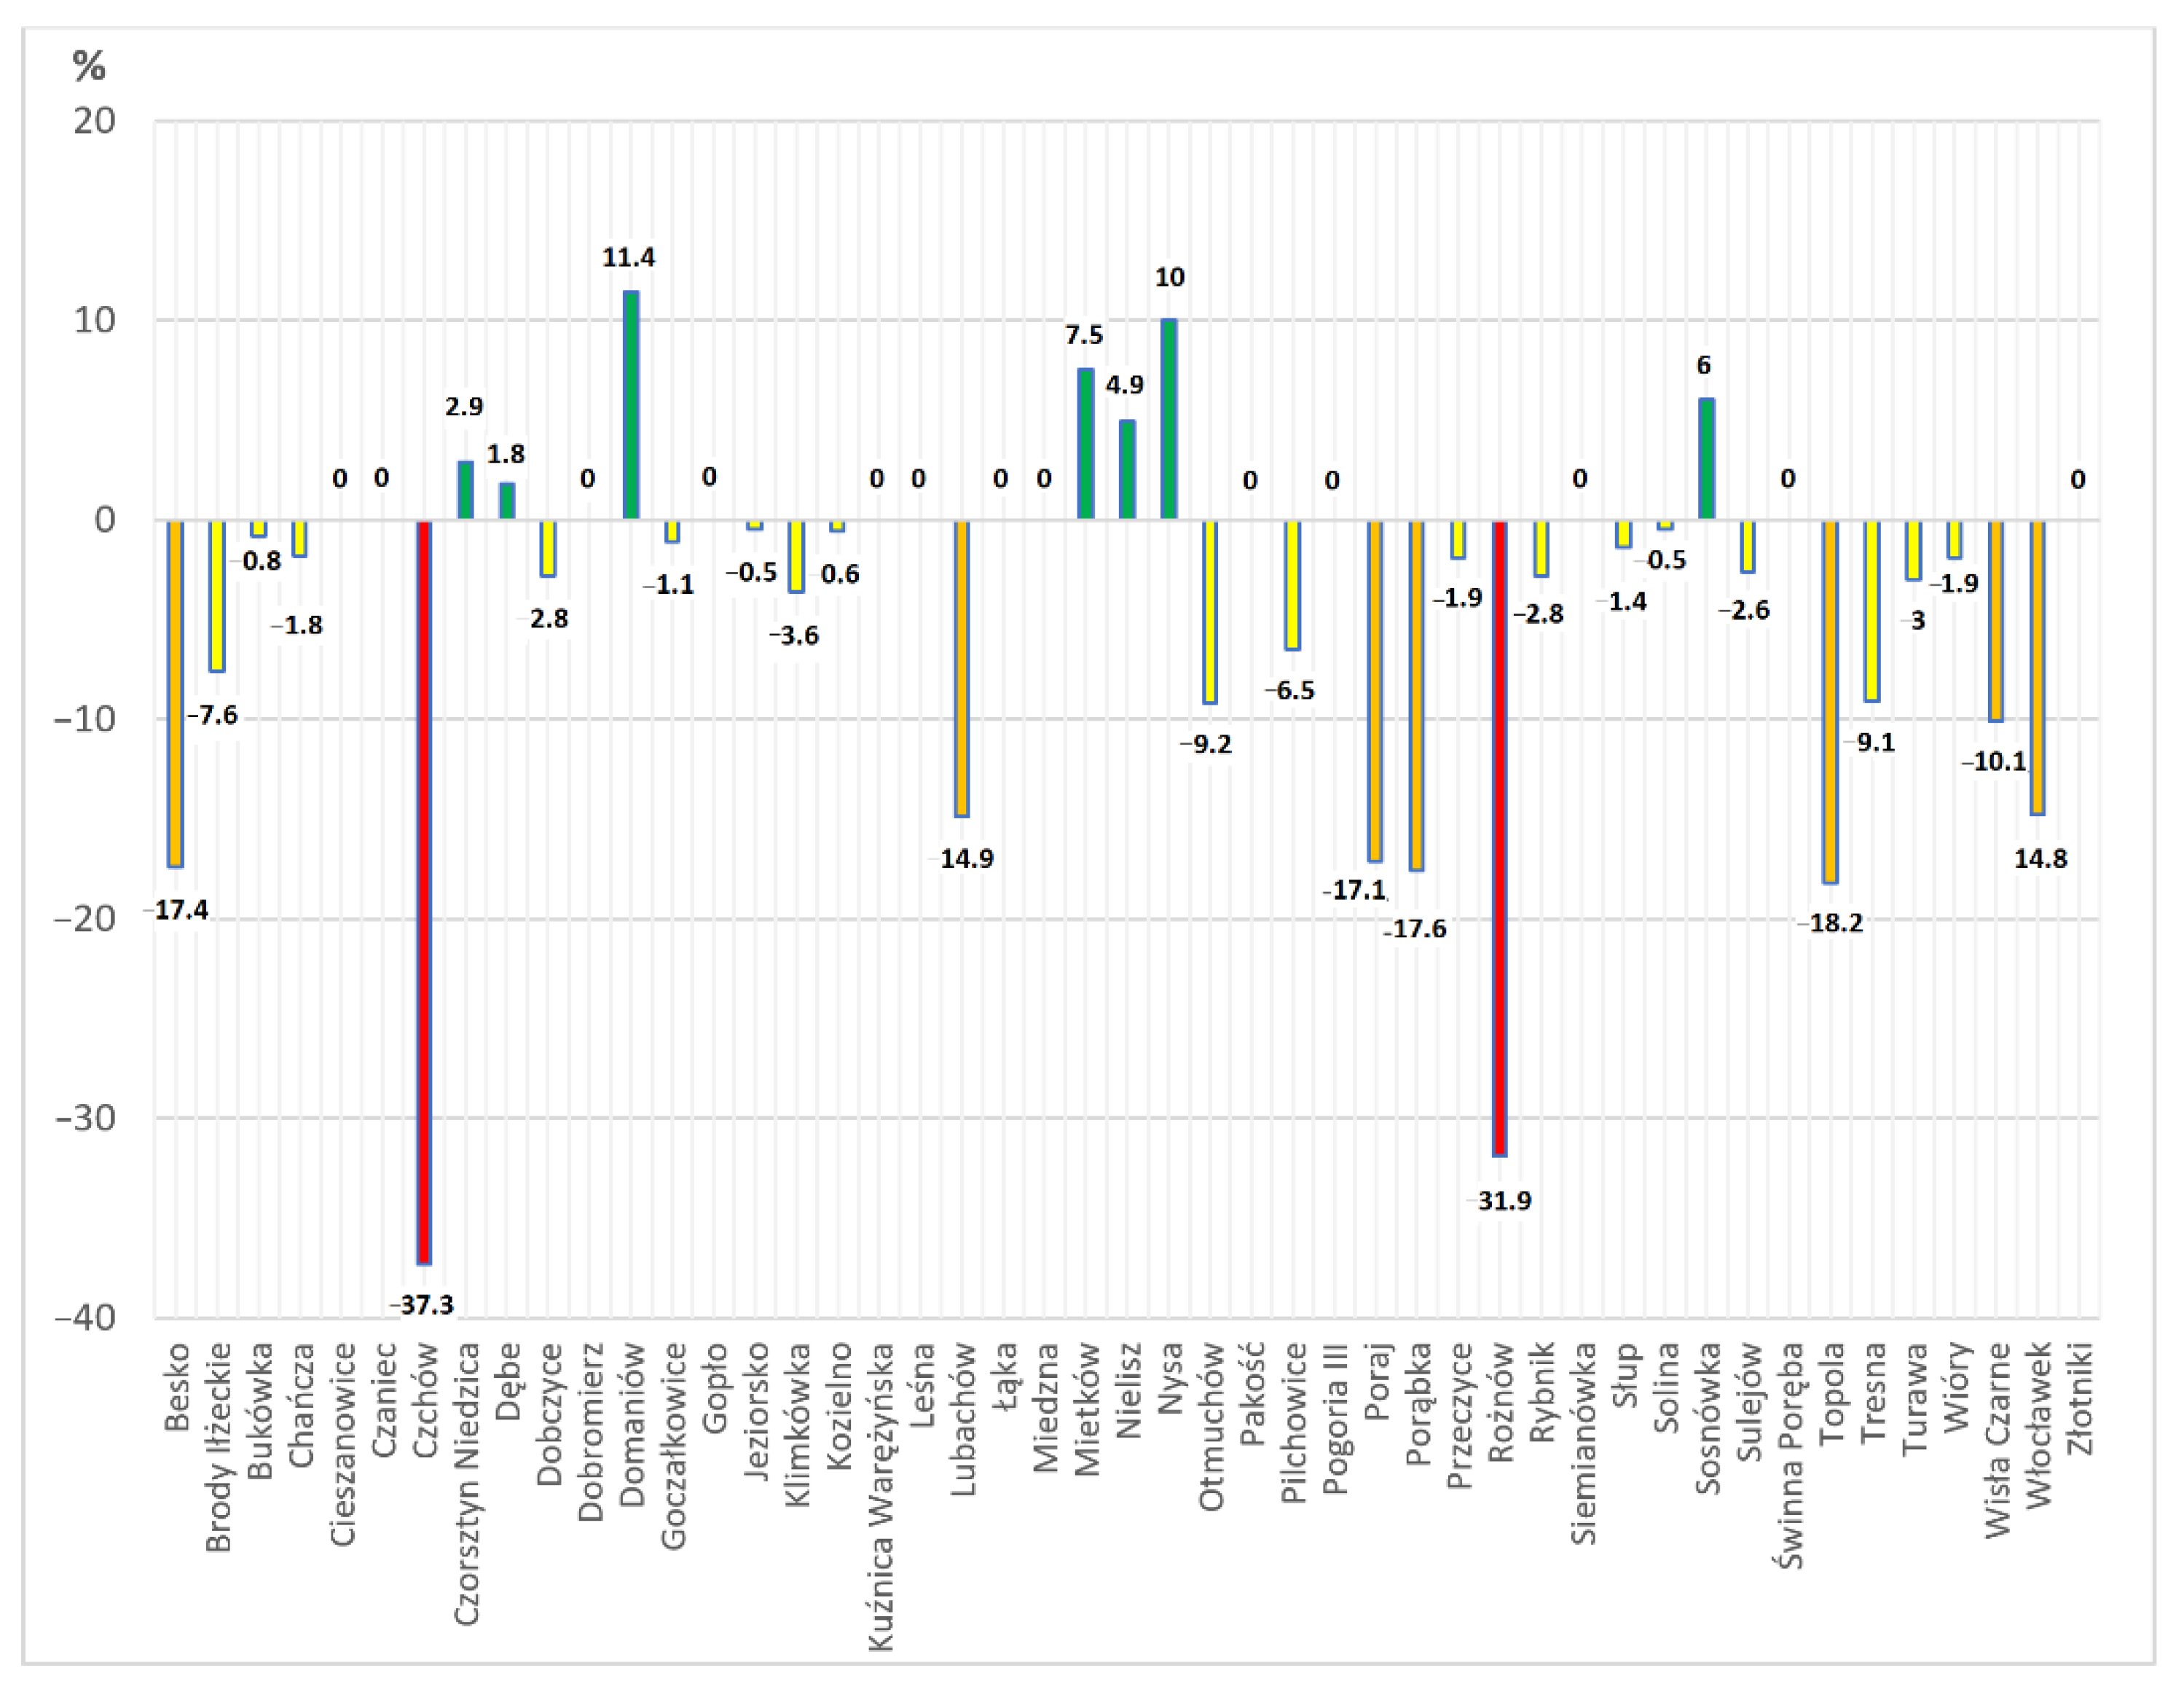
3.1. Capacity Change Analysis

The total initial capacity of the analyzed reservoirs at their maximum damming level (MaxDL), understood as their designed maximum capacity for the passage of the flood wave, obtained at the stage of their commissioning, was 3677.751 million m3 (Table A1). Currently, it is lower by 5.2% and amounts to 3485.095 million m3 (Figure 2). As a result, it is possible to store 192.656 million m3 less water (Table 1). On this basis it can be concluded that we are dealing with a loss of almost 200 million m3, which can be compared to the loss in the national resources of one of the large reservoirs, e.g., Jeziorsko or Goczałkowice. It was found that in 27 reservoirs the capacity decreased by 8.7% on average. The capacity limitation concerned both the reservoirs on mountain and lowland rivers. The capacity in the Rożnów reservoir on the Dunajec River, a Carpathian tributary of the Vistula River, decreased by a maximum of 31.9%. The Włocławek reservoir on the Vistula River (a lowland reservoir) lost most of the capacity, i.e., as much as 79.01 million m3 (14.8%), and the average annual capacity limitation was 1.549 million m3 (0.29%). In the analyzed 27 reservoirs that lost their capacity, the average annual capacity reduction was progressing at a rate of about 0.2%.
On the other hand, the volume of stored water at an NDL is 2717.04 million m3 (Figure 2) and it is extremely important in the context of counteracting the effects of drought and electricity production. It is also worth noting that the reservoirs have a total flood reserve (this is understood as the capacity of the reservoir intended for use when the flood wave is passing), between the NDL and the MaxDL [44] of 768.055 million m3 (which is about 22.0% of the total capacity), used when a flood wave is passing (Figure 2).
The conducted analyses show that the main reason for limiting the capacity of the discussed reservoirs is sediment supply. The conducted research shows that the suspended load constituted practically all clastic material delivered to mountain reservoirs, while the bed load is important in the case of lowland reservoirs [7]. In the lower reach of the Vistula, the percentage of bed load is as high as 87% [45]. In turn, bank erosion plays a varied role. As it turns out, in the case of reservoirs located in the Carpathians, the supply of sediment in this way is effective only in the first 10–20 years of their operation, and then it practically disappears, while in the case of lowland reservoirs it is constantly observed [7]. At the same time, permanent retention of up to 100% of bed load and suspended load results in an immediate reduction in transport and sedimentation in the lower course of the river [46]. In 27 reservoirs, a decrease in capacity was noted (Table 1), the initial value of which at the maximum damming level was 2575.537 m3. However, it has now dropped to 2354.252 m3, i.e., a difference of as much as 221.105 million m3 is visible—almost 9% of the state from the start-up period. In the case of 7 reservoirs, the capacity at the maximum damming level increased on average by 5.6%, i.e., 28.449 million m3. The highest increase, by 11.4%, was recorded on the Domaninów lowland reservoir on the Radomka River. The Czorsztyn reservoir on the Dunajec River (mountain reservoir) gained the most capacity, as much as 6.653 million m3 (2.9%). In 13 out of 47 analyzed reservoirs (28% of reservoirs), a similar value of capacity was maintained (Table 1). This may result from several variables, including, for example, proper water management (water management manual) and the lack of sediment supply. Structure of capacity the analyzed reservoirs can be seen in Figure 3 and spatial information in Figure 4.
It was found that both natural and artificial processes determining changes in their capacity took place in the analyzed reservoirs. In the statistical analyses, no relationship was found between the time of operation and the degree of sediment filling. There is a visible difference in terms of the degree of capacity changes in relation to the initial capacity, which resulted in the division into the following classes (Figure 3 and Figure 4):
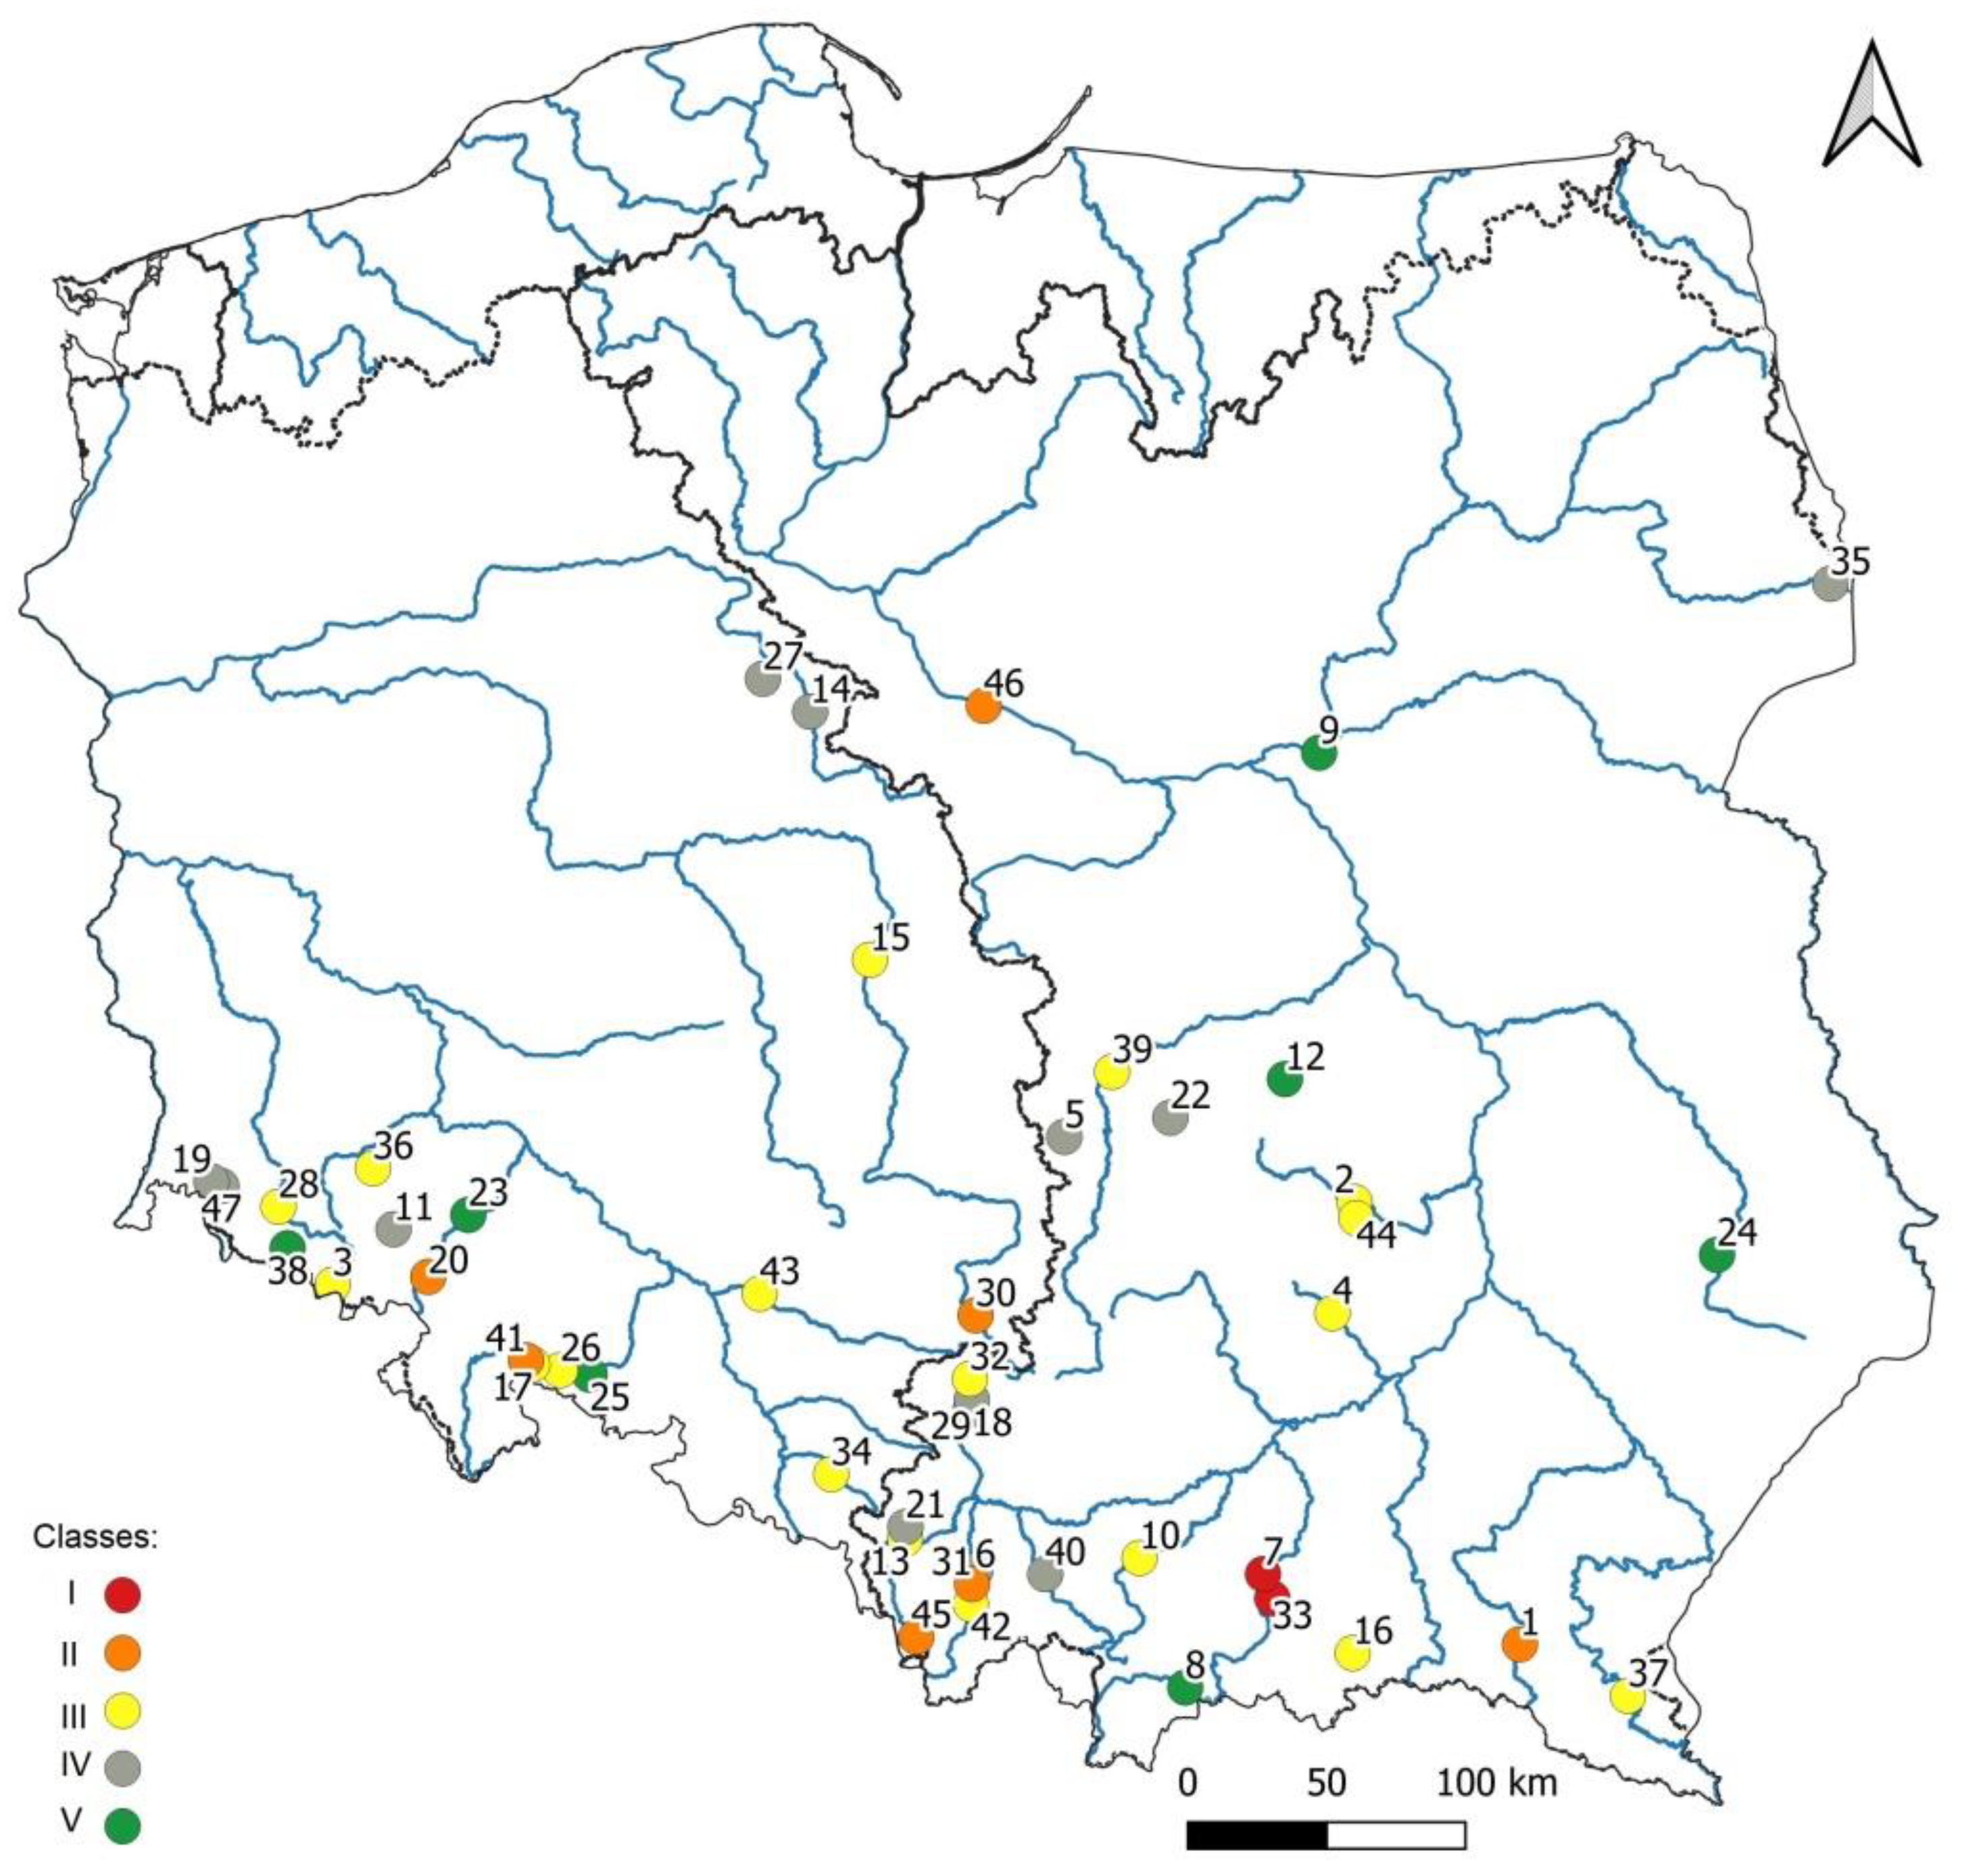
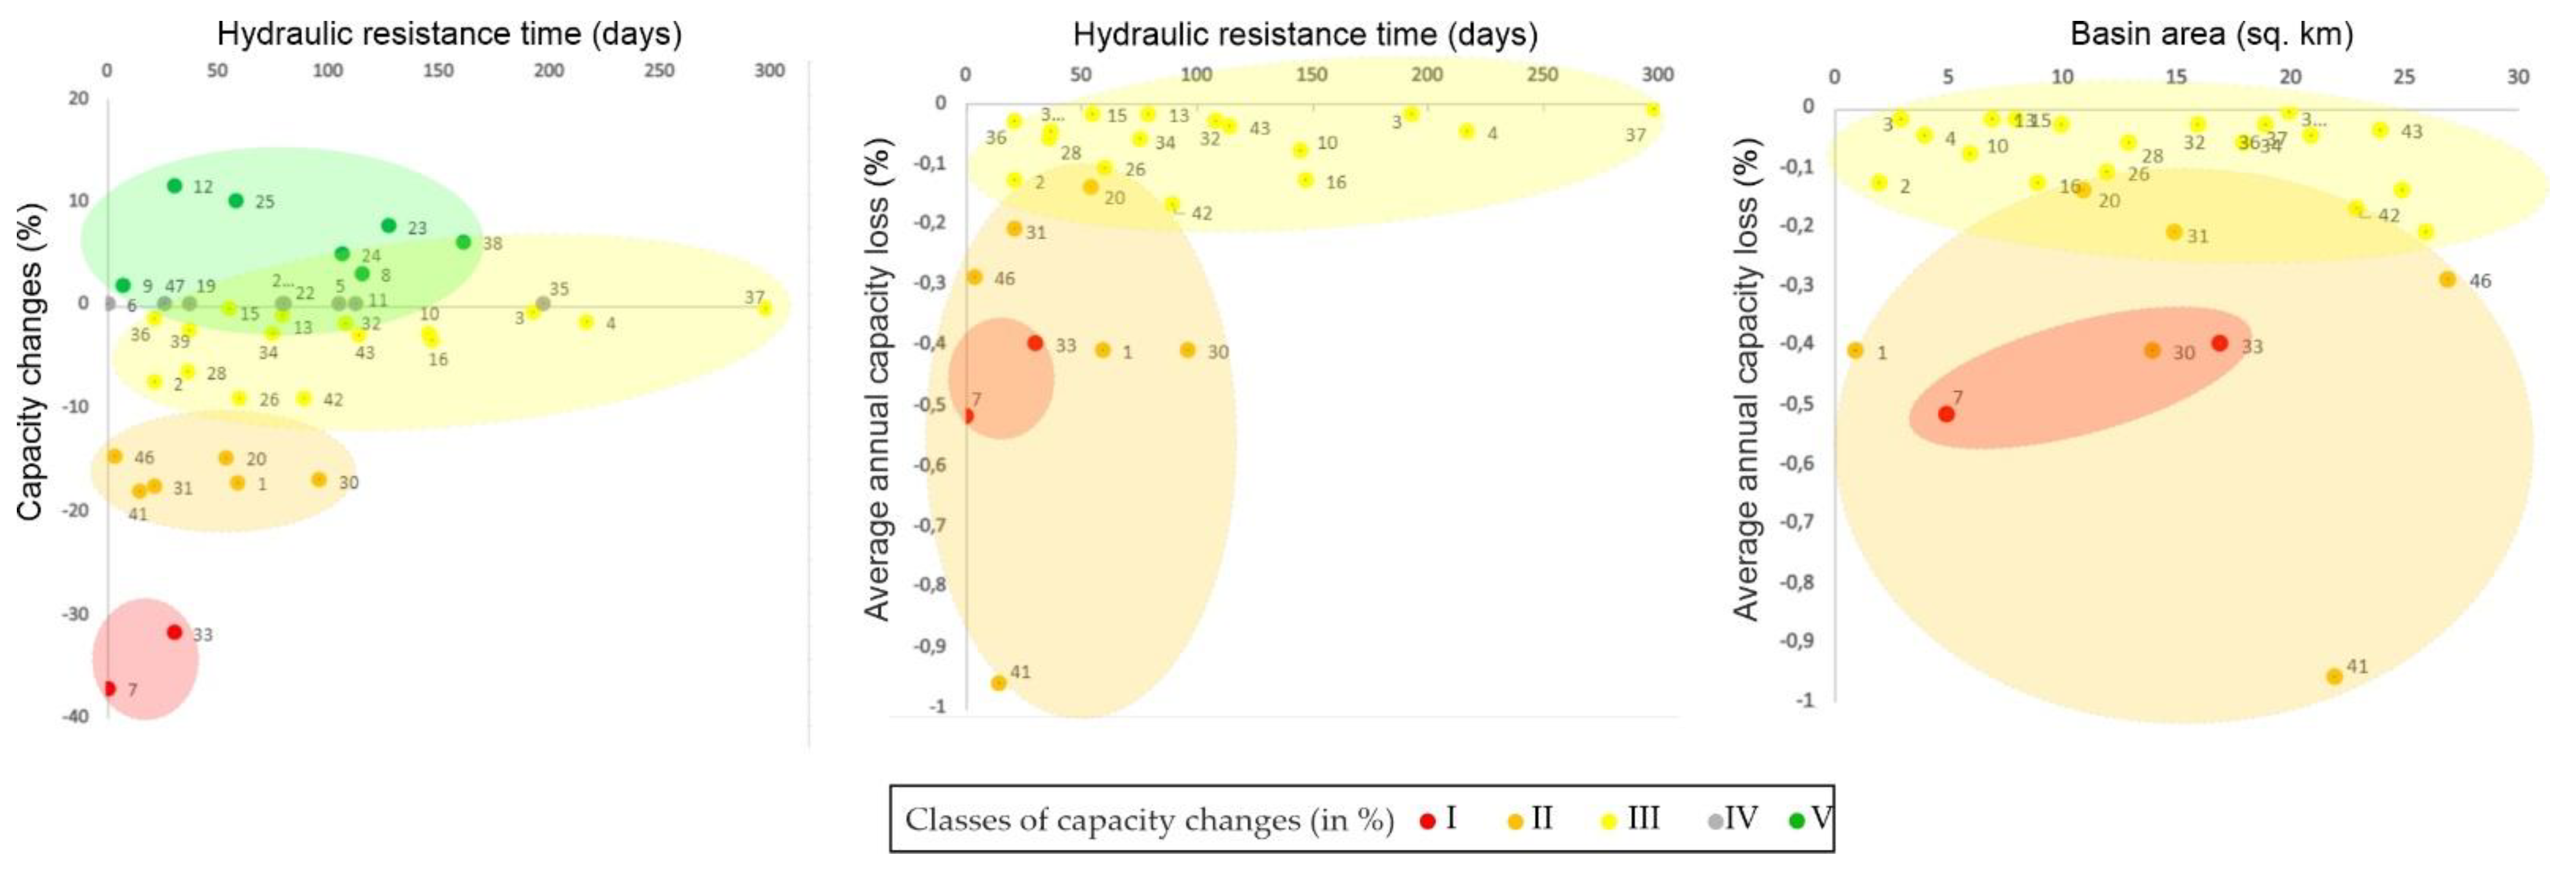
  • I—large loss of capacity—over 30%;
  • II—a significant loss of capacity—10.1–30%;
  • III—moderate loss of capacity—0.1–10%;
  • IV—constant capacity;
  • V—increase in capacity.
The highest unit loss of capacity at the MaxDL in relation to the initial capacity was observed in the case of the Włocławek reservoir (class II), amounting to 79.010 million m3 and representing 14.8% of the initial capacity recorded at the time of commissioning the facility (Table 2). This size is comparable to, e.g., the current capacity of the Mietków reservoir (77.220 million m3). The capacity at the time of commissioning of the Włocławek reservoir was 532,600 million m3, while the current maximum water storage capacity is 453,590 million m3. The reason for this is the intensive delivery of bed load from the drainage basin with an area of 168,900 km2 and its accumulation, mainly in the upper part of the reservoir [46], as well as large-scale landslide processes as well as peeling and falling off of the material, which is a significant source of clastic material supply [46]. However, the supply of bed load to the reservoir is limited from year to year due to its backwater zone extending upstream [47]. The Włocławek reservoir is a run-of-the-river reservoir and, despite its large size, its retention time is only 4.5 days [48]. A large loss of volume was also recorded on the Rożnów reservoir on the Dunajec River (class I). Its initial capacity was 228.700 million m3 and decreased to the level of 155.770 million m3. The lost 72.930 million m3 of retention capacity is a value higher than the capacity at the MaxDL of 2/3 of the analyzed reservoirs. It also corresponds to 31.9% of the value from the commissioning period of the facility (Figure 3 and Figure 4), and a loss of 28% was found already in 1990. During 50 years of the reservoir’s operation, the upper part of the backwater was completely silted, and the length of the reservoir at medium damming during this time was shortened by 40% [7]. In terms of the percentage loss of retention capacity, the Rożnów reservoir is far behind the much smaller Czchów reservoir (class I)—another one on the Dunajec River, located directly downstream from it. The drop in capacity is large and amounts to 37.3%, which corresponds to 4.470 million m3 (Table 1). In the case of both of these reservoirs, the cause is the delivery of bed load, the accumulation of which is particularly visible in the backwater zones. In the Rożnów reservoir, it is transported mainly with the Dunajec River, while for Czchów, the supply from this river is significantly limited. It is a shallow valley reservoir in which the delivered clastic material may be deposited for a longer period only in the absence of high floods, as the accumulated sediments are subject to intense erosion during them. It is a consequence of a sudden discharge of water from the upper reservoir of the cascade for the purposes of maintaining a flood reserve [7]. Therefore, the Łososina river is a potential source of the deposited material in the Czchów reservoir. After 1975, river engineering works were carried out along its bed to prevent erosion and reduce water table falls. A hydrotechnical structure was built with low-head-dams (against bed load transport/accumulation) and gabions protecting the banks. These works were aimed at reducing the transport of bed load by the Łososina river and limiting its supply to the Czchów reservoir. As a result, the bed load decreased by 13.3687 kg·s−1 m−1. This is useful information from the point of view of river management practices, as the reservoir is additionally a source of drinking water for the region [49]. Over a longer period of time, the alternation of years with positive and negative sediment silting balance was observed. Therefore, the retention capacity of the Czchów reservoir started to oscillate around 0% after only a few years after its commissioning, and due to the lack of a large flood on the Dunajec in the years 1977–1988, the values were in the range of 15–83%. In the longer term, the volume of the outflow of the suspended load from the shallow Czchów reservoir will be similar to the volume of its delivery [7].
A significant loss in the volume of stored water, ranging from 10.1 to 18.2% (class II) of the initial value, was recorded in the following seven reservoirs: Topola, Porąbka, Besko, Poraj, Lubachów, Włocławek, and Wisła Czarne (Figure 3 and Figure 4). Together, they are responsible for the loss of 98.231 million m3 of retention capacity (Table 1). The average loss of capacity in this group is 15.7%—the Włocławek reservoir described above dominates, and the unit values in the Topola (4.824 million m3), Porąbka (5.660 million m3), and Poraj (4.298 million m3) reservoirs are greater than the current capacity at the maximum damming of the Wisła Czarne reservoir (4.044 million m3). On the other hand, in the remaining 18 reservoirs, where a decrease in capacity was observed in relation to the initial value, the percentage of changes was in the range above 0% to 10% (class I). The lowest losses were recorded in the Jeziorsko and Solina reservoirs, 0.5% each, and the highest ones were recorded for Otmuchów (9.2%) and Tresna (9.1%). These are the largest reservoirs in this group, so it automatically translates into maximum unit capacity losses, amounting to 13.190 and 9.300 million m3, respectively. In this respect, slight losses of retention capacity were observed in the Kozielno (0.098 million m3) and Bukówka (0.130 million m3) reservoirs.
The analysis also allowed to distinguish eight reservoirs, which increased their retention capacity at the maximum damming level in relation to the initial capacity (class V). In two of them, the percentage of changes was 10 percent or more: number one in this class Domaniów (11.4%—from 12.985 to 14.370 million m3) and Nysa (10.0%—from 111,000 to 122.050 million m3) (Table 1). A relatively small change was recorded in the Dębe reservoir (the Zegrze lake), amounting to 1.8% but translating into an additional 1.680 million m3 of stored water. This reservoir is cyclically dredged due to the intensive supply of sediments by the Bug river [50,51]. On the other hand, in the context of counteracting the effects of drought and flood protection, a very large increase in capacity is visible on the Nysa reservoir, where during 50 years of its operation, the capacity increased by 11.050 million m3. This value is close to the capacity of the Łąka and Dobromierz reservoirs. One of the reasons for such a state of affairs is the completed project worth about USD 115 million, entitled “Modernization of the Nysa reservoir in terms of flood safety—stage I”, under which the Nysa Kłodzka riverbed was cleared, significant volumes of sediment were extracted, two large sources in one span were created in the discharge structure, and the overflow in the three remaining spans of this structure was lowered by 1 m [52]. Aggregate is also extracted from the reservoir under granted concessions, similarly to the Mietków reservoir. In the shallow reservoirs (Goczałkowice, Sulejów, Dębe), months with an increasing negative silting balance were observed, evidencing systematic erosion of accumulated sediments. In the first years of the functioning of the reservoirs, bank erosion can also significantly increase the flood control and hydropower capacity [7]. Another potential cause of the observed changes may be corrections of damming elevations or changes in the technique of bathymetric measurements (depth sounding of the reservoir) for the purpose of updating the water management manual. According to the information provided, despite the increase in the size of some reservoirs, there was a total capacity reduction at the maximum level of damming compared to the initial value by 192.656 million m3. It can be assumed that this is the size of the accumulated sediment and it could have been greater, if not for the dredging works carried out on individual reservoirs. Such activities were recorded, for example, in the Dobczyce reservoir, where 0.550 million m3 [21] of sediment were extracted in 2012, and Czorsztyn Niedzica in 2016, from which about 0.223 million m3 of bed load was collected [15]. Dredging works are also carried out systematically on the Włocławek reservoir, and in the years 2014–2019, a total of about 0.990 million m3 of sediment was extracted [19]. Therefore, on average, about 0.165 million m3 of sediment was excavated annually—the most, 0.264 million m3 in 2014, and the least, 0.114 million m3 in 2017. However, taking into account the size of the bed load accumulated in the reservoir’s backwater, it can be concluded that the need for deepening is considerable.
In the Włocławek reservoir, in addition to the information on the sediments excavated in 2014–2019, in order to fully present this topic, it is also necessary to note that such activities have also recently been carried out, producing the following volumes of collected sediments:
  • approx. 1 million m3 in the years 1980–1981 in the region of Płock;
  • 11.6 million m3 in the years 1983–1987 on the longer section of Płock–Duninów–Koralewo;
  • 0.5 million m3 in 2002–2003 in the area of the so-called Kępa K-14 [53];
  • 0.05 million m3 in 2021 in the Płock area and works on a larger scale are planned.
Dredging works on the Włocławek reservoir are mainly aimed at ensuring appropriate conditions for winter flood protection [54], including the permeability of the bed for ice flow in a longitudinal profile. Their importance was visible, e.g., in 2021, where, due to significant ice cover, the icebreaker action also reached an area of intense sediment accumulation. During the initial years of the reservoir’s operation, when dredging works in the upper part of the reservoir had not yet been carried out on a massive scale, its retention capacity decreased from 80 to 35%. However, after 1982 the silting rate slowed down about two times and due to the increase in capacity, the retention capacity of the reservoir quickly increased—in 1990 it again reached 80%. The dredged material undergoes, inter alia, deposition near the banks of the reservoir, and part of it, as a result of increased water turbidity caused by the work of dredgers, flows away from the reservoir. In addition, selected Pliocene clay outcrops were covered by thicker material extracted from the bottom of the reservoir, which prevents them from being washed out and from participating in silting of the reservoir [46]. Moreover, damming the waters of the Vistula with the dam in Włocławek completely inhibited the transport of bed load. It was assumed that the reservoir retains approximately 42% of the suspension [55], and most of the bed load remains accumulated in the reservoir [56].
Preserving the flood-prevention capacity of this largest reservoir in Poland is crucial, because the volume of the flood wave in this section of the Vistula ranges from a few to a dozen or so billion m3—it exceeds the volume of the reservoir (at Q = 3000 m3/s, and filling to MaxDL takes place after 12 h). According to the information presented, a significant reduction in retention capacity results from the intensive supply of sediment to the reservoirs. On an annual average, the waters of the lower Vistula in the unregulated, braided-anastomosing section in the years 1971–1995 transported nearly 1.5 million m3, while the extreme values for wet years are 2.2 million m3 and 0.7 million m3 in dry years [57]. On the other hand, according to Gierszewski [58], who used the sediment sounding method, an annual average of 1.2 million m3 of material is accumulated in the reservoir, and Babiński, Habel [59] estimated their quantity at 1.25 million m3 on the basis of repeated bathymetry measurements.
Desilting works carried out on the Czorsztyn Niedzica reservoir meant that it can now be classified as class V—to the group of reservoirs with an increase in capacity. In addition, dredging works are planned on the Przeczyce reservoir, where a total of 0.400 million m3 is expected to be extracted in the years 2023–2025 [31], which is to allow the recovery of the initial capacity. Proper diagnosis of the reservoir’s desilting needs and proper planning of this process together with subsequent management is important for maintaining appropriate parameters of individual reservoirs and retention in the country.
However, according to the information obtained from the regional water management boards of the State Water Holding Polish Waters, for the vast majority of the retention reservoirs analyzed in this study no desilting works are carried out or planned. However, it should be remembered that such activities do not always bring the expected results and are often very expensive, and in addition they do not replenish sediment downstream of the dam [60]. Therefore, it is necessary to take action in the reservoirs’ watersheds, which has turned out to be effective in the case of the described regulatory work on the Łososina River (a hydrotechnical structure was built with low-head-dams and gabions protecting the banks), which was the main source of sediment transport to the Czchów reservoir [49]. Other examples of solutions include:
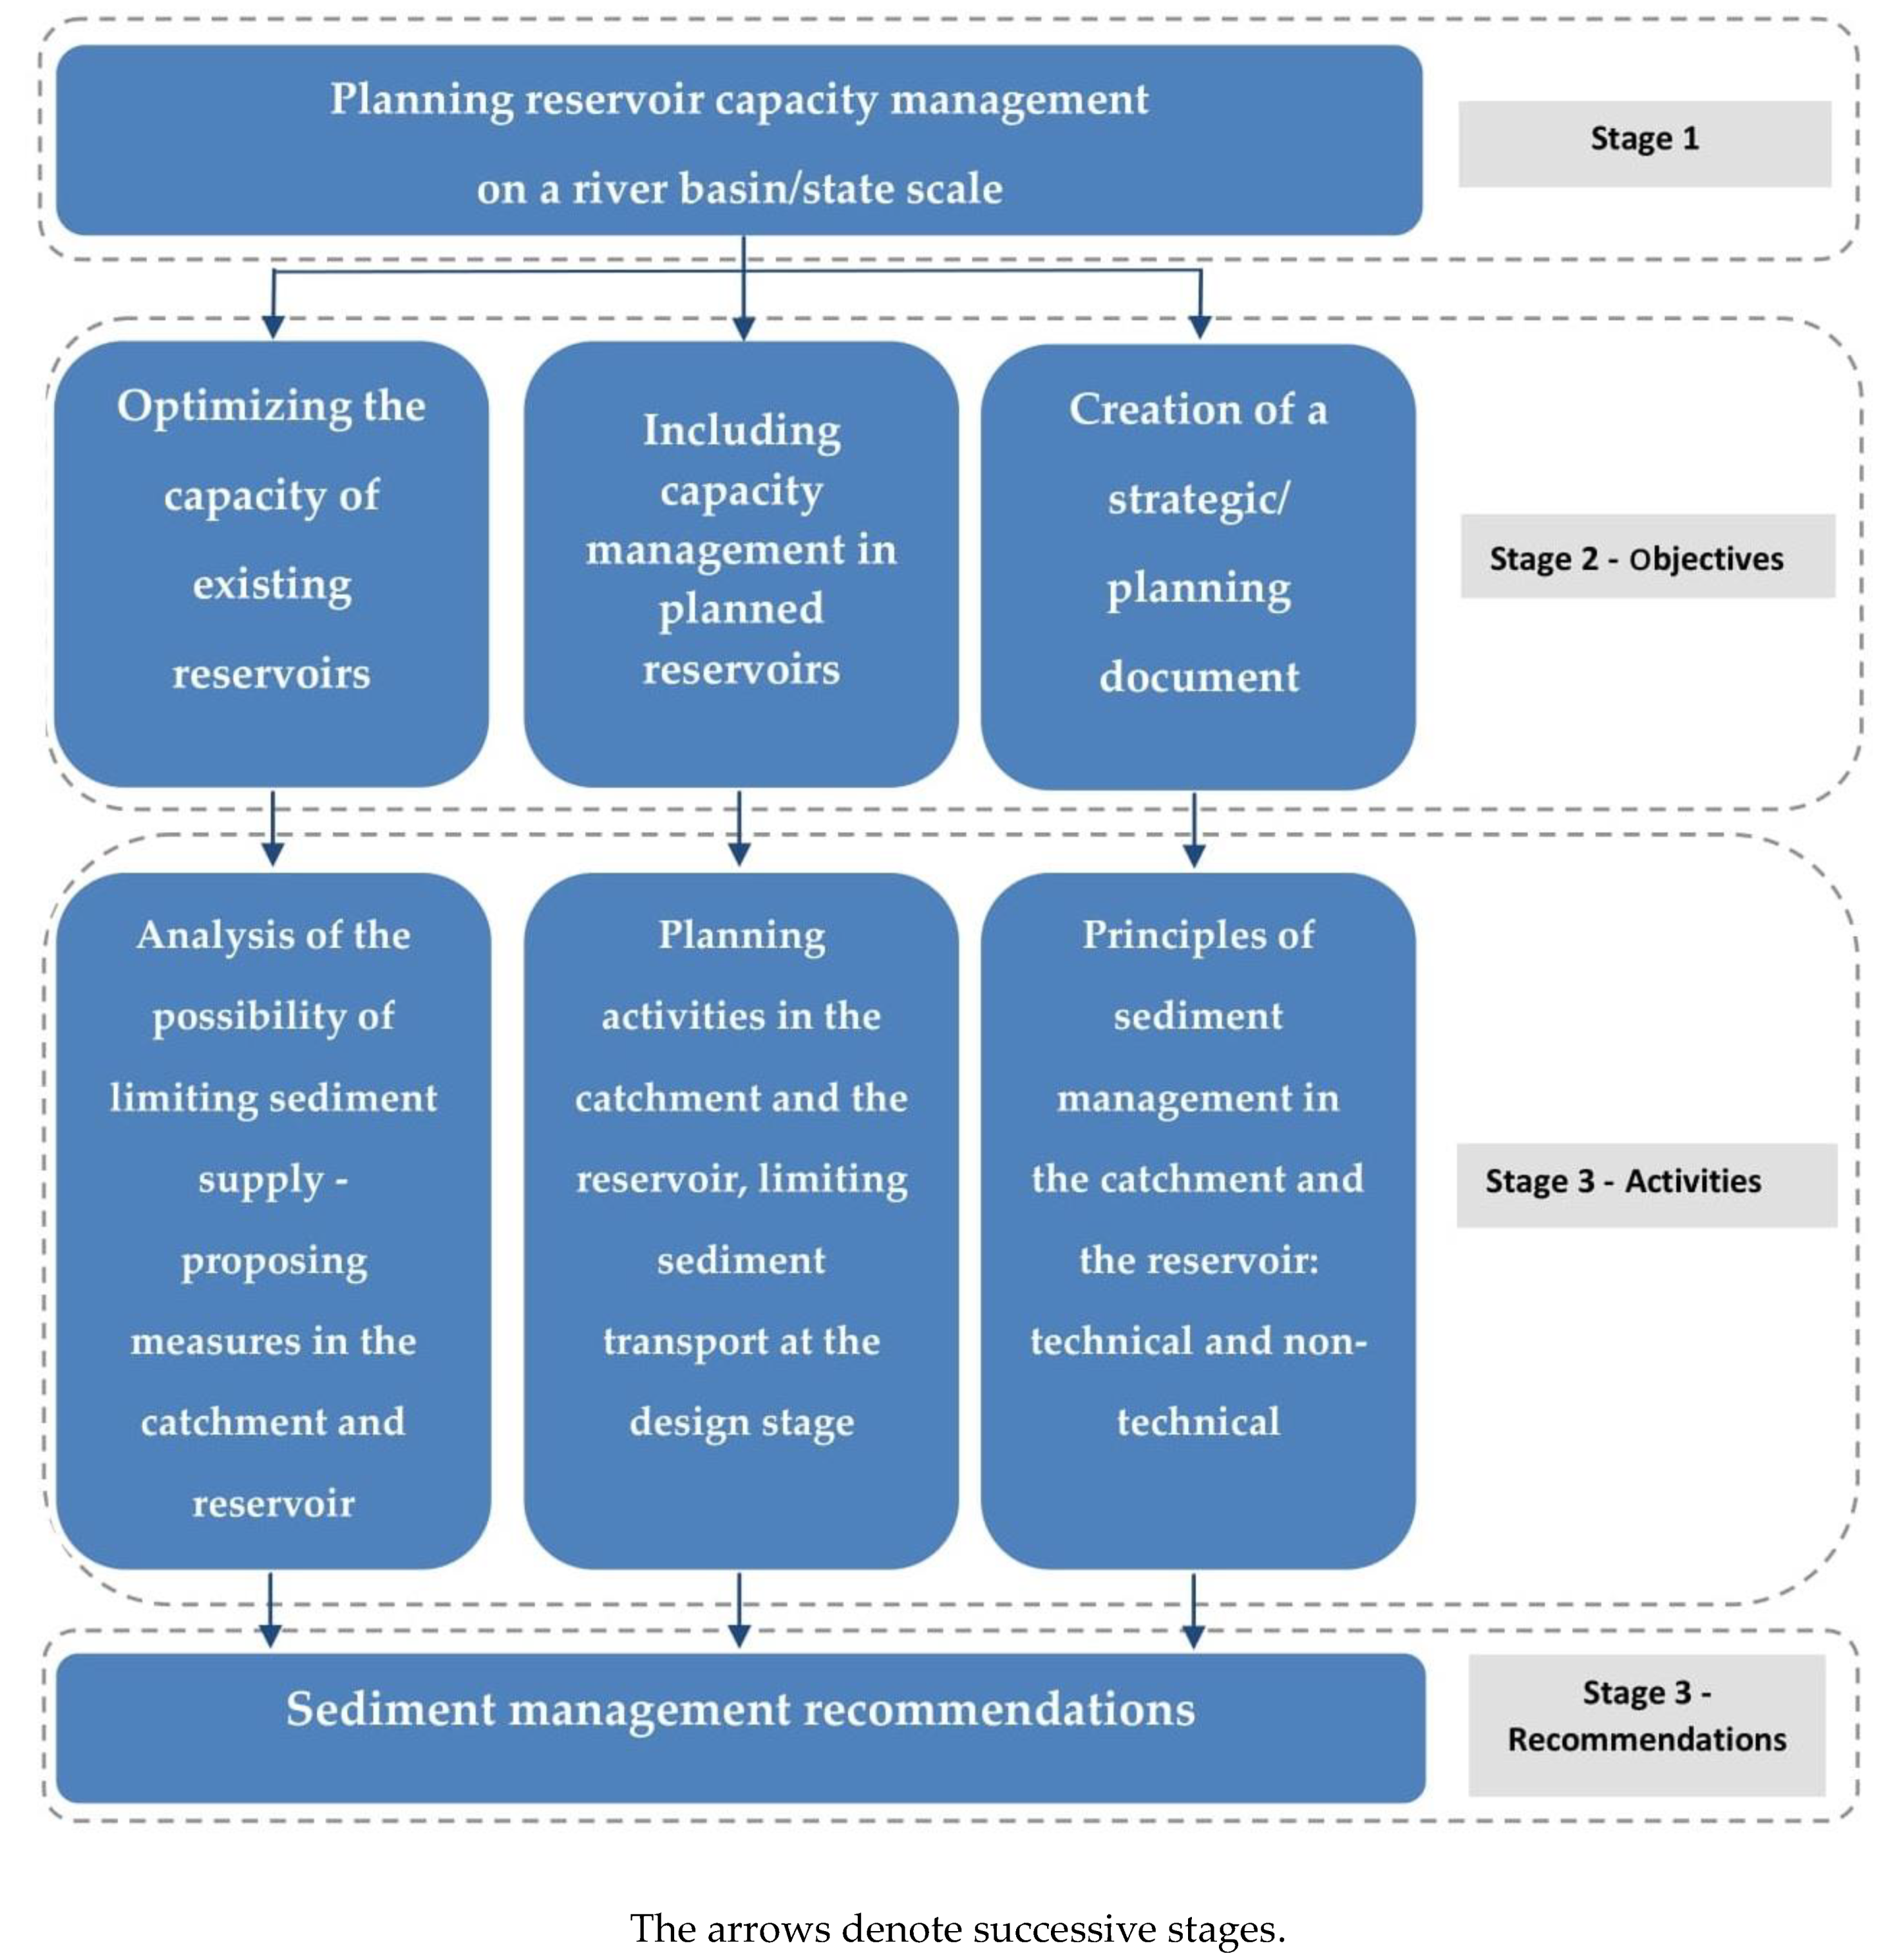
  • Check dams—their task is, for example, to trap sediment before reaching the lower reservoir;
  • Sediment traps—low dams located directly in front of the reservoir to catch sediments, especially coarse-grained fractions;
  • Warping—directing flowing water to agricultural areas, designed to accumulate debris there [1].
Such activities, enabling sediment management, should be applied at the stage of dam construction [13]; however, even for the existing barrages, it is recommended to analyze various options for limiting sediment supply.
The need to undertake the above-mentioned dredging and river training works does not arise in the case of reservoirs for which the capacity has not changed (class IV), which constitute approximately 25% of the analyzed objects. These are the reservoirs: Cieszanowice, Czaniec, Dobromierz, Gopło, Kuźnica Warężyńska, Leśna, Łąka, Miedzna, Pakość, Pogoria III, Siemianówka, Świnna Poręba, and Złotniki (Figure 3). This group includes both the youngest of the considered reservoirs, Świnna Poręba—it has been operating for only five years, and the oldest, Leśna—launched 109 years earlier.
In the case of Lake Gopło and the Pakość reservoir, natural factors (lack of supply of larger amounts of bed load from the Noteć river supplying the reservoirs) and artificial factors related to the operation of hydrotechnical devices, determined the maintenance of a constant capacity. The water level for both reservoirs depends on the same weir [61]. The Pakość reservoir was created by raising the water table by 4.5 m and connecting three lakes: Pakoskie Północne, Pakoskie Południowe, and Bronisławskie, due to which another 41.4 million m3 of usable capacity was obtained [62]. On the other hand, the damming of the Gopło reservoir in the 1970s resulted in obtaining additional retention capacity, which amounts to 21.660 million m3. In this case, all conditions and limitations on the possibility of storing water are caused by the necessity to protect the surrounding historic buildings, as well as valuable natural areas in the area of the Nadgoplański Park Tysiąclecia (the Gopło Millennium Landscape Park) [61].

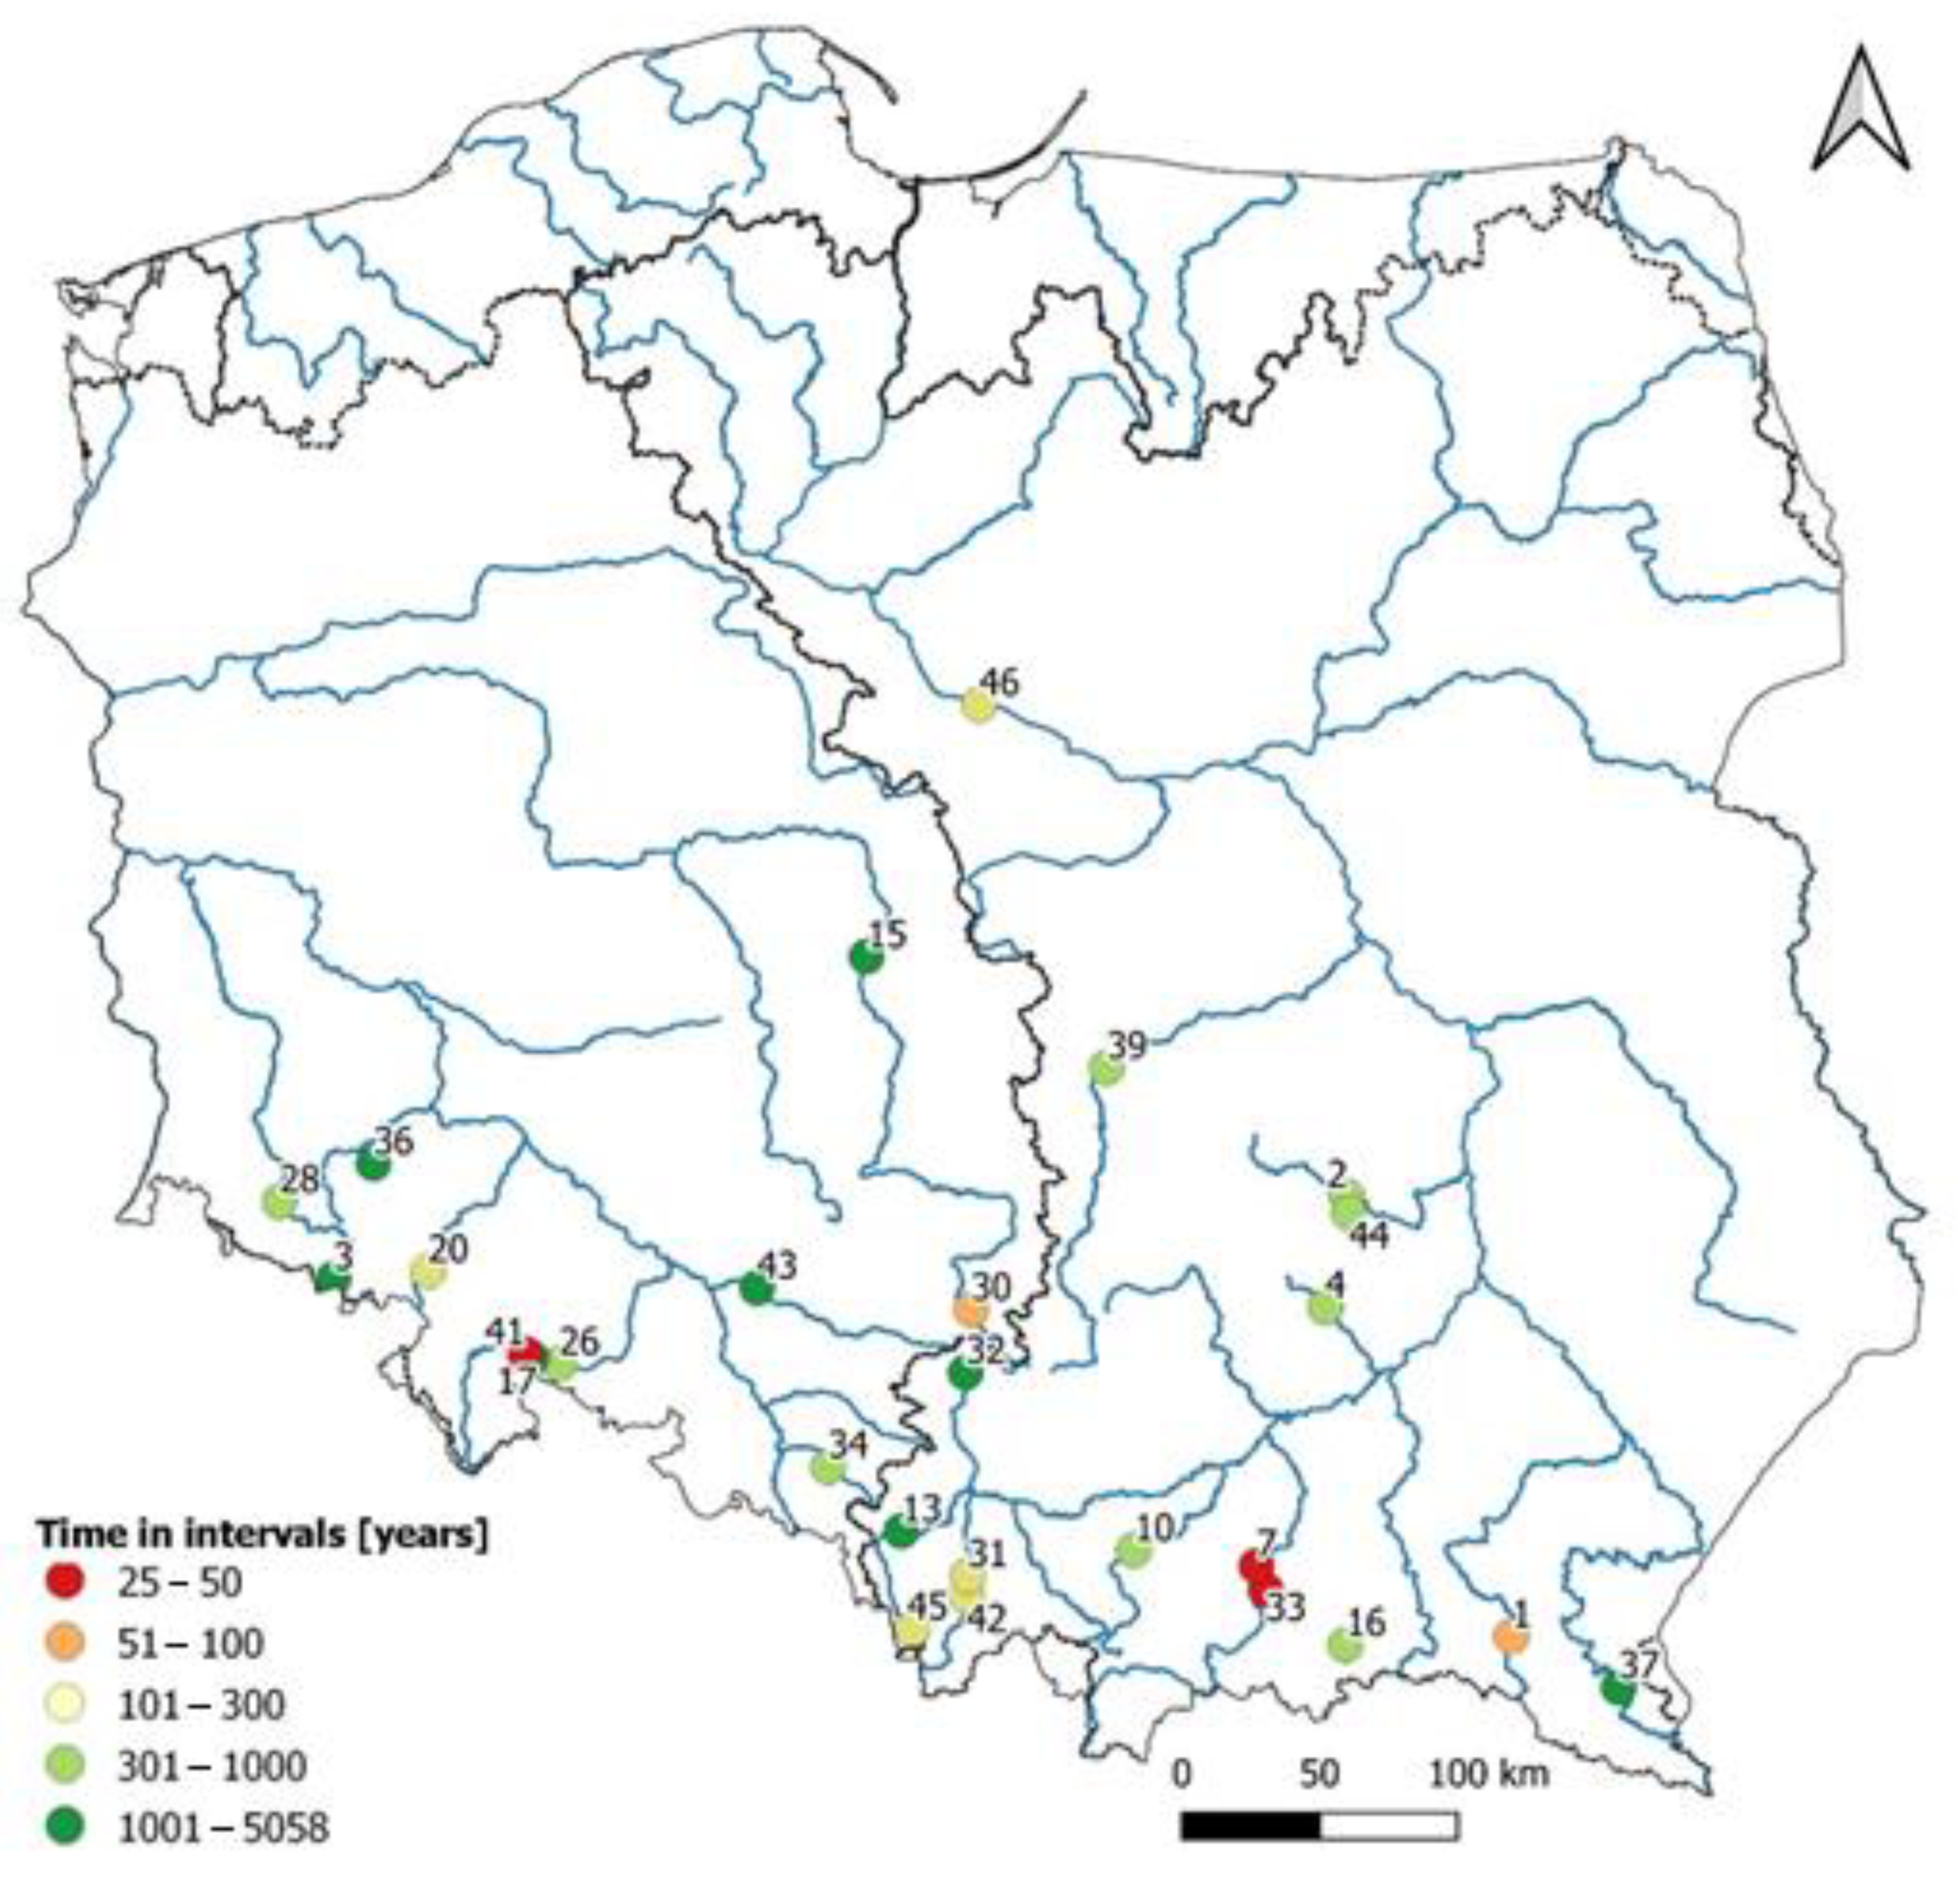
3.2. Rate of Capacity Changes and Service Life Assessment

Only selected reservoirs with visible loss of capacity were subjected to detailed studies of the changes taking place. Two basic parameters were analyzed: the rate of the annual capacity loss processes in the unit and percentage terms (Table 2), as well as the related forecast of changes. The time needed to lose 50% and 80% of the initial capacity was also calculated. The average annual silting index is influenced by many factors, including: geological structure of the catchment area, relief, climatic conditions, vegetation, hydrological relations, and anthropogenic elements, such as the size of the reservoir, hydrotechnical structures, and land use in the catchment area [7]. On the other hand, taking into account the current trends made it possible to determine the service life of individual reservoirs in the short—(50% of the initial capacity at the MaxDL) and long—(80%) terms. The adoption of the latter value for the analyses results from the fact that it is assumed in the literature that when this level is reached, the reservoir ceases to fulfill its retention function. In fact, it depends on the characteristics of individual objects and theoretically may range from slightly more than 0.0 to almost 100%. For this reason, the calculated values of the duration of this silting phase should be considered only as an illustration [7].
The rate of loss of reservoir capacity depends on two quantities, which are influenced by natural factors and human intervention: the annual supply of bed load to the reservoir and its ability to permanently retain sediment. The dimensions and pace of this process are also determined by their: depth, capacity, shape and morphology and service life, with the lapse of which, as a result of progressive shallowing, the sedimentation possibilities decrease [7]. Considering the rate of silting, the very high intensity of this process is visible in the Włocławek and Rożnów reservoirs, where on average each year they lose 1.549 and 0.923 million m3, respectively (Table 2, Figure 5). This is a huge loss of capacity, and it certainly has an impact on the flood protection, power generation and retention functions in the context of counteracting the effects of drought. This can also be compared to the situation where every year we would lose two objects of the size of the Czaniec reservoir—the calculated average annual silting rate of the Włocławek reservoir alone is greater than its size. The average annual silting of the Topola reservoir, next in this list, is definitely lower, i.e., 0.254 million m3. The level of 0.100 million m3 was exceeded in another three reservoirs: Tresna (0.172), Otmuchów (0.150), and Poraj (0.102 million m3) (Table 2). In other sites, the annual amount of sedimentation was lower, and trace values were observed for the following reservoirs: Bukówka (0.004), Kozielno (0.005), and Przeczyce (0.007 million m3) (Table 2).
The rate of silting of reservoirs was also analyzed in terms of the percentage of lost capacity each year in relation to the initial capacity. Topola (0.96%) is the leader in this class, and its higher position than the Rożnów reservoir (0.40%) was influenced by a significant difference in their initial capacity (Figure 5). In the case of the Rożnów reservoir, a slower silting process was observed, as the rate of capacity loss found at the end of the 20th century was 0.58% of the initial capacity per year, while in the first 20 years of operation it was even twice as fast [7]. The following reservoirs also have high values of the percentage of capacity lost each year: Czchów (0.52%), Poraj (0.41%), and Besko (0.41%), but the rate of changes significantly differs from the first two places (the Topola and Rożnów reservoirs). For almost half of the reservoirs (12 out of 27), the average annual percentage of lost capacity does not exceed 0.1% (Figure 5). It is practically a trace loss, e.g., in the case of the Solina reservoir 0.01%, and the Bukówka, Goczałkowice, and Jeziorsko reservoirs—0.02% each. When analyzing historical data of volume measurements performed cyclically in the periods of operation of selected reservoirs, the relationship between the annual rate of capacity loss and the age of the reservoir is visible. That is, with the extension of the operating time, the value of the annual rate of capacity loss decreased. For example, in 1999 its value for the following reservoirs: Włocławek—0.38% of the output capacity, Tresna—0.24%, Goczałkowice—0.04%, and Solina—0.02% (7), while the current values in 2021 for the indicated levels are respectively: 0.29%, 0.17%, 0.02%, and 0.01%, which gives a limitation of the amount of capacity loss from 23% to 50%.
We carried out the strength of the Spearman’s rank correlation between the calculated indices of the characteristics of the capacity change and the average annual rate of capacity loss in reservoirs with the characteristic features of the reservoirs: hydraulic resistance time, and the basin area. We showed the relationship on Figure 6. The correlation for the calculated indicators of average annual capacity loss (%) to hydraulic resistance time (days) is statistically significant (p = 0.008). The strength of the correlation is clearly marked by a moderate relationship (class II reservoirs) and a very strong relationship (class I reservoirs) of variables in the impact of hydraulic resistance time (in days) on the calculated indicators. Therefore, hydraulic resistance time could have a significant relationship on the negative change in the capacity of the tested reservoirs and thus a significant annual loss of capacity. In the case of the catchment area feature, also only for I and II class reservoirs the correlation is positive (high correlation). Reservoirs in classes III–V are characterized by a large dispersion of values on the chart in all analyzes, which proves the potential impact of the other factors, e.g., hydraulic engineering works, on changes in their capacities.
The presented data on the average annual rate of silting of reservoirs made it possible to prepare forecasts for the loss of capacity, i.e., the so-called service life. The short-term perspective was chosen, defined as the number of years needed to lose 50% of its initial capacity, and the long-term one, at 80%, often requiring the reservoir to be decommissioned. Out of 26 analyzed reservoirs (Table 2 and Figure 7), two of them, i.e., Czchów and Topola, stand out in particular. In the case of the former, the obtained results indicate that if the present silting rate was maintained, it would lose half of its original volume in 25 years, and 80% within 39 years (Figure 6). We know, however, that the engineering works carried out on the Łososina river, which supplies the Czchów reservoir, has resulted in the reduction of the bed load transported to the reservoir, which is why a scenario of extending its lifetime is likely [49]. The example of the Czchów reservoir shows that it is necessary to be careful when calculating the service life solely on the basis of data on the initial and current capacity. As proven above, the rate of filling reservoirs with sediments may change during operation. Analogous calculations for the Topola reservoir show that it will lose half of its original volume in 33 years, and 80% in 53 years (Figure 6). The Rożnów reservoir on the Dunajec River is also characterized by a short service life, for which the number of years needed to reach 50% of the output capacity is 45, and the 80% level is 72 years (Figure 6). Apart from those mentioned above, no other reservoir should lose half of its initial volume before year 2100. In the first half of the 22nd century, such a possibility is potentially available to the Besko (year 2121) and Poraj (year 2122) reservoirs. The conducted analyses also show that many reservoirs can be considered long-lived—their life span is over 1000 years (Table 2, Figure 7). The comparison clearly distinguishes Solina, where, while maintaining the same silting rate, half of the capacity will be filled in 5058 years, and 80% only potentially in 8094 years (Figure 7). It is also related to the fact that the retention period is the longest for it, amounting to 299 days. This group also includes: Jeziorsko, Goczałkowice, and Bukówka. However, it should be remembered that the above calculations are prognostic and the actual pace of changes in the reservoirs depends on many factors and may differ from the presented data in the future.

4. Discussion

There are 69 reservoirs in Poland with a capacity exceeding 5 million m3 [63], and a further 31 reservoirs have a capacity of 1 to 5 million m3 [64], and in total they can collect almost 4 billion m3 of water, which is only 6% of the average annual runoff of Polish rivers. As a result, the national volume of reservoir retention per capita is only 60 m3 and it is over 20 times lower than the world average [65]. Meanwhile, rational management of water resources requires reaching the capacity of these reservoirs oscillating around 20%, which corresponds to about 11–12 billion m3. It is assumed that in Poland it is possible to achieve reservoir retention at the level of approximately 15%, i.e., 8.4 billion m3 [66]. The factors limiting the achievement of the maximum parameters in this respect are, among others, topographic conditions, population density and the degree of development of the country [29] and constraints resulting from the need to achieve good water status [27]. The vast majority of water resources in Poland, i.e., 87.5% (53.9 km3), are of own origin, and the remaining 12.5% (12.7 km3) have sources outside the country. The average total volume of surface waters over many years is 61.6 km3—95.5% of which flow directly into the Baltic Sea, and the rest (4.5%) to the neighboring countries [67], to the Black Sea, and North Sea catchment area.
According to the information provided by the International Commission on Large Dams [4], 7714 km3 of water is stored in dam reservoirs worldwide. On the other hand, the annual mass of bed load carried by rivers (both dragged and suspended) was estimated at about 24–30 billion tons, and it was estimated that approximately 1400 million m3 of sediments accumulate each year in water bodies exploited for 30–40 years [4]. Most of them accumulate in reservoirs used for energy purposes and the losses due to this (loss of dead storage and active capacity) in the world amount to about USD 10 billion annually. Similar losses for reservoirs used for irrigation are estimated at 7 billion m3, which translates into approximately USD 3.5 billion each year. In China, retention reservoirs lose about 800 million m3 of water annually, while in relation to the initial capacity, in Japan the current volume of stored water is 7% lower, in Spain over 4%, and in Pakistan even about 20% of water was lost in just 22 years [68]. In Poland, we calculated capacity lost over 192 million m3 of capacity (5.2%). In the UK, the rate of capacity loss is estimated at 0.11% year−1 [69]. In India, the Central Water Commission found that the average annual loss in storage is about 0.4% of the total damming capacity [70]. Data applied to seven watersheds for a semiarid region in Brazil showed average annual reservoir storage capacity reduction of 0.23% year−1 due to silting [71]. In Poland we calculated average annual reservoir storage capacity reduction of 0.2% year−1.
The information presented in this article is an extension and reliable compilation of information, based on unpublished data mainly from the main entity responsible for water management in Poland. The created database of archival and modern parameters of 47 water reservoirs in the country describes the quantitative and qualitative change in reservoir capacity along with short- and long-term forecasts, and the presented data can be used for further analytical work in the field of the operation of retention reservoirs.
According to the information provided, the capacity of the reservoirs depends on many aspects, which are influenced by natural factors and human intervention. In the context of the latter, it is also assumed that the extent of the reduced capacity of the reservoirs and the pace of the processes taking place were also influenced by the manner of their use. Adverse impacts occurred in particular on facilities used to generate electricity from hydroelectric power plants. They did not work in run-of-river regime, like now, but in an intervention mode [48]. For example, the operation of a hydroelectric power plant in Włocławek on the so-called hydropeaking regime lasted from January 1970 to February 2002 [72] and was of great importance not only for the section downstream of the barrage, but also for the banks of the reservoir itself and for the delivery of sediments to its bowl. To illustrate the situation, it should be noted that the daily amplitude of water levels at the lower site of the water barrage then ranged from 2 to 3 m [57].
Bearing in mind the obtained results, it is proposed to create a broader document of a strategic, conceptual or planning nature dealing with the subject of sediment management in retention reservoirs, aimed at establishing the principles of their appropriate management (Figure 8). It should identify technical and non-technical measures focusing on this issue. Among the first of them, it is suggested to introduce more frequent monitoring of reservoir capacity, i.e., to perform bathymetric measurements, and planning—if it is necessary from the point of view of hydropower operation, flood capacity management or preventing the effects of drought. Currently, bathymetric tests are carried out mainly when designing desilting works or renewing water permits (licenses). Pursuant to the Act of 20 July 2017—Water Law [73], water permits for the use of water in reservoirs by barrage managers are issued for up to 30 years. Specifying shorter deadlines for performing bathymetric measurements (e.g., when updating water management manuals) could contribute to obtaining more data on changes in reservoir capacity. On the other hand, among the operational activities, one of the elements could be changed in the water management manual, in which it is potentially worthwhile to supplement the issues related to sediment management for selected facilities. An example in this regard would be to plan to flush smaller reservoirs or sections downstream that are excluded from the continuous water supply. Conducting increased water discharge for wash out sediments is planned twice a year (in winter and autumn) from the Myczkowce reservoir in order to clean the San between the dam and the Myczkowce hydroelectric power plant in Zwierzyń. Similar artificial high discharges are made from the Koronowski reservoir for the purpose of flushing the Brda bed between the dam and the hydroelectric power plant in Samociążek [74].
Sediment management is one of the key elements in the implementation of the Water Framework Directive [28]. Sediment management should be obligatorily taken into account when designing new hydrotechnical structures, as well as applied to existing ones. Currently implemented or developed national water programs, e.g., update of flood risk management plans, plan to counteract the effects of drought, or program to counteract water scarcity, do not include action plans for sediment management [14]. This confirms that the strategic and planning documents do not define guidelines in this regard, which may be due to the complexity of the issue and the lack of sufficient data. The methodology for eliminating the problems related to excessive accumulation of bed load in rivers and reservoirs has not yet been developed, taking into account also guidelines indicating what devices should be installed on reservoirs and along rivers in order to maintain the continuity of sediment transport, which could potentially be included in the developed water permits. Currently, no data on the transport of sediments on Polish rivers have been cyclically collected. Until 1990, the Polish Institute of Meteorology and Water Management (IMGW-PIB) carried out constant monitoring of the transport of sediments (suspended solids).
The review of the literature on the studied issue in other countries of Central and Eastern Europe indicates that this region lacks comprehensive studies of the discussed research problem, hence this work can be treated as unique. Studies on the loss of capacity or on sediments as such, were conducted only for individual reservoirs, such as Vrbovce [75] and Ottergrund [76] in Slovakia and Máchovo Lake [77] in the Czech Republic. Therefore, it is recommended to also conduct this type of analysis in other countries, because increasing the “small” and “large” retention is one of the measures to adapt to climate change. Increasing or maintaining reservoir retention is one of the strategic goals of the strategic adaptation plan for climate-sensitive sectors and areas [78]. In this context, the importance of adequate sediment management was also highlighted during the 2021 United Nations Climate Change Conference (COP26) [79]. Representatives of over 20 global organizations (the so-called sediment managers, including scientists and researchers, water managers, port and waterway operators, flood protection managers, and similar, as well as those in the dredging and construction sector) signed the Climate Change and Sediment Management Pledge in November 2021. This document emphasizes, inter alia, that sediments are an inherent element of water systems and a basic component of many natural habitats and ecosystem services. Therefore, the signatories of the declaration in the management of sediments will seek and implement solutions that are beneficial not only to the climate and nature, but also to society and the economy [79]. The results of the SR1.5 Special Report by the Intergovernmental Panel on Climate Change—IPCC, indicate an increase in the mean annual temperatures [80]. In Poland, due to climate change, there is an increase in extreme climatic and weather phenomena, such as droughts, floods, including flash floods.
On the basis on the analysis of climate change scenarios based on global and regional circulation models, changes in the transport of sediment from the basin are expected, including a reduction in its runoff. Therefore, the occurring climatic processes will cause a faster reduction of reservoirs’ capacity [81]. Therefore, great importance should be attached to the proper management of sediments due to the needs of, inter alia, counteracting the effects of drought, reducing the risk of flooding, adapting and mitigating climate change.
In Poland, the annual theoretical energy resources of rivers amount to 23,000 GWh, of which 11,950 GWh is suitable for use. It is estimated that the economic resources amount to 8500 GWh year−1 [82]. Dam reservoirs for hydropower will contribute to the reduction or, in some sectors of the economy, to zero emission of production and services, which is one of the priorities in shaping future activities and applied technologies.

5. Conclusions

Detailed conclusions from our research allow us to state that:
  • The primary function for most of them is flood protection, while retaining water resources necessary to counteract the effects of drought and for the needs of hydropower plants;
  • The average service life of the reservoirs is 48 years. The oldest analyzed Łąka reservoir was commissioned in 1907, and the youngest Świnna Poręba 109 years later, i.e., in 2016;
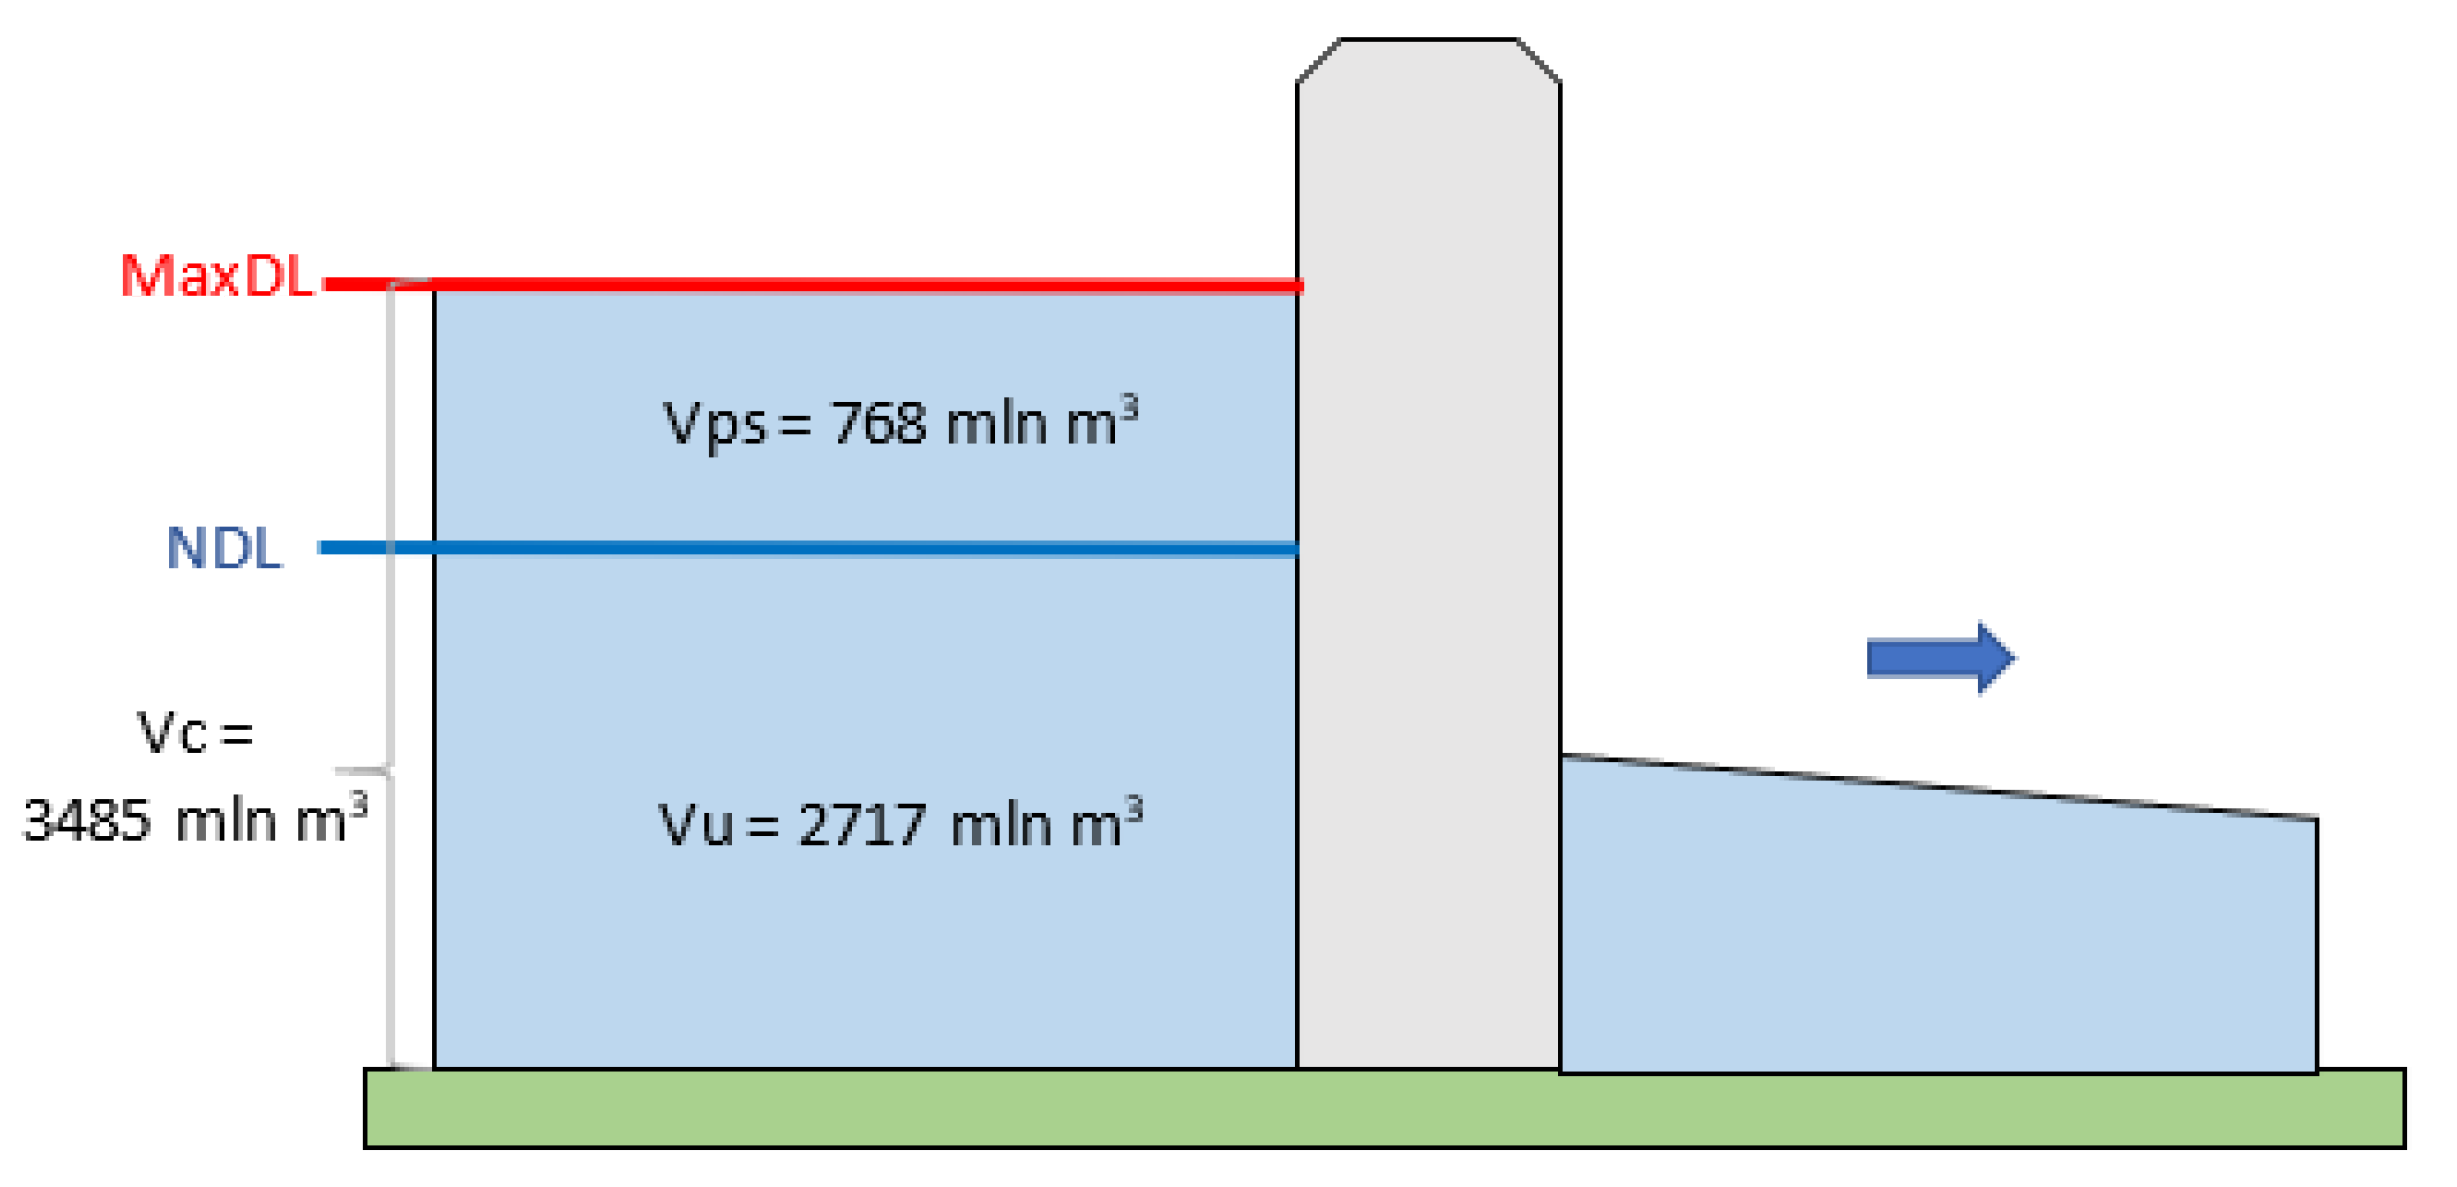
  • Since their commissioning until now, the total capacity at the maximum damming level has decreased by 192.656 million m3, i.e., by 5.2% (27 reservoirs showed a reduction in retention capacity, seven an increase, and no changes were observed for 13). The total starting capacity was 3677.751 million m3, while currently it is 3485,095 million m3;
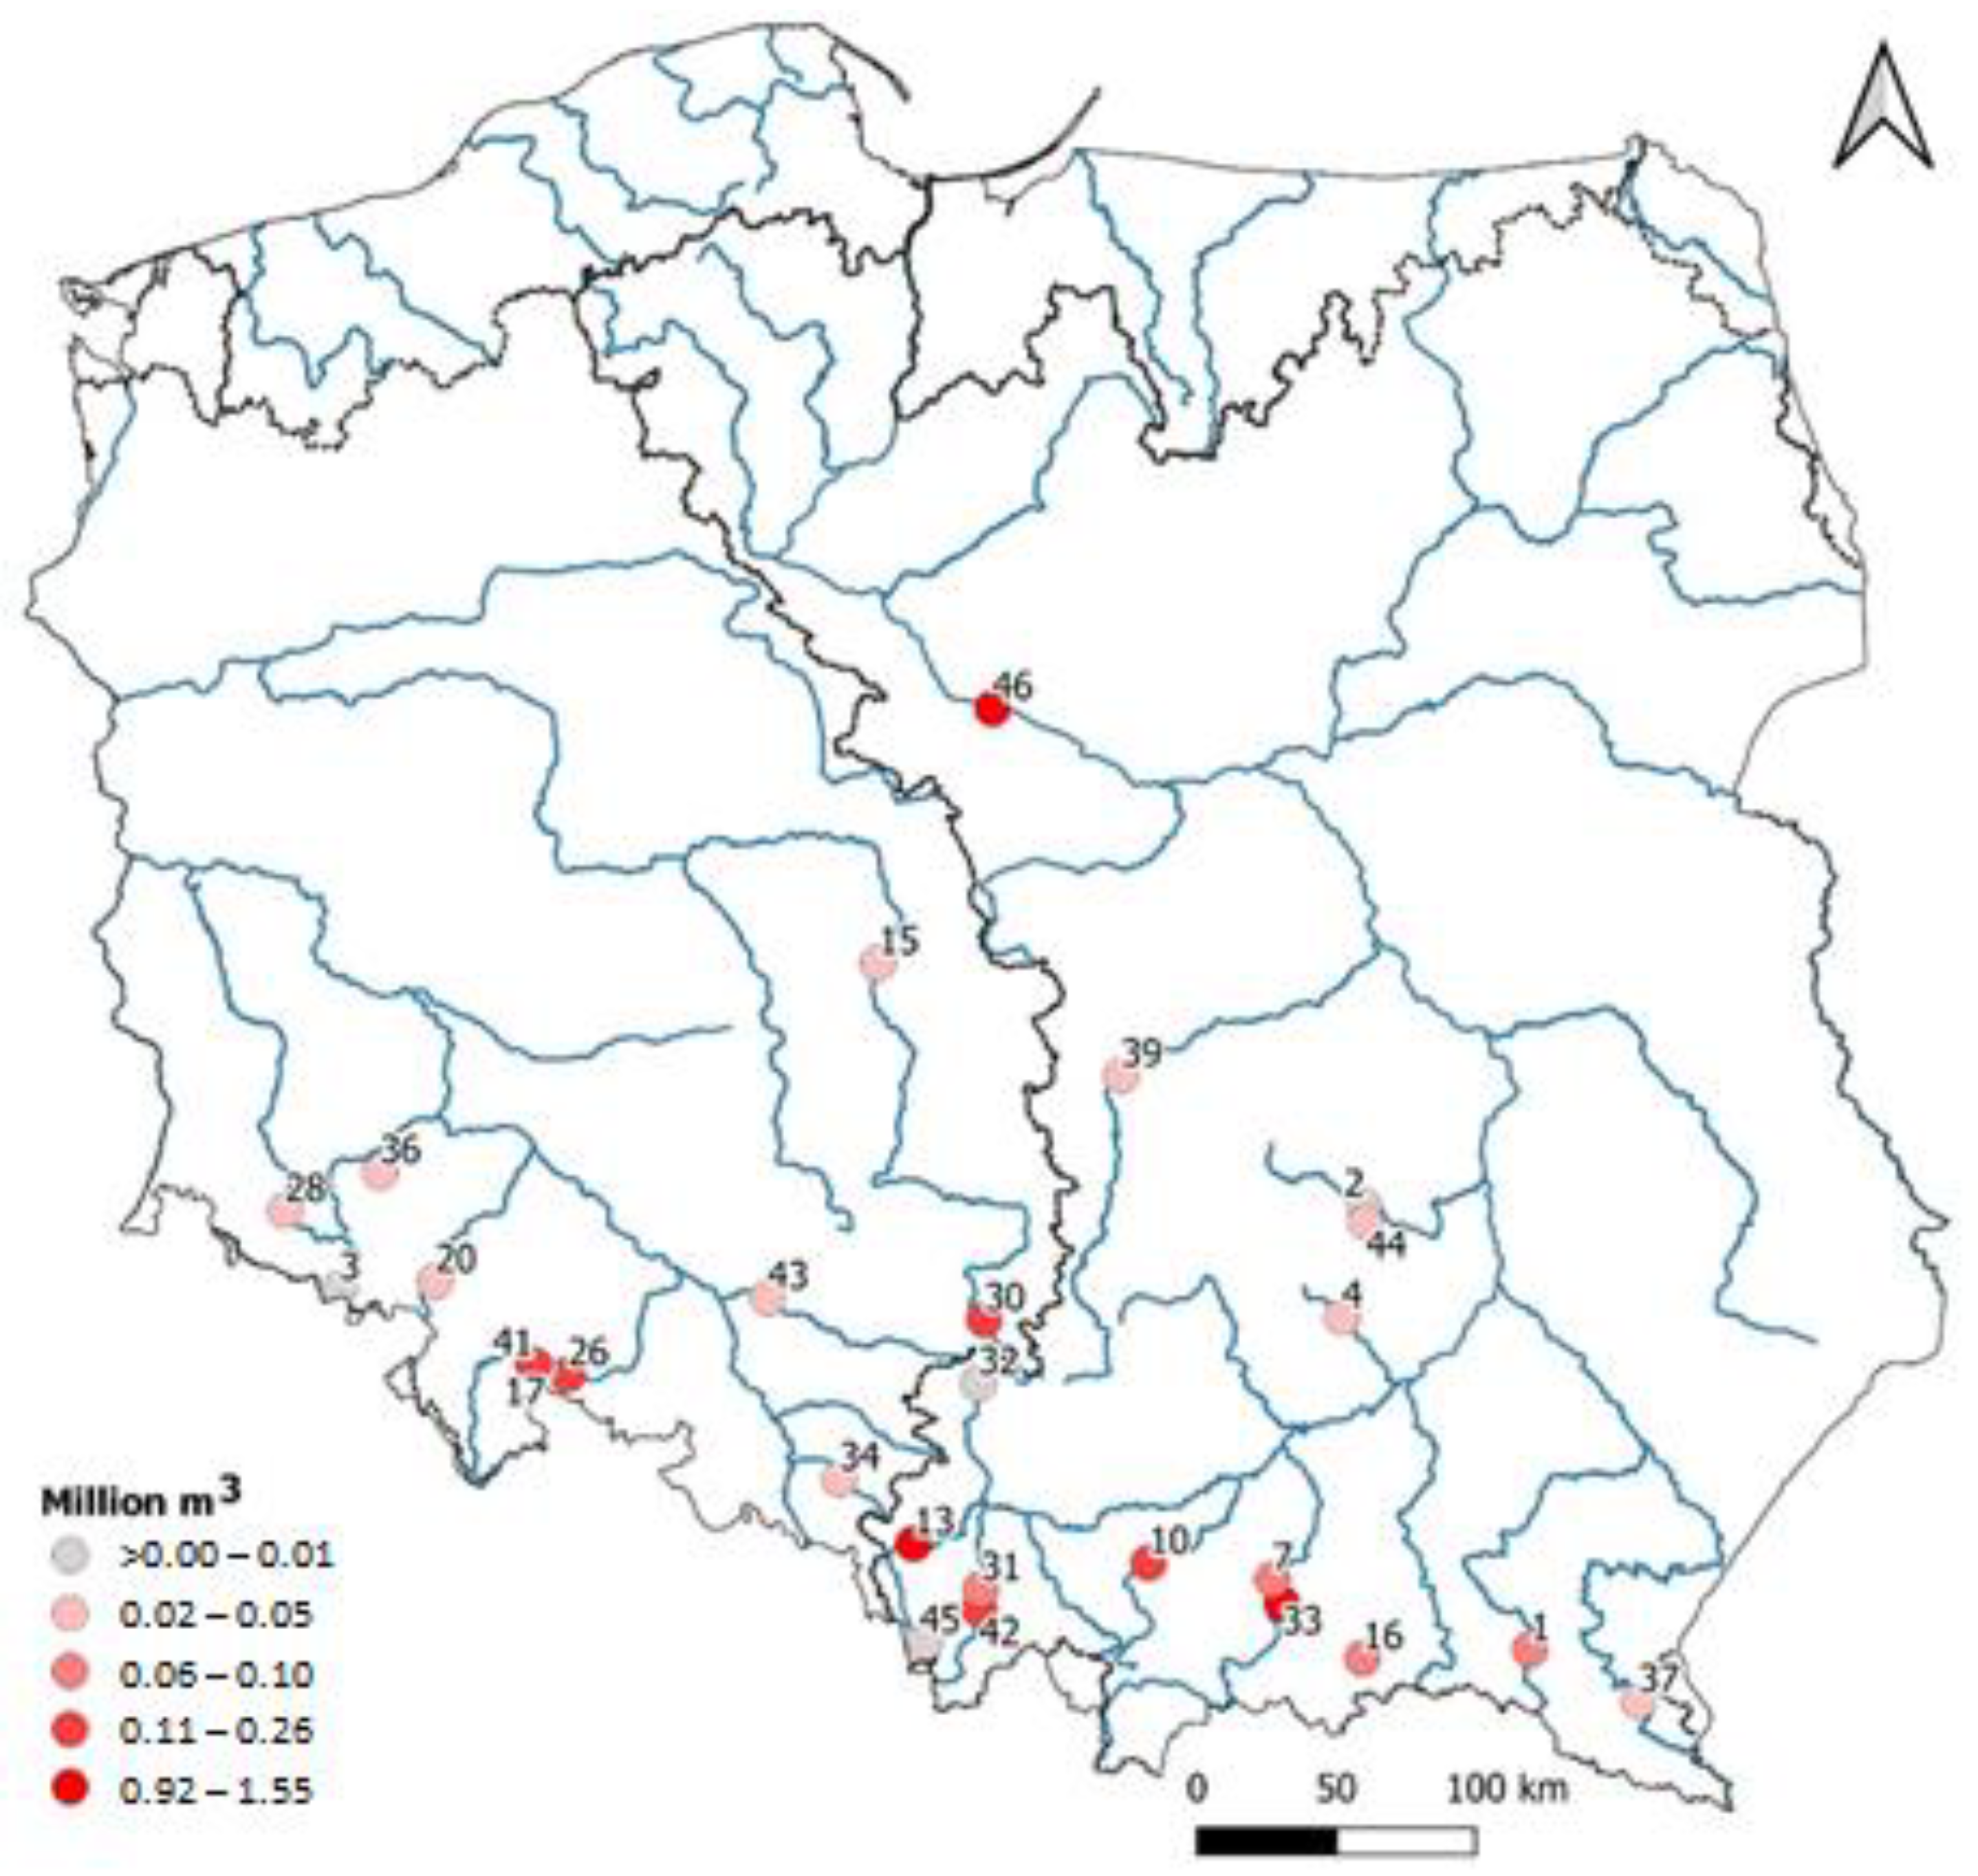
  • The average annual silting rate of reservoirs does not exceed 0.2% of the loss of their capacity;
  • There are differences in terms of the degree of capacity changes in relation to the initial capacity—the Czchów reservoir has the highest percentage of lost volume (37.3%), while Włocławek lost the most, as much as 79.01 million m3 (approx. 15% of the capacity), the Domaniów reservoir increased its capacity by 11.4% compared to the initial capacity (1.475 million m3), while the Nysa reservoir increased by 11.050 million m3 (10.0%);
  • The average annual silting for the Włocławek reservoir is 1.549 million m3, i.e., on average each year water resources decrease by 0.29% in relation to the initial parameters, which is mainly due to the intensive delivery and accumulation of bed load. The values would be higher if regular dredging works were not carried out, mainly aimed at ensuring appropriate conditions for winter flood protection;
  • Assuming that the rate of silting of the Czchów reservoir would be analogous to the current one, it would lose half of its original volume in 25 years, and 80% in just 39 years—however, the regulatory works on its inflow limited the inflow of sediment. This shows the importance of the appropriate location of e.g., low head dams in order to reduce the transport of bed load and limit its delivery to the reservoir;
  • Dredging works are carried out on selected reservoirs, but it seems reasonable to coordinate activities in this area in order to manage sediments, while taking into account activities in the catchments of reservoirs limiting the transport of bed load; the loss of capacity may have a significant impact on the proper management of water resources in reservoirs, including flood protection and counteracting the effects of drought, as well as energy functions;
  • So far there is no national policy on reservoir capacity management and sediment management plans;
  • Maintaining reservoir retention and its regular increase is one of the measures to counteract the effects of drought and floods, so it is an important factor in adapting to climate change.

Author Contributions

Conceptualization, Ł.P., D.A., M.H. and M.M.; methodology, Ł.P. and M.H.; validation, M.H. and D.A.; formal analysis, D.A. and M.M.; investigation, Ł.P.; resources, Ł.P.; writing—original draft preparation, Ł.P., M.H., D.A. and M.M.; writing—review and editing, D.A., M.H. and M.M.; visualization, Ł.P. and M.M.; supervision, D.A.; funding acquisition, D.A. All authors have read and agreed to the published version of the manuscript.

Funding

The APC was funded by University of Silesia in Katowice by regular financial support from the Polish Ministry of Science and Education.

Institutional Review Board Statement

Not applicable.

Informed Consent Statement

Not applicable.

Data Availability Statement

Publicly available data sets were analyzed in this study. These data can be found here: https://inzynierbudownictwa.pl/modernizacja-zbiornika-wodnego-nysa (accessed on 10 June 20201 http://globaldamwatch.org/grand/ (accessed on 10 June 2021), http://www.uwm.edu.pl/kolektory/energia-wody/elekwodne.html (accessed on 10 June 2021), https://www.icold-cigb.org/GB/world_register/general_synthesis.asp (accessed on 10 July 2021).

Conflicts of Interest

The authors declare no conflict of interest.

Appendix A

Table A1. Basic parameters of reservoirs crucial for water management in Poland.
IDReservoirRiverCommissioningBasin Area (km2)Reservoir Area at Maximum Damming Level (MaxDL) (km2)Hydraulic Resistance Time (Days−1)Capacity during the Normal Damming Level (NDL) (Million m3)
1BeskoWisłok19782101.3060.06.9
2Brody IłżeckieKamienna19646501.9022.06.7
3BukówkaBóbr1987222.00194.012.8
4ChańczaCzarna Staszowska19844704.70218.014.2
5CieszanowiceLuciąża1998802.20106.05.7
6CzaniecSoła196711500.461.01.3
7CzchówDunajec194953002.501.37.5
8Czorsztyn NiedzicaDunajec1997120012.30116.0176.5
9DębeNarew197369,00033.008.290.0
10DobczyceRaba198690010.70146.092.7
11DobromierzStrzegomka1987801.00113.010.0
12DomaniówRadomka20017405.0031.09.9
13GoczałkowiceWisła195543032.0080.0118.1
14GopłoNoteć Wschodnia1970117321.80N/D73.36
15JeziorskoWarta1991839042.0056.0142.8
16KlimkówkaRopa19941803.10148.032.0
17KozielnoNysa Kłodzka200221853.46N/D12.9
18Kuźnica WarężyńskaPrzemsza20052944.86N/D39.2
19LeśnaKwisa19072901.4038.07.0
20LubachówBystrzyca19171450.5055.04.9
21ŁąkaPszczynka19861604.2080.08.0
22MiedznaWąglanka19791301.8081.03.4
23MietkówBystrzyca19867209.10128.063.0
24NieliszWieprz, Por200812608.30107.020.6
25NysaNysa Kłodzka1972400021.0059.066.3
26OtmuchówNysa Kłodzka1933236021.0061.059.0
27PakośćNoteć Zachodnia, Mała Noteć1974158113.02N/D80.18
28PilchowiceBóbr191212002.4037.024.0
29Pogoria IIIPogoria1974192.08N/D11.4
30PorajWarta19793905.0097.013.0
31PorąbkaSoła193611003.7022.022.0
32PrzeczycePrzemsza19633004.70109.08.6
33RożnówDunajec1942490016.0031.0155.8
34RybnikRuda19733504.7076.022.1
35SiemianówkaNarew199560032.50198.064.8
36SłupNysa Szalona19783804.9022.023.6
37SolinaSan1968119022.00299.0472.0
38SosnówkaCzerwonka20021001.80162.010.9
39SulejówPilica1973490024.0038.075.1
40Świnna PorębaSkawa201680210.35N/D100.8
41TopolaNysa Kłodzka200221503.4015.216.5
42TresnaSoła1967110010.0090.053.9
43TurawaMała Panew1948150021.00115.080.0
44WióryŚwiślina20073634.08N/D15.7
45Wisła CzarneWisła1973290.41N/D2.3
46WłocławekWisła1970168,90075.004.5369.9
47ZłotnikiKwisa19242801.2027.09.7
Source: own study based on [31,33,34,35,38,39,40,41,42,43].

References

  1. Kondolf, M.; Gao, Y.; Annandale, G.W.; Morris, G.L.; Jiang, E.; Zhang, J.; Cao, Y.; Carling, P.; Fu, K.; Guo, Q.; et al. Sustainable sediment management in reservoirs and regulated rivers: Experiences from five continents. Earth’s Future 2014, 2, 256–280. [Google Scholar] [CrossRef]
  2. Mahmood, K. Reservoir Sedimentation: Impact, Extent, Mitigation. World Bank Tech. Rep. 1987, 71. Available online: https://www.scirp.org/(S(351jmbntvnsjt1aadkposzje))/reference/ReferencesPapers.aspx?ReferenceID=1867120 (accessed on 10 June 2021).
  3. Mazhar, N.; Mirza, A.I.; Abbas, S.; Akram, M.A.N.; Ali, M.; Javid, K. Effects of climatic factors on the sedimentation trends of Tarbela Reservoir, Pakistan. SN Appl. Sci. 2021, 3, 122. [Google Scholar] [CrossRef]
  4. International Commision on Large Dams Data. Available online: https://www.icold-cigb.org/GB/world_register/general_synthesis.asp (accessed on 10 July 2021).
  5. Hosseinjanzadeh, H.; Hosseini, K.; Kaveh, K.; Mousavi, S.F. New proposed method for prediction of reservoir sedimentation distribution. Int. J. Sediment Res. 2015, 30, 235–240. [Google Scholar] [CrossRef]
  6. Beuselinck, L.; Govers, G.; Hairsine, P.B.; Sander, G.C.; Breynaert, M. The influence of rainfall on sediment transport by overland flow over areas of net deposition. J. Hydrol. 2002, 25, 145–163. [Google Scholar] [CrossRef]
  7. Łajczak, A. Współczesny transport i sedymentacja materiały unoszonego w Wiśle i jej dopływach. Monogr. Kom. Gospod. Wodnej PAN 1999, 15, 215. [Google Scholar]
  8. Rzętała, M. Funkcjonowanie Zbiorników Wodnych oraz Przebieg Procesów Limnicznych w Warunkach Zróżnicowanej Antropopresji na Przykładzie Regionu Górnośląskiego; Wydawnictwo Uniwersytetu Śląskiego: Katowice, Poland, 2008; Available online: https://www.researchgate.net/publication/322068561_Funkcjonowanie_zbiornikow_wodnych_oraz_przebieg_procesow_limnicznych_w_warunkach_zroznicowanej_antropopresji_na_przykladzie_regionu_gornoslaskiego (accessed on 10 June 2021).
  9. Matysik, M.; Absalon, D.; Habel, M.; Maerker, M. Surface water quality analysis using CORINE data: An application to assess reservoirs in Poland. Remote Sens. 2020, 12, 979. [Google Scholar] [CrossRef] [Green Version]
  10. Absalon, D.; Matysik, M.; Woźnica, A.; Łozowski, B.; Jarosz, W.; Ulańczyk, R.; Babczyńska, A.; Pasierbiński, A. Multi-Faceted Environmental Analysis to Improve the Quality of Anthropogenic Water Reservoirs (Paprocany Reservoir Case Study). Sensors 2020, 20, 2626. [Google Scholar] [CrossRef] [PubMed]
  11. Ulańczyk, R.; Łozowski, B.; Woźnica, A.; Absalon, D.; Kolada, A. Water Quality and Ecosystem Modelling: Practical Application on Lakes and Reservoirs. In Quality of Water Resources in Poland; Zeleňáková, M., Kubiak-Wójcicka, K., Negm, A.M., Eds.; Springer: Cham, Switzerland, 2021. [Google Scholar] [CrossRef]
  12. Hassan, M.; Shamim, M.A.; Sikandar, A.; Mehmood, I.; Ahmed, I.; Ashiq, S.Z.; Khitab, A. Development of sediment load estimation models by using artificial neural networking techniques. Environ. Monit. Assess. 2015, 187, 686. [Google Scholar] [CrossRef]
  13. Habel, M.; Szatten, D.; Babiński, Z.; Nadolny, G. Sediment Management in River Basins: An Essential Element of the River Basin Management Plans. In Quality of Water Resources in Poland; Zeleňáková, M., Kubiak-Wójcicka, K., Negm, A.M., Eds.; Springer: Cham, Switzerland, 2021. [Google Scholar] [CrossRef]
  14. Absalon, D.; Matysik, M.; Habel, M. Water Quality in Main Dam Reservoirs in Poland. In Quality of Water Resources in Poland; Zeleňáková, M., Kubiak-Wójcicka, K., Negm, A.M., Eds.; Springer: Cham, Switzerland, 2021. [Google Scholar] [CrossRef]
  15. Ericson, C.L. An artificial landscape-scale fishery in the Bolivian Amazon. Nature 2000, 408, 190–193. [Google Scholar] [CrossRef]
  16. Lehner, B.; Liermann, C.R.; Revenga, C.; Vörösmarty, C.; Fekete, B.; Crouzet, P.; Döll, P.; Endejan, M.; Frenken, K.; Magome, J.; et al. High-resolution mapping of the world’s reservoirs and dams for sustainable river-flow management. Front. Ecol. Environ. 2011, 9, 494–502. [Google Scholar] [CrossRef] [Green Version]
  17. Garcia de Leaniz, C. Weir Removal in Salmonid Streams: Implications, Challenges and Practicalities. Hydrobiologia 2008, 609, 83–96. [Google Scholar] [CrossRef]
  18. Beames, P.; Lehner, B.; Anand, M. Global Reservoir and Dams Database—Technical Documentation 2019, Version 1.3. Available online: http://globaldamwatch.org/grand/ (accessed on 10 July 2021).
  19. Fox, G.A.; Sheshukov, A.; Cruse, R.; Kolar, R.L.; Guertault, L.; Gesch, K.R.; Dutnell, R.C. Reservoir Sedimentation and Upstream Sediment Sources: Perspectives and Future Research Needs on Streambank and Gully Erosion. Environ. Manag. 2016, 57, 945–955. [Google Scholar] [CrossRef] [PubMed] [Green Version]
  20. Habel, M.; Mechkin, K.; Podgorska, K.; Saunes, M.; Babiński, Z.; Chalov, S.; Absalon, D.; Podgórski, Z.; Obolewski, K. Dam and reservoir removal projects: A mix of social-ecological trends and cost-cutting attitudes. Sci. Rep. 2020, 10, 19210. [Google Scholar] [CrossRef] [PubMed]
  21. Ehsani, N.; Vörösmarty, C.J.; Fekete, B.M.; Stakhiv, E.Z. Reservoir operations under climate change: Storage capacity options to mitigate risk. J. Hydrol. 2017, 555, 435–446. [Google Scholar] [CrossRef]
  22. Paredes-Beltran, B.; Sordo-Ward, A.; de-Lama, B.; Garrote, L. A Continental Assessment of Reservoir Storage and Water Availability in South America. Water 2021, 13, 1992. [Google Scholar] [CrossRef]
  23. Döll, P.; Fiedler, K.; Zhang, J. Global-scale analysis of river flow alterations due to water withdrawals and reservoirs. Hydrol. Earth Syst. Sci. 2009, 13, 2413–2432. [Google Scholar] [CrossRef] [Green Version]
  24. Bekri, E.S.; Economou, P.; Yannopoulos, P.C.; Demetracopoulos, A.C. Reassessing Existing Reservoir Supply Capacity and Management Resilience under Climate Change and Sediment Deposition. Water 2021, 13, 1819. [Google Scholar] [CrossRef]
  25. Sarakinos, H.; Johns, S.E. Social perspectives on dam removal. In Dam Removal Research: Status and Prospects; Graf, W.L., Ed.; The Heinz Center’s Dam Removal Research Workshop: Washington, DC, USA, 2002; Available online: http://user.engineering.uiowa.edu/~cee_171/handouts/Dam_Research_Full_Report.pdf (accessed on 10 June 2021).
  26. Morris, G.L. Classification of Management Alternatives to Combat Reservoir Sedimentation. Water 2020, 12, 861. [Google Scholar] [CrossRef] [Green Version]
  27. Directive 2000/60/EC of the European Parliament and of the Council of 23 October 2000 Establishing a Framework for Community Action in the Field of Water Policy. Available online: https://eur-lex.europa.eu/legal-content/EN/TXT/?uri=celex%3A32000L0060 (accessed on 10 July 2021).
  28. Communication from the Commission to the European Parliament and the Council Addressing the Challenge of Water Scarcity and Droughts in the European Union. 2007. Available online: https://www.europarl.europa.eu/RegData/docs_autres_institutions/commission_europeenne/com/2007/0414/COM_COM(2007)0414_EN.pdf (accessed on 10 July 2021).
  29. Projekt Rozporządzenia Ministra Infrastruktury w Sprawie Przyjęcie Planu Przeciwdziałania Skutkom Suszy z Dnia 1 April 2021 r. Available online: https://legislacja.rcl.gov.pl/projekt/12342551 (accessed on 10 July 2021).
  30. Journal of Law 2016 Item 1911 [Rozporządzenie Rady Ministrów z Dnia 18 Października 2016 r. w Sprawie Przyjęcia Planu Zarządzania Ryzykiem Powodziowym dla Obszaru Dorzecza Wisły]. Available online: http://isap.sejm.gov.pl/isap.nsf/DocDetails.xsp?id=WDU20160001911 (accessed on 10 July 2021).
  31. Regional Water Management Authority in Gliwice, State Water Holding Polish Waters Data—E-mail dated 2 April 2021.
  32. University of Warmia and Mazury in Olsztyn Data. Available online: http://www.uwm.edu.pl/kolektory/energia-wody/elekwodne.html (accessed on 10 July 2021).
  33. Regional Water Management Authority in Rzeszów, State Water Holding Polish Waters data—E-mail dated 24 March 2021 and 25 March 2021.
  34. TAURON Ekoenergia Ltd.—E-mail dated 28 April 2021.
  35. Regional Water Management Authority in Poznań, State Water Holding Polish Waters data—E-mail dated 26 March 2021 and 26 March 2021.
  36. Łajczak, A. Retencja rumowiska w zbiornikach zaporowych karpackiego dorzecza Wisły. Czas. Geogr. 1986, 1, 47–77. [Google Scholar]
  37. Mapa Podziału Hydrograficznego Polski w Skali 1:10,000. Available online: https://dane.gov.pl/pl/dataset/2167,mapa-podzialu-hydrograficznego-polski-w-skali-110 (accessed on 10 July 2021).
  38. Regional Water Management Authority in Wrocław, State Water Holding Polish Waters data—E-mail dated 31 March 2021.
  39. Regional Water Management Authority in Lublin, State Water Holding Polish Waters data—E-mail dated 19 March 2021.
  40. Regional Water Management Authority in Warszawa, State Water Holding Polish Waters data—E-mail dated 26 March 2021 and 26 March 2021.
  41. Regional Water Management Authority in Białystok, State Water Holding Polish Waters data—E-mail dated 19 March 2021.
  42. Regional Water Management Authority in Bydgoszcz, State Water Holding Polish Waters data—E-mail dated 18 March 2021, 26 March 2021 and 26 March 2021.
  43. Regional Water Management Authority in Kraków, State Water Holding Polish Waters data—E-mail dated 26 March 2021, 26 March 2021 and 9 April 2021.
  44. Journal of Law 2019 Item 1725 [Rozporządzenie Ministra Gospodarki Morskiej i Żeglugi Śródlądowej z dnia 21 Sierpnia 2019 r. w Sprawie Zakresu Instrukcji Gospodarowania Wodą]. Available online: https://isap.sejm.gov.pl/isap.nsf/download.xsp/WDU20190001725/O/D20191725.pdf (accessed on 10 July 2021).
  45. Banach, M. Główne procesy a osady w strefie brzegowej zbiornika Włocławek. Przegląd Geogr. 1988, 60, 267–299. [Google Scholar]
  46. Łajczak, A. Studium nad zamulaniem wybranych zbiorników zaporowych w dorzeczu Wisły. Monogr. Kom. Gospod. Wodnej PAN 1995, 8, 106. [Google Scholar]
  47. Faleńczyk-Koziróg, K.; Skubała, P.; Habel, M.; Waldon-Rudzionek, B.; Szatten, D. River islands as habitats for soil mites (Acari). River Res. Appl. 2019, 35, 736–748. [Google Scholar] [CrossRef]
  48. Gierszewski, P.; Habel, M.; Szmańda, J.; Luc, M. Evaluating effects of dam operation on flow regimes and riverbed adaptation to those changes. Sci. Total Environ. 2020, 710, 136202. [Google Scholar] [CrossRef] [PubMed]
  49. Radecki-Pawlik, A.; Kuboń, P.; Radecki-Pawlik, B.; Plesiński, K. Bed-Load Transport in Two Different-Sized Mountain Catchments: Mlynne and Lososina Streams, Polish Carpathians. Water 2019, 11, 272. [Google Scholar] [CrossRef] [Green Version]
  50. Dojlido, J.; Gromiec, M. Rzeka Bug–Zasoby Wodne i Przyrodnicze; IMGW, Wyższa Szkoła Ekologii i Zarządzania: Warszawa, Poland, 2002. [Google Scholar]
  51. Magnuszewski, A.S. Procesy korytowe w Jeziorze Zegrzyńskim. Monogr. Kom. Gospod. Wodnej 2014, 20, 299–306. [Google Scholar]
  52. Website Inzynieriabudownictwa.pl Data. Available online: https://inzynierbudownictwa.pl/modernizacja-zbiornika-wodnego-nysa/ (accessed on 10 June 2021).
  53. Majewski, W. Powódź zatorowa na Wiśle w rejonie Płock-Włocławek w grudniu 1982 r. Próba wyjaśnienia zjawisk hydrauliczno-lodowych związanych z powodzią 1982 r. Gospod. Wodna 2009, 2, 64–72. [Google Scholar]
  54. Tang, Q.; Duncan, J.M.; Guo, L.; Lin, H.; Xiao, D.; Eissenstat, D.M. On the controls of preferential flow in soils of different hillslope position and lithological origin. Hydrol. Process. 2020, 34, 4295–4306. [Google Scholar] [CrossRef]
  55. Babiński, Z.; Chalov, S.R. Udział rumowiska unoszonego i wleczonego w transporcie fluwianym. Promot. Geogr. Bydgostiensia 2005, 3, 9–34. [Google Scholar]
  56. Babiński, Z. Wpływ Zapór na Procesy Korytowe rzek Aluwialnych ze Szczególnym Uwzględnieniem Zbiornika Włocławskiego; Wyd. Akademii Bydgoskiej im. Kazimierza Wielkiego: Bydgoszcz, Poland, 2002. [Google Scholar]
  57. Babiński, Z. Współczesne procesy korytowe dolnej Wisły. Pr. Geogr. 1992, 157, 171. [Google Scholar]
  58. Gierszewski, P.; Szmańda, J.B. Ocena Wpływu Zbiornika Włocławskiego na Transport Zawiesiny Wisłą. Wyd. Inst. Geogr. i Gosp; Przestrzennej UJ: Kraków, Poland, 2005. [Google Scholar]
  59. Babiński, Z.; Habel, M. Impact of a single dam on sediment transport continuity in large lowland rivers. In River Sedimentation, Proceedings of the 13th International Symposium on River Sedimentation, Stuttgart, Germany, 19–22 September 2016; Wieprecht, S., Haun, S., Weber, K., Noack, M., Terheiden, K., Eds.; CRC Press: London, UK, 2017. [Google Scholar] [CrossRef]
  60. Habel, M.; Babiński, Z.; Szatten, D. Problem odnowy rumowiska wleczonego poniżej zapór. Ocena możliwości sztucznego uzupełniania rumowiska poniżej stopnia wodnego we Włocławku. Gospod. Wodna 2017, 11, 353–356. [Google Scholar]
  61. Ardor. Instrukcja gospodarowania wodą dla zbiorników Gopło i Pakość wraz z urządzeniami hydrotechnicznymi. 2006. Unpublished Work.
  62. Grobelska, H. Aktualny stan strefy brzegowej zbiornika Pakoskiego. In Proceedings of the Konferencji Naukowo-Technicznej, Eksploatacja i Oddziaływanie Dużych Zbiorników Nizinnych (na Przykładzie Zbiornika Jeziorsko), Stow. In Proceedings of the Inż. i Techn. Wodnych i Melioracyjnych, Zarząd Główny, Zarząd Oddziału w Poznaniu, Uniejów, Poland, 20–21 May 1999; pp. 195–211. [Google Scholar]
  63. Kubiak-Wójcicka, K.; Szczęch, L. Dynamics of Electricity Production against the Backdrop of Climate Change: A Case Study of Hydropower Plants in Poland. Energies 2021, 14, 3427. [Google Scholar] [CrossRef]
  64. Wiejaczka, Ł. Zbiorniki retencyjne w polskich Karpatach. Aura Sigma-Not 2010, 10, 7–9. [Google Scholar]
  65. Gierszewski, P. Hydromorfologiczne uwarunkowania funkcjonowania geoekosystemu Zbiornika Włocławskiego. Pr. Geogr. 2018, 268. Available online: https://www.rcin.org.pl/dlibra/publication/91047/edition/69674/content (accessed on 15 June 2021).
  66. Journal of Law 2019 Item 92 [Uchwała nr 92 Rady Ministrów z dnia 10 Września 2019 r. w Sprawie Przyjęcia Założeń do Programu Przeciwdziałania Niedoborowi Wody na Lata 2021–2027 z Perspektywą do Roku 2030]. Available online: http://isap.sejm.gov.pl/isap.nsf/DocDetails.xsp?id=WMP20190000941 (accessed on 15 June 2021).
  67. Gutry-Korycka, M.; Sadurski, A.; Kundzewicz, Z.W.; Pociask-Karteczka, J.; Skrzypczyk, L. Zasoby wodne a ich wykorzystanie. Nauka 2014, 1, 77–98. Available online: https://journals.pan.pl/dlibra/publication/106379/edition/92153/content (accessed on 20 June 2021).
  68. Morris, G.L.; Annandale, G.W.; Hotchkiss, R.H. Reservoir sedimentation. Sedimentation Engineering-Processes, Measurements, Modeling, and Practice. ASCE Man. Rep. Eng. Pract. 2008, 110, 579–612. [Google Scholar]
  69. Halcrow, W. 2001 Sedimentation in Storage Reservoirs, Final Report—Department of the Environment, British Dam Society, Wiltshire. Available online: https://britishdams.org/assets/documents/defra-reports/200102Sedimentation%20in%20storage%20reservoirs.pdf (accessed on 4 June 2021).
  70. Froehlich, D.; Narayan, P.; Kumar, M. Estimating Reservoir Capacity Loss from Sedimentation. In Proceedings of the Third National Dam Safety Conference, Roorkee, India, 18–19 February 2017; pp. 1–16. [Google Scholar]
  71. De Araujo, J.C.; Guntner, A.; Bronstert, A. Loss of reservoir volume by sediment deposition and its impact on water availability in semiarid Brazil. Hydrol. Sci. J. 2006, 51, 157–170. [Google Scholar] [CrossRef]
  72. Habel, M.; Pieron, Ł. Impact of large scale hydro-projects on the changes of hydrological regime—Illustrated by the example of the lower Vistula. In Human Impact on the Fluvial Processes of Eurasian Rivers; Habel, M., Ed.; Kazimierz Wielki University: Bydgoszcz, Poland, 2012; Available online: https://www.researchgate.net/publication/256456633 (accessed on 5 June 2021).
  73. Journal of Law 2017 Item 1566 [Ustawa z Dnia 20 Lipca 2017 r.—Prawo Wodne]. Available online: http://isap.sejm.gov.pl/isap.nsf/DocDetails.xsp?id=WDU20170001566 (accessed on 5 June 2021).
  74. Szatten, D.; Habel, M.; Pellegrini, L.; Maerker, M. Assessment of Siltation Processes of the Koronowski Reservoir in the Northern Polish Lowland Based on Bathymetry and Empirical Formulas. Water 2018, 10, 1681. [Google Scholar] [CrossRef] [Green Version]
  75. Valent, P.; Výleta, R.; Danáčová, M. A Joint Sedimentation-Flood Retention Assessment of a Small Water Reservoir in Slovakia: A New Hope for Old Reservoirs? Geosciences 2019, 9, 158. [Google Scholar] [CrossRef] [Green Version]
  76. Fuska, J.; Kubinský, D.; Weis, K.; Lackóová, L.; Pokrývková, J.; Leitmanová, M.; Panagopoulos, T. Area-storage capacity curve of historic artifical water reservoir Ottergund, Slovakia-assessment of the historical data with the use of GIS tools. J. Ecol. Eng. 2017, 18, 49–57. [Google Scholar] [CrossRef] [Green Version]
  77. Dostál, T.; Krasa, J.; Vrana, K.; Dockal, M.; Koudelka, P.; David, V.; Vokurka, A. Sediment transport and water quality in Máchovo Lake (Czech Republic). Ann. Wars. Univ. Life Sci.-SGGW Land Reclam. 2010, 42, 139–148. [Google Scholar] [CrossRef]
  78. Strategiczny Plan Adaptacji dla Sektorów i Obszarów Wrażliwych na Zmiany Klimatu do Roku 2020 z Perspektywą do Roku 2030. Available online: https://klimada2.ios.gov.pl/adaptacja/ (accessed on 2 June 2021).
  79. COP26: Climate and Sediment Management Pledge 2021. Available online: https://sednet.org/category/news/ (accessed on 2 June 2021).
  80. IPCC Special Report on Global Warming of 1.5 °C, above Pre-Industrial Levels and Related Global Greenhouse Gas Emission Pathways, in the Context of Strengthening the Global Response to the Threat of Climate Change, Sustainable Development, and Efforts to Eradicate Poverty. Available online: https://www.ipcc.ch/sr15 (accessed on 30 June 2021).
  81. Shrestha, B.; Maskey, S.; Babel, M.S.; van Griensven, A.; Uhlenbrook, S. Sediment related impacts of climate change and reservoir development in the Lower Mekong River Basin: A case study of the Nam Ou Basin, Lao PDR. Clim. Chang. 2018, 149, 13–27. [Google Scholar] [CrossRef]
  82. Kasza, H. Zbiorniki Zaporowe—Eutrofizacja—Ochrona; Wyd. Akademii Techniczno-Humanistycznej: Bielsko Biała, Poland, 2009. [Google Scholar]
Figure 1. Location of 47 key reservoirs in Poland (A) against the map of the river network (B) and the main river basins and first-order watersheds (C) and main cities (D). The basic parameters of the reservoirs listed on the map are given in Table A1. The background of the map is a digital terrain model obtained from the Head Office of Geodesy and Cartography. Reservoirs: 1. Besko, 2. Brody Iłżeckie, 3. Bukówka, 4. Chańcza, 5. Cieszanowice, 6. Czaniec, 7. Czchów, 8. Czorsztyn Niedzica, 9. Dębe, 10. Dobczyce, 11. Dobromierz, 12. Domaniów, 13. Goczałkowice, 14. Gopło, 15. Jeziorsko, 16. Klimkówka, 17. Kozielno, 18. Kuźnica Warężyńska, 19. Leśna, 20. Lubachów, 21. Łąka, 22. Miedzna, 23. Mietków, 24. Nielisz, 25. Nysa, 26. Otmuchów, 27. Pakość, 28. Pilchowice, 29. Pogoria III, 30. Poraj, 31. Porąbka, 32. Przeczyce, 33. Rożnów, 34. Rybnik, 35. Siemianówka, 36. Słup, 37. Solina, 38. Sosnówka, 39. Sulejów, 40. Świnna. Poręba, 41. Topola, 42. Tresna, 43. Turawa, 44. Wióry, 45. Wisła. Czarne, 46. Włocławek, 47. Złotniki.
Energies 14 07951 g001
Figure 2. The current capacity of the analyzed 47 key reservoirs in Poland. Explanations: NDL (normal damming water level)—the highest level of the water table in normal conditions of use; MaxDL (maximum damming water level)—the highest level of the dammed water table, taking into account the permanent flood reserve; Vu (usable volume of the reservoir)—the capacity of the reservoir intended to be used for specific purposes of this reservoir, between the minimum damming water level and the normal damming level; Vps (permanent flood capacity of the reservoir)—reservoir capacity intended to be used when the flood wave is passing, between the normal damming level and the maximum damming level; Vc (total capacity of the reservoir)—reservoir capacity taking into account the total value of Vu and Vps.
Energies 14 07951 g002
Figure 3. Structure of capacity change in reservoirs of key importance for water management in Poland. Classes: I—large loss of capacity—over 30% (red), II—significant loss of capacity—10.1–30% (orange), III—moderate loss of capacity—0.1–10% (yellow), IV—constant unchanged capacity (no color), V—increase in capacity (green).
Energies 14 07951 g003
Figure 4. Classes of capacity changes (in %) in reservoirs of key importance for water management in Poland. Classes: I—large loss of capacity—over 30%, II—significant loss of capacity—10.1–30%, III—moderate loss of capacity—0.1–10%, IV—constant (unchanged) capacity, V—increase in capacity. Reservoirs: 1. Besko, 2. Brody Iłżeckie, 3. Bukówka, 4. Chańcza, 5. Cieszanowice, 6. Czaniec, 7. Czchów, 8. Czorsztyn Niedzica, 9. Dębe, 10. Dobczyce, 11. Dobromierz, 12. Domaniów, 13. Goczałkowice, 14. Gopło, 15. Jeziorsko, 16. Klimkówka, 17. Kozielno, 18. Kuźnica Warężyńska, 19. Leśna, 20. Lubachów, 21. Łąka, 22. Miedzna, 23. Mietków, 24. Nielisz, 25. Nysa, 26. Otmuchów, 27. Pakość, 28. Pilchowice, 29. Pogoria III, 30. Poraj, 31. Porąbka, 32. Przeczyce, 33. Rożnów, 34. Rybnik, 35. Siemianówka, 36. Słup, 37. Solina, 38. Sosnówka, 39. Sulejów, 40. Świnna. Poręba, 41. Topola, 42. Tresna, 43. Turawa, 44. Wióry, 45. Wisła. Czarne, 46. Włocławek, 47. Złotniki.
Energies 14 07951 g004
Figure 5. The average annual rate of loss of the capacity of reservoirs of key importance for water management in Poland, belonging to classes of capacity changes from I to III. Reservoirs: 1. Besko, 2. Brody Iłżeckie, 3. Bukówka, 4. Chańcza, 7. Czchów, 10. Dobczyce, 13. Goczałkowice, 15. Jeziorsko, 16. Klimkówka, 17. Kozielno, 20. Lubachów, 26. Otmuchów, 28. Pilchowice, 30. Poraj, 31. Porąbka, 32. Przeczyce, 33. Rożnów, 34. Rybnik, 35. Siemianówka, 36. Słup, 37. Solina, 38. Sosnówka, 39. Sulejów, 40. Świnna. Poręba, 41. Topola, 42. Tresna, 43. Turawa, 44. Wióry, 45. Wisła. Czarne, 46. Włocławek.
Energies 14 07951 g005
Figure 6. Statistical significance between calculated indicators of reservoir’s capacity changes and the selected characteristic features of reservoirs.
Energies 14 07951 g006
Figure 7. Forecast for the loss of capacity up to the value of 50% of the initial capacity of key reservoirs for water management in Poland, belonging to capacity change classes I to II. Reservoirs: 1. Besko, 2. Brody Iłżeckie, 3. Bukówka, 4. Chańcza, 7. Czchów, 10. Dobczyce, 13. Goczałkowice, 15. Jeziorsko, 16. Klimkówka, 17. Kozielno, 20. Lubachów, 26. Otmuchów, 28. Pilchowice, 30. Poraj, 31. Porąbka, 32. Przeczyce, 33. Rożnów, 34. Rybnik, 35. Siemianówka, 36. Słup, 37. Solina, 38. Sosnówka, 39. Sulejów, 40. Świnna. Poręba, 41. Topola, 42. Tresna, 43. Turawa, 44. Wióry, 45. Wisła. Czarne, 46. Włocławek.
Energies 14 07951 g007
Figure 8. Conceptual model of capacity management of retention reservoirs.
Energies 14 07951 g008
Table 1. Calculated changes in capacity at MaxDL in reservoirs of key importance for water management in Poland.
IDReservoirRiverCapacity
[Million m3]
Capacity Changes
InitialCurrent[Million m3]%
1.BeskoWisłok16.00013.210−2.790−17.4
2.Brody IłżeckieKamienna7.5907.010−0.580−7.6
3.BukówkaBóbr16.79016.660−0.130−0.8
4.ChańczaCzarna Staszowska24.22023.780−0.440−1.8
5.CieszanowiceLuciąża9.1009.1000.0000.0
6.CzaniecSoła1.3001.3000.0000.0
7.CzchówDunajec12.0007.530−4.470−37.3
8.Czorsztyn NiedzicaDunajec231.900238.5536.6532.9
9.DębeNarew94.30095.9801.6801.8
10.DobczyceRaba141.740137.720−4.020−2.8
11.DobromierzStrzegomka11.35011.3500.0000.0
12.DomaniówRadomka12.89514.3701.47511.4
13.GoczałkowiceWisła163.100161.300−1.800−1.1
14.GopłoNoteć Wschodnia88.64088.6400.0000.0
15.JeziorskoWarta203.000202.037−0.963−0.5
16.KlimkówkaRopa43.50041.950−1.550−3.6
17.KozielnoNysa Kłodzka16.40016.302−0.098−0.6
18.Kuźnica WarężyńskaPrzemsza46.28046.2800.0000.0
19.LeśnaKwisa16.80016.8000.0000.0
20.LubachówBystrzyca8.0006.807−1.193−14.9
21.ŁąkaPszczynka11.15011.1500.0000.0
22.MiedznaWąglanka3.8023.8020.0000.0
23.MietkówBystrzyca71.80077.2205.4207.5
24.NieliszWieprz, Por27.14028.4711.3314.9
25.NysaNysa Kłodzka111.000122.05011.05010.0
26.OtmuchówNysa Kłodzka142.650129.460−13.190−9.2
27.PakośćNoteć Zachodnia, Mała Noteć86.46086.4600.0000.0
28.PilchowiceBóbr53.50050.000−3.500−6.5
29.Pogoria IIIPogoria12.03312.0330.0000.0
30.PorajWarta25.10020.802−4.298−17.1
31.PorąbkaSoła32.20026.540−5.660−17.6
32.PrzeczycePrzemsza20.74020.352−0.388−1.9
33.RożnówDunajec228.7155.770−72.930−31.9
34.RybnikRuda24.00023.322−0.678−2.8
35.SiemianówkaNarew79.50079.5000.0000.0
36.SłupNysa Szalona38.60038.050−0.550−1.4
37.SolinaSan474.500472.040−2.460−0.5
38.SosnówkaCzerwonka14.00014.8400.8406.0
39.SulejówPilica86.59484.330−2.264−2.6
40.Świnna PorębaSkawa160.844160.8440.0000.0
41.TopolaNysa Kłodzka26.50021.676−4.824−18.2
42.TresnaSoła102.00092.700−9.300−9.1
43.TurawaMała Panew95.50092.610−2.890−3.0
44.WióryŚwiślina35.33334.660−0.673−1.9
45.Wisła CzarneWisła4.5004.044−0.456−10.1
46.WłocławekWisła532.600453.590−79.010−14.8
47.ZłotnikiKwisa12.10012.1000.0000.0
Source: own study based on [31,33,34,35,38,39,40,41,42,43].
Table 2. The rate of volume change in reservoirs of key importance for water management in Poland, belonging to the classes of volume changes from I to III.
IDReservoirRiverAverage Annual Rate of Capacity LossTime to 50% Loss from Initial Capacity [Years]Time to 80% Loss from Initial Capacity [Years]
Million m3%
1.BeskoWisłok0.0650.4180128
2.Brody IłżeckieKamienna0.0100.13316506
3.BukówkaBóbr0.0040.0221623459
4.ChańczaCzarna Staszowska0.0120.059811570
7.CzchówDunajec0.0620.522539
10.DobczyceRaba0.1150.08582931
13.GoczałkowiceWisła0.0270.0229244679
15.JeziorskoWarta0.0320.0231325011
16.KlimkówkaRopa0.0570.13352563
17.KozielnoNysa Kłodzka0.0050.0315712513
20.LubachówBystrzyca0.0110.14245392
26.OtmuchówNysa Kłodzka0.1500.11388621
28.PilchowiceBóbr0.0320.067241159
30.PorajWarta0.1020.4181129
31.PorąbkaSoła0.0670.21157251
32.PrzeczycePrzemsza0.0070.0314922387
33.RożnówDunajec0.9230.404572
34.RybnikRuda0.0140.068021282
36.SłupNysa Szalona0.0130.0314662345
37.SolinaSan0.0460.0150588094
39.SulejówPilica0.0470.058701392
41.TopolaNysa Kłodzka0.2540.963353
42.TresnaSoła0.1720.17242387
43.TurawaMała Panew0.0400.0411331813
44.WióryŚwiślina0.0480.14354566
45.Wisła CzarneWisła0.0100.21189302
46.WłocławekWisła1.5490.29121193
Source: own study based on [31,33,34,35,38,39,40,41,42,43].
Publisher’s Note: MDPI stays neutral with regard to jurisdictional claims in published maps and institutional affiliations.

