Article

Estimating the Employment and Fiscal Consequences of Thermal Coal Phase-Out in China

1
Smith School of Enterprise and the Environment, University of Oxford, Oxford OX1 3QY, UK
2
School of Economic and Management, North China Electric Power University, Beijing 102206, China
*
Author to whom correspondence should be addressed.
Energies 2022, 15(3), 800; https://doi.org/10.3390/en15030800
Submission received: 5 November 2021 / Revised: 13 January 2022 / Accepted: 19 January 2022 / Published: 22 January 2022
(This article belongs to the Special Issue Policy and Finance for Clean Energy Transition)

Abstract

:
China hosts over half of global coal-fired power generation capacity and has the world’s largest coal reserves. Its 2060 carbon neutrality goal will require coal-fired electricity generation to shrink dramatically, with or without carbon capture and storage technology. Two macroeconomic areas in which the socioeconomic impact of this decline is felt are losses in jobs and tax revenues supported by thermal coal mining, transport and power generation. At the national level, under a ‘baseline’ (B) scenario consistent with China’s carbon neutrality goal, labour productivity growth in coal mining implies that significant job losses will occur nationally in the medium term, even if all coal plants continue operating as planned. Jobs supported by the coal power industry would decline from an estimated 2.7 million in 2021, to 1.44 million in 2035 and 94,000 in 2050, with jobs losses from mining alone expected to exceed 1.1 million by 2035. Tax revenues from thermal coal would total approximately CNY 300 billion annually from 2021–2030, peaking in 2023 at CNY 340 billion. This is significantly less than estimated subsidies of at least CNY 480 billion, suggesting coal is likely a net fiscal drain on China’s public finances, even without accounting for the costs of local pollution and the social cost of carbon. As coal plant retirements accelerate, from 2034 onwards, fiscal revenues begin to fall more rapidly, with rates of decline rising from 1% in the 2020s to over 10% a year by the 2040s. More aggressive climate policy and technology scenarios bring job and tax losses forward in time, while a No Transition policy, in which all currently planned coal plants are built, delays but does not ultimately prevent these losses. At the provincial level, China’s major coal-producing provinces will likely face challenges in managing the localised effects of expected job losses and finding productive alternative uses for this labour. Governments of coal-producing provinces like Inner Mongolia, with an industry highly dependent on exports to other provinces, are more exposed than others to declining tax revenues from coal, and more insulated from job losses, given their high current degree of labour efficiency. Although their provincial revenues are likely to remain stable until the early 2030s under the B scenario, the possibility of increasing policy stringency underlines the need for revenue and skill base diversification. At the firm level, China’s ‘Big Five’ state-owned power companies were responsible for over 40% of both jobs and tax revenues in 2021. The number of jobs supported by the activities of each of the largest ten firms, with one exception, will decline by 71–84% by the early 2040s, with the tax contribution of each declining by 43–69% in the same period.

1. Introduction

China has been the world’s largest annual emitter of greenhouse gases since 2005 [1] and hosts more than half of global coal-fired power generation (thermal coal) capacity. Coal power generation capacity in China is concentrated in the populous Eastern provinces, and increasingly in the coal-rich autonomous regions of Inner Mongolia in the North and Xinjiang in the West, as well as the Central province of Shanxi. In 2020, amid the global economic slowdown induced by the COVID-19 virus pandemic, capacity additions accelerated, accounting for three-quarters of globally commissioned coal capacity, and 85% of capacity under development [2]. China also produced 53% of the world’s crude steel in 2019 and 60% of its cement in 2017 [3,4], both of which rely heavily on coal as an energy source. Replacing unabated coal plants with net zero emissions alternatives in China is, therefore, critical to global decarbonisation.
In September 2020, President Xi Jinping announced China would set itself a target of reaching carbon neutrality by 2060, and to peak emissions “before 2030” [5]. The 14th Five Year Plan (FYP), a guide to national policy priorities from 2021–25 published after the announcement, targets 20% non-fossil energy in final consumption by 2025 and 25% by 2030. While it mentions an 18% drop in CO2 emissions intensity by 2025, the targeted 6% annual GDP growth means total emissions may still rise by 2025 [6].
However, modelling of multi-sector development pathways led by Tsinghua University [7] projects that China’s coal-fired power generation capacity will decline to 191 GW by 2050 under a 2 °C global warming scenario, with 47% electricity generated coming from carbon capture and storage (CCS)-enabled units, and coal contributing just 6.5% of total power generation. Under a 1.5 °C scenario reaching net zero sectoral emissions in 2045, coal capacity in 2050 will be just 181 GW, with 88% of generation being CCS-enabled and contributing just 6% of total electricity generation. Global assessments of cost-effective pathways for coal plant retirement find that operational lifetimes of 30 years, including plants under construction but assuming no capacity currently in the planning stages is ultimately built, are considered cost-effective for a 2 °C scenario, implying phase-out by the early 2050s. Operating lifetimes of 15 years are deemed optimal for a 1.5 °C scenario, implying phase-out by the late 2030s [8].
Thus, even if CCS technologies reach commercial scalability and see wide deployment, China’s coal fleet—over 90% of which is estimated to be controlled by state-owned enterprises [9]—is expected to shrink by over 80% by 2050 under either a 2 °C or 1.5 °C scenario. If China is to meet its carbon neutrality targets, a total phase-out of unabated coal-fired electricity generation in China by 2060, across both the thermal and metallurgical coal segments, is nearly inevitable.
Prior analysis of thermal coal phase-out in China and beyond has focused on the financial implications of asset stranding for the owners of coal plants and mines [10,11,12,13,14], and optimises plant-level phase-out processes according to profitability, environmental impact, or both. Studies of other countries have considered the financial consequences, but also consider the impact of coal transition on some of the other priorities of government, often using the term ‘just transition’ to call for or to describe measures that protect the interests of those negatively affected. These include mitigating the short- and medium-term effects on coal industry employment and structural deindustrialisation, as well as the fiscal impact of declining coal revenue and, in some cases, higher costs for electricity consumers [15]. Strategies for managing these and other political economy frictions of phasing out coal in China have been examined qualitatively [16] and integrated assessment models (IAMs) have been used to project changes in energy sector employment across different countries, including China [17]. However, the reconstruction and quantification of employment and fiscal impacts of coal phase-out in China, in a granular, bottom-up manner and using publicly available data, has not yet been attempted. This paper, therefore, makes a first attempt to answer calls for new research [18] on the national, subnational, corporate and supply chain impacts of coal phase-out in China.
This analysis uses plant-level data and a reconstruction of the coal production-consumption network to model the impact of coal phase-out on jobs within, and tax revenues from, the thermal coal industry in China under a range of plausible climate policy scenarios. It considers the implications for the political economy of coal transition, and for the design of corresponding redistributive policies in China. Section 2 presents an overview of current literature on the socioeconomic challenges presented by coal phase-out and strategies employed for managing the impact on consumers, workers, and public sector revenues. It situates these challenges within the context of the Chinese coal industry. Section 3 lays out a methodology for projecting the employment and fiscal impacts of coal transition in China. Section 4 presents results at national, subnational, and firm levels. Section 5 analyzes the implications of the findings for the Chinese government in managing the transition. Section 6 concludes.

2. Reviewing Experiences with Coal Transitions: China and Beyond

2.1. Coal Transitions outside China

Analyses of the drivers and effects of coal industry maturation, transition and decline outside China are dominated by studies of the United States (U.S.), United Kingdom (U.K.), and Western Europe, particularly Germany. Eastern Europe and developing economies at earlier stages of transition are systematically under-represented [19]. While coal was, until relatively recently, the main source of primary energy in most advanced economies, the energy market structures and political systems under which their coal transitions took, or are taking place, are very different to those in China. Even in Western economies still in the throes of coal transition, energy demand growth is low or negative, absolute coal consumption is far smaller, and coal now contributes a much lower proportion for primary or industrial energy supply than it once did. The relevance of this literature to China lies in the historical and contemporary experiences of structural change that coal transitions have induced in these contexts, particularly on industry and labour.
A comprehensive review of the literature on coal transitions [19] finds that loss of employment is their most frequently documented economic consequence. The U.K., Western Europe and the U.S. exhibited a sustained decline in coal industry employment in the late 20th and early 21st centuries. In the U.K., coal production declined 99% from 1962 to 2012, with coal-related employment also falling 99% in the same period, from 664,000 to 6000 [20]. In Germany, direct and indirect employment in coal power and mining declined from over 700,000 in 1985 to under 100,000 in 2015, driven by post-Soviet market liberalisation, international competition, and technical advances, among other factors [21]. Across the E.U., coal mining employment fell 50% to 130,000 between 2007–2017. Alves Dias, et al. [22] estimate coal-related employment in the E.U. at 238,000 in 2018 (less than 0.1% of total employment). About 160,000 of these remaining jobs are expected to be lost by 2030, 25% of those in Upper Silesia, a region of Poland [23]. In the U.S., coal mining supported just 40,000 jobs in 2020, down 55% from 2011 and 77% from 1985 [24]. Coal is also being outstripped by clean power generation: U.S. coal power plant-related jobs averaged 79,700 in 2019, only 22% of the jobs in wind and solar power in the same year [25].
In aggregate, coal phase-out can be associated with substantial net employment gains in the power sector as coal jobs are replaced by renewables. Net overall job gains do not, however, imply that former coal miners and plant operators will be re-employed in renewable industries, since they do not necessarily occur in the same place, and at the same time, as job losses in coal, or demand the same skills and experience. Upstream activities in coal mining that cannot easily pivot to new sources of demand and are not necessarily well-located for renewable industries are more likely to see concentrated net job losses. Theoretical work on ‘adjacent’ future career pathways in green industries for existing U.S. fossil fuel workers, matching occupational skills across time and space [26] can help to address this problem, but has yet to be applied in practice.
Loss of employment linked to coal transitions is associated with a series of other social impacts. To manage these impacts, a variety of ‘just transition’ measures have been adopted across different countries and regions. Observed negative social outcomes include declining living standards, increasing poverty, and a drop in public service provision, partially mitigated by robust social security and redistributive tax systems, but also the generation of alternative employment opportunities through economic diversification and new investment [27]. Significant negative effects on public finances are reported in some cases, linked to declining tax revenues from coal and high remediation costs for former mining areas [28,29]. Measures to dampen localised employment shocks, prevent deterioration of locally funded services and infrastructure, and divert surplus labour supply into new markets have been deployed in several European countries. These include Germany’s EUR 40 billion investment in education, innovation, and social safety nets, in collaboration with trade unions, and Spain’s EUR 250 million transition support package that also requires firms to submit just transition plans before closing mining sites [30]. There is some evidence of positive social outcomes from coal industry closures, in terms of declining mortality and morbidity [31,32], particularly from cardiovascular and respiratory diseases [33].
Analysis of transition measures suggests that while support for diversification into other industries has generated new investment and jobs in former coal regions, former coal workers and their dependents have not necessarily benefited from these measures [34]. Early findings also suggest that early retirement schemes can soften the immediate impact of redundancies and reduce fiscal uncertainty for local governments, but do not help workers seeking alternative employment or retraining. Such schemes can also be very costly to maintain through to retirement age, particularly for younger workforces. In terms of fiscal impact, the coal industry in G20 countries is estimated to benefit from at least USD 63.9 billion in subsidies annually, with the majority accruing to consumers of coal-fired electricity through USD 15.4 billion in direct fiscal support, and USD 20.9 billion in capital investments by state-owned enterprises [35]. Even without considering health and climate externalities, to the extent that reduced tax revenues from coal are offset by reductions in these subsidies, coal phase-out can be revenue-neutral or even revenue-positive for governments. If true, this implies that redistribution of fiscal support, social support, and productive investment among subnational regions or groups, rather than macroeconomic stability or growth, should be the primary concern for policymakers.

2.2. Coal Transition in China

The scale of the economic transformation China must undertake in the next four decades to meet its public commitments to carbon peaking (2030) and neutrality (2060) is historically unprecedented. Previous regulatory efforts to streamline China’s coal industry over the last twenty years have focused not on replacing coal itself, but on replacing old coal infrastructure with new, small thermal plants and mines with large ones, inefficient machinery with high efficiency technology, and moving polluting activities from high- to low-population density areas. These goals have been pursued through two overarching sets of national policies, as well as pilot emissions trading programmes.
The first national policy framework relates to coal mine consolidation. These began in the 1990s, and saw thousands of small mine closures, including over 40,000 mine closures in 2000 alone [36] and almost 45,000 mining company closures from 1998–2002 [37], citing illegal extraction, poor safety and environmental records, low recovery rates and suboptimal locations [38]. From 2003 onwards, central government continued its policy of closing smaller mines and plants, moving more recently towards large, centralised state-owned coal bases [39], nominally driven by safety, industrial restructuring, and environmental factors [40]. Small-scale state-owned mines accounted for 73% of mine closures from 2016–18; however, they were still larger and more labour-efficient than privately-owned mines, and more often controlled by large conglomerates able to redeploy workers elsewhere within their corporate structure and geographic reach [41]. Consolidation policies have also increased mining industry concentration: in 2018, 10 mining companies accounted for 42% of national output, and mines with over 1.2 million tonnes (Mt) of annual production capacity comprised 80% of output [41]. The China National Coal Association expects the total number of mines to decline further, from 4700 in 2020 to 4000 in 2025, even as annual production rises to 4.1 billion tonnes. By this time, 25% of mines are expected to employ labour-saving “smart production techniques” [42].
The second set of national policies reflects the government’s “build big, close small” approach of removing excess capacity through supply side structural reforms and the establishment of emissions standards for coal-fired thermal power plants. The government’s “developing large units, suppressing small ones” policy resulted in the closure of 77 GW of older, mostly small-scale capacity plants during the 11th FYP period (2006–2010) and 28 GW during the 12th FYP (2011–2015) [43]. The definition of “outdated” coal-fired power was extended to all units under 300 MW in the 2013 Action Plan for Air Pollution Prevention and Control [44]. In 2014, China introduced ultra-low emission (ULE) standards, requiring coal-fired power generation units to be renovated to limit emissions of sulphur dioxide (SO2), nitrogen oxides (NOx) and particulate matter (PM) to 35, 50 and 10 mg/m3 concentrations in the plant exhaust stack, respectively [45]. Subsequent government subsidies enabled large swathes of remaining non-compliant capacity to improve overall plant efficiency and implement emissions control technology, at an estimated cost of CNY 130 billion in 2014–15. Pressure on municipal and regional governments to reduce coal power generation in urban areas has also contributed to an ongoing shift in generation capacity towards more rural Eastern and Northern mining regions and the export of power to demand centres through long-distance transmission lines [46]. In 2017, the Chinese government pledged to cancel or postpone construction of 150 GW of additional coal power generation capacity, and to remove a further 20 GW of technologically outdated coal-fired power stations by 2020 [47].
China’s carbon emissions trading system (ETS), formally proposed by the National Development and Reform Commission in 2011, was first implemented in six subnational “pilot” jurisdictions (Beijing, Shanghai, Tianjin, Chongqing, Hubei, and Guangdong). The pilot programmes were expected to be problematic, and indeed experienced design- and context-induced difficulties, with low prices and volumes, insufficient market supervision [48,49] and consequently weak incentives to choose emissions abatement over acquiring more permits. Evaluation of the programmes’ success suggests that, while there is evidence that the ETS pilots were associated with lower emissions [50,51], other contributing factors included levels of economic development, higher population density, greater economic openness (which could enable carbon leakage, particularly where emissions could be relocated to less population-dense parts of China), research expenditure, and strength of environmental regulations, as well as the maturity of the trading market, with the wealthier Eastern provinces seeing higher prices and greater emissions reductions relative to counterfactual baselines [52]. The national ETS was launched in July 2021, although it retains many of the design elements of the pilots and its role in slowing or accelerating the coal transition is not yet clear.
These consolidation, efficiency, and carbon trading measures have not yet achieved the absolute reduction in total national thermal coal consumption or emissions required by the government’s new commitments, but they do provide some insight as to the effects of industrial restructuring and consolidation on employment. Direct employment by coal companies peaked at 5.3 million in 2013, falling to 3.2 million in 2018 [53]. Independent forecasts made in 2017 suggest that improved technology will reduce coal sector jobs by a further 50% to 1.6 million in 2050, with further restrictions on capacity growth reducing total coal jobs in 2050 to 900,000 [16]. In a reflection of how these trends are expected to continue, the International Energy Agency (IEA) predicts a 30% drop in global coal employment from 2019–2030 in its Accelerated Policy Scenario, with the sharpest drop seen in China, resulting from a combination of increased productivity and industrial restructuring [54].
Previous experience with the depletion of specific coal mines also sheds some light on the potential consequences of large-scale disruption where cities built on coal have failed to diversify before supplies run out. Fuxin, in Liaoning province, once hosted Asia’s largest open pit mine, with 500,000 city residents either employed in, or dependent on it at peak production, and the mining bureau funding local hospitals, schools and other facilities. The mine entered bankruptcy in 2005. Some jobs for younger, stronger workers were restored following restructuring, but with lower wages [55]. While Fuxin’s economy has since partly recovered through new investment in wind and solar industries, without proactive policy, a similar trajectory may be repeated in many other locations as demand for coal declines and mining area consolidation proceeds.
China has already put some transition management measures in place. In 2016, the government itself projected 1.3 million jobs would be lost by 2020 in the coal sector as a result of capacity reduction and consolidation policies [56], and implemented measures including a CNY 100 bn (c. $15 bn) “Industrial Special Fund” launched by the Ministry of Finance to support worker relocation and fund welfare payments [57]. Shanxi province, the second-largest coal producer in China, is expected to draw at least CNY 3.5 billion from the fund by 2022 to support relocation, retraining, early retirement, and public sector job creation to offset the effects of coal capacity control policies. Shanxi’s investment in regeneration of depleted mining areas, energy source diversification, and other measures, remains a relative outlier, however [34].
If these projections are correct, large-scale job losses in the coal industry are likely to materialise even in the absence of punitive climate policy measures, and even new coal-fired power generation and mining capacity is added. In a scenario in which the 2030 and 2060 targets are realised, coal power generation must peak within a decade and decline thereafter, further accelerating thermal coal industry job losses. Coal phase-out will also affect the fiscal contribution of coal to national and subnational governments, with tax revenues from coal providing funding for local research facilities, hospitals, infrastructure, and public services, as well as contributing to the general public budget.
This study aims to model and test these hypotheses by charting the trajectory of jobs and tax revenues associated with the thermal coal industry under different coal phase-out scenarios. This can help to identify the scale of the changes that are likely to occur, and the policy options available to state institutions for managing and redistributing social cost and benefits.

3. Materials and Methods

Using asset-level datasets of China’s coal power plants and coal mines, supplemented by a range of independently sourced data points and assumptions on employment in coal transport, plant utilisation rates, tax rates, and productivity improvements, this study models and interprets the magnitude and distribution of jobs and tax revenues across space and time in China’s coal power sector. See Appendix D for further detail on assumptions and calculations.
The model overlays employment and tax calculations on a demand-driven coal production network constructed from plant and mine datasets, both of which also contain information on the corporate owners of each asset. It links employment in the coal power sector and coal mining industries to the building and retirement of plants from 2021 to 2060, according to five progressively stricter policy scenarios (see Appendix B). The transportation of coal from mines to the plants where it is used is also accounted for.
Coal demand is modelled on the basis of operating or planned coal-fired power plants in China, using a composite dataset updated in February 2021. The power plant dataset is hosted by the Smith School of Enterprise and the Environment at the University of Oxford. It combines coal power plant information from the S&P Global World Electric Power Plant (WEPP) Database, Global Energy Monitor’s Global Coal Plant Tracker (GCPT), and the World Resource Institute’s Global Power Plant Database. Plant-level coal consumption is estimated on the basis of 2019 province-level utilisation rates, to avoid pandemic-related distortions—i.e., markedly lower average utilisation rates—in 2020, particularly given China’s strong industrial recovery since then. The starting year of the analysis is 2021, to ensure that results reflect actual operating coal generation capacity in the middle of that year. Coal consumption rates vary depending on the size and type of plant (subcritical, supercritical, or ultra-supercritical), its operating efficiency, and the type of coal it consumes (anthracite, bituminous, sub-bituminous, or lignite), each of which has different estimated energy content. Table 1 summarises coal-fired power generation capacity (GW), estimated utilisation rates (%), corresponding electricity generation (TWh) and coal production statistics by province (million tonnes of coal equivalent, Mtce). Coal supplies are modelled based on a dataset of coal mines producing over one million tonnes annually, last updated in June 2021 [58]. The dataset represents at least 80% of total national coal output [41].
Power generation and coal mining are distributed very differently across China. Three provinces supply 1.87 billion tonnes of thermal coal, about 75% of the 2.44 billion tonnes of total production: Inner Mongolia (IM, 904 Mt), Shaanxi (SN, 498 Mt), and Shanxi (SX, 468 Mt). Xinjiang (XJ) is the fourth-largest coal producer at 237 Mtce annually. Inner Mongolia exports most of its coal to other provinces, as shown in Figure 1. All of these four provinces are net coal exporters, while every other province is a net coal importer, from other provinces and from abroad. Comparing aggregate national supplies to demand indicates an excess of low-quality lignite, and a shortage of high-quality anthracite, with the supply gap closed with imports from outside China. Several coastal provinces—notably Guangdong (home to the Shenzhen industrial zone), Beijing and Tianjin (TJ), and Zhejiang (ZJ)—produce no coal at all, relying entirely on imports from other provinces and international markets.
Coal plants are much more dispersed. No single province hosts more than 9.4% of coal power generation capacity. While the densely populated coastal and Eastern regions host some of the largest provincial fleets at 110.3 GW (Shandong, SD), 89.6 GW (Jiangsu, JS), 80.8 GW (Henan, HN) and 73.3 GW (Shanxi, SX), the sparsely populated Northern region of Inner Mongolia is expected to become the largest by 2023 at 120 GW if plants currently under construction are completed, with Xinjiang in the Northwest also expected to reach over 70 GW in the same year. This compares to a U.S. coal fleet expected to fall below 200 GW in total by 2025 [59] and reflects an ongoing shift, at least partly induced by public health concerns, from building coal power along the densely populated Eastern coast, to locating plants closer to production sites in less population-dense mining areas and exporting the resultant electricity.
Data on coal trading patterns between provinces is not available; however, plant and mine datasets alike contain information on the type of coal produced and consumed, such that anthracite mines can only supply anthracite-consuming plants, and so on. Only thermal coal-producing mines are included in the analysis, given that thermal coal dominates coal use in power generation, with metallurgical coal being used for steel production.
Matching first by coal type, coal plants consume coal from local (i.e., same province) mines where they exist first, and then import coal from other provinces on a pro-rata basis according to the distribution of supplies remaining once each province has met its own demand for coal. Although province-level average coal prices are available and average transportation costs from provincial or municipal capitals to plants can be estimated, these do not reflect actual intra-provincial coal price variations with any accuracy. Further, coal prices remain heavily regulated in China, albeit less so than electricity prices. Because of these uncertainties and distortions, price-based optimisation methods are not used to determine from which provinces plants choose to purchase their coal, as they would likely be no more accurate than the simple method employed here. In effect, this means that the three largest coal producers supply 90% of interprovincial coal trade: Inner Mongolia (an estimated 659 Mt in 2021, 40% of the total), Shanxi (426 Mt, 26%), Shaanxi (396 Mt, 24%). In the model, coal is imported from outside China only to the extent that domestic mines are unable to supply it. This results in China’s imports being largely comprised of the highest-quality type of thermal coal, anthracite.
While these figures are based on a best-effort reconstruction of the coal network in China with major limitations on data availability, and subject to constant change based on market conditions, they should represent an approximation of where and in what quantities coal is produced and consumed in China. Associating coal plants with mines in this way makes it possible to link the operation (and retirement schedule) of specific plants with upstream mining jobs (both locally and externally to each province) and associated tax revenues.

3.1. Estimating Employment

Data on the number of jobs supported by coal plants themselves is not easily available. Survey information suggests that the number of jobs supported directly by a given plant can vary significantly based on the age and size of the plant (with newer, larger plants typically requiring less employees to operate) and the age stratification of employees [60]. In addition, staff may be employed in non-technical positions tied directly to the plant, including catering, accommodation, logistics, and construction [61], depending on the degree of vertical and horizontal integration of the plant or the enterprise that controls it. Accurately estimating the number of employees in each specific plant is not feasible, since this can depend on factors in addition to the plant’s location, type, owner, age, and design for which data is not available. Bearing in mind these limitations, this analysis uses the best available estimates of staff numbers differentiated by plant size [60] (Table 4), resulting in estimated employment of approximately 400,000 in China’s coal plants in 2021.
The number of jobs supported by the mines supplying coal plants is much larger. National statistics place the total number of jobs in coal mining and dressing at a peak of 5.3 million in 2014, falling to 4.5 million in 2015, 2.85 million in 2019 and 2.68 million in 2020 [62]. This decline, of nearly 50% in six years, reflects a combination of small mine closures and falling labour intensity, as noted above.
In some cases, the number of employees in a specific mine are available in the coal mine dataset used for this analysis. The data is incomplete, however, and biased towards large, more labour-efficient mines. Because of this, the number of employees in coal mining in each province is estimated by applying province-level estimates of labour intensity (in jobs per 10,000 tonnes of annual production) [63] (Table 4). The estimated average labour intensity of coal mining and washing diverges sharply across provinces [63]. That of the most efficient province, Inner Mongolia (1.7 jobs/10,000 additional tons of coal production in 2015) is similar to that of contemporary Germany. The least efficient is Jiangsu, at 30.8 jobs/10,000 tons on average. At a constant rate of productivity increase, this suggests that less labour-efficient provinces will see much greater job losses as a proportion of total mining employment in the short term.
These estimates, which are for the year 2015, are projected forward in the source’s methodology by assuming an 8% annual increase in labour productivity consistent with historical trends each year from 2015–2020, slowing to 5% per year from 2021–2050, and 0% thereafter (i.e., assuming no potential for further improvement at that point) [63]. This assumption does not account for the actual dynamics of labour elasticity of demand in the industry, such as structural impediments to hiring and firing workers, and indispensable mining jobs unaffected by changes in output. This results in an estimate of 1.72 million thermal coal mining jobs in 2021, which accounts for 63% of total coal mining and washing jobs in reported in 2020 national statistics [64] and 59% of total estimated coal production in 2019. This suggests that the model estimates aggregate employment in coal mining reasonably well, with thermal coal demand (excluding metallurgical coal and coal for heating) accounting for approximately 60% of total coal mine output and associated jobs.
The coal industry also supports jobs in the transport sector, particularly where dedicated rail, road and port infrastructure has been put in place for specific mines, depending on the degree of automation and efficiency of the transport process. The employment elasticity of coal demand in turn depends at least partly on the substitutability of coal for other products or commodities not correlated with coal demand. In the model, it is assumed that coal transport is not substitutable, implying that coal is mostly transported along routes and using equipment dedicated to the purpose. Coal is transported by rail, road, and water (river or ocean) in different proportions. To arrive at an estimate of the employment intensity of coal transport, the number of jobs in each coal transport segment is divided by ton–kilometres of freight transported in each segment [64], then a weighted average is calculated based on the shares of each transport mode in the coal sector [65]. This results in an estimate of 433 jobs per billion ton–km of coal transported. Actual costs are calculated based on the amount of coal transported, multiplied by the distance between each plant and the capital city of the province it imports from (as a reasonable proxy for average distance travelled).
Labour productivity improvements are likely to occur in the transport and power sectors, as well as coal mining, driven in particular by automation. The authors have been unable to locate data to substantiate any assumptions on the rate of improvement. Accounting for some further automation in both sectors would accelerate the rate of job losses observed in the results but would still have a relatively small impact in comparison to the mining sector given the dominance of the latter in coal sector employment.

3.2. Estimating Taxes and Subsidies

The coal industry raises tax and social security revenues for subnational and national governments in several ways. Income taxes to central government, and social security contributions for investment in managed public funds, are calculated on the basis of employee wages, which vary by employment type and region [66], using current tax brackets and assuming only the standard deduction is made [67,68]. Social security contributions vary across provinces and cities, but are assumed here to total 50% of base salary, with 30% employer-contributed and 20% deducted from wages [69]. Real wages, prices and tax rates are assumed to remain constant in the model.
The 2018 Environmental Pollution Tax levies charges on several pollutants, with the level generally decided by subnational governments and set at higher levels for more populous provinces (see Appendix D, Figure A1). In this study, coal plants are subject to taxes on sulphur, nitrogen, particulates, and wastewater. Coal mines are taxed on gangue, tailings, ash, and wastewater.
Coal mines also pay fees for mining rights, at 0.5–4% of sales value (of which 80% goes to subnational governments), as well as (minimal) prospecting and exploration fees based on estimated mine surface area. Resource taxes, based on the value of coal sales, accrue to subnational government and vary by province. Finally, value-added tax (VAT), reduced in 2019 to 13% for coal products, is levied cumulatively on coal and, ultimately, electricity sales, using price data that is assumed to already include VAT. VAT is collected by the national government, and 25% is then returned to the subnational government from which the revenue was raised. Surcharges for education and construction are levied as a percentage of VAT: 3% for education, and 1% (rural), 5% (county) and 7% (urban) for construction. Since construction surcharges are levied based on the location of the parent company’s headquarters, we assume, for simplicity, that all construction surcharges are levied at the higher urban rate at 7% of VAT.
Total tax revenues to central government, therefore, include income taxes, prospecting, and exploration fees, 20% of mining royalties, and 75% of VAT. Total revenues to subnational governments include environmental pollution taxes, resource taxes, 80% of mining royalties, 25% of VAT, and education and construction surcharges.
Data limitations prevent estimation of subsidies at plant or mine level or distinguishing between subsidies benefiting coal power generation, versus coal use in industry and heating. Subsidies are estimated in aggregate on the basis of point-in-time studies, themselves reliant on multiple assumptions and subject to uncertainty. They include subnational fiscal support to coal mines, VAT rebates and subsidies for R&D and coalbed methane production, the aforementioned Industrial Special Fund, price subsidies to electricity and coal transport, and credit support. Electricity price subsidies can be estimated at plant level based on the difference between the administratively-set benchmark (regulated) price and spot (market) prices for electricity. Mines are assumed to take full advantage of available VAT rebates.
With the caveat that subsidy estimates are uncertain and highly aggregated, recent estimates place overall production subsidies at CNY 17–18 per tonne of coal [70], implying a CNY 350–375 billion production subsidy to the approximately 2.08 billion tonnes of coal consumed by thermal plants in 2021. Annual generation subsidies for coal power are estimated at CNY 120 billion [71] to CNY 263 billion [72] (although, in the latter case, the bulk of these subsidies were expected at the time of writing to be eliminated by 2020 amid the end of funding for pollution control upgrades and deregulation of price controls). Subsidies to rail transport add at least another CNY 10 billion, with central government subsidies estimated at CNY 2 billion [73] in 2015, and provincial subsidies from Inner Mongolia alone at CNY 7.2 billion [71]. Taking the lower ranges, this suggests an overall current subsidy level of at least CNY 480 billion annually to the thermal coal industry across plants, transport, and mines, not counting historical subsidies for plant pollution control equipment.
The negative environmental and health externalities to coal production are also not included in this figure (although they are subject to some limited taxation). Estimates of externalities per tonne of coal production (including impact on air quality, water and soil quality, global warming, prevalence of respiratory disease, and a range of other factors at various stages of production and consumption) vary. Coady, et al. [74] assess damages from all energy sources in China (to which coal is a major, if not majority contributor) at CNY 3 trillion for global warming impact, and a further CNY 12 trillion for local pollution, around 40 times higher than all other subsidies combined. Zhao, et al. [75] use revealed preference methods to estimate the environmental cost of coal-fired power plants at CNY 300 per MWh (implying a subsidy of CNY 1.52 trillion in 2021, given 5058 TWh of coal-fired generation), which is still five times all other subsidies. Annual externality subsidies to coal power generation are estimated by others at a more modest CNY 180 billion [72], around a third of all other subsidies.

4. Results

4.1. National Level Results

The model was constructed to run from 2021 to 2060 for five scenarios (see Appendix B for detail), under which the life of each plant becomes progressively shorter: 30 years under the “No Transition” (NT) and ”Baseline” (B) scenarios, 25 under “Low-Cost Renewables” (R), 20 under 50% lower emissions than 2015 (C50) and 15 under “80% lower” (C80), respectively. 
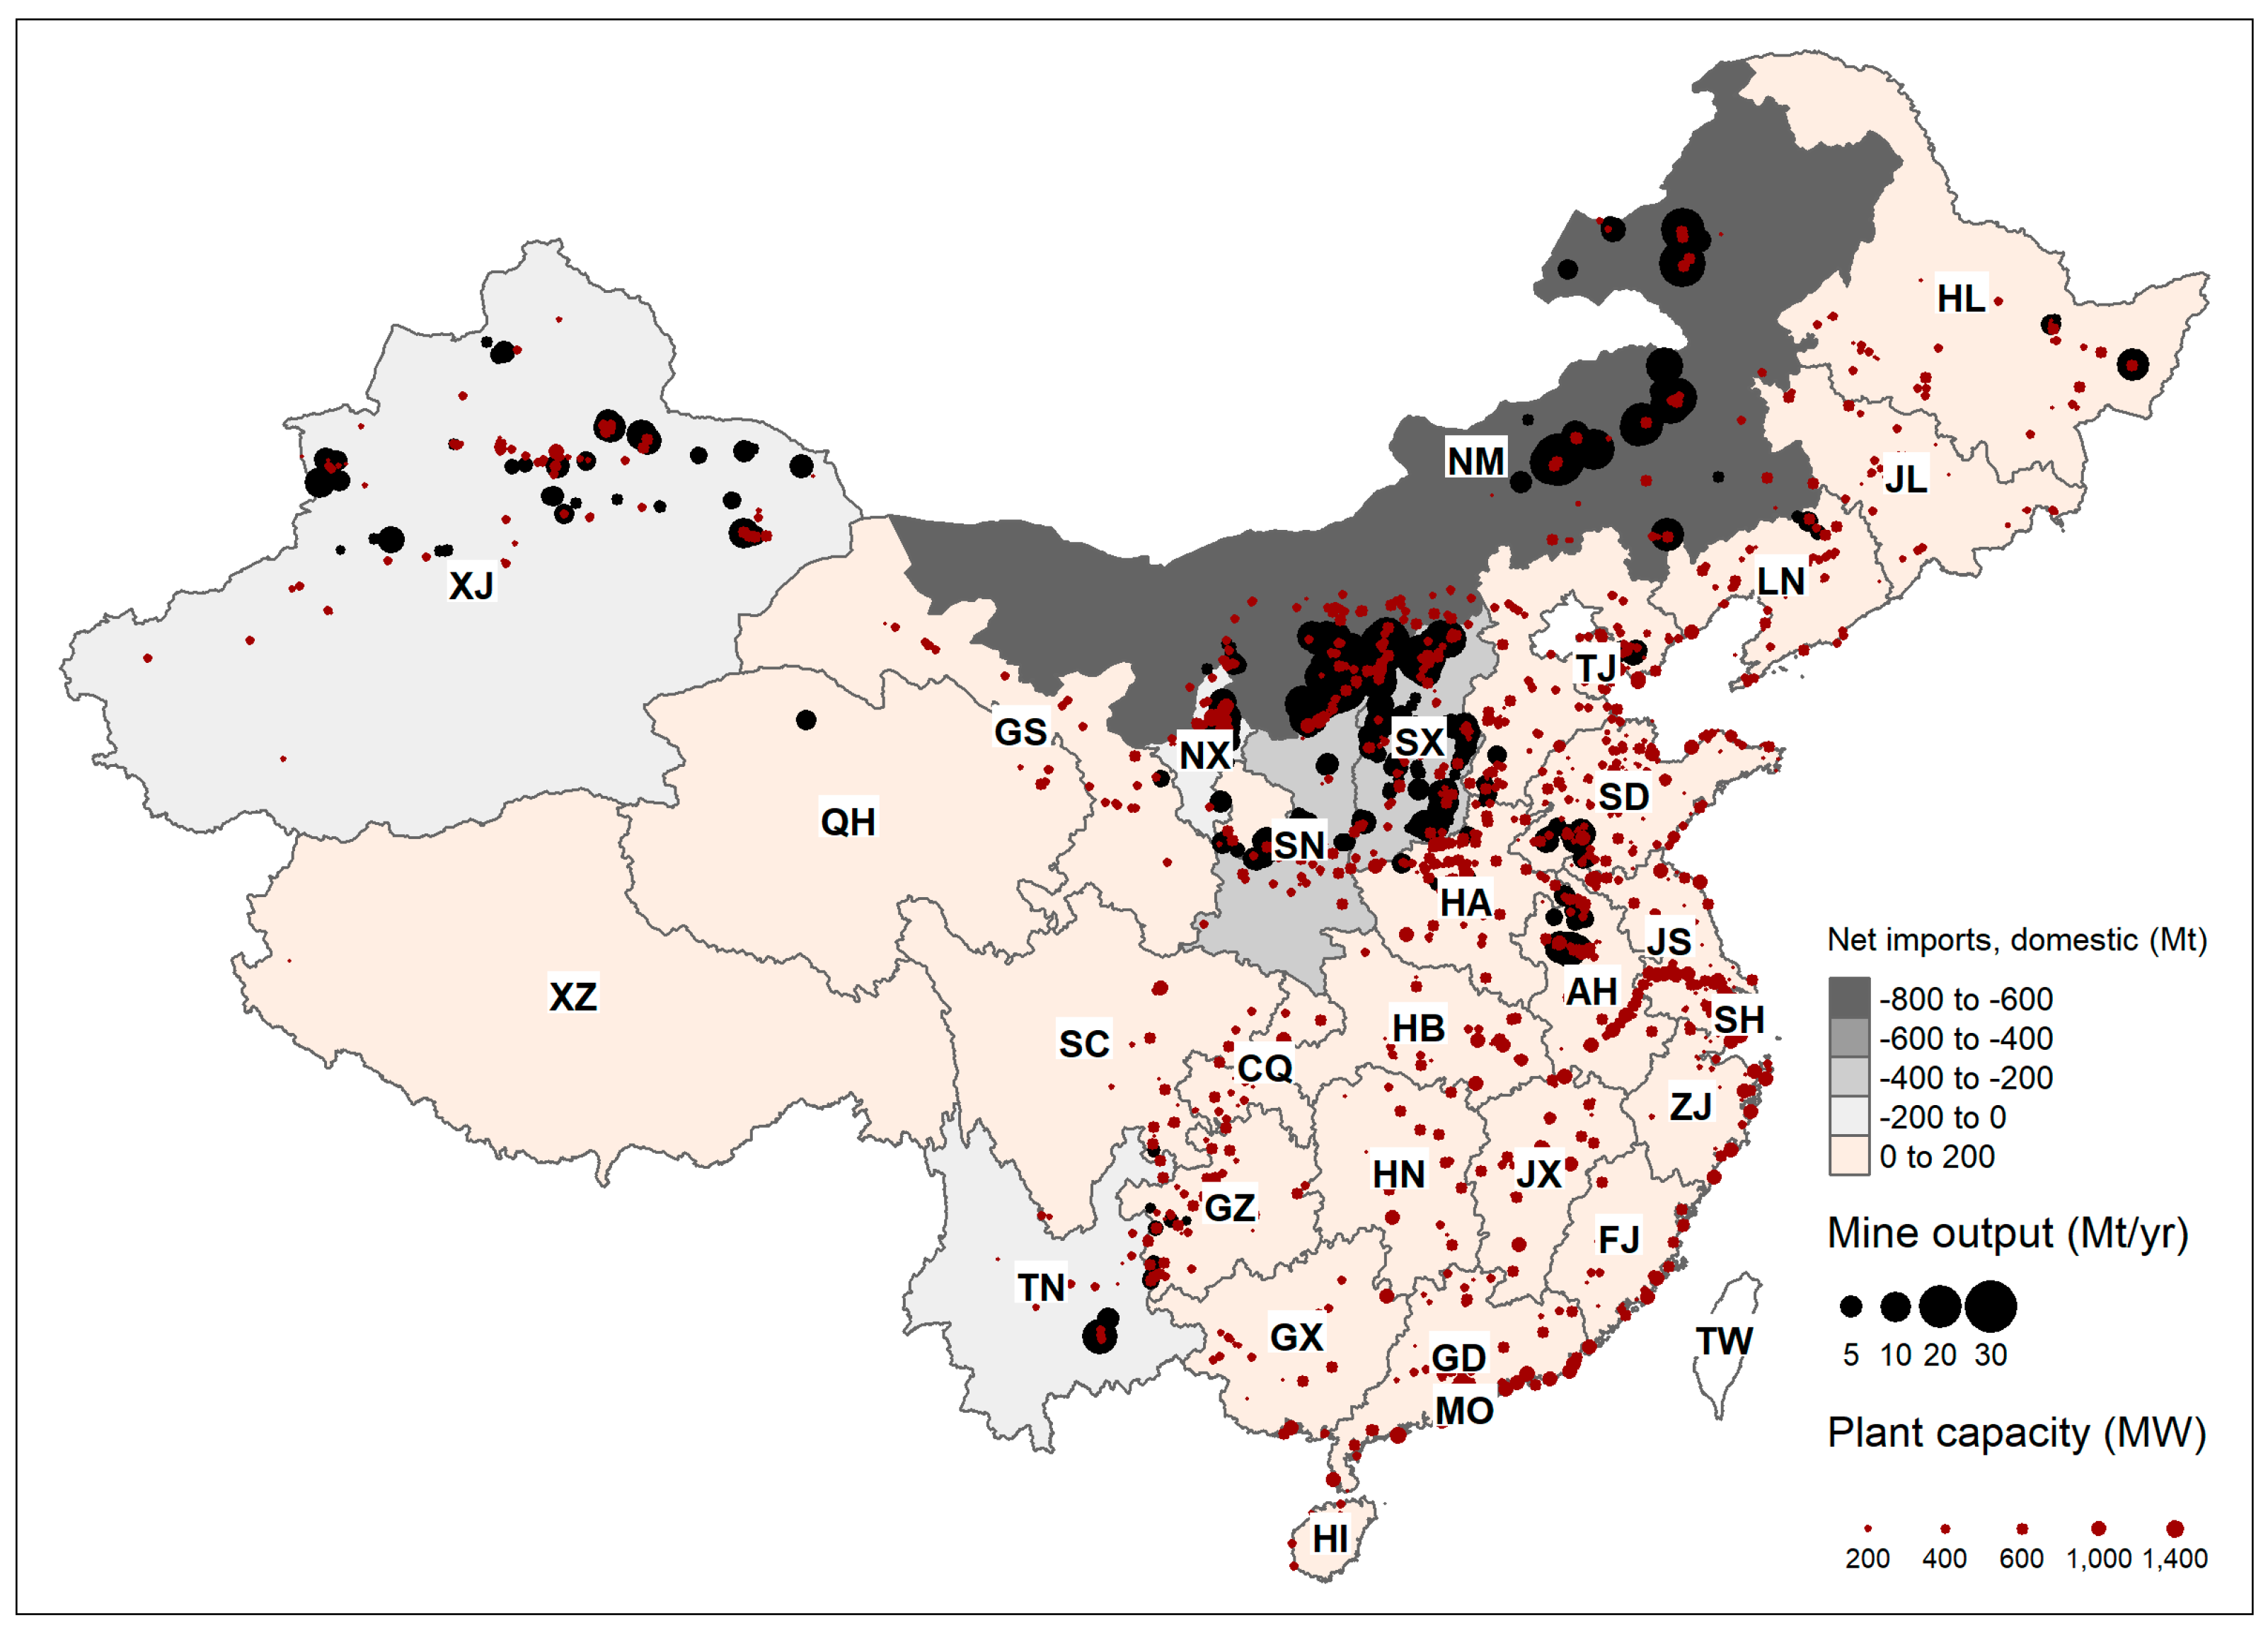
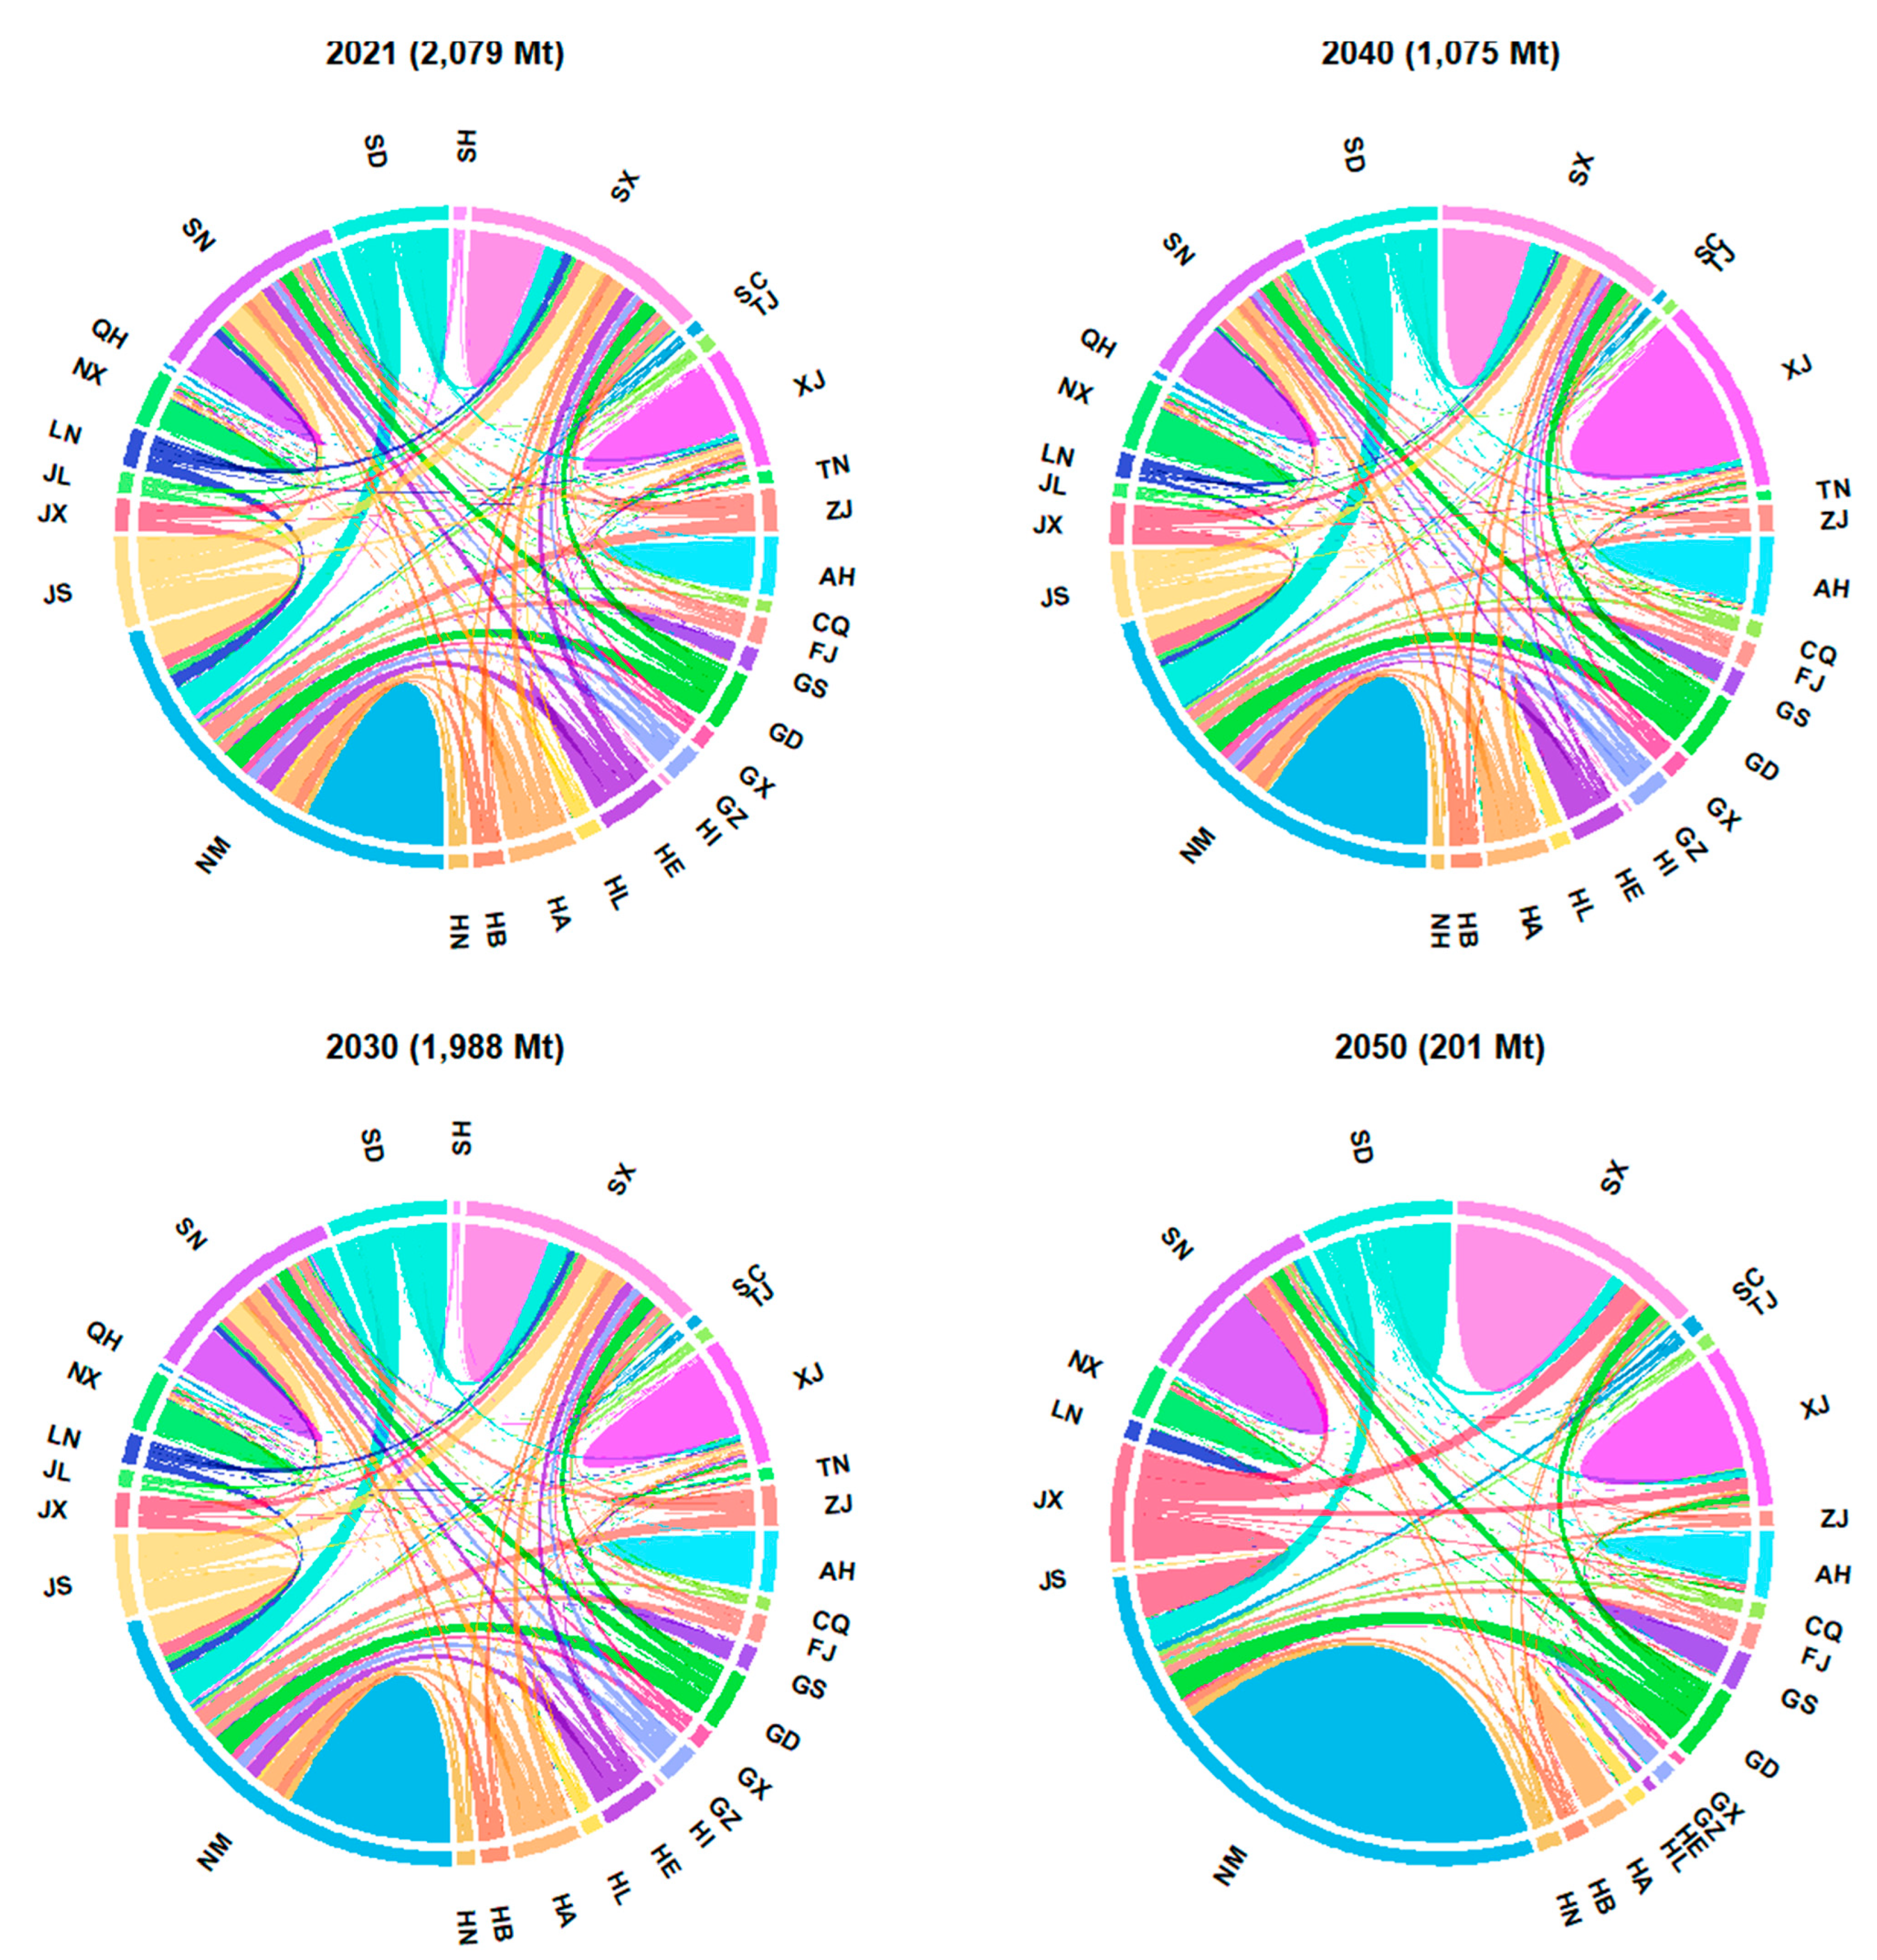
Figure 2 shows the production-consumption relationships of thermal coal of all types between provinces in the B scenario, where each coal-consuming province (outside ring) consumes coal from local mines where it is available, and imports from other provinces where it is not (cross-circle links, where the colour of the link is that of the destination province). The prominence of Inner Mongolia (NM), Shaanxi (SN), and Shanxi (SX) as coal suppliers to many other provinces is clearly visible. All three produce a large amount of coal, consume a significant share of their own coal, and export the rest to other provinces. Inner Mongolia’s and Shanxi’s prominence as both producers and consumers will continue to grow, such that, by 2050, both provinces will dominate coal demand, obtaining the vast majority of coal from their own local mines.
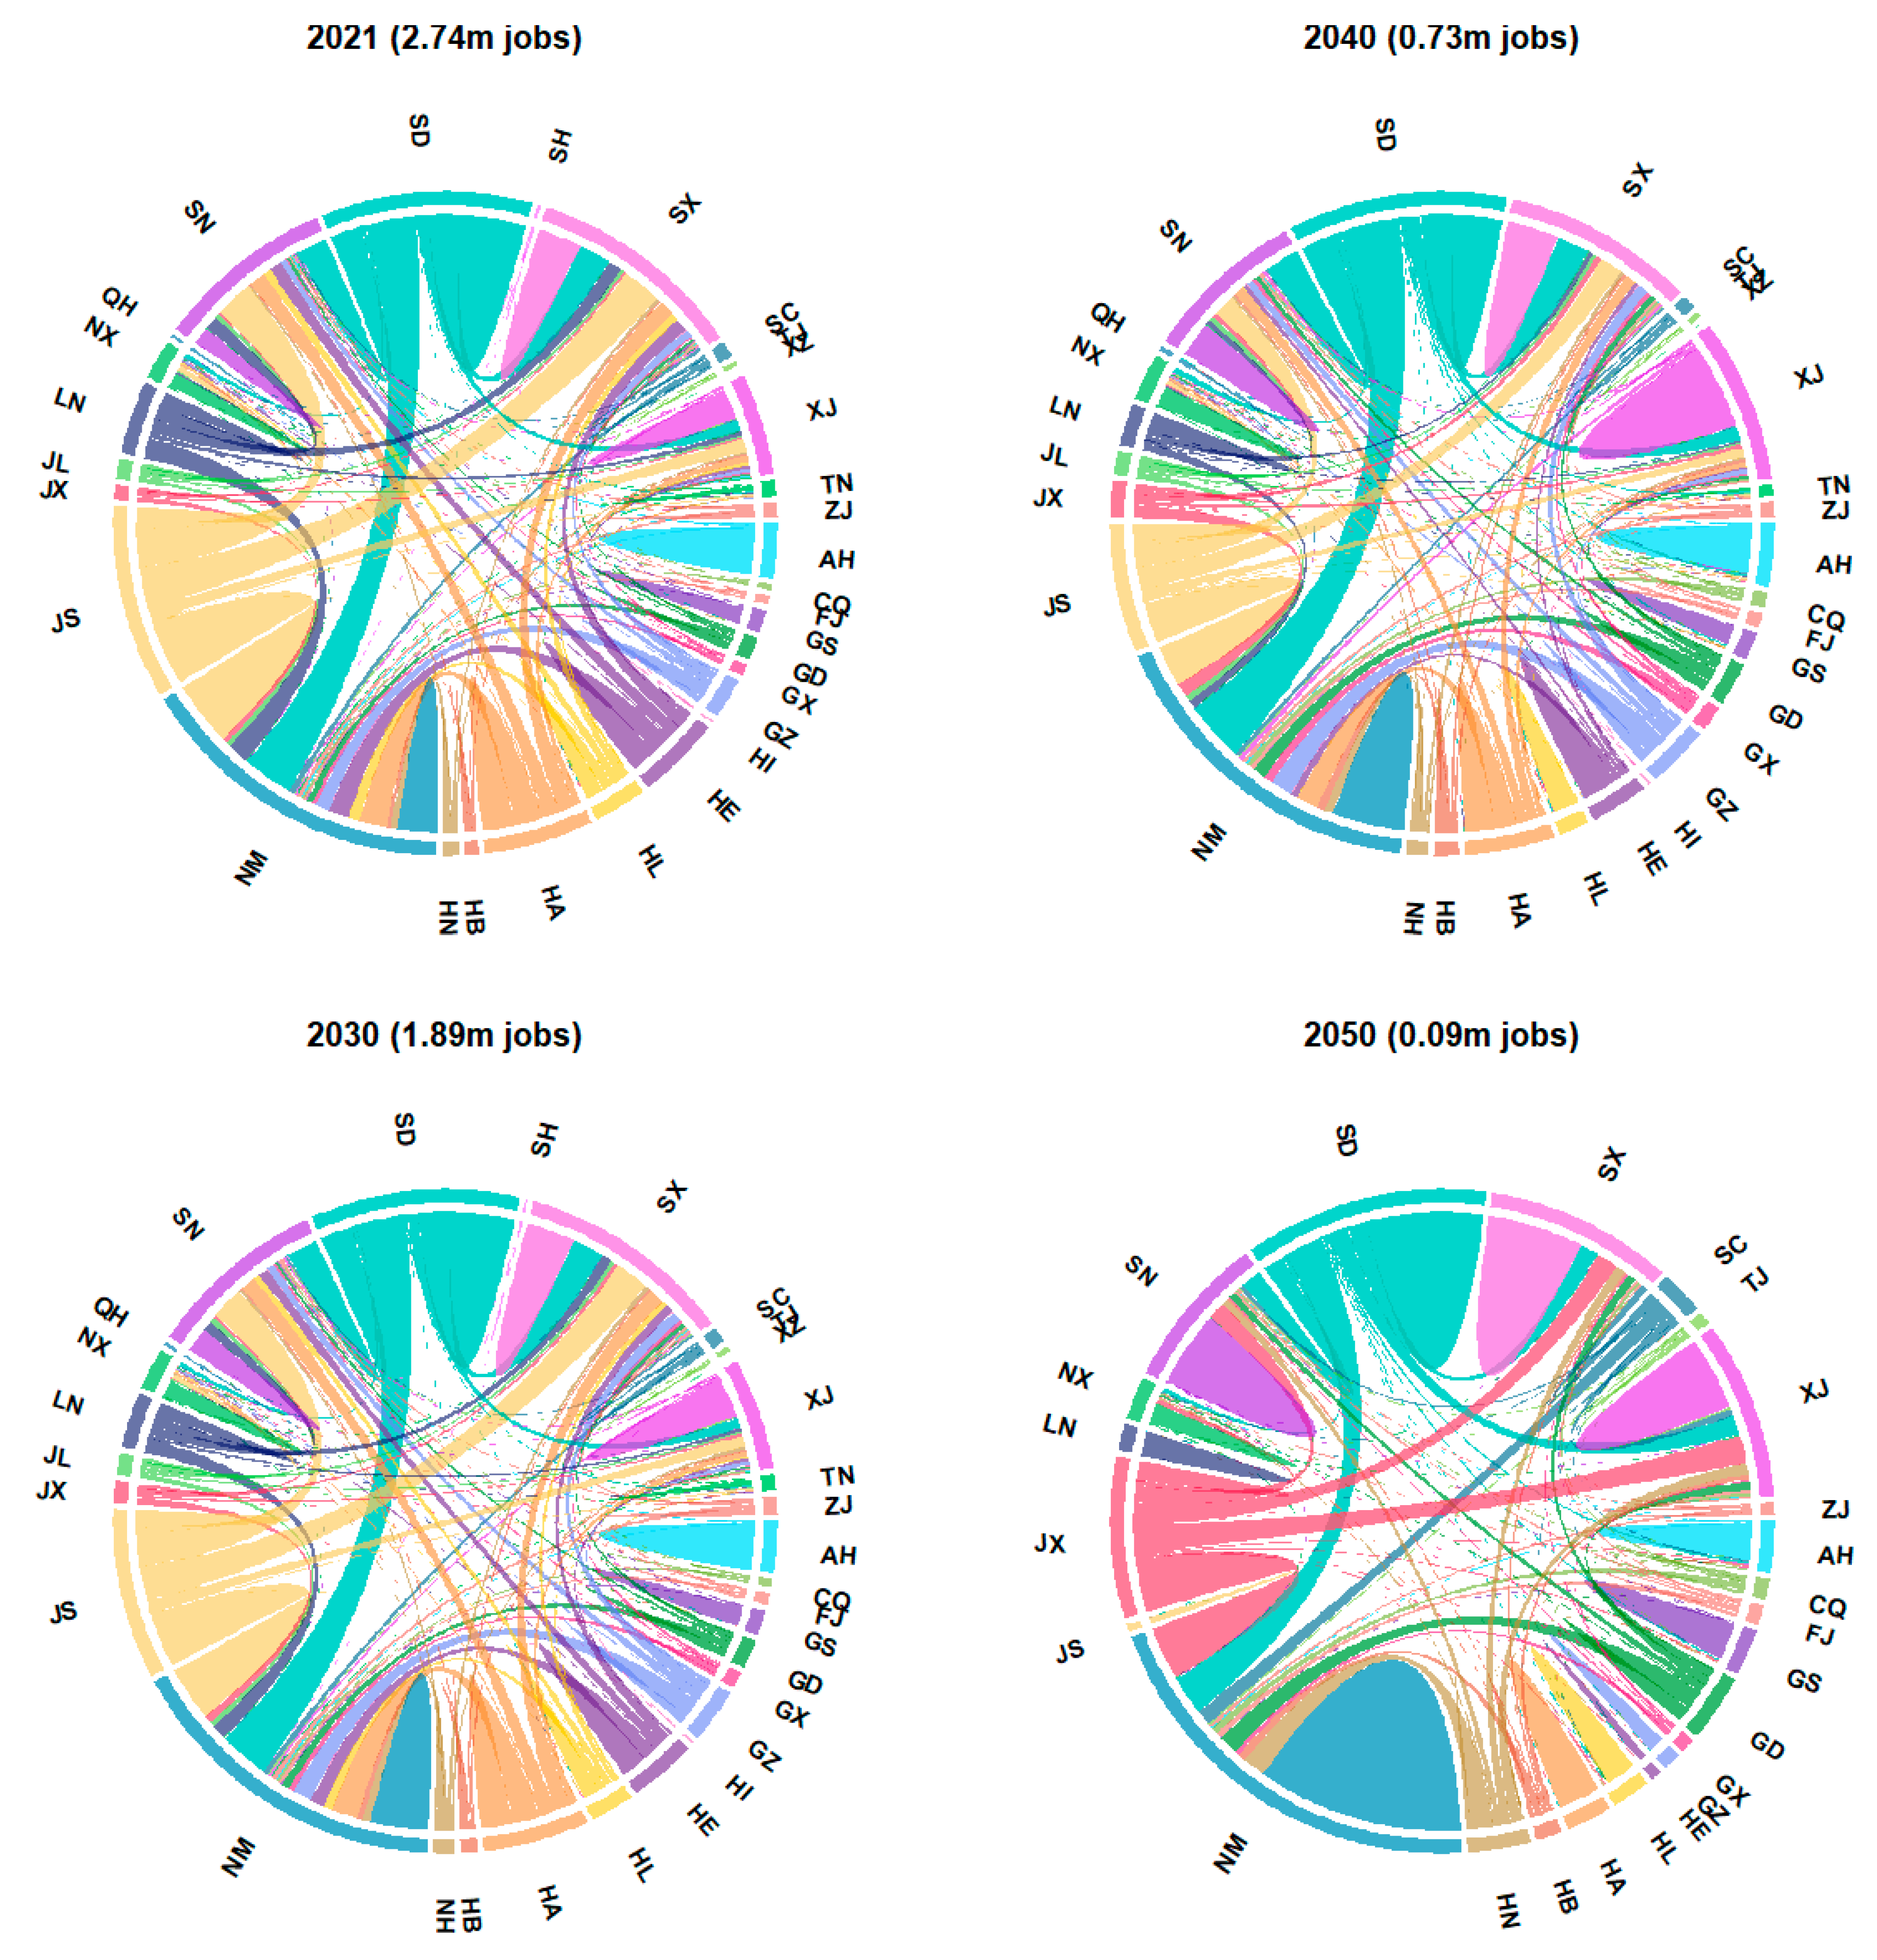
Table 2 summarises the number of jobs supported by each province’s coal fleet, which are also visualised in Figure 3. This refers to jobs at coal plants in that province, as well as upstream supply chain jobs in mining and transport supported by each plant’s coal consumption. The number of support jobs is determined largely by the labour intensity of mining in the provinces from which the coal is sourced. Provinces themselves are more likely to be home to a greater number of coal jobs (both locally and nationally) when they have a combination of large coal fleets, large mining capacity, and high labour intensity. Coal plants in Shandong, for instance, support 491,200 jobs nationally, both locally and indirectly by importing coal from other provinces. Inner Mongolia’s coal fleet is of a similar size but is supplied entirely by its ultra-efficient domestic mining industry workforce and supports only 102,000 jobs, although coal exports to other provinces supports another 444,000 coal mining jobs in Inner Mongolia’s mines.
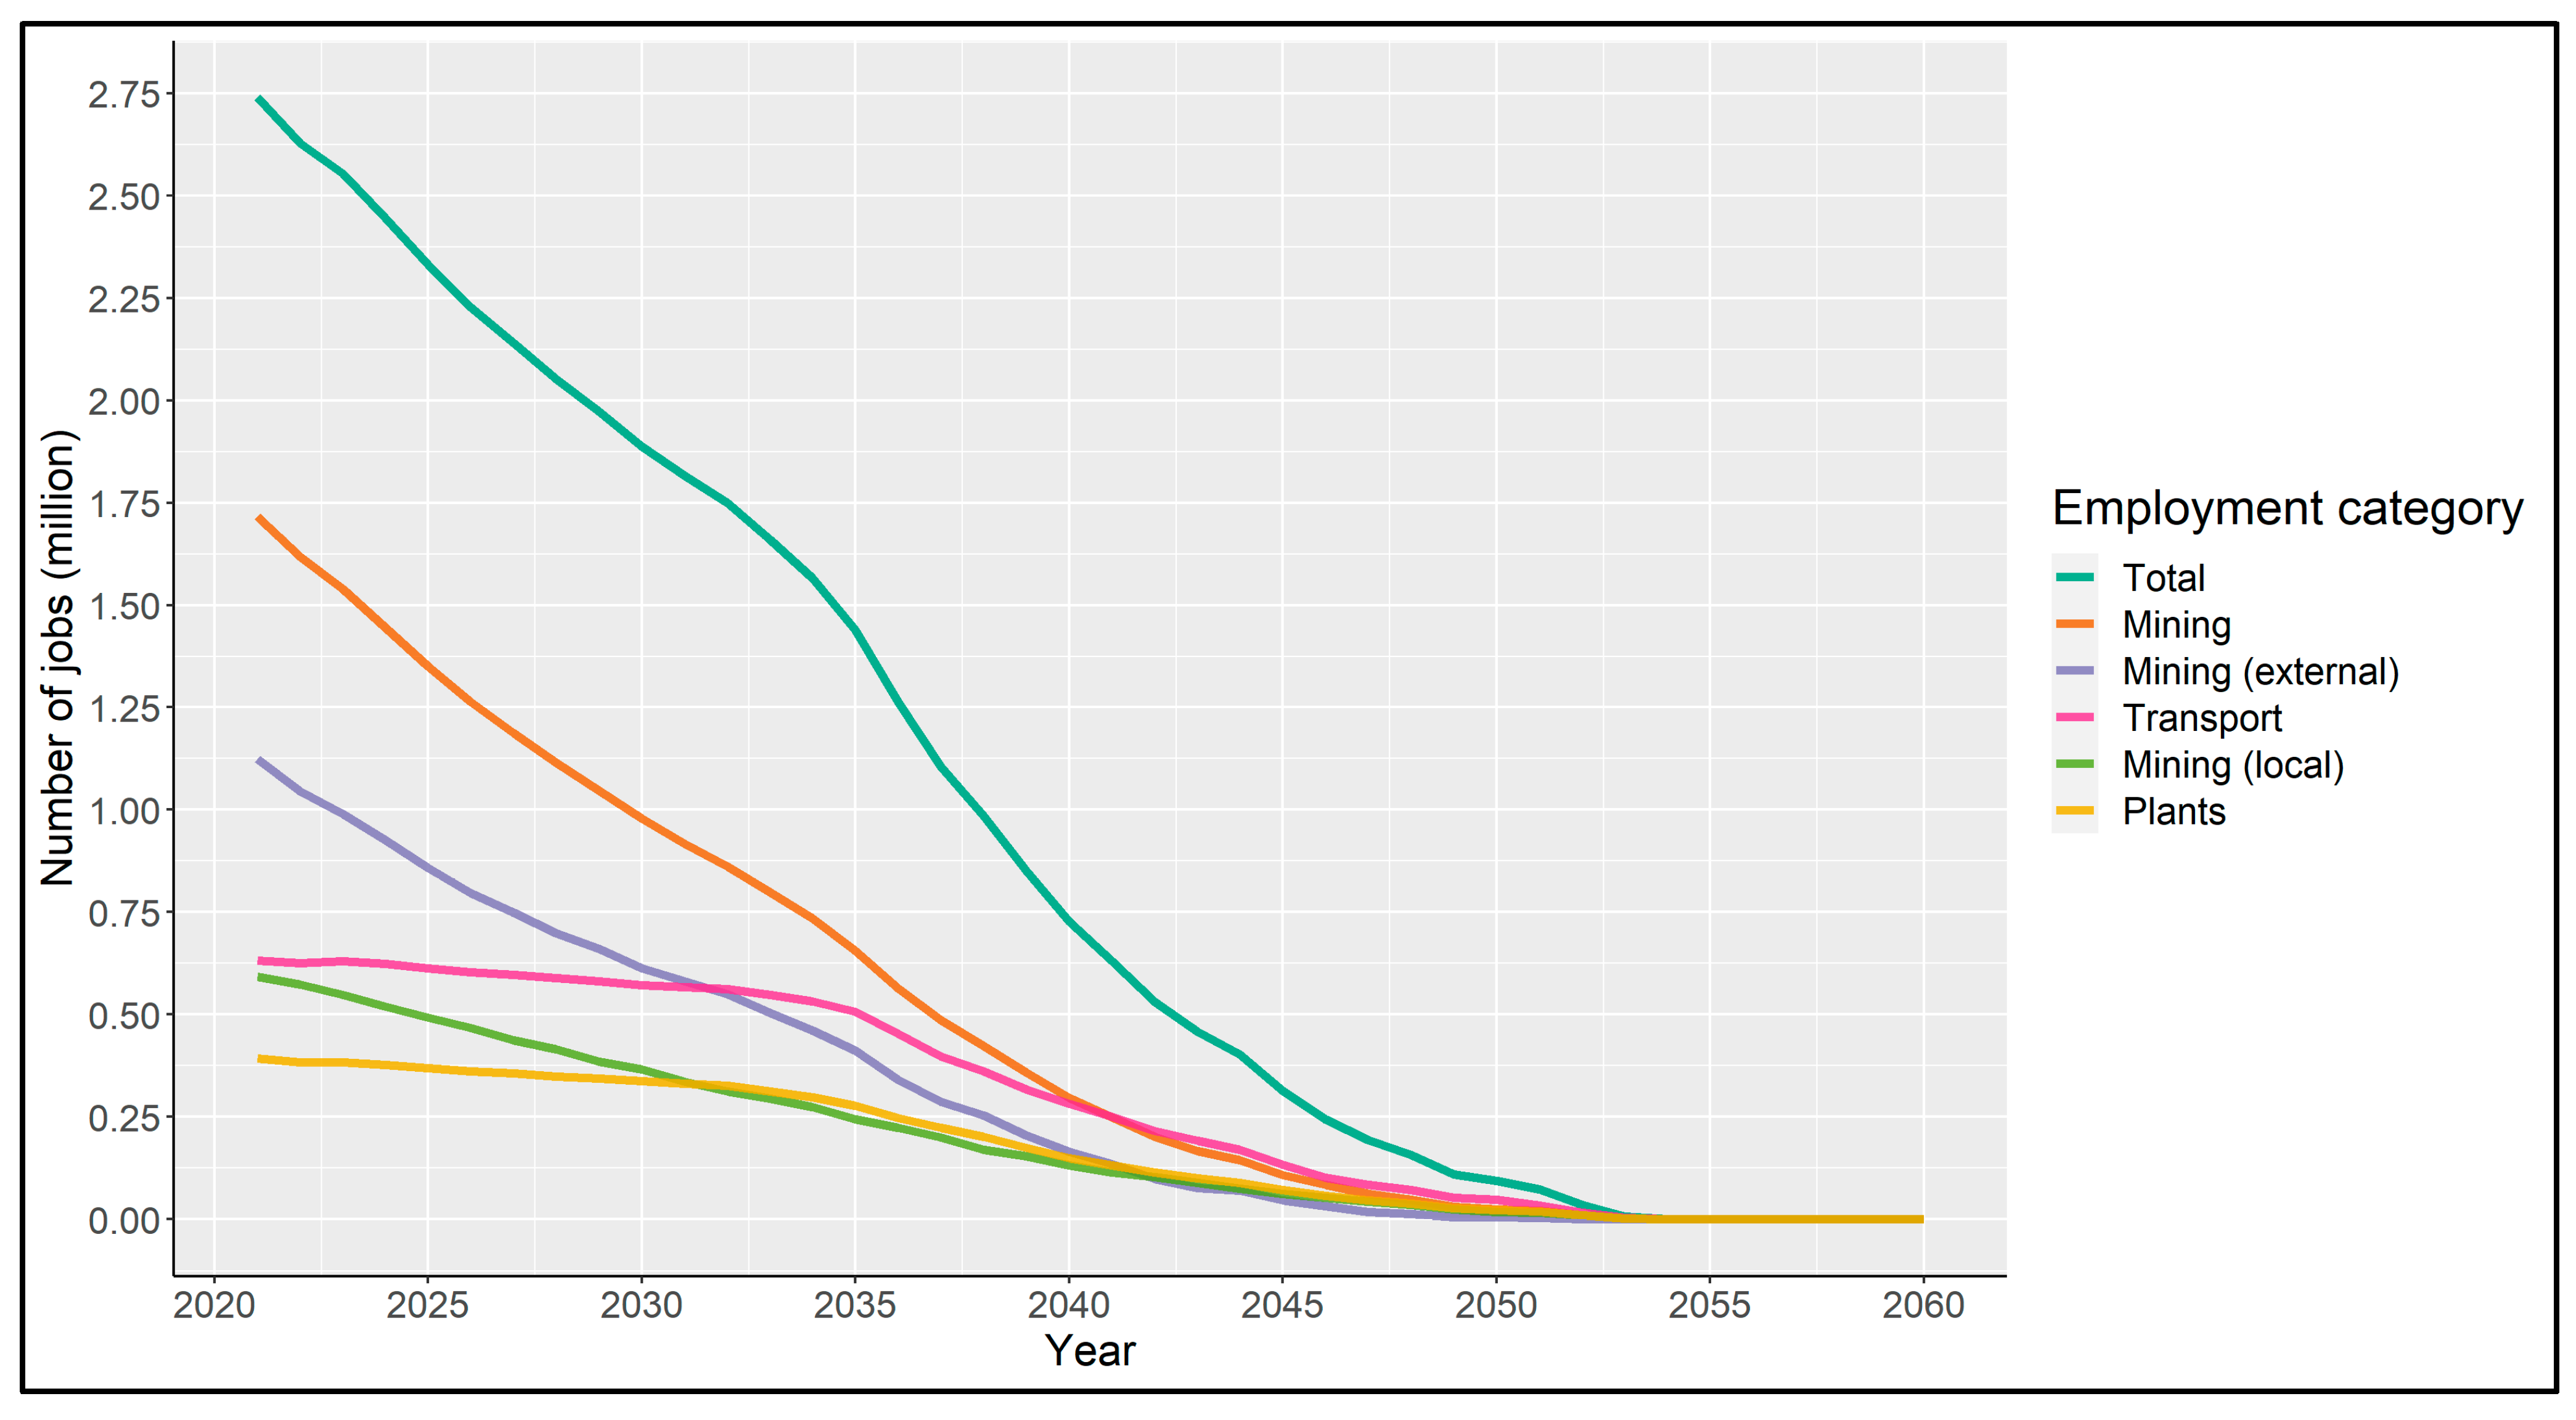
Figure 4 plots baseline scenario estimates for employment in the coal power industry from 2021–2060. Employment in coal mines starts at a higher level (1.72 million) but follows a steep downward trajectory, declining by over 60% to 655,000 by 2035. Employment in plants (starting at 393,000) falls half as fast, by just under 30% to 277,000 in the same period. Transport jobs are proportional to ton-km of coal transported and again fall half as fast as plant jobs: 632,000 in 2021 falling 15% to 238,000 in 2035, reflecting a 15% drop in coal consumption over that period. The sharp fall in mining jobs reflects the extrapolation of past declines in mining labour intensity and the slow pace of plant retirements up to about 2034. From this point onwards, total job losses accelerate as the pace of plant retirements increases and coal demand falls more rapidly, slowing slightly again in the 2040s and declining to zero in 2054 as the wave of plants built in the decade to 2020 reach the end of their operating lifetimes.
Under the baseline scenario, reflecting current policies, total employment supported by the thermal coal power industry is projected to drop from 2.74 million in 2021, to below 1 million by 2038, below 500,000 by 2043, and below 250,000 by 2046 (see Figure 4). As noted in previous work [16], the net employment impact of coal closure on the whole economy is unlikely to be significantly negative as other forms of energy production and supporting industries take its place. The public policy challenge is anticipating job losses sufficiently well across space and time to take early action to redeploy workers elsewhere or offer retraining programmes to avoid the potentially very large burden of mass early retirements, or chronic unemployment, on the social security system. Methodologies have been developed to undertake this analysis by identifying green industries and skills that are ‘adjacent’ to emissions-intensive ones [76], but have not yet been applied in detail to China.
The trajectory of fiscal revenues in the B scenario does not decline as sharply and in fact rises slightly in the short term. Income taxes and social security payments fall with the decline in employment; however, total revenues rise initially from CNY 330 billion to CNY 339 billion in 2023, at which point total coal capacity peaks at 1205 GW. This reflects the tax burden on physical capital (notably resource and environmental pollution taxes, VAT, and surcharges linked to VAT) representing a much greater proportion of total revenue than taxes on labour.
In 2021, VAT contributes CNY 153.7 billion in tax revenues to the national government (95% of the total), about 2.7% of total VAT revenue in 2020 [77]. Of the remaining national government revenues, income taxes contribute CNY 5.6 billion (3.4%), and mining royalties CNY 2.6 billion (1.6%), and. For subnational governments, pollution taxes on mines generate CNY 52.7 billion (31.3%), VAT, CNY 51.2 billion (30.5%), resource taxes CNY 47.8 billion (28.4%), and pollution taxes on plants, CNY 4.7 billion (2.8%).
As 
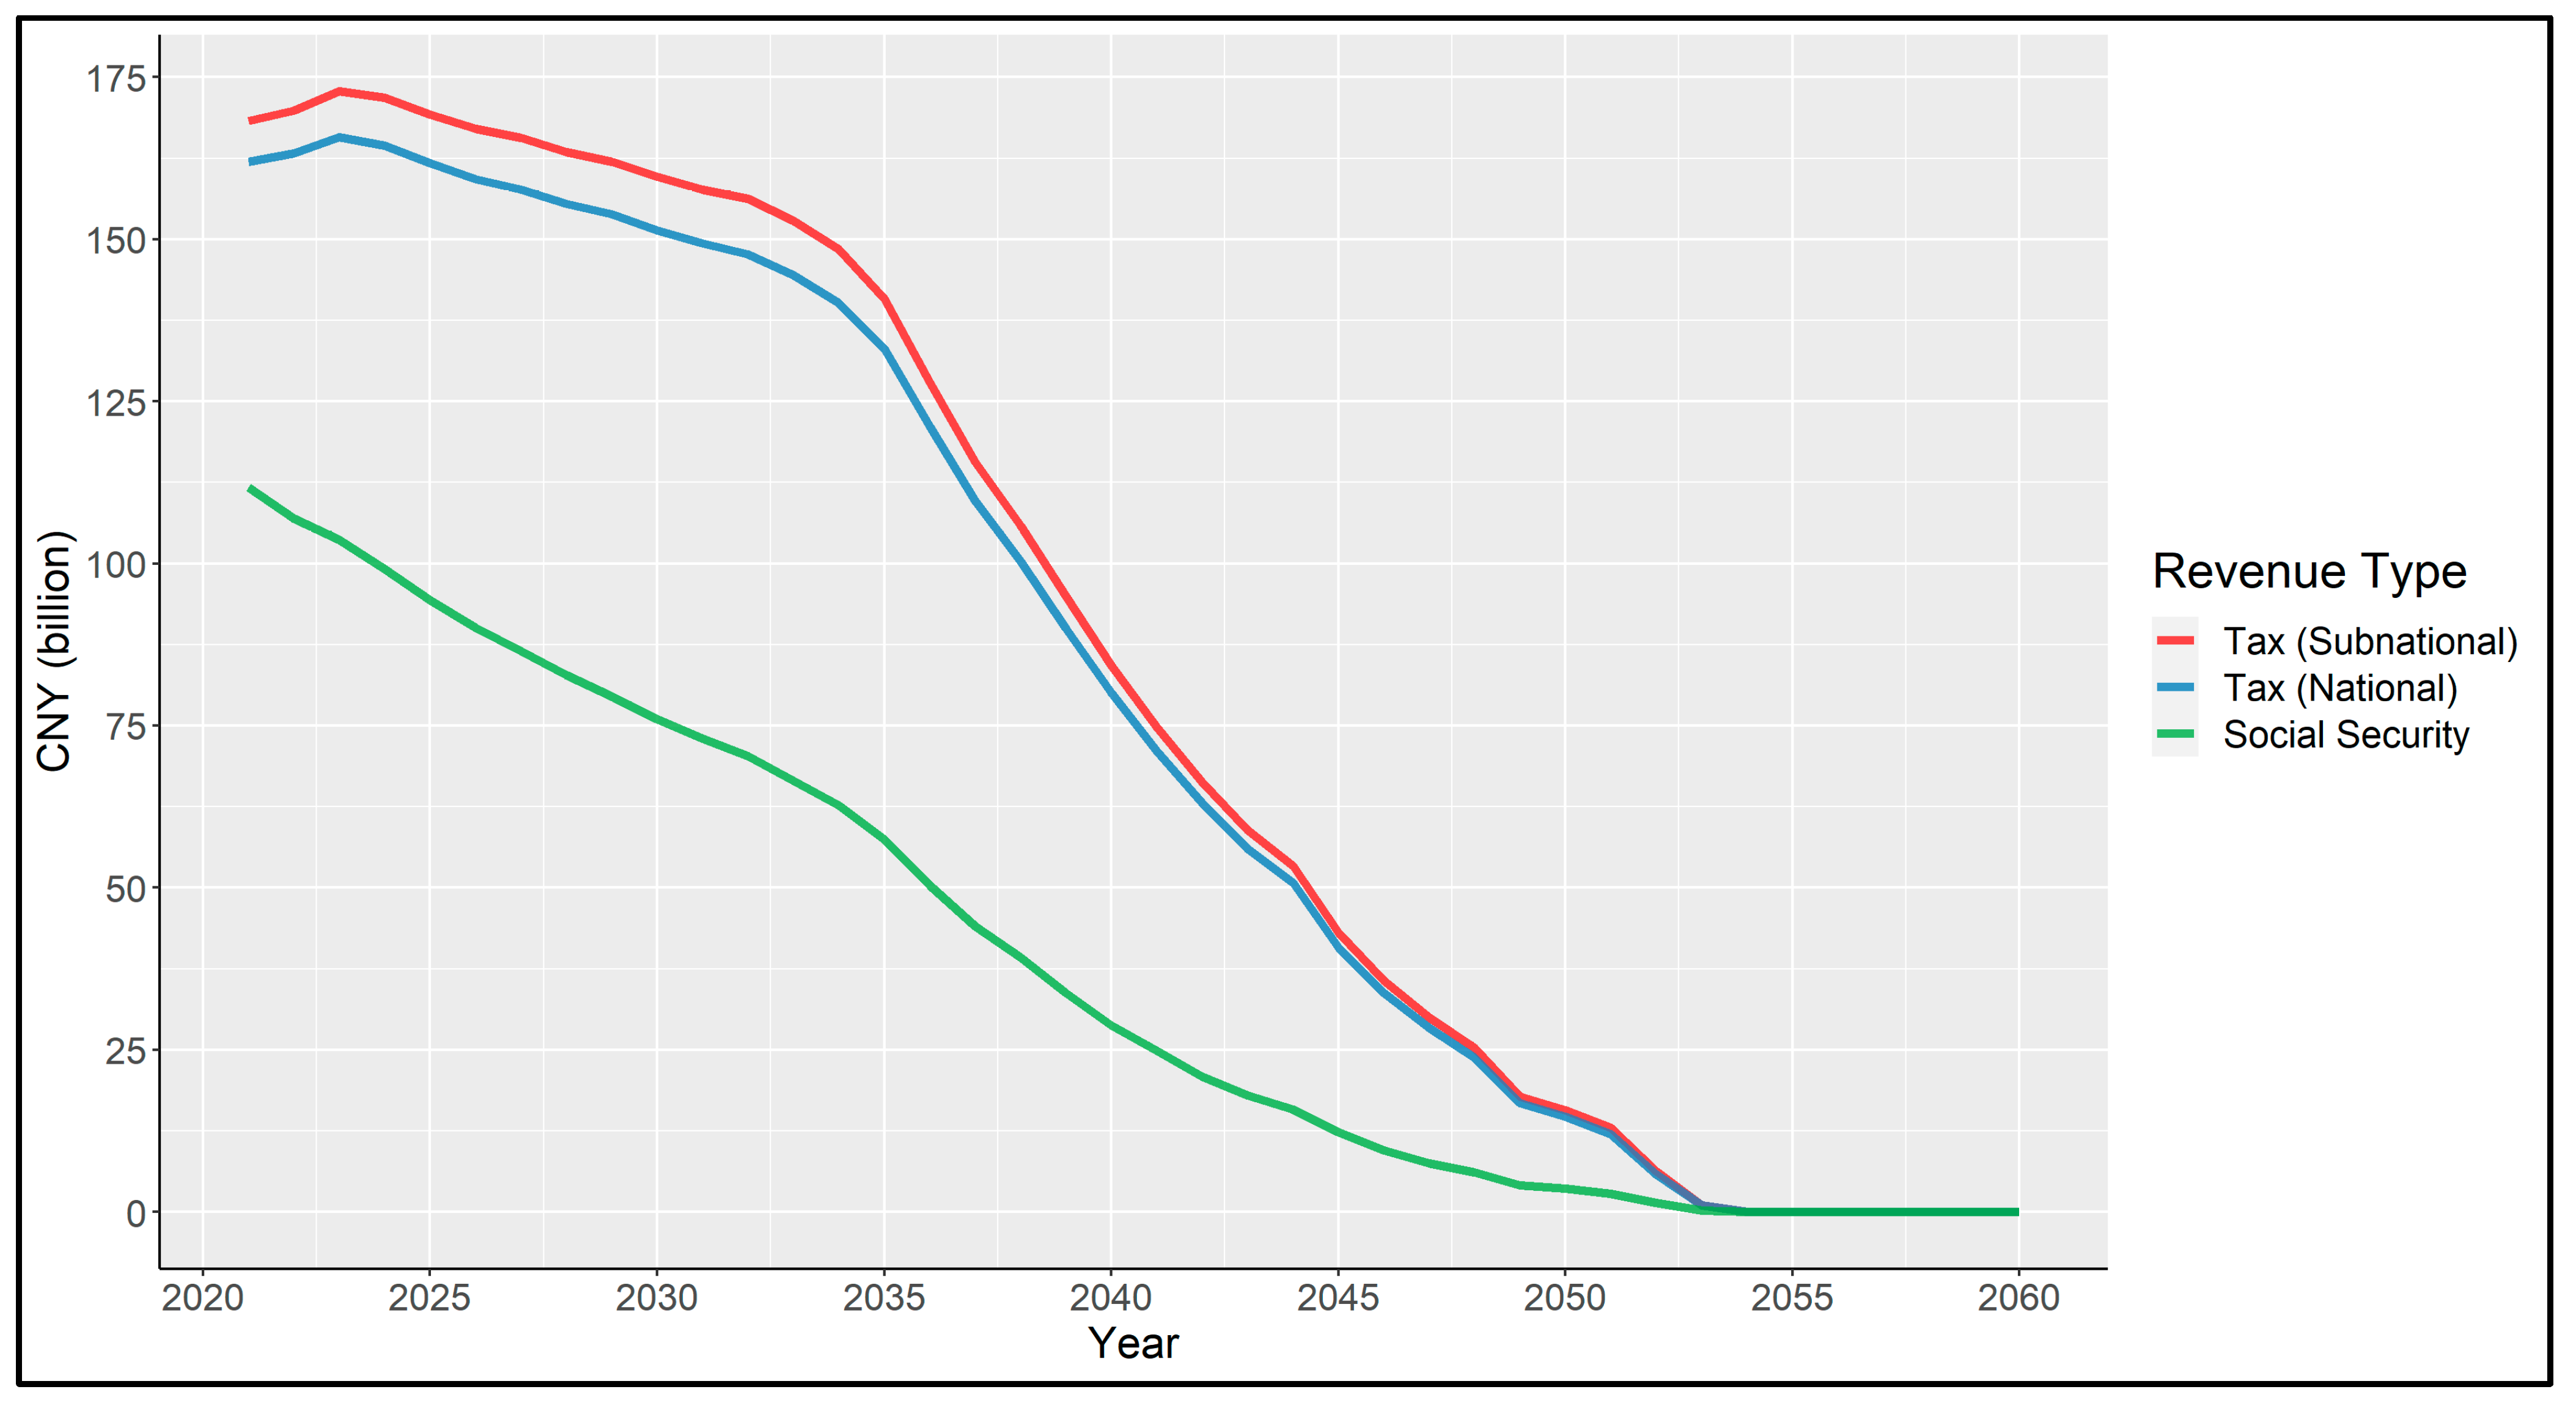
Figure 5 shows, despite the difference in composition, absolute revenues flowing to national and subnational governments are very similar and follow a near-identical trajectory. Annual revenues to national/subnational/all levels of government decline slowly by 1–1.5% annually from their CNY 166/173/339 billion peaks in 2023, to CNY 151/160/311 billion in 2030. Tax revenues start to fall steeply around 2034 as plant retirements accelerate, with annual rates of decline in both cases jumping from 3% in 2034, to 5% in 2035 and 9% in 2036, continuing to fall by 9–11% per year until 2044 and significantly faster thereafter. Total tax revenues from the thermal coal industry fall below CNY 100 billion by 2045, and just over CNY 30 billion in 2050. Social security payments (not strictly a tax, but a relevant contribution to publicly managed funds) are also plotted for comparison. The trend in social security revenue, falling from CNY 112 billion in 2021 to CNY 76 billion in 2030 (a 32% decline), and CNY 3.6 billion in 2050 (a 97% decline) is based entirely on wages, and, therefore, follows a similar trajectory to total job losses (Figure 4) rather than tracking plant closures, with some variation due to differences in average wage over time.
When compared to the estimated current annual subsidy level of CNY 480 billion or more, the total of around CNY 330 billion in total tax revenue suggests that the net fiscal contribution of the coal industry to public revenues is likely to be negative, without accounting for the cost of negative externalities. As the revenues associated with capital assets fall more sharply after 2035, it becomes increasing likely that coal will become a net fiscal drain on China, even without accounting for the public health, productivity, and other environmental and climate externalities that coal mining and combustion generate. While subsidies to capital assets and power price subsidies for coal may fall as generation and coal consumption declines, other costs may rise to negate this, including contingent liabilities arising from state-owned power or mining company losses, defaults, or bankruptcies, restructuring efforts, and relocation/retraining costs for laid-off workers.
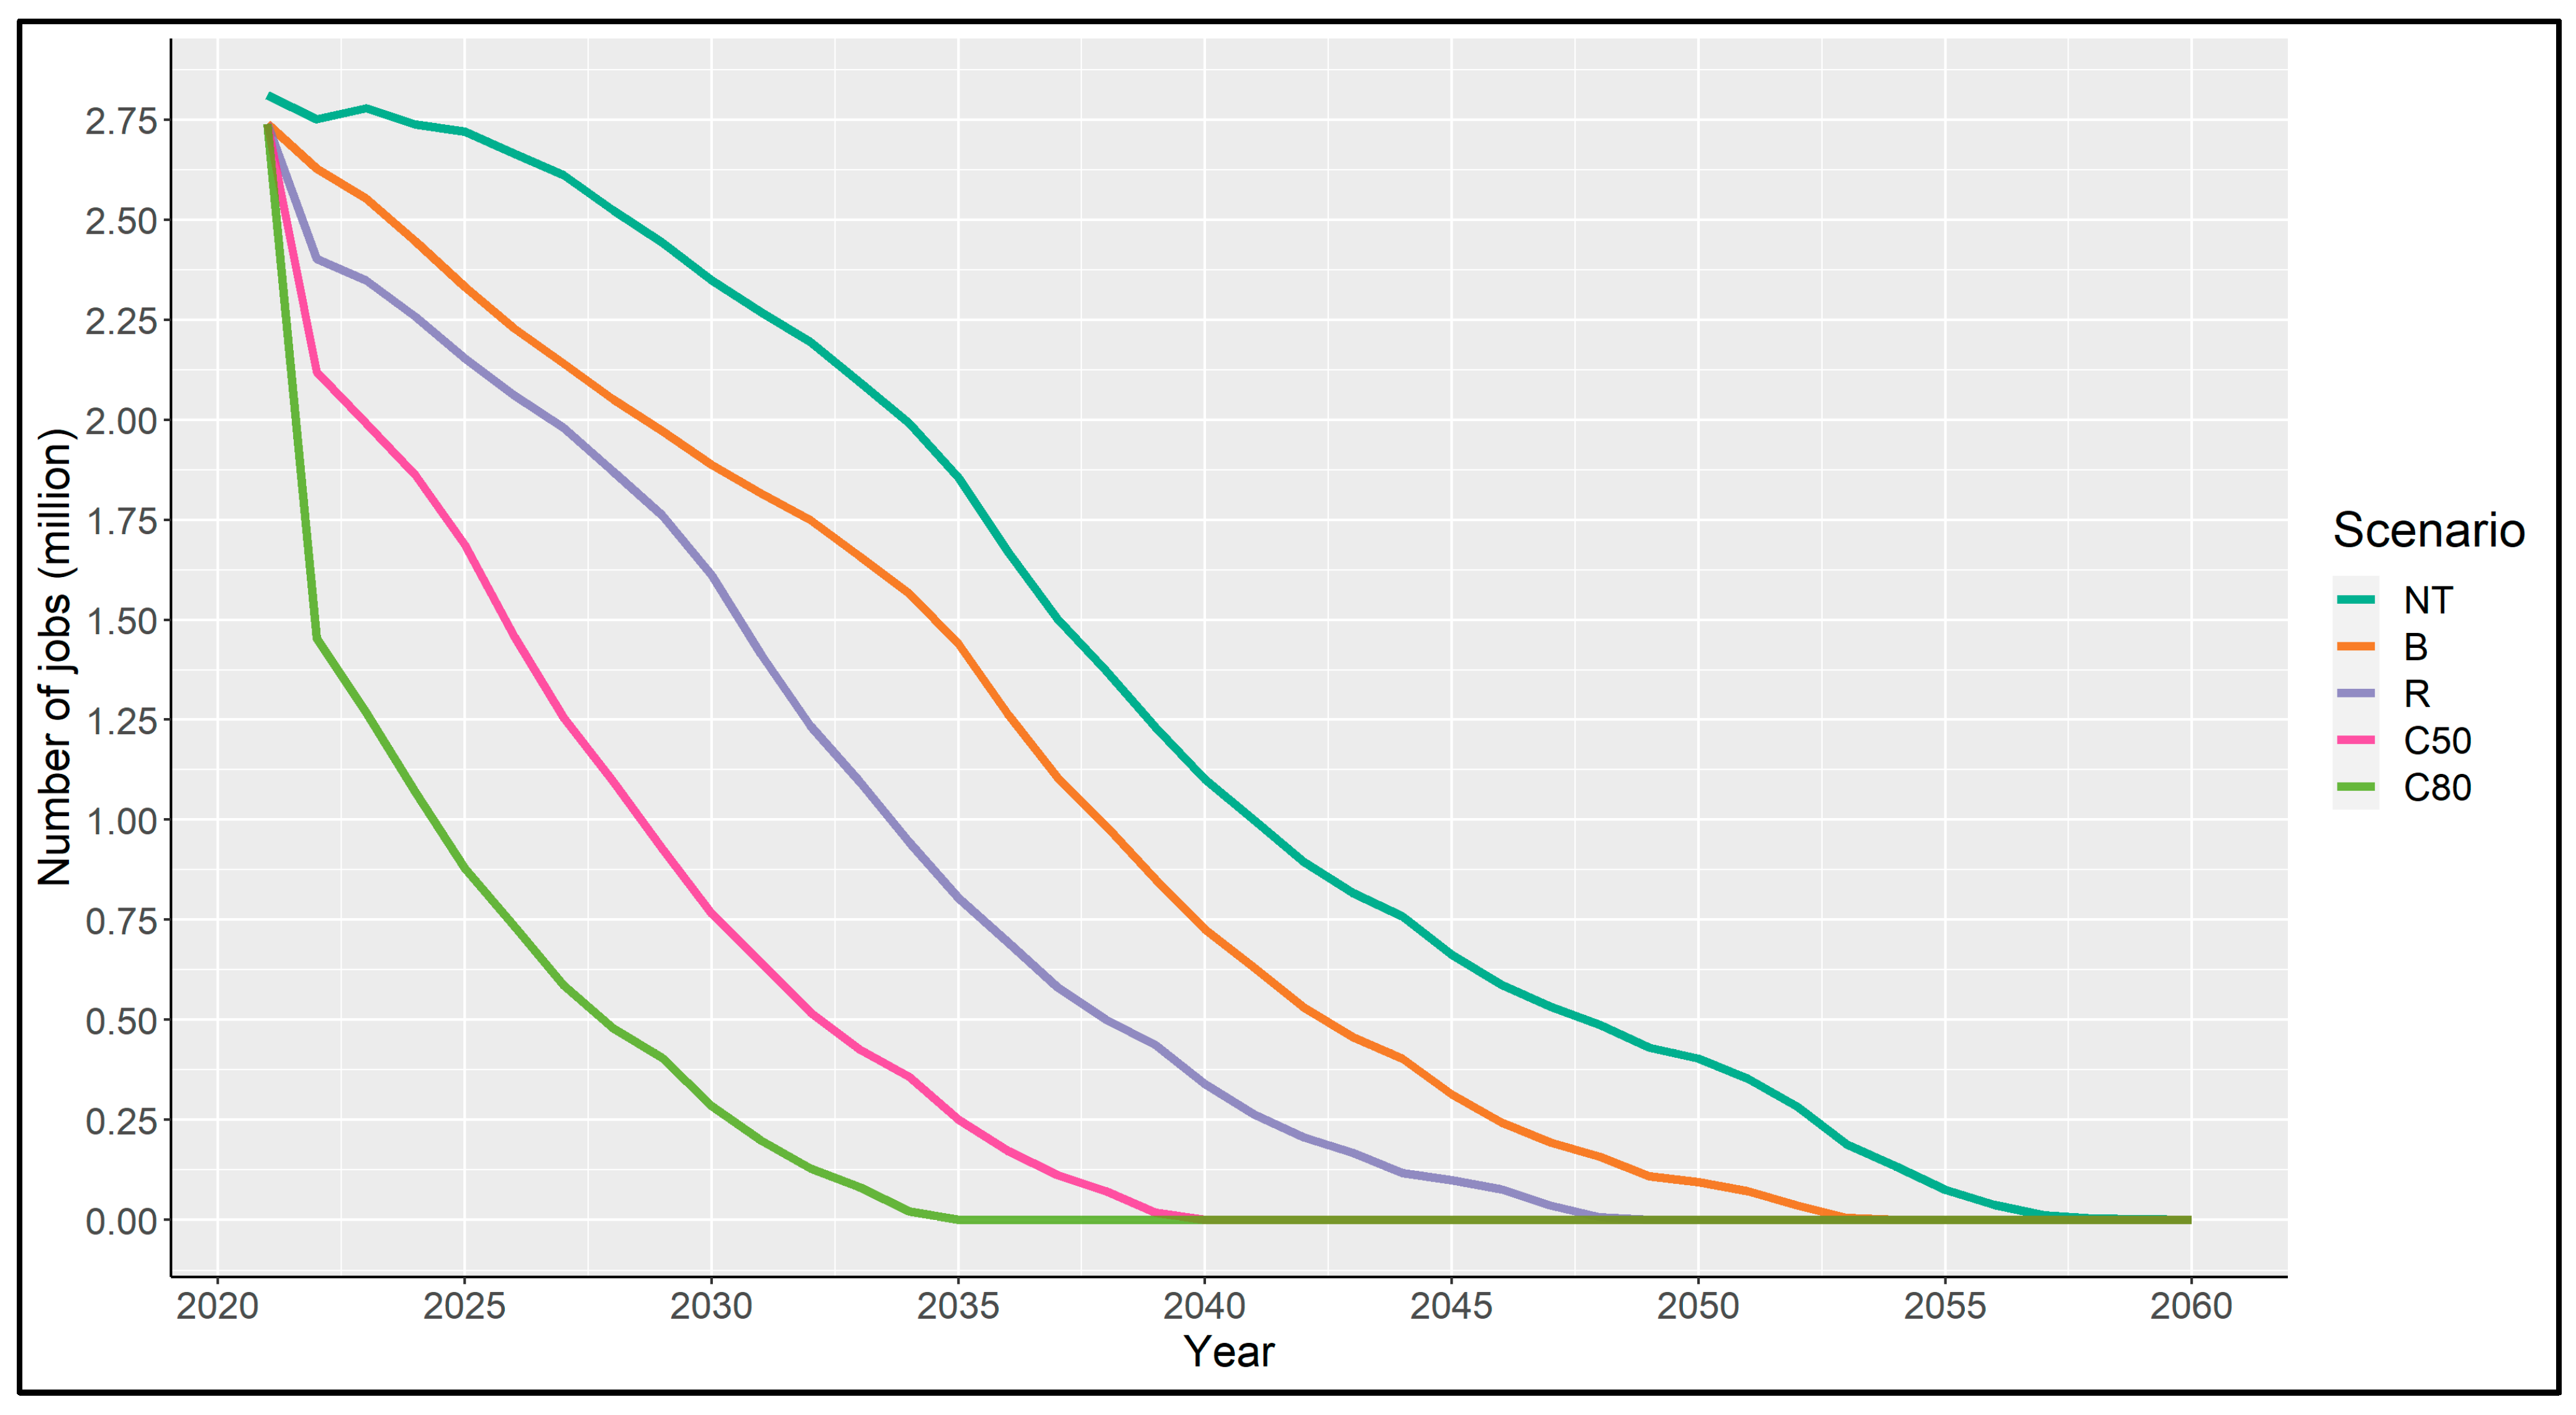
Comparing the baseline against the R scenario, with lower expected technology costs, and the more aggressive C50 and C80 scenarios, which artificially constrain total sector emissions, helps to understand the marginal impact of climate policy on thermal coal employment and the sector’s fiscal contribution. Under progressively stricter scenarios, the short-term drop in coal capacity (reflecting the retirement of older plants) needed to meet the target requirements becomes increasingly large.
The R scenario has relatively little impact on total employment until the late 2020s, leading to about 270,000 fewer jobs in 2030 relative to the baseline (Figure 6). The differential between the two pathways widens to over 630,000 in 2035, before converging back to 214,000 by 2045. Under the C50 scenario, implying coal phase-out by 2040, over 1.1 million additional job losses compared to the baseline would be expected by 2030, while, under the C80 scenario (phase-out by 2035), almost 1.6 million additional jobs disappear by 2030—almost 40% of total thermal coal industry jobs today. Notably, even the No Transition scenario, where all planned plants are built, only protects about 500,000 employees from redundancy by 2030 compared to the baseline. Total jobs still fall 40% by 2040 and 85% by 2050, declining to zero in 2060.
The more ambitious phase-out pathways do have serious employment consequences in the short term; however, the absolute magnitude of these changes is not unprecedented in China’s coal industry. Absolute job losses by 2030, even under the C80 scenario, are still fewer than the estimated 2.7 million coal industry jobs already lost between 2014 and 2020 [62]. If 181 GW of CCS-enabled capacity were kept open in 2050 (as in the 2 °C scenario described above), even at the current rate of around 150 employees for a large (circa 1 GW) plant, this would be unlikely to support more than about 25,000–30,000 coal plant jobs at the most in the second half of the century, and fewer in mining and transport.
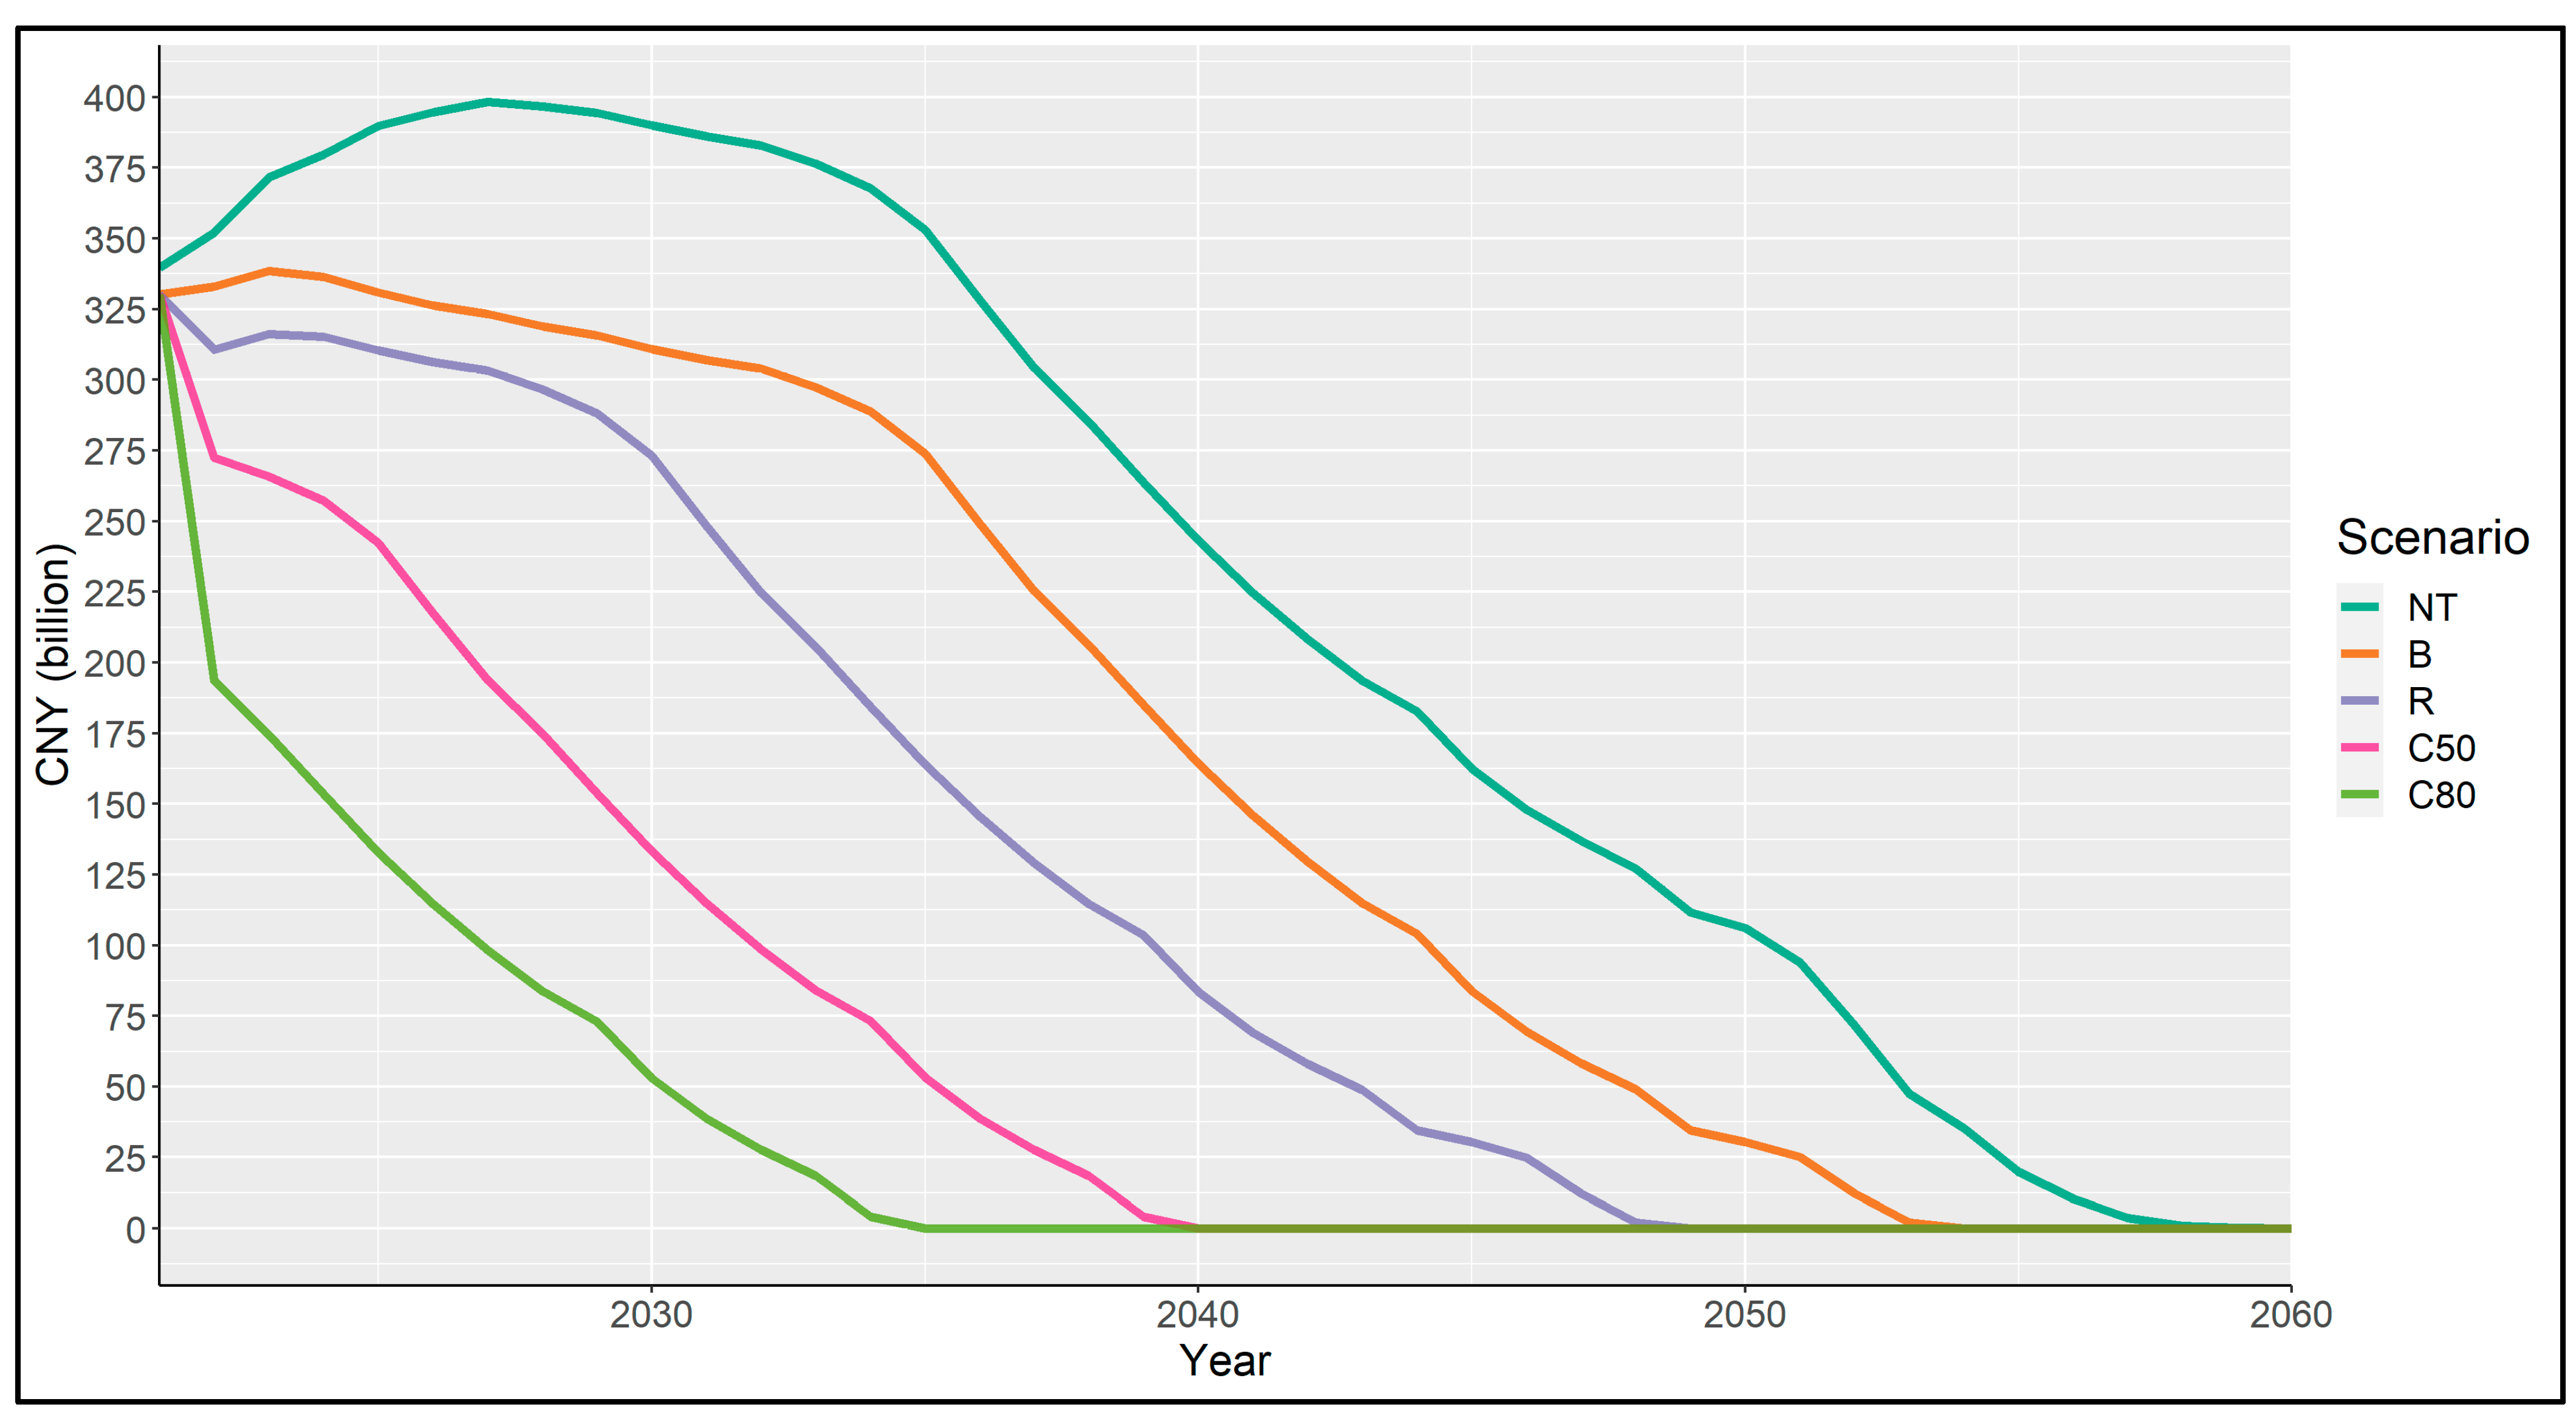
The fiscal picture (Figure 7) is somewhat different for the first three scenarios. In the Baseline and No Transition scenarios, revenues keep increasing as long as coal generation capacity, hence also coal consumption (under the model assumptions), keeps increasing. Revenues peak in 2023 (CNY 339 billion) and 2027 (CNY 399 billion) under the B and NT scenarios, respectively. Total tax revenues remain relatively stable up to 2030 under the R scenario, falling by just 17% through the 2020s. They decline rapidly thereafter, following a similar trajectory as the baseline but, five years earlier, declining to zero in the late 2040s. In the C50 and C80 scenarios, the trajectory is also similar after a sharp initial drop in revenues, with subsequent rates of decline tracking the baseline, but starting 10–11 years and 15–16 years sooner, respectively. These patterns again reflect that the tax base for coal is much more capital-intensive than labour-intensive, since initial job losses do not offset increasing tax revenues from new plants, and, in each scenario, sharp declines in tax revenues coincide with increasing rates of capacity retirement.
Overall, scenario analysis suggests that the additional job losses associated with a pre-2050 coal phase-out target are relatively minor, even without counting job creation in the renewables sector. Job losses are much faster in the C50 and C80 scenarios but still slower in absolute terms than China has seen over the past decade. The timing, rather than the rate, of tax revenue decline is most affected by more ambitious phase-out scenarios.

4.2. Province-Level Results

The impact of coal phase-out is very different across provinces, due to differential exposure to the coal industry. When ‘internal’ coal jobs in each province (jobs at coal plants, and jobs at coal mines in the same province that supply these plants), and ‘external’ ones (jobs at coal mines in other provinces supported by demand from coal plants) are overlaid on the production-consumption network in Figure 2, the results follow a markedly different pattern, due to the differences in labour intensity between coal mines in different provinces (Table 3; see Appendix C for full results for other scenarios) and how these interact with changing coal demand over space and time. Under the baseline scenario, 31% of coal industry jobs (853,000) are lost by 2030, at a similar rate to the IEA’s global predictions and consistent with its finding of a slightly higher rate of job loss in China than elsewhere. Perhaps most notably, the provinces at the root of the largest absolute jobs losses in the medium term (2021–2030) are not the large mining provinces, but those with large coal fleets that are declining in size, and moderate-to-large coal mining industries with high, but declining, labour intensity. In combination, plant closures and inefficient local mining means the number of total jobs lost for each GW of capacity closed is more than twice as high in Jiangsu (where 13.5 GW are retired from 2021–2030) as Hebei (11.5 GW).
Similarly, coal plants in Inner Mongolia, despite accounting for over 10% of China’s thermal coal demand in 2021, initially support only 3.7% of total coal jobs because the coal mines supplying most of these plants are also in (highly labour-efficient) Inner Mongolia. Similarly, plants in Shandong account for 8% of coal demand, but support 18% of coal jobs nationally because of the higher average labour intensity of the mines supplying them—some of which are in Shandong, with most of the rest sourced from Inner Mongolia, Shaanxi, and Shanxi. By 2050, differences in labour intensity have converged significantly and interprovincial trade in coal has largely disappeared, such that most remaining coal mining jobs are supported by demand from plants in the same province, with Shandong remaining the only notable exception.
For provinces that are already very labour-efficient, productivity improvements have less absolute impact over time relative to total provincial mining jobs, while, for provinces with high labour intensity, annual job losses are much greater, reflecting the active consolidation, closure of small mines and rollout of automated mining infrastructure that are a feature of current government policy. In Shanxi province, for instance, the Yangquan Coal Industry Group is using 5G technology to monitor and run mining operations remotely at its Xinyuan mine. Having employed 3000 workers in 2012, the mine expects to provide under 1000 jobs by 2025 [55]. This means that more jobs are lost to efficiency than to planned or policy-accelerated plant closures and the ensuing effects on coal demand, at least in the short term, under current policies.
The following section explores in more detail the employment and fiscal implications of coal phase-out for a major net coal-producing province (Inner Mongolia) and a net coal-consumer (Jing-Jin-Ji region), comparing the two and reflecting on the dynamics these and provinces with similar net-producer and net-consumer characteristics are likely to see if China’s coal demand falls as projected.

4.2.1. Inner Mongolia

Inner Mongolia is the largest coal-producing province in China, at over 900 million tonnes annually, 37% of national production and nearly twice that of the next-largest producers, Shanxi (20%) and Shaanxi (19%). As one of China’s most suitable locations for wind farm development [78], the province also hosts substantially more wind generation capacity than any other, at 11.4 GW, with a further 3.3 GW currently planned, although these are still dwarfed by its 103 GW of thermal coal generation capacity (as of 2021). Inner Mongolia has historically seen high curtailment rates for wind energy. These have since declined, from an average of 15% in 2016 to 10% in 2018 [79], supported by greater long-distance transmission capacity to serve markets in Eastern provinces. Investment in additional transmission capacity appears to have grown since the onset of COVID-19, and is believed to have been supporting the transmission of locally generated coal-fired electricity to demand centres in the East for at least 7.9 GW of capacity commissioned in the first half of the year [80].
Inner Mongolia is also fast becoming China’s largest consumer of coal. As of 2021, the province hosts 103 GW of capacity, nearly 9% of China’s total and just shy of Shandong’s 110 GW. Based on plants currently under construction, Inner Mongolia will overtake Shandong in 2023 to become host to China’s largest provincial fleet, reaching peak capacity at 120 GW in 2024. This is more than the total combined fleets of Germany and Japan, and roughly half the size of the entire fleets of the U.S. and India. Its dependence on coal mining and other minerals, the use of coal for domestic heating, and the provincial government’s support for coal (extending to enterprises under government control), support the continued expansion of the coal industry despite national policy.
In terms of employment, Inner Mongolia is, however, relatively well positioned to transition away from a coal-based economy, with appropriate planning. Its mining workforce is the most efficient in China, at 1.7 jobs per additional 10,000 tonnes produced (the second-least labour intensive are Shaanxi, at 3.3, and Xinjiang, at 3.5). Thus, despite massive coal mining and combustion operations, coal plants located in Inner Mongolia are estimated to support just 102,000 jobs, of which only 27,000 are in the mining industry.
However, since Inner Mongolia exports over two-thirds of its coal and meets almost 40% of total interprovincial demand, the jobs associated with meeting demand from other provinces are several times those associated with supplying just its own plants. Over 440,000 additional coal mining jobs and 39,000 coal transport jobs are associated with coal supplied by Inner Mongolia to other provinces. Once accounting for exported coal, therefore, over 500,000 jobs in Inner Mongolia depend on demand for thermal coal.
On the fiscal front, Inner Mongolia’s coal industry contributes CNY 33.7 billion to central government revenues (about 15% of national revenues from coal), peaking at CNY 35.9 billion in 2024 before falling sharply after 2030 to under CNY 15 billion by 2041. Contribution to subnational tax revenues (in Inner Mongolia and the provinces it exports to) start at a higher level, peaking at CNY 44 billion in 2023 and falling below CNY 15 billion by 2043. Of these subnational tax revenues, over 40% are resource taxes and nearly 20% are VAT payments. This is as expected: the relatively low labour intensity of coal production, low environmental pollution taxes, and the fact that most of Inner Mongolia’s coal is exported, means that tax revenues associated with the local coal industry are closely tied to the production and sale of coal.
Estimates of subsidies directed by the provincial government to Inner Mongolia’s coal industry in the past add some context to these estimates, suggesting that the apparent net fiscal boon from coal industry operations is not as great as it first appears. While subsidies vary from year to year depending on funding priorities and are difficult to measure with any accuracy or certainty, historically, Inner Mongolia is estimated to have granted at least CNY 720 million in temporary tax relief for coal price adjustments and coal rail transport. In 2013, the cost to Inner Mongolia’s provincial government of providing coal users with rail transportation below market rate was estimated at CNY 7.2 billion [73].

4.2.2. Jing-Jin-Ji

‘Jing-Jin-Ji’ is shorthand for the combined Beijing, Hebei and Tianjin area, a heavily urbanised region with a population of over 112 million. In Beijing’s case, the municipality contains no coal mines, and recently closed its last coal-fired power plant. It imports large volumes of electricity, a majority of which is necessarily from coal plants given China’s electricity mix but does not directly contribute to employment or tax revenue in the coal sector. Tianjin does not produce any coal but hosts 15 GW of coal-fired power plant capacity, while Hebei hosts 58 GW of generating capacity. The combined total of about 72 GW represents 6% of China’s total operating capacity in 2021. Hebei produces about 0.1% of China’s thermal coal (3 million tonnes annually). No new coal capacity is planned, and current capacity will decline as existing plants are progressively closed.
The wealth and population density of Jing-Jin-Ji relative to other provinces, and its status as political capital, have direct implications for the political economy of coal phase-out. With the effects of local air pollution affecting a very large populace, pressure to address air quality issues that have plagued the area for decades has led to the relocation of coal power serving Jing-Jin-Ji away from city areas, and the imposition of the highest environmental pollution tax rates in China. At the same time, government policy promotes the maintenance of stable, affordable electricity prices to help sustain continued high growth rates. Achieving these goals simultaneously requires importing electricity from sources cheap and flexible enough to offset transmission infrastructure costs and ensure uninterrupted power supplies, a role still played predominantly by coal.
Neither electricity prices (both benchmark and spot prices) nor coal prices in Jing-Jin-Ji are particularly high or low, hovering near the national median. This implies greater tax revenue per unit of coal mined or consumed in Jing-Jin-Ji than Inner Mongolia (through greater unit VAT and resource tax revenues, both generated ad valorem). Beijing, Hebei, and Tianjin all impose maximum plant-level environmental pollution taxes (CNY 12/kg for air pollutants, and CNY 14/m3 for wastewater), the only provinces currently doing so (see Appendix D, Figure A1). In Tianjin, these charges are relatively immaterial given the lack of a coal mining industry and relatively small amount of coal-fired generation. In Beijing, they are non-existent. (It should be noted that 65% of Beijing’s electricity demand and 40% of Tianjin’s is met through imported electricity, the bulk of which is generated in coal-fired units in Inner Mongolia, Shanxi, Shaanxi, and Hebei and exported via long-distance transmission lines [81]).
Hebei’s significant coal plant and mining industry, however, faces higher charges per tonne of coal extracted or burned than other provinces. In combination, the Jing-Jin-Ji provinces collect CNY 1 billion in environmental taxes on coal plants annually (compared to CNY 0.43 billion in Inner Mongolia, which has nearly twice the generation capacity, albeit with fewer operating hours). Further, the estimated average labour intensity of coal mining in Hebei is 16.7 jobs per additional 10,000 tonnes extracted, more than five times that of Inner Mongolia (2.8). Consequently, despite having half as much coal power plant capacity, Hebei’s coal plants support nearly 70% more local coal mining jobs (45,000) as Inner Mongolian plants do (27,000).

4.2.3. Province-Level Comparison

In terms of employment, the national coal industry supports ten times as many mining jobs in Inner Mongolia as Jing-Jin-Ji, and the gap will remain significant for the next two decades. Because of Inner Mongolia’s superior labour efficiency and much larger scale, the absolute numbers converge sharply by 2040, not least because some coal mine employment in Inner Mongolia depends on demand from Jing-Jin-Ji, and Jing-Jin-Ji’s coal demand supports Inner Mongolia jobs. The gap narrows to under 10,000 jobs by 2050. Plant jobs decline steadily in Jing-Jin-Ji as its remaining plants retire on a smooth trajectory to 2050. In Inner Mongolia, employment in plants is stable until the mid-2030s, before declining sharply to 2040 as plants built in the 2010s start to retire and reaching zero in the mid-2050s.
Where the focus for Inner Mongolia is on coal production, continued industrial development, growth in electricity generation and upgrading its position on the electricity value chain, Jing-Jin-Ji is more likely to be concerned with securing reliable, affordable power to facilitate further economic development. These contrasting potential motivations, which mirror the relationship between net coal producers and consumers across China, are not incompatible—in fact, the provinces’ respective interests are well-aligned, such that an expansion of coal power in Inner Mongolia benefits both, particularly in the context of power shortages induced by a shortage of coal supplies in late 2020 [82] and autumn 2021 [83].

4.3. Firm-Level Results

Company identifiers in the source datasets allow the composition and trajectory of jobs and tax revenues supported by plants operated by individual companies to be traced. This analysis does so at the parent level, since China’s power generation firms typically control many subsidiaries that ultimately share a beneficial owner—often the government. Since plants can also be owned in different shares by multiple companies, the number of jobs associated with each company is scaled by the proportion of equity ownership it has in a given plant.
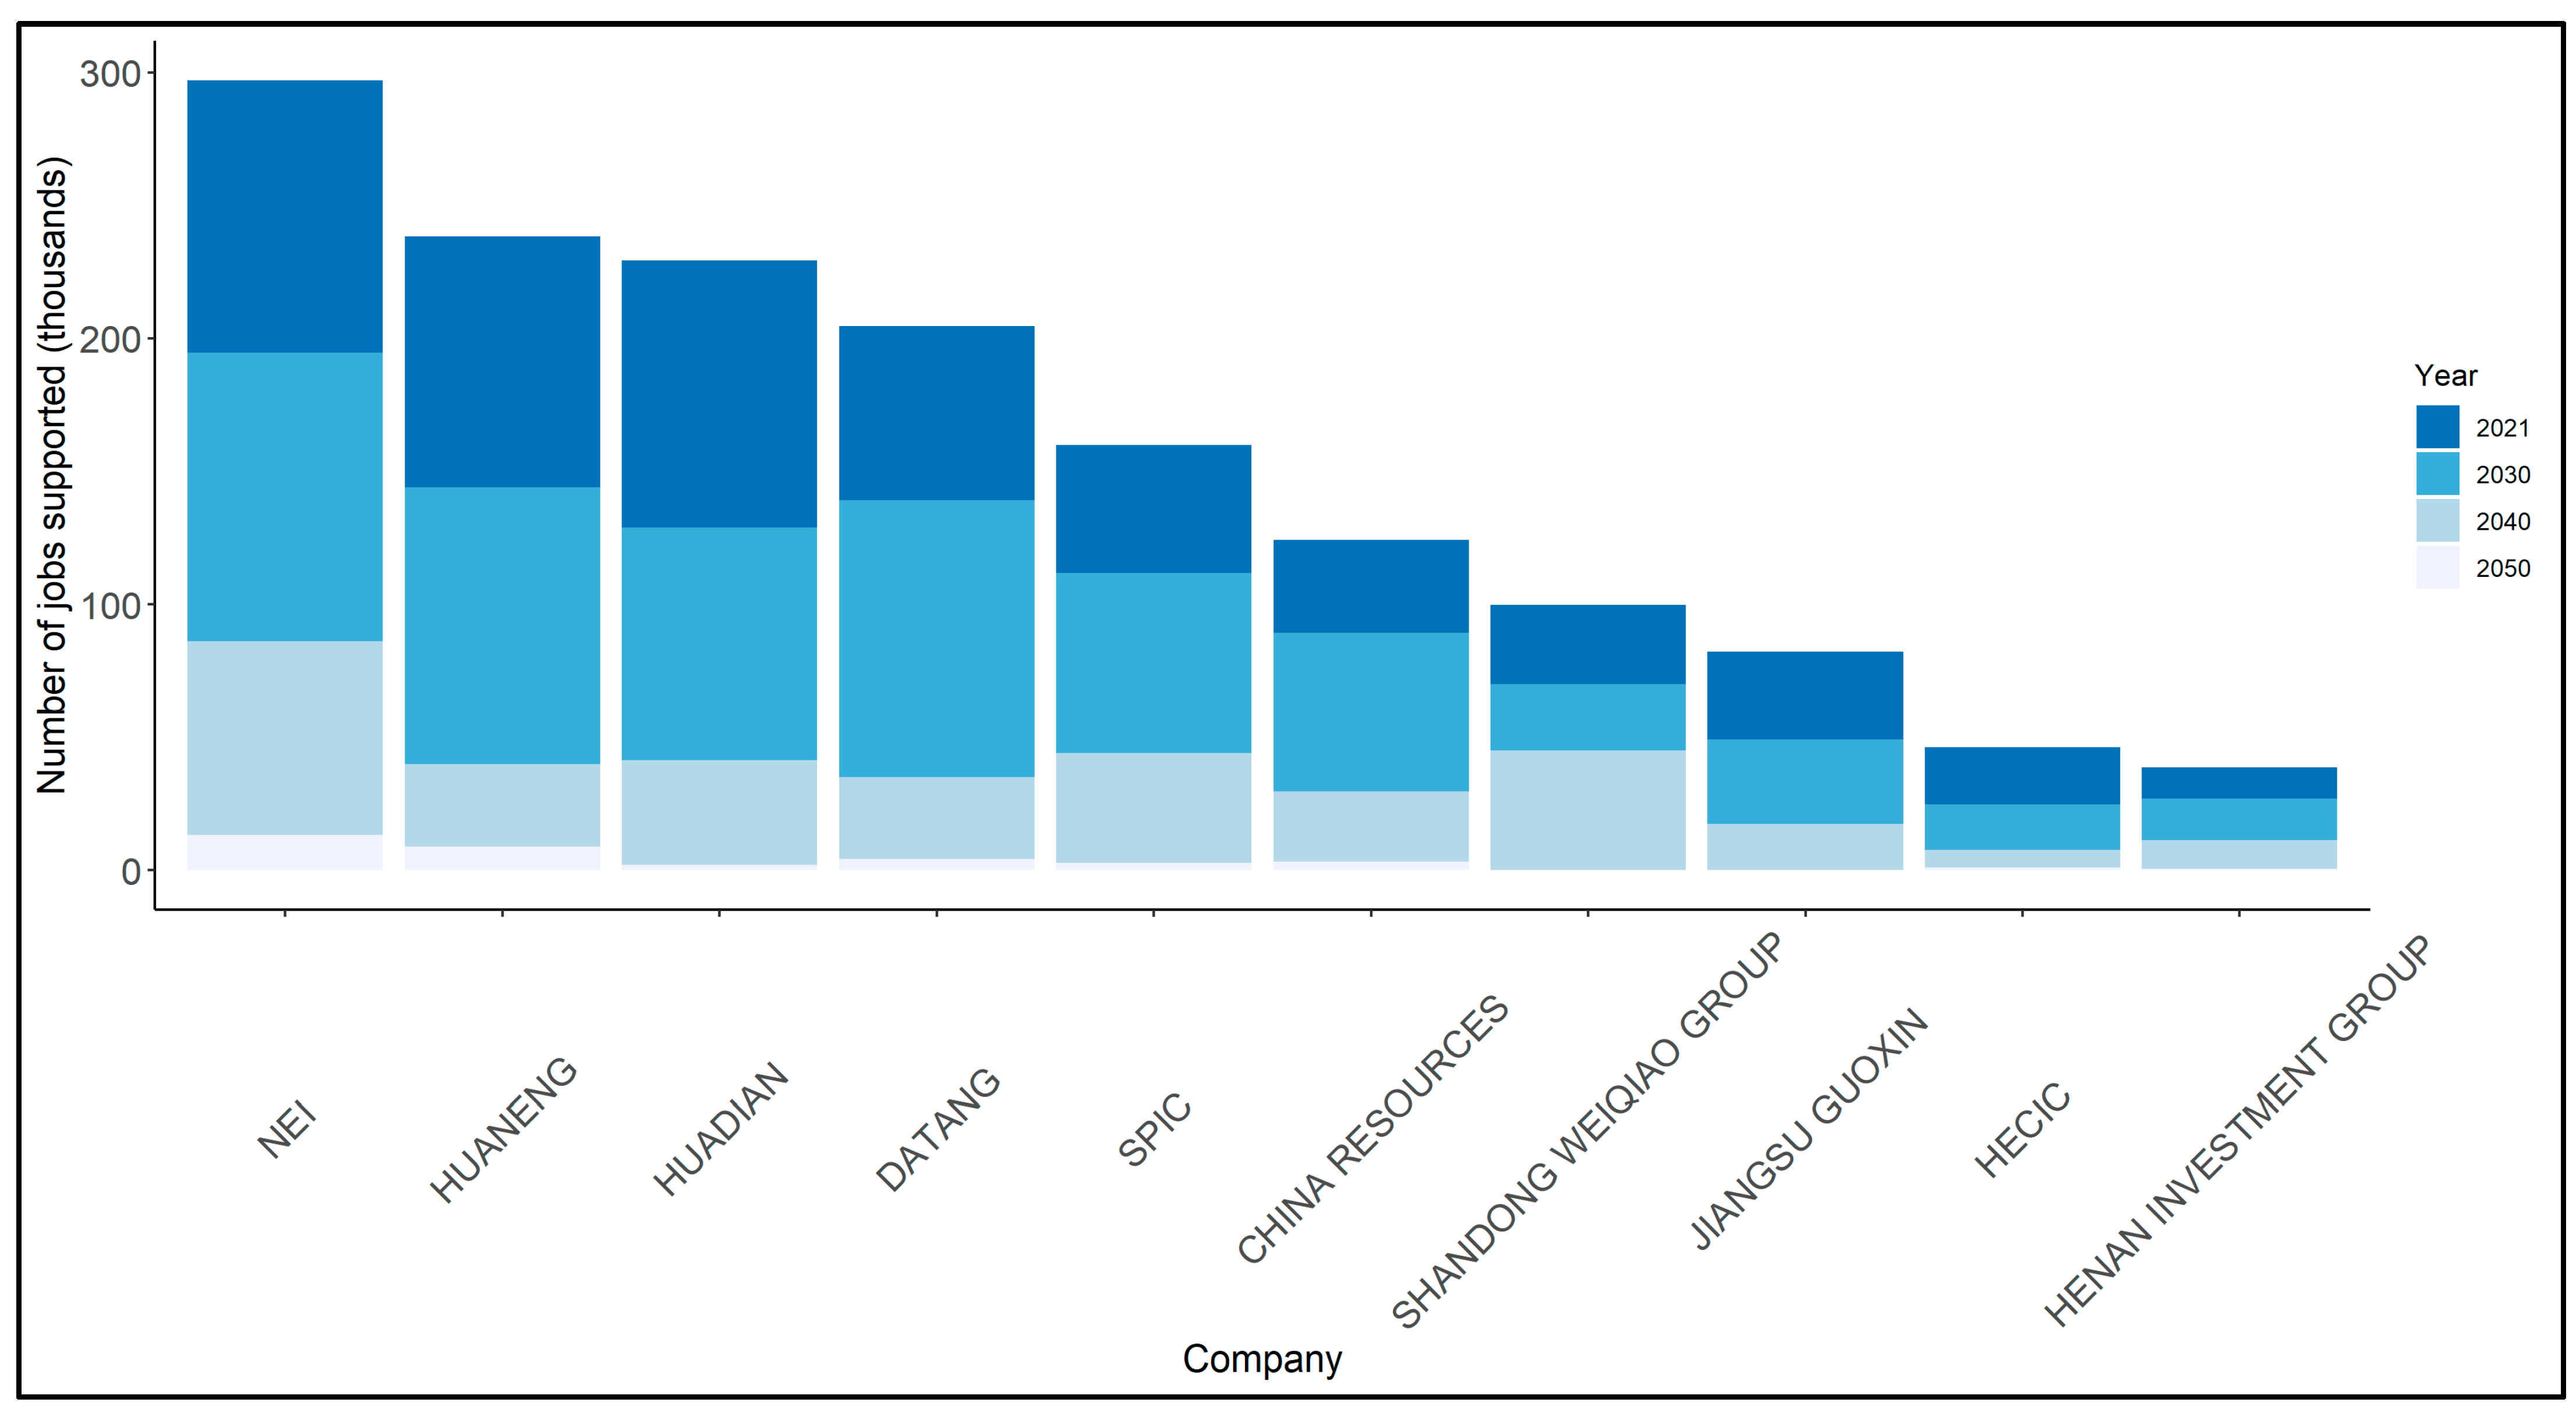
Under the B scenario, the five largest sources of employment in coal power generation and the mines supplying them in 2021 are the ‘Big Five’ power generation companies. In descending order of coal-fired generation capacity, these are National Energy Investment Group (NEI; formerly Shenhua and also known as CHN Energy), Huaneng, Datang, Huadian, and State Power Investment Corporation (SPIC). Each of these firms also controls a considerable amount of coal production (see Table 4). NEI, created from a merger between two large generating and mining firms, is by far the largest annual producer, at 183 million tonnes.
Between them, the ‘Big Five’ support 43% of the jobs in China’s thermal coal industry; the top 10 support 56%. The largest single source of employment, at 297,000, is NEI (see Figure 8). The coal activities of Huaneng and Huadian support 238,400 and 229,400 jobs each, respectively, while Datang supports 204,700. SPIC supports 160,000. Beyond the ‘Big Five’, plants owned by China Resources (a state-owned integrated mining company) are the next largest source of employment, supporting 135,000 jobs. Among the remaining top ten firms, Shandong Weiqiao (a private sector aluminium producer), and Jiangsu Guoxin (a diversified state-owned investment company) support over 80,000 workers apiece. Looking only at these ten largest firms, it is possible to deduce that close to half of all coal jobs in China, and likely much more across all firms, are directly supported by coal plants in which state-owned enterprises have controlling or minority interests.
Mirroring the trajectory of job losses nationally, in the B scenario, 28% of the jobs currently supported by each of the Big 5 are lost by 2030, and another 50% are lost by 2040. By the 2040s, employment supported by the ten largest firms has declined by 77% in aggregate, ranging from 71–84% for individual companies. The exception is Shandong Weiqiao, where job losses are slower because of Shandong’s high mining labour intensity and significant local coal resources, meaning it imports relatively less from more efficient provinces than other firms.
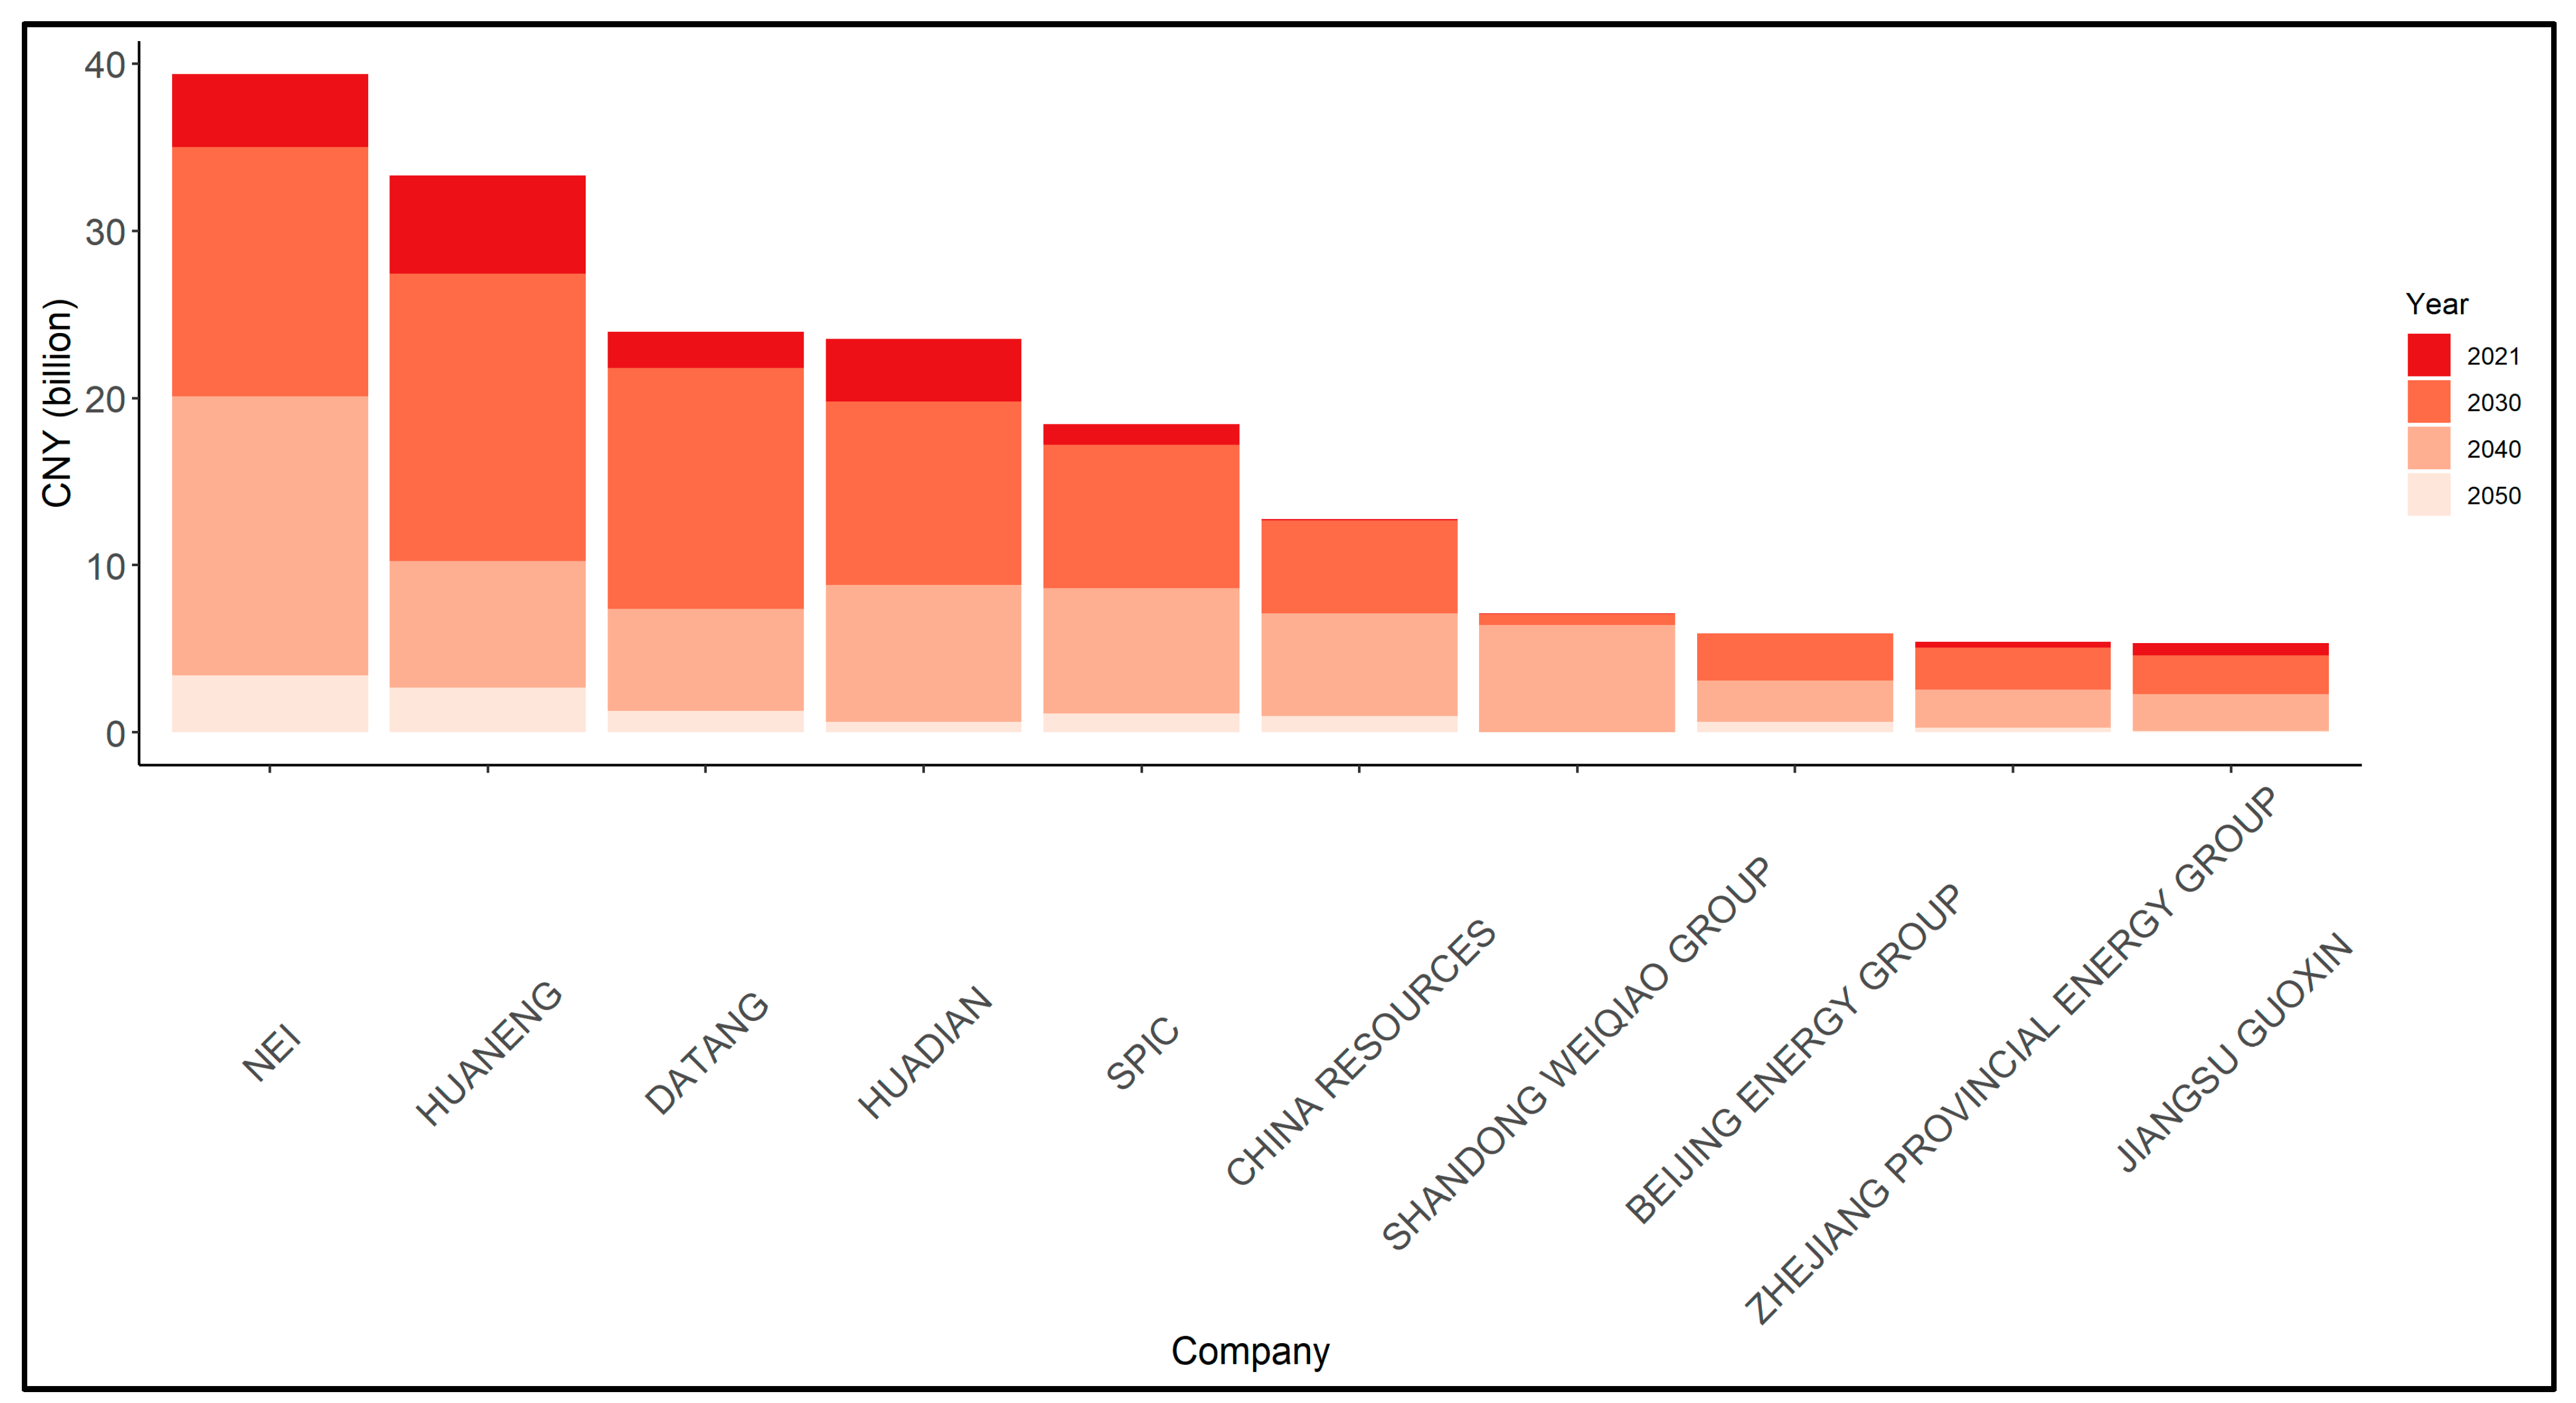
Unsurprisingly, the Big Five are also the largest contributors (directly and indirectly) to tax revenues nationally (see Figure 9), with the activities of the two largest, NEI and Huaneng, generating CNY 39.4 billion and CNY 33.3 billion in revenue respectively, and the ‘Big Five’ together, almost CNY 140 billion. The largest ten firms contribute almost CNY 175 billion between them, representing more than half of total tax revenues from thermal coal. Mirroring the national trajectory, total tax contributions from the ‘Big Five’ decline relatively slowly at first, falling just 13% to CNY 121.2 billion in 2030, then start to fall much more rapidly after 2034, falling by 60% from their 2021 levels to just CNY 55.2 billion by 2040. The tax contribution of each top ten firm falls by 43–69% by 2040, with the exception of China Resources. By 2050, revenues from the ‘Big Five’ are CNY 9.2 billion (6.6% of their starting value), and those from the top ten firms, CNY 11.1 billion (6.3%).

5. Discussion

Most job losses in China’s coal power sector in any scenario are associated with mining, which represents over four times the employment in thermal coal plants and nearly three times that in thermal coal transport. The magnitude of expected employment decline by 2050 in coal mines is significant but is driven more by declining labour intensity than climate policy stringency.
The experiences of the E.U. and U.S., as the preeminent economies experiencing a long-term decline in the coal industry, are instructive for China. However, the scale of China’s coal industry and its central role in driving economic growth and development, as well as the dominance of SOEs in the sector, imbue China’s coal transition with unique political economy challenges. Existing policies have focused largely on worker relocation, an option that is more relevant for large, diversified SOEs, but does little to support workers in smaller, local mines that have fallen victim to consolidation policies. This approach is likely not viable in the longer term, since relocation will not be an option as plant retirements accelerate, and a much greater focus on retraining (where relevant) and redeployment of existing skills in clean power and industrial technologies is essential.
Managing job losses on an aggregate basis may be within reach of China’s existing transition planning apparatus, given that the total expected job losses by 2030, even in the most extreme climate policy scenario, are fewer than those experienced from 2014–20, along with prospects for growth in clean technology value chains. However, at a local level, new ‘green’ job creation may not occur in the same place and at the same time as coal industry decline, making strategic planning at a provincial scale necessary to avoid the long-term consequences of rapid deindustrialisation observed in coal transitions outside China. State-owned and private enterprises across the country have developed, at speed and scale, remarkable capabilities in the manufacture and development of complex low-carbon products (notably solar panels, electric vehicles, and third generation nuclear reactors) that have propelled China to a global leadership position in the production of each. In anticipation of the inevitable decline in coal sector employment, China’s national and subnational governments, as well as its SOEs in energy and industry, may do well to focus on identifying means for further scaling up these industries that can make use of the human capital at their disposal—including by making use of skills and expertise developed in the coal industry—and be supported by appropriate incentives for capital reallocation, including financial market design and regulation. Developing a package of mutually supportive measures for efficient labour redeployment is an important topic for further research.
The replacement of fiscal revenues tied to coal presents different challenges. In the B scenario, two-thirds of total tax revenues linked to coal power flow to the central government and remain relatively stable until the mid-2030s. For large coal producers, particularly Inner Mongolia, subnational governments receive over 50% of total tax revenues from coal. Since subnational governments and SOEs have relative fiscal independence and can generally issue their own debt, they represent a contingent liability for the central government that is realised whenever they are unable to meet financial obligations, for instance, if they borrow excessively to finance coal expansion that subsequently finds itself in insufficient demand, either as a result of government policy, sector reforms, competition from renewables, or all three. The risk of default and size of potential public sector liabilities is greater for more ambitious phase-out scenarios.
Managing these potential fiscal risks is a task falling to the central government and its agencies across multiple ministries. The National Energy Administration’s rolein approving coal power, for example, is already under review following a highly critical public evaluation by the influential Central Environment Inspection Team (CEIT) and will be an important instrument in preventing further investment in coal assets that may present fiscal risks to provinces either subsidising them or investing through locally owned SOEs. Similarly important is the China Banking and Insurance Regulatory Commission (CBIRC) in crafting regulation designed to prevent provinces with an interest in growing coal from doing so where the financial (and, by implication, fiscal risks) are significant.
The national ETS—effectively an emissions standard in which the penalty for an asset not meeting the standard is for it to be included in the scheme—is unlikely to deliver significant revenues in the near term if current prices, allocations, and trading volumes persist [84]. This is not least because the trajectory for free permit allocation, versus auctioning, is not yet clear, and the exclusion of plants meeting a given emissions standard is equivalent to free permit allocations to coal power emissions. Even if provinces are allowed to retain a share of revenues from local permit trading, the incentive to keep prices low to avoid accelerating the decline of coal industries, particularly those run by SOEs, is strong.
The approximate magnitude of non-externality subsidies to the coal industry is uncertain, but likely to be significantly higher than tax revenues from it. This suggests that the net effect of coal phase-out may be revenue-neutral or positive, and further that the role of central government in managing the fiscal implications of coal-phase out in itself is likely to be largely redistributive, rather than requiring additional borrowing or monetary stimulus measures. Central fiscal support to provinces to aid their transition—funded partly through savings from reduced subsidy payments—may be essential to weakening the destructive incentives for coal expansion in mining regions, such as Inner Mongolia, that also have plentiful renewable resources able to compete on price with coal. In the longer term, ways of taxing clean technologies will be needed to replace the resource taxes and VAT receipts (tied to coal sales) that represent a significant proportion of subnational revenue. In locations where coal is unlikely to be replaced directly with renewable, investments in building up other clean industries by development finance actors including policy banks and—to an extent—state-owned commercial banks, is likely to be required. Longer-term measures are likely to require either raising revenues from clean energy without unnecessarily slowing its development, greater borrowing on the expectation of higher future growth, or reducing public spending. The latter may be unviable, not least due to the need to meet contingent liabilities in the coal industry (e.g., outstanding bonds and loans) to which government is exposed through ownership of state-owned enterprises (SOEs), pressure to meet annual GDP growth targets, clean-up costs for former mining sites, long-term health, environmental and climate costs, and the cost of relocating and retraining labour supplies.
The extent to which additional investment is needed in reorienting labour resources to clean industries is a more complicated question, and one requiring more data, to be addressed in future research. Large net fiscal outlays are likely to be necessary for China to accelerate the pace of decarbonisation, given the need for research and development spending, and infrastructure investment, in key technologies, notably hydrogen, nuclear, direct air capture, storage, and possibly CCS.

6. Conclusions

This analysis has focused on the employment implications of transitioning China’s economy away from coal, as well as the fiscal ramifications for areas dependent on the tax revenues it generates. The results of the simulations constructed here show that the absolute magnitude of the labour transition challenge facing China is not unprecedented in its recent history; however, central and subnational governments will need to carefully manage the localised effects of job losses and find productive alternative uses for unemployed labour.
The majority of tax revenues from coal flow to central government and are unlikely to decline until the 2030s. Coal-producing provinces such as Inner Mongolia are more dependent on subnational tax revenues, both accentuating the need for diversification and making it more politically challenging to achieve. National-level regulation and enforcement will be essential in limiting provincial exposure to fiscal shortfalls caused by coal industry declines, although these are likely to be limited until the 2030s unless China pursues a much more aggressive phase-out strategy than currently envisaged. Almost half of total employment is driven by coal plants owned by five large state-owned enterprises that are integral to several local economies and providers of critical physical and social infrastructure, further accentuating the difficulties of embarking on such significant structural change. China is exceptionally well-positioned to divert coal subsidies and investment to clean technologies and skills, and renewable power, both to meet domestic policy goals, and as the world’s largest exporter of green products.
This initial effort to reconstruct the coal network and associated jobs and tax revenues in China has many limitations and can be extended in multiple directions. These may include the addition of unpriced subsidies, particularly those typically considered to be externalities. It is also possible to overlay other economic, environmental and financial metrics on the underlying network to consider, for example, how the marginal financial position of each plant and its owners are affected; and where and in what quantities pollutant emissions at source are “traded” across China’s power system. As better data becomes available, there is also potential for examination of structural change dynamics in the labour market induced by coal phase-out. This might include examining the risk of regional economic decline when accounting for where opportunities for re-employment in a range of emerging clean industries might arise, with corresponding implications for subnational migration and reskilling needs, both for governments and for large state-owned companies with the capacity to redeploy workers across the country. Similarly, the accuracy of the reconstructed network can be improved by accounting for price dynamics and transport availability between provinces and matching specific mines to specific plants based on multiple criteria, including but not limited to coal prices. Finally, this modelling effort raises pertinent hypotheses about China’s coal transition that merit further multi-method investigation, particularly to explore the political economy dynamics between agents driving, and affected by, the transition.

Author Contributions

Conceptualization, A.C.; methodology, A.C.; validation, W.Z.; formal analysis, A.C.; investigation, A.C. and W.Z.; writing—original draft preparation, A.C.; writing—review and editing, A.C. and W.Z.; visualization, A.C. All authors have read and agreed to the published version of the manuscript.

Funding

The research was initiated with funding from the Foreign, Commonwealth and Development Office (FCDO), Government of the United Kingdom, grant number FP099. The research was continued and refined with funding from the Natural Environment Research Council (NERC) in its capacity as National Member Organization for the United Kingdom to the International Institute for Applied Systems Analysis (IIASA); and the Economics of Energy Innovation and Systems Transition (EEIST) project. EEIST is jointly funded through UK Aid by the UK Government Department for Business, Energy and Industrial Strategy (BEIS), and the Children’s Investment Fund Foundation (CIFF). The contents of this manuscript represent the views of the authors and should not be taken to represent the views of the UK government, CIFF or the organisations to which the authors are affiliated. Weirong Zhang is funded by the National Natural Science Foundation of China, grant number 72173043, under project leader Jiahai Yuan.

Data Availability Statement

The dataset on coal mines can be accessed upon request from Global Energy Monitor (https://globalenergymonitor.org/projects/global-coal-mine-tracker/ (accessed on 11 July 2021)). The dataset on coal plants (accessed on 20 February 2021) combines publicly available data from Global Energy Monitor and the World Resources Institute (https://www.wri.org/research/global-database-power-plants with proprietary data from S&P Global Platts.

Acknowledgments

The author gratefully acknowledges data support from Durand D’Souza and Lily Chau at the Carbon Tracker Initiative, Jiahai Yuan at North China Electric Power University, and Matthew McCarten and Nataliya Tkachenko at the Oxford Sustainable Finance Programme. For valuable comments and suggestions, thanks to David Robinson, Conor Hickey, Ben Caldecott, Xin Li, and three anonymous reviewers. Thank you to Sebastian Poledna at the International Institute for Applied Systems Analysis (IIASA) for his support, encouragement, and feedback throughout the later development of this project, and to the Advancing Systems Analysis group for helpful comments.

Conflicts of Interest

The author declares no conflict of interest.

Appendix A. Province Codes

Table A1. Province codes used in the main text.
ProvinceCode
AnhuiAH
BeijingBJ
ChongqingCQ
FujianFJ
GuangdongGD
GansuGS
GuangxiGX
GuizhouGZ
HenanHA
HubeiHB
HebeiHE
HainanHI
HeilongjiangHL
HunanHN
JilinJL
JiangsuJS
JiangxiJX
LiaoningLN
Inner MongoliaNM
NingxiaNX
QinghaiQH
SichuanSC
ShandongSD
ShanghaiSH
ShaanxiSN
ShanxiSX
TianjinTJ
TibetXZ
XinjiangXJ
YunnanTN
ZhejiangZJ

Appendix B. Scenarios

This study examines the impact of coal phase-out under five scenarios. The first is a ‘no transition’ scenario (NT) assuming that the coal sector continues to develop with no constraints over and above those already in place; namely, that all plants that are either planned or under construction are built and operated as expected, while the remainder of the fleet is phased out according to its age.
The remaining four scenarios, which play out from 2021–2060, are designed to be roughly equivalent to the four scenarios developed in He, et al. [85] that describe the trajectory of coal power generation up to 2030. The standard operating lifetime of the coal plants is manipulated.
Under the ‘baseline’ scenario (B), which reflects current policies, coal power plants operate for 30 years, and no further plants are built other than those already approved. This implies that coal use in electricity generation will not quite be fully phased out by 2050. In the baseline and the ‘no transition’ scenario, currently operating plants more than 30 years old are assumed to cease operating after 35 years, plants more than 35 years old, after 40 years, and all plants more than 40 years old are assumed to retire the following year.
This implies that 108 GW of coal power (approximately 10% of the currently operating fleet) remains online in 2050, concentrated in Inner Mongolia, Shanxi, Shandong, Xinjiang, and Shaanxi. Coal is phased out entirely in the power sector by 2054. While the implications for carbon budgets are not addressed here, previous studies [86,87] suggest that committed emissions from energy infrastructure built well before 2020 significantly exceed the global carbon budgets for both 1.5 °C and 2 °C and that compliance with these budgets will require a faster phase-out than projected here. Given China’s major contribution to power sector emissions globally, the baseline scenario is unlikely to be compatible with either of the Paris Agreement targets without significant deployment of negative emissions technologies in the form of CCS (including variants such as co-firing coal with biomass) and direct air capture.
The baseline therefore represents a trajectory for China’s coal power sector that reflects existing policies (including the 2060 carbon neutrality announcement) but is not necessarily in line with China’s international commitments under the Paris Agreement, or with the best available science. Meeting these targets would require that CCS deployment be rapidly accelerated, and that coal with CCS remain competitive in the long term against available alternatives. Both appear unlikely at present.
Allowing plants to operate for this long reduces the financial risk of stranded or otherwise non-performing assets accumulating on coal and utility company balance sheets—although this does not eliminate them, since the economics of China’s coal plants and decreasing utilization hours for coal suggest as much as half the current fleet is suffering operating financial losses [10].
The baseline is, however, consistent with China decarbonisation pathway modelling in [7], in which the unabated coal generation fleet stands at 123 GW (+68 GW CCS) in 2050 under a 2 °C scenario, and 32 GW (+149 GW CCS) under a more ambitious 1.5 °C scenario, partially reflecting the use of CCS as a means of justifying carbon budget overshoot before 2050. In the model in this study, 472 TWh of coal-fired electricity is generated in 2050 under the baseline scenario, similar to the 450 TWh (unabated; 850 TWh including CCS) in [7] for a 2 °C scenario, and much higher than the 110 TWh (unabated; 900 TWh including CCS) in the 1.5 °C scenario, in which net zero emissions are achieved in the power sector between 2045 and 2050.
CCS does feature in the 1.5 °C and 2 °C scenarios, however, since its scalability and competitiveness are not yet established, particularly when considering price trends in clean technologies, it is not considered as an option in the model. The potential for CCS to sustain existing coal sector jobs and create new ones will merit further study as its feasibility becomes clearer.
China may opt to phase out its coal plants more rapidly than in the baseline scenario, either as a matter of top-down policy (particularly if responding to new information on the climate system), or proliferation of cheaper, cleaner alternatives in the market, or both. Three alternative scenarios are modelled in which coal plants are closed more quickly than expected (i.e., an accelerated decline in capacity), assuming no additional CCS capacity. An alternative route to a similar outcome is to keep plants open as originally planned, but with much fewer generating hours. This may help to preserve jobs at the plants for longer, but with severe financial consequences for plant owners that are, in many cases, already absorbing operating losses. We assume that the closure of plants, rather than running increasing portions of the fleet at increasingly large losses, is the preferred strategy in designing these scenarios. In the first alternative scenario, ‘R’, the trajectory of accelerated plant closures is calibrated to correspond to match the share of coal capacity closures between 2020 and 2030 in the three scenarios presented in He, Lin, Sifuentes, Liu, Abhyankar and Phadke [85], a power system model that optimises for cost given a set of energy technology prices and carbon constraints. In the ‘R’ scenario, a more rapid phase-out reflects the impact of lower-than-expected renewables costs on capacity additions. In the more aggressive ‘C50’ and ‘C80’ scenarios, lower-than-expected renewables costs are combined with exogenously-imposed emissions constraints for the power sector of 50% and 80% below 2015 levels by 2030, respectively. These latter two scenarios are reflective of different levels of carbon constraints placed on the power sector as a proxy for the aggressiveness of national decarbonisation policy.
To implement the scenarios, the only variable that is changed is the operating lifetime of each coal plant, which is calibrated to reflect the approximate capacity remaining by 2030 in the scenarios constructed in [85], multiplied by a factor of 1.42 to account for the ratio between expected 2020 installed capacity in the source paper (832 GW) and actual operating capacity in 2020 (1180 GW) for scenarios B and R. The higher installed capacity in these scenarios is largely offset by lower operating hours, such that coal power generation is similar under the B scenario, and slightly higher under the R scenario. In the C50 and C80 scenarios, no multiplier is used since they are based on emissions reductions from a 2015 (not 2020) baseline. The scenarios, and how they are implemented into the model in this paper, are summarised in Table A2.
Table A2. Overview of coal phase-out scenarios employed.
ScenarioDescriptionPlant Operating Lifetime (Years)Capacity in 2030 (GW)Generation in 2030 (TWh)
He et al. (2020)ModelHe et al. (2020)Model
NTNo transition: all plants planned or under construction are built and operated as intended30 if plant age < 30;
35 if plant age > 30;
40 if plant age > 35;
Age + 1 if plant age > 40
N/A1398N/A6069
BBaseline; reflects existing policy of carbon neutrality by 2060Same as NT751 × 1.42 = 1057111449154827
RLow-cost renewables; reflects greater than expected declines in renewables costs25707 × 1.42 = 100398436764270
C5050% decline in emissions from coal power by 2030 relative to 201520;
cancellation of plants under construction
49848623712125
C8080% decline in emissions from coal power by 2030 relative to 201515;
cancellation of all plants under construction
196195957867

Appendix C. Employment Trajectories for All Provinces, in All Scenarios

Table A3. Trends in coal industry employment supported by each province, 2021–2060 and change to 2030 (NT scenario).
Province in Which Coal Plants Are LocatedCoal Industry Jobs Supported by Those Plants (Thousands, 2021)203020402050Change in Jobs Supported 2021–2030% Change in Jobs Supported 2021–2030
Jiangsu454,814309,291105,48423,119145,523−32.0%
Shandong498,112369,899155,86239,018128,213−25.7%
Hebei197,592112,94137,300323084,651−42.8%
Liaoning174,692101,76935,186855972,923−41.7%
Henan261,630193,99270,76318,09067,638−25.9%
Heilongjiang136,28876,31322,747493659,975−44.0%
Shanxi111,17994,53341,47813,29816,645−15.0%
Sichuan37,55629,78412,26869037772−20.7%
Ningxia39,85533,59415,49229526262−15.7%
Yunnan20,29814,518325114565780−28.5%
Zhejiang36,56431,33210,64616905232−14.3%
Shanghai704940944104262956−41.9%
Tianjin11,9649788381214262176−18.2%
Hainan482435371588-1286−26.7%
Guangdong56,10955,11434,16412,473995−1.8%
Chongqing15,60215,20811,0293775394−2.5%
Jilin49,34649,22827,64214,336118−0.2%
Tibet125125125-−00.1%
Anhui131,335131,34761,09423,470−130.0%
Hubei32,70333,77522,47110,690−10723.3%
Qinghai7037814548291769−110815.7%
Fujian21,64124,28713,9846851−264612.2%
Guangxi29,43235,31324,69710,223−588120.0%
Shaanxi47,03957,88736,13718,439−10,84923.1%
Hunan41,32955,03333,91325,576−13,70333.2%
Jiangxi38,18654,67141,60132,527−16,48543.2%
Gansu58,41277,10140,96321,561−18,68932.0%
Inner Mongolia104,358125,76970,23138,657−21,41020.5%
Xinjiang88,704113,47187,00124,037−24,76727.9%
Guizhou98,991127,16476,06634,038−28,17328.5%
Total2,812,7642,349,0211,102,235403,526463,743−16.5%
Table A4. Trends in coal industry employment supported by each province, 2021–2060 and change to 2030 (R scenario).
Province in Which Coal Plants Are LocatedCoal Industry Jobs Supported by Those Plants (Thousands, 2021)203020402050Change in Employment 2021–2030% Employment Loss 2021–2030
Jiangsu451,727204,38930,884-247,338−54.8%
Shandong491,171278,88155,747-212,290−43.2%
Henan256,720140,25119,213-116,469−45.4%
Hebei197,48288,82418,825-108,658−55.0%
Liaoning172,18380,0299253-92,153−53.5%
Heilongjiang122,47957,4178011-65,062−53.1%
Anhui126,76176,00012,768-50,762−40.0%
Shanxi109,16968,75317,948-40,416−37.0%
Guizhou95,57269,37615,441-26,196−27.4%
Gansu49,63431,0436091-18,591−37.5%
Sichuan37,59321,3733883-16,221−43.1%
Jilin46,98931,5722691-15,417−32.8%
Guangdong54,47241,2869748-13,186−24.2%
Inner Mongolia102,06388,97927,705-13,084−12.8%
Zhejiang35,96924,3361344-11,633−32.3%
Ningxia39,82628,74610,353-11,080−27.8%
Yunnan20,3109339--10,970−54.0%
Hunan39,82429,5546581-10,270−25.8%
Xinjiang86,78776,99523,726-9792−11.3%
Hubei32,07124,2108883-7861−24.5%
Shaanxi44,82337,65814,121-7166−16.0%
Fujian20,51916,0984470-4421−21.5%
Tianjin11,70574042507-4301−36.7%
Shanghai70502759--4291−60.9%
Guangxi27,19122,9628929-4229−15.6%
Jiangxi35,76532,93014,977-2835−7.9%
Qinghai700746491094-2358−33.7%
Hainan48273109--1717−35.6%
Chongqing13,69512,5774116-1118−8.2%
Tibet125125125-−00.1%
Total2,741,5061,611,622339,436-1,129,885−41.2%
Table A5. Trends in coal industry employment supported by each province, 2021–2060 and change to 2030 (C50 scenario).
Province in Which Coal Plants Are LocatedCoal Industry Jobs Supported by Those Plants (Thousands, 2021)203020402050Change in Employment 2021–2030% Employment Loss 2021–2030
Shandong491,171138,729--352,442−71.8%
Jiangsu451,727103,992--347,735−77.0%
Henan256,72063,422--193,298−75.3%
Hebei197,48247,124--150,358−76.1%
Liaoning172,18330,375--141,808−82.4%
Heilongjiang122,47918,720--103,759−84.7%
Anhui126,76139,220--87,541−69.1%
Shanxi109,16931,127--78,043−71.5%
Inner Mongolia102,06331,868--70,195−68.8%
Guizhou95,57236,280--59,292−62.0%
Gansu49,63412,444--37,191−74.9%
Guangdong54,47221,005--33,467−61.4%
Jilin46,98913,880--33,109−70.5%
Sichuan37,5935739--31,855−84.7%
Hunan39,8248790--31,033−77.9%
Zhejiang35,9698345--27,624−76.8%
Xinjiang86,78759,426--27,361−31.5%
Shaanxi44,82317,680--27,144−60.6%
Jiangxi35,76511,389--24,375−68.2%
Ningxia39,82615,807--24,019−60.3%
Hubei32,07112,681--19,390−60.5%
Yunnan20,3102141--18,168−89.5%
Guangxi27,19113,648--13,543−49.8%
Fujian20,5196987--13,531−65.9%
Tianjin11,7052521--9184−78.5%
Shanghai7050---7050−100.0%
Chongqing13,6957442--6253−45.7%
Qinghai70073255--3752−53.5%
Hainan48271572--3254−67.4%
Tibet125125--−00.1%
Total2,741,506765,732--1,975,774−72.1%
Table A6. Trends in coal industry employment supported by each province, 2021–2060 and change to 2030 (C80 scenario).
Province in Which Coal Plants Are LocatedCoal Industry Jobs Supported by Those Plants (Thousands, 2021)203020402050Change in Employment 2021–2030% Employment Loss 2021–2030
Shandong491,17142,493--448,678−91.3%
Jiangsu451,72742,550--409,176−90.6%
Henan256,72019,468--237,252−92.4%
Hebei197,48226,462--171,020−86.6%
Liaoning172,1839815--162,368−94.3%
Heilongjiang122,4797308--115,171−94.0%
Anhui126,76113,136--113,625−89.6%
Shanxi109,16912,279--96,890−88.8%
Inner Mongolia102,06313,439--88,624−86.8%
Guizhou95,57213,147--82,425−86.2%
Xinjiang86,78720,095--66,692−76.8%
Guangdong54,4725354--49,117−90.2%
Gansu49,6343758--45,877−92.4%
Jilin46,9892646--44,343−94.4%
Hunan39,8242502--37,322−93.7%
Sichuan37,593914--36,679−97.6%
Shaanxi44,8239172--35,651−79.5%
Zhejiang35,969508--35,461−98.6%
Jiangxi35,7654506--31,259−87.4%
Ningxia39,82611,204--28,622−71.9%
Hubei32,0717086--24,985−77.9%
Yunnan20,310---20,310−100.0%
Guangxi27,1917886--19,305−71.0%
Fujian20,5193145--17,374−84.7%
Chongqing13,6952761--10,934−79.8%
Tianjin11,7051642--10,063−86.0%
Shanghai7050---7050−100.0%
Qinghai70071346--5661−80.8%
Hainan4827---4827−100.0%
Tibet125125--−00.1%
Total2,741,506284,746--2,456,760−89.6%

Appendix D. Technical Appendix

This appendix details the assumptions and calculations made in order to generate the model results reported in the paper.

Appendix D.1. Coal Plant Operations

Coal plants are deemed to be operational or non-operational based on the start year of operations (contained in the data) and end year (determined in each scenario based on the methodology in Appendix B). To estimate coal consumption per useful unit of electricity produced, information on coal energy content (EC) and plant efficiency is required. Coal energy content assumptions differ by the type of coal consumed (see Table A7).
Table A7. Coal energy content assumptions. Source: Carbon Tracker Initiative.
Coal TypeEnergy Content (kcal per kg)
Anthracite6066
Bituminous5316
Sub-bituminous4897
Lignite3713
Average (used when coal type unknown)4500
These figures are then converted to GJ per tonne using the conversion factor 239,005.7 GJ/kcal, and then to M/Wh per tonne using the conversion factor 3.6 GJ/MWh (A1).
E C   ( MWh t ) = 3.6 × E C ( kcal kg ) × ( 1000 239 , 005.7 )
Plant efficiency factors (EF) vary by type of plant (see Table A8) and are estimated to decay (d) by 0.18% per year, based on data provided by Carbon Tracker Initiative.
Table A8. Plant efficiency assumptions by technology type.
Plant Technology TypeEfficiency (%)Source
Subcritical39.6%[88]
Supercritical42%[89]
Ultra-supercritical44%[89]
Estimated capacity factors (CF) by province are provided in Table 1 in the main text and are sourced from published statistics provided by the China Electricity Council (CEC) for the year 2019. Coal consumption (C) by plant i with capacity CA in year t that began operating in year t* is calculated using Equations (A2) and (A3):
E f f i c i e n c y i t = E F i × ( 1 d ) t t *
C i t = C A i × C F i t × 8766 E C × E f f i c i e n c y i t      
It is assumed that each plant starts phasing down its operations two years ahead of closure, reducing its initial capacity factor by one third for the penultimate year of operation, and by two thirds for the last year of operation. This is intended to be a crude proxy for reflecting declining demand for the services of coal plants targeted for phase-out, either because they are not providing sufficient value to the market or are considered not to meet regulatory targets.

Appendix D.2. Coal Mining Operations

The coal mine dataset contains fields for each mine’s opening year and remaining operational lifetime. If remaining lifetime data is not available, the mine is assumed to operate either until 2050, or for 50 years from its opening year, whichever is the longest. If the opening year is also unavailable, the mine is assumed to operate for 50 years after the base year (2021). The dataset is filtered for mines that produce thermal coal. If the mine produces both thermal and metallurgical coal, it is classed as a thermal coal mine. Thermal coal production by province and coal type is then aggregated.

Appendix D.3. Coal Production-Consumption Network

Each plant prioritises the consumption of coal mined in the province in which it is located (which must match the type of coal the plant consumes) and imports the balance from other provinces. Similarly, China prioritises the consumption of domestic coal, and is assumed to import coal only when there is an undersupply (which is the case for, e.g., anthracite). In each province p and for each coal type ct, the amount of coal demand met by local supplies (CDlocal) is the minimum of local demand d (coal of that type consumed by plants in that province) and local supply s (coal of that type produced by mines m in the same province) (A4).
C D p , c t l o c a l = min ( n = 1 i d i , p , c t ,   n = 1 m s p , c t )
The amount of each plant’s total coal demand (CDtotal) met by importing from other provinces (CDexternal) or from outside China is what remains when local demand is subtracted from it. The amount of each province’s coal supply exported to other provinces (CSexported) is what remains once local demand is subtracted from total local production (A5).
C S p , c t e x p o r t e d = n = 1 m s p , c t n = 1 i C D i , p , c t l o c a l
The amount of coal (by type) imported from outside China (CDimported) is the maximum of total demand (CDtotal), minus total domestic supply (CDlocal + CDexternal) across all provinces; and zero (A6).
C D c t i m p o r t e d = max ( 0 , n = 1 p C D p , c t t o t a l n = 1 p C D p , c t l o c a l n = 1 p C D p , c t e x t e r n a l )
The percentage of the interprovincial coal export market (ep) held by each province is the share of coal exported by that province over total interprovincial exports, for each coal type (A7).
e p p , c t = C S p , c t e x p o r t e d n = 1 p C S p , c t e x p o r t e d
Each province then sources its coal externally from other provinces (where applicable) on a pro-rata basis according to each other province’s share of the interprovincial market. This is recalculated for each year t in the model.

Appendix D.4. Coal Transport Operations

Since the model aggregates mines at the provincial level and does not link specific mines to specific plants, coal transportation distances are calculated on the basis of the shortest geographic distance between the capital city of each province, and the plant. See [90] for a similar approach. A calculation for the cost of transport is required in order to assess revenues from VAT levied on the transport and power generation components of the supply chain. Average coal transport prices by mode, and the share of each mode in total transport volumes, are used to estimate an overall average cost per ton-km.
Table A9. Cost and share of transport by mode.
Transport ModeAverage Cost (CNY /ton-km) [Source]Share (Scaled to 100%) [65]Weighted Average Cost of Transport (CNY /ton-km)
Rail0.1 [91]46.67%0.2196
Road0.55 [92]28.57%
Water0.06375 [92]24.76%
Total transport costs (TC) for each plant in a given year are the sum, across provinces, of the product of distance dist between plant i and the capital of province p, and the amount of coal demanded from each province CDp (A8).
T C i = n = 1 p d i s t i p × C D p  

Appendix D.5. Employment

The number of jobs supported by each coal plant while it is operating depends on the capacity of the plant (Table A10).
Table A10. Number of jobs in coal plants by plant capacity. Adapted from [60].
Plant Capacity (c) (MW)Number of Jobs
0 ≤ c < 10060
100 ≤ c < 300100
100 ≤ c < 600110
600 ≤ c < 1000120
≥1000150
The number of jobs (per billion ton-km) supported by the transport of coal in each province is the weighted average across modes of the total number of jobs supported by each transport mode in each province, divided by total freight volumes for each mode in each province. Table A11 summarises the data points used in constructing this measure, as well as the 2015 figures for coal mining jobs per 10,000 tons of coal production by province. This coal mining labour intensity measure, L, is projected forward based on annual rates of labour productivity growth g cited in [63] (A9). In the transport sector, jobs are assumed to be held in the province of origin of the coal being transported.
L t = L b × ( 1 g ) t b     where   {   b = 2015 , g = 8 % ,         2015 t 2020 b = 2020 , g = 5 % ,           2021 t 2050 b = 2050 , g = 0 % ,           2051 t 2060
Table A11. Estimated jobs per billion ton-km of coal transported, and per 10,000 tons of coal produced, by province.
Jobs (2020) [64]Freight Volumes (Billion ton-km, 2020) [65]Weighted Average Jobs per Billion ton-kmJobs per 10,000 tons Coal Production (L), 2015 [63]
ProvinceRoadRailWaterRoadRailWater
Anhui47.3132.38.475.4326.8622.5183.517.5
Beijing103.3262.20.381.427.60.03354.820
Chongqing27.2123.712.120.895.3245.3451.018
Fujian33.596.014.619.496.2713.6173.89
Gansu64.844.30.2151.798.00.0438.016.5
Guangdong72.1388.341.430.1256.42450.8183.30
Guangxi66.466.84.475.3147.1176.5345.125.5
Guizhou33.559.60.264.254.84.5755.18
Hainan6.519.46.11.74.1159.0194.20
Hebei88.1118.018.0493.7802.759.9165.223
Heilongjiang137.360.60.681.479.50.61229.529
Henan110.8229.52.1214.6530.0121.2395.528.7
Hubei78.6159.713.293.9226.8292.6410.19.5
Hunan77.8129.53.285.5131.742.2811.916.5
Inner Mongolia108.157.60.0273.5195.50.0353.41.7
Jiangsu64.0233.651.733.3323.5637.9351.137
Jiangxi56.389.73.356.5304.025.5386.921
Jilin62.661.90.054.0126.30.0690.526
Liaoning112.6115.628.4123.2266.3502.7287.632.5
Ningxia19.711.10.221.443.70.0473.67.5
Qinghai23.319.60.027.212.60.01076.710.5
Shaanxi97.4111.00.0175.0173.10.1598.63.3
Shandong88.0203.738.4152.5674.6189.6324.732.2
Shanghai33.7179.731.61.583.92947.180.80
Shanxi102.675.80.0277.5269.20.0326.49.5
Sichuan70.8166.80.787.8152.830.6879.412
Tianjin28.358.810.951.759.9154.6367.80
Tibet0.715.40.04.011.40.01041.60
Xinjiang57.479.70.1114.680.20.0703.83.5
Yunnan39.075.20.251.9101.51.7737.520
Zhejiang4.0202.229.023.6208.21007.4189.70
Total1915.83647.4319.5

Appendix D.6. Tax Revenues and Subsidies

Estimation of tax revenues raised from employment requires estimating average wages by province for each type of employee. Data on average wages in the mining, power, and transport industries for each province is drawn from the China Statistical Yearbook 2019 [93]. In each industry, there is a substantial difference between public and private sector wages (public sector wages are typically much higher), and a weighted average is taken based on the proportion of public vs. private employees in each sector. In the mining sector, the public/private ratio (%) is 62/38; in power, it is 80/20; and in transport, 44/56 (Table A12).
Table A12. Wages by sector (public sector, private sector, and weighted average) and province.
Average Wage, Public Sector
(Thousand CNY/Year)
Average Wage, Private Sector
(Thousand CNY/Year)
Weighted Average Wage
(Thousand CNY/Year)
ProvinceMiningPowerTransportMiningPowerTransportMiningPowerTransport
Anhui59.0101.985.548.5113.1100.348.980.962.9
Beijing67.0135.0109.074.6176.7156.466.1123.391.1
Chongqing60.374.469.154.992.985.457.789.571.6
Fujian54.361.358.644.7119.7104.858.090.172.0
Gansu43.285.469.347.483.576.345.384.662.5
Guangdong48.6142.3106.648.0142.6123.862.5107.582.2
Guangxi45.363.956.844.5101.790.346.089.865.2
Guizhou52.671.164.055.3110.899.742.791.564.0
Hainan44.765.657.635.4100.887.754.397.673.2
Hebei43.982.267.644.6100.489.348.487.165.3
Heilongjiang39.390.070.736.280.371.543.783.160.9
Henan39.271.859.442.988.579.543.075.957.4
Hubei43.582.867.839.7103.290.542.286.461.5
Hunan42.757.651.939.794.383.439.685.259.5
Inner Mongolia57.1120.196.150.5101.491.345.191.565.4
Jiangsu55.894.179.556.0142.7125.562.698.578.3
Jiangxi47.560.155.345.485.077.247.187.064.6
Jilin36.571.258.032.189.678.136.677.954.6
Liaoning40.979.264.641.178.971.342.285.961.3
Ningxia50.4128.999.054.9120.3107.349.688.066.4
Qinghai43.9130.297.353.5102.792.948.299.970.8
Shaanxi49.3100.681.045.8105.793.844.289.964.2
Shandong53.196.279.766.4107.799.561.490.974.3
Shanghai0.0271.2167.857.5204.3175.165.7134.495.7
Shanxi50.281.369.541.187.178.044.293.665.8
Sichuan47.2103.281.946.7108.996.648.198.169.9
Tianjin68.3140.1112.763.9156.4138.058.2103.377.9
Tibet0.0105.265.10.0104.083.30.0108.847.6
Xinjiang68.6141.6113.861.4103.895.450.0104.673.9
Yunnan50.970.563.055.4102.993.446.3100.970.1
Zhejiang61.987.577.758.7129.4115.360.697.076.5
Social security payments are raised from wages; they are not strictly a tax but are made up of contributions by employers and employees. All employees are assumed to contribute to social security at the rate of 20% of gross salary; all employers, 30% of gross salary.
Income taxes are levied based on each employee’s taxable income. The standard deduction for income taxes in China is CNY 60,000 [68]. We assume that each employee claims the standard deduction. Taxable income is the maximum of is what remains, and zero. Total tax payable by each employee is taxable income multiplied by the tax rate for the applicable tax bracket, minus an additional ‘quick deduction’ for that bracket reflecting the amount taxed at a lower rate (Table A13).
Table A13. Income tax brackets, rates, and quick deductions.
Taxable Income (T, Thousand CNY)Rate (%)Quick Deduction (Thousand CNY)
0 ≤ T < 3630
36 ≤ T < 144102.52
144 ≤ T < 3002016.92
300 ≤ T < 4202531.92
420 ≤ T < 6603052.92
660 ≤ T < 9603585.92
T ≥ 96040181.92
Data on environmental pollution taxes is available only as ranges for each province (Figure A1), with more population-dense provinces typically opting for higher tax rates across all pollutants. In each case, the average of the range for each province is used to calculate the applicable tax. Taxes are levied on plants’ sulphur dioxide, nitrous oxide, particulate matter, and wastewater emissions. The first three are levied at rates ranging from CNY 1.2–10/kg; wastewater is taxed at CNY 1.4–10.5/m3. Emissions of pollutants per MWh generated vary by plant type (see Table A14).
Figure A1. Environmental Pollution Tax rates for selected pollutants by province. Units: CNY/kg (CNY/m3 for wastewater).
Energies 15 00800 g0a1
Table A14. Coal plant local pollutant emissions by plant type.
Plant TypeSOx
(kg/MWh) [89]
NOx
(kg/MWh) [89]
PM2.5
(kg/MWh) [89]
Wastewater (m3/MWh) [94]
Subcritical0.1170.1650.0322.27 × 10−5
Supercritical0.1030.150.032.27 × 10−5
Ultra-supercritical0.10.1420.0282.27 × 10−5
Further pollution taxes are levied on mining activities (and, in principle, transport activities, although these are assumed to be insignificant in this analysis and are not included). The relevant taxes and pollution rates per tonne of coal equivalent (tce; a standard measurement based on coal with 7000 kcal/kg calorific value) are detailed in Table A15.
Table A15. Coal mining pollutant tax and emissions rates [95,96].
PollutantTax Rate (CNY/kg)Emissions (kg/tce)
Coal gangue0.005175
Mine tailings0.0150.013
Coal ash0.02539.6
Wastewater [94]1.4–10.50.3
Prospecting and exploration fees are levied on operational mines, based on the area that the mine covers: CNY 500/km2/year for the former, and CNY 1000/km2/year for the latter. Since the dataset used for this exercise contains very limited information on mine sizes, an average production density of 0.52 million tons (Mt)/km2/year is used as an approximate proxy [97]. Precision for this tax is relatively less important than for other taxes, since it represents a very small proportion of total revenues. This produces estimates of CNY 964.7/Mt in prospecting fees, and CNY 1929.4/Mt in exploration fees.
Mining royalties (of which 20% go to central government, 80% to provincial government) and resource taxes (100% provincial governments) are levied ad valorem on coal sales by value, which are derived from the amount of coal consumed by each plant from each province. Royalties range from 0.5–4% of sales; here an average figure of 1.8% of sales is used. Resource tax rates vary by province and are provided in Table A16 alongside average provincial coal and coal-fired electricity prices (weighted average of fixed (benchmark) and spot market tariffs), which are used in the calculation of VAT.
VAT (of which 75% goes to central government, 25% returned to the subnational jurisdictions in which it was generated) is levied at the rate r of 12%, cumulatively, on coal sales, transport, and electricity sales. As with other VAT systems, each buyer in the process pays the requisite VAT and reclaims it once the good in question is sold, such that total VAT paid should be 12% of the final sale price. Prices used in the data already include VAT; the formula for calculating VAT payable is found in Equation (A10). At each stage, VAT is calculated based on the price of the service or good (coal, transport, wholesale electricity), and the VAT already paid upstream is deducted. If VAT already paid exceeds VAT payable at that stage of the value chain, no VAT is paid at that stage.
VAT = p V A T × r 1 + r
Table A16. Average coal [98] and electricity prices [99] (2019, incl. VAT), and resource tax rates [100], by province.
ProvinceCoal Price (CNY/ton)Electricity Price (Benchmark) (CNY/MWh)Electricity Price (Spot) (CNY/MWh)% Electricity Sold on Spot MarketWeighted Average Electricity Price (CNY/MWh)Resource Tax Rate (%)
Anhui584.37384.434633.7%371.52.0%
Beijing473.11368.2353.324.0%364.62.0%
Chongqing591.97396.4394.623.9%396.03.0%
Fujian542.08393.2363.227.6%384.92.0%
Gansu468.87297.8190.622.8%273.42.5%
Guangdong571.98453412.829.2%441.30.0%
Guangxi688.14420.7306.636.2%379.42.5%
Guizhou492.4351.5323.630.0%343.15.0%
Hainan505.69429.8399.81.3%429.40.0%
Hebei473.11368.2353.324.0%364.62.0%
Heilongjiang522.7374362.615.3%372.32.0%
Henan527.87377.9359.430.8%372.22.0%
Hubei597.44416.1408.627.4%414.02.0%
Hunan633.34450436.524.8%446.72.5%
Inner Mongolia272.44293.2220.236.0%266.99.0%
Jiangsu541.3391360.549.6%375.92.0%
Jiangxi656.69414.3403.626.7%411.42.0%
Jilin540.57373.1250.924.0%343.82.0%
Liaoning540.29375.336034.9%370.02.0%
Ningxia359.74259.5248.430.5%256.16.5%
Qinghai528.74324.7224.749.0%275.76.0%
Shaanxi419.07354.5291.614.6%345.36.0%
Shandong559.98394.9381.125.3%391.44.0%
Shanghai528.7415.5385.59.7%412.60.0%
Shanxi352.17332310.843.7%322.78.0%
Sichuan589.21401.2298.222.9%377.62.5%
Tianjin491.24365.5306.413.2%357.70.0%
Tibet589.21401.2298.222.9%377.60.0%
Xinjiang253.89260170.216.7%245.06.0%
Yunnan479.79335.818157.7%246.55.5%
Zhejiang582.75415.3390.227.8%408.30.0%
Only a handful of relevant subsidies can be calculated within the model. They are summarized in Table A17. The first is VAT rebates for coal mines and coalbed methane production; these are capped at a fixed level. It is assumed that they are claimed to the maximum amount as long as the total VAT liabilities generated by coal mines exceed the subsidy cap. The general VAT rebate is applied first; if sufficient liabilities remain after that, the coalbed methane rebate is applied.
The price protection subsidy is calculated on the basis of the average difference between fixed benchmark price and spot prices for electricity by province in Table A16, multiplied by the proportion of coal-fired electricity sold. Environmental externality subsidies for coal plants are calculated on the basis of tce (converted from tonnes of coal based on the calorific content of each coal type).
Table A17. Estimated annual subsidies to the coal industry.
SubsidyTypeOriginUnitValueSource
VAT rebate (general)FiscalCentralCNY bn1.71[73]
VAT rebate (coalbed methane)FiscalCentralCNY bn1.1[73]
Fiscal supportFiscalProvincialCNY bn5.3[101]
ResearchDirectCentralCNY bn0.33[73]
Coalbed methane productionDirectBothCNY bn0.41[73]
Transition FundDirectCentralCNY bn10.5[35]
Rate subsidy—electricityRatesCentralCNY bn146[102]
Rate subsidy—railRatesCentralCNY bn1.9[73]
Rate subsidy—railRatesProvincialCNY bn7.2[71]
Price protection—direct CentralCNY/kWh0.064[72]
Price protection—spot markets CentralCNY/kWh0.13[72]
Credit support CentralCNY35.7[73]
Priority dispatch CentralCNY6.8[71]
Environmental externalities CentralCNY/tce154[72]
Total (estimated)
Production BothCNY/ton17.78[70]
Generation BothCNY bn120.8[71]
Generation BothCNY bn263[72]
Generation—environmental BothCNY bn119.3[72]
Generation—externalities BothCNY bn179[72]
Generation—price protection BothCNY bn183.3[72]
Generation—crowding out renewables BothCNY bn17.5[72]

References

  1. ClimateWatch. Historical GHG Emissions; ClimateWatch: Washington, DC, USA, 2020. [Google Scholar]
  2. Shearer, C.; Myllyvirta, L. China Dominates 2020 Coal Plant Development; Global Energy Monitor and Centre for Research on Energy and Clean Air: San Francisco, CA, USA, 2021. [Google Scholar]
  3. World Steel Association. World Crude Steel Production—Summary; World Steel Association: Brussels, Belgium, 2020. [Google Scholar]
  4. Curry, K.C.; van Oss, H.G. 2017 Minerals Yearbook: Cement; United States Geological Survey: Reston, VA, USA, 2020.
  5. Myers, S.L. China’s pledge to be carbon neutral by 2060: What it means. The New York Times, 2020. [Google Scholar]
  6. Myllyvirta, L. China’s Five-Year Plan: Baby Steps towards Carbon Neutrality; Centre for Research on Energy and Clean Air, 2021. [Google Scholar]
  7. He, J.; Xie, Z.; Li, Z.; Zhang, X.; Chang, S.; Chen, S.; Dong, W.; Guo, S.; Gu, A.; Ou, X.; et al. Comprehensive Report on China’s Long-Term Low-Carbon Development Strategy and Pathways. Chin. J. Popul. Resour. Environ. 2021, 18, 263–295. [Google Scholar] [CrossRef]
  8. Cui, R.Y.; Hultman, N.; Edwards, M.R.; He, L.; Sen, A.; Surana, K.; McJeon, H.; Iyer, G.; Patel, P.; Yu, S.; et al. Quantifying operational lifetimes for coal power plants under the Paris goals. Nat. Commun. 2019, 10, 4759. [Google Scholar] [CrossRef] [PubMed] [Green Version]
  9. Herve-Mignucci, M.; Wang, X.; Nelson, D.; Varadarajan, U. Slowing the Growth of Coal Power in China: The Role of Finance in State-Owned Enterprises; Climate Policy Initiative: San Francisco, CA, USA, 2015. [Google Scholar]
  10. Gray, M.; Sundaresan, S. Political Decisions, Economic Realities: The underlying Operating Cashflows of Coal Power during COVID-19; Carbon Tracker Initiative: London, UK, 2020. [Google Scholar]
  11. Bodnar, P.; Gray, M.; Grbusic, T.; Herz, S.; Lonsdale, A.; Mardell, S.; Ott, C.; Sundaresan, S.; Varadarajan, U. How to Retire Early: Making Accelerated Coal Phaseout Feasible and Just; Rock Mountain Institute: Boulder, CO, USA, 2020. [Google Scholar]
  12. Yuan, J.; Zhang, W.; Zhang, K.; Meng, Z.; Zhu, Y.; Qiu, Y.; Wu, R.; Zhang, C. The Choice for China’s Power Sector Strategic Pathway in the Post-Pandemic Era: Coal Power or New Power Infrastructure? North China Electric Power University: Beijing, China, 2020. [Google Scholar]
  13. Cui, R.; Hultman, N.; Jiang, K.; McJeon, H.; Yu, S.; Cui, D.; Edwards, M.; Sen, A.; Song, K.; Bowman, C.; et al. A High Ambition Coal Phaseout in China: Feasible Strategies through a Comprehensive Plant-by-Plant Assessment; Center for Global Sustainability, University of Maryland and Energy Research Institute: College Park, MD, USA, 2020. [Google Scholar]
  14. Spencer, T.; Berghmans, N.; Sartor, O. Coal Transitions in China’s Power Sector: A Plant-Level Assessment of Stranded Assets and Retirement Pathways; Institut du Développement Durable et des Relations Internationales: Paris, France, 2017. [Google Scholar]
  15. Jakob, M.; Steckel, J.C.; Jotzo, F.; Sovacool, B.K.; Cornelsen, L.; Chandra, R.; Edenhofer, O.; Holden, C.; Löschel, A.; Nace, T.; et al. The future of coal in a carbon-constrained climate. Nat. Clim. Chang. 2020, 10, 704–707. [Google Scholar] [CrossRef]
  16. Caldecott, B.; Bouveret, G.; Dericks, G.; Kruitwagen, L.; Tulloch, D.; Liao, X. Managing the Political Economy Frictions of Closing Coal in China; Discussion Paper; Smith School of Enterprise and the Environment, University: Oxford, UK, 2017. [Google Scholar]
  17. Pai, S.; Emmerling, J.; Drouet, L.; Zerriffi, H.; Jewell, J. Meeting well-below 2 °C target would increase energy sector jobs globally. One Earth 2021, 4, 1026–1036. [Google Scholar] [CrossRef]
  18. Cui, R.; Hultman, N.; Cui, D.; McJeon, H.; Yu, S.; Edwards, M.; Sen, A.; Song, K.; Bowman, C.; Clarke, L.; et al. A plant-by-plant strategy for high-ambition coal power phaseout in China. Nat. Commun. 2021, 12, 1–10. [Google Scholar] [CrossRef]
  19. Diluiso, F.; Walk, P.; Manych, N.; Cerutti, N.; Chipiga, V.; Workman, A.; Ayas, C.; Cui, R.Y.; Cui, D.; Song, K.; et al. Coal transitions—part 1: A systematic map and review of case study learnings from regional, national, and local coal phase-out experiences. Environ. Res. Lett. 2021, 16, 113003. [Google Scholar] [CrossRef]
  20. Department for Business Energy & Industrial Strategy. Historical Coal Data: Coal Production, Availability and Consumption; Department for Business Energy & Industrial Strategy: London, UK, 2020. [Google Scholar]
  21. Oei, P.-Y.; Hermann, H.; Herpich, P.; Holtemöller, O.; Lünenbürger, B.; Schult, C. Coal phase-out in Germany—Implications and policies for affected regions. Energy 2020, 196, 117004. [Google Scholar] [CrossRef]
  22. Alves Dias, P.; Kanellopoulos, K.; Medarac, H.; Kapetaki, Z.; Miranda-Barbosa, E.; Shortall, R.; Czako, V.; Telsnig, T.; Vazquez-Hernandez, C.; Lacal Arántegui, R. EU Coal Regions: Opportunities and Challenges Ahead; European Commission, Joint Research Centre: Petten, The Netherlands, 2018. [Google Scholar]
  23. Galgóczi, B. Towards a just Transition: Coal, Cars and the World of Work; European Trade Union Institute: Brussels, Belgium, 2019. [Google Scholar]
  24. U.S. Bureau of Labor Statistics. All Employees, Coal Mining [CES1021210001]; Federal Reserve Bank of St. Louis, Ed.; U.S. Bureau of Labor Statistics: St. Louis, MO, USA, 2021.
  25. National Association of State Energy Officials; Energy Futures Initiative. 2020 U.S. Energy and Employment Report; National Association of State Energy Officials: Arlington, VA, USA; Energy Futures Initiative: Washington, DC, USA, 2020. [Google Scholar]
  26. Mealy, P.; Teytelboym, A. Economic Complexity and the Green Economy. Research Policy 2020. [Google Scholar] [CrossRef]
  27. Oei, P.-Y.; Brauers, H.; Herpich, P. Lessons from Germany’s hard coal mining phase-out: Policies and transition from 1950 to 2018. Clim. Policy 2020, 20, 963–979. [Google Scholar] [CrossRef] [Green Version]
  28. Andrews-Speed, P.; Ma, G.; Shao, B.; Liao, C. Economic responses to the closure of small-scale coal mines in Chongqing, China. Resour. Policy 2005, 30, 39–54. [Google Scholar] [CrossRef]
  29. Mayer, A. The Fiscal Impacts of Energy: Perspectives from local governments in the Mountain West, USA. Energy Policy 2018, 122, 186–193. [Google Scholar] [CrossRef]
  30. Sandbag. Solving the Coal Puzzle: Lessons from Four Years of Coal Phase-Out Policy in Europe; Europe Beyond Coal: Berlin, Germany, 2019. [Google Scholar]
  31. Goodman, P.G.; Rich, D.Q.; Zeka, A.; Clancy, L.; Dockery, D.W. Effect of Air Pollution Controls on Black Smoke and Sulfur Dioxide Concentrations across Ireland. J. Air Waste Manag. Assoc. 2009, 59, 207–213. [Google Scholar] [CrossRef] [PubMed]
  32. Office, I.L. A just transition for all: Can the past inform the future? Int. J. Labour Res. 2014, 6, 173. [Google Scholar]
  33. Skorkovsky, J.; Kotesovec, F. Mortality in Northwestern Bohemia in Periods of High and Low Air Pollution. In Environmental Health in Central and Eastern Europe; Springer: New York, NY, USA, 2006; pp. 1–11. [Google Scholar]
  34. Bridle, R.; Kitson, L.; Duan, H.; Sanchez, L.; Merrill, T. At the Crossroads: Balancing the Financial and Social Costs of Coal Transition in China; International Institute for Sustainable Development (IISD): Winnipeg, MB, Canada, 2017. [Google Scholar]
  35. Gençsü, I.; Whitley, S.; Roberts, L.; Beaton, C.; Chen, H.; Doukas, A.; Geddes, A.; Gerasimchuk, I.; Sanchez, L.; Suharsono, A. G20 Coal Subsidies: Tracking Government Support to a Fading Industry; Overseas Development Institute: London, UK, 2019. [Google Scholar]
  36. Sheldon, C.G.; Strongman, J.; Weber-Fahr, M. It’s Not Over When It’s Over: Mine Closure Around the World; World Bank: Washington, DC, USA; International Finance Corporation: Washington, DC, USA, 2002. [Google Scholar]
  37. Rui, H. Development, Transition and Globalization in China’s Coal Industry. Dev. Chang. 2005, 36, 691–710. [Google Scholar] [CrossRef]
  38. Song, Z.; Kuenzer, C. Coal fires in China over the last decade: A comprehensive review. Int. J. Coal Geol. 2014, 133, 72–99. [Google Scholar] [CrossRef]
  39. People’s Republic of China. Notice Regarding Completing 2016 Work on Coal Consumption Reduction and Substitution; National Development and Reform Commission, People’s Republic of China: Beijing, China, 2016. [Google Scholar]
  40. Cao, X. Policy and regulatory responses to coalmine closure and coal resources consolidation for sustainability in Shanxi, China. J. Clean. Prod. 2017, 145, 199–208. [Google Scholar] [CrossRef]
  41. Hao, X.; Song, M.; Feng, Y.; Zhang, W. De-Capacity Policy Effect on China’s Coal Industry. Energies 2019, 12, 2331. [Google Scholar] [CrossRef] [Green Version]
  42. Liu, Z. China caps coal output goal at 4.1b tons. China Daily, 2021. [Google Scholar]
  43. Myllyvirta, L.; Shen, X. Burning Money: How China Could Squander Over One Trillion Yuan on Unneeded Coal-Fired Capacity; Greenpeace: Hong Kong, China, 2016. [Google Scholar]
  44. State Council of the People’s Republic of China. 国务院关于印发大气污染防治行动计划的通知 [Action Plan for Air Pollution Prevention and Control]; State Council of the People’s Republic of China: Beijing, China, 2013. [Google Scholar]
  45. Tang, L.; Qu, J.; Mi, Z.; Bo, X.; Chang, X.; Anadon, L.D.; Wang, S.; Xue, X.; Li, S.; Wang, X.; et al. Substantial emission reductions from Chinese power plants after the introduction of ultra-low emissions standards. Nat. Energy 2019, 4, 929–938. [Google Scholar] [CrossRef]
  46. Zhang, P.; Zhang, L.; Tian, X.; Hao, Y.; Wang, C. Urban energy transition in China: Insights from trends, socioeconomic drivers, and environmental impacts of Beijing. Energy Policy 2018, 117, 173–183. [Google Scholar] [CrossRef]
  47. Tan, H.; Thurbon, E.; Kim, S.-Y.; Mathews, J.A. Overcoming incumbent resistance to the clean energy shift: How local governments act as change agents in coal power station closures in China. Energy Policy 2021, 149, 112058. [Google Scholar] [CrossRef]
  48. Lo, A.Y. Carbon trading in a socialist market economy: Can China make a difference? Ecol. Econ. 2013, 87, 72–74. [Google Scholar] [CrossRef]
  49. Zeng, M.; Li, J.; Tian, L.; Liu, Y.; Wang, L. Review of Concentrating Solar Thermal Power in China: Status Quo, Problems and Countermeasures; AIP Publishing: Melville, NY, USA, 2018. [Google Scholar]
  50. Zhang, W.; Li, J.; Li, G.; Guo, S. Emission reduction effect and carbon market efficiency of carbon emissions trading policy in China. Energy 2020, 196, 117117. [Google Scholar] [CrossRef]
  51. Zhang, Y.; Li, S.; Luo, T.; Gao, J. The effect of emission trading policy on carbon emission reduction: Evidence from an integrated study of pilot regions in China. J. Clean. Prod. 2020, 265, 121843. [Google Scholar] [CrossRef]
  52. Aihua, L.; Miglietta, P.P.; Toma, P. Did carbon emission trading system reduce emissions in China? An integrated approach to support policy modeling and implementation. Energy Syst. 2021. [Google Scholar] [CrossRef]
  53. He, G.; Lin, J.; Zhang, Y.; Zhang, W.; Larangeira, G.; Zhang, C.; Peng, W.; Liu, M.; Yang, F. Enabling a rapid and just transition away from coal in China. One Earth 2020, 3, 187–194. [Google Scholar] [CrossRef] [PubMed]
  54. International Energy Agency. World Energy Outlook 2021; International Energy Agency: Paris, France, 2020. [Google Scholar]
  55. Murtagh, D.; Kan, K.; Murphy, C.; Mayger, J. China’s Coal Industry Fights for Survival in a Greener World. Bloomberg News, 2020. [Google Scholar]
  56. Ministry of Human Resources and Social Security. Press Conference on Employment and Social Security of the State Council Information Office; People’s Republic of China: Beijing, China, 2016.
  57. People’s Republic of China. Notice of the Five Departments on Doing a Good Job in the Resettlement of Employees in Resolving the Overcapacity of the Steel and Coal Industry in 2017; People’s Republic of China: Beijing, China, 2017.
  58. Global Energy Monitor. Global Coal Mine Tracker; Global Energy Monitor: San Francisco, CA, USA, 2021. [Google Scholar]
  59. Energy Information Administration. As U.S. coal-fired capacity and utilization decline, operators consider seasonal operation. In Today in Energy; U.S. Energy Information Administration: Washington, DC, USA, 2020. [Google Scholar]
  60. Yuan, J.; Zhang, W.; Guo, X.; Ai, Y.; Zheng, R. Deepening Supply-Side Structural Reforms in Coal Power with a Power Market. Emerg. Mark. Financ. Trade 2021, 57, 773–785. [Google Scholar] [CrossRef]
  61. Institute for Labor Studies. Study on Green Employment in China; Institute for Labor Studies: Manila, Philippines, 2010. [Google Scholar]
  62. CEIC China No of Employee: Coal Mining & Dressing. Available online: https://www.ceicdata.com/en/china/no-of-employee-by-industry-monthly/no-of-employee-coal-mining-dressing (accessed on 7 February 2021).
  63. UIBE; Chinese Academy of Sciences. Research on Employment Issues Associated with Coal Industry Transition; Institute of Global Value Chains, University of International Business and Economics: Beijing, China; Institute of Urban Development and Environment, Chinese Academy of Sciences: Beijing, China, 2019. [Google Scholar]
  64. China Statistics Press China Statistical Yearbook 2020. Available online: www.stats.gov.cn/tjsj/ndsj/2020/indexeh.htm (accessed on 2 November 2021).
  65. Pan, H.; Zheng, Y. Chapter 8—The development and status quo of freight transport in China. In Urban Freight Transportation Systems; Elbert, R., Friedrich, C., Boltze, M., Pfohl, H.-C., Eds.; Elsevier: Amsterdam, The Netherlands, 2020; pp. 135–161. [Google Scholar]
  66. National Bureau of Statistics of China. Average Annual Wage of Employed Persons in Different Positions in Enterprises above Designated Size in 2019; National Bureau of Statistics of China: Beijing, China, 2020. [Google Scholar]
  67. PWC China. People’s Republic of: Individual—Taxes on Personal Income. Available online: https://taxsummaries.pwc.com/peoples-republic-of-china/individual/taxes-on-personal-income (accessed on 8 March 2021).
  68. PWC China. People’s Republic of: Individual—Deductions. Available online: https://taxsummaries.pwc.com/peoples-republic-of-china/individual/deductions (accessed on 8 March 2021).
  69. MS Advisory Explaining China’s Social Security System and Housing Fund Scheme for Employers. Available online: https://www.msadvisory.com/news-updates/august-2020/china-social-security-system-and-housing-fund (accessed on 8 March 2021).
  70. Xiang, H.; Kuang, Y. Who benefits from China’s coal subsidy policies? A computable partial equilibrium analysis. Resour. Energy Econ. 2020, 59, 101124. [Google Scholar] [CrossRef]
  71. Denjean, B.; Su, T.; Attwood, C.; Bridle, R.; Duan, H.; Gerasimchuk, I. Subsidies to Coal Power Generation in China; International Institute for Sustainable Development: Winnipeg, MB, Canada, 2016. [Google Scholar]
  72. Yuan, J.; Guo, X.; Zhang, W.; Chen, S.; Ai, Y.; Zhao, C. Deregulation of power generation planning and elimination of coal power subsidy in China. Util. Policy 2019, 57, 1–15. [Google Scholar] [CrossRef]
  73. Xue, H.; Wang, H.; Bridle, R.; Gerasimchuk, I.; Attwood, C. Subsidies to Coal Production in China; International Institute for Sustainable Development: Winnipeg, MB, Canada, 2015. [Google Scholar]
  74. Coady, D.; Parry, I.; Sears, L.; Shang, B. How Large Are Global Fossil Fuel Subsidies? World Dev. 2017, 91, 11–27. [Google Scholar] [CrossRef]
  75. Zhao, X.; Cai, Q.; Ma, C.; Hu, Y.; Luo, K.; Li, W. Economic evaluation of environmental externalities in China’s coal-fired power generation. Energy Policy 2017, 102, 307–317. [Google Scholar] [CrossRef]
  76. Mealy, P. Know What? New Lenses on Productive Knowledge Shed Light on Long Run Development, Structural Change, Job Switching and the Transition to the Green Economy. Ph.D. Thesis, University of Oxford, Oxford, UK, 2018. [Google Scholar]
  77. Statista Revenue of Value-Added Tax (VAT) in China from 2011 to 2020. Available online: https://www.statista.com/statistics/455231/china-vat-revenue/ (accessed on 10 March 2021).
  78. Gao, Y.; Ma, S.; Wang, T.; Wang, T.; Gong, Y.; Peng, F.; Tsunekawa, A. Assessing the wind energy potential of China in considering its variability/intermittency. Energy Convers. Manag. 2020, 226, 113580. [Google Scholar] [CrossRef]
  79. Energy Research Institute; China National Renewable Energy Centre. China Renewable Energy Outlook 2019; Energy Research Institute of Academy of Macroeconomic Research: Beijing, China; NDRC: Beijing, China, 2019. [Google Scholar]
  80. Global Energy Monitor; CREA. A New Coal Boom in China: Country Accelerates New Coal Plant Permitting and Proposals; Global Energy Monitor and Centre for Research on Energy and Clean Air: San Francisco, CA, USA, 2020. [Google Scholar]
  81. Li, W.; Yang, M.; Long, R.; He, Z.; Zhang, L.; Chen, F. Assessment of greenhouse gasses and air pollutant emissions embodied in cross-province electricity trade in China. Resour. Conserv. Recycl. 2021, 171, 105623. [Google Scholar] [CrossRef]
  82. New York Times. ‘The Whole City Was Dark’: China Rations Electricity for Millions. The New York Times, 2020. [Google Scholar]
  83. Reuters. Column: China’s widening electricity crisis caused by coal shortage. Reuters, 2021. [Google Scholar]
  84. Slater, H.; de Boer, D.; Guoqiang, Q.; Shu, W. 2020 China Carbon Pricing Survey; China Carbon Forum: Beijing, China, 2020. [Google Scholar]
  85. He, G.; Lin, J.; Sifuentes, F.; Liu, X.; Abhyankar, N.; Phadke, A. Rapid cost decrease of renewables and storage accelerates the decarbonization of China’s power system. Nat. Commun. 2020, 11, 1–9. [Google Scholar] [CrossRef]
  86. Pfeiffer, A.; Hepburn, C.; Vogt-Schilb, A.; Caldecott, B. Committed emissions from existing and planned power plants and asset stranding required to meet the Paris Agreement. Environ. Res. Lett. 2018, 13, 054019. [Google Scholar] [CrossRef] [Green Version]
  87. Tong, D.; Zhang, Q.; Zheng, Y.; Caldeira, K.; Shearer, C.; Hong, C.; Qin, Y.; Davis, S.J. Committed emissions from existing energy infrastructure jeopardize 1.5 °C climate target. Nature 2019, 572, 373. [Google Scholar] [CrossRef]
  88. Minchener, A. Another Innovative Idea from the Waigaoqiao No.3 Coal Power Plant Engineers; International Centre for Sustainable Carbon: London, UK, 2019. [Google Scholar]
  89. Myllyvirta, L. How much do ultra-supercritical coal plants really reduce air pollution? Renew Economy, 2017. [Google Scholar]
  90. Li, N.; Chen, W.; Zhang, Q. Development of China TIMES-30P model and its application to model China’s provincial low carbon (Pre-proof). Energy Econ. 2020, 92, 104955. [Google Scholar] [CrossRef]
  91. Zhang, B.; Kang, Z. China Railway Freight Price Reform Analysis: Based on Price Elasticity of Freight Demand; IEIS2019; Li, M., Dresner, M., Zhang, R., Hua, G., Shang, X., Eds.; Springer: Singapore, 2020; pp. 573–585. [Google Scholar]
  92. Rioux, B.; Galkin, P.; Murphy, F.; Pierru, A. Economic impacts of debottlenecking congestion in the Chinese coal supply chain. Energy Econ. 2016, 60, 387–399. [Google Scholar] [CrossRef] [Green Version]
  93. People’s Republic of China. China Statistical Yearbook 2019; People’s Republic of China: Beijing, China, 2019. [Google Scholar]
  94. Zhu, Y.; Jiang, S.; Zhao, Y.; Li, H.; He, G.; Li, L. Life-cycle-based water footprint assessment of coal-fired power generation in China. J. Clean. Prod. 2020, 254, 120098. [Google Scholar] [CrossRef]
  95. Xu, S. The situation of generation, treatment and supervision of common industrial solid wastes in China. IOP Conf. Ser. Earth Environ. Sci. 2018, 113, 012154. [Google Scholar] [CrossRef]
  96. Zhang, Y.; Ling, T.-C. Reactivity activation of waste coal gangue and its impact on the properties of cement-based materials—A review. Constr. Build. Mater. 2020, 234, 117424. [Google Scholar] [CrossRef]
  97. Mining Technology. The Ten Biggest Coal Mines in the World; Verdict Media Limited: London, UK, 2020. [Google Scholar]
  98. Guoneng Hutong Inner Mongolia Network Technology Co Ltd. National and provincial electricity coal price index 2019. In Inner Mongolia Coal Exchange Center; Guoneng Hutong Inner Mongolia Network Technology Co Ltd., 2019. [Google Scholar]
  99. Cheng, S.; Li, K. Electrical Equipment Securities Research Report—Industry Review; Bank of China International Securities Co Ltd.: Hong Kong, China, 2020. [Google Scholar]
  100. Qin, P.; Chen, P.; Zhang, X.-B.; Xie, L. Coal taxation reform in China and its distributional effects on residential consumers. Energy Policy 2020, 139, 111366. [Google Scholar] [CrossRef]
  101. Gençsü, I.; Chen, H. G20 Coal Subsidies: Tracking Government Support to a Fading Industry—China Background Paper; Overseas Development Institute: London, UK, 2019. [Google Scholar]
  102. International Energy Agency. Energy Subsidies: Tracking the Impact of Fossil-Fuel Subsidies. Available online: https://www.iea.org/topics/energy-subsidies (accessed on 9 March 2021).
Figure 1. Estimated interprovincial trade balances for thermal coal in China by province (2021). Overlaid with coal mine output, and coal plants (operating and under construction), by capacity. See Appendix A for province codes.
Energies 15 00800 g001
Figure 2. Coal production-consumption network by province, 2021–2050 (B scenario). For province codes, see Appendix A. For a given producer (outer ring), ‘humps’ in the same colour as the outer ring represent coal consumed in the same province in which it is produced. ‘Links’, in different colours, represent coal exported to other provinces, where the colour of the link is that of the destination province.
Energies 15 00800 g002
Figure 3. Coal jobs supported by each province, B scenario. Flows from province X (the colour of the outside ring) to province Y, in the same colour as province X, represent jobs in province Y supported by coal imports to fuel coal-fired power generation activity in province X.
Energies 15 00800 g003
Figure 4. Employment in coal plants, transport and mines, 2021–2060, baseline scenario.
Energies 15 00800 g004
Figure 5. Breakdown of tax (national and subnational) and social security revenues, 2021–2060, B scenario.
Energies 15 00800 g005
Figure 6. Employment in the thermal coal mining, power, and transport sectors under five coal phase-out scenarios, 2021–2060.
Energies 15 00800 g006
Figure 7. Total tax revenues under different coal phase-out scenarios, 2021–2060.
Energies 15 00800 g007
Figure 8. Largest parent companies by number of coal jobs supported, 2021–2050 (baseline scenario).
Energies 15 00800 g008
Figure 9. Largest parent companies by direct and indirect contribution to total tax revenues from coal, 2021–2050 (B scenario).
Energies 15 00800 g009
Table 1. Coal capacity, generation, and production statistics by province (B scenario, 2021).
ProvinceCapacity (GW) 1Average Capacity Factor (%) 2Generation (TWh) 1Coal Production (Mtce) 2
Anhui52.055.2%251.470.4
Chongqing14.039.4%48.2-
Fujian27.149.1%116.7-
Gansu21.645.2%85.533.1
Guangdong72.640.0%254.5-
Guangxi20.547.4%85.2-
Guizhou35.248.4%149.08.8
Hainan3.953.3%18.0-
Hebei58.255.4%282.33.0
Heilongjiang21.143.7%80.912.2
Henan80.840.2%284.719.9
Hubei33.844.6%132.2-
Hunan21.945.7%87.5-
Inner Mongolia103.361.1%552.7904.0
Jiangsu89.649.4%387.7-
Jiangxi27.958.8%143.7-
Jilin19.242.9%72.1-
Liaoning38.445.5%153.28.0
Ningxia32.652.5%150.2101.1
Qinghai5.729.2%14.65.8
Shaanxi44.250.0%193.9467.9
Shandong110.350.7%490.349.1
Shanghai15.935.6%49.7-
Shanxi73.350.5%324.2498.0
Sichuan15.534.7%47.01.8
Tianjin15.345.0%60.2-
Tibet0.03.3%0.0-
Xinjiang65.857.9%333.8237.3
Yunnan14.718.0%23.124.0
Zhejiang45.546.5%185.3-
Total1180 50582444
1 Capacity and generation figures are 2021 figures based on asset-level data. 2 Capacity factors and coal production are taken from 2019 statistics.
Table 2. Summary information on estimated coal industry employment in 2021 (B scenario), in descending order of total jobs supported by coal power generation in each province.
ProvinceJobs Supported by Coal Power Generation in the Province (Thousands)Thermal Coal Consumption (Mt)Total Jobs Supported per 10,000 Tonnes of Coal Consumed (2021)Share of Total Jobs Supported
Shandong491.2198.924.717.9%
Jiangsu451.7154.829.216.5%
Henan256.7114.422.49.4%
Hebei197.5115.317.17.2%
Liaoning172.266.825.86.3%
Anhui126.899.312.84.6%
Heilongjiang122.536.233.84.5%
Shanxi109.2131.28.34.0%
Inner Mongolia102.1256.14.03.7%
Guizhou95.658.916.23.5%
Xinjiang86.8136.76.33.2%
Guangdong54.5101.65.42.0%
Gansu49.635.314.11.8%
Jilin47.036.912.71.7%
Shaanxi44.877.85.81.6%
Ningxia39.859.86.71.5%
Hunan39.832.512.21.5%
Sichuan37.618.919.91.4%
Zhejiang36.074.24.81.3%
Jiangxi35.855.36.51.3%
Hubei32.152.26.11.2%
Guangxi27.233.38.21.0%
Fujian20.545.84.50.7%
Yunnan20.39.421.60.7%
Chongqing13.718.97.30.5%
Tianjin11.724.54.80.4%
Shanghai7.020.93.40.3%
Qinghai7.06.011.70.3%
Hainan4.87.46.50.2%
Tibet0.10.0736.20.0%
Total27422079
Table 3. Trends in coal industry employment supported by each province, 2021–2060 and change to 2030 (B scenario).
Province in Which Coal Plants Are LocatedCoal Industry Jobs Supported by Those Plants (Thousands, 2021)203020402050Change in Jobs Supported 2021–2030% Change 2021–2030
Jiangsu451,727266,90774,712424184,820−40.9%
Shandong491,171329,085127,03316,277162,086−33.0%
Hebei197,482107,54333,50961189,939−45.5%
Henan256,720166,84651,210299589,874−35.0%
Liaoning172,18387,22224,526168984,961−49.3%
Heilongjiang122,47967,11316,507215055,366−45.2%
Anhui126,76181,03230,334267745,729−36.1%
Shanxi109,16981,93332,223675627,236−24.9%
Gansu49,63436,81812,692266912,817−25.8%
Sichuan37,59325,4088158288112,186−32.4%
Jilin46,98935,72814,085-11,261−24.0%
Guizhou95,57285,96236,82511469610−10.1%
Ningxia39,82631,06713,85716068759−22.0%
Guangdong54,47246,87425,47544477598−13.9%
Yunnan20,31012,7991689-7510−37.0%
Xinjiang86,78779,47259,78552347315−8.4%
Hubei32,07126,21414,42217625857−18.3%
Zhejiang35,96930,15292458605817−16.2%
Hunan39,82434,89312,81941994930−12.4%
Shaanxi44,82341,17921,83155193644−8.1%
Shanghai70503702--3348−47.5%
Inner Mongolia102,06398,85744,98514,6083206−3.1%
Tianjin11,705934633438672359−20.2%
Qinghai700749482679-2059−29.4%
Fujian20,51918,849831413191670−8.1%
Guangxi27,19125,72314,7239611468−5.4%
Hainan482735551589-1271−26.3%
Chongqing13,69513,10187871373595−4.3%
Jiangxi35,76535,58121,65110,801183−0.5%
Tibet125125125-−00.1%
Total2,741,5061,888,033727,13393,832853,473−31.1%
Table 4. Largest 10 companies by capacity (in 2021, B scenario), with corresponding coal production capacity, and jobs and tax revenues supported by each company’s coal plants.
CompanyCapacity (GW)Coal Production (Mt/Year)Jobs Supported (Thousands)Total Tax Revenue Supported (CNY bn)
NEI/CHN Energy142.7183.0297.039.4
Huaneng117.065.0238.433.3
Datang84.88.0204.724.0
Huadian84.38.8229.423.5
SPIC67.819.3160.018.4
China Resources44.28.0124.212.8
Shandong Weiqiao Group22.40.099.87.1
Zhejiang Provincial Energy Group19.60.015.65.4
Beijing Energy Group18.81.922.55.5
Jiangsu Guoxin17.60.082.25.3
Publisher’s Note: MDPI stays neutral with regard to jurisdictional claims in published maps and institutional affiliations.

