Abstract
Electric Technology Vehicles (ETVs: hybrid, electric, and plug-in hybrid) may reach price parity with incumbent internal combustion vehicles (ICEVs) in the near future. Climate policy for transportation will depend on the degree to which consumers prefer ETVs, and price parity is a key factor. In this study, we explore the interaction between future cost reductions and the economically motivated adoption of ETVs. We construct a model of the U.S. personal vehicle market accounting for heterogenous use and vehicle preferences, in which adoption induces cost reductions that increase future market share. Model results indicate that price parity is reached for most consumers in a number of cost scenarios, but not with constant ICEV costs and modest ETV cost declines. A price parity future suggests that government support could be temporary and phased out after a successful market transition. However, if ETVs continue to be more expensive than ICEVs, then lasting government support is needed. Heterogeneity is essential to understanding the market transition: treating consumers as heterogeneous results in an ETV market share 23% higher than assuming average consumers. Future work can clarify ETV support policy by resolving uncertainty in cost trajectories and modeling dynamic and heterogenous consumer markets.
1. Introduction
Decarbonization of transportation is critical to limit global warming to 1.5 degrees C [,] and meet the 2 degrees C goal of the Paris Accords []. From this perspective, the United States (U.S.) transport sector requires rapid and sustained attention. The U.S. transport sector accounts for 28% of national emissions (i.e., 1782 million metric tons of CO2e), 60% of which is from private transportation [,]. When powered by a reasonably clean electricity grid, Battery Electric Vehicles (BEV) and Plug-in Hybrid Electric Vehicles (PHEV) emit substantially lower carbon than internal combustion engine vehicles (ICEVs) [,]. This suggests that a combination of mass adoption of electric vehicles and a switch to renewable grids is key to decarbonizing transportation.
We use the aggregate term Electric Technology Vehicles (ETVs) to refer to Hybrid Electric Vehicles (HEVs), Battery Electric Vehicles (BEVs), and Plug-in Hybrid Electric Vehicles (PHEVs). Fuel Cell Vehicles also use electric motors, with distinct technology and cost structures, e.g., Wróblewski et al., 2021 []. We exclude Fuel Cell Vehicles or alternative storage technologies in further discussion, assuming that lithium-ion battery-based and internal combustion engine-based vehicles will dominate the passenger vehicle market, at least until 2040.
The promise of ETVs to contribute to sustainable transportation has led to active research on their economic, environmental and social attributes. Barbosa et al., 2022 performed a bibliometric analysis of the literature, finding that China leads in a number of publications []. ETV applications in different transportation sectors have been studied, including freight [,,] and public transportation [,,]. This work focuses on personal vehicles. Some analysts use multi-national approaches to explore differences in ETV adoption []; here, the focus is on a detailed analysis of adoption in a single large national market (the U.S.).
ETVs are an emerging technology with a small but growing market share. In the U.S., the total number of Battery Electric Vehicles (BEVs) crossed 1 million in 2020, but the market share of plug-in vehicles was a meager 2.3%, of which BEVs were 1.3%, and Plug-in Hybrid Electric Vehicles (PHEVs) were 0.98% []. This leaves a significant majority of the market that ETVs must capture to realize broad environmental benefits. It is thus vital to better understand how and when ETVs will become market competitive.
Governments worldwide are interested in stimulating the transition to ETVs, so many subsidize their purchase and/or mandate adoption. For example, a U.S. consumer can get up to USD 7500 of federal tax credit for purchasing an electric or plug-in hybrid electric vehicle, with some states adding additional support [].
In order to clarify the potential for ETVs to become the economically preferred choice of most consumers, this work focuses on the interconnected evolution of vehicle adoption and cost. Higher costs can be a critical hurdle for emerging technology to acquire a market share. New technologies often evolve rapidly. Ideally, over time, they become more economical than the incumbent. Currently, the purchase price of ETVs is higher than comparable internal combustion engine vehicles (ICEVs), mainly due to the high cost of batteries and the electric drive train. Reductions in initial capital costs are thus needed for ETVs to be financially attractive to many consumers. The future cost of a technology depends both on its intrinsic potential and the degree to which research, development, and industrial scale-up enable the technology to reach that potential. The history of technology abounds with examples of cost reductions and adoption occurring in tandem, leading to the idea that adoption induces cost reductions by attracting research and development and contributing to learning and economies of scale in production. From that perspective, the future cost of a technology could be predicted via a model that accounts for diffusion and its interaction with technological progress. There are many previous examples of such models applied to different technologies: one direction focuses on the heterogeneity of submarkets, clarifying how adoption by a subset of consumers that benefit more from a technology leads to cost reductions, making the technology more attractive to the next group. This approach was applied to solar panels in Japan [], later dubbed “cascading diffusion”, and used for residential fuel cells []. Another group of models focuses on the behavioral aspects of diffusion, linking to technological progress to predict technological costs over time [,,].
To review the literature forecasting vehicle market futures based on the interaction of diffusion and cost reductions for ETVs, in 2012, Tran et al. published a conceptual piece arguing for the necessity of combining the two to reasonably forecast vehicle markets []. In 2017, McCollum and collaborators developed a global behavioral model for ETV, ICEV, and biofuel vehicle adoption, dividing consumers into 27 different groups (3 driver types —urban, suburban, rural; 3 technology affinity groups—early adopter, early minority, and early majority; and 3 driving pattern groups—modest, average, and frequent driver) []. Future technology costs were assumed to follow the default behavior in MESSAGE—A system dynamics model for energy systems []. Results showed that accounting for consumer heterogeneity and behavior leads to essentially no adoption of ETVs, with the market in 2100 dominated by biofuel and synthetic fuel ICEVs. In a follow-up study by the same research group, Edelenbosch et al. model social learning, the idea that consumers become more open to new technologies by interacting with other adopters []. They also developed specific models for cost reductions in ETVs. The baseline scenario for the vehicle market in 2100 was ICEVs having around an 80% share, BEVs around 15%, and fuel cell vehicles around 5%. In addition to these explicit modeling efforts, there are also many forecasts of the price and/or adoption of ETVs by consultancies, NGOs, firms, and international organizations: Bloomberg New Energy Finance (BNEF) [,,], the International Council on Clean Transportation (ICCT) [,,], UBS Consulting [], Navigant Consulting [], BP’s Energy Outlook [], as well as the International Energy Agency’s Global EV Outlook [,]. We describe these studies further in the Methods and Data section, but they do not directly bear on the research question as they do not include explicit modeling.
To set the context for this work, we address three gaps in the literature regarding the interaction of cost reductions and the adoption of Electric Technology Vehicles. First, the customer market has previously only been treated in a highly aggregated form, the most detailed dividing consumers into 27 groups []. However, other studies have shown that heterogeneity in driving patterns, vehicle preferences, and fuel costs dramatically affect the financial and environmental benefits of adopting an ETV [,,,,,,]. Thus, higher resolution of the consumer market can be crucial in identifying subgroups that prefer a technology whose adoption makes it cheaper for future groups []. The second gap is that preliminary analyses assume a single cost trajectory, despite widespread disagreement in estimates of current and future price differences between ETVs and ICEVs. Some analysts argue that ETVs will be less expensive than similar ICEVs in the near future [,,], others that ICEVs will continue to be less expensive for decades [,,]. It is essential to understand how this uncertainty in costs affects the future preferability of ETVs over ICEVs. Third, prior analyses do not capture how the evolving vehicle market will affect consumer decisions. Models are calibrated on historical behavior in a market with only a few ETV options []. One expects that consumers will be more likely to purchase ETVs once a wide variety of options is available.
To address these three literature gaps, we build a model of cascading diffusion of electric technology vehicles in the United States from 2018 to 2040 that accounts for the interaction of adoption and cost reductions. The model resolves detailed behavioral heterogeneities such as annual miles driven, type of vehicle owned, and geographical variabilities in fuel and electricity prices. The Total Cost of Ownership (TCO) is calculated for each resolved consumer group, and the diffusion model assumes consumers choose the least total cost drivetrain (BEV, PHEV, hybrid, or ICEV). Vehicle cost is resolved for four generic vehicle types (sedan, SUV, minivan, truck), and technological progress for ETVs is modeled via experience curves, which predict cost as a function of the cumulative adoption of a technology [,]. We analyze how uncertainty in current electric vehicle costs, cost increases in internal combustion engines, and learning rates affect future market outcomes through scenario analysis. We further investigate how federal tax credits for electric vehicles could play a role in realizing lower costs and a higher market share for ETVs.
This work directly addresses each of the three research gaps: for heterogeneity, we use 309,000 households’ responses to the 2017 National Household Travel Survey (NHTS) to model the differences in vehicle use (miles driven), vehicle type, and lifetime preference among consumers in high resolution. We also use state-level resolved data on gasoline and electricity prices, affecting operating costs. Combining these variabilities results in wide distributions in cost of ownership and carbon savings from purchasing an ETV []. This is important because annual vehicle mileage varies widely: while the average U.S. annual miles driven is 11,700 miles (18,830 km), 5% of vehicles drive less than 1400 miles (2250 km) in a year, and another 5% drive more than 26,000 miles (41,843 km) [,,]. Our analysis treats national adoption in terms of 309,000 distinct consumer types, compared with 27 consumer groups in prior work [].
The second literature gap addressed is disagreement regarding estimates of the current and future prices of ETVs and ICEVs. We do not attempt to develop “better” cost estimates here; this would involve detailed vehicle teardowns, a venture beyond the current scope. Instead, we undertake a literature review to understand the disagreement surrounding existing estimates, develop vehicle price scenarios, and run the integrated model using these different scenarios. This clarifies how disagreement among cost estimates affects the future ETV market. While the current price difference between ETVs and ICEVs is knowable in principle, analysts disagree substantially in practice. An accurate figure for the current price difference is important because experience curve model outcomes for future prices strongly depend on the starting point. Bloomberg New Energy Finance reports the additional cost of a BEV-100 sedan as USD 7400 [,,], while analysis by the International Council on the Clean Transportation (ICCT) reports the same cost as USD 10,700 [,,]. While this difference may seem minor, it results in significant differences in projected adoption, as discussed later. The future price of the incumbent technology (ICEVs) is also an essential yet uncertain factor. Analysts argue that meeting increasingly stringent emission regulations leads to increases in ICEV cost. A BNEF report estimates an annual increase in ICEV price of 0.7% for sedans [,,]. Brennan et al. 2016 and collaborators estimate the annual price growth in ICEV as 0.46% []. The two results, when compounded over time, differ substantially. Furthermore, note that ICEV price increases are challenging to accurately forecast given that they depend on future regulatory decisions and the reaction of automakers and consumers to changing circumstances.
The third literature gap addressed is how the expanding availability of ETV models might affect their market preferability. Discussed further in the Data and Methods section, there are many types of diffusion models, including discrete choice, agent-based, and others [,,,,,,,,,,,]. Prior diffusion models forecast future purchase behavior calibrated on historical data [,,,,,,,,,,,]. The problem is that historically, few ETV models have been available compared to ICEVs, limiting consumer choices on essential attributes such as brand, vehicle type, and styling. Recent trends indicate rapid changes in the ETV market. In the U.S., the number of battery-electric models increased from 14 in 2015 to 30 in 2021; the number of plug-in hybrid electric models increased from 13 PHEVs in 2015 [] to 26 in 2021 []. Looking to the future, automaker General Motors recently announced a goal of phasing out internal combustion vehicles in their lineup by 2035 []. Consumers having ETV options for basically any model will presumably increase market share by reducing the number of consumers who avoid ETVs because the style, size, or brand does not suit their preferences. Historically calibrated and stated preference-based models thus face challenges in forecasting behavior in a rapidly evolving set of market choices. In this work, we do not solve the modeling challenge of predicting the co-evolution of the ETV market and consumer preferences. Instead, we offer a contrasting perspective: Assume a market in which there are ETV and ICEV versions of all vehicles and that consumers choose a drivetrain that minimizes their Total Cost of Ownership (TCO). Consumers generally choose vehicles based on multiple attributes. However, suppose any vehicle design is available in all drivetrains (BEV, PHEV, ICEV). In that case, as it would be in a more diverse market, the total cost of ownership is a significant factor in that choice [,]. We do not assert that forecasting diffusion based on a future model selection and cost of ownership is necessarily superior to historical projections. We argue, however, that a Total Cost of Ownership-based adoption model is a reasonable choice that provides valuable information about the economic potential of ETVs.
Section 2 of the manuscript summarizes the data and methods used. The scale and sophistication of the model requires that much of the detail appears in the Supplemental Information. Results are presented in Section 3, which include the cost reductions in lithium batteries in different cost scenarios, the evolving share of ETVs in the vehicle market and the cost per vehicle adopted in different government subsidy scenarios. The Discussion (Section 4) offers perspective on results of the model and compares with prior results, and the Conclusion section (Section 5) explores implications for policy- and decision-makers.
2. Materials and Methods
Figure 1 shows the overall flow of the integrated model (larger grey boxes) and details of the structure within each model module (blue boxes). To summarize the model at a high level, three sub-models interact (the Financial Model, the Market Allocation Model, and the Technology Progress Model) in order to predict U.S. adoption of ETVs and ICEVs from 2018 to 2040. Similar to a system dynamics model [], the model runs through annual iterations, with each sub-model feeding information to the next. The Financial Model, described in Section 2.2 below, combines consumer attributes such as annual miles driven with vehicle attributes (initial cost, fuel economy, etc.) to estimate the Total Cost of Ownership for each vehicle option for each consumer. This information is sent to the Market Allocation Model, described in Section 2.3, to determine which consumers purchase a new vehicle and if that purchase is a conventional ICEV, hybrid, PHEV, or BEV. Consumers go to the vehicle market at the end-of-life of their current vehicle, determined by the age of their vehicle and information on their lifespan preference. The consumer purchases the least cost option from the Financial Model, assuming it is available (see Section 2.3 for discussion of market caps for new technologies). Summing over annual purchases of all consumers results in national sales of ICEVs and each ETV type in that year. The cumulative sales of ETVs are fed into a Technological Progress Model, described in Section 2.4, that determines the cost reduction in the next year using an experience curve model. An experience curve model presumes that each doubling of production results in fixed percentage of cost reduction and the resulting learning rates are calibrated from historical data. Conventional ICEVs increase in price due to increasing stringency of fuel efficiency rules such as CAFE standards []—this is termed the “ICEV Cost Premium”. The cost changes then feed into the next year’s loop, and this is repeated annually from 2018 to 2040.
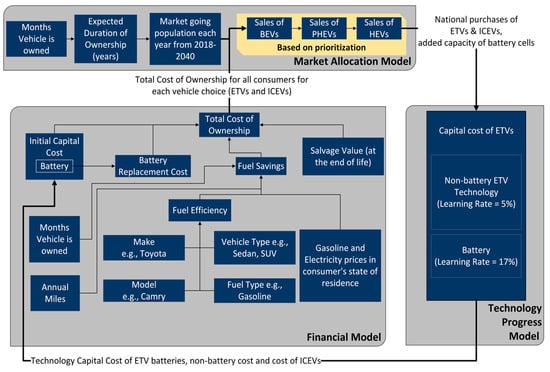
Figure 1.
Method to model future prices and adoption of Battery Electric Vehicles (BEVs), Plug-in Hybrid Electric Vehicles (PHEVs), Hybrid Electric Vehicles (HEV), and Internal Combustion Engine Vehicles (ICEVs), in the U.S. from 2018 to 2040. The three sub-models are the Financial Model, the Market Allocation Model, and the Technology Progress Model, which are run in annual loops: The Financial Model (Section 2.2) calculates the Total Cost of Ownership of each vehicle type for each consumer. This information is sent to the Market Allocation Model (Section 2.3), which uses each consumer’s vehicle lifetime to determine who purchases a new vehicle that year, then determines which vehicle type (ICEV, BEV, BHEV, or HEV) they purchase, according to least cost. National purchases are accumulated for that year and used in the Technological Progress Model (Section 2.4) to determine cost reductions for the next year, using an experience curve. Multiple sources are used to develop this model. The geographical (state of residence i.e., fuel prices) and behavioral heterogeneities (annual miles, months vehicle is owned, vehicle make and model) come from the U.S. National Household Travel Survey []. The fuel economy [] and fuel prices [,,,] come from different sources. Similarly, the capital costs of technologies [,,,,,,,,,] and learning rates of battery cells [,,,,] and non-battery technologies [,,,,,] come from different sources.
The Market Allocation Model has consumers purchase the least cost drivetrain. This approach may seem simplistic given evidence from prior literature indicating that vehicle choices are complicated and multi-attribute. Many analysts have chosen to account for this complexity using multivariable discrete choice models [,,,,,,,,,,]. However, it is crucial to note that the vehicle market is evolving rapidly, with expanding selection and improving performance of ETVs. Increasingly, consumers can choose from vehicles that are otherwise similar except for drivetrain, e.g., consider Toyota Camry, Hyundai Sonata, and Prius options that differ only by drivetrain. We thus hypothesize a future vehicle market where drivetrain technology can generally be selected as an option, with other attributes remaining similar. Ideally, an integrated model could describe both the temporal evolution of offerings on the vehicle market and the multi-attribute nature of consumer decisions. Developing and validating such a model is beyond the current modeling scope; the objective here is to investigate the potential scale of effects of heterogeneity and cost uncertainty on ETV market evolution. We provide details on the modeling below, with additional equations and data inputs explained in the Supplemental Information (SI).
2.1. Prior Diffusion Models
The modeling of the adoption of electric vehicles is most commonly done using consumer-level choice modeling (discrete choice model, consumer choice model, or an agent-based model). There are three general methods used to model EV adoption/diffusion, listed in Table 1. In terms of the number of publications, the most common method is discrete choice models [,,,,,,,,,,]. Many of these studies have used the nested multinomial logit model along with multivariate regression models. It is also common to use stated-preference surveys of consumers to model the consumers’ preferences towards ETVs.

Table 1.
Prior literature and methods used to forecast Electric Technology Vehicle (ETV) adoption/diffusion.
A Bass diffusion model for adoption assumes that the process of uptake of new products by a population is S-shaped (or similar) [,]. These models formulate how aggressive early adopters and potential later adopters of a technology interact based on probability distributions and survival functions. The Bass diffusion models implicitly divide the population into segments of early and late adopters as a function of the perceived “risk” of adoption of a technology. In contrast to “bottom-up” discrete choice models that develop adoption based on individual survey responses, Bass diffusion models directly forecast future adoption after calibration using a time series of historical adoption data.
Another approach to EV adoption is system dynamics modeling. In system dynamics models, there is a feedback loop in which state changes are induced due to the adoption of a technology by a subpopulation. Moreover, this feedback typically triggers more consumers to adopt the new technology in the next iteration. However, the technology adoption decision is modeled differently in different studies. For example, McCollum et al. treated ETV choice as an economic decision modified by a monetized “risk” factor reflecting a consumer’s preference or aversion to new technology [].
2.2. Financial Model
We use a TCO-based model for the reasons described in the introduction. Total Cost of Ownership (TCO) is a method for calculating the present value of direct and indirect costs associated with a purchase [,]. In this case, the TCO constitutes initial capital costs (), discounted fuel savings () for the duration of ownership, discounted battery replacement costs (), and the discounted salvage value () at the end of ownership, as summarized in Equation (1).
Each of these four cost factors involves a significant modeling effort that cannot be completely conveyed in a brief format. Vehicle capital cost (CC) is based on historical data that is adjusted by technological progress in batteries/electronics for ETVs, ICEV cost premiums, and the size of the vehicle (details below and in Section S1.6 of the SI). Fuel Savings (FS) result from calculations of gasoline and electricity use of all vehicle types, along with state-differentiated gasoline and electricity prices (details below and in Section S1.5 of the SI). PHEVs can use both fuel types and are assumed to fully charge the battery once a day and to deplete the battery before switching to gasoline. Additional battery costs (BC) are the costs related to battery replacement during the operating life of the vehicle. This may or may not occur and is based on battery cycling: batteries are assumed to have a lifetime equivalent to 2800 complete cycles (for more detail see Section S1.4 in the SI). Finally, salvage value (SV) is based on an empirical analysis of vehicle salvage values as a function of ownership duration (for more detail see Section S1.3 in the SI) []. Time discounting is applied to all costs and benefits.
In evaluating the purchase of an ETV, we assume consumers keep the same make, model, and type as their previous vehicle. We model four technology options: 1. Updated Conventional Vehicle (Internal Combustion Engine Vehicle-ICEV), 2. Hybrid Electric Vehicle without plug-in capability (HEV), 3. Battery Electric Vehicle (BEV), and 4. Plug-in Hybrid Electric Vehicle (PHEV). We define ‘updated conventional vehicle’ as the newest version of the vehicle the consumer currently owns. We assess the economic implications of purchasing an ETV by comparing the ETV with the updated conventional vehicle. A discount rate of 7% is assumed, a value commonly used in vehicle TCO calculations [,,,,,,] as well as suggested by the U.S. Office of Management and Budget []. The salvage value is estimated as a function of years of ownership (Equations (S2)–(S4) in the SI) []. There are other methods to estimate the salvage value. For example, Wróblewski, P. et al., 2021 have a residual rate adjustment factor and have considered the residual values in the battery pack as a prime driver for the salvage value of an ETV [].
The U.S. National Household Travel Survey (NHTS) is used as the primary data source for driver and vehicle characteristics, which includes vehicle holding characteristics for each surveyed household (a total of 309,000 households and 143,000 vehicles) []. The model considers the state-level differences (i.e., the geographic heterogeneity) in gasoline and electricity prices. The model also accounts for the individual-level differences in miles driven, type of vehicle owned (sedan, SUV, minivan, and truck), and lifetime ownership preferences to estimate the economic benefits of electric technology vehicles (hybrid, plug-in hybrid, electric) in the U.S. (i.e., behavioral heterogeneity). Collectively, these inherent heterogeneities are referred to as the demand-side heterogeneities in the U.S. private transportation sector.
As discussed earlier, we assume a developed ETV market in which there is a reasonable analogous ETV option for any current vehicle model. Therefore, we model ETV choice as a differential technology “upgrade” to currently-sold conventional vehicles. This leads to modeling incremental cost additions of each technology type (HEV or BEV, or PHEV) for each vehicle class (sedan, SUV, van, and truck). Using prior models [,,] of ETV characteristics and costs, we have designed technical and performance specifications and cost estimates for ETVs based on a typical conventional vehicle for each vehicle class. The technical and performance specifications of the designed vehicles are described in the SI document and the SI Excel sheet.
Two BEV ranges are modeled: 100 miles (160 km) and 150 miles (241 km). Consumers who drive more than 150 miles daily may only choose HEV and PHEV technologies. This model assumes BEVs with ranges of 100 and 150 mainly because the day trip analysis based on NHTS showed that 83% of the daily vehicle miles traveled (VMT) are under 60 miles (97 km), and 95% are under 120 miles (193 km) []. We assume that a consumer will first operate on electricity for PHEVs until the battery is drained and then switch to gasoline. Our model simplifies driving patterns to assume that consumers drive their average each day. This assumption neglects consumers’ daily variability and ignores households owning multiple vehicles and selecting different vehicles for different trips.
Additional Cost of ETVs
The additional cost of an ETV includes the battery cell costs and the non-battery electric vehicle (EV) components costs. These non-battery components include an electric motor, transmission and integration, control unit, onboard charging unit, regenerative braking, and wiring. Relative to an internal combustion engine vehicle, EVs are credited for removing the internal combustion engine and related mechanical components.
The cost of an ETV is calculated for each vehicle type based on the technical specifications (for example, battery size and power of the electric motor), which are designed by matching characteristics to the conventional vehicles. The battery capacity and the electric motor power requirements are scaled for each vehicle type, and they dictate the total cost of battery and electric motor, respectively. For example, a sedan with a 100-mile range has a battery of 27 kWh and an electric motor of 131 kW power, while a 100-mile range SUV needs a 34 kWh battery and a 142 kW motor. We use the per-kWh price of the battery and the per-kW price of the electric motor and other components such as the onboard charger to estimate the additional cost of the technology. In addition to capital costs, an industry markup factor of 1.46× from cost to price is assumed for all vehicle components [].
Cost reductions are often characterized using experience curves, which assume a fixed cost reduction for each doubling of cumulative production, the learning rate. Previous studies have applied the experience curve model to various energy technologies, including solar panels, wind power, and coal (see Macdonald et al. [] and Rubin et al. [,] for reviews). Experience curves have also been applied to lithium batteries used in electric vehicles [,,,,,], with learning rate estimates in the range of 8–17%, with recent literature indicating 16–19% [,,,,]. Costs of non-battery technologies in electric vehicles, such as electric motors and power electronics, are less well-studied [,,,,,,], though prior studies suggest learning rates ranging from 5% to 17%.
Battery Cell Price: There are many prior analyses, reporting a wide range of battery pack prices. Some of the literature estimates battery cell price and battery pack price separately. Along with lithium-ion (Li-ion) battery cells, there are components such as the battery management system (observes the output of each battery cell group), battery thermal management system (maintains operating temperature of the battery within the desired range), and related pack assembly (such as module frames, steel pack case, covers, inside wiring and electronics, etc.) which constitute a typical battery pack [,,]. We work up from battery cell price per kilowatt-hour (USD per kWh) for this study. We used USD 230 per kWh as the initial battery cell price in 2017. This price is in line with various estimates for the year 2018 from previous studies [,,] and reports such as Bloomberg New Energy Finance (BNEF) [] and the Joint Technical Support Document from the U.S. Environmental Protection Agency (US-EPA) []. However, it is also important to note some studies reported lower current battery cell prices (USD 145–159 per kWh [,,]), but we considered these as outliers.
Non-Battery EV Technology Costs: Non-battery ETV components are also important, and depending on the assumed model, they can be more expensive than batteries. The relevance of non-battery costs in ETVs will only grow as battery costs continue their rapid decline. For this analysis, we use bottom-up cost models to estimate the additional cost of the ETV (HEV, BEV, and PHEV) technologies over ICEVs. Noteworthy models available in the literature are from National Renewable Energy Laboratory (NREL) [], Wu and collaborators [], Argonne National Laboratory (ANL) [], and the National Research Council (NRC) [,]. All of these cost models are based on older consulting reports [] for their assumptions about non-battery costs such as wiring, hybrid transmission, and integration, etc. [,]. A report from UBS Consulting produces a detailed teardown cost model of a Chevrolet Bolt [] but did not treat other vehicle types, i.e., PHEVs and HEVs. Therefore, we used a combination of NRC reports [,] and Kromer et al., 2007 [] for crucial component costs such as wiring and derived the additional cost of HEVs.
Due to broad disagreement between analyses and the lack of a single authoritative study, we used two different cost models, each representing an extreme of non-battery EV technology cost assumptions. The High Non-Battery Cost Model is based on the International Council on the Clean Transportation (ICCT) report [] as the primary source. The model has comparative cost models for BEVs and PHEVs based on the bottom-up cost approach and contains component-wise costs. Secondly, the Low Non-Battery Cost Model is based on Bloomberg New Energy Finance (BNEF) [] projections. The Low Non-Battery Cost Model does not provide a component-wise breakdown of the costs but is a frequently referenced model in the EV research community. These two models generally agree on the cost of batteries but differ with respect to other components’ costs and cost trajectory.
High Non-Battery Cost Model: This model is a bottom-up cost estimation based on the ICCT report [] and the NRC report [,]. The non-battery EV components considered in this model are the electric motor, EV transmission, power electronics, wiring, regenerative breaking, control unit, onboard charging unit, and ICEV credits, which account for engine downsizing and replacing mechanical components in an ICEV by an electric drivetrain. The size and cost of the electric motor are estimated with respect to the type of the vehicle (for example, a sedan vs. an SUV). The ICEV credits are also determined based on the engine size.
Low Non-Battery Cost Model: This model, as mentioned above, is based on BNEF data []. As we are considering only the additional costs, we have excluded the vehicle chassis and assembly costs (BNEF has assumed them to be constant in the model). BNEF has developed the manufacturing cost of the BEV with three main components: Battery Pack, Powertrain (including an electric motor, inverter, electronics, etc.), and Vehicle chassis and assembly. The powertrain costs and corresponding power ratings are extracted from the BNEF report, and a straight-line equation is generated for powertrain costs (USD) as a function of power ratings (kW) of EV technology variants. The powertrain costs are calculated using the ratio of power ratings of respective PHEV and ICEV engines for PHEV variants.
For example, the additional cost calculated for a BEV sedan with a 100-mile range as per the High Non-Battery Cost Model is USD 10,745, versus an additional cost of USD 7437 for the Low Non-Battery Cost case. This includes 27 kWh of battery, and the powertrain costs for 131 kW of power output in both cases. These calculations and those for other vehicle types are attached in the detailed excel sheet in the SI.
2.3. Market Allocation Model
Identifying Purchasing Consumers for Each Year: One vital function of the Market Allocation Model is to identify the consumers “going to the market” for the year. We calculate the purchase year and subsequent purchase year for each consumer using the expected duration of ownership. The expected duration of ownership is the period for which a particular consumer uses their vehicle. The NHTS does not report the expected duration of ownership for a vehicle. Therefore, we use the observations of the number of months the vehicle is currently owned and derive the expected duration of ownership. It is obtained through a random generation conditional upon the probability distribution of lifetime and survivor function, given how long consumers have owned their current car, see Figure S1 in the SI. For example, if a consumer has an expected duration of ownership of 7 years and has owned their vehicle for three years (purchasing it, for example, in 2014), they will go to the market after four years (2021). The same consumer will be in the market to replace the vehicle again in 2028. The expected duration of ownership determines the vehicle lifetimes used in calculating the total cost of ownership and the salvage value. Note that the duration of car ownership—explained in the SI—varies by consumer (seven years on average with a standard deviation of 3.6 years). We follow a similar process for each consumer to determine their first purchase year and then subsequent purchase year. Once these market-going consumers are recognized, the Financial Model calculates each consumer’s Total Cost of Ownership.
The Market Allocation Model suggests the number of U.S. consumers who would prefer to purchase an ETV. However, supply may be constrained by the ability of the industry to grow to meet demand. We thus impose a cap on ETV production growth, assuming that the total number of BEVs and PHEVs sold each year increases at most 50% from the previous year. This cap is informed by a recently published report by UBS Consulting also estimates the growth rate as 47% in their most optimistic penetration scenario [].
2.4. Technological Progress Model
Cost reductions for ETVs are modeled using an experience curve. The experience curve was first used to describe the cost reductions in aircraft manufacturing []. It has been used in various energy technology studies and is shown in Equation (2) [,,,,].
‘’ represents the cumulative adoption of the said technology, ‘’ is the price per unit (), ‘’ and ‘’ are initial cost and production capacity, respectively. Finally, ‘’ is known as the learning coefficient and is a positive empirical constant. The initial capacity of battery cells and the number of BEVs and PHEVs—used for the experience curve of non-battery EV components—are calculated and are available in the SI Excel sheet. The learning rate (LR) is given by
and denotes the fractional reduction in the cost for every doubling of production. The historically produced battery capacity is over 33 million kWh based on average battery size and the stock of BEVs (402,000) and PHEVs (361,000) in the U.S. in 2017 []. The installed capacity of the non-battery EV technologies is considered to be equal to the total number of BEVs and PHEVs, i.e., one per vehicle. The calculations are attached in the SI Excel Sheet. The learning rates for batteries in ETVs are taken to be 17%, with 5% for non-battery ETV components such as electric motors. This is based on literature analyzing historical data on cost reductions, see SI Sections S1.6.2 and S1.6.3 for details.
As discussed in the introduction, some analysts argue that more stringent environmental regulations will increase the cost of ICEVs. In the base case, we estimate the ICEV Cost Premium is an annual 0.6% increase [,,,,] based on prior literature. However, we study the importance of this assumption in the sensitivity analysis. For details, see the Supplemental Information, Section S1.7. Forecasts for future fuel efficiencies of ETVs and ICEVs are described in Supplemental Information, Section S1.7.
There are various caveats and assumptions associated with the model, some described previously, and for a more detailed discussion, see Section S3 in the SI.
3. Results
Given a set of cost assumptions, the model from Section 2 forecasts annual sales of ETVs and ICEVs, and future prices of batteries and non-battery components of ETVs. Figure 2 shows the evolution of battery cell prices over time (a function of adoption) with and without consideration of consumer heterogeneity (for the case of High Non-Battery Costs and an 0.6% annual ICEV Cost Premium). Figure 2 indicates much lower future battery costs for ETVs when considering consumer heterogeneity. This is because including heterogeneity identifies a minority of consumers who can still benefit from relatively expensive ETVs. This results in higher initial adoption, driving cost reductions and further adoption in the process of cascading diffusion.
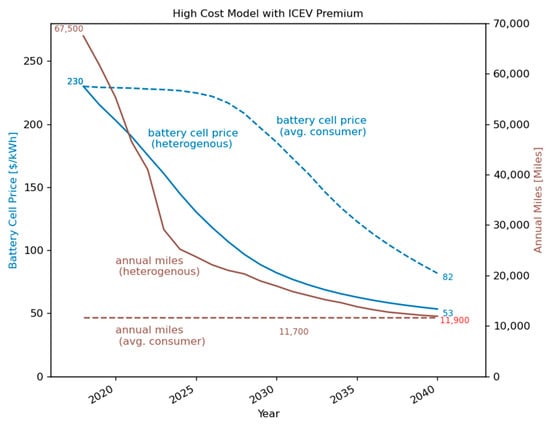
Figure 2.
Forecast battery cell price (USD per kWh, blue lines and left axis) and Average Annual Miles (brown lines, right axis) driven by consumers adopting ETVs, accounting for heterogeneity (different miles driven, lifetime, and fuel prices) in consumer behavior (solid lines) versus non-heterogeneous (average) consumers (dashed lines). All results assume the High Non-Battery Cost Model with ICEV Cost Premium, gasoline price = USD 2.60/gallon (EUR 0.65 per liter). Note that accounting for heterogeneity leads to more rapid cost reductions by identifying early sub-populations that benefit from and thus prefer BEVs, PHEVs, or Hybrids over ICEVs. The annual miles driven for early-adopting subpopulations are significantly higher than the average consumer’s annual mileage (11,700 miles = 18,800 km). As battery costs fall, ETVs become economically attractive to more consumers, eventually being preferred by almost all drivers by 2040. In contrast, assuming that all consumers are average implies that adoption of ETVs and resulting cost reductions are slower. (HEV = Hybrid Electric Vehicle, BEV = Battery Electric Vehicle (BEV), PHEV = Plug-in Hybrid Electric Vehicle, ICEV = Internal Combustion Engine Vehicle).
Figure 2 also shows the average annual mileage of the consumers that purchase an ETV. Moreover, it is evident that the average annual miles of the subpopulation that adopts an ETV is significantly higher (67,500 miles, i.e., 108,600 km for the year 2018) than an average consumer’s annual mileage (11,700 miles, i.e., 18,800 km). The average annual mileage of those choosing an ETV declines rapidly over time, showing that cost reductions for batteries and powertrain electronics rapidly broaden the pool of consumers that benefit from ETVs. As shown in the figure, when heterogeneity is included in the model the average annual miles of consumers moving to an ETV falls from 67,500 miles (108,600 km) to 11,900 miles (19,150 km), at which point ETVs are preferred by almost the entire population. The stark differences in results for heterogenous versus non-heterogenous modeling of consumers demonstrates the important interactive effects of technology progress and heterogeneity: Adoption is much faster and higher overall when both are considered together. A critical part of these results is also to understand that there is adoption of ETVs even in case of average consumers, this adoption is a result of the ICEV cost premium which represents conventional vehicles getting more expensive over time, and hence the financial outlook of ETVs improves compared to ICEVs, resulting in ETV adoption.
Figure 3 shows the market share of technologies if heterogeneities are accounted for in the case of the High-Cost Model with ICEV Cost Premium of 0.6% per year (same assumptions as blue line in Figure 2). With these assumptions, BEV adoption grows from a few percent of the market today to over 90% of the market in 15 years.
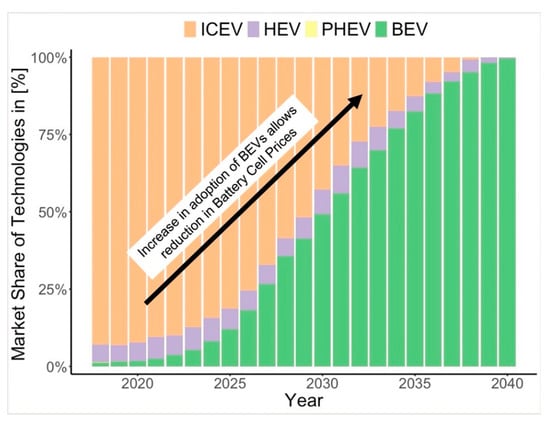
Figure 3.
Future annual market share of vehicle technologies for the case of the High Non-Battery Cost Model with ICEV Cost Premium, with heterogeneous consumers (HEV = Hybrid Electric Vehicle; BEV = Battery Electric Vehicle; PHEV = Plug-in Hybrid Electric Vehicle; ICEV = Internal Combustion Engine Vehicle). Note that PHEV adoption is small enough to be invisible in this set of results.
3.1. High Non-Battery Cost vs. Low Non-Battery Cost Model
As discussed in the introduction, while there is a reasonable consensus on battery costs, sources disagree on the non-battery costs of ETVs. These differences led to the development of the Low and High Non-Battery Cost scenarios described in Section 2.2. There is also uncertainty about future cost increases in ICEVs. Figure 4 shows how a vital model outcome, the additional cost of a BEV-100 sedan relative to an ICEV sedan, varies under different scenarios. For Low Non-Battery Costs and ICEVs becoming more expensive, BEVs will reach price parity (BEV-100 price = ICEV price) in 2025. The price parity point is pushed out further in other scenarios, to well beyond 2040 in the case of High Non-Battery Costs and no ICEV cost increase. These results indicate that uncertainty in these seemingly minor variables can strongly affect forecasts of the future of ETVs.
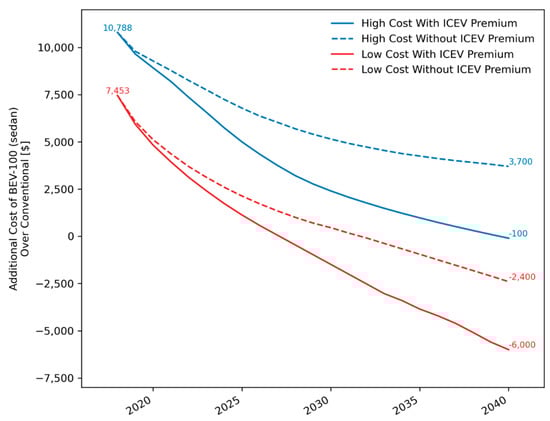
Figure 4.
The additional capital cost, over time, of a BEV 100-mile (160 km) range sedan versus “equivalent” ICEV, in four cost scenarios (combinations of Low and High Non-Battery Cost and with and without ICEV Cost Premium, gasoline price = USD 2.60 per gallon = EUR 0.65 per liter), with heterogeneous consumers. A value of zero indicates upfront cost parity for BEVs. Results show that uncertainty in current BEV cost and future ICEV cost lead to very different trajectories for cost parity. (BEV = Battery Electric Vehicle; ICEV = Internal Combustion Engine Vehicle).
3.2. Impact of Fuel Prices
Expected future gasoline prices are critical in the evolving economics of ETVs. Therefore, we conducted a multivariable scenario analysis where we considered all combinations of the Non-battery Cost Model, ICEV Cost Premiums, and three levels of gasoline prices (Figure 5). The figure shows the battery cell price over time (in USD per kWh) as a single representative metric that stands in for cumulative sales of ETVs. For the High Non-Battery Cost Model with the gasoline price of USD 1.95 per gallon, the ICEV Cost Premium significantly impacts adoption and battery cell price reductions. If the gasoline price stays low and the ICEVs do not get more expensive, ETVs will never be financially attractive to most consumers. In this case, the replacement of incumbents with ETVs is not significant, and the battery cell price reduces only slightly from USD 230 per kWh to USD 213 per kWh.
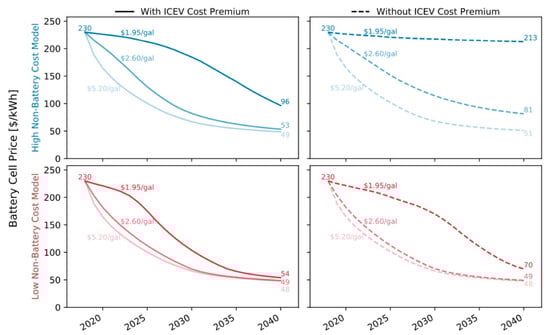
Figure 5.
Reduction in battery cell price (USD/kWh) over time for scenarios with different gasoline prices, non-battery cost, and ICEV Cost Premiums, with heterogeneous consumers. For the Low Non-Battery Cost Model, ETVs are adopted, and battery prices fall quickly regardless of gasoline price and ICEV Cost Premium. For the High Non-Battery Cost scenarios, low gasoline prices lead to high battery costs and low market share in 2040 (1 USD/gallon = 0.25 EUR/L).
On the other hand, if it is assumed that the conventional vehicles get more expensive with time, then battery cell price falls from USD 230 per kWh to USD 96 per kWh even at the lower gasoline price of USD 1.95 per gallon. This shows the importance of understanding future price increases for ICEVs (presumably to accommodate more efficient technologies required to meet the stricter environmental regulations such as CAFE standards). If gasoline prices are low, then the economics of ETV cascading diffusion are favorable only if conventional vehicles get more expensive. If gasoline prices are high (USD 5.20/gal), then any assumptions about non-battery costs and ICEV premiums lead to a similar outcome with high ETV adoption.
3.3. Effect of Gasoline Prices and ICEV Cost Premium
As discussed above, both gasoline prices and assumptions about ICEV Cost Premiums can drastically affect BEV adoption in the High Non-Battery Cost Model. Figure 6 shows the total market share of BEVs plus PHEVs in 2040 under different High Non-Battery Cost Model criteria. An annual increase of 0.6% in the ICEV prices indicates the base case assumption, which is varied down to 0% (representing constant inflation-adjusted capital costs for ICEVs). At low gasoline prices and without increases in ICEV prices, ICEVs are always the economical choice for consumers, meaning that the virtuous circle of cascading diffusion may never take off (at least when only the personal financial benefits of consumers are considered). A more favorable outlook is possible if gasoline prices increase in the future. As a result, the share of BEVs and PHEVs increases substantially in the 2040 market, even without any increase in ICEV Costs. The scenarios where BEVs and PHEVs dominate the market (80+%) by 2040 occur when gasoline prices are similar to or higher than 2017 values, and there is some increase in ICEV prices. While this analysis is purely economic and does not include government support for the emerging ETV technologies, it does point out which techno-economic scenarios naturally support rapid ETV adoption and which scenarios present headwinds (and potentially continual ones) to the development of the market.
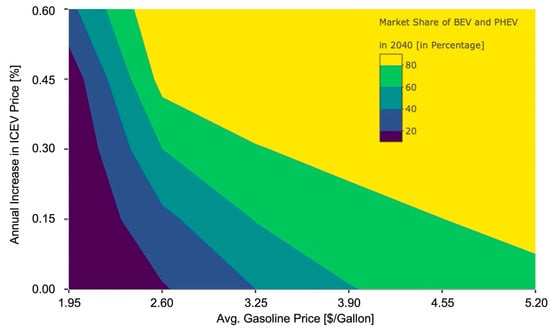
Figure 6.
Market share of BEVs and PHEVs in 2040 for High Non-Battery Cost Model with variable gasoline price and the annual increase in conventional vehicle price (ICEV Cost Premium). At lower gasoline prices and without ICEV Cost Premium, BEVs and PHEVs remain more expensive than conventional vehicles. Expensive gasoline and/or ICEV cost increases will lead to a significant market share for BEVs and PHEVs in 2040 (1 USD/gallon ≈ 0.25 EUR/L).
3.4. Adoption Benefits of Subsidies
The integrated model can also be used to evaluate the U.S. federal subsidy [] for BEVs and PHEVs. The additional stimulated adoption can be estimated by comparing ETV adoption with and without subsidy. Results are shown in Table 2 for differing lengths of subsidy. The induced sales by a subsidy are a measure of its effectiveness. The government cost per sale is the ratio of total subsidy expenditure paid over its term to the induced sales. In the Low Non-Battery Cost scenarios, the subsidy appears as an expensive intervention, as high as USD 18,000 per vehicle, because the model has many consumers buying ETVs without any subsidy. The government ends up paying “free riders” - those who would have purchased ETVs anyway. The subsidy is most economically effective in the High Non-Battery Cost scenario without an ICEV Cost Premium, e.g., a government cost of USD 800 per additional ETVs adopted for a 3-year subsidy. This number (USD 800) is much lower than the direct USD 7500 per vehicle subsidy because that subsidy stimulates early cost reductions, which induce later consumers to buy, meaning that each direct adopter that receives the subsidy eventually causes almost ten additional indirect adopters due to technological progress.
Table 2.
Impact of federal subsidies (which vary by battery size up to USD 7500, reflecting current U.S. policy) in inducing the sales of ETVs. The first column shows the cost model used to estimate the non-battery EV technology costs. The second column indicates the duration of the federal subsidy. The other columns show the total sales of BEVs and PHEVs, additional ‘induced’ sales because of federal subsidies, and cost to the government per induced sale, when ICEV Cost Premium is present or not. (‘M’ indicates ‘millions’).
3.5. Caveats
In this section, we discuss some of the modeling simplifications and assumptions. Firstly, we assumed a developed ETV market in which a drivetrain choice is an option and then modeled the consumers’ choice of drivetrain solely due to net economic benefit (i.e., the NPV). Past analyses have conflicting results on how much fuel efficiency affects consumers’ purchase decisions, some indicating an effect [,,,,] and others finding that consumers undervalue paying more to receive energy savings now []. We justify this simplification by arguing (1) it is a valuable counterpoint to preliminary analyses that detail multi-attribute preferences but are static in treating future vehicle choices, and (2) the treatment is sufficient to illustrate the main points, i.e., how detailed treatment of heterogeneity and uncertainty in vehicle costs could influence market outcomes.
Second, we treated the U.S. vehicle market as independent of activities in other nations. The potential problem with this simplification is that vehicles are produced via a global industry; if other countries adopt ETVs faster or slower than the U.S., this affects the learning rates experienced from the U.S. perspective []. The model’s implicit assumption is that the rest of the world will adopt ETVs at a similar rate to the U.S. If the rest of the world adopts at a slower rate, this lowers the local pace of cost reductions, reducing the progression of ETV markets. If the rest of the world adopts at a faster rate, ETV markets will progress faster. In either case, the qualitative conclusions from the modeling would be the same: that heterogeneity is essential to market progression and outcomes depend on improved resolution of vehicle cost details. A future global heterogeneous model would be of great value, though building such a model would require significant resources.
Third, the model assumes that the consumers will have at least a home-charging (or level 1) option available to charge their vehicle at least once, mostly overnight. Although charging infrastructure is growing, only 50–60% of the population currently has access to charging stations [,]. To address current limitations on charging infrastructure, we performed an additional sensitivity analysis assuming only 50% of the population will have access to charging, and only this section of the population will be able to adopt a BEV. This analysis is added in the Supplemental Information.
The future growth of access to charging stations is both unknown and unpredictable. The availability of charging stations and BEV adoption is quintessentially a ‘chicken-and-egg’ problem, and it is hard to know how the market will evolve. Recent trends suggest charging infrastructure is growing rapidly, e.g., public fast charging ports in Washington D.C. increased by more than seven times from 2017 (720) to 2020 (6080), and in the same period, the level 2 public charging ports have increased by more than four times []. Therefore, as the public charging infrastructure grows, consumers could potentially charge a BEV without a charger at home.
We also neglected the impacts of terrain and extreme temperature [] on the performance of ETVs, mainly due lack of information. Even though our model accommodates the entire population of the U.S., the primary data source of NHTS does not include additional information about consumers’ daily operating conditions and/or the temperatures the consumers might have experienced.
With respect to CAFE standards, it has been found that the automakers may be able to sell more conventional vehicles for every ETV sold []. However, in our analysis, as we do not focus on a particular manufacturer, we do not consider such a fleet-level response by manufacturers that are constrained by current policy.
We assumed the cost trajectory of Li-ion batteries is a function of ETV adoption. While the ETV market is expected to dominate demand for Li-ion batteries for decades, there are other Li-ion applications, such as stationary energy storage. These other markets could increase demand of Li-ion batteries, inducing additional cost reductions. It is also possible that the ETV battery cost trajectory is changed by switching to a different battery chemistry or design. However, note that other experience curves such as for photovoltaic modules and wind power have been insensitive to the detailed structure of the technology, remaining empirically robust even with addition of thin film cells and large diameter turbines. This said, future costs are sensitive to learning rate values, so we added additional sensitivity analysis with optimistic and pessimistic learning rates in the SI. It is also conceivable for a disruptive technology to emerge and establish a new trend. Our analysis, like many others, explores only those futures in which emerging alternatives with established market success complete with the incumbent.
Similarly, our analysis assumes that 2018 electricity prices persist over time. The utilities and electricity-generating companies may change their primary sources of electricity generation and are likely to install more renewable energy sources that could change electricity prices. Moreover, the time of charging also impacts the cost of charging, and our analysis does not consider these interactions with the electricity market. Lastly, our analysis assumes BEVs with ranges of 100 and 150 mainly because the day trip analysis based on NHTS showed that 83% of the daily vehicle miles traveled (VMT) are under 60 miles, and 95% are under 120 miles []. Although BEVs of higher ranges are available and new models are getting introduced, this assumption is based on daily driving needs.
Considering these assumptions and caveats as a whole, our predictions of future ETV market shares are intended to demonstrate important dependencies, not as robust forecasts. We argue, however, that this high-level model succeeds in demonstrating that consumer heterogeneity and price uncertainty are essential factors to resolve if we want to understand the future of ETVs.
4. Discussion
The contributions of this analysis are as follows. First, by running the model for average and resolved heterogeneities, we clarified the degree to which accounting for consumer heterogeneity affects market outcomes. Second, we use a diffusion model reflecting a near-term future market in which consumers can choose between ETV and ICEV versions and base choices on the total cost of ownership. This provides a valuable contrast with prior work rooted in calibration on historical market data. Third, we clarify the importance of initial cost and cost evolution assumptions on future market outcomes. These are critical and uncertain variables whose influence has not been analyzed.
The goal of this work was to understand whether consumer heterogeneity and technological progress could work together to achieve cascading diffusion of ETVs in the U.S. while investigating the factors that strongly affect the long-term trends. The answer to this question is that there are plausible futures in which cascading diffusion does occur, i.e., ETVs emerge as the preferred technology for most consumers by 2040. There are also futures where this does not happen. Suppose the choice between ETV or ICEV is left to the consumer, and ICEVs continue to be less expensive in initial and total ownership costs. In this situation, one expects that ICEVs would continue to dominate the market. While the question of future cost parity is challenging, it is certainly possible to answer it with greater certainty.
This leads to a key takeaway that very little can reliably be said about the future of ETVs without resolution on critical inputs, specifically current non-battery costs, future prices of internal combustion vehicles, and future gasoline prices. Of these, future gasoline prices are well studied, and while still uncertain, much more is known. Given the lack of prior work, studies of potential future costs of internal combustion vehicles would help. Note that a critical uncertainty, current non-battery costs, can easily be mitigated given transparent, publicly available studies. We hope that this analysis encourages organizations to undertake such work.
A second lesson is that heterogeneity matters for the technology diffusion of ETVs. We only treated two extreme cases: detailed behavioral and geographical heterogeneity with ICEV premium versus a scenario where the entire population is considered to be the same as that of a national average. The ETV adoption in 2040 in these scenarios was found to be 100% and 77%, respectively. The most detailed prior analysis binned consumers into 27 groups []; we treated 309,000 different types of driver. It would be useful to know what level of heterogeneity is needed to achieve a desired degree of accuracy, but this is left to future work.
To compare our results with previous analyses, Edelenbosch et al., 2018 [] found ICEVs as the dominant technology until around 2050 (with a few PHEVs), with some post-2050 growth in BEVs. We found some futures dominated by ICEVs before 2050, for combinations of High Non-Battery Cost, low ICEV Cost Premium, and low gasoline prices, but much of our parameter space indicated a more optimistic future for ETVs. Differences in scope and methods make it difficult to identify reasons for our different conclusion, but that earlier work assumed a much lower learning rate for batteries (11%), which presumably contributed to a lack of near-term cost declines and momentum in adoption.
Our model, as with previous efforts [,] and indeed nearly all multi-decade efforts to forecast a complex energy system, faces significant epistemological challenges. Real validation is only possible decades after decisions were made that the model was intended to inform. This said, it is possible to improve the empirical grounding of modeling data and assumptions. It is also possible to retrospectively train the model for the distant past and check how it performs to “forecast” the recent past. Note that this approach is problematic for emerging technologies, as the recent past does not meaningfully integrate the probable future usage/performance/adoption. While well beyond the current scope, we do believe that energy modeling communities should tackle retrospective validation in the future.
5. Conclusions
Governments around the world are subsidizing the purchase of electric vehicles. For example, the U.S. federal government offers a USD 7500 tax credit in the U.S. [], and many states offer additional incentives. There are two arguments to justify a subsidy: the first is to stimulate direct environmental benefits from ETV adoption, the second is to contribute to the long-term development of the ETV market. Analysis by Michalek et al. indicates that the direct environmental benefit per ETV adoption in the U.S. is worth hundreds of dollars, much lower than the USD 7500 subsidy []. However, a subsidy can have significant long-term benefits if a clean technology becomes preferable over an incumbent for a large share of the market []. Our results suggest this could be the case, i.e., subsidies for ETVs contribute to long-term benefits by lowering their future costs, helping to achieve future price parity. However, given uncertainty around the correct current and future ETV and ICEV prices, it is not clear if and when unsubsidized ETVs will be preferred over ICEVs for most consumers. The analysis in Section 3.4 shows that the subsidy cost per stimulated ETV purchase can be either much higher or much lower than the direct subsidy, depending on the course of technological progress.
This analysis focused on the U.S., but the results are relevant to other regions. Without detailed analysis, it is difficult to predict the economic benefits of ETVs elsewhere. Some attributes favor ETV adoption in the U.S. (relatively high annual miles driven and low electricity prices), while others disfavor the transition (low gasoline prices). Previous analysis showed reasonably similar costs of ETV ownership between the U.S., the U.K. and Japan []. Heterogeneity in vehicle usage and ownership patterns is likely to be significant in other countries as well, so accounting for it would be required when attempting to understand adoption patterns.
A global view of ETV adoption raises the question of whether some countries with favorable economics and/or policies could be global leaders in adoption and drive global cost reductions []. Conceptually, this is similar to the effect of significant Germany subsidies for rooftop solar from 2004 to 2014, which helped to lower global solar panel prices []. While technology subsidy policy is generally a domestic affair, heterogeneity across countries suggests that there is value in international discussion and coordination []. Furthermore, in many of the modeled scenarios, ETV production occasionally hit the maximum growth rate limitation of 50% year-over-year, suggesting that demand for ETVs may grow rapidly once the market reaches a certain maturity. Policymakers can prepare for that event through industrial policy that builds up supply chains before periods of increased demand.
Decision-makers and analysts around the world should consider both domestic and international heterogeneity when formulating ETV promotion policies. By better understanding domestic heterogeneity, policies can be tuned to focus on successive niches of consumer markets, promoting diffusion at lower cost. By considering the international situation, decision-makers can better understand how policies and adoption in other countries will drive cost reductions, influencing the domestic situation.
Uncertainties surrounding the ability of ETVs to achieve price parity with conventional vehicles is a second concern. Governments can substantially reduce price uncertainty by funding empirical research on current costs and expected trends for ETVs and ICEVs. It is important that these studies report underlying data to enable the deconstruction of differences in results from other works. Second, uncertainty in future prices means that governments should be prepared for uneven outcomes from subsidy policies, preparing to react to the situation as it evolves. That said, an unstable subsidy erodes producer confidence and commitment, so there should be clear rules for reduction, such as a scheduled decline in future blocks of adoption or subsidies that are dependent on the supply/demand for ETVs.
Supplementary Materials
The following supporting information can be downloaded at: https://www.mdpi.com/article/10.3390/en15134722/s1, There are two Supplemental Information files: a Supplementary Information document and Vehicle Cost and Technical Data spreadsheet. The document contains a detailed methods section and additional results. The spreadsheet contains calculations and detailed vehicle cost models.
Author Contributions
R.R.D. analyzed data, developed the model, and wrote the paper. E.H. and E.W. contributed to developing and formulating the research and writing the paper. All authors have read and agreed to the published version of the manuscript.
Funding
This research has been supported by the National Science Foundation, Environmental Sustainability Program (grant CBET #1605319).
Data Availability Statement
Detailed technical and cost data, including citations for sources, are available in the provided Vehicle Cost and Technical Data spreadsheet. Model results include GBs of data and are not publicly archived, but specific data requests can be sent to the authors.
Conflicts of Interest
The authors declare no conflict of interest.
References
- Intergovernmental Panel on Climate Change (IPCC). IPCC—SR15. Available online: http://www.ipcc.ch/report/sr15/ (accessed on 12 October 2018).
- Intergovernmental Panel on Climate Change (IPCC). Summary for Policymakers of IPCC Special Report on Global Warming of 1.5 °C Approved by Governments: Press Release; IPCC: Geneva, Switzerland, 2018. Available online: https://www.ipcc.ch/pdf/session48/pr_181008_P48_spm_en.pdf (accessed on 12 October 2018).
- PPMC TRANSPORT. Paris Agreement on Climate Change, a Strong Call to Action for the Transport Sector. Available online: http://www.ppmc-transport.org/paris-agreement-on-climate-change-a-strong-call-to-action-for-the-transport-sector/ (accessed on 26 August 2018).
- U.S. Environmental Protection Agency (EPA). Inventory of U.S. Greenhouse Gas Emissions and Sinks (1990–2016); EPA: Washington, DC, USA, 2018. Available online: https://www.epa.gov/sites/production/files/2018-01/documents/2018_complete_report.pdf (accessed on 12 October 2018).
- U.S. Environmental Protection Agency (EPA). Fuel Economy. Available online: https://www.fueleconomy.gov/ (accessed on 27 February 2018).
- Archsmith, J.; Kendall, A.; Rapson, D. From Cradle to Junkyard: Assessing the Life Cycle Greenhouse Gas Benefits of Electric Vehicles. Res. Transp. Econ. 2015, 52, 72–90. [Google Scholar] [CrossRef]
- Hodges, J. Electric Cars Seen Getting Cleaner Even Where Grids Rely on Coal—Bloomberg. Available online: https://www.bloomberg.com/news/articles/2019-01-15/electric-cars-seen-getting-cleaner-even-where-grids-rely-on-coal (accessed on 27 October 2019).
- Wróblewski, P.; Drożdż, W.; Lewicki, W.; Dowejko, J. Total Cost of Ownership and Its Potential Consequences for the Development of the Hydrogen Fuel Cell Powered Vehicle Market in Poland. Energies 2021, 14, 2131. [Google Scholar] [CrossRef]
- Barbosa, W.; Prado, T.; Batista, C.; Câmara, J.C.; Cerqueira, R.; Coelho, R.; Guarieiro, L. Electric Vehicles: Bibliometric Analysis of the Current State of the Art and Perspectives. Energies 2022, 15, 395. [Google Scholar] [CrossRef]
- Osieczko, K.; Zimon, D.; Płaczek, E.; Prokopiuk, I. Factors That Influence the Expansion of Electric Delivery Vehicles and Trucks in EU Countries. J. Environ. Manag. 2021, 296, 113177. [Google Scholar] [CrossRef]
- Aiello, G.; Inguanta, R.; D’angelo, G.; Venticinque, M. Energy Consumption Model of Aerial Urban Logistic Infrastructures. Energies 2021, 14, 5998. [Google Scholar] [CrossRef]
- Gohlke, D.; Desai, R.R.; Muratori, M. Least-Cost Technologies For Different Transportation Segments: A Sensitivity Analysis. In Proceedings of the Presented at the 2020 Transportation Research Board (TRB) 99th Annual Meeting, Washington, DC, USA, 12–16 January 2020. [Google Scholar]
- Satterfield, C.; Nigro, N.; Wood, E.; Jensen, J.; Smith, C.; Desai, R.; Ge, Y. A Vehicle-by-Vehicle Assessment of the Electrification Potential for Publicly-Owned Vehicles; The National Academies of Sciences, Engineering, and Medicine: Washington, DC, USA, 2020; Available online: https://atlaspolicy.com/wp-content/uploads/2020/12/Electrification_Assessment_of_Public_Vehicles_in_Washington.pdf (accessed on 10 May 2022).
- Vilppo, O.; Markkula, J. Feasibility of Electric Buses in Public Transport. World Electr. Veh. J. 2015, 7, 357–365. [Google Scholar] [CrossRef]
- Kubański, M. Prospects for the Use of Electric Vehicles in Public Transport on the Example of the City of Czechowice-Dziedzice. Transp. Res. Procedia 2020, 44, 110–114. [Google Scholar] [CrossRef]
- Novotny, A.; Szeberin, I.; Kovács, S.; Máté, D. National Culture and the Market Development of Battery Electric Vehicles in 21 Countries. Energies 2022, 15, 1539. [Google Scholar] [CrossRef]
- International Energy Agency (IEA). Global EV Outlook 2020; IEA: Paris, France, 2020. Available online: https://iea.blob.core.windows.net/assets/ed5f4484-f556-4110-8c5c-4ede8bcba637/GlobalEVOutlook2021.pdf (accessed on 20 August 2021).
- U.S.-Environmental Protection Agency (EPA). Federal Tax Credits for All-Electric and Plug-in Hybrid Vehicles. Available online: https://www.fueleconomy.gov/feg/taxevb.shtml (accessed on 4 May 2018).
- Tsuchiya, H. Photovoltaics Cost Analysis Based on The Learning Curve. In Proceedings of the Congress of International Solar Energy: Clean and Safe Energy Forever, Kobe, Japan, 4–8 September 1989; pp. 402–406. [Google Scholar]
- Herron, S.; Williams, E. Modeling Cascading Diffusion of New Energy Technologies: Case Study of Residential Solid Oxide Fuel Cells in the US and Internationally. Environ. Sci. Technol. 2013, 47, 8097–8104. [Google Scholar] [CrossRef]
- Tran, M.; Banister, D.; Bishop, J.D.K.; McCulloch, M.D. Realizing the Electric-Vehicle Revolution. Nat. Clim. Chang. 2012, 2, 328–333. [Google Scholar] [CrossRef]
- McCollum, D.L.; Wilson, C.; Pettifor, H.; Ramea, K.; Krey, V.; Riahi, K.; Bertram, C.; Lin, Z.; Edelenbosch, O.Y.; Fujisawa, S. Improving the Behavioral Realism of Global Integrated Assessment Models: An Application to Consumers’ Vehicle Choices. Transp. Res. Part D Transp. Environ. 2017, 55, 322–342. [Google Scholar] [CrossRef]
- Edelenbosch, O.Y.; McCollum, D.L.; Pettifor, H.; Wilson, C.; Van Vuuren, D.P. Interactions between Social Learning and Technological Learning in Electric Vehicle Futures. Environ. Res. Lett. 2018, 13, 124004. [Google Scholar] [CrossRef]
- International Institute for Applied System Analysis (IIASA). MESSAGE Energy Model. Available online: https://iiasa.ac.at/web/home/research/researchPrograms/Energy/MESSAGE.en.html (accessed on 20 November 2020).
- Soulopoulos, N. When Will Electric Vehicles Be Cheaper than Conventional Vehicles? 2017. Available online: https://data.bloomberglp.com/bnef/sites/14/2017/06/BNEF_2017_04_12_EV-Price-Parity-Report.pdf (accessed on 10 September 2018).
- Curry, C. Lithium-Ion Battery Costs and Market. 2017. Available online: https://data.bloomberglp.com/bnef/sites/14/2017/07/BNEF-Lithium-ion-battery-costs-and-market.pdf (accessed on 10 September 2018).
- Morsy, S. BNEF Long Term EV Outlook. 2017. Available online: https://classic.nga.org/files/live/sites/NGA/files/pdf/2017/SalimMorsy-1.pdf (accessed on 10 September 2018).
- Wolfram, A.P.; Lutsey, N. Electric Vehicles: Literature Review of Technology Costs and Carbon Emissions; The International Council on Clean Transportation: Washington, DC, USA, 2016; Available online: https://www.theicct.org/sites/default/files/publications/ICCT_LitRvw_EV-tech-costs_201607.pdf (accessed on 10 September 2017).
- Lutsey, N.; Nicholas, M. Update on Electric Vehicle Costs in the United States through 2030. Int. Counc. Clean Transp. 2019, 1–12. [Google Scholar] [CrossRef]
- Slowik, P.; Lutsey, N.; Berlin, B. Expanding the Electric Vehicle Market in U.S. Cities; International Council on Clean Transportation (ICCT): Washington, DC, USA, 2017; Available online: https://theicct.org/publication/expanding-the-electric-vehicle-market-in-u-s-cities/ (accessed on 25 October 2018).
- Hummel, P.; Lesne, D.; Radlinger, J.; Goldbaz, C.; Langan, C.; Takahashi, K.; Mulholland, D.; Stott, A.; Haire, G.; Mittermaier, M.; et al. Q-Series UBS Evidence Lab Electric Car Teardown—Disruption Ahead? UBS Group SA: Basel, Switzerland, 2017; Available online: https://neo.ubs.com/shared/d1ZTxnvF2k/ (accessed on 10 November 2018).
- Navigant Tomorrow’s Vehicles: An Overview of Vehicle Sales and Fuel Consumption Through 2025; Fuels Institute: Chicago, IL, USA, 2017; Available online: https://www.fuelsinstitute.org/getattachment/Research/Tomorrows-Vehicles/Tomorrows-Vehicles-An-Overview-of-Vehicle-Sales-and-Fuel-Consumption-Through-2025.pdf?lang=en-US (accessed on 10 November 2018).
- BP. BP Energy Outlook 2019 Edition The Energy Outlook Explores the Forces Shaping the Global Energy Transition out to 2040. 2019. Available online: https://www.bp.com/content/dam/bp/business-sites/en/global/corporate/pdfs/energy-economics/energy-outlook/bp-energy-outlook-2019.pdf (accessed on 10 January 2020).
- International Energy Agency (IEA). Global EV Outlook 2018: Towards Corss-Modal Electrification; IEA: Paris, France, 2018. [CrossRef]
- International Energy Agency (IEA). Global EV Outlook 2019 Scaling-Up the Transition to Electric Mobility; IEA: Paris, France, 2019. Available online: https://www.iea.org/publications/reports/globalevoutlook2019/ (accessed on 24 January 2020).
- Breetz, H.L.; Salon, D. Do Electric Vehicles Need Subsidies? Ownership Costs for Conventional, Hybrid, and Electric Vehicles in 14 U.S. Cities. Energy Policy 2018, 120, 238–249. [Google Scholar] [CrossRef]
- Peterson, S.B.; Whitacre, J.F.; Apt, J. Net Air Emissions from Electric Vehicles: The Effect of Carbon Price and Charging Strategies. Environ. Sci. Technol. 2011, 45, 1792–1797. [Google Scholar] [CrossRef] [PubMed]
- Hao, H.; Wang, M.; Zhou, Y.; Wang, H.; Ouyang, M. Levelized Costs of Conventional and Battery Electric Vehicles in China: Beijing Experiences. Mitig. Adapt. Strateg. Glob. Chang. 2015, 20, 1229–1246. [Google Scholar] [CrossRef]
- Parks, K.; Denholm, P.; Markel, T. Costs and Emissions Associated with Plug-In Hybrid Electric Vehicle Charging in the Xcel Energy Colorado Service Territory; National Renewable Energy Laboratory (NREL): Golden, CO, USA, 2007. [CrossRef]
- Palmer, K.; Tate, J.E.; Wadud, Z.; Nellthorp, J. Total Cost of Ownership and Market Share for Hybrid and Electric Vehicles in the UK, US and Japan. Appl. Energy 2018, 209, 108–119. [Google Scholar] [CrossRef]
- Desai, R.R.; Chen, R.B.; Hittinger, E.; Williams, E. Heterogeneity in Economic and Carbon Benefits of Electric Technology Vehicles in the U.S. Environ. Sci. Technol. 2019, 54, 1136–1146. [Google Scholar] [CrossRef]
- Desai, R.R. Clean Transportation: Effects of Heterogeneity and Technological Progress on EV Costs and CO2 Abatement, and Assessment of Public EV Charging Stations; Rochester Institute of Technology: Rochester, NY, USA, 2019; Available online: https://scholarworks.rit.edu/theses/10152 (accessed on 24 January 2020).
- U.S. Department of Transportation (DOT). National Household Travel Survey. Available online: https://nhts.ornl.gov (accessed on 10 September 2017).
- Brennan, J.W.; Barder, T.E. Battery Electric Vehicles vs. Internal Combustion Engine Vehicles; Arthur D Little: Boston, MA, USA, 2016; p. 48. Available online: https://www.adlittle.com/sites/default/files/viewpoints/ADL_BEVs_vs_ICEVs_FINAL_November_292016.pdf. (accessed on 15 October 2017).
- Duan, Z.; Gutierrez, B.; Wang, L. Forecasting Plug-In Electric Vehicle Sales and the Diurnal Recharging Load Curve. IEEE Trans. Smart Grid 2014, 5, 527–535. [Google Scholar] [CrossRef]
- Duan, Z. Emergency Modeling in Transportation via Queing and Game Theory. 2013. Available online: https://ieeexplore.ieee.org/stamp/stamp.jsp?arnumber=6693758 (accessed on 15 October 2018).
- Pfahl, S.; Jochem, P.; Fichtner, W. When Will Electric Vehicles Capture the German Market? And Why? In Proceedings of the EVS27 International Battery, Hybrid and Fuel Cell Electric Vehicle Symposium, Barcelona, Spain, 17–20 November 2013; Available online: https://ieeexplore.ieee.org/stamp/stamp.jsp?tp=&arnumber=6914735 (accessed on 10 September 2017).
- Yabe, K.; Shinoda, Y.; Seki, T.; Tanaka, H.; Akisawa, A. Market Penetration Speed and Effects on CO 2 Reduction of Electric Vehicles and Plug-in Hybrid Electric Vehicles in Japan. Energy Policy 2012, 45, 529–540. [Google Scholar] [CrossRef]
- Hess, S.; Fowler, M.; Adler, T.; Bahreinian, A. A Joint Model for Vehicle Type and Fuel Type Choice: Evidence from a Cross-Nested Logit Study. Transportation 2012, 39, 593–625. [Google Scholar] [CrossRef]
- Liu, Y.; Cirillo, C. A Generalized Dynamic Discrete Choice Model for Green Vehicle Adoption. Transp. Res. Procedia 2017, 23, 868–886. [Google Scholar] [CrossRef]
- Driscoll, Á.; Lyons, S.; Mariuzzo, F.; Tol, R.S.J. Simulating Demand for Electric Vehicles Using Revealed Preference Data. Energy Policy 2013, 62, 686–696. [Google Scholar] [CrossRef]
- Fu, S.; Ren, Y. Electric Vehicle Forecasting for China from 2011 to 2050 Based on Scenario Analysis. In Proceedings of the Applied Mechanics and Materials, Sanya, China, 24–25 November 2012; Trans Tech Publications Ltd.: Kapellweg, Switzerland, 2012; Volume 128–129, pp. 846–849. [Google Scholar]
- Gnann, T.; Plötz, P.; Kühn, A.; Wietschel, M. Modelling Market Diffusion of Electric Vehicles with Real World Driving Data—German Market and Policy Options. Transp. Res. Part A Policy Pract. 2015, 77, 95–112. [Google Scholar] [CrossRef]
- Plötz, P.; Gnann, T.; Wietschel, M. Modelling Market Diffusion of Electric Vehicles with Real World Driving Data—Part I: Model Structure and Validation. Ecol. Econ. 2014, 107, 411–421. [Google Scholar] [CrossRef]
- Lee, D.H.; Park, S.Y.; Hong, J.C.; Choi, S.J.; Kim, J.W. Analysis of the Energy and Environmental Effects of Green Car Deployment by an Integrating Energy System Model with a Forecasting Model. Appl. Energy 2013, 103, 306–316. [Google Scholar] [CrossRef]
- Nemry, F.; Brons, M. Plug-in Hybrid and Battery Electric Vehicles Market Penetration Scenarios of Electric Drive Vehicles. Jrc-Ipts 2010, 1–36. [Google Scholar]
- Alternative Fuels Data Center (AFDC). Maps and Data—U.S. Plug-in Electric Vehicle Sales by Model. Available online: https://afdc.energy.gov/data/10567 (accessed on 27 February 2021).
- evadoption.com. EV Models Currently Available in the US—EVAdoption. Available online: https://evadoption.com/ev-models/ (accessed on 20 June 2021).
- GM General Motors, the Largest U.S. Automaker, Plans to Be Carbon Neutral by 2040. Available online: https://media.gm.com/media/us/en/gm/home.detail.html/content/Pages/news/us/en/2021/jan/0128-carbon.html (accessed on 27 February 2021).
- Ellram, L.M. Total Cost of Ownership; An Analysis Approach for Purchasing. Int. J. Phys. Distrib. Logist. Manag. 1995, 25, 4–23. [Google Scholar] [CrossRef]
- Hagman, J.; Ritzén, S.; Stier, J.J.; Susilo, Y. Total Cost of Ownership and Its Potential Implications for Battery Electric Vehicle Diffusion. Res. Transp. Bus. Manag. 2016, 18, 11–17. [Google Scholar] [CrossRef]
- Bala, B.K.; Arshad, F.M.; Noh, K.M. System Dynamics; Springer Texts in Business and Economics; Springer Singapore: Singapore, 2017; ISBN 978-981-10-2043-8. [Google Scholar]
- U.S. EPA. NHTSA Joint Technical Support Document: Final Rulemaking for 2017-2025 Light-Duty Vehicle Greenhouse Gas Emission Standards and Corporate Average Fuel Economy Standards; U.S. Environmental Protection Agency (EPA) and National Highway Traffic Safety Administration (NHTSA): Washington, DC, USA, 2012; p. 602. [CrossRef]
- U.S. EPA Emissions & Generation Resource Integrated Database (EGRID). Available online: https://www.epa.gov/energy/emissions-generation-resource-integrated-database-egrid (accessed on 1 January 2018).
- www.AAA.com. Gas Prices. Available online: http://gasprices.aaa.com/state-gas-price-averages/ (accessed on 1 January 2018).
- CNG-Now Average CNG Price by State. Available online: http://www.cngnow.com/average-cng-prices/Pages/default.aspx (accessed on 1 January 2018).
- GasBuddy.com. Available online: http://www.gasbuddy.com/USA (accessed on 13 February 2018).
- Nykvist, B.; Nilsson, M. Rapidly Falling Costs of Battery Packs for Electric Vehicles. Nat. Clim. Chang. 2015, 5, 329–332. [Google Scholar] [CrossRef]
- Kromer, M.A.; Heywood, J.B. Electric Powertrains: Opportunities and Challenges in the U.S. Light-Duty Vehicle Fleet. Ph.D. Thesis, Massachusetts Institute of Technology, Cambridge, MA, USA, 2007. Available online: http://web.mit.edu/sloan-auto-lab/research/beforeh2/files/kromer_electric_powertrains.pdf (accessed on 15 October 2017).
- N.R.C. Transitions to Alternative Vehicles and Fuels; N.R.C.: Washington, DC, USA, 2013; Available online: http://www.nap.edu/catalog/18264 (accessed on 15 October 2017).
- N.R.C. Transitions to Alternative Vehicles and Fuels: Appendix F; N.R.C.: Washington, DC, USA, 2013; Available online: https://nap.nationalacademies.org/read/18264/chapter/17 (accessed on 15 October 2017).
- Safari, M. Battery Electric Vehicles: Looking behind to Move Forward. Energy Policy 2018, 115, 54–65. [Google Scholar] [CrossRef]
- Kolwich, G. Light-Duty Vehicle Technology Cost Analysis: European Vehicle Market; International Council on Clean Transportation: Washington, DC, USA, 2013; Available online: http://www.theicct.org/light-duty-vehicle-technology-cost-analysis-european-vehicle-market (accessed on 10 January 2018).
- Wright, T.P. Factors Affecting the Cost of Airplanes. J. Aeronaut. Sci. 1936, 3, 122–128. [Google Scholar] [CrossRef]
- Nykvist, B.; Sprei, F.; Nilsson, M. Assessing the Progress toward Lower Priced Long Range Battery Electric Vehicles. Energy Policy 2019, 124, 144–155. [Google Scholar] [CrossRef]
- Kittner, N.; Lill, F.; Kammen, D.M. Energy Storage Deployment and Innovation for the Clean Energy Transition. Nat. Energy 2017, 2, 17125. [Google Scholar] [CrossRef]
- Schmidt, O.; Hawkes, A.; Gambhir, A.; Staffell, I. The Future Cost of Electrical Energy Storage Based on Experience Rates. Nat. Energy 2017, 2, 17110. [Google Scholar] [CrossRef]
- Pasaoglu, G.; Harrison, G.; Jones, L.; Hill, A.; Beaudet, A.; Thiel, C. A System Dynamics Based Market Agent Model Simulating Future Powertrain Technology Transition: Scenarios in the EU Light Duty Vehicle Road Transport Sector. Technol. Forecast. Soc. Change 2016, 104, 133–146. [Google Scholar] [CrossRef]
- McDonald, A.; Schrattenholzer, L. Learning Rates for Energy Technologies. Energy Policy 2001, 29, 255–261. [Google Scholar] [CrossRef]
- van Vliet, O.P.R.; Kruithof, T.; Turkenburg, W.C.; Faaij, A.P.C. Techno-Economic Comparison of Series Hybrid, Plug-in Hybrid, Fuel Cell and Regular Cars. J. Power Sources 2010, 195, 6570–6585. [Google Scholar] [CrossRef]
- Contestabile, M.; Offer, G.J.; Slade, R.; Jaeger, F.; Thoennes, M. Battery Electric Vehicles, Hydrogen Fuel Cells and Biofuels. Which Will Be the Winner? Energy Environ. Sci. 2011, 4, 3754–3772. [Google Scholar] [CrossRef]
- Weiss, M.; Patel, M.K.; Junginger, M.; Perujo, A.; Bonnel, P.; van Grootveld, G. On the Electrification of Road Transport—Learning Rates and Price Forecasts for Hybrid-Electric and Battery-Electric Vehicles. Energy Policy 2012, 48, 374–393. [Google Scholar] [CrossRef]
- Bunch, D.S.; Bradley, M.; Golob, T.F.; Kitamura, R.; Occhiuzzo, G.P. Demand for Clean-Fuel Vehicles in California: A Discrete-Choice Stated Preference Pilot Project. Transp. Res. Part A Policy Pract. 1993, 27, 237–253. [Google Scholar] [CrossRef]
- Cirillo, C.; Xu, R.; Bastin, F. A Dynamic Formulation for Car Ownership Modeling. Transp. Sci. 2016, 50, 322–335. [Google Scholar] [CrossRef]
- Brownstone, D.; Bunch, D.S.; Train, K. Joint Mixed Logit Models of Stated and Revealed Preferences for Alternative-Fuel Vehicles. Transp. Res. Part B Methodol. 2000, 34, 315–338. [Google Scholar] [CrossRef]
- Ewing, G.; Sarigöllü, E. Assessing Consumer Preferences for Clean-Fuel Vehicles: A Discrete Choice Experiment. J. Public Policy Mark. 2000, 19, 106–118. [Google Scholar] [CrossRef]
- Jan Wassenaar, H.; Chen, W.; Cheng, J.; Sudjianto, A.; Wassenaar, H.J.; Chen, W.; Cheng, J. Enhancing Discrete Choice Demand Modeling for Decision-Based Design. J. Mech. Des. 2005, 127, 514. [Google Scholar] [CrossRef]
- Potoglou, D.; Kanaroglou, P.S. Household Demand and Willingness to Pay for Clean Vehicles. Transp. Res. Part D Transp. Environ. 2007, 12, 264–274. [Google Scholar] [CrossRef]
- Ahn, J.; Jeong, G.; Kim, Y. A Forecast of Household Ownership and Use of Alternative Fuel Vehicles: A Multiple Discrete-Continuous Choice Approach. Energy Econ. 2008, 30, 2091–2104. [Google Scholar] [CrossRef]
- Ziegler, A. Individual Characteristics and Stated Preferences for Alternative Energy Sources and Propulsion Technologies in Vehicles: A Discrete Choice Analysis; Economics Paper Series, No. 10/125; ETH, Swiss Federal Institute of Technology, CER-ETH—Center of Economic Research at ETH Zurich: Zurich, Switzerland, 2010. [Google Scholar]
- Hidrue, M.K.; Parsons, G.R.; Kempton, W.; Gardner, M.P. Willingness to Pay for Electric Vehicles and Their Attributes. Resour. Energy Econ. 2011, 33, 686–705. [Google Scholar] [CrossRef]
- Hackbarth, A.; Madlener, R. Consumer Preferences for Alternative Fuel Vehicles: A Discrete Choice Analysis. Transp. Res. Part D Transp. Environ. 2013, 25, 5–17. [Google Scholar] [CrossRef]
- Brooker, A.; Gonder, J.; Lopp, S.; Ward, J. ADOPT: A Historically Validated Light Duty Vehicle Consumer Choice Model; National Renewable Energy Laboratory: Golden, CO, USA, 2015. [CrossRef]
- Brown, M. Catching the Phever: Simulating Electric Vehicle Diffusion with an Agent-Based Mixed Logit Model of Vehicle Choice. J. Artif. Soc. Soc. Simul. 2013, 16. [Google Scholar] [CrossRef]
- Liu, C.; Greene, D. Transportation Energy Transition Modeling and Analysis: The LAVE-Trans Model; Department of Energy Annual Merit Review: Washington, DC, USA, 2014.
- Liu, C.; Lin, Z. How Uncertain Is the Future of Electric Vehicle Market: Results from Monte Carlo Simulations Using a Nested Logit Model. Int. J. Sustain. Transp. 2017, 11, 237–247. [Google Scholar] [CrossRef]
- Lin, Z.; Liu, C. MA3T—Modeling Vehicle Market Dynamics with Consumer Segmentation. In Proceedings of the 2015 U.S. DOE H2 Program and Vehicle Technologies Program Annual Merit Review Meeting, Arlington, Virginia, 8–12 June 2015. [Google Scholar]
- Lin, Z.; Greene, D.L. Promoting the Market for Plug-In Hybrid and Battery Electric Vehicles Role of Recharge Availability. Transp. Res. Rec. J. Transp. Res. Board 2011, 2252, 49–56. [Google Scholar] [CrossRef]
- Noori, M.; Tatari, O. Development of an Agent-Based Model for Regional Market Penetration Projections of Electric Vehicles in the United States. Energy 2016, 96, 215–230. [Google Scholar] [CrossRef]
- Orbach, Y.; Fruchter, G.E. Forecasting Sales and Product Evolution: The Case of the Hybrid/Electric Car. Technol. Forecast. Soc. Change 2011, 78, 1210–1226. [Google Scholar] [CrossRef]
- Zhang, T.; Gensler, S.; Garcia, R. A Study of the Diffusion of Alternative Fuel Vehicles: An Agent-Based Modeling Approach. J. Prod. Innov. Manag. 2011, 28, 152–168. [Google Scholar] [CrossRef]
- Wolinetz, M.; Axsen, J. How Policy Can Build the Plug-in Electric Vehicle Market: Insights from the REspondent-Based Preference And Constraints (REPAC) Model. Technol. Forecast. Soc. Chang. 2017, 117, 238–250. [Google Scholar] [CrossRef]
- Bühne, J.A.; Gruschwitz, D.; Hölscher, J.; Klötzke, M.; Kugler, U.; Schimeczek, C. How to Promote Electromobility for European Car Drivers? Obstacles to Overcome for a Broad Market Penetration. Eur. Transp. Res. Rev. 2015, 7, 30. [Google Scholar] [CrossRef]
- Eggers, F.; Eggers, F. Where Have All the Flowers Gone? Forecasting Green Trends in the Automobile Industry with a Choice-Based Conjoint Adoption Model. Technol. Forecast. Soc. Chang. 2011, 78, 51–62. [Google Scholar] [CrossRef]
- Kihm, A.; Trommer, S. The New Car Market for Electric Vehicles and the Potential for Fuel Substitution. Energy Policy 2014, 73, 147–157. [Google Scholar] [CrossRef]
- Propfe, B.; Kreyenberg, D.; Wind, J.; Schmid, S. Market Penetration Analysis of Electric Vehicles in the German Passenger Car Market towards 2030. Int. J. Hydrogen Energy 2013, 38, 5201–5208. [Google Scholar] [CrossRef]
- Qian, L.; Soopramanien, D. Incorporating Heterogeneity to Forecast the Demand of New Products in Emerging Markets: Green Cars in China. Technol. Forecast. Soc. Change 2015, 91, 33–46. [Google Scholar] [CrossRef]
- Redelbach, M.; Sparka, M.; Schmid, S.; Friedrich, H.E. Modelling Customer Choice and Market Development for Future Automotive Powertrain Technologies. World Electr. Veh. J. 2013, 6, 935–944. [Google Scholar] [CrossRef]
- Shafiei, E.; Thorkelsson, H.; Ásgeirsson, E.I.; Davidsdottir, B.; Raberto, M.; Stefansson, H. An Agent-Based Modeling Approach to Predict the Evolution of Market Share of Electric Vehicles: A Case Study from Iceland. Technol. Forecast. Soc. Change 2012, 79, 1638–1653. [Google Scholar] [CrossRef]
- Lebeaua, K.; Van Mierlob, J.; Lebeaua, P.; Mairessea, O.; Macharisa, C. The Market Potential for Plug-in Hybrid and Battery Electric Vehicles in Flanders: A Choice-Based Conjoint Analysis. Transp. Res. Part D Transp. Environ. 2012, 17, 592–597. [Google Scholar] [CrossRef]
- Liu, Y.; Klampfl, E.; Tamor, M.A. Modified Bass Model with External Factors for Electric Vehicle Adoption; SAE International: Warrendale, PA, USA, 2013. [Google Scholar] [CrossRef]
- De Santa-Eulalia, L.A.; Neumann, D.; Klasen, J. A Simulation-Based Innovation Forecasting Approach Combining the Bass Diffusion Model, the Discrete Choice Model and System Dynamics An Application in the German Market for Electric Cars. In Proceedings of the Third International Conference on Advances in System Simulation, Lisbon, Portugal, 16–20 October 2011. [Google Scholar]
- Zeng, M.; Zhan, X.; Xue, S.; Ma, M.; Li, Y. Inventory Forecast of Electric Vehicles in China during the Twelfth Five-Year Plan Period Using Bass Model Optimized by Particle Swarm Optimization. J. Appl. Sci. 2013, 13, 4887–4891. [Google Scholar] [CrossRef][Green Version]
- Becker, T.A.; Sidhu, I.; Tenderich, B. Electric Vehicles in the United States A New Model with Forecasts to 2030; University of California: Berkeley, CA, USA, 2009. [Google Scholar]
- Barter, G.E.; Reichmuth, D.; West, T.H.; Manley, D.K. The Future Adoption and Benefit of Electric Vehicles on JSTOR. SAE Int. J. Altern. Powertrains 2013, 2, 82–95. [Google Scholar] [CrossRef]
- Wansart, J.; Schnieder, E. Modeling Market Development of Electric Vehicles. In Proceedings of the 2010 IEEE International Systems Conference, San Diego, CA, USA, 5–8 April 2010. [Google Scholar]
- Edelenbosch, O.Y.; Hof, A.F.; Nykvist, B.; Girod, B.; van Vuuren, D.P. Transport Electrification: The Effect of Recent Battery Cost Reduction on Future Emission Scenarios. Clim. Chang. 2018, 151, 95–108. [Google Scholar] [CrossRef]
- Harrison, G.; Thiel, C.; Jones, L. Powertrain Technology Transition Market Agent Model (PTTMAM); Publications Office of the European Union: Ispara, Italy, 2016. Available online: https://publications.jrc.ec.europa.eu/repository/bitstream/JRC100418/pttmam%20technical%20report%20final_online.pdf (accessed on 22 October 2019).
- Shepherd, S.; Bonsall, P.; Harrison, G. Factors Affecting Future Demand for Electric Vehicles: A Model Based Study. Transp. Policy 2012, 20, 62–74. [Google Scholar] [CrossRef]
- Kieckhäfer, K.; Volling, T.; Spengler, T.S. A Hybrid Simulation Approach for Estimating the Market Share Evolution of Electric Vehicles. Transp. Sci. 2014, 48. [Google Scholar] [CrossRef]
- Frank, M. Bass A New Product Growth for Model Consumer Durables. Manage. Sci. 1969, 15, 215–227. [Google Scholar] [CrossRef]
- Bass, F.M.; Krishnan, T.V.; Jain, D.C. Why the Bass Model Fits without Decision Variables. Mark. Sci. 1994, 13, 203–223. [Google Scholar] [CrossRef]
- Raustad, R. Electric Vehicle Life Cycle Cost Analysis; Electric Vehicle Transportation Center, University of Central Florida: Cocoa, FL, USA, 2017; Available online: http://fsec.ucf.edu/en/publications/pdf/fsec-cr-2053-17.pdf (accessed on 15 September 2017).
- Miotti, M.; Supran, G.J.; Kim, E.J.; Trancik, J.E. Personal Vehicles Evaluated against Climate Change Mitigation Targets. Environ. Sci. Technol. 2016, 50, 10795–10804. [Google Scholar] [CrossRef] [PubMed]
- Gilmore, E.A.; Lave, L.B. Comparing Resale Prices and Total Cost of Ownership for Gasoline, Hybrid and Diesel Passenger Cars and Trucks. Transp. Policy 2013, 27, 200–208. [Google Scholar] [CrossRef]
- Al-Alawi, B.M.; Bradley, T.H. Total Cost of Ownership, Payback, and Consumer Preference Modeling of Plug-in Hybrid Electric Vehicles. Appl. Energy 2013, 103, 488–506. [Google Scholar] [CrossRef]
- O’Keefe, M.; Brooker, A.; Johnson, C.; Mendelsohn, M.; Neubauer, J.; Pesaran, A. Battery Ownership Model: A Tool for Evaluating the Economics of Electrified Vehicles and Related Infrastructure; Preprint (OSTI Identifier 1002155). In Proceedings of the 25th International Battery, Hybrid and Fuel Cell Electric Vehicle Symposium & Exposition, Shenzhen, China, 5–8 November 2010. [Google Scholar]
- Lipman, T.E.; Delucchi, M.A. A Retail and Lifecycle Cost Analysis of Hybrid Electric Vehicles. Transp. Res. Part D Transp. Environ. 2006, 11, 115–132. [Google Scholar] [CrossRef]
- Weis, A.; Jaramillo, P.; Michalek, J. Estimating the Potential of Controlled Plug-in Hybrid Electric Vehicle Charging to Reduce Operational and Capacity Expansion Costs for Electric Power Systems with High Wind Penetration. Appl. Energy 2014, 115, 190–204. [Google Scholar] [CrossRef]
- US-OMB (The Office of Management and Budget). OMB Circular A-94 Guidelines and Discount Rates for Benefit-Cost Analysis of Federal Programs. 2017. Available online: https://www.wbdg.org/FFC/FED/OMB/OMB-Circular-A94.pdf (accessed on 15 October 2017).
- Wróblewski, P.; Lewicki, W. A Method of Analyzing the Residual Values of Low-Emission. Energies 2021, 14, 6859. [Google Scholar] [CrossRef]
- Methipara, J.; Reuscher, T.; Santos, A. FHWA NHTS Brief-Electric Vehicle Feasibility; Oak Ridge National Laboratory: Knoxville, TN, USA, 2016. Available online: http://nhts.ornl.gov/briefs/EVFeasibility20160701.pdf (accessed on 15 October 2017).
- Rogozhin, A.; Gallaher, M.; Helfand, G.; McManus, W. Using Indirect Cost Multipliers to Estimate the Total Cost of Adding New Technology in the Automobile Industry. Int. J. Prod. Econ. 2010, 124, 360–368. [Google Scholar] [CrossRef]
- Rubin, E.S.; Azevedo, I.M.L.; Jaramillo, P.; Yeh, S. A Review of Learning Rates for Electricity Supply Technologies. Energy Policy 2015, 86, 198–218. [Google Scholar] [CrossRef]
- Rubin, E.S.; Yeh, S.; Antes, M.; Berkenpas, M.; Davison, J. Use of Experience Curves to Estimate the Future Cost of Power Plants with CO2 Capture. Int. J. Greenh. Gas Control 2007, 1, 188–197. [Google Scholar] [CrossRef]
- Pasaoglu, G.; Honselaar, M.; Thiel, C. Potential Vehicle Fleet CO2 Reductions and Cost Implications for Various Vehicle Technology Deployment Scenarios in Europe. Energy Policy 2012, 40, 404–421. [Google Scholar] [CrossRef]
- BCG (The Boston Consulting Group). The Electric Car Tipping Point—Research Highlights. 2017, Volume 2. Available online: https://www.bcg.com/de-de/publications/2018/electric-car-tipping-point.aspx (accessed on 15 January 2019).
- Kuhlmann, K.; Wolf, S.; Pieper, C.; Xu, G.; Ahmad, J. The Future of Battery Production for Electric Vehicles. 2018. Available online: https://www.bcg.com/publications/2018/future-battery-production-electric-vehicles.aspx (accessed on 15 January 2019).
- The Boston Consulting Group. Focus Batteries for Electric Cars. 2010. Available online: http://www.bcg.com/documents/file36615.pdf (accessed on 24 January 2019).
- Brooker, A.; Thornton, M.; Rugh, J. Technology Improvement Pathways to Cost-Effective Vehicle Electrification; National Renewable Energy Laboratory: Golden, CO, USA, 2010. [CrossRef]
- Wu, G.; Inderbitzin, A.; Bening, C. Total Cost of Ownership of Electric Vehicles Compared to Conventional Vehicles: A Probabilistic Analysis and Projection across Market Segments. Energy Policy 2015, 80, 196–214. [Google Scholar] [CrossRef]
- Moawad, A.; Kim, N.; Shidore, N.; Rousseau, A. Assessment of Vehicle Sizing, Energy Consumption, and Cost through Large-Scale Simulation of Advanced Vehicle Technologies (ANL/ESD-15/28); Argonne National Laboratory: Chicago, IL, USA, 2016.
- Harmon, C. Experience Curves of Photovoltaic Technology; IIASA: Laxenburg, Austria, 2000; Available online: http://pure.iiasa.ac.at/6231 (accessed on 15 August 2018).
- Weiss, M.; Junginger, M.; Patel, M.K.; Blok, K. A Review of Experience Curve Analyses for Energy Demand Technologies. Technol. Forecast. Soc. Chang. 2010, 77, 411–428. [Google Scholar] [CrossRef]
- Matteson, S.; Williams, E. Learning Dependent Subsidies for Lithium-Ion Electric Vehicle Batteries. Technol. Forecast. Soc. Change 2015, 92, 322–331. [Google Scholar] [CrossRef]
- Neij, L.; Andersen, P.D.; Helby, P.; Hoppe-Kilpper, M.; Morthorst, P.E. Experience Curves: A Tool for Energy Policy Assessment Project Title: Experience Curves-a Tool for Energy Policy Programmes Assessment (EXTOOL); Deapartment of Technology and Society, Environmental and Energy Systems Studies: Lund, Sweden, 2003. [Google Scholar]
- Busse, B.M.R.; Knittel, C.R. American Economic Association Are Consumers Myopic? Evidence from New and Used Car Purchases. Am. Econ. Rev. 2016, 103, 220–256. [Google Scholar] [CrossRef]
- Gillingham, K.; Houde, S.; van Benthem, A. Consumer Myopia in Vehicle Purchases: Evidence from a Natural Experiment; National Bureau of Economic Research: Zurich, Switerland, 2019; Volume 19/321. [Google Scholar] [CrossRef]
- Parry, I.W.H.; Walls, M.; Harrington, W. Automobile Externalities and Policies. J. Econ. Lit. 2007, 45, 373–399. [Google Scholar] [CrossRef]
- Gately, D. Individual Discount Rates and the Purchase and Utilization of Energy-Using Durables: Comment. Bell J. Econ. 1980, 11, 373. [Google Scholar] [CrossRef]
- Gillingham, K.; Newell, R.G.; Palmer, K. Energy Efficiency Economics and Policy. Annu. Rev. Resour. Econ. 2009, 1, 597–620. [Google Scholar] [CrossRef]
- Williams, E.; Hittinger, E.; Carvalho, R.; Williams, R. Wind Power Costs Expected to Decrease Due to Technological Progress. Energy Policy 2017, 106, 427–435. [Google Scholar] [CrossRef]
- Lin, Z.; Dong, J.; Liu, C.; Greene, D. Estimation of Energy Use by Plug-in Hybrid Electric Vehicles. Transp. Res. Rec. 2012, 2287, 37–43. [Google Scholar] [CrossRef]
- Traut, E.J.; Cherng, T.W.C.; Hendrickson, C.; Michalek, J.J. US Residential Charging Potential for Electric Vehicles. Transp. Res. Part D Transp. Environ. 2013, 25, 139–145. [Google Scholar] [CrossRef]
- U.S. DOE. Alternative Fuels Data Center. Available online: http://www.afdc.energy.gov/data/ (accessed on 1 January 2021).
- Yuksel, T.; Tamayao, M.A.M.; Hendrickson, C.; Azevedo, I.M.L.; Michalek, J.J. Effect of Regional Grid Mix, Driving Patterns and Climate on the Comparative Carbon Footprint of Gasoline and Plug-in Electric Vehicles in the United States. Environ. Res. Lett. 2016, 11, 044007. [Google Scholar] [CrossRef]
- Jenn, A.; Azevedo, I.M.L.; Michalek, J.J. Alternative Fuel Vehicle Adoption Increases Fleet Gasoline Consumption and Greenhouse Gas Emissions under United States Corporate Average Fuel Economy Policy and Greenhouse Gas Emissions Standards. Environ. Sci. Technol. 2016, 50, 2165–2174. [Google Scholar] [CrossRef] [PubMed]
- Michalek, J.J.; Chester, M.; Jaramillo, P.; Samaras, C.; Shiau, C.-S.N.; Lave, L.B. Valuation of Plug-in Vehicle Life-Cycle Air Emissions and Oil Displacement Benefits. Proc. Natl. Acad. Sci. USA 2011, 108, 16554–16558. [Google Scholar] [CrossRef]
- Wen, D.; Gao, W.; Qian, F.; Gu, Q.; Ren, J. Development of Solar Photovoltaic Industry and Market in China, Germany, Japan and the United States of America Using Incentive Policies. Energy Explor. Exploit. 2021, 39, 1429–1456. [Google Scholar] [CrossRef]
Publisher’s Note: MDPI stays neutral with regard to jurisdictional claims in published maps and institutional affiliations. |
© 2022 by the authors. Licensee MDPI, Basel, Switzerland. This article is an open access article distributed under the terms and conditions of the Creative Commons Attribution (CC BY) license (https://creativecommons.org/licenses/by/4.0/).