
Dioxin Formation in Biomass Gasification: A Review


Abstract
:1. Introduction
2. Dioxin Formation in Gasification
3. Overview of Experimental Measurements of Dioxin Formation Levels in Pyrolysis and Gasification

| Technology | Feedstock | Reactor Type | Temperature (°C) | PCDD/F Emission (ng-TEQ/Nm3) | Syngas Info. | Note | Ref. |
|---|---|---|---|---|---|---|---|
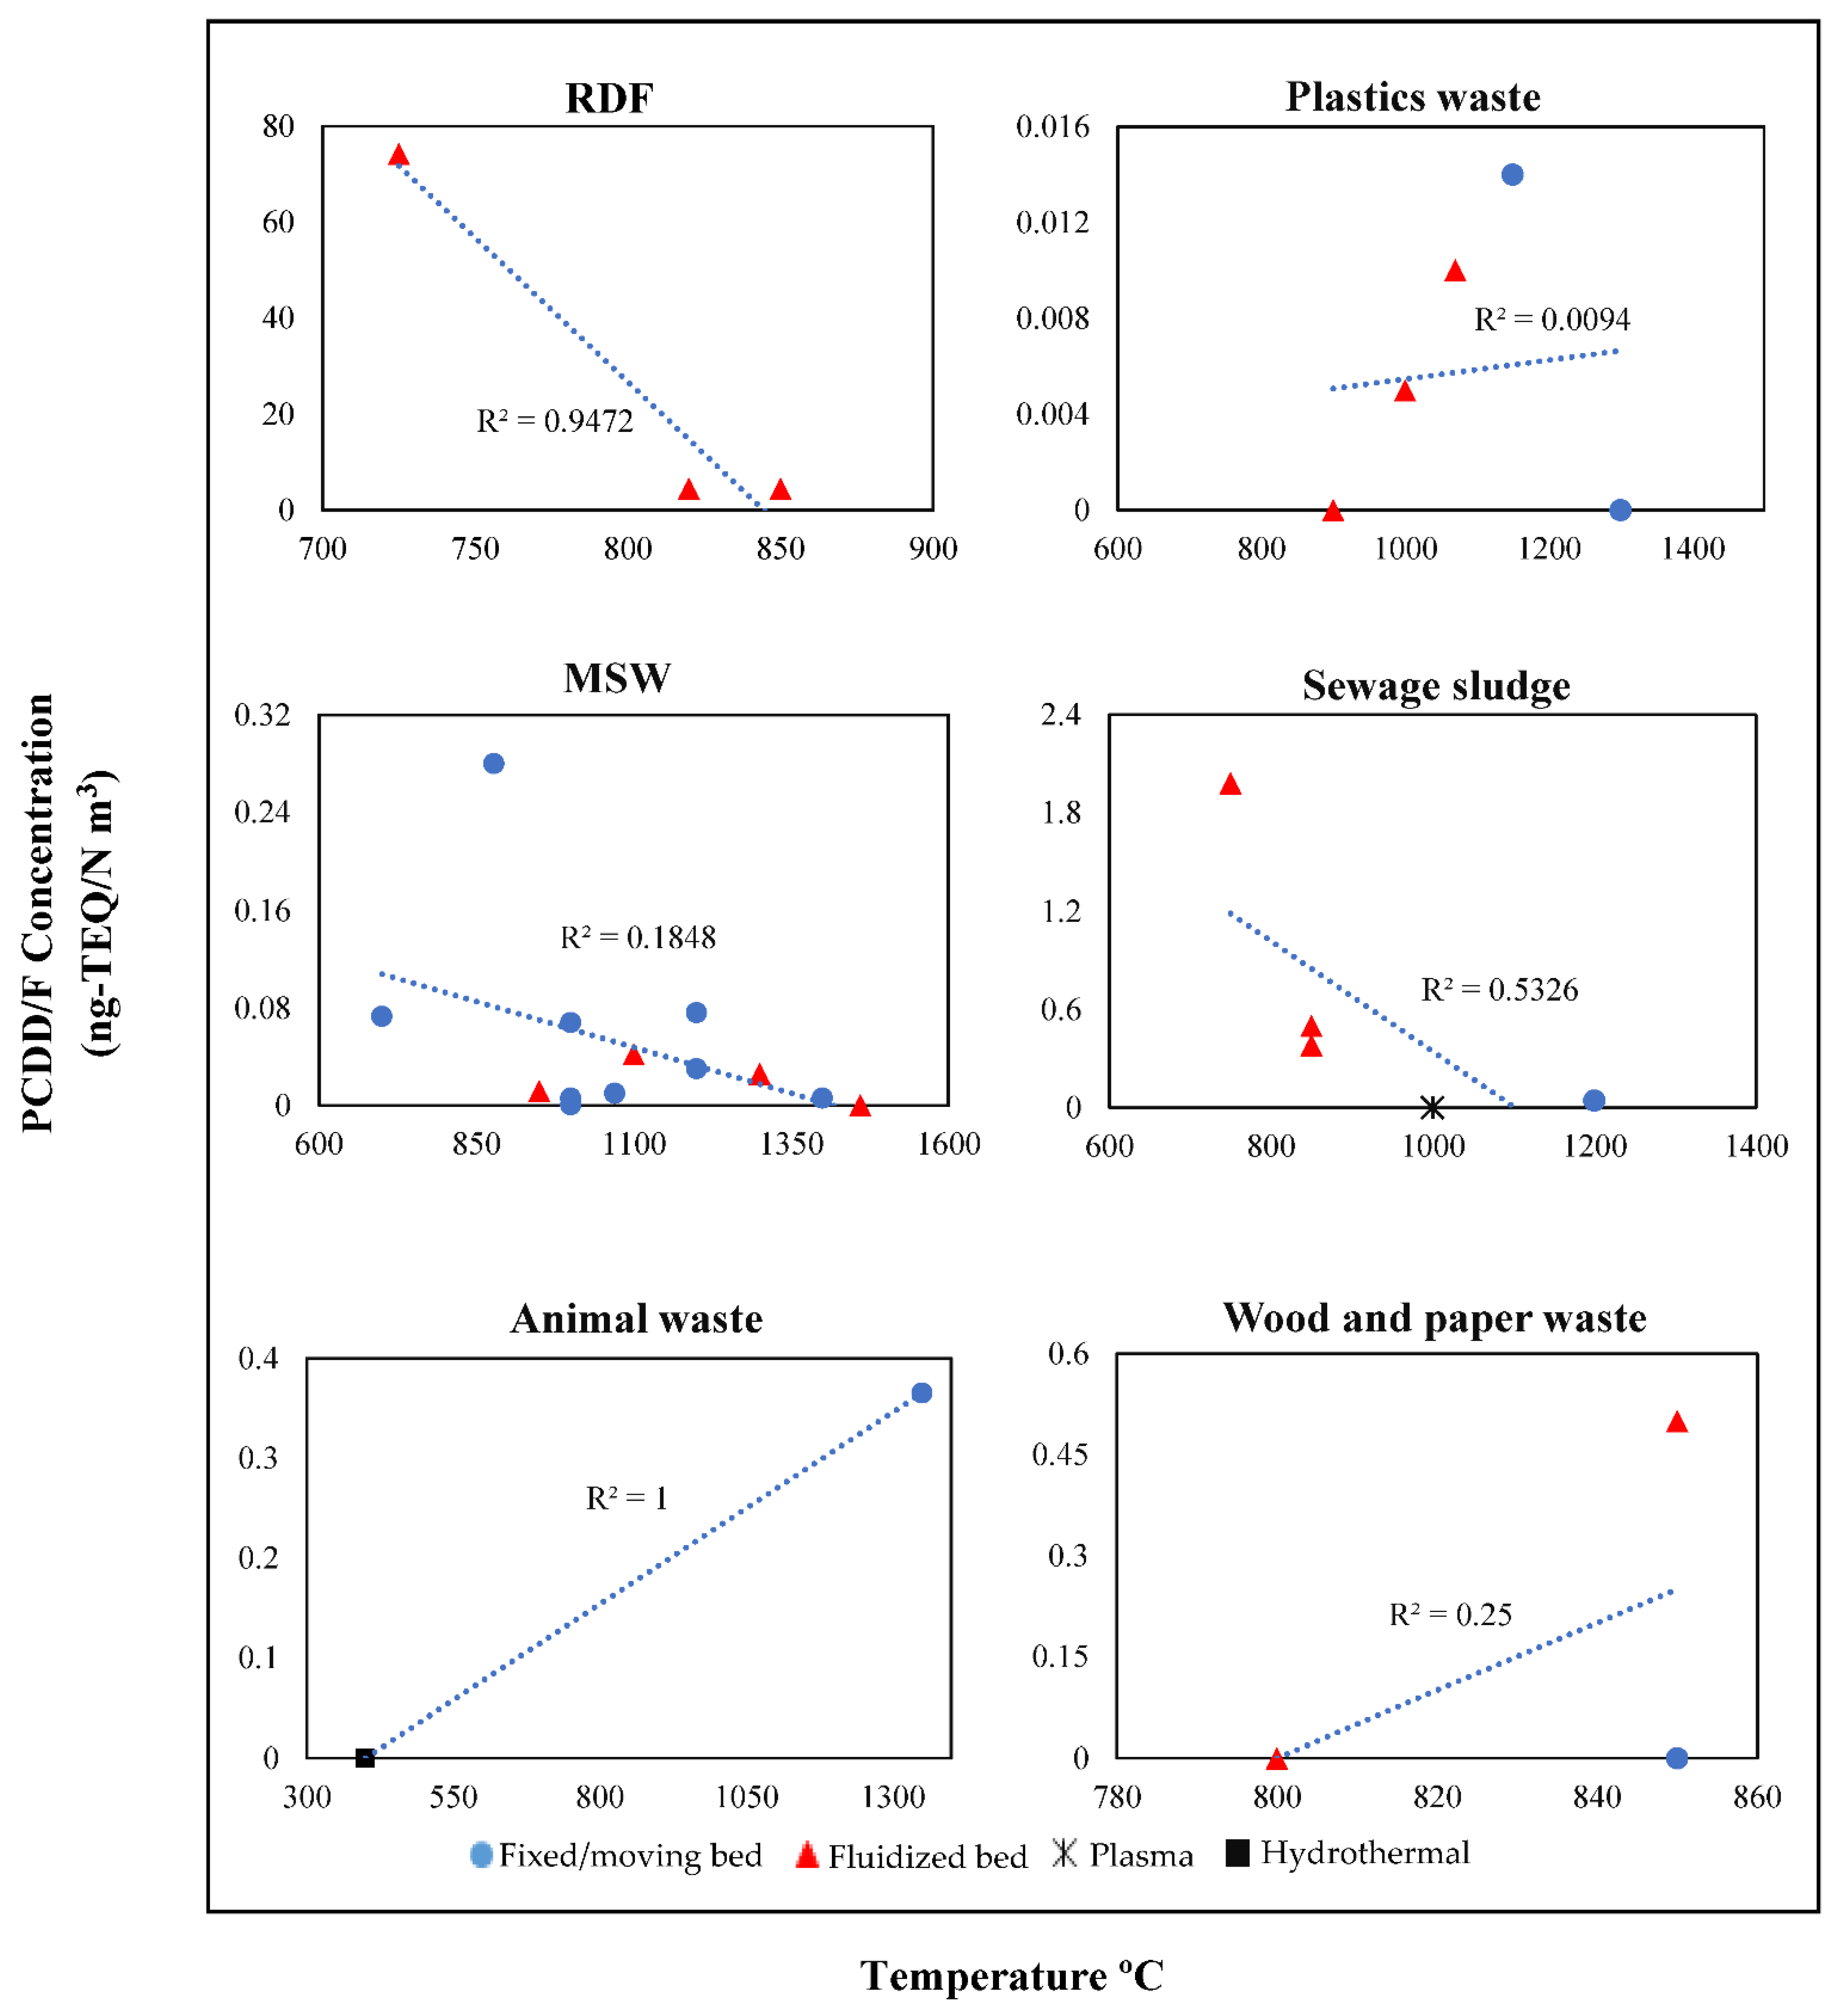
| Gasification | MSW | Moving grit gasifier | 877.82 | 0.28 | - | dioxin concentration below the allowed value set by the Brazilian legislation (0.5), USA (0.1 to 0.3 for new plants and 0.3 to 0.8 for existing plants), Canada (0.5). | [16] |
| Combustion | Different types of wood chips and waste wood | Moving grate, Grate burner, Fluidized bed | Temperature is not reported, burners vary in power from 500 kW to 10 MW | 0.0027–9.57 | - | Emissions from grate burners when using wood pellets goes below allowed value. | [3] |
| Gasification | Torrefied wood pellet | Downdraft GEK gasifier | 850 | Lower than the limit | - | - | [70] |
| Gasification | Sewage sludge with wood pellets | Fixed-bed updraft | 1010–1394 | 0.043 | - | PCDD/Fs were completely destroyed at temperatures above 600 °C. | [21] |
| Gasification | MSW | Thermoselect | 1200–1600 | 0.03 | CO 25–34% H2 28–38% HHV of syngas varies from 10.88–14.65 MJ/Nm3 | - | [55] |
| Gasification | MSW | Fixed bed Thermoselect | 1200 | 0.03 | CO 27–40% H2 36–40% Heating value 8–10.2 MJ/Nm3 | - | [74] |
| Pyrolysis and combustion | Animal wastes | Horizontal furnace | 600–1100 | The highest for pyrolysis at 850 °C was 20.2 and for combustion was 43 | - | - | [75] |
| Pyrolysis and combustion | Cotton textile, polyester textile, Polyvinyl chloride (PVC), sewage sludge, waste lube oils, meat and bone meals, and paper waste. | Batch laboratory scale Horizontal tubular reactor | 850 | Combustion: 14.8 14 4500 55 80 40 17 Pyrolysis: - - 215 81 - 21 - | - | Some data is not present in pyrolysis for materials such as polyester textiles, waste lube oil, waste paper. | [76] |
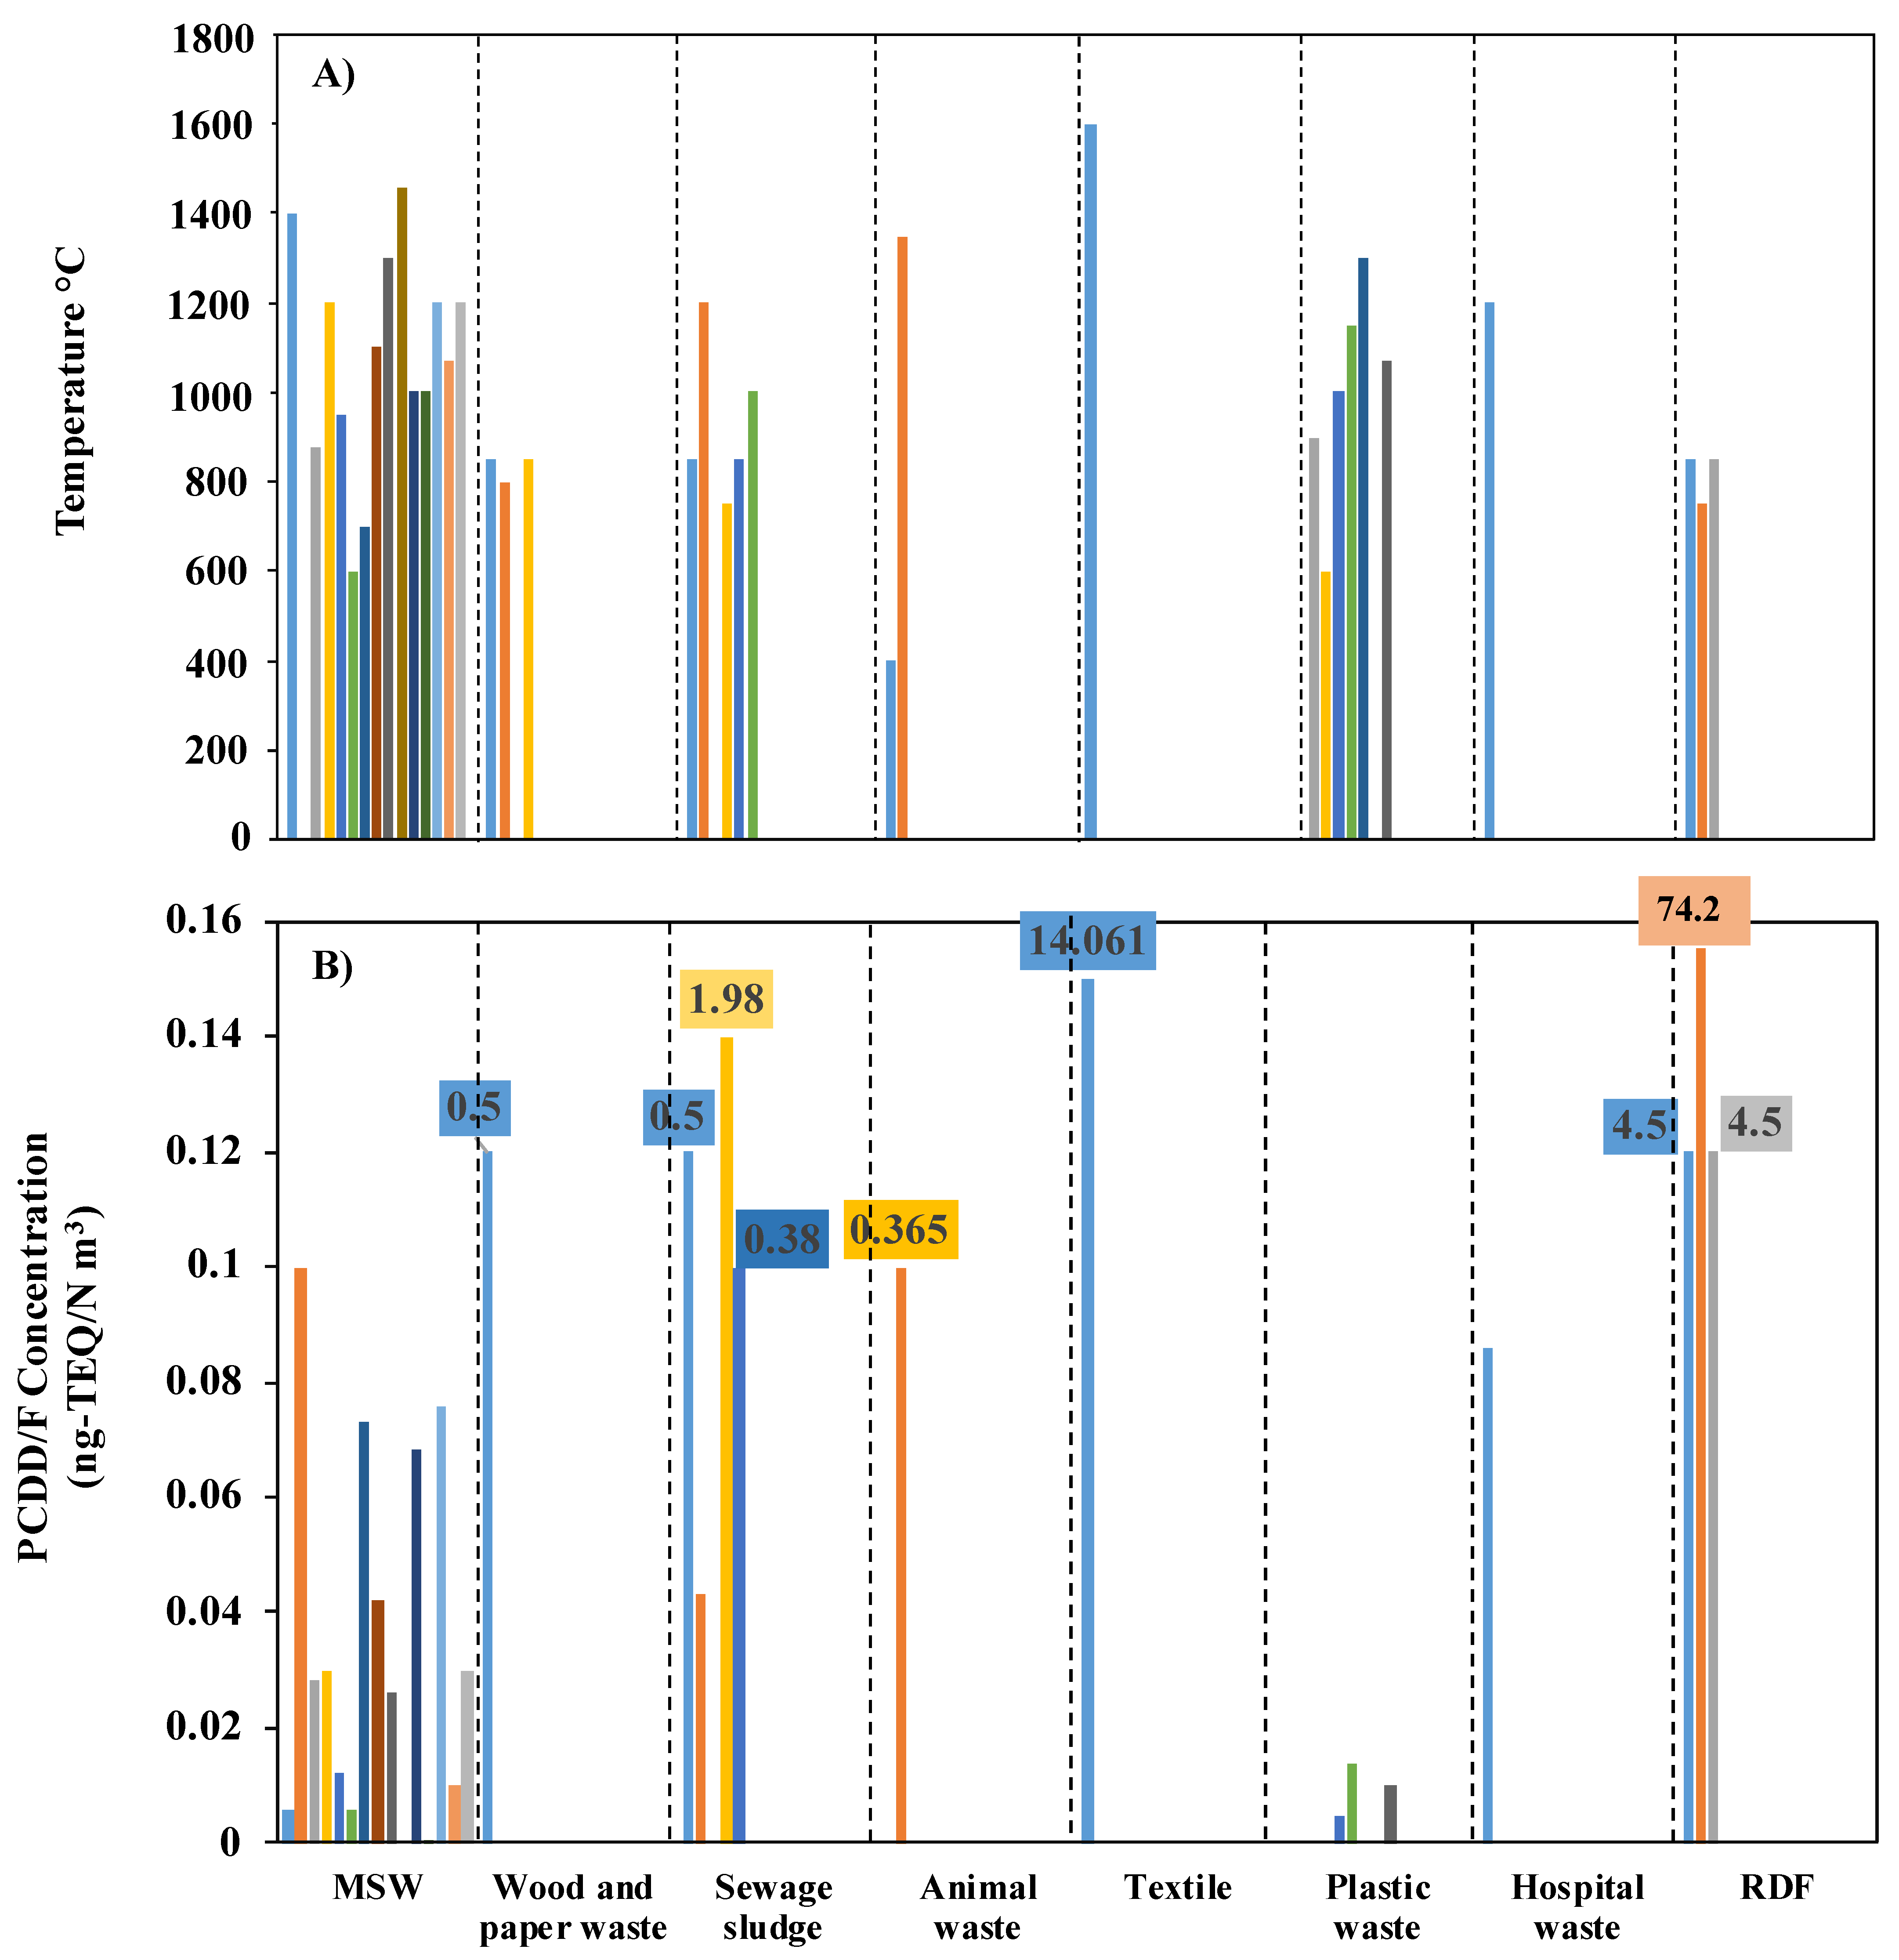
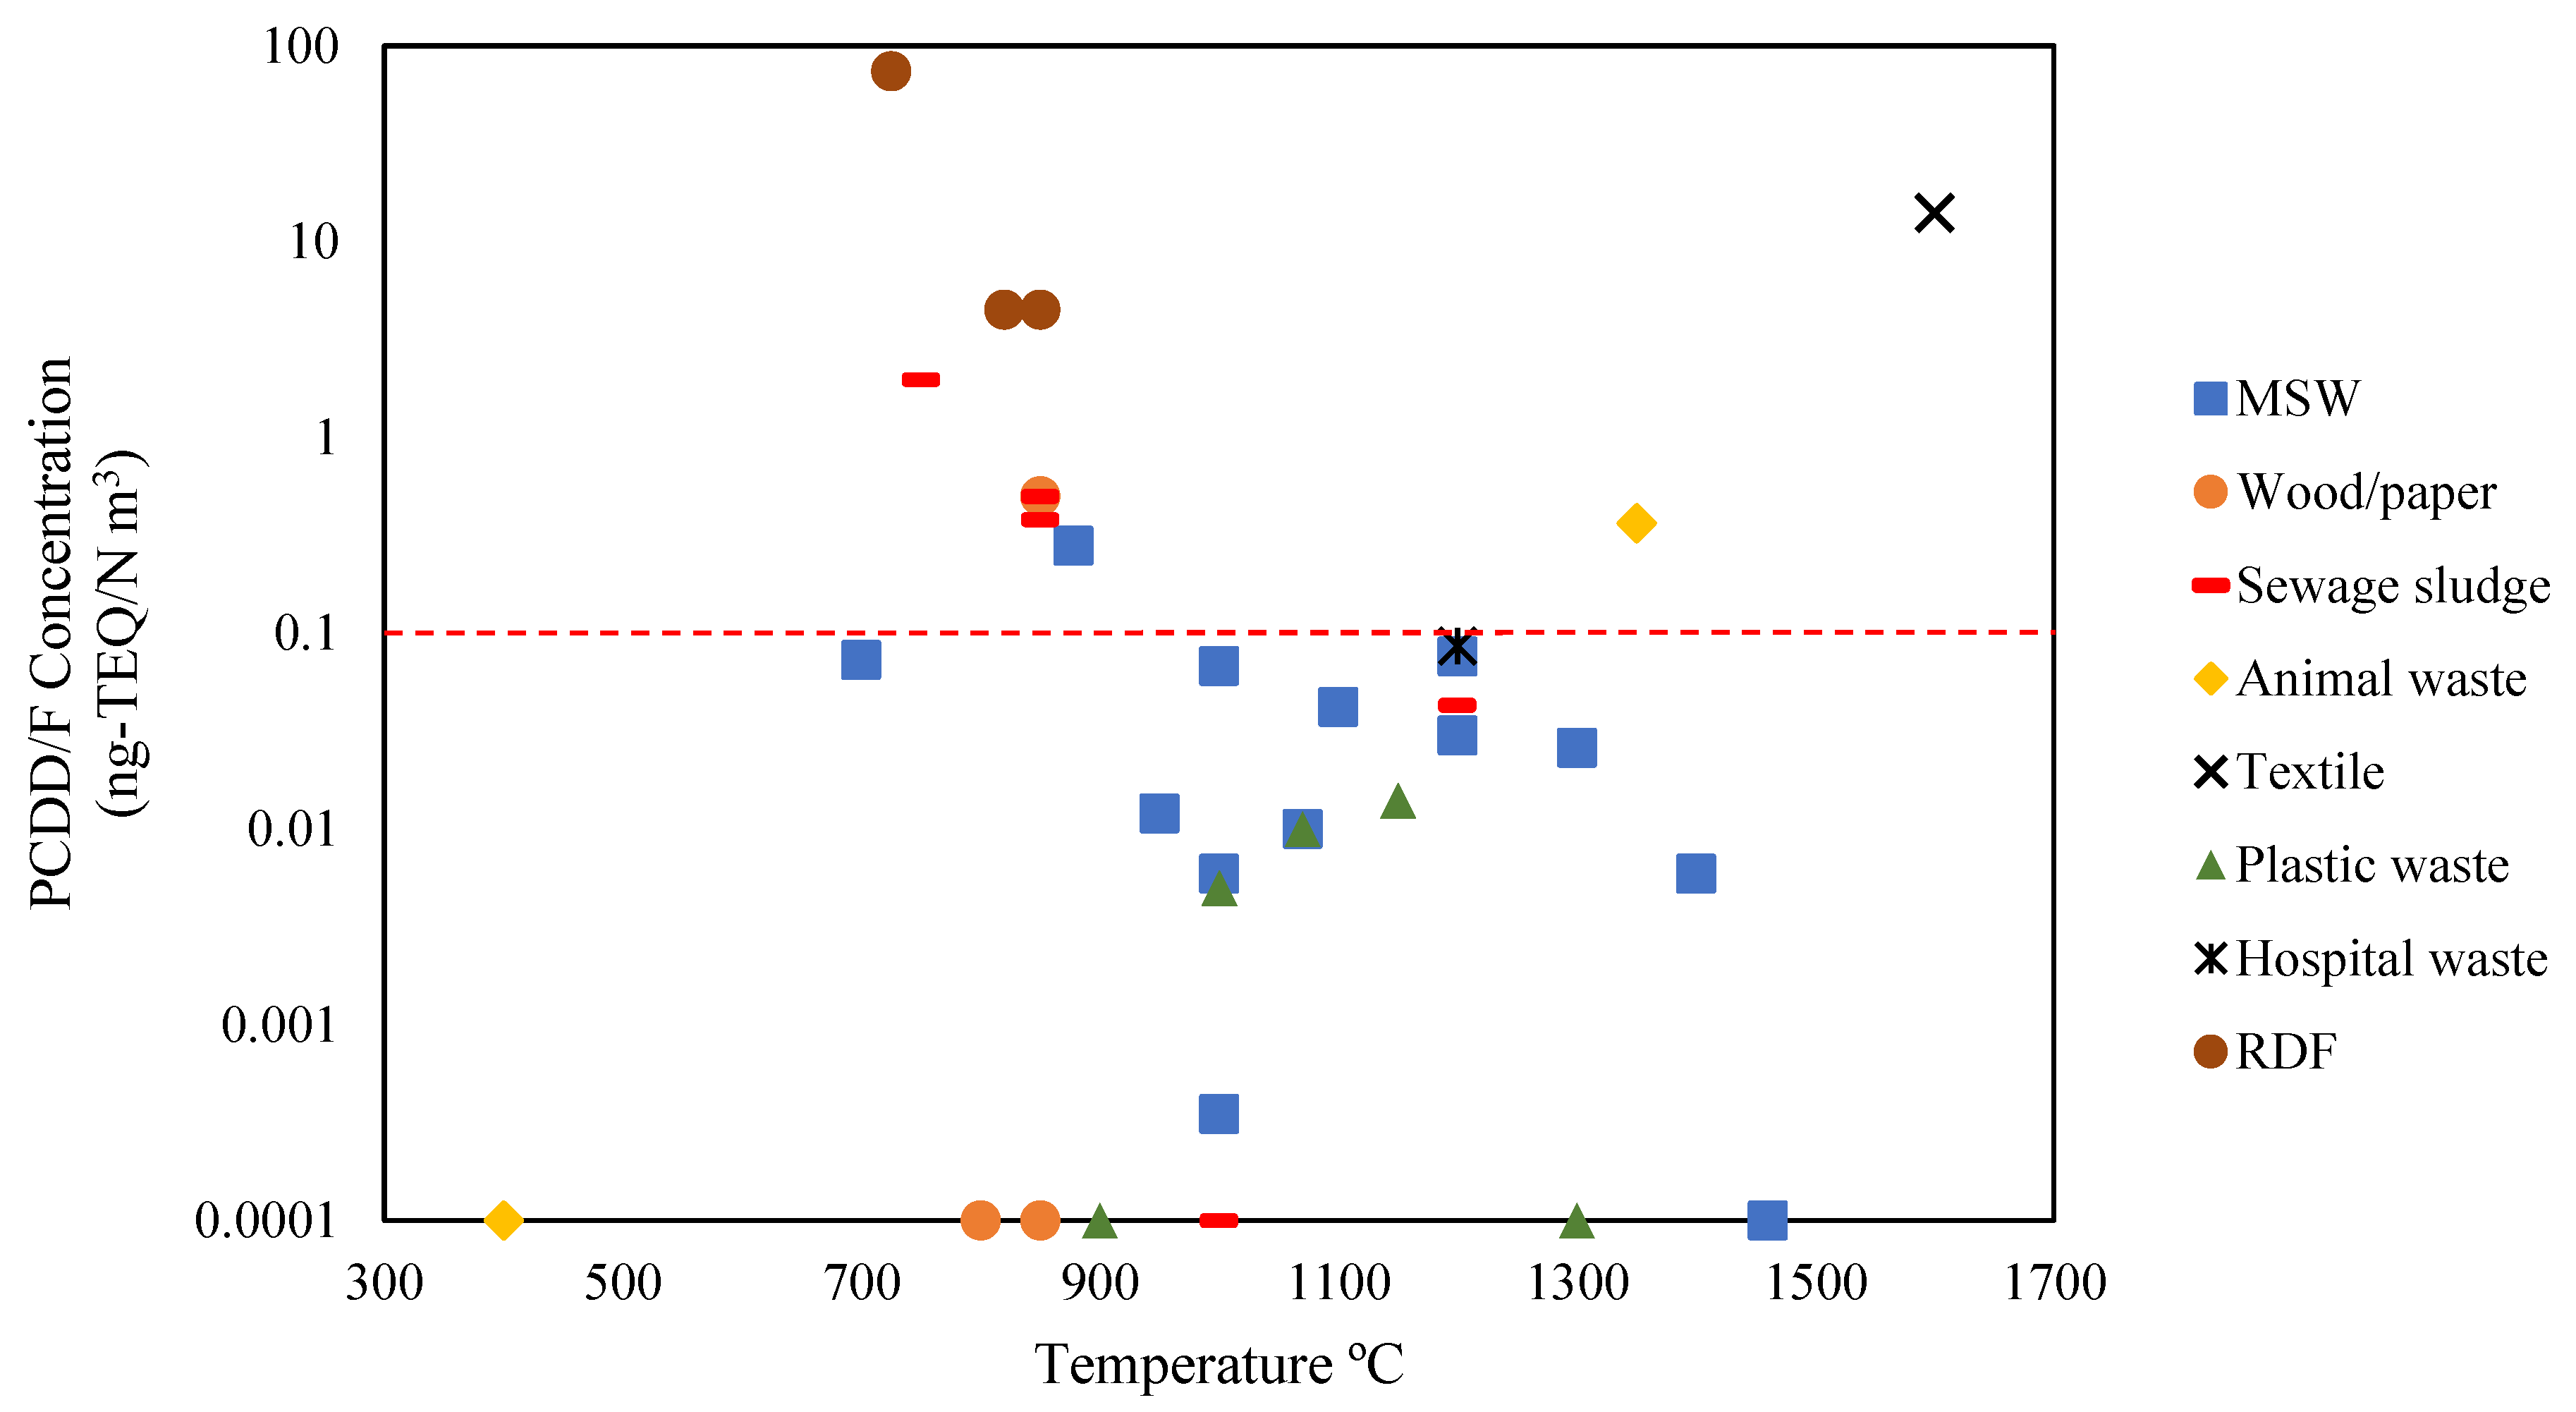
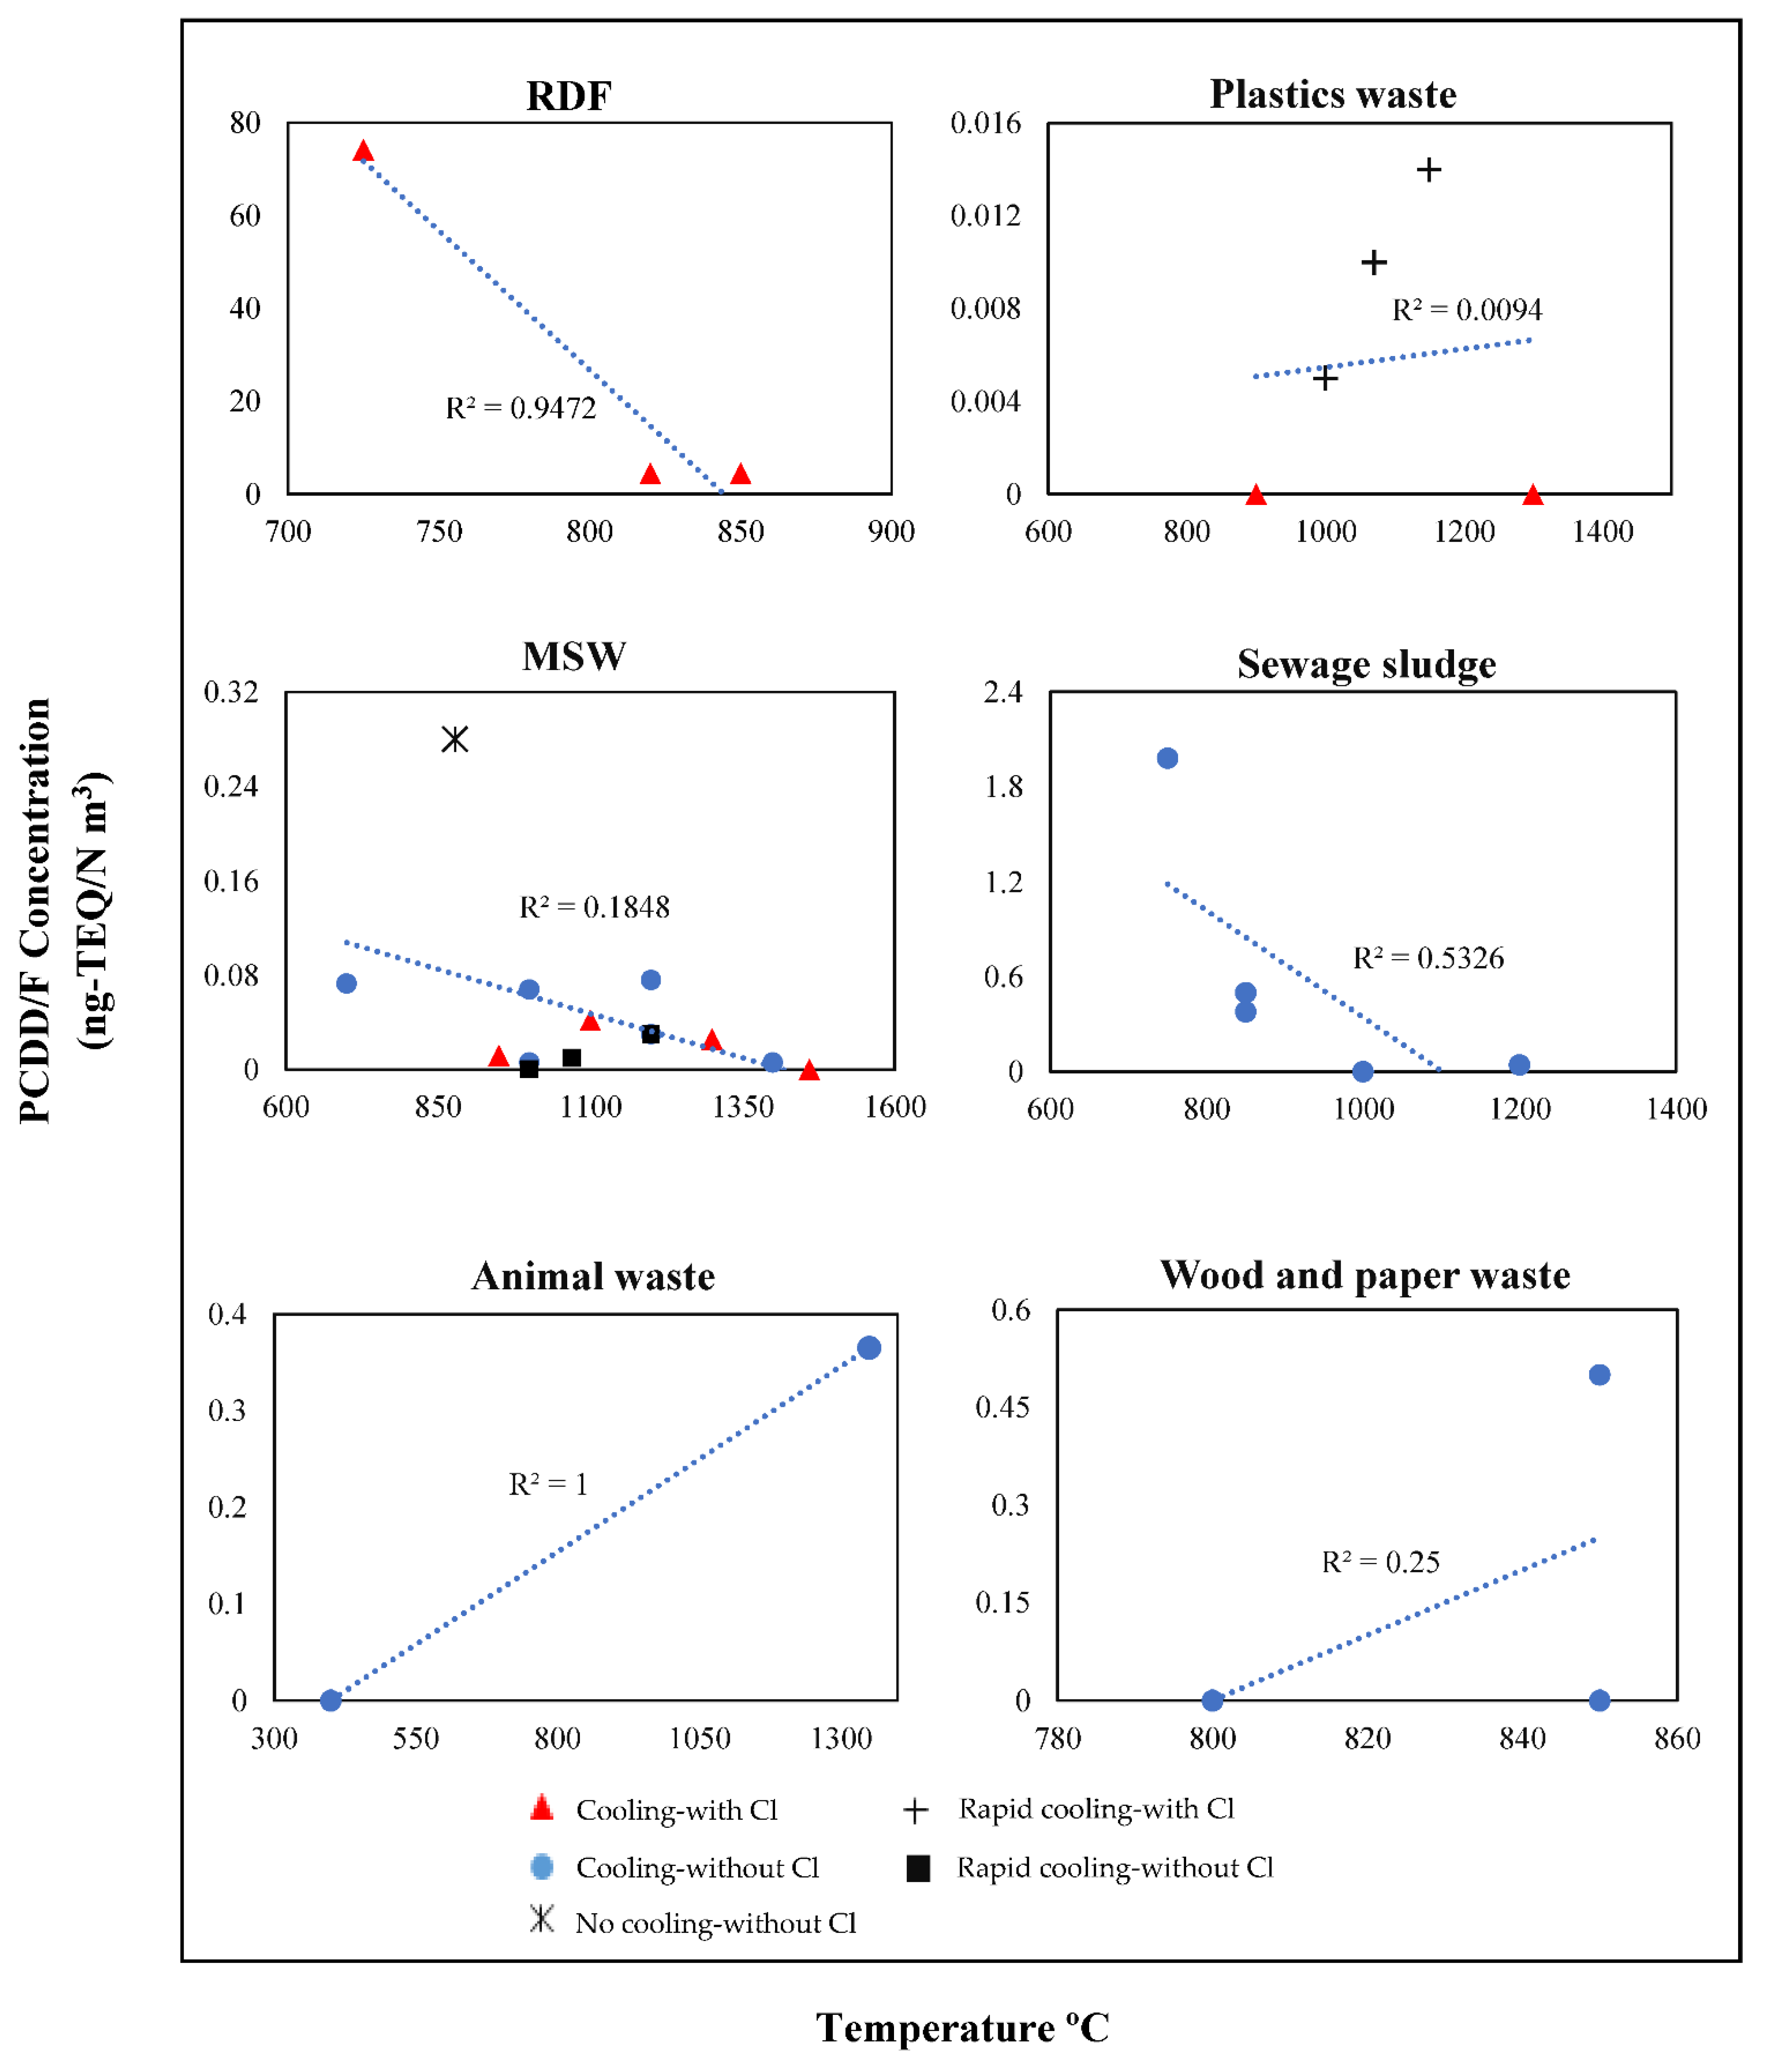
| Gasification | Sewage sludge | Fluidized bed | 750–850 | At 750 °C was 1.98 and at 850 °C was 0.38 | CO 16.8% H2 14.9% CO2 13.5% CH4 4.1% N2 47% | - | [58] |
| Gasification | RDF | Fluidized bed | 725–820 | At 725 °C was 74.2 and at 820 °C was 4.5 | CO 12.1% H2 7.1% CO2 13.7% CH4 6.4% N2 53% | - | [58] |
| Co-gasification | Coal and MSW | Fluidized bed | 600–950 | In raw gas was 0.012. In flue gas was 0.002. In exhaust gas was 0.005 | CO 37% H2 34% CO2 25% CH4 5% | Flue gases from the same plant, contained 0.03 ng-TEQ/Nm3 PCDD/F because of the fraction of plastic waste from sorting. The PCDD/F stream derived with the slag during an hour is equal to the stream of these compounds in the raw gas. | [66] |
| Gasification | MSW | Direct melting system | 1000 | In flue gas was 0.0059–0.0082. In fly ash was 0.18–0.037 | LHV of syngas MJ/m3 was 4.4–5.9 | - | [77] |
| Gasification | Chicken manure | Hydrothermal gasification | 200–400 | PCDD/Fs were not detected | Without the additive 0.1943 mmol H2, 0.2617 mmol CO, 0.0244 mmol CO2, 0.0024 mmol CH4 With the additive the yields of gasses were decreased. | The alkaline additive Ca(OH)2 enhances the reaction rate of the hydrothermal gasification at low reaction temperature. | [68] |
| Gasification | WEEE plastics | - | 1200 | 0.014–0.59 | - | The allowed limit by Japan legislation is (0.1 to 0.5 ng-TEQ/Nm3). | [62] |
| Gasification | Pelletized and loose straw | Fluidized bed | 792–826 | Small negligible | For pelletized straw CO 13–14% H2 17–18% CO2 16–18% CH4 3–4% N2 49–50% For loose straw CO 14–17% H2 8–9% CO2 16–17% CH4 5% N2 51–54% | Higher amount of tars in experiments with loose straw. PAHs were present in large amounts in the fly ash especially for loose straw. | [67] |
| Gasification | Biofermenting residue with coal-water slurry | Multicomponent slurry pressure gasifier | 1300−1400 | 0.365 | CO 43.7% H2 34.2% CO2 18.2% CH4 0.3% | It meets the PCDD/F concentration limit of China (0.5 ng-TEQ/Nm3) but is far beyond the limits in the EU. | [69] |
| Gasification | Carpet and textile waste | Plasma gasification | 1600 | 14.061 | CO 11.7% H2 8.1% CO2 3.1% CH4 1.1% O2 1.1% | Presence of Cl elevates dioxin formation and the gas cools down in 200 to 400 °C where secondary dioxin formation occurs. | [78] |
| Gasification | MSW Plastic waste PVC refuse | - | 1000 | 0.0035–0.014 | - | The measured values were converted assuming 12% oxygen. | [65] |
| Gasification | MSW | Drying, pyrolysis, gasification, combustion, and ash vitrification in one step | 600–1200 | 0.076 | - | - | [79] |
| Gasification | Alfalfa stem | - | - | Total chlorinated dioxin compounds were 0.1–0.6 µg/kg | - | The concentrations both in fly and bottom ash were as following: TCDD was 0.1 µg/kg, 2, 3, 7,8 trichlorodioxyfuran was 0.08 µg/kg | [80] |
| Gasification | RDF and PVC | - | 600–1000 | Lower than the limits | CO 11.4% H2 69.6% CO2 13.5% CH4 5.5% Heating value of 10.92 (MJ/m3) | - | [59] |
| Gasification | MSW | High temperature gasification and smelting system | 1070 | Less than 0.01 ng-TEQ/Nm3 | - | Gasification and smelting system with O2 blowing and drying waste, and rapid gas cooling system in high-temperature reduction atmosphere are effective for dioxin removal. | [81] |
| Gasification | Plastic waste and PVC | Sumitomo Metals gasification and smelting system | 1070 | Less than 0.01 ng-TEQ/Nm3 | - | - | [61] |
| Gasification | Plastic waste | Chemical looping gasification | 900 | too small to detect by using GC-MS | CO 21.9% H2 12.7% CO2 7.8% CH4 5.9% N2 50.7% | - | [82] |
| Gasification | Hospital waste | Drying, pyrolysis, gasification, combustion, and ash vitrification in one step | 600–1200 | 0.0861 | - | - | [83] |
| Gasification | MSW | Industrial-sized power plant | 1400 | In clean fuel gas was 0.00003 to 0.0059 and in exhaust gas was 0.0000082 to 0.0031 | CO 15.6% H2 11.9% CO2 15.3% CH4 1.1% N2 55.1% Heating value of 3700 (kJ/m3 N) | - | [84] |
4. Conclusions
- Gasification of wastes other than those mentioned in this review;
- The inhibitors of dioxin formation in gasification, such as sulfur- or nitrogen-containing agents.
Author Contributions
Funding
Acknowledgments
Conflicts of Interest
References
- Cheung, W.H.; Lee, V.K.C.; McKay, G. Minimizing dioxin emissions from integrated MSW thermal treatment. Environ. Sci. Technol. 2007, 41, 2001–2007. [Google Scholar] [CrossRef] [PubMed]
- Cunliffe, A.M.; Williams, P.T. De-novo formation of dioxins and furans and the memory effect in waste incineration flue gases. Waste Manag. 2009, 29, 739–748. [Google Scholar] [CrossRef]
- Lavric, E.D.; Konnov, A.A.; De Ruyck, J. Dioxin levels in wood combustion—A review. Biomass Bioenergy 2004, 26, 115–145. [Google Scholar] [CrossRef]
- Environment Australia. Incineration and Dioxins Review of Formation Processes. A Consultancy Funded by Environment Australia Department of the Environment and Heritage; Environment Australia: Canberra, Australia, 1999; Volume 42.
- Huang, H.; Buekens, A. On the mechanisms of dioxin formation in combustion processes. Chemosphere 1995, 31, 4099–4117. [Google Scholar] [CrossRef]
- Altarawneh, M.; Dlugogorski, B.Z.; Kennedy, E.M.; Mackie, J.C. Mechanisms for formation, chlorination, dechlorination and destruction of polychlorinated dibenzo- p -dioxins and dibenzofurans (PCDD/Fs). Prog. Energy Combust. Sci. 2009, 35, 245–274. [Google Scholar] [CrossRef]
- Paladino, O.; Massabò, M. Health risk assessment as an approach to manage an old landfill and to propose integrated solid waste treatment: A case study in Italy. Waste Manag. 2017, 68, 344–354. [Google Scholar] [CrossRef]
- Sodhi, K.K.; Kumar, M.; Singh, I.K.; Singh, D.K. Ecological Risk of Dioxin Exposure Dioxin; CRC Press: Boca Raton, FL, USA, 2020; ISBN 9781315170961. [Google Scholar]
- National Research Council. Waste Incineration and Public Health; National Academy of Sciences: Washington, DC, USA, 2000; ISBN 0309504465. [Google Scholar]
- Martens, D.; Balta-Brouma, K.; Brotsack, R.; Michalke, B.; Schramel, P.; Klimm, C.; Henkeimann, B.; Oxynos, K. Chemical impact of uncontrolled solid waste combustion to the vicinity of the Kouroupitos Ravine, Crete, Greece. Chemosphere 1998, 36, 2855–2866. [Google Scholar] [CrossRef]
- Huang, H.; Buekens, A. De novo synthesis of polychlorinated dibenzo-p -dioxins and dibenzofurans Proposal of a mechanistic scheme. Sci. Total Environ. 1996, 193, 121–141. [Google Scholar] [CrossRef]
- Tosti, S.; Sousa, M.A.; Buceti, G.; Madeira, L.M.; Pozio, A. Process analysis of refuse derived fuel hydrogasification for producing SNG. Int. J. Hydrog. Energy 2019, 44, 21470–21480. [Google Scholar] [CrossRef]
- Kirkels, A.F.; Verbong, G.P.J. Biomass gasification: Still promising? A 30-year global overview. Renew. Sustain. Energy Rev. 2011, 15, 471–481. [Google Scholar] [CrossRef]
- Basu, P. Biomass Gasification, Pyrolysis and Torrefaction Practical Design and Theory, 2nd ed.; Elsevier: Amsterdam, The Netherlands, 2013. [Google Scholar]
- Knoef, H.; Ahrenfeldt, J. Handbook Biomass Gasification; BTG Biomass Technology Group: Enschede, The Netherlands, 2005. [Google Scholar]
- Lopes, E.J.; Okamura, L.A.; Yamamoto, C.I. Formation of dioxins and furans during municipal solid waste gasification. Braz. J. Chem. Eng. 2015, 32, 87–97. [Google Scholar] [CrossRef] [Green Version]
- Panepinto, D.; Tedesco, V.; Brizio, E.; Genon, G. Environmental Performances and Energy Efficiency for MSW Gasification Treatment. Waste Biomass Valorization 2014, 6, 123–135. [Google Scholar] [CrossRef]
- Thakare, S.; Nandi, S. Study on Potential of Gasification Technology for Municipal Solid Waste (MSW) in Pune City. Energy Procedia 2015, 90, 509–517. [Google Scholar] [CrossRef]
- Klein, A. Gasification: An Alternative Process for Energy Recovery and Disposal of Municipal Solid Wastes. New York. 2002. Available online: http://www.zetatalk10.com/docs/Gasifiers/Gasification_Of_Municipal_Solid_Wastes_2002.pdf (accessed on 30 May 2002).
- Xu, P.; Jin, Y.; Cheng, Y. Thermodynamic Analysis of the Gasification of Municipal Solid Waste. Engineering 2017, 3, 416–422. [Google Scholar] [CrossRef]
- Seggiani, M.; Puccini, M.; Raggio, G.; Vitolo, S. Effect of sewage sludge content on gas quality and solid residues produced by cogasification in an updraft gasifier. Waste Manag. 2012, 32, 1826–1834. [Google Scholar] [CrossRef]
- Werther, J.; Ogada, T. Sewage sludge combustion. Prog. Energy Combust. Sci. 1999, 25, 55–116. [Google Scholar] [CrossRef]
- Costner, B.P.; Cray, W.C.; Martin, G.; Rice, B.; Santillo, D.; Stringer, R. PVC: A Primary Contributor to the U.S. Dioxin Burden; Citeseer: Princeton, NJ, USA, 1995. [Google Scholar]
- Safavi, S.M.; Richter, C.; Unnthorsson, R. Dioxin and Furan Emissions from Gasification. In Gasification; IntechOpen: London, UK, 2021. [Google Scholar]
- Zhang, M.; Buekens, A.; Li, X. Brominated flame retardants and the formation of dioxins and furans in fires and combustion. J. Hazard. Mater. 2016, 304, 26–39. [Google Scholar] [CrossRef]
- Duwel, U.; Nottrodt, A.; Ballschmiter, K. Simultaneous sampling of PCDD/PCDF inside the combustion chamber and on four boiler levels of a waste incineration plant. Chemosphere 1990, 20, 1839–1846. [Google Scholar] [CrossRef]
- Maric, J.; Berdugo Vilches, T.; Pissot, S.; Cañete Vela, I.; Gyllenhammar, M.; Seemann, M. Emissions of dioxins and furans during steam gasification of Automotive Shredder residue; experiences from the Chalmers 2–4-MW indirect gasifier. Waste Manag. 2020, 102, 114–121. [Google Scholar] [CrossRef] [PubMed]
- McKay, G. Dioxin characterisation, formation and minimisation during municipal solid waste (MSW) incineration: Review. Chem. Eng. J. 2002, 86, 343–368. [Google Scholar] [CrossRef]
- Tame, N.W.; Dlugogorski, B.Z.; Kennedy, E.M. Formation of dioxins and furans during combustion of treated wood. Prog. Energy Combust. Sci. 2007, 33, 384–408. [Google Scholar] [CrossRef]
- Sippula, O.; Lind, T.; Jokiniemi, J. Effects of chlorine and sulphur on particle formation in wood combustion performed in a laboratory scale reactor. Fuel 2008, 87, 2425–2436. [Google Scholar] [CrossRef]
- Lu, S.; Yan, J.; Li, X.; Ni, M.; Cen, K.; Dai, H. Effects of inorganic chlorine source on dioxin formation using fly ash from a fluidized bed incinerator. J. Environ. Sci. 2007, 19, 756–761. [Google Scholar] [CrossRef]
- Baumgärtel, G. The Siemens Thermal Waste Recycling Process—A modern technology for converting waste into usable products. J. Anal. Appl. Pyrolysis 1993, 27, 15–23. [Google Scholar] [CrossRef]
- Schubert, R.; Stahlberg, R. Advanced Continuous In-line Gasification and Vitrification of Solid Waste. Sustain. Dev. Int. 1999, 1, 37–40. [Google Scholar]
- Zhang, M.; Yang, J.; Buekens, A.; Olie, K.; Li, X. PCDD/F catalysis by metal chlorides and oxides. Chemosphere 2016, 159, 536–544. [Google Scholar] [CrossRef]
- Zhang, R.-Z.; Wang, L.-Z.; Yin, R.-H.; Luo, Y.-H. Alteration in formation behaviors of chloroaromatic precursors of PCDD/Fs: An experimental study on the effect of extrinsic and intrinsic oxygen on chlorination. Chemosphere 2020, 243, 125319. [Google Scholar] [CrossRef]
- Liu, W.; Zheng, M.; Zhang, B.; Qian, Y.; Ma, X.; Liu, W. Inhibition of PCDD/Fs formation from dioxin precursors by calcium oxide. Chemosphere 2005, 60, 785–790. [Google Scholar] [CrossRef]
- Ma, J.; Wang, J.; Tian, X.; Zhao, H. In-situ gasification chemical looping combustion of plastic waste in a semi-continuously operated fluidized bed reactor. Proc. Combust. Inst. 2019, 37, 4389–4397. [Google Scholar] [CrossRef]
- Zhao, X.; Zhou, H.; Sikarwar, V.S.; Zhao, M.; Park, A.H.A.; Fennell, P.S.; Shen, L.; Fan, L.S. Biomass-based chemical looping technologies: The good, the bad and the future. Energy Environ. Sci. 2017, 10, 1885–1910. [Google Scholar] [CrossRef] [Green Version]
- Cai, J.; Zheng, W.; Luo, M.; Kuang, C.; Tang, X. Characterization of copper (II) chemical forms and heavy metal distribution in chemical looping gasification of municipal solid waste. J. Energy Inst. 2021, 96, 140–147. [Google Scholar] [CrossRef]
- Kamińska-Pietrzak, N.; Smoliński, A. Selected Environmental Aspects of Gasification and Co-Gasification of Various Types of Waste. J. Sustain. Min. 2013, 12, 6–13. [Google Scholar] [CrossRef] [Green Version]
- Cai, J.; Zeng, R.; Zheng, W.; Wang, S.; Han, J.; Li, K.; Luo, M.; Tang, X. Synergistic effects of co-gasification of municipal solid waste and biomass in fixed-bed gasifier. Process Saf. Environ. Prot. 2021, 148, 1–12. [Google Scholar] [CrossRef]
- Zwart, R.W.R.; Van der Drift, A.; Bos, A.; Visser, H.J.M.; Cieplik, M.K.; Könemann, H.W.J. Oil-based gas washing-Flexible tar removal for high-efficient production of clean heat and power as well as sustainable fuels and chemicals. Environ. Prog. Sustain. Energy 2009, 28, 324–335. [Google Scholar] [CrossRef] [Green Version]
- Ferraz, M.C.M.A.; Afonso, S.A.V. Dioxin Emission Factors for the Incineration of Different Medical Waste Types. Environ. Contam. Toxicol. 2003, 44, 460–466. [Google Scholar] [CrossRef] [PubMed]
- Walker literature review of formation and release of PCDD/Fs from gas manufacturing. Chemosphere 1997, 35, 1409–1422. [CrossRef]
- Maya, D.M.Y.; Sarmiento, A.L.E.; Oliveira, C.A.V.B.d.; Lora, E.E.S.; Andrade, R.V. Gasification of Municipal Solid Waste for Power Generation in Brazil, a Review of Available Technologies and Their Environmental Benefits. J. Chem. Chem. Eng. 2016, 10, 249–255. [Google Scholar] [CrossRef] [Green Version]
- Chagger, H.K.; Kendall, A.; McDonald, A.; Pourkashanian, M.; Williams, A. Formation of dioxins and other semi-volatile organic compounds in biomass combustion. Appl. Energy 1998, 60, 101–114. [Google Scholar] [CrossRef]
- Lind, T.; Kauppinen, E.I.; Hokkinen, J.; Jokiniemi, J.K.; Orjala, M.; Aurela, M.; Hillamo, R. Effect of Chlorine and Sulfur on Fine Particle Formation in Pilot-Scale CFBC of Biomass. Energy Fuels 2006, 20, 61–68. [Google Scholar] [CrossRef]
- Dannecker, W.; Hemschemeier, H. Level of activated-coke technology for flue gas dust collection behind refuse destruction plants looking at the problem from the special aspects of dioxin separation. Organohalogen Compd. 1990, 4, 267. [Google Scholar]
- Pařízek, T.; Bébar, L.; Stehlík, P. Persistent pollutants emission abatement in waste-to-energy systems. Clean Technol. Environ. Policy 2008, 10, 147–153. [Google Scholar] [CrossRef]
- Hiraoka, M.; Takizawa, Y.; Masuda, Y.; Takeshita, R.; Yagome, K.; Tanaka, M.; Watanabe, Y.; Morikawa, K. Investigation on generation of dioxins and related compounds from municipal incinerators in Japan. Chemosphere 1987, 16, 1901–1906. [Google Scholar] [CrossRef]
- Goemans, M.; Clarysse, P.; Joannès, J.; De Clercq, P.; Lenaerts, S.; Matthys, K.; Boels, K. Catalytic NOx reduction with simultaneous dioxin and furan oxidation. Chemosphere 2003, 50, 489–497. [Google Scholar] [CrossRef]
- Kojima, N.; Mitomo, A.; Itaya, Y.; Mori, S.; Yoshida, S. Adsorption removal of pollutants by active cokes produced from sludge in the energy recycle process of wastes. Waste Manag. 2002, 22, 399–404. [Google Scholar] [CrossRef]
- Bonte, J.L.; Fritsky, K.J.; Plinke, M.A.; Wilken, M. Catalytic destruction of PCDD/F in a fabric filter: Experience at a municipal waste incinerator in Belgium. Waste Manag. 2002, 22, 421–426. [Google Scholar] [CrossRef]
- Inoue, K.; Yasuda, K.; Kawamoto, K. Report: Atmospheric pollutants discharged from municipal solid waste incineration and gasification-melting facilities in Japan. Waste Manag. Res. 2009, 27, 617–622. [Google Scholar] [CrossRef]
- Kwak, T.-H.; Lee, S.; Park, J.-W.; Maken, S.; Yoo, Y.D.; Lee, S.-H. Gasification of municipal solid waste in a pilot plant and its impact on environment. Korean J. Chem. Eng. 2006, 23, 954–960. [Google Scholar] [CrossRef]
- Lu, P.; Huang, Q.; Bourtsalas, A.T.; Themelis, N.J.; Chi, Y.; Yan, J. Review on fate of chlorine during thermal processing of solid wastes. J. Environ. Sci. 2019, 78, 13–28. [Google Scholar] [CrossRef]
- Mukherjee, A.; Debnath, B.; Ghosh, S.K. A Review on Technologies of Removal of Dioxins and Furans from Incinerator Flue Gas. Procedia Environ. Sci. 2016, 35, 528–540. [Google Scholar] [CrossRef]
- Van Paasen, S.; Cieplik, M.; Phokawat, N. Gasification of Non-Woody Biomass; Technical Report; ECN: Petten, The Netherlands, 2006. [Google Scholar]
- Borgianni, C.; De Filippis, P.; Pochetti, F.; Paolucci, M. Gasification process of wastes containing PVC. Fuel 2002, 81, 1827–1833. [Google Scholar] [CrossRef]
- Huang, H.; Buekens, A. Chemical kinetic modeling of de novo synthesis of PCDD/F in municipal waste incinerators. Chemosphere 2001, 44, 1505–1510. [Google Scholar] [CrossRef]
- Yamamoto, T.; Sato, H.; Matsukura, Y.; Ujisawa, Y.; Ishida, H.; Sasaki, S.; Hata, Y. Gasification and smelting system using oxygen blowing for plastic waste including polyvinyl chloride. J. Mater. Cycles Waste Manag. 2004, 6, 6–12. [Google Scholar] [CrossRef]
- Yamawaki, T. The gasification recycling technology of plastics WEEE containing brominated flame retardants. Fire Mater. 2003, 27, 315–319. [Google Scholar] [CrossRef]
- Xiao, G.; Jin, B.-S.; Zhong, Z.-P.; Chi, Y.; NI, M.-J.; Cen, K.-F.; Xiao, R.; Huang, Y.-J.; Huang, H. Experimental study on MSW gasification and melting technology. J. Environ. Sci. 2007, 19, 1398–1403. [Google Scholar] [CrossRef]
- Hu, B.; Huang, Q.; Chi, Y.; Yan, J. Polychlorinated dibenzo-p-dioxins and dibenzofurans in a three-stage municipal solid waste gasifier. J. Clean. Prod. 2019, 86, 1279–1296. [Google Scholar] [CrossRef]
- Kikuchi, R.; Sato, H.; Matsukura, Y.; Yamamoto, T. Semi-pilot scale test for production of hydrogen-rich fuel gas from different wastes by means of a gasification and smelting process with oxygen multi-blowing. Fuel Process. Technol. 2005, 86, 1279–1296. [Google Scholar] [CrossRef]
- Adlhoch, W.; Sato, H.; Wolff, J.; Radtke, K. High-temperature Winkler gasification of municipal solid waste. Gasif. Technol. Conf. 2000, 8, 1–15. [Google Scholar]
- Asikainen, A.H.; Kuusisto, M.P.; Hiltunen, M.A.; Ruuskanen, J. Occurrence and Destruction of PAHs, PCBs, ClPhs, ClBzs, and PCDD/Fs in Ash from Gasification of Straw. Environ. Sci. Technol. 2002, 36, 2193–2197. [Google Scholar] [CrossRef] [PubMed]
- Bircan, S.Y.; Matsumoto, K.; Kitagaw, K. Environmental Impacts of Hydrogen Production by Hydrothermal Gasification of a Real Biowaste. In Gasification for Practical Applications; InTech Open: London, UK, 2012; p. 15. ISBN 9789537619992. [Google Scholar]
- Du, Y.; Jiang, X.; Ma, X.; Tang, L.; Wang, M.; Lv, G.; Jin, Y.; Wang, F.; Chi, Y.; Yan, J. Cogasification of biofermenting residue in a coal-water slurry gasifier. Energy Fuels 2014, 28, 2054–2058. [Google Scholar] [CrossRef]
- Rollinson, A.N.; Williams, O. Experiments on torrefied wood pellet: Study by gasification and characterization for waste biomass to energy applications. R. Soc. Open Sci. 2016, 3, 150578. [Google Scholar] [CrossRef] [PubMed] [Green Version]
- Wu, S.; Azharuddin, M.; Sasaoka, E. Characteristics of the removal of mercury vapor in coal derived fuel gas over iron oxide sorbents. Fuel 2006, 85, 213–218. [Google Scholar] [CrossRef]
- Behrend, P.; Krishnamoorthy, B. Considerations for waste gasification as an alternative to landfilling in Washington state using decision analysis and optimization. Sustain. Prod. Consum. 2017, 12, 170–179. [Google Scholar] [CrossRef]
- Prabhansu; Karmakar, M.K.; Chandra, P.; Chatterjee, P.K. A review on the fuel gas cleaning technologies in gasification process. J. Environ. Chem. Eng. 2015, 3, 689–702. [Google Scholar] [CrossRef]
- Kwak, T.H.; Maken, S.; Lee, S.; Park, J.W.; Min, B.-R.; Yoo, Y.D. Environmental aspects of gasification of Korean municipal solid waste in a pilot plant. Fuel 2006, 85, 2012–2017. [Google Scholar] [CrossRef]
- Conesa, J.A.; Fullana, A.; Font, R. Dioxin production during the thermal treatment of meat and bone meal residues. Chemosphere 2005, 59, 85–90. [Google Scholar] [CrossRef] [PubMed]
- Conesa, J.A.; Font, R.; Fullana, A.; Martín-Gullón, I.; Aracil, I.; Gálvez, A.; Moltó, J.; Gómez-Rico, M.F. Comparison between emissions from the pyrolysis and combustion of different wastes. J. Anal. Appl. Pyrolysis 2009, 84, 95–102. [Google Scholar] [CrossRef] [Green Version]
- Tanigaki, N.; Manako, K.; Osada, M. Co-gasification of municipal solid waste and material recovery in a large-scale gasification and melting system. Waste Manag. 2012, 32, 667–675. [Google Scholar] [CrossRef] [PubMed]
- Lemmens, B.; Elslander, H.; Vanderreydt, I.; Peys, K.; Diels, L.; Oosterlinck, M.; Joos, M. Assessment of plasma gasification of high caloric waste streams. Waste Manag. 2007, 27, 1562–1569. [Google Scholar] [CrossRef] [PubMed]
- Liu, Y.; Liu, Y. Novel incineration technology integrated with drying, pyrolysis, gasification, and combustion of MSW and ashes vitrification. Environ. Sci. Technol. 2005, 39, 3855–3863. [Google Scholar] [CrossRef]
- Mozaffari, M.; Rosen, C.J.; Russelle, M.P.; Nater, E.A. Chemical Characterization of Ash from Gasification of Alfalfa Stems: Implications for Ash Management. J. Environ. Qual. 2000, 29, 963. [Google Scholar] [CrossRef]
- Yamamoto, T.; Isaka, K.; Sato, H.; Matsukura, Y.; Ishida, H. Gasification and Smelting System Using Oxygen Blowing for Municipal Waste. ISIJ Int. 2008, 40, 260–265. [Google Scholar] [CrossRef] [Green Version]
- Wang, J.; Zhao, H. Application of CaO-Decorated Iron Ore for Inhibiting Chlorobenzene during in Situ Gasification Chemical Looping Combustion of Plastic Waste. Energy Fuels 2016, 30, 5999–6008. [Google Scholar] [CrossRef]
- Liu, Y.; Ma, L.; Liu, Y.; Kong, G. Investigation of Novel Incineration Technology for Hospital Waste. Environ. Sci. Technol. 2006, 40, 6411–6417. [Google Scholar] [CrossRef] [PubMed]
- Noma, T.; Ide, K.; Yoshikawa, J.; Kojo, K.; Matsui, H.; Nakajima, R.; Imai, K. Development of waste gasification and gas reforming system for municipal solid waste (MSW). J. Mater. Cycles Waste Manag. 2012, 14, 153–161. [Google Scholar] [CrossRef]

Publisher’s Note: MDPI stays neutral with regard to jurisdictional claims in published maps and institutional affiliations. |
© 2022 by the authors. Licensee MDPI, Basel, Switzerland. This article is an open access article distributed under the terms and conditions of the Creative Commons Attribution (CC BY) license (https://creativecommons.org/licenses/by/4.0/).
Share and Cite
Safavi, A.; Richter, C.; Unnthorsson, R. Dioxin Formation in Biomass Gasification: A Review. Energies 2022, 15, 700. https://doi.org/10.3390/en15030700
Safavi A, Richter C, Unnthorsson R. Dioxin Formation in Biomass Gasification: A Review. Energies. 2022; 15(3):700. https://doi.org/10.3390/en15030700
Chicago/Turabian StyleSafavi, Aysan, Christiaan Richter, and Runar Unnthorsson. 2022. "Dioxin Formation in Biomass Gasification: A Review" Energies 15, no. 3: 700. https://doi.org/10.3390/en15030700
APA StyleSafavi, A., Richter, C., & Unnthorsson, R. (2022). Dioxin Formation in Biomass Gasification: A Review. Energies, 15(3), 700. https://doi.org/10.3390/en15030700