
Deactivation Model Study of High Temperature H2S Wet-Desulfurization by Using ZnO

 ,
,  ,
,  ,
, 
 and
and 
Abstract
:1. Introduction
2. Experimental Test Bench
- N2, 99.999% (impurities H2O < 5 ppm; O2 < 5 ppm; CnHm < 0.5 ppm; H2 < 0.5 ppm)
- N2 99.9999% + H2S 1000 ppm (with ±2.1 ppm uncertainty)
3. Results and Discussion
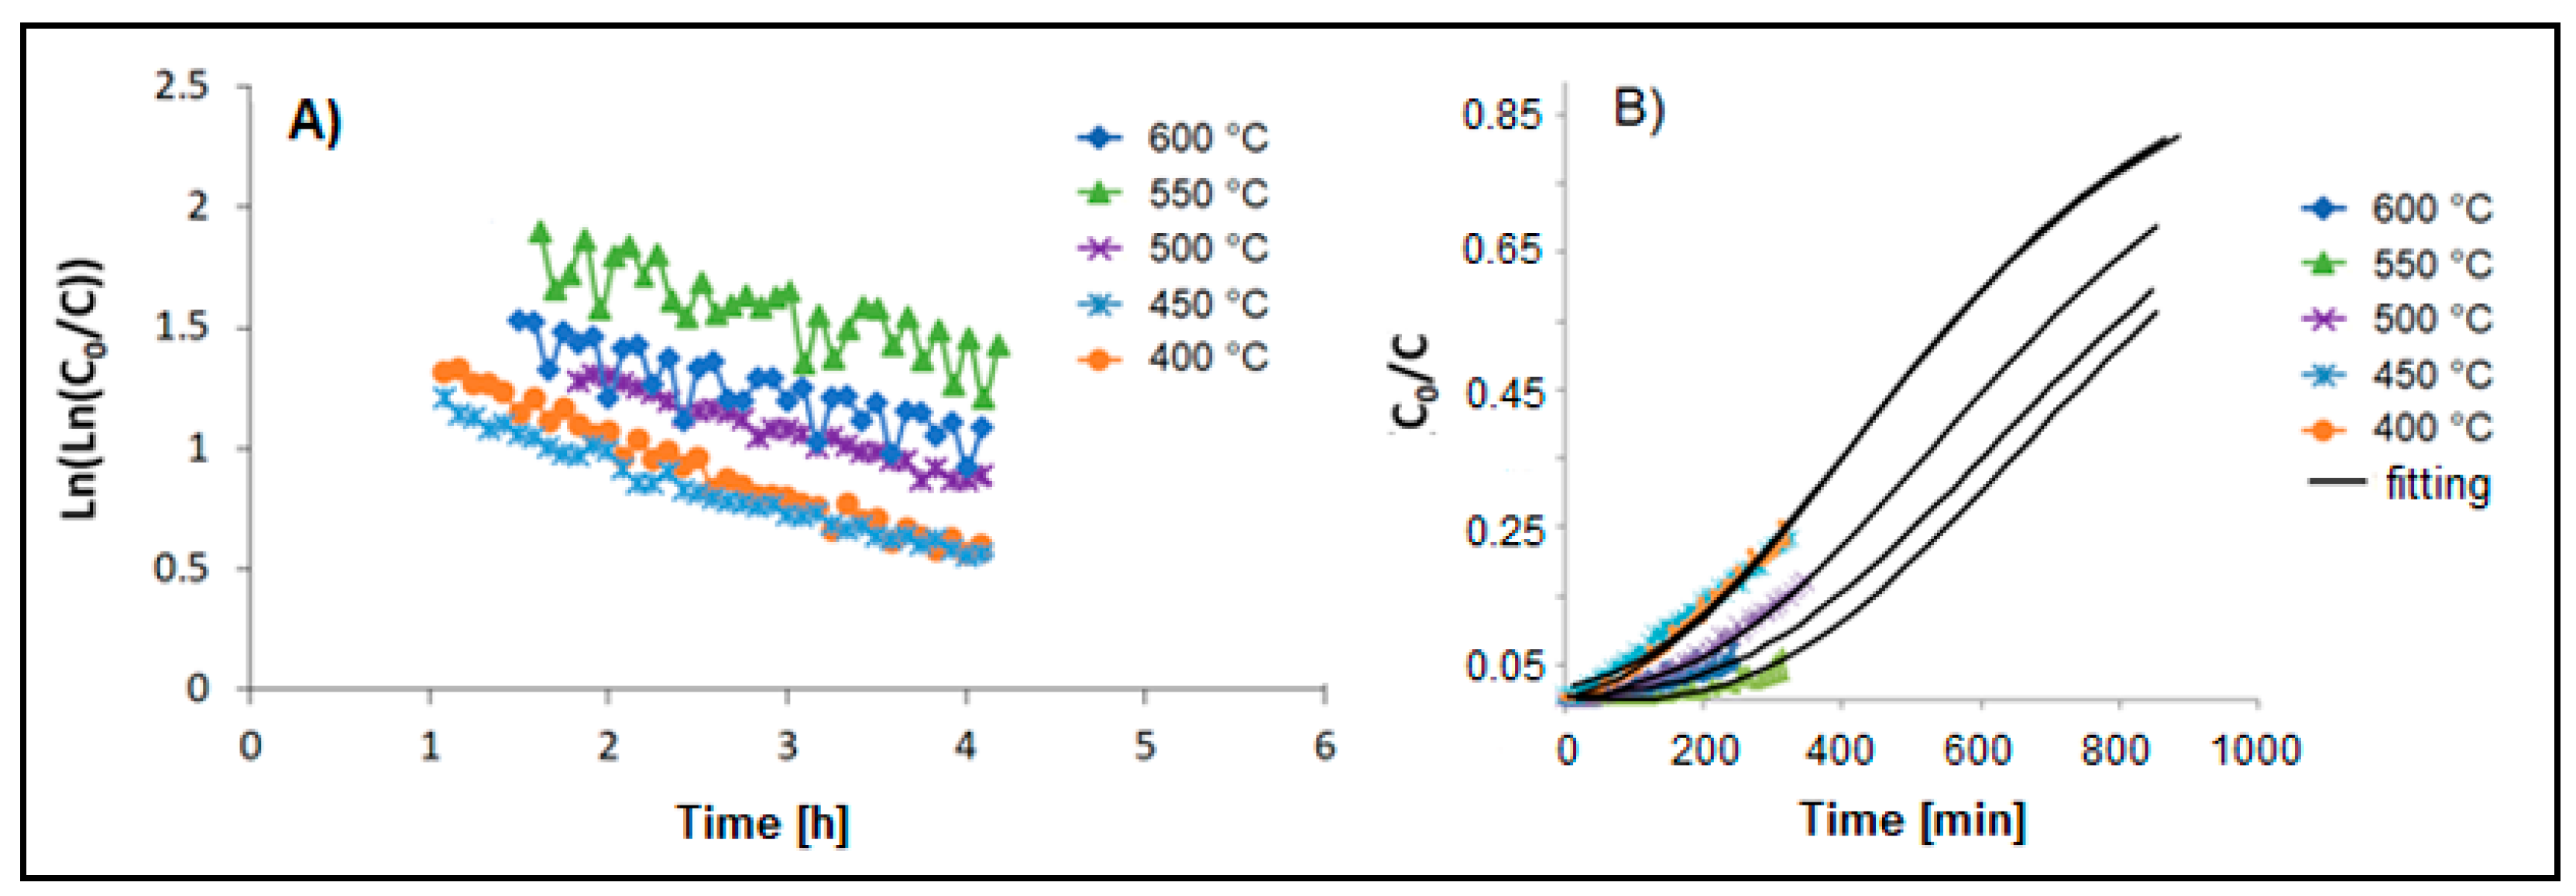
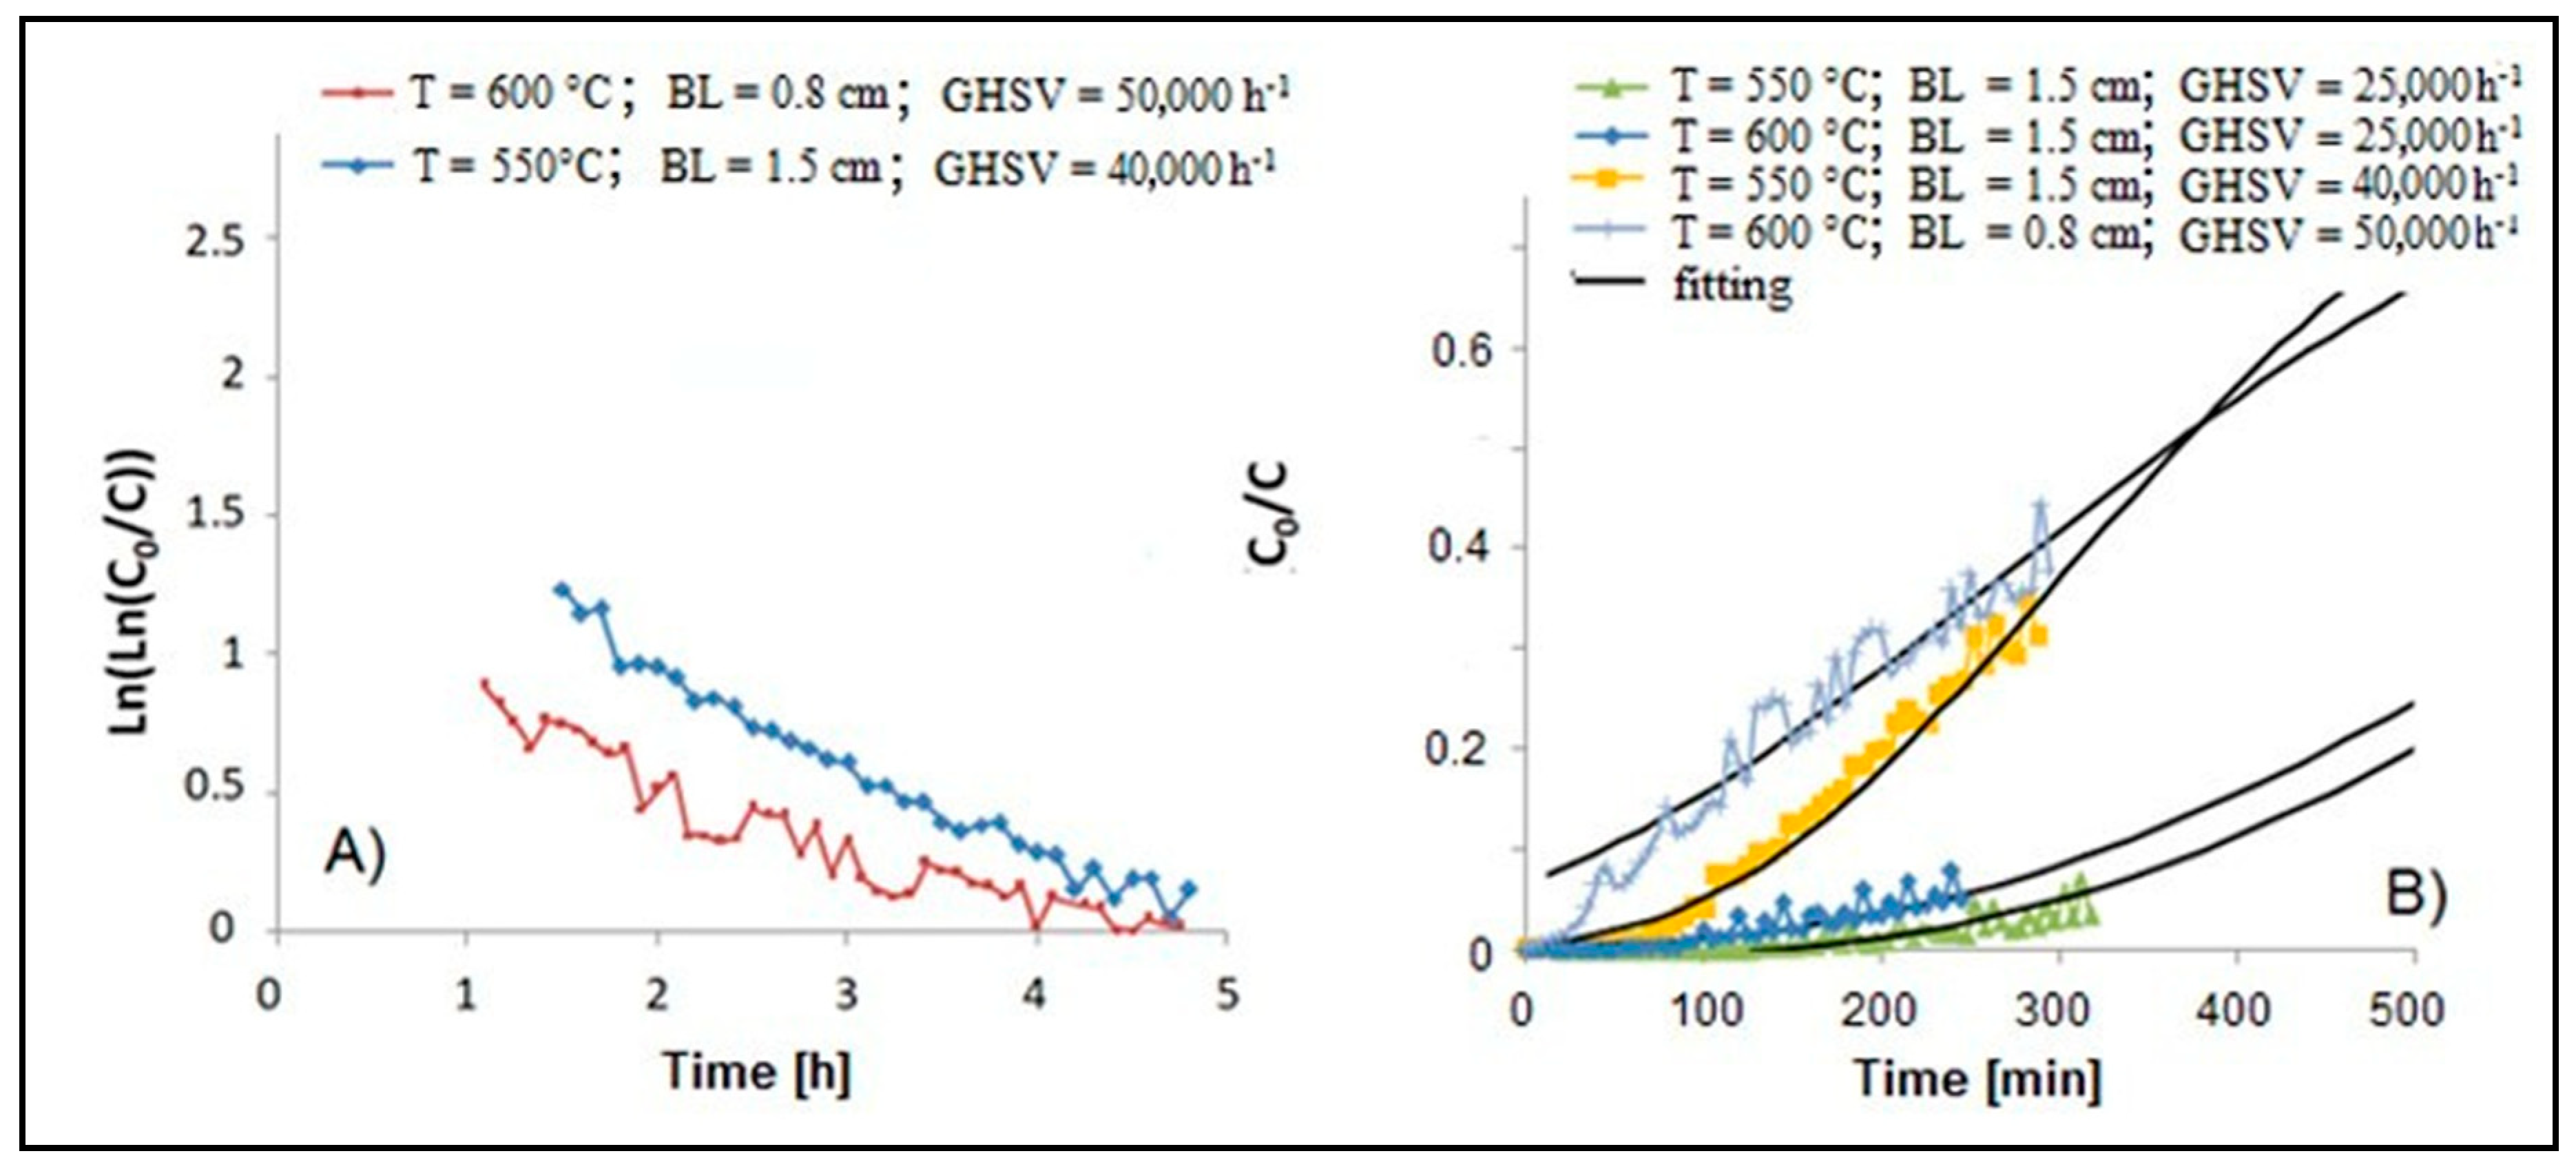
3.1. Adsorption Tests
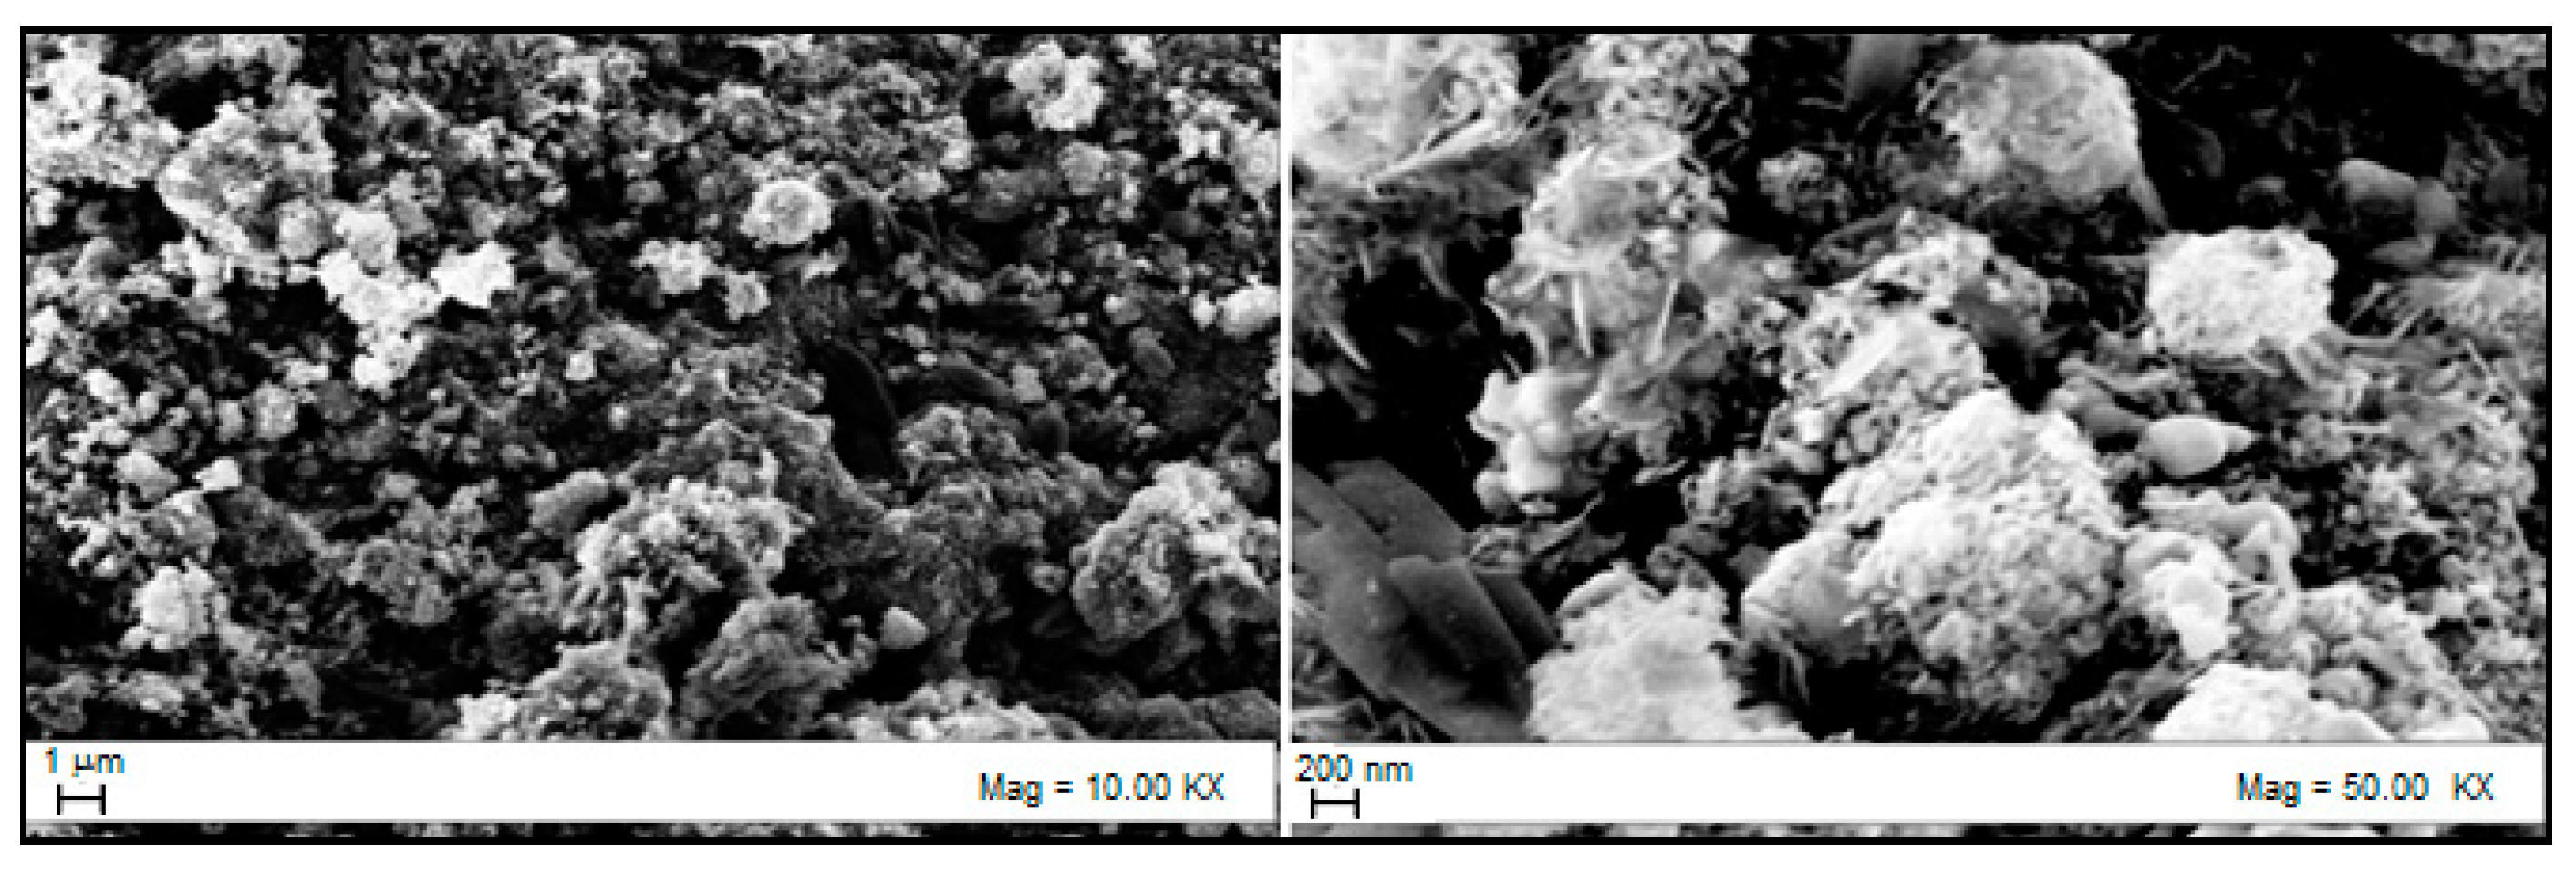
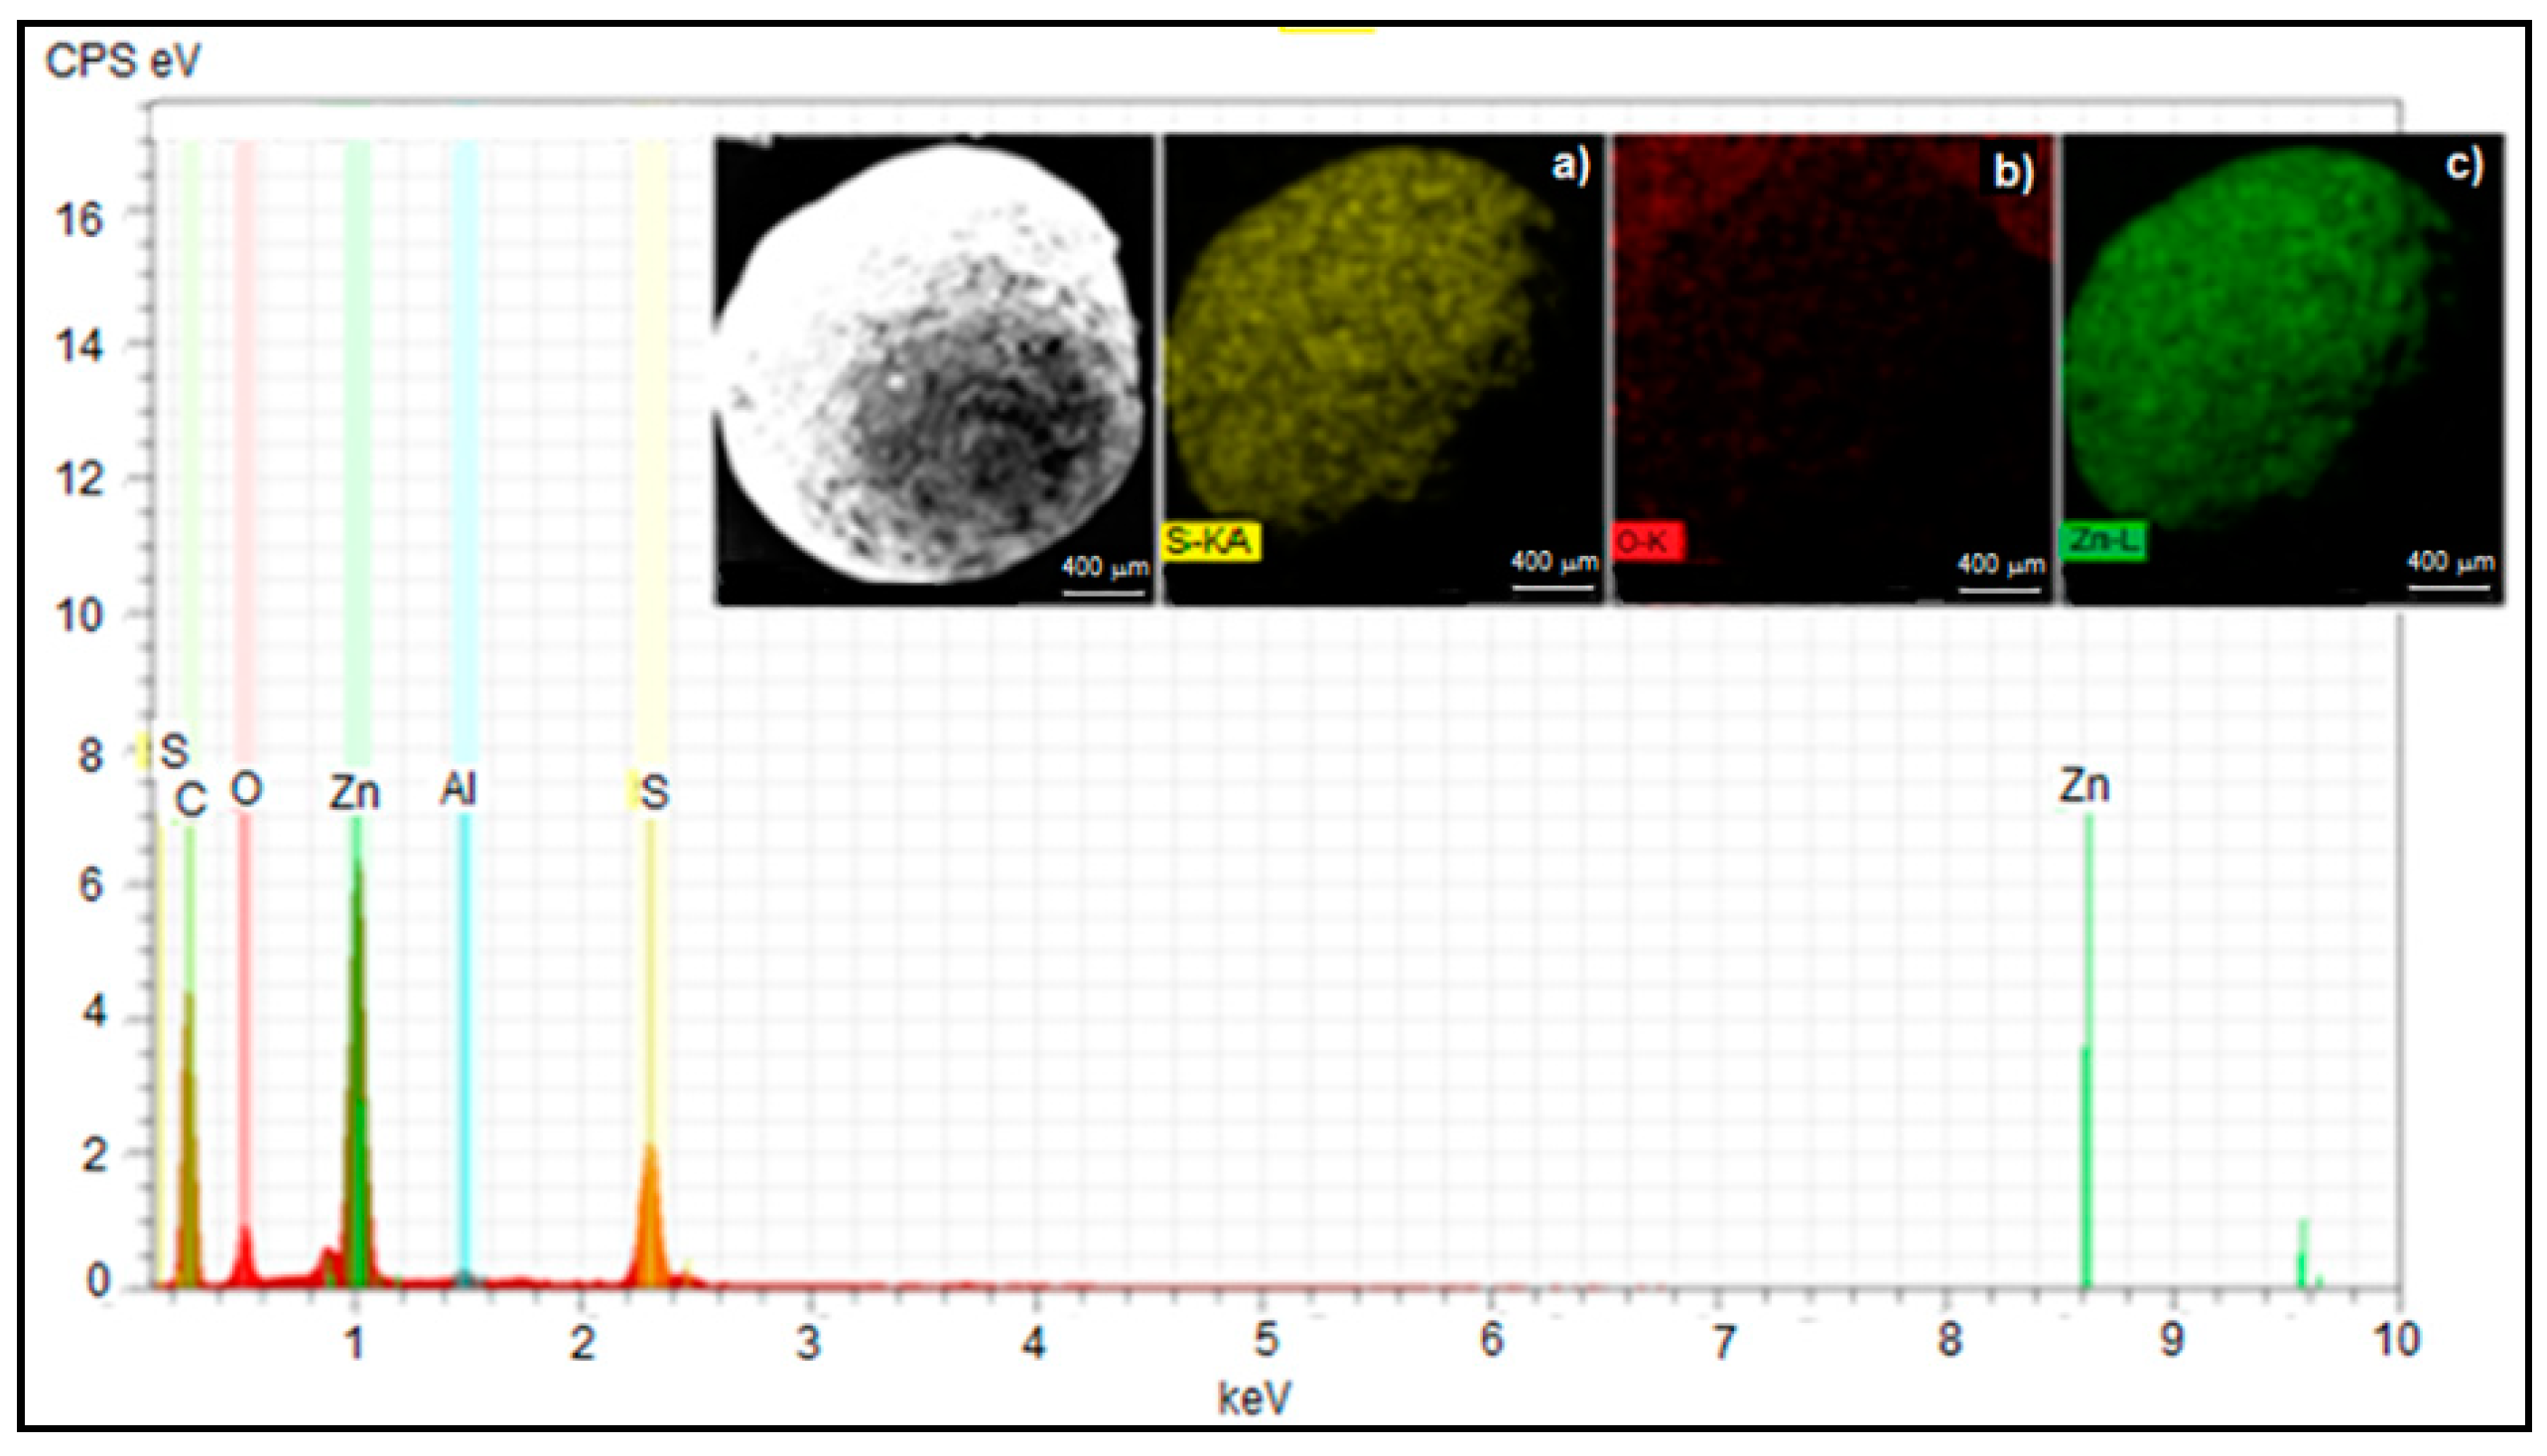
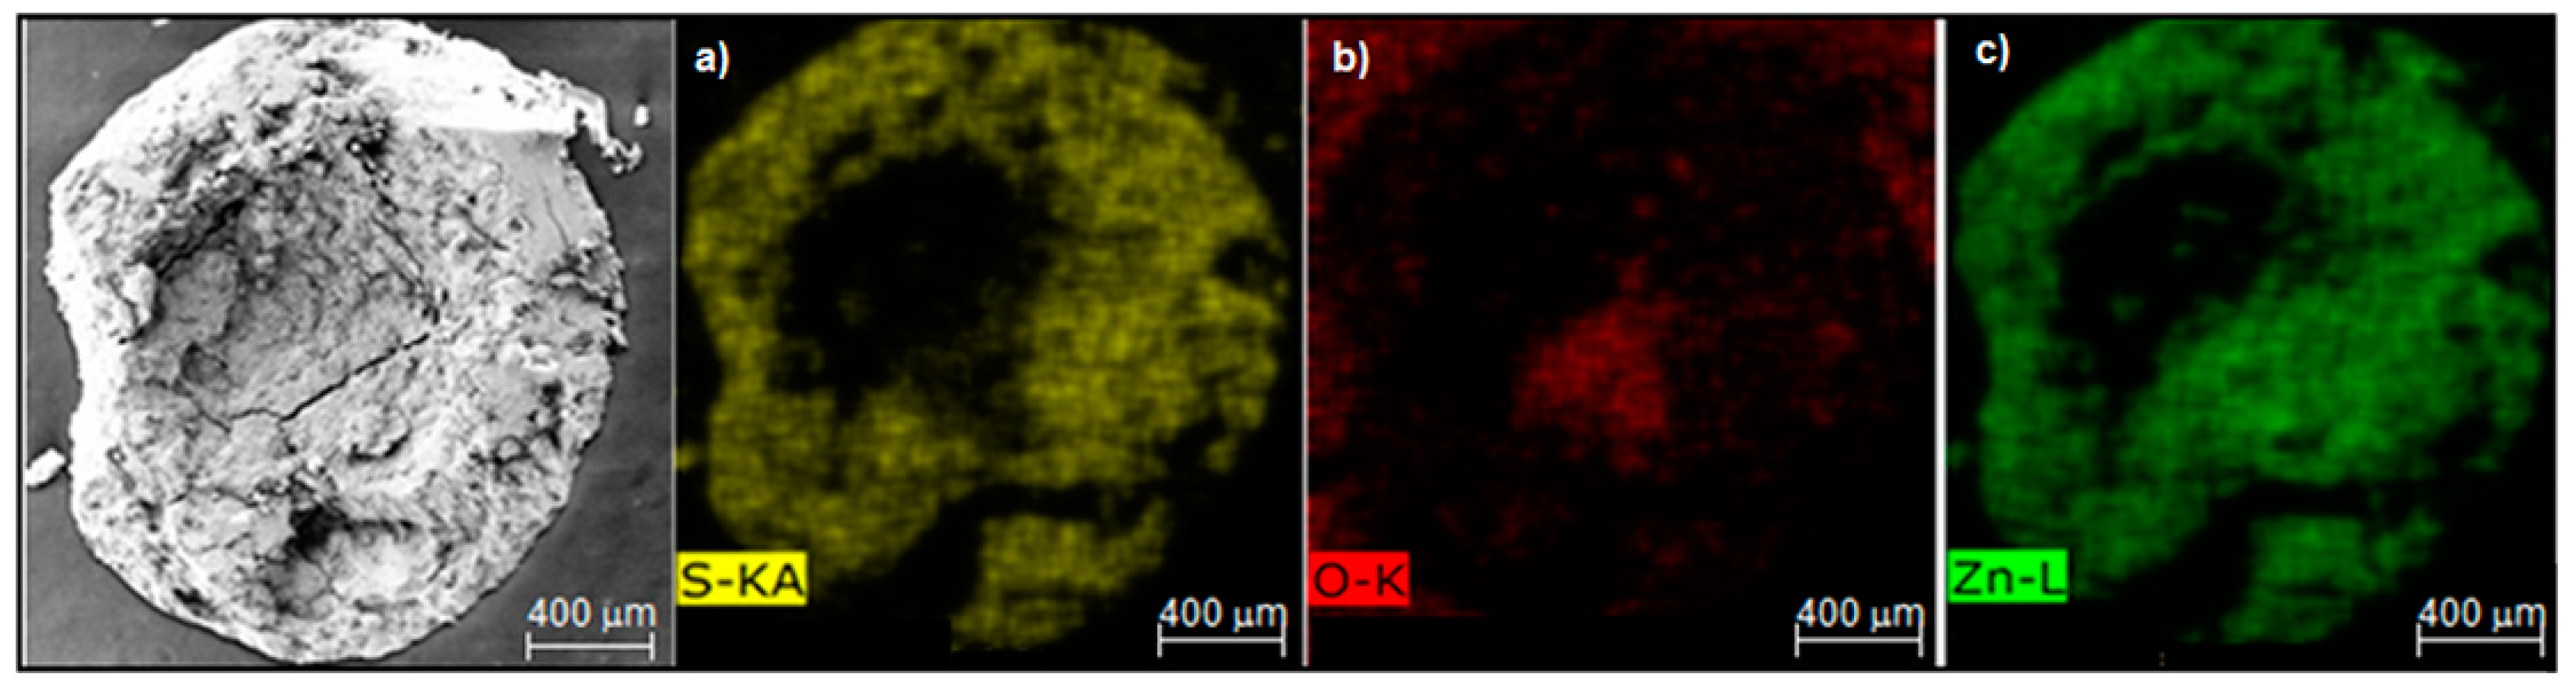
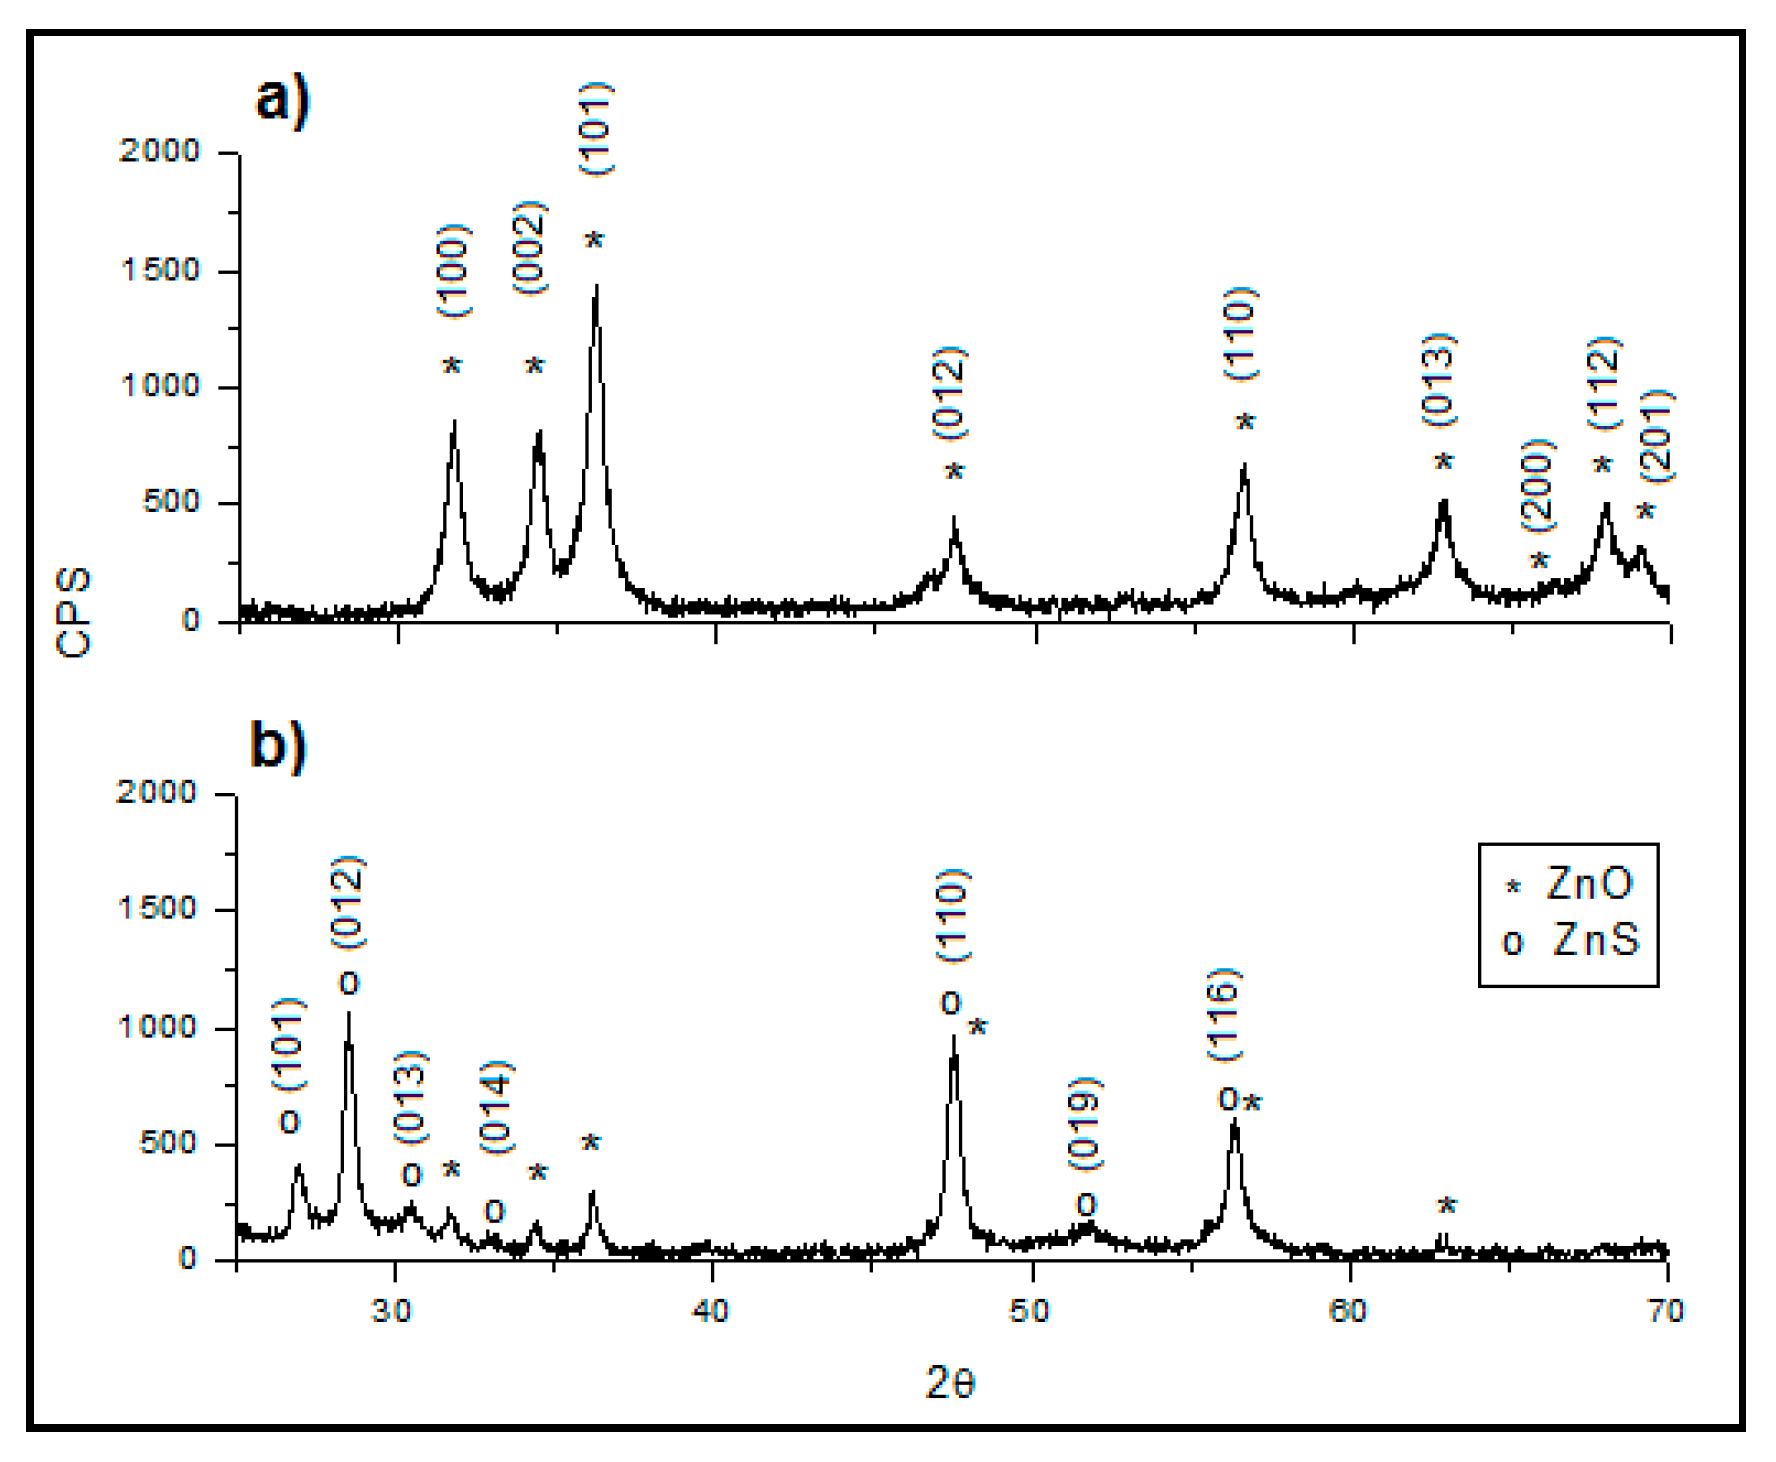
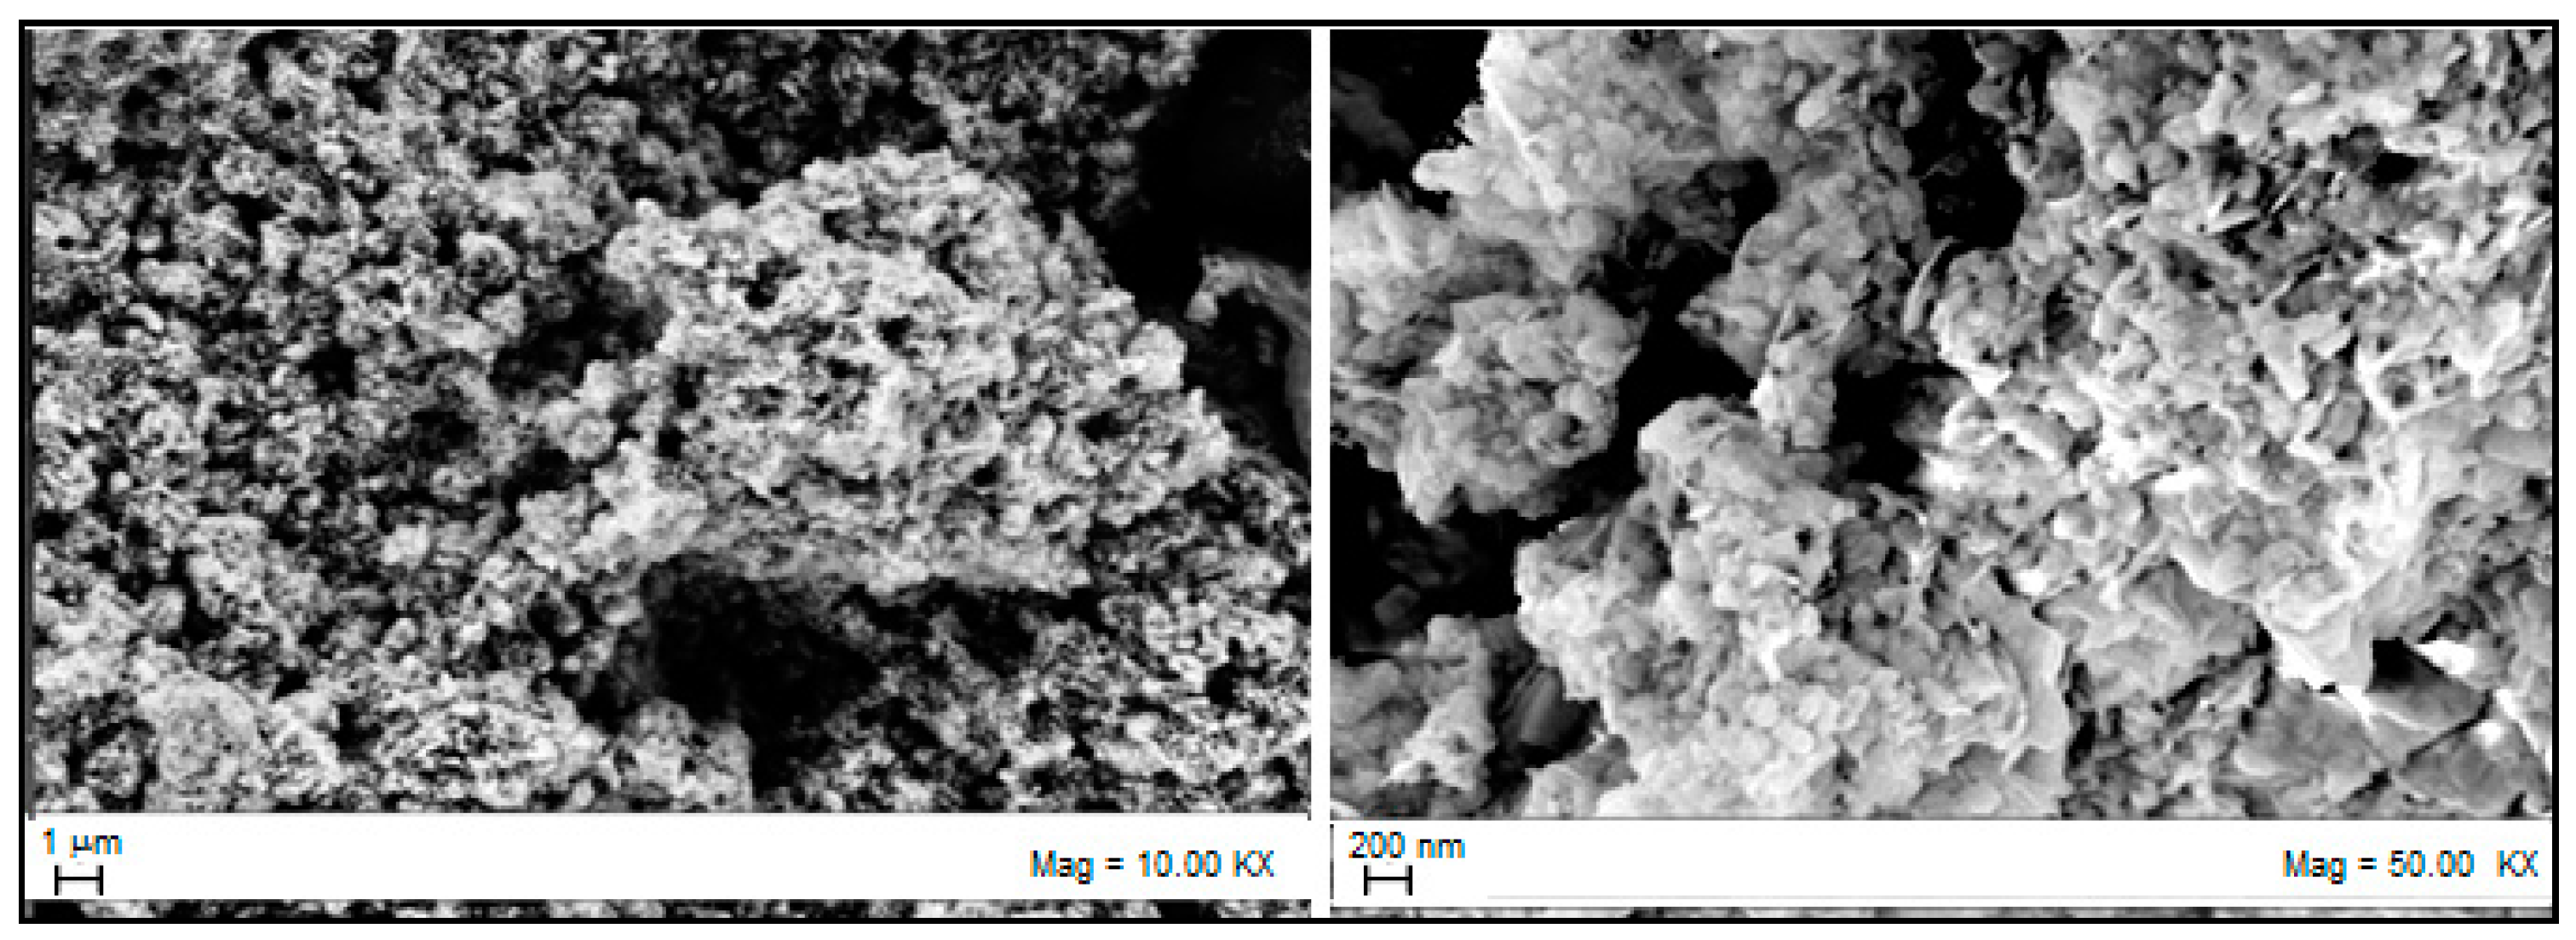
3.2. Sorbent Characterization
4. Conclusions
Author Contributions
Funding
Institutional Review Board Statement
Informed Consent Statement
Data Availability Statement
Acknowledgments
Conflicts of Interest
References
- Bin Chung, J.; Chung, J.S. Desulfurization of H2S using cobalt-containing sorbents at low temperatures. Chem. Eng. Sci. 2005, 60, 1515–1523. [Google Scholar] [CrossRef]
- Ko, T.-H.; Chu, H.; Liou, Y.-J. A study of Zn–Mn based sorbent for the high-temperature removal of H2S from coal-derived gas. J. Hazard. Mater. 2007, 147, 334–341. [Google Scholar] [CrossRef] [PubMed]
- Ko, T.; Chu, H.; Chaung, L.; Tseng, T. High temperature removal of hydrogen sulfide using an N-150 sorbent. J. Hazard. Mater. 2004, 114, 145–152. [Google Scholar] [CrossRef] [PubMed]
- Yasyerli, S.; Dogu, G.; Ar, I.; Dogu, T. Activities of Copper Oxide and Cu−V and Cu−Mo Mixed Oxides for H2S Removal in the Presence and Absence of Hydrogen and Predictions of a Deactivation Model. Ind. Eng. Chem. Res. 2001, 40, 5206–5214. [Google Scholar] [CrossRef]
- Frilund, C.; Simell, P.; Kaisalo, N.; Kurkela, E.; Koskinen-Soivi, M.-L. Desulfurization of Biomass Syngas Using ZnO-Based Adsorbents: Long-Term Hydrogen Sulfide Breakthrough Experiments. Energy Fuels 2020, 34, 3316–3325. [Google Scholar] [CrossRef]
- Kołodziejczak-Radzimska, A.; Jesionowski, T. Zinc Oxide—From Synthesis to Application: A Review. Materials 2014, 7, 2833–2881. [Google Scholar] [CrossRef] [Green Version]
- Li, L.; Sun, T.; Shu, C.; Zhang, H. Low temperature H2S removal with 3-D structural mesoporous molecular sieves supported ZnO from gas stream. J. Hazard. Mater. 2016, 311, 142–150. [Google Scholar] [CrossRef]
- Wang, X.; Sun, T.; Yang, J.; Zhao, L.; Jia, J. Low-temperature H2S removal from gas streams with SBA-15 supported ZnO nanoparticles. Chem. Eng. J. 2008, 142, 48–55. [Google Scholar] [CrossRef]
- Kim, K.; Park, N. Removal of hydrogen sulfide from a steam-hydrogasifier product gas by zinc oxide sorbent: Effect of non-steam gas components. J. Ind. Eng. Chem. 2010, 16, 967–972. [Google Scholar] [CrossRef]
- Rosso, I.; Galletti, C.; Bizzi, M.; Saracco, G.; Specchia, V. Zinc Oxide Sorbents for the Removal of Hydrogen Sulfide from Syngas. Ind. Eng. Chem. Res. 2003, 42, 1688–1697. [Google Scholar] [CrossRef]
- Jung, S.Y.; Lee, S.J.; Park, J.J.; Jun, H.K.; Lee, T.J.; Ryu, C.K.; Kim, J.C. The simultaneous removal of hydrogen sulfide and ammonia over zinc-based dry sorbent supported on alumina. Sep. Purif. Technol. 2008, 63, 297–302. [Google Scholar] [CrossRef]
- Breck, D.W. Zeolite Molecular Sieves: Structure, Chemistry and Use; Breck, D.W., Ed.; John Wiley: New York, NY, USA, 1974; ISBN 978-0471099857. [Google Scholar]
- de Oliveira, L.H.; Meneguin, J.G.; Pereira, M.V.; da Silva, E.A.; Grava, W.M.; Nascimento, J.F.D.; Arroyo, P.A. H2S adsorption on NaY zeolite. Microporous Mesoporous Mater. 2019, 284, 247–257. [Google Scholar] [CrossRef]
- Sigot, L.; Ducom, G.; Germain, P. Adsorption of hydrogen sulfide (H2S) on zeolite (Z): Retention mechanism. Chem. Eng. J. 2016, 287, 47–53. [Google Scholar] [CrossRef]
- Ozekmekci, M.; Salkic, G.; Fellah, M.F. Use of zeolites for the removal of H 2 S: A mini-review. Fuel Process. Technol. 2015, 139, 49–60. [Google Scholar] [CrossRef]
- Shen, F.; Liu, J.; Zhang, Z.; Dong, Y.; Gu, C. Density functional study of hydrogen sulfide adsorption mechanism on activated carbon. Fuel Process. Technol. 2018, 171, 258–264. [Google Scholar] [CrossRef]
- Mohammadi, N.; Khani, H.; Gupta, V.K.; Amereh, E.; Agarwal, S. Adsorption process of methyl orange dye onto mesoporous carbon material–kinetic and thermodynamic studies. J. Colloid Interface Sci. 2011, 362, 457–462. [Google Scholar] [CrossRef] [PubMed]
- Nguyen-Thanh, D.; Bandosz, T.J. Activated carbons with metal containing bentonite binders as adsorbents of hydrogen sulfide. Carbon N. Y. 2005, 43, 359–367. [Google Scholar] [CrossRef]
- Nguyen-Thanh, D.; Bandosz, T.J. Effect of Transition-Metal Cations on the Adsorption of H2S in Modified Pillared Clays. J. Phys. Chem. B 2003, 107, 5812–5817. [Google Scholar] [CrossRef]
- Louhichi, S.; Ghorbel, A.; Chekir, H.; Trabelsi, N.; Khemakhem, S. Properties of modified crude clay by iron and copper nanoparticles as potential hydrogen sulfide adsorption. Appl. Clay Sci. 2016, 127-128, 123–128. [Google Scholar] [CrossRef]
- Ko, T.-H.; Chu, H.; Chaung, L.-K. The sorption of hydrogen sulfide from hot syngas by metal oxides over supports. Chemosphere 2005, 58, 467–474. [Google Scholar] [CrossRef]
- Westmoreland, P.; Harrison, D.P. Evaluation of candidate solids for high-temperature desulfurization of low-Btu gases. Environ. Sci. Technol. 1976, 10, 659–661. [Google Scholar] [CrossRef]
- Norheim, A.; Wærnhus, I.; Broström, M.; Hustad, J.E.; Vik, A. Experimental Studies on the Influence of H2S on Solid Oxide Fuel Cell Performance at 800 °C. Energy Fuels 2007, 21, 1098–1101. [Google Scholar] [CrossRef]
- Li, T.S.; Wang, W.G.; Chen, T.; Miao, H.; Xu, C. Hydrogen sulfide poisoning in solid oxide fuel cells under accelerated testing conditions. J. Power Sources 2010, 195, 7025–7032. [Google Scholar] [CrossRef]
- Chen, H.; Wang, F.; Wang, W.; Chen, D.; Li, S.-D.; Shao, Z. H2S poisoning effect and ways to improve sulfur tolerance of nickel cermet anodes operating on carbonaceous fuels. Appl. Energy 2016, 179, 765–777. [Google Scholar] [CrossRef]
- Błesznowski, M.; Jewulski, J.; Zieleniak, A. Determination of H2S and HCl concentration limits in the fuel for anode supported SOFC operation. Open Chem. 2013, 11, 960–967. [Google Scholar] [CrossRef]
- Boldrin, P.; Ruiz-Trejo, E.; Mermelstein, J.; Menéndez, J.M.B.; Reina, T.R.; Brandon, N.P. Strategies for Carbon and Sulfur Tolerant Solid Oxide Fuel Cell Materials, Incorporating Lessons from Heterogeneous Catalysis. Chem. Rev. 2016, 116, 13633–13684. [Google Scholar] [CrossRef]
- Sun, J.; Modi, S.; Liu, K.; Lesieur, R.; Buglass, J. Kinetics of Zinc Oxide Sulfidation for Packed-Bed Desulfurizer Modeling. Energy Fuels 2007, 21, 1863–1871. [Google Scholar] [CrossRef]
- Turton, R.; Berry, D.A.; Gardner, T.H.; Miltz, A. Evaluation of Zinc Oxide Sorbents in a Pilot-Scale Transport Reactor: Sulfidation Kinetics and Reactor Modeling. Ind. Eng. Chem. Res. 2004, 43, 1235–1243. [Google Scholar] [CrossRef]
- Suyadal, Y.; Erol, M.; Oǧuz, H. Deactivation Model for the Adsorption of Trichloroethylene Vapor on an Activated Carbon Bed. Ind. Eng. Chem. Res. 2000, 39, 724–730. [Google Scholar] [CrossRef]
- Garces, H.F.; Galindo, H.M.; Garces, L.J.; Hunt, J.; Morey, A.; Suib, S.L. Low temperature H2S dry-desulfurization with zinc oxide. Microporous Mesoporous Mater. 2010, 127, 190–197. [Google Scholar] [CrossRef]
- Joshi, S.Y.; Ren, Y.; Harold, M.P.; Balakotaiah, V. Determination of kinetics and controlling regimes for H2 oxidation on Pt/Al2O3 monolithic catalyst using high space velocity experiments. Appl. Catal. B Environ. 2011, 102, 484–495. [Google Scholar] [CrossRef]
- Eshraghi, A.; Mirzaei, A.A.; Rahimi, R.; Atashi, H. Fischer-Tropsch Synthesis on Fe-Co-Pt/γ-Al2O3 catalyst: A mass transfer, kinetic and mechanistic study. Korean J. Chem. Eng. 2020, 37, 1699–1708. [Google Scholar] [CrossRef]
- Ko, T. Fitting of Breakthrough Curve by Deactivation Kinetic Model for Adsorption of H2S from Syngas with Zn-Contaminated Soil. Asian J. Chem. 2015, 27, 865–869. [Google Scholar] [CrossRef]
- Hassan, K.H.; Khammas, A.-A.; Rahman, A.M. Zinc Oxide Hydrogen Sulfide Removal Catalyst/ Preparation, Activity Test and Kinetic Study. Al-Khwarizmi Eng. J. 2008, 4, 74–84. [Google Scholar]


| Experimental Conditions | |
|---|---|
| Sorbent (grams) | 0.5 ± 0.001 |
| T (°C) | 400–600 |
| N2 (vol.%) | 82 |
| H2S (ppmv) | 410 |
| H2O (vol.%) | 18 |
| P (bar) | 0.95–1.05 |
| GHSV (h−1) | 25,000 |
| N2 (NmL min−1) | 250 |
| Total flow (Nml min−1) | 305 ± 1 |
| Bed Length (BL) (cm) | 1.5 |
| Particle diameter(cm) | 1.5–3.0 |
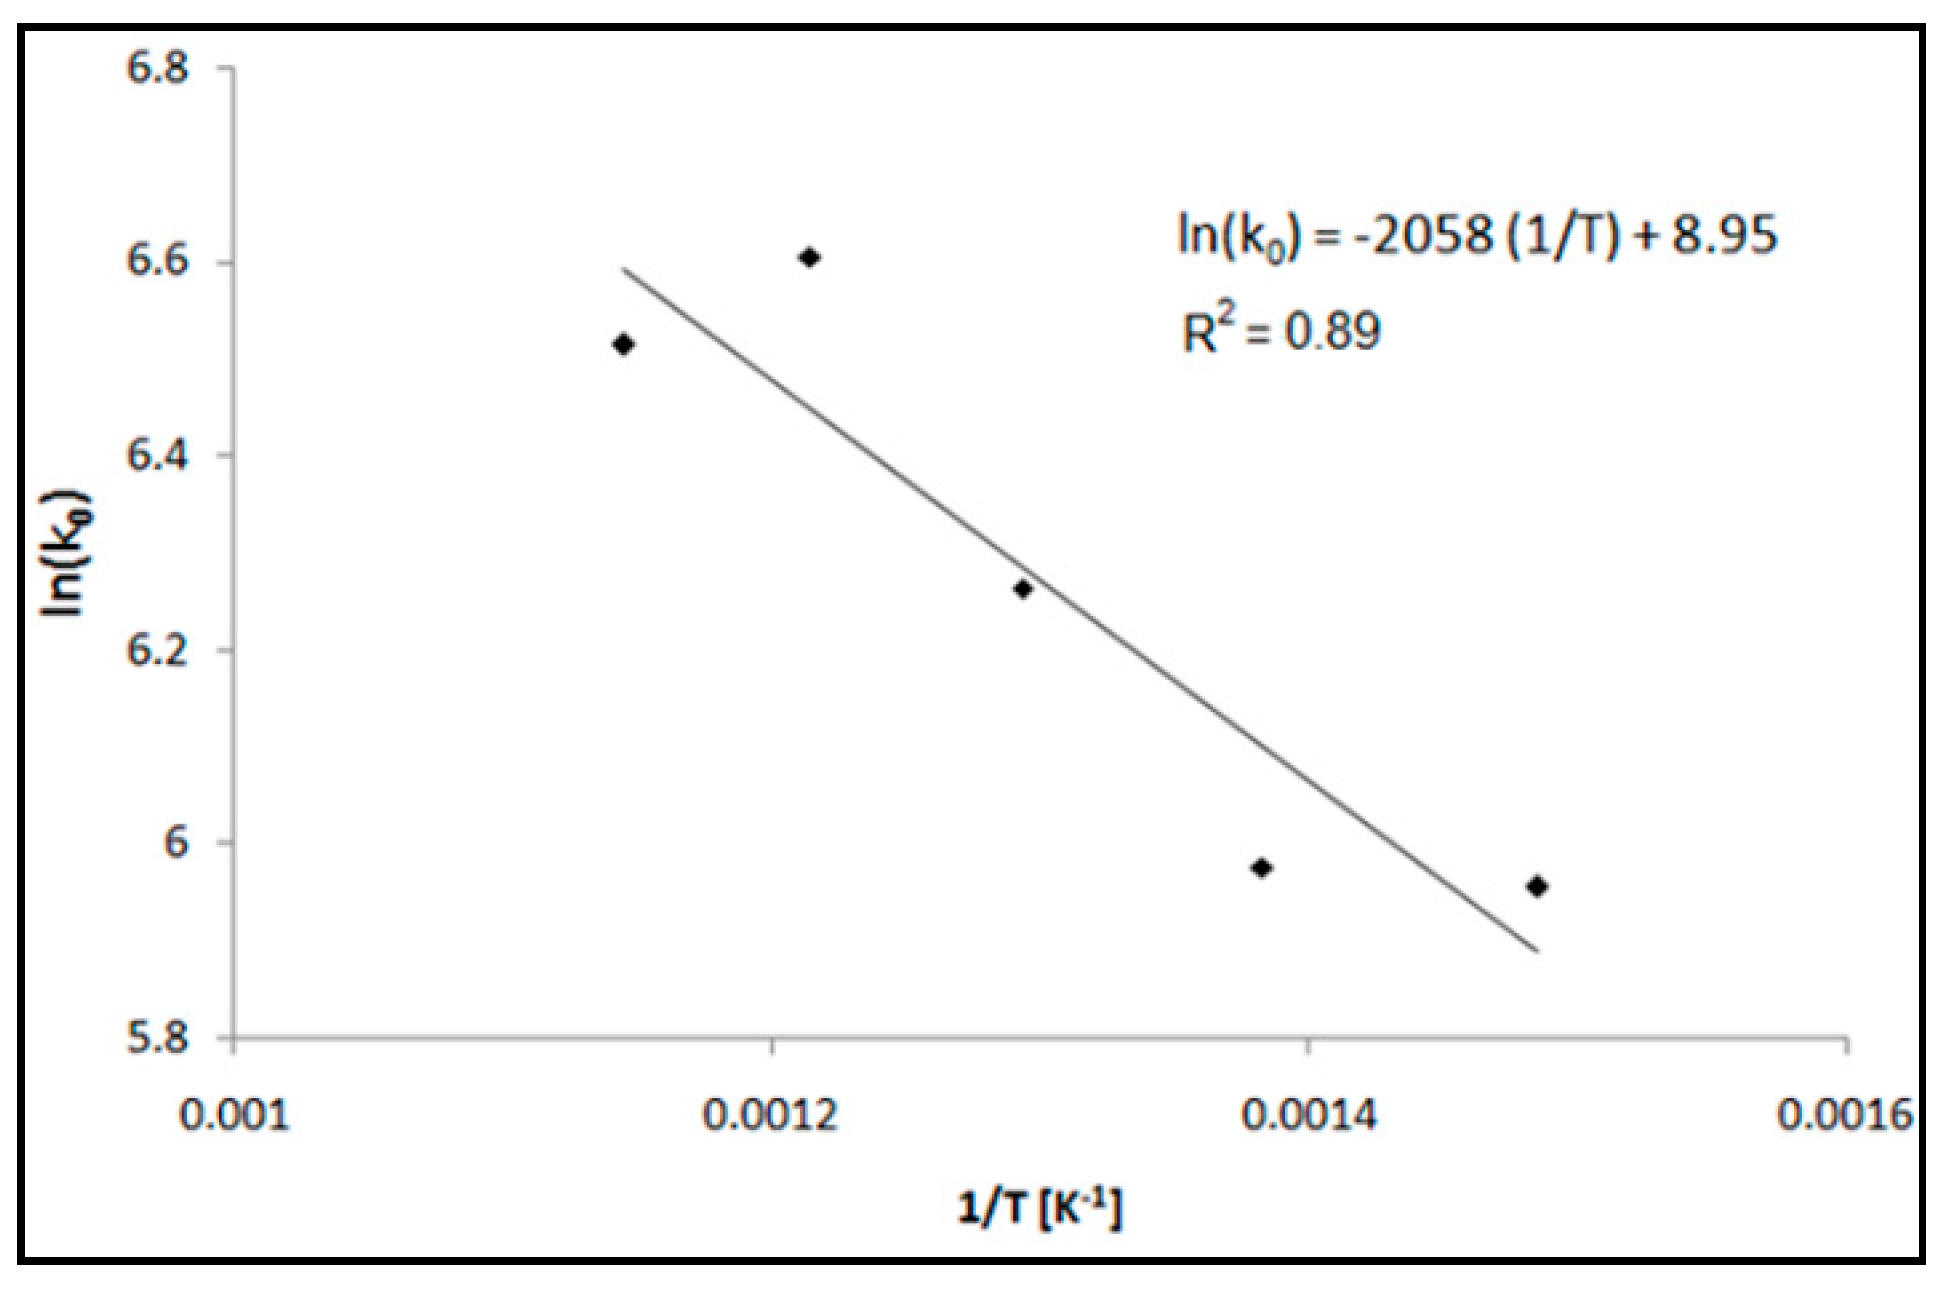
| T [°C] | Bed Length [cm] | GHSV [h−1] | k0 [L g−1h−1] | kd [h−1] | R2 | tb [h] | ts [h] | vs [cm h−1] | LUB [cm] | MTZ [cm] | SCb | SCe | |
|---|---|---|---|---|---|---|---|---|---|---|---|---|---|
| 600 | 0.8 | 50000 | 0.99 | 318 | 0.226 | 0.90 | 0.03 | 7.5 | 0.106 | 0.8 | 1.60 | 0.75 | 27 |
| 550 | 1.5 | 40000 | 1.62 | 895 | 0.327 | 0.97 | 0.70 | 8.7 | 0.172 | 1.38 | 2.76 | 5.3 | 27 |
| 600 | 1.5 | 25000 | 1.72 | 675 | 0.171 | 0.71 | 1.42 | 14.3 | 0.104 | 1.35 | 2.70 | 2.9 | 27 |
| 550 | 1.5 | 25000 | 1.90 | 739 | 0.182 | 0.70 | 2.72 | 13.6 | 0.109 | 1.21 | 2.42 | 5.4 | 28 |
| 500 | 1.5 | 25000 | 1.62 | 525 | 0.185 | 0.98 | 0.92 | 13.0 | 0.115 | 1.39 | 2.79 | 1.8 | 24 |
| 450 | 1.5 | 25000 | 1.40 | 394 | 0.206 | 0.97 | 0.42 | 11.3 | 0.132 | 1.46 | 2.91 | 1.0 | 20 |
| 400 | 1.5 | 25000 | 1.45 | 385 | 0.212 | 0.97 | 0.45 | 10.8 | 0.140 | 1.43 | 2.86 | 1.0 | 19 |
| Element | Initial Composition wt% | Composition at Breakthrough Time wt% at 550 °C | Composition at Equilibrium Time wt% at 550 °C |
|---|---|---|---|
| O | 20.89 | 19.14 | 5.98 |
| S | 0 | 4.53 | 24.63 |
| Zn | 77.72 | 75.03 | 68.05 |
| Al | 1.39 | 1.30 | 1.34 |
Publisher’s Note: MDPI stays neutral with regard to jurisdictional claims in published maps and institutional affiliations. |
© 2021 by the authors. Licensee MDPI, Basel, Switzerland. This article is an open access article distributed under the terms and conditions of the Creative Commons Attribution (CC BY) license (https://creativecommons.org/licenses/by/4.0/).
Share and Cite
Hatunoglu, A.; Dell’Era, A.; Del Zotto, L.; Di Carlo, A.; Ciro, E.; Bocci, E. Deactivation Model Study of High Temperature H2S Wet-Desulfurization by Using ZnO. Energies 2021, 14, 8019. https://doi.org/10.3390/en14238019
Hatunoglu A, Dell’Era A, Del Zotto L, Di Carlo A, Ciro E, Bocci E. Deactivation Model Study of High Temperature H2S Wet-Desulfurization by Using ZnO. Energies. 2021; 14(23):8019. https://doi.org/10.3390/en14238019
Chicago/Turabian StyleHatunoglu, Arda, Alessandro Dell’Era, Luca Del Zotto, Andrea Di Carlo, Erwin Ciro, and Enrico Bocci. 2021. "Deactivation Model Study of High Temperature H2S Wet-Desulfurization by Using ZnO" Energies 14, no. 23: 8019. https://doi.org/10.3390/en14238019
APA StyleHatunoglu, A., Dell’Era, A., Del Zotto, L., Di Carlo, A., Ciro, E., & Bocci, E. (2021). Deactivation Model Study of High Temperature H2S Wet-Desulfurization by Using ZnO. Energies, 14(23), 8019. https://doi.org/10.3390/en14238019