1. Introduction
This research consisted of the forest inventory idealization’s stage regarding the research and development project, titled “Computer Tool for On-line and Automated Management of Vegetation for Conflicts Mitigation related to Electricity Grid”, carried out by the SATC and the State Electric/Equatorial Energy Company of the state of Rio Grande do Sul (RS), Brazil. The objective was to propose a computational tool that integrates data from aerial images, field surveys, and a predictive model of tree growth, for the main species, components of afforestation in the municipality of Porto Alegre, state of Rio Grande do Sul, Brazil.
This integration of multiple data will allow us to identify conflict points between vegetation and the energy network, ensuring automated and online forest management, optimizing tree pruning services, and observing environmental, economic, and safety issues [
1]. Automating the monitoring of electricity transmission and distribution networks is crucial for energy utilities to ensure quality and continuity in electricity supply.
The planting of trees for urban purposes usually takes place on sidewalks, and, as a result of urban development, they end up sharing the same space as the electricity distribution network, in many cases staying under them [
2,
3]. It is a fact that the public authorities and the inhabitants of urban areas plant trees to provide more pleasant environments, manage the hydrological and rainwater regime, create a microclimate, and attract fauna. However, these trees continue to be planted on sidewalks, below the power grids [
4]. Thus, a contradiction arises, since it is precisely for these trees that the energy concessionaires will have to implement costly pruning or removal services [
5], since the large vegetation, with no proper management, conflicts with the distribution network of electricity [
6].
The Vegetation management close to power grids represents a large operational expense to the transmission and Distribution Companies of electricity [
6]. This is because the vegetation close to the network causes supply failures, fire, and public safety risks, which are increased during natural phenomena of great magnitude, because winds cause a shock of vegetation in the network (structural failure), in addition to making the trees conduct energy, providing an unconventional grounding [
7].
Supply interruptions generate problems such as revenue loss for the distributors, from the interruption to the complete reestablishment. Unscheduled shutdowns can cause financial losses to consumers (especially industrial, commercial, and public authorities) due to non-productivity or sales of products/services or even considerable losses of raw materials and production batches [
8]. In addition, full load interruptions/resets generate transitory effects (electrical surges) that damage equipment and devices of consumers and the distributor itself. Problems generated by customers in addition to lawsuits bring a negative image of the energy distributor to society [
9].
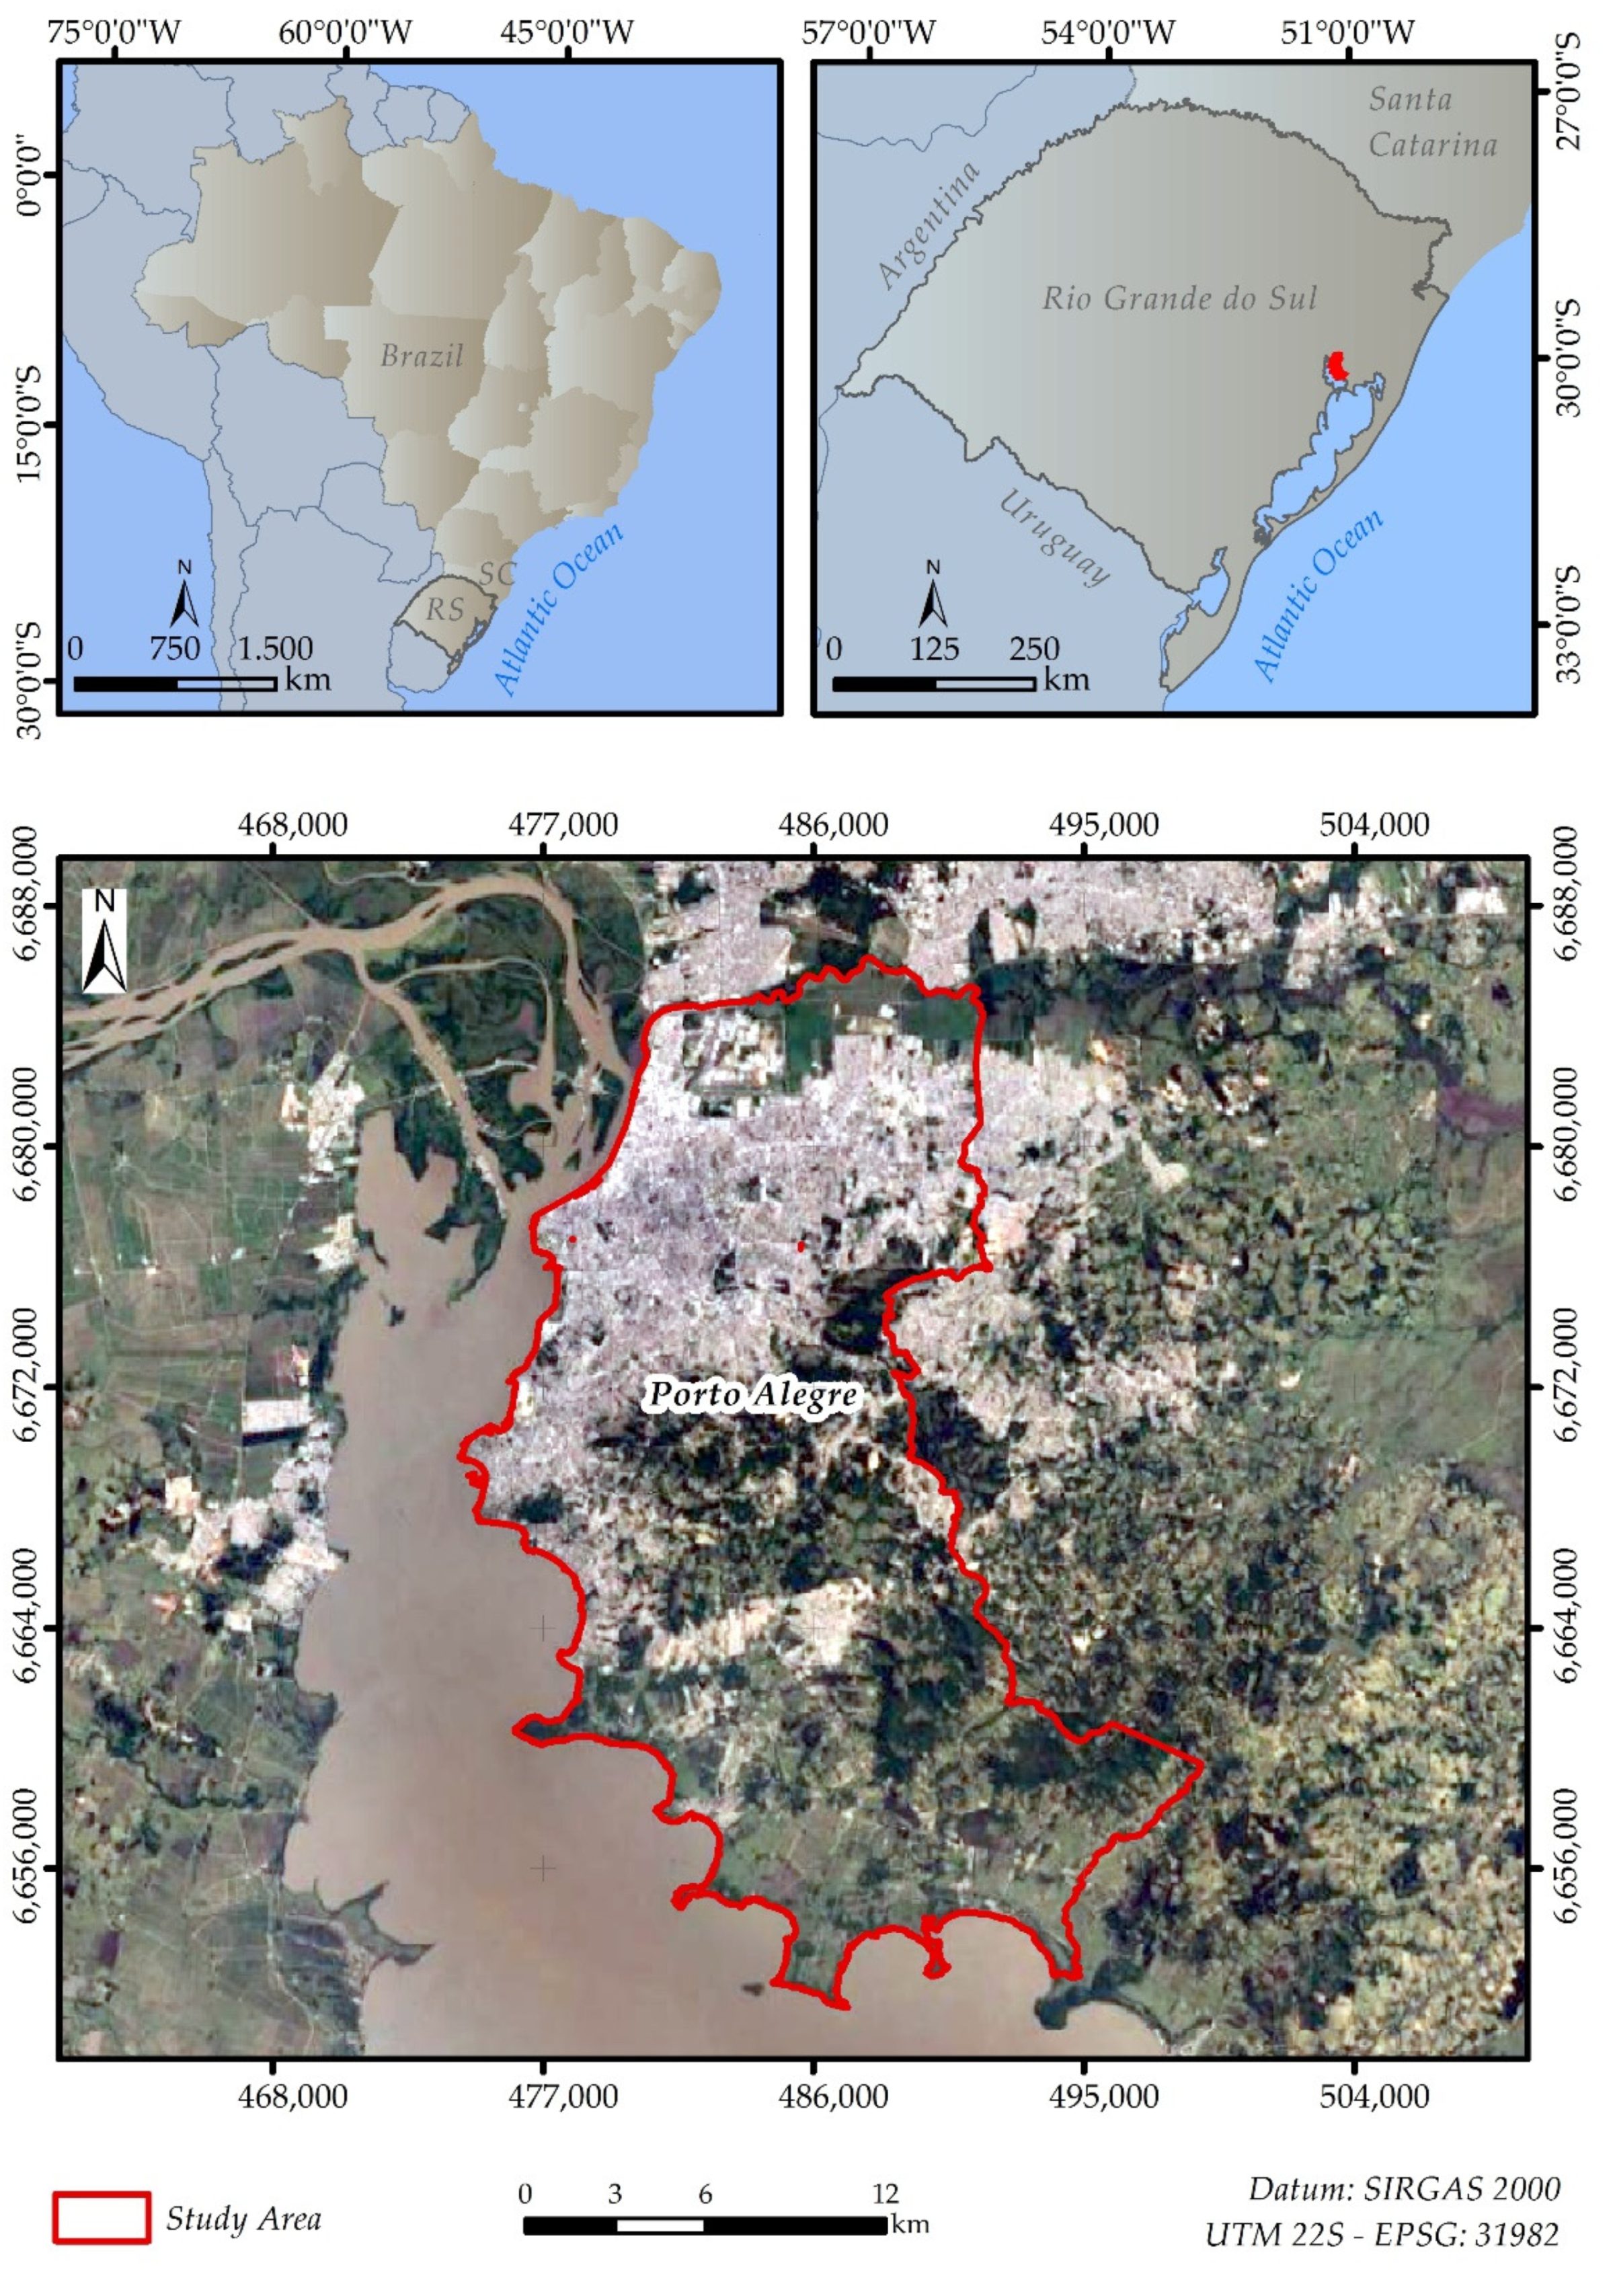
An initial and fundamental stage of the reported project consists of carrying out a forest inventory in the pilot area, the municipality of Porto Alegre, which has 495.39 km² [
10] and 1,488,252 inhabitants [
11] distributed in an urban area with recognized afforestation [
11,
12]. The city of Porto Alegre is only part of the CEEE/Equatorial service area (
Figure 1).
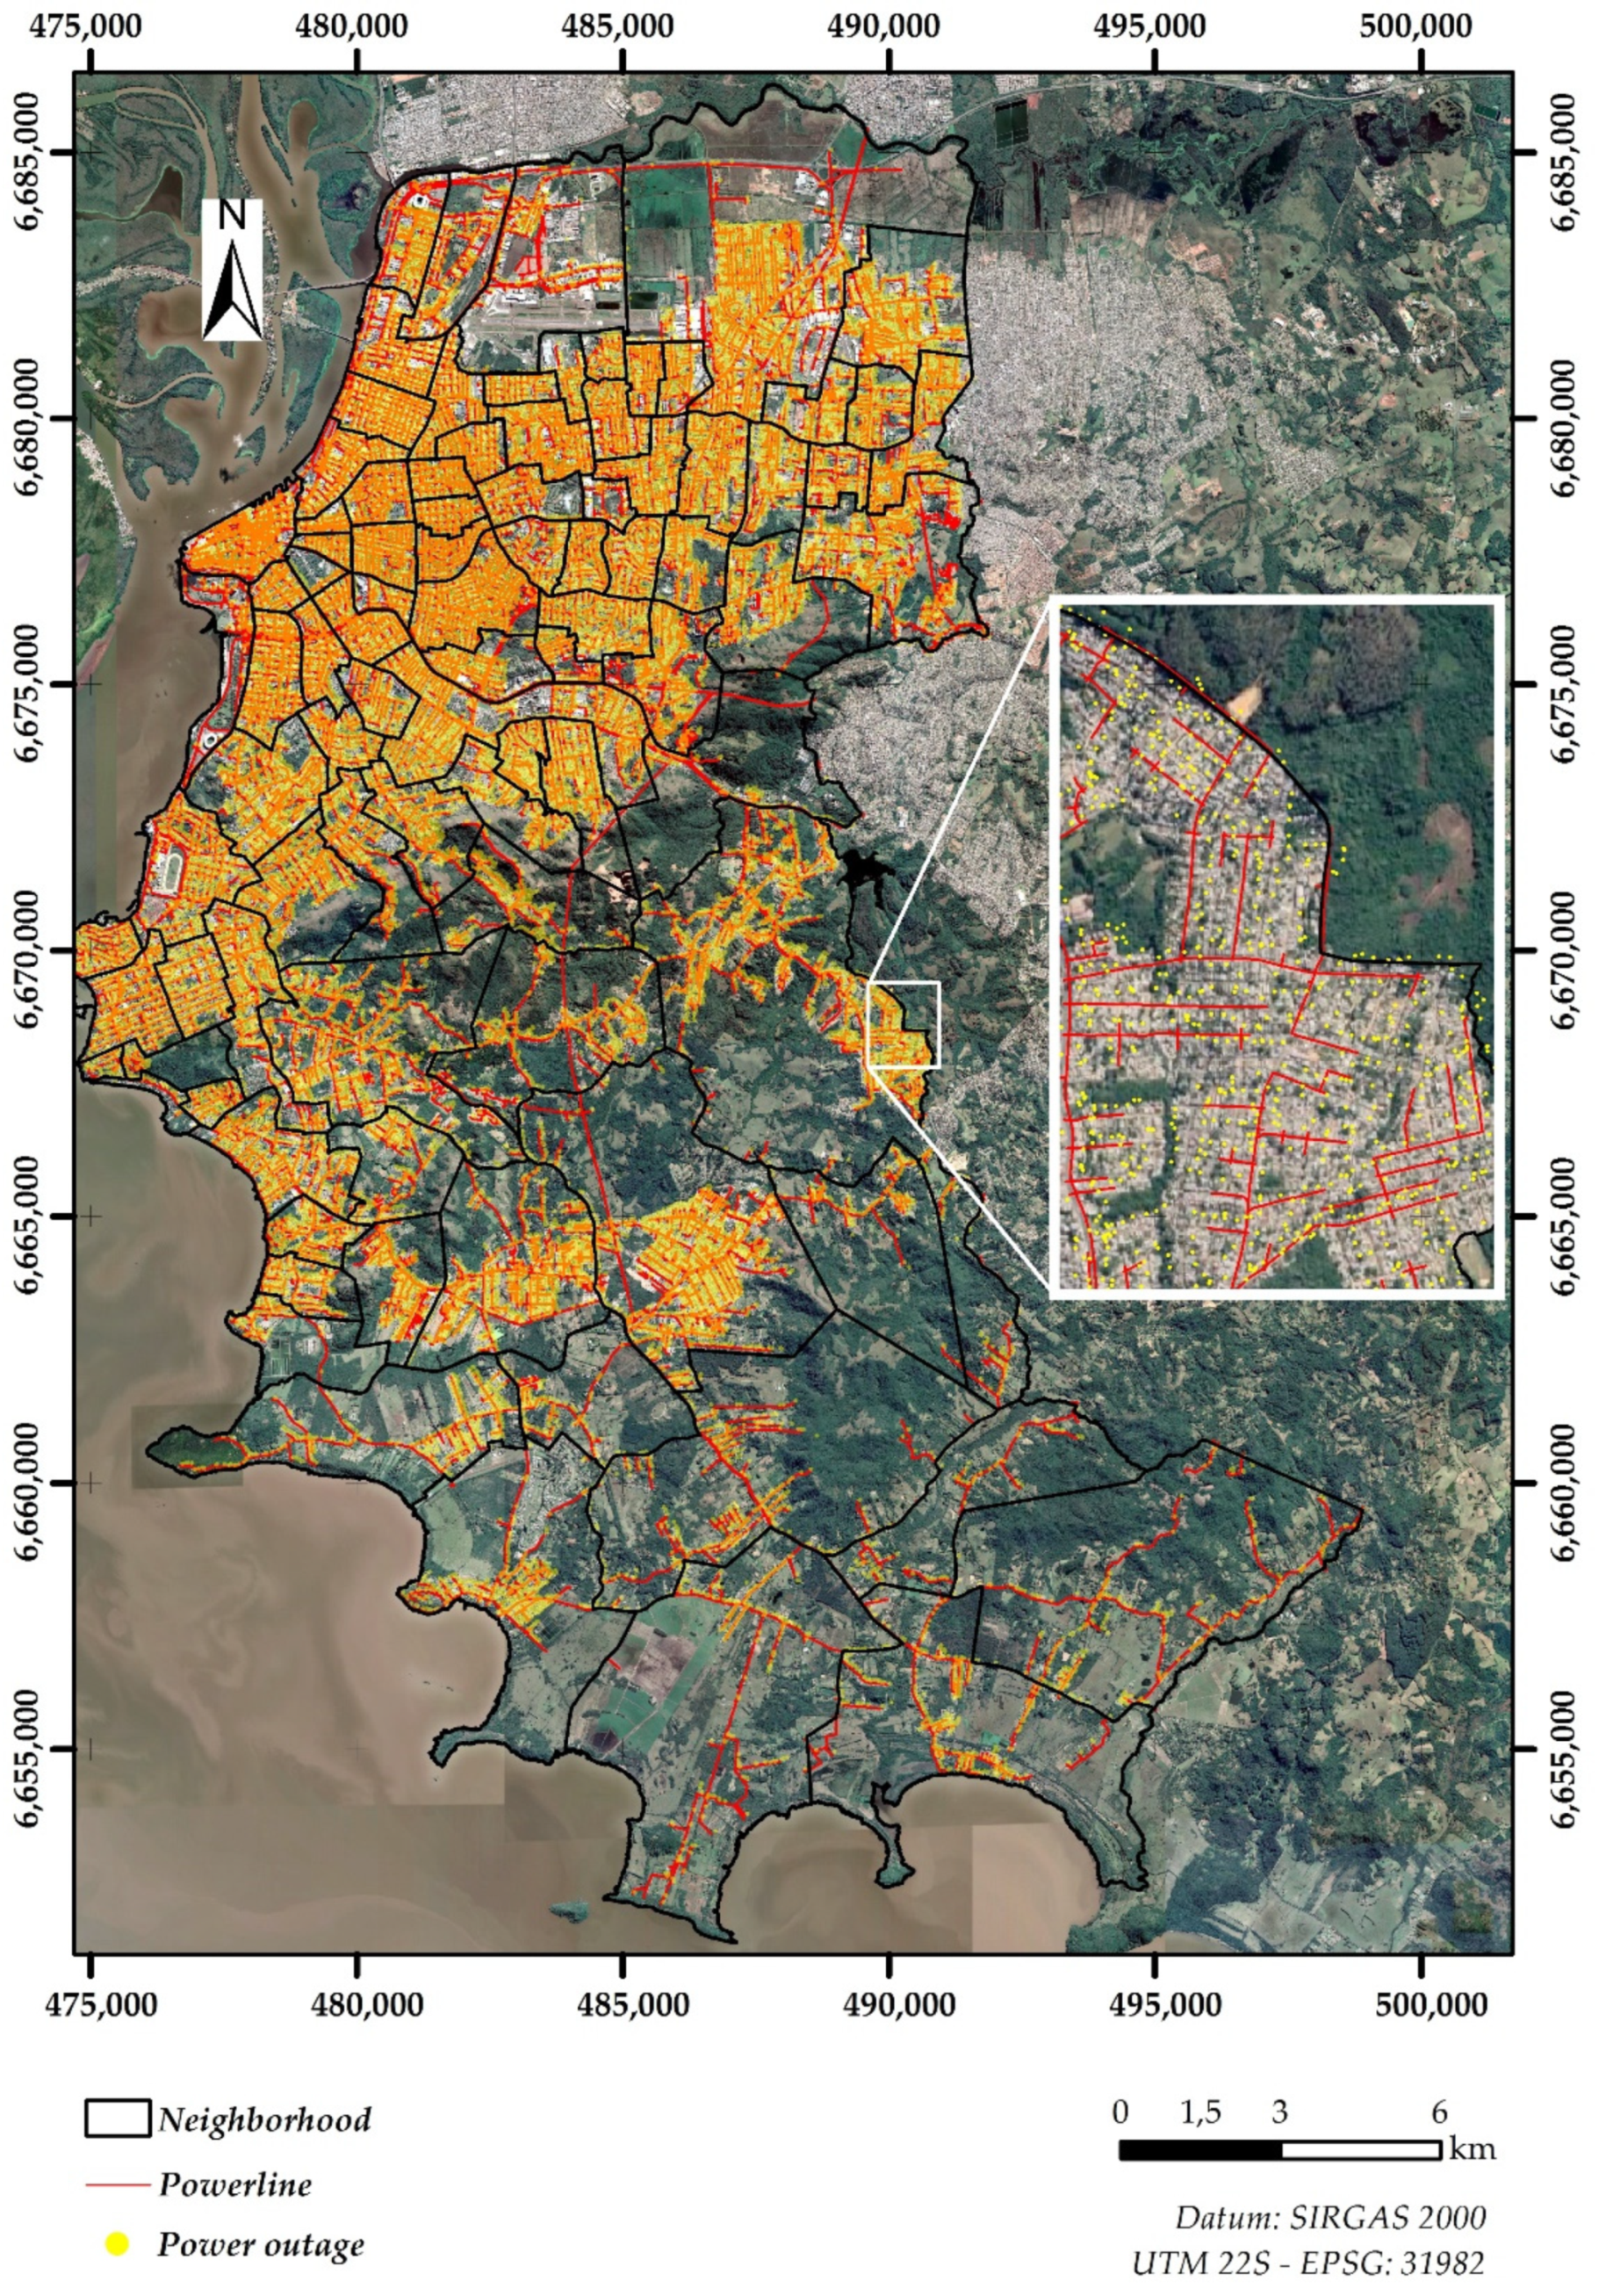
In
Figure 2, for example, it can be seen that along the CEEE/Equatorial primary energy network, represented in red, there is a vast history of power outages, in yellow. Thus, the problem is spread over an entire area of study, making it necessary to know the magnitude of the causes and work on their mitigation.
Thus, the realization of a forest inventory aims to characterize the diversity and the vegetation [
12] that conflicts with the electrical distribution networks, which is a primary data for conflict management. However, a forestry inventory in an urban area must follow specific criteria [
4], emphasizing the spatial character, while seeking the representativeness of the surveys, requiring the development of a sampling plan.
The objective of this proposition was precisely to present the strategies adopted for the accurate realization of this inventory of the vegetation that conflicts with the electrical network, in the municipality of Porto Alegre, serving as input for a larger project. Here, the aim was to present the sample significance and its strategy for directing field efforts, as well as the sample geometry. Botanical data collection metrics will not be addressed, but, rather, sampling efforts of field work will be addressed to locations defined as critical, that is, which, by prior analysis in the office, were classified as high priority to be visited, indicating that the target population is any and all vegetation that occurs under, on, and laterally to the energy distribution system and that may conflict spatially and operationally with this energy distribution system.
This introductory item presented the problem, objective, and state of the art pertaining to the approached theme. Next, this work was structured so that, initially, the methodological procedures were described and divided into stages. These methodological steps included (1) acquisition of the database and software used, and (2) factor hierarchy and map algebra. Then, the results of the research were discussed, with the presentation of the base factors of the study, definition of the hierarchy of factors, and addressing these and the final model for the field work. Finally, the final considerations were made with the most relevant points of the work. The references used in the elaboration of this study are listed in the final item of this paper.
2. Methodological Procedures
The sampling strategy for a forest inventory was stratified to identify areas of greatest interest in the study area, intentionally focused on conflict areas, vegetation, and power grid [
3]. In general terms, the guiding criteria for sampling for the forest inventory were established to obtain representativeness, taking into account access conditions and distribution patterns of floristic properties [
9], in the indication of pre-diagnosis, performed by remote sensing, as in [
13], on pre-existing data and even on the temporal and financial issue of proceeding with an inventory in the territory of Porto Alegre.
As the office, idealization, and preparation stages for carrying out the subsequent forest inventory in the field, geoprocessing tools [
14] were used to represent the political division of sectors in the territory of Porto Alegre. In addition, by remote sensing techniques [
15], a satellite image interpretation was performed, which allowed the identification of vegetation in conflict with the energy distribution system.
2.1. Acquisition of the Database and Software Used
While using the data from the distributor (CEEE/Equatorial), received in the format of Excel® spreadsheets and containing the primary and secondary networks, the necessary information processing was carried out. Among the contents of this worksheet, the initial and final coordinates of the vertices of each line segment represent the stretch of the electric energy distribution network.
Another spreadsheet containing information on closed occurrences documented by the CEEE/Equatorial team was considered in order to highlight the types of interruptions arising from different causes. Thus, as the primary and occurrence network layer, other layers composed the geographic database, namely, (1) Study area boundary [
10], (2) Neighborhood boundaries [
16], (3) Points of occurrence (CEEE/Equatorial database), (4) Census sector limits [
17], (5) Power distribution network (CEEE/Equatorial database), and (6) 4-m buffer from the energy distribution system (the area of the electrical grid).
Regarding the satellite image, we chose the satellite with a spatial resolution of 0.7 m in the panchromatic band [
18], as it presents the possibility of applying the Normalized Difference Vegetation Index (NDVI) [
19], applied in Brazilian territory recently by [
20]. The scenes covering the study areas were acquired on 8 January 2020, being orthorectified [
21] with geometric terrain correction using data from the Shuttle Radar Topography Mission (SRTM) [
22].
To perform the spatial analysis, it was necessary to adopt a Geographic Information System (GIS) [
23]. Moreover, in order to add and convert the information, the ArcGis
® software was used [
14]. Through its geoprocessing tools, it was possible to convert this vector and matrix information, which were spatialized in the geodetic reference system SIRGAS2000-EPSG 31982, with the same data used in the CEEE/Equatorial database.
2.2. Factor Hierarchy and Map Algebra
With the organized database, together with the orthorectified satellite image, it was possible to start the information crossing in a GIS environment, aiming at a predictive model of conflict locations between vegetation and the distribution network. Thus, to stratify the segments of the electrical network of all the neighborhoods of Porto Alegre into four different groups (high, medium, low, and very low priority of visit), this model was made, integrating five predisposing factors to this problem, namely, absolute population affected by census sector, neighborhood area, amount of vegetation per sector, number of occurrences per sector, and type of customer, whether conventional or strategic.
The first step consisted of assigning weights and ranking these factors, via Hierarchical Process Analysis (HPA) [
24]. The objective of the HPA method was to establish a scale of importance among analyzed factors and, later, organize them in a matrix, so that they were related, paired, and could actually reflect if there was a hierarchy of importance of one factor over another. The attribution of importance among the factors was given by the application of a questionnaire, applied to the technical team of SATC and CEEE/Equatorial, with the participation of 15 specialists, as in the works of [
25].
This questionnaire presented the context of the problem in question, a problem question, and an example of judgment, according to the application of an importance scale (proposed by Professor Thomas Lorie Saaty) [
24], with the interviewee filling in the remaining gaps. The answers were integrated into a parity comparison matrix, which was transformed and normalized, with the ei-vectors being calculated, informing the hierarchy of factors.
Regarding the benefits of the method, with the judgments of peer-to-peer comparisons coming from intuition and experience, HPA is able to consider both qualitative and quantitative aspects (tangible or intangible) of a problem that does not require decision making [
26]. Once an equation with the average opinion of experts was structured, which defined the hierarchies of the five factors, the consistency of the experts’ judgments was determined, that is, weighting according to a Consistency Ratio (CR), which is an analysis of sensitivity, indicative of the judgment of logical relationship [
27].
Once weighted and made up by specialists, the equation that brought together and ranked the factors, arising from the application of HPA, was, in fact, the base model for the application of map algebra [
28]. The map algebra in this work was performed in ArcGis
® 10.8.1 [
14], using spatial analysis tools, raster (ArcToolbox > Spatial Analyst Tools> Map Algebra > raster calculator).
In this logic, each factor was spatialized in a layer with specific weight, superimposed on the layers of the other factors [
29], resulting in a model (final map) that stratified the study area into critical sectors, that is, distinct priority groups for field incursion and design of the forest inventory. HPA is a necessary step to obtain a hierarchy of factors that, once spatialized, integrate perfectly into map algebra.
3. Analysis and Discussion of Results
This section presents the main results obtained in this research and the validation of the spatial stratification performed.
3.1. Presentation of the Study’s Base Factors
Before going deeper into the hierarchy of factors and the structuring of the model, which will generate a priority output map, it was necessary to have an individual explanation of each factor and attribution of weights to its subclasses: (1) Population, (2) Area of the neighborhood, (3) Survey of vegetation, (4) Number of occurrences, and (5) Type of customers.
Population: absolute number of inhabitants, important to identify places where greater numbers of people may be affected by the lack of electricity. The limits of census sectors were used as the smallest unit of political division in the municipal territory, with data from the last demographic census [
10,
11,
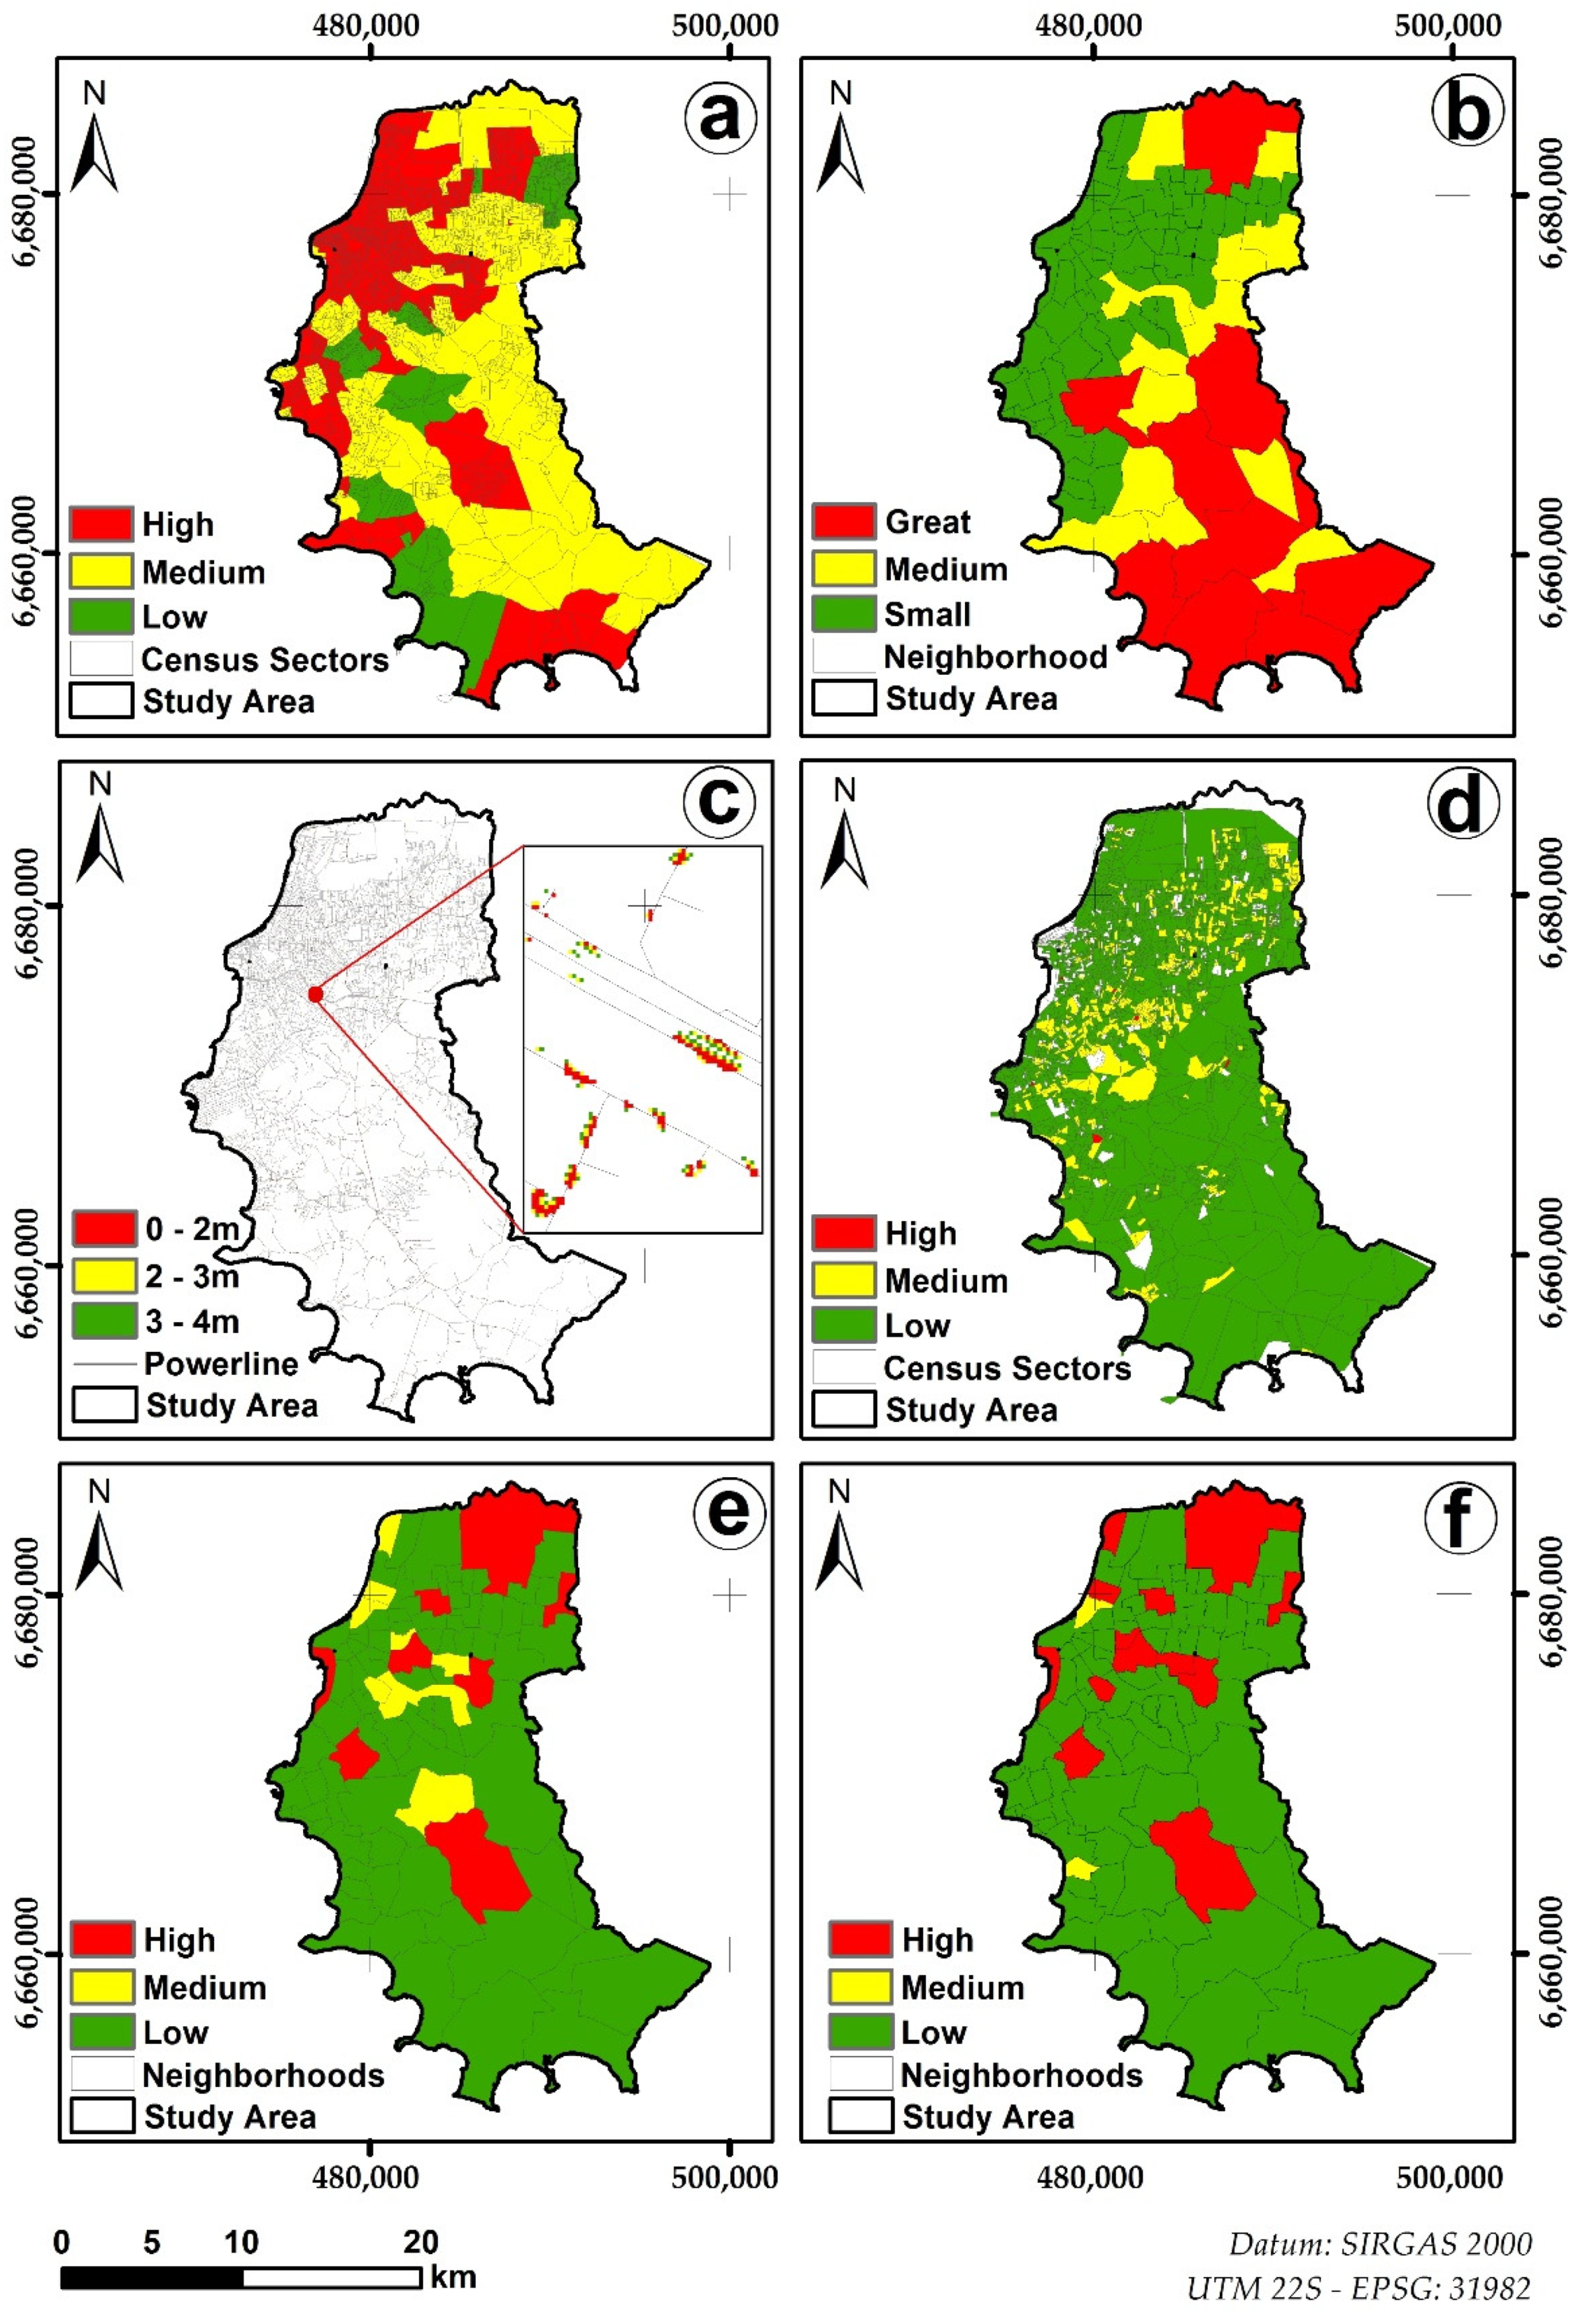
17]. The totality of population information by sectors was computed and standardized, visualized in histograms, and subdivided into three classes, with weight 1 being assigned to the least populous sectors, weight 2 to intermediate sectors, and weight 3 to those with the largest population. Then, using geoprocessing metrics, tabular and vector information was rasterized, obtaining the categorization of the population of Porto Alegre by census tracts (
Figure 3a).
Neighborhood area: consists of neighborhoods grouped into three sets, of large, medium, and small territorial extension (
Figure 3b). This factor is justified by the premise that larger sites could have greater potential for vegetation, or greater network extension, obviously, carrying out an analysis disregarding the other factors, that is, larger neighborhoods would have greater effort sampling to survey the vegetation.
Vegetation survey: Quantity of vegetation close to the grid: The NDVI calculation was performed by the “difference between the reflectance of the near infrared (IR) and red (R) bands, divided by the sum of the two reflectances, being expressed mathematically as NDVI = ((IR − R)/(IR + R))” [
20]. Once the NDVI calculation for Porto Alegre was carried out, all the places that had vegetation were limited to up to 4 m of off-set for each side of the electrical network. Within this buffer, the categorization of vegetation positioned from 0 to 2 m of the net, 2 to 3 m, and 3 to 4 m was carried out, according to the final map obtained for this factor (
Figure 3c).
Number of occurrences: from the database sent by the CEEE/Equatorial team, 304 (tree or vegetation), 311 (wind), and 312 (fall of a tree) causes were selected, verifying the total of these by census sectors of the pilot municipality. However, not always where there were more power outages is where the network is more extensive, that is, there are places with a small linear extension of the network with a high incidence of shutdowns due to conflict with the vegetation. In this way, by adding up the causes mentioned and dividing by the linear extension of the network, it was possible to verify the points of very high recurrence, that is, directing the model to priority places for visits. Sectors with no record of occurrences were also seen or even the absence of the network, remaining blank in this information layer (
Figure 3d).
Type of customer: It was assumed that any consumer is a conventional customer and that, among these, some have a certain specialty (social, institutional function, for example) or even strategic purpose (airports, for example). Thus, it was possible to combine and stratify the table of information forwarded to CEEE/Equatorial (files with data from the years 2017 to 2020) according to the type of customer, assigning weights from 1 (conventional) to 3 (strategic), spatialized in the same way as the types of occurrences, that is, keeping proportionality with the area of each neighborhood. Thus, the absolute number of strategic customers will only have a greater ‘weight’ if they are territorially concentrated. The weights assigned in the conventional customers/neighborhood area ratio are shown in
Figure 3e, and strategic customers/neighborhood area in
Figure 3f.
Once the procedures for obtaining the determining factors to carry out a field visit were presented, it was necessary to rank these five factors of this proposition, establishing the importance of one factor over the others. For this, the Hierarchical Process Analysis (HPA) was adopted.
3.2. Definition of Factor Hierarchy
To define the hierarchy of the base factors of the study, the HPA was applied during the stage of discussion and judgment between two paired factors. Prior knowledge and experience of experts was considered, considering the different points of view to stimulate relative magnitudes’ comparison and minimizing failures.
For this work, a questionnaire was designed to ascertain the opinion of the CEEE/Equatorial and SATC team about the hierarchy of the five listed factors, meeting the HPA objective of transforming subjective knowledge into quantitative information. This questionnaire, with the context of how to carry out the participation of each specialist in the topic of electricity and conflicts with vegetation, was applied by the technical team participating in the project via the addition of parity comparisons on the Google Forms’ platform.
With the answers computed, the starting point for applying the HPA was the structuring of the judgment matrix or parity comparison.
Table 1 presents an example of the matrix structured from the answers of one of the experts participating in the project, in which, as an example, it can be mentioned that the factor number of occurrences of power shutdown is much more important than the amount of population in the affected region. The attribution of grades followed the Saaty Fundamental scale, which varies from 1/9 to 9, that is, from least to most important.
Next, the eigenvectors were calculated from the normalization of the comparison matrix. The results of the eigenvectors provided the hierarchy (
Table 2) or order of priority, derived from the five factors that were compared for each interviewee, showing the computed weights of the importance of a multi-criteria model that guided the importance of the areas to be visited in the city of Porto Alegre. In this example, the factor number of occurrences accounted for 30.06%; vegetated area, 30.06%; type of consumer, 28.32%; population, 7.40%; and neighborhood area, 4.16%.
Once the eigenvector matrix was obtained, the HPA method presented as an advantage the possibility of determining the consistency of the weights that were assigned to each of the analysis criteria, that is, validating and weighting according to a Consistency Ratio (CR). The CR is the probability that the values of the judgments were random, ranging from 0 to 1, and its result cannot be greater than 0.1 (10% inconsistency); otherwise, it will imply a reassessment or even rejection of the weights assigned by different respondents. In this example, the OR was 2.43% (<10%), that is, the weights attributed by the respondent to the paired factors were adequate.
The same procedures were performed for all 15 experts who responded to the survey. With all the eigenvectors (weights) of the predisposing factors, defined by each specialist, an arithmetic average of the different propositions was made, obtaining the final hierarchy of the five factors, which was adopted to carry out the cartographic modeling via algebra of maps to obtain a zoning of priority areas for the forest inventory.
In order to integrate the 11 participants, whose CR of their judgments were below 10% (on average 8.72),
Table 3 was organized, which brings together the participation of interviewees from CEEE/Equatorial and SATC. As can be seen in
Table 3, from the relation of weights by factors of the respective interviewees, a simple arithmetic mean was made, shown in the column on the right.
Thus, the average value obtained from the eigenvectors (weights) of each factor predisposing to the forest inventory was used to compose the multiplier coefficients of each class of each factor, which had already been idealized and rasterized, as shown in
Figure 3. These results were associated in the form of an equation, which could be inserted in a GIS software raster calculator (Equation (1)), where the map algebra was performed to compose a final model, that is, an output synthesis map, a guideline of priority areas for field incursions.
3.3. Factor Crossings and Final Model for Field Work
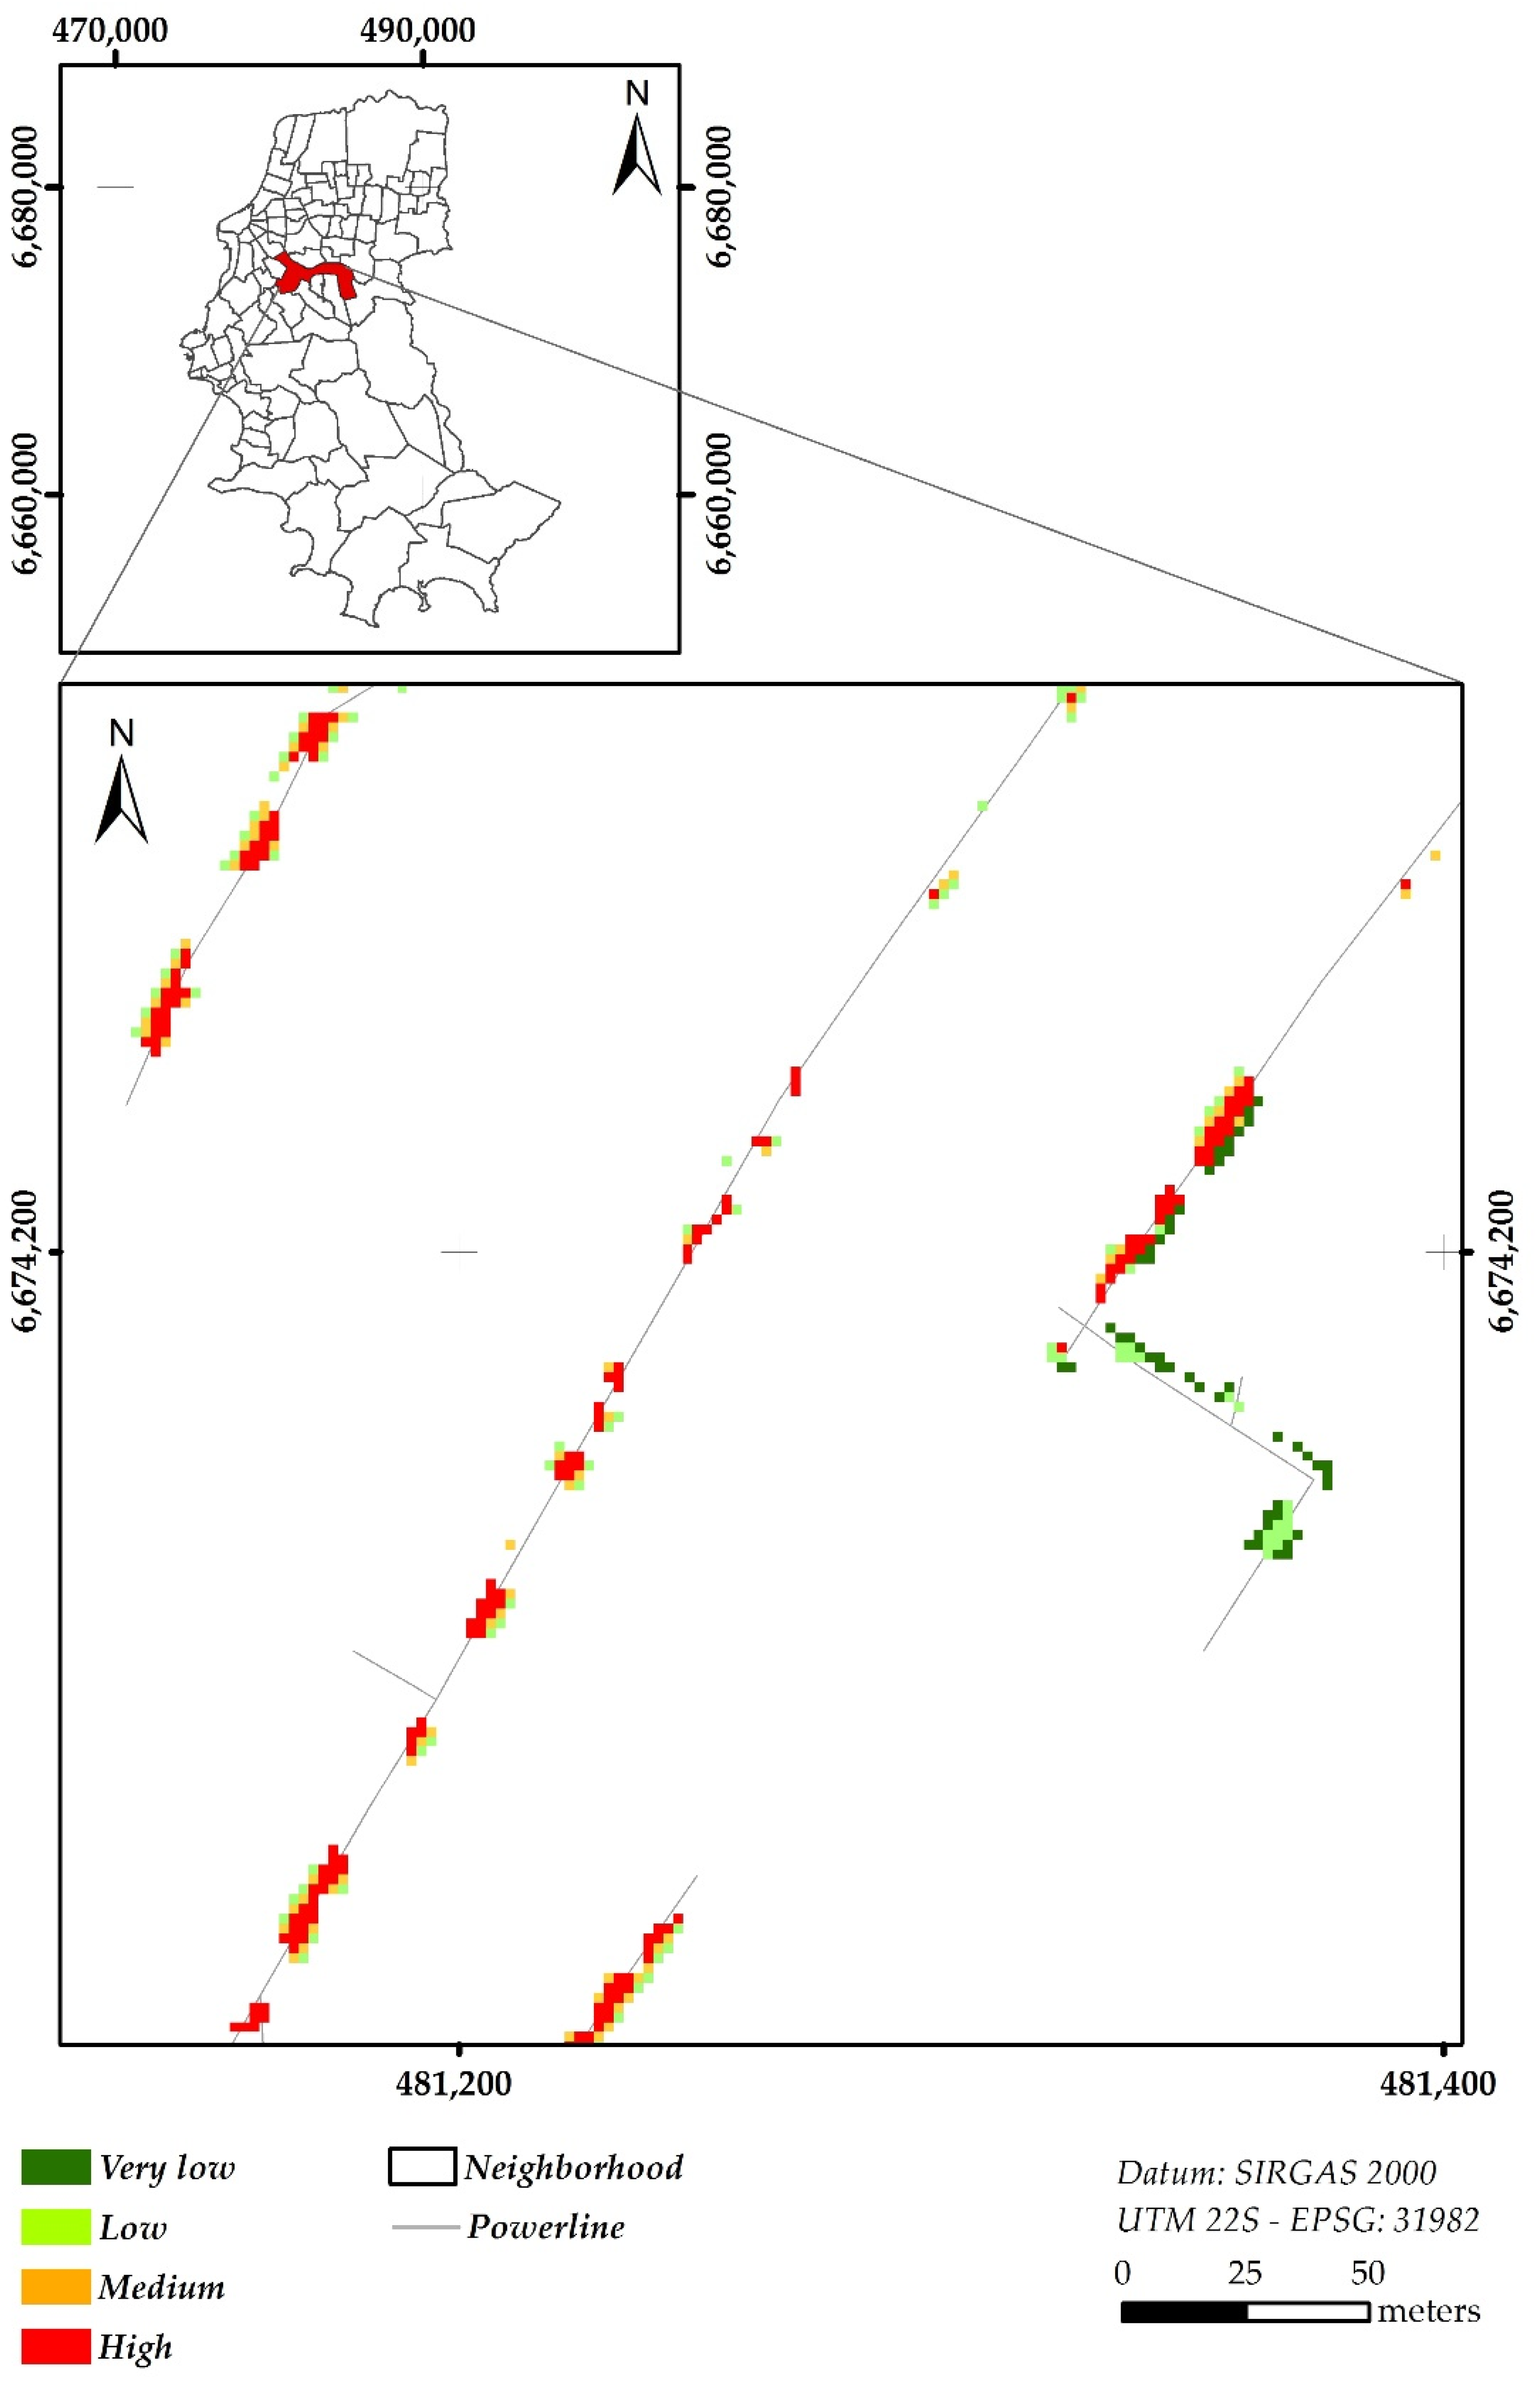
After obtaining the weights of the factors using the HPA method and determining that these weights were consistent, they were combined with the information transformed from tabular to matrix data, in the idealized and classified maps for each predisposing factor. Through this algebra of maps, it was possible to reach the final map of this cartographic modeling of stratification for priority areas for the visit (
Figure 4).
The visual result of the final model was expressed with different colors within the idealized buffer of 4 m for each side of the electrical system (
Figure 4). Each color presented a cartographic communication, and the absence of (empty) colors, where the network would hypothetically pass, indicated the absence of conflict with the vegetation. The warm colors indicated that they had priority points for the visit: in orange, the secondary care locations, and, in red, the prioritization locations for the forest inventory.
The assumption of priority classes, whose colors express them on a map, is the result of cartographic modeling, considering the combination of factors, their particularities, and the hierarchy established among them. Therefore, a ‘red zone’ is not only a place that has vegetation close to the network but also the site has a recurrence of disconnections, that the network is not extensive in relation to the neighborhood area, which affects many users, that these are a priority, that is, a combination already demonstrated here and explained by Equation (1).
Regarding the stratification performed, it was conceived based on the examination of the frequency histogram of the component pixels of the map derived from the modeling, in which it was conceived that the last quartile would be represented in red. From the absolute number of pixels (
Figure 4), with a value on the abscissa axes > 1.73, only the priority ‘red zones’ for carrying out fieldwork for the entire municipality of Porto Alegre were cut. In the computation of frequencies, 57,401 pixels, in different quartiles, represented the colors in
Figure 4. Only the >1.73 quartile refers to priority areas, with 14,350 pixels, which would form priority polygons. As it would not be feasible to visit all these places, a random sampling was carried out that was representative, with a significance of 90%, being then prioritized to visit 100 places in the field.
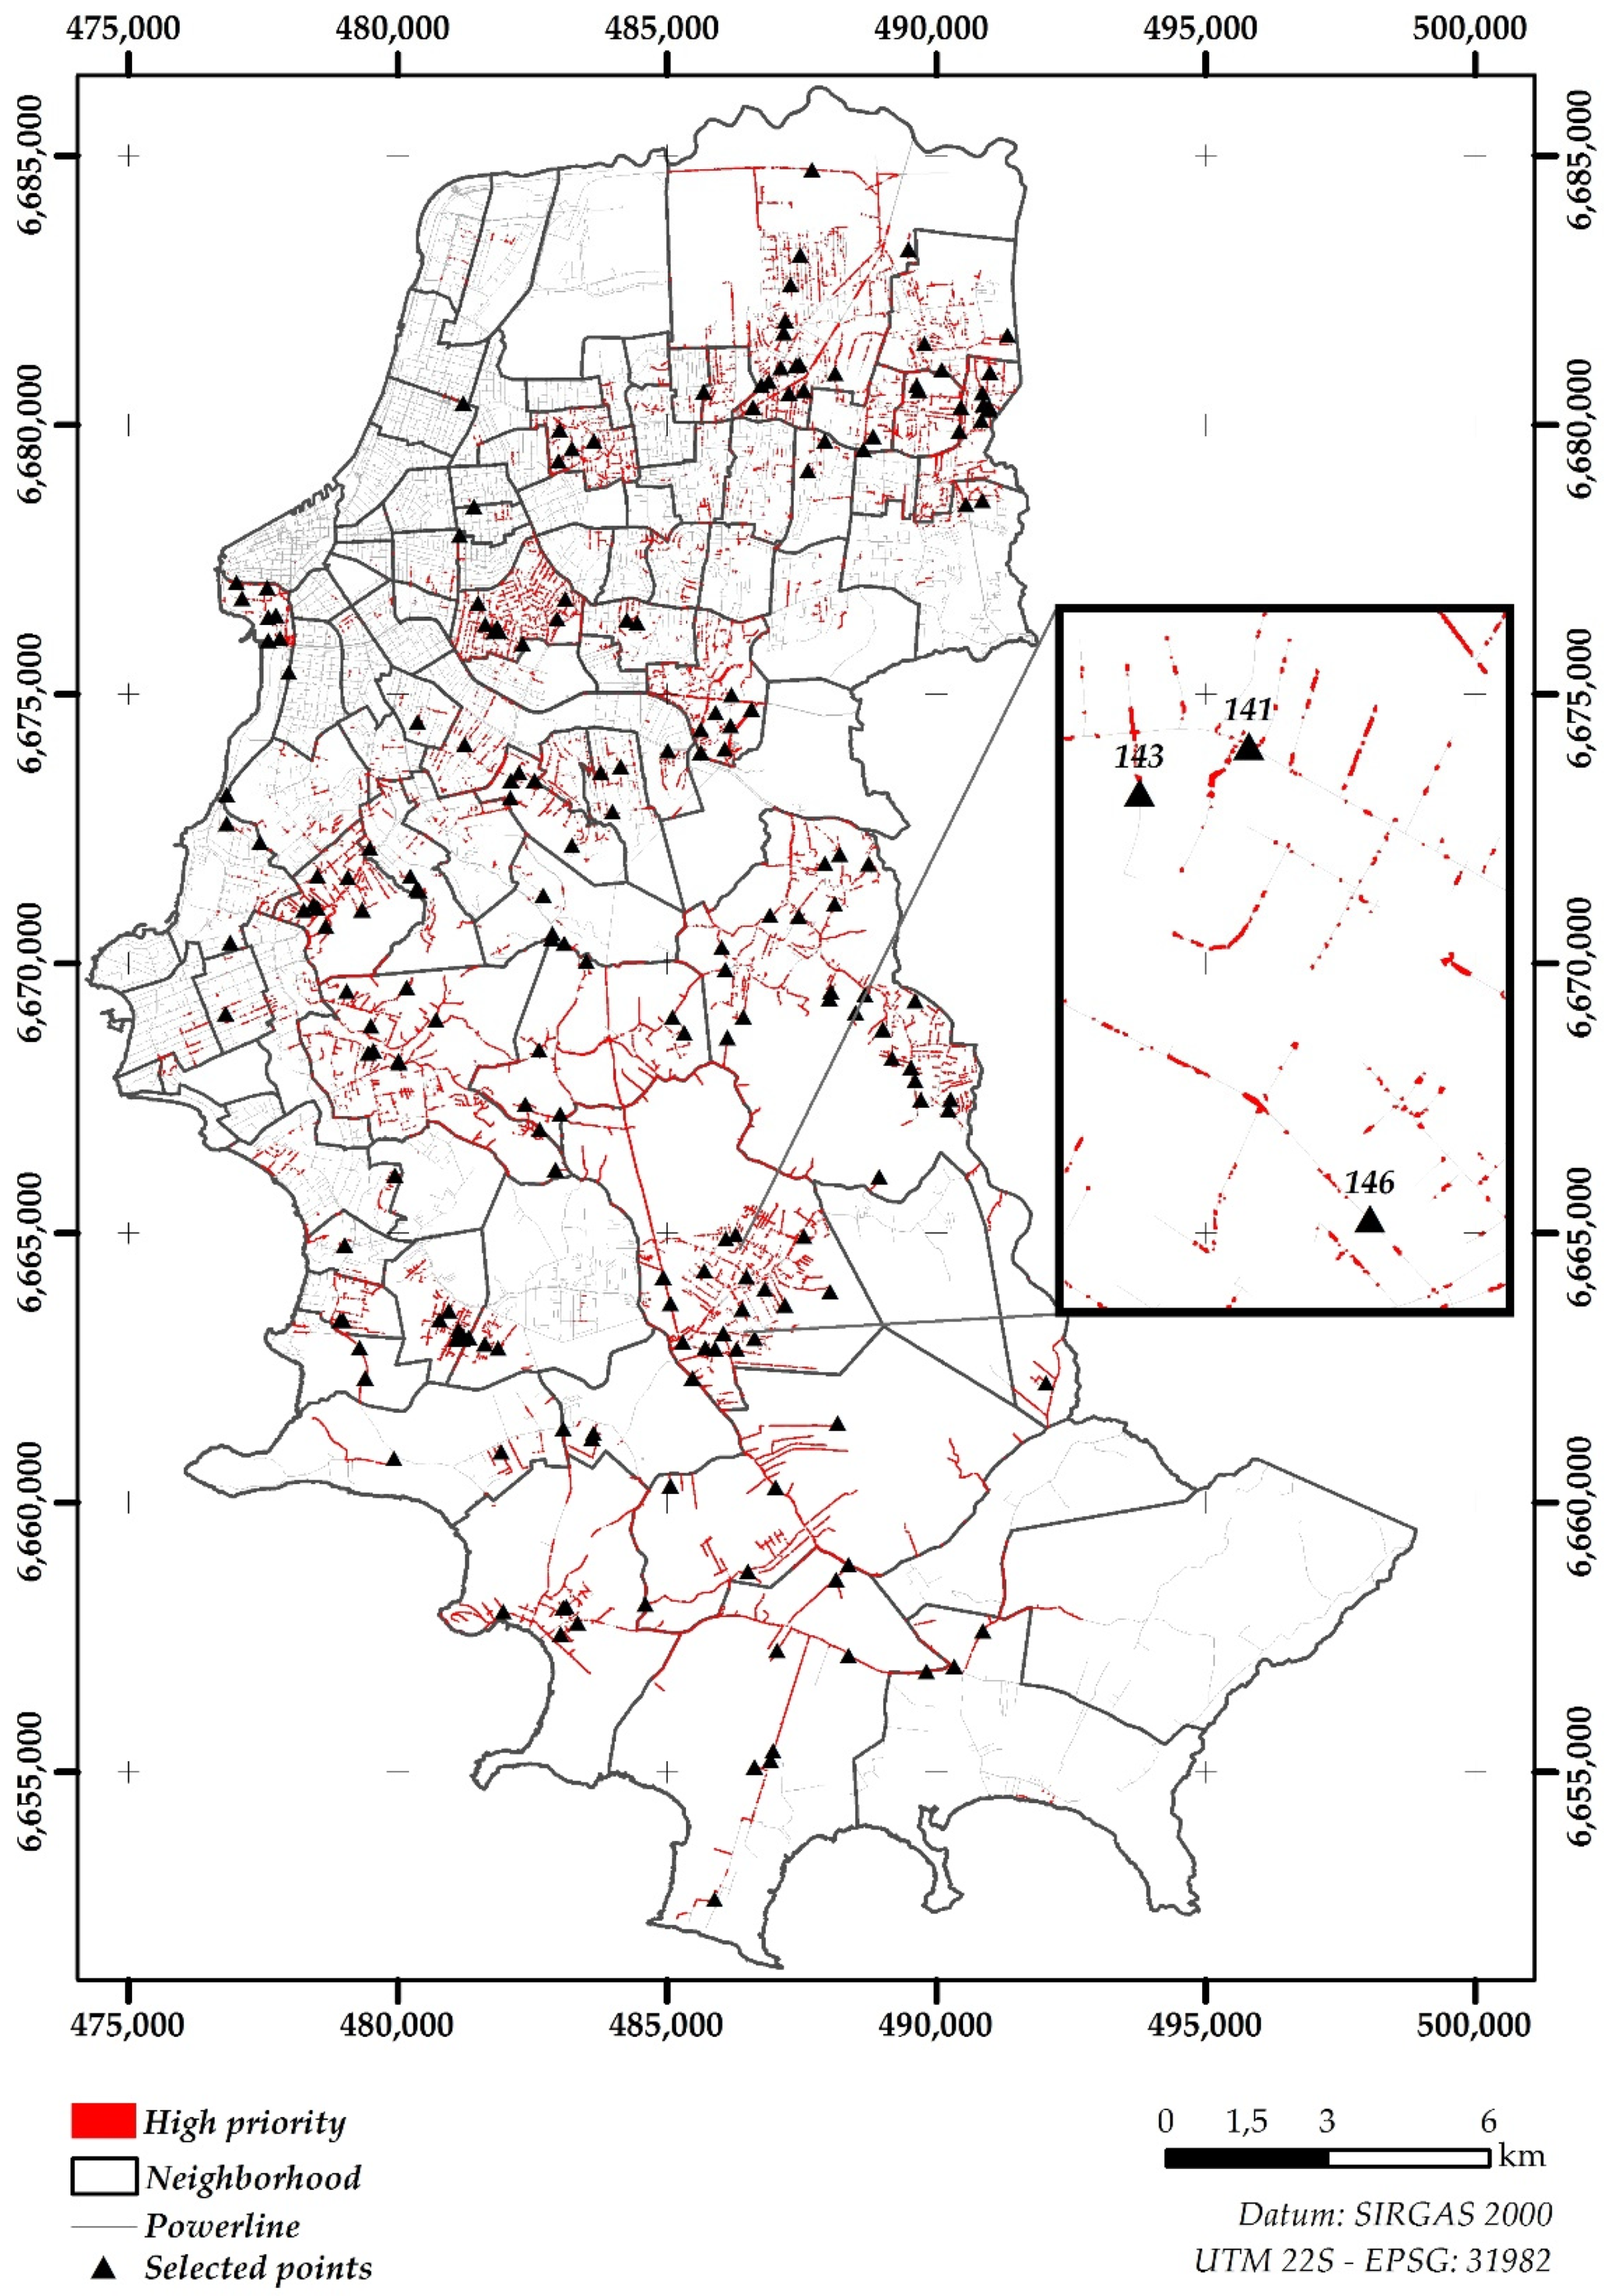
Even at this stage of pre-field modeling, it was already known that not all areas could be visited, either because of roads and blocked accesses for public works, sometimes because of lack of safety, or because they had recently pruned and cut trees. Thus, 200 points were plotted with coordinates on the centroids of random pixels, so that 100 of these could be validated in the field (
Figure 5).
Furthermore, it was known that characteristics of dozens of individuals would be collected at each point, which would increase the sampling significance. For example, if 100 points were visited and the average registered 15 trees in each, for a hypothetical total of 1500 trees, the idealized significance of 90% would jump to 97.4%. In view of this high significance for the number of samples to be collected in places of equal spatial significance obtained by the model, the project’s field activities began.
4. Conclusions
The contact of vegetation with the electrical grid is a widespread problem in urban areas; however, it can be avoided if diagnosed, with a view to planning the correct cities’ afforestation. In Brazil, this problem is exacerbated by tropical climate conditions, facilitating rapid plant growth and even proliferation of some invasive specimens under and laterally to the energy distribution system.
The methodology proposed in this study allows for a mapping and prioritization of mandatory locations for carrying out a confirmatory forest inventory in loco, integrating the occurrence of disconnections, number and type of affected users, and extension of the neighborhood, among others. The mapping of critical zones is represented in different nuclei where the places with priority for visitation are represented in the hot nuclei, with orange being the places that deserve secondary attention and red the places that have priority for the realization of the posterior forest inventory. It is noteworthy that the greatest limitation found for the application of the methodology was due to the reliability of the database and the need for additional data and the extraction of duplicated data, which are subject to spatial crossing. An example is the satellite image that was made available of a multispectral nature, which requires the application of an index to extract vegetation information in relation to the urban space; however, if we had a hyperspectral image, anatomical analyses on plant taxonomy would be carried out.
As a recommendation for future research, an additional factor was incorporated into the model: the type of energy distribution system, giving greater weight to places where the network is bare (greater risk), with a lower weight where it is protected (lesser risk). This is because in places with an electrical grid every touch of vegetation can generate a short circuit, while in a protected network the vegetation can coexist in the same network space; thus, a layer with this information could improve the model, changing the number of points to be prioritized for field visits, optimizing the forest inventory.
Finally, the spatial stratification obtained in the study and validation of the proposed methodology can be replicated, giving or adapting hierarchical factors and criteria, to help optimize the diagnosis of problem areas in different consumption centers that present a conflict of vegetation with the electrical grid. Therefore, based on the study carried out, it can be stated that the method is an alternative to mitigate conflicts between the electrical grid and urban vegetation in a reliable forest inventory, oriented to priority locations for pruning, cutting, and even changing tree specimens, avoiding interruption of energy distribution system.


 ,
, 
