
Evaluation and Dynamic Evolution of the Total Factor Environmental Efficiency in China’s Mining Industry

Abstract
:1. Introduction
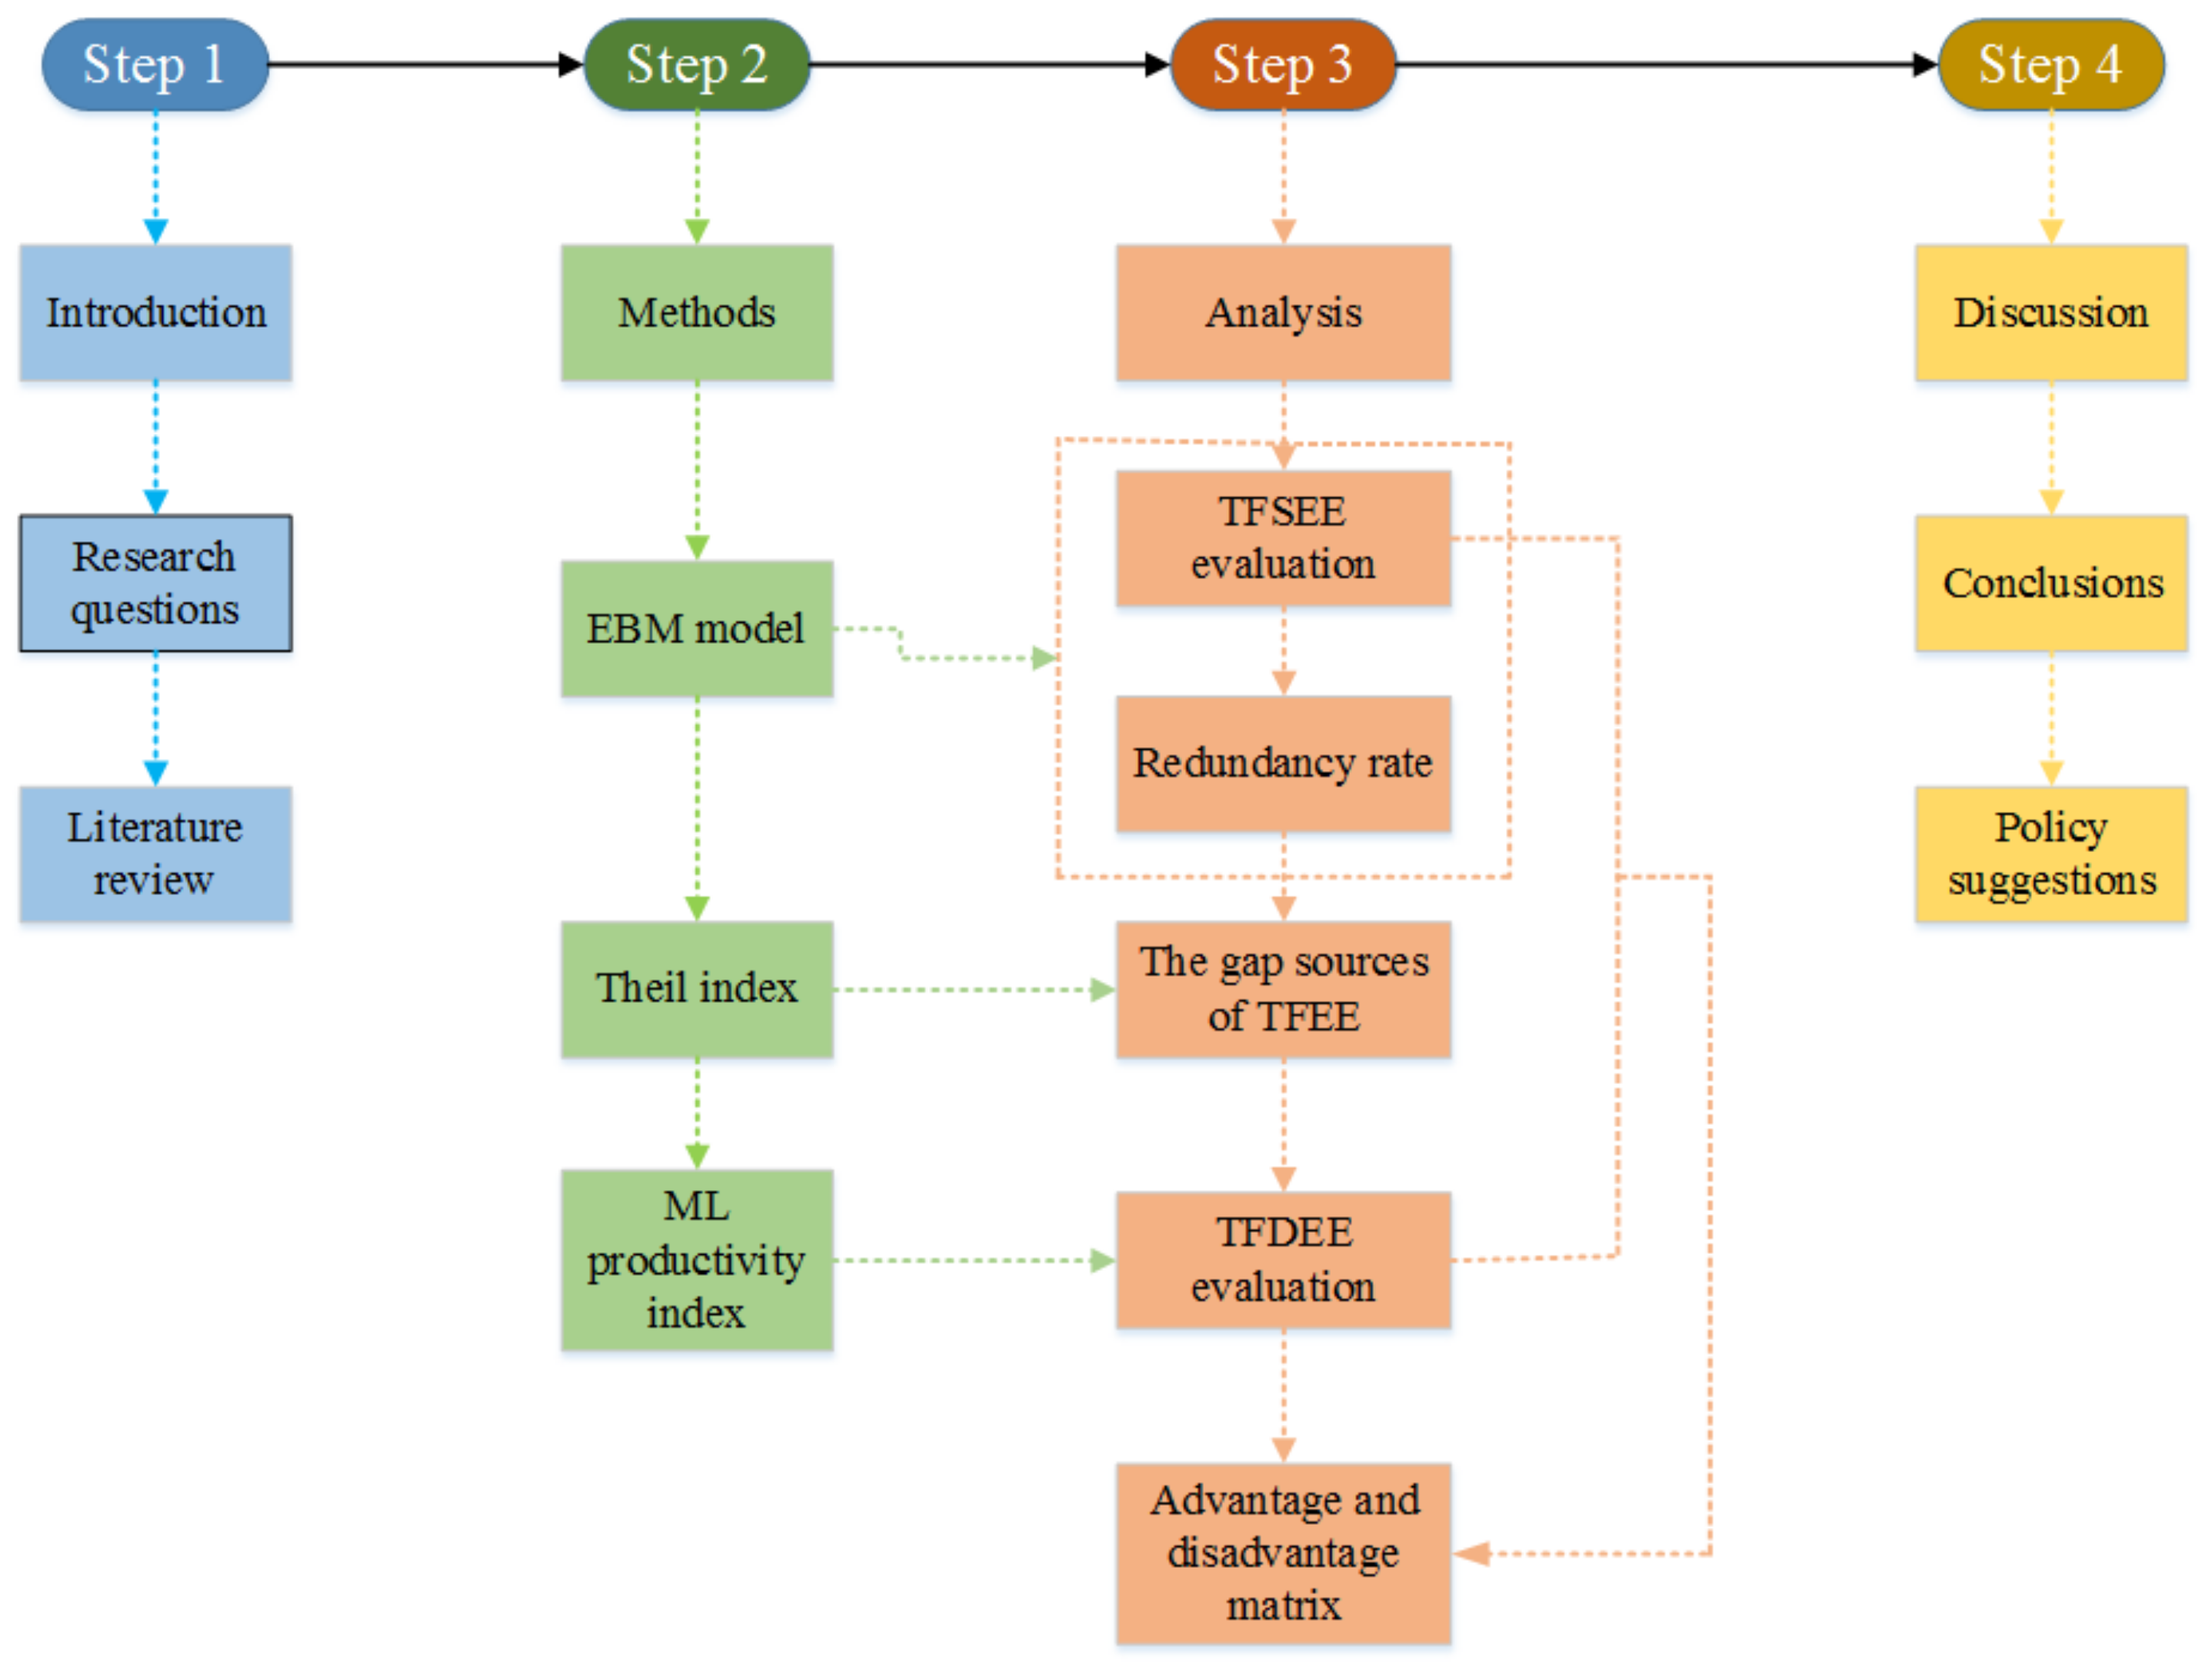
2. Research Methods
2.1. Epsilon-Based Measure Model
2.2. Theil Index
2.3. Malmquist–Luenberger Productivity Index
3. Variable Selection and Data Sources
3.1. Input and Output Variables
3.2. Region Description
4. Results and Discussion
4.1. Analysis of TFSEE in China’s Mining Industry
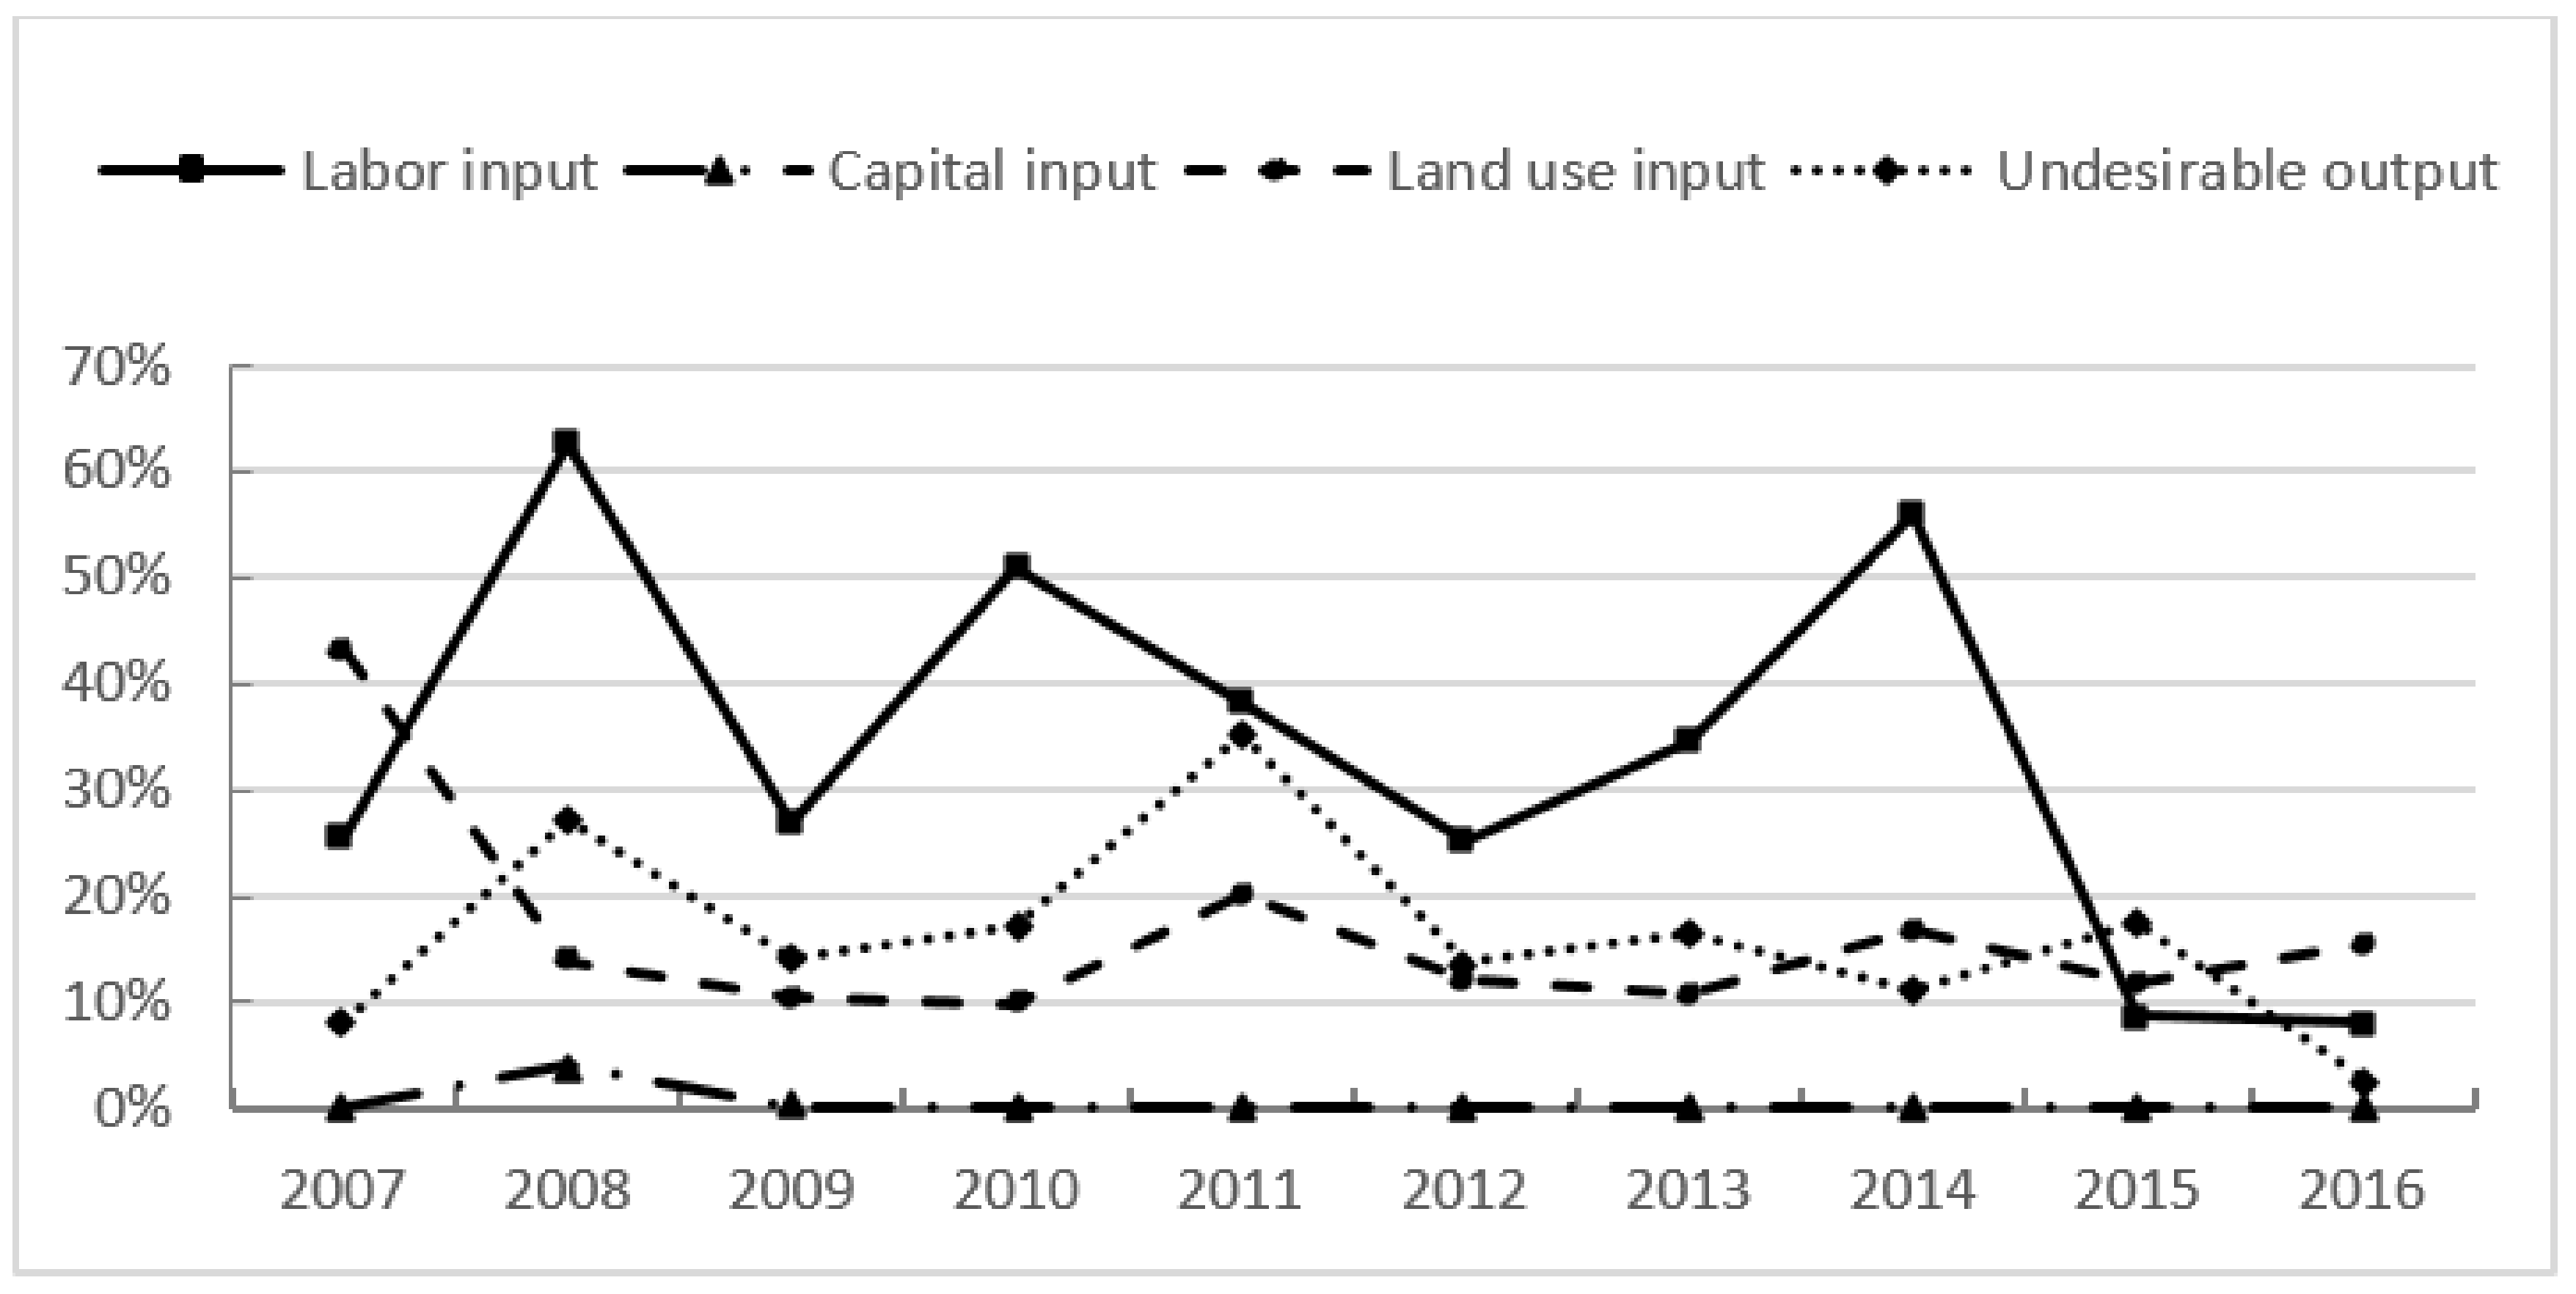
4.2. The Potential of Input-Saving and Undesirable Output Reduction
4.2.1. Overall Analysis
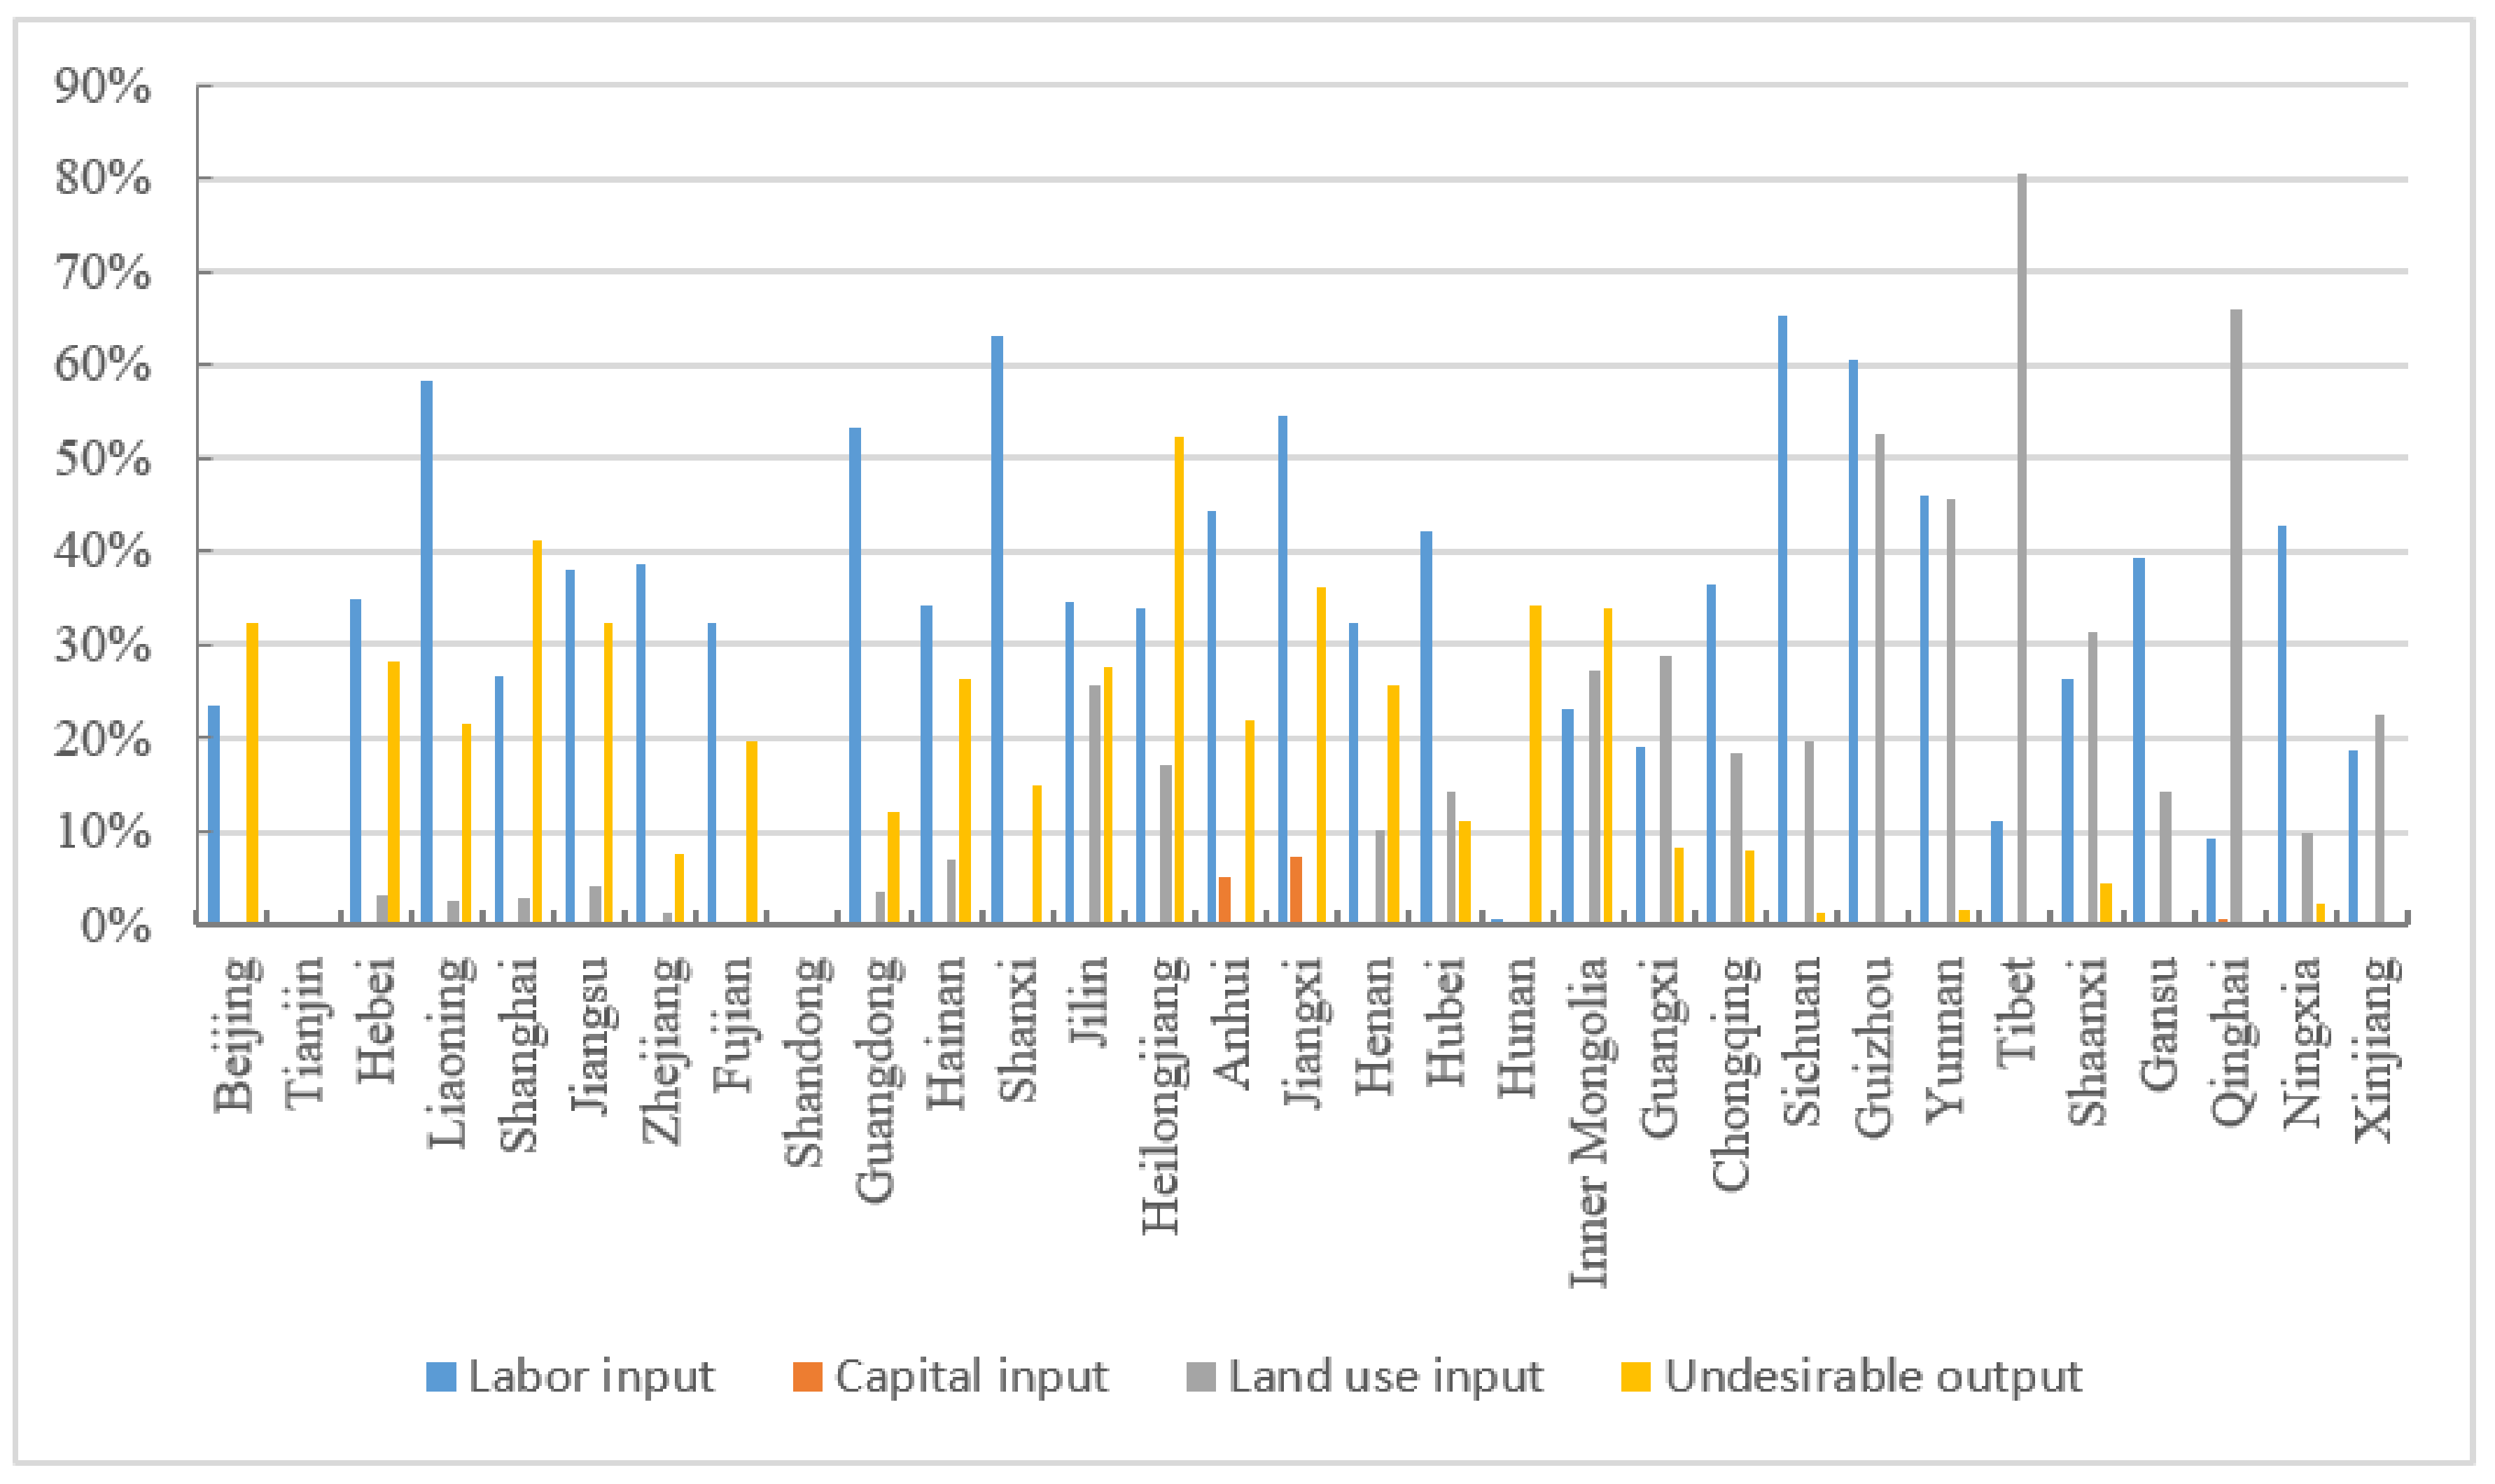
4.2.2. Provincial Analysis
4.2.3. Regional Analysis
4.3. The Sources of Provincial Gap of TFEE in China’s Mining Industry
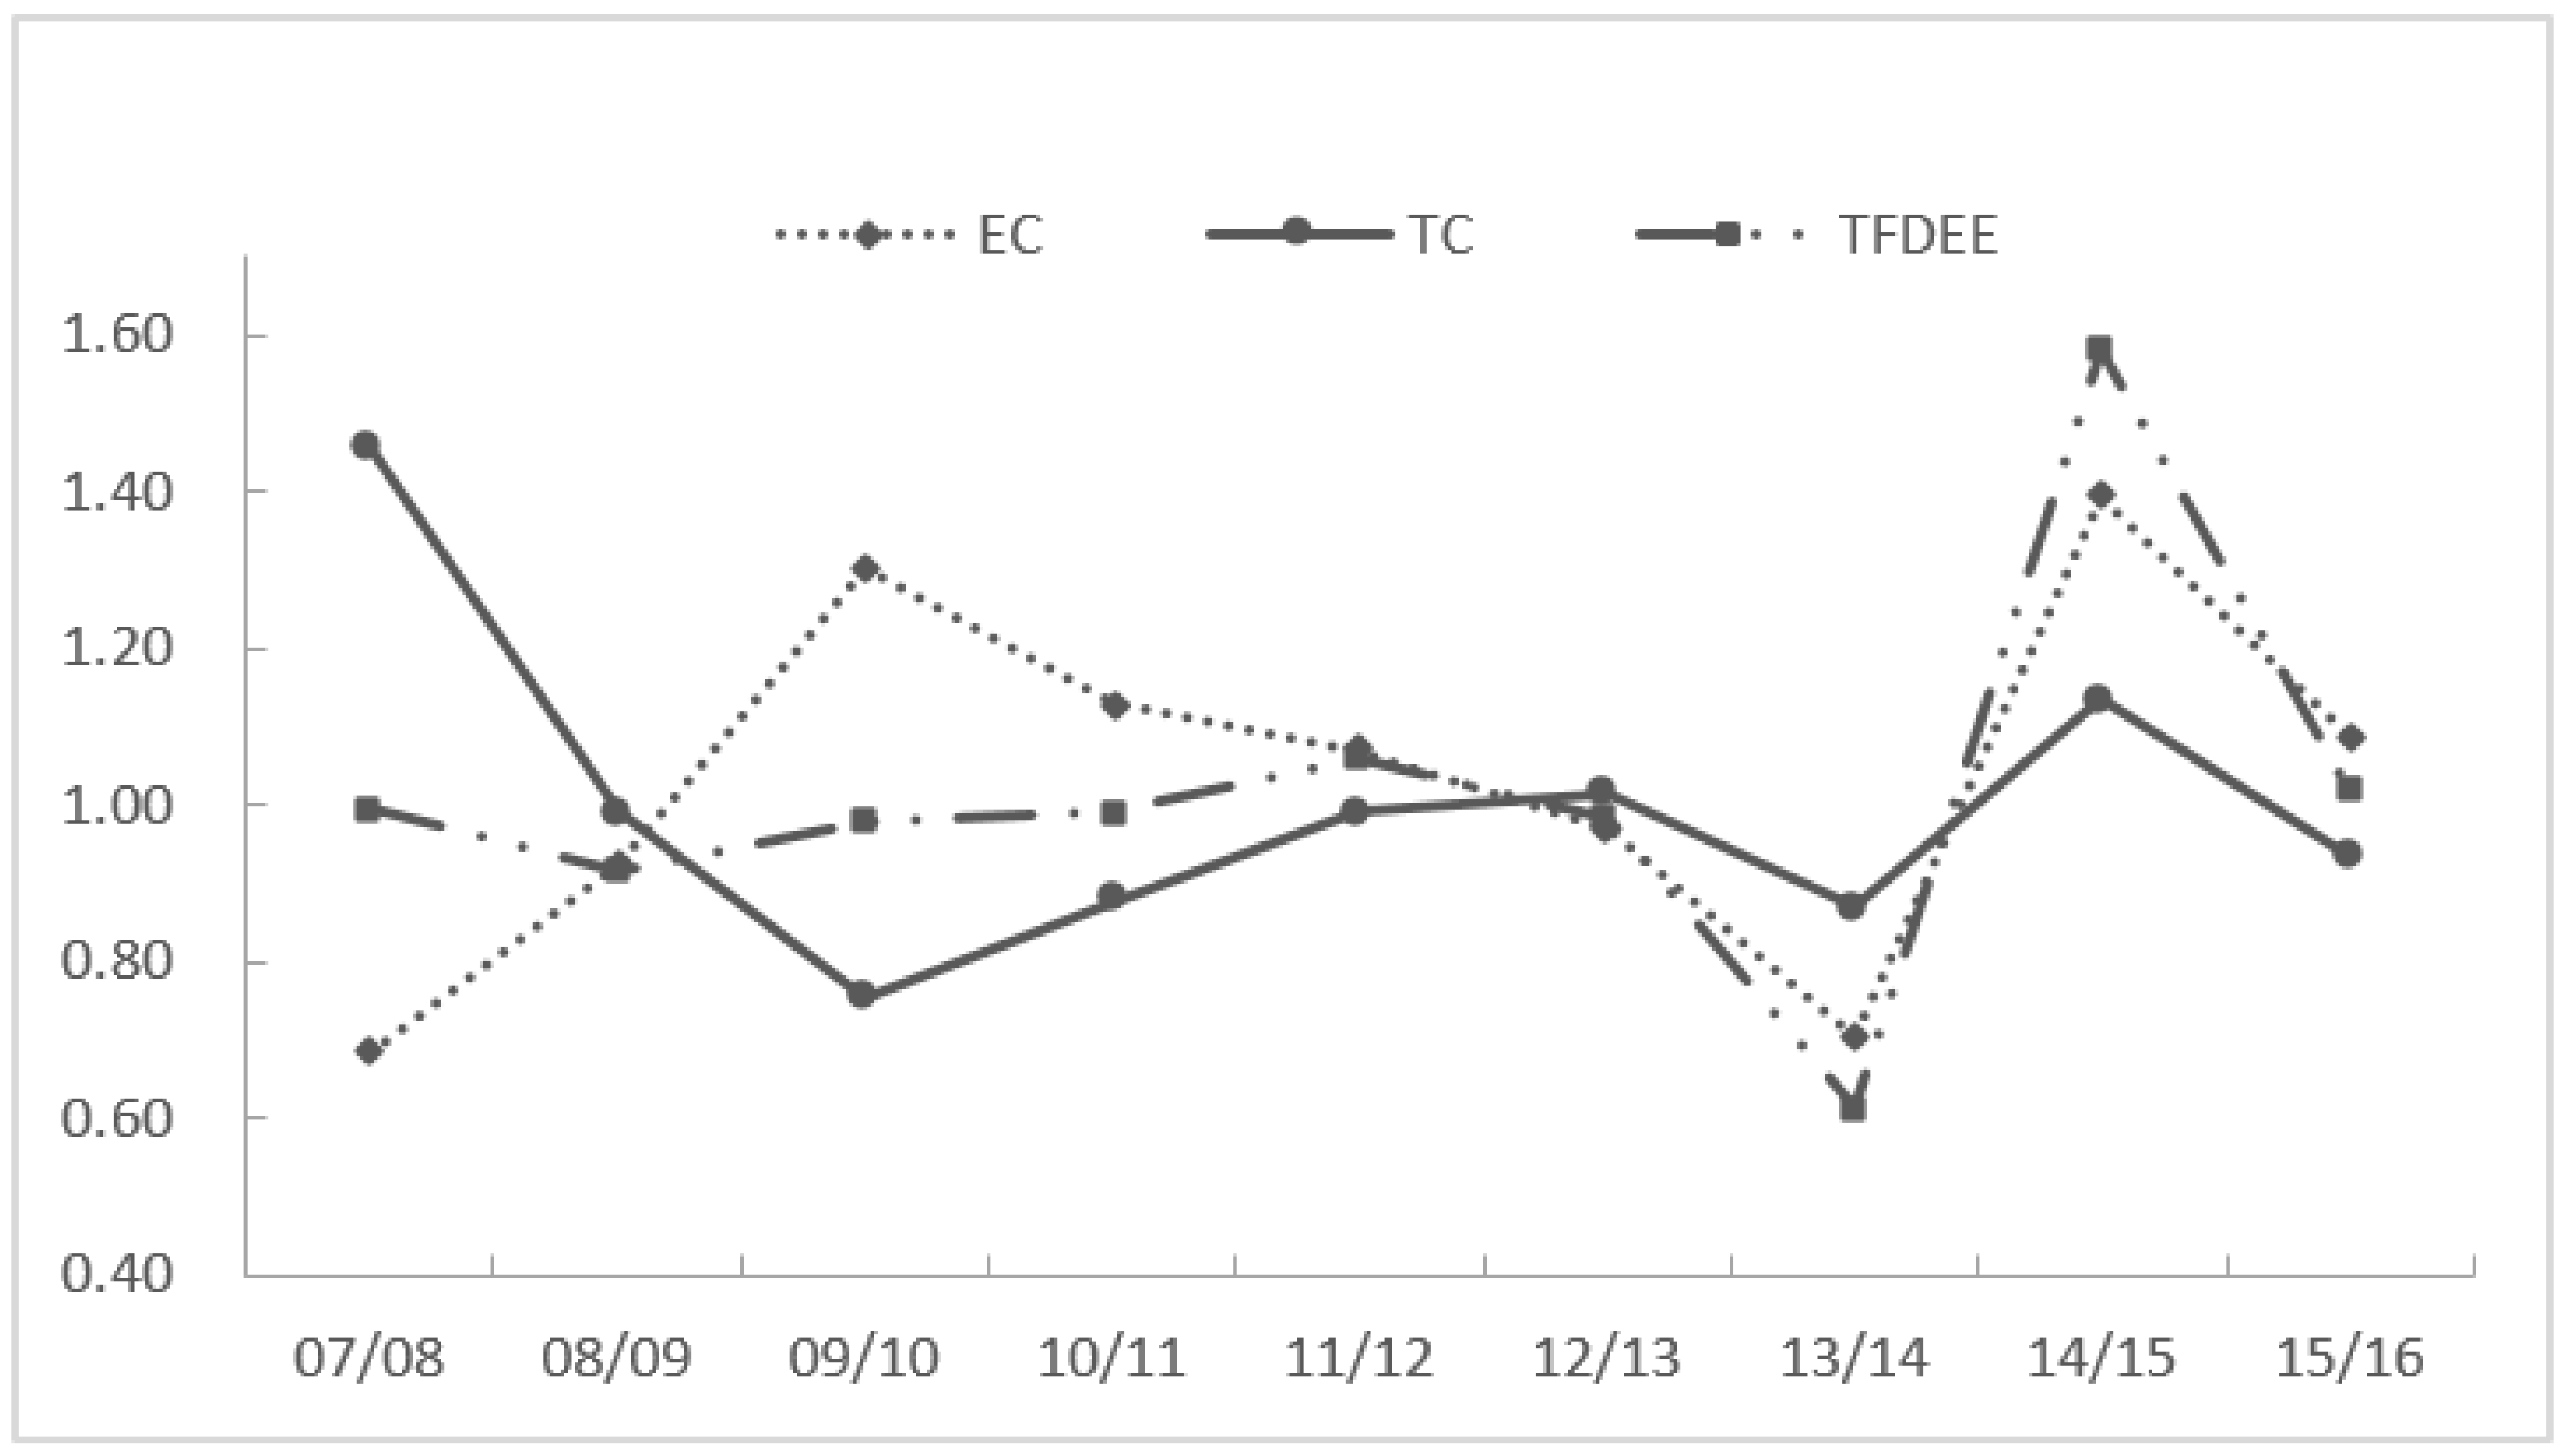
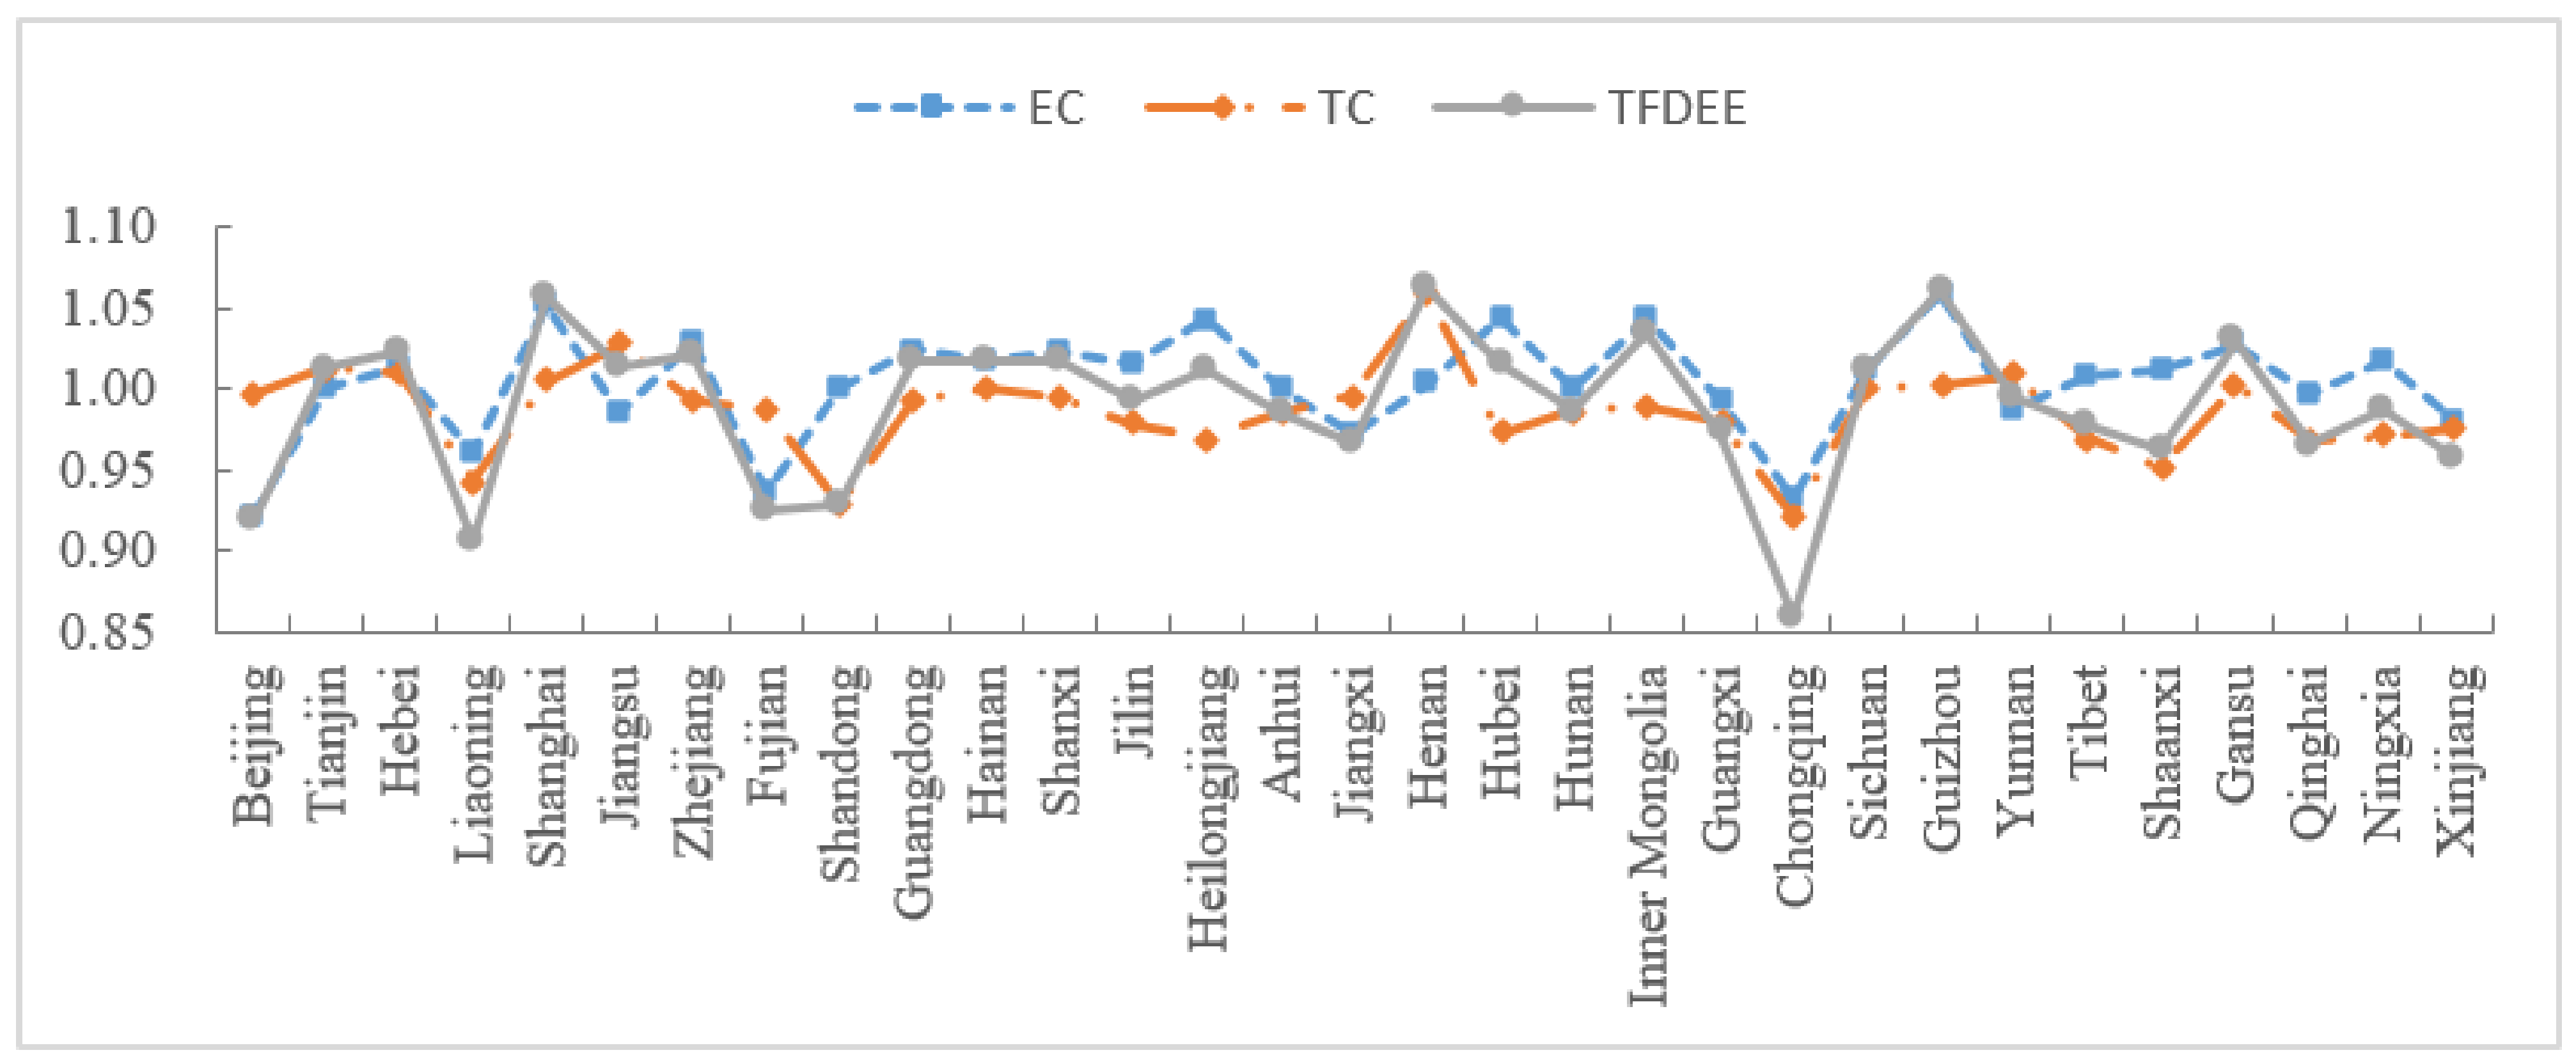
4.4. Analysis of TFDEE in China’s Mining Industry
4.4.1. Overall Analysis
4.4.2. Provincial Analysis
4.4.3. Regional Analysis
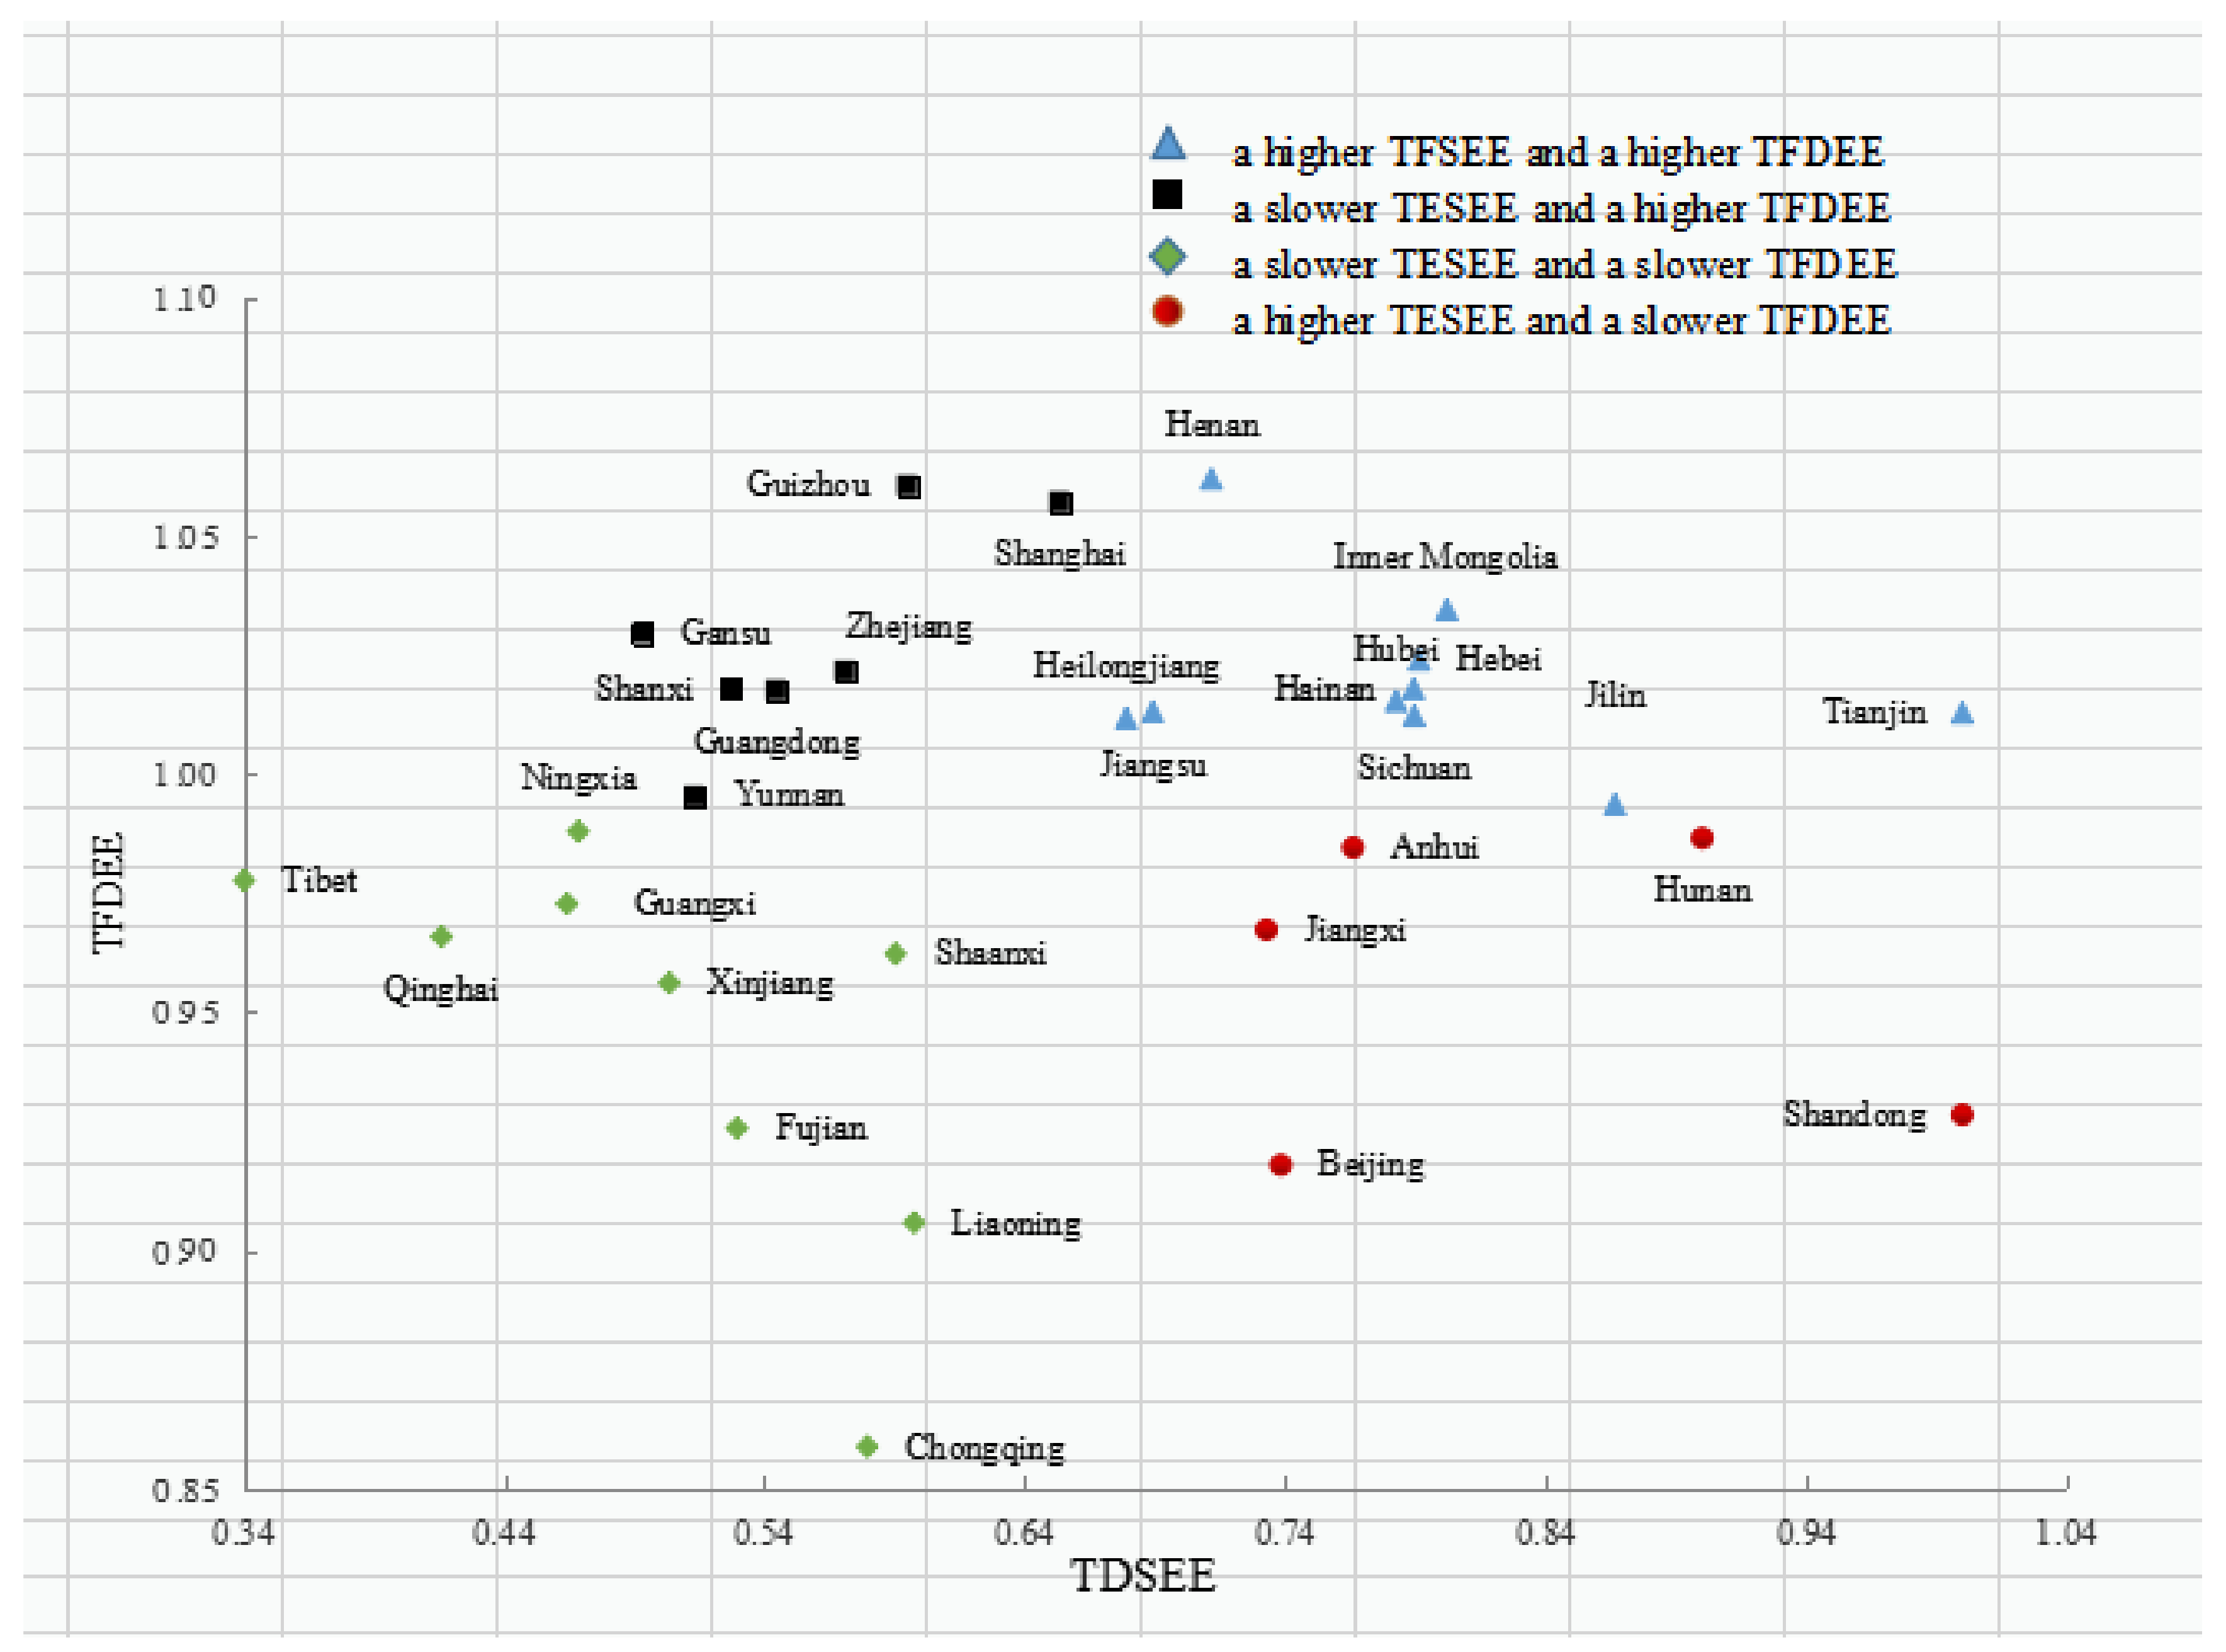
4.5. The Advantages and Disadvantages for Improving TFEE in China’s 31 Provincial Mining Industries
5. Conclusions and Policy Recommendations
5.1. Conclusions
5.2. Policy Recommendations
Author Contributions
Funding
Institutional Review Board Statement
Informed Consent Statement
Data Availability Statement
Acknowledgments
Conflicts of Interest
References
- Hartman, H.L.; Mutmansky, J.M. Introductory Mining Engineering, 2nd ed.; Wiley: Hoboken, NJ, USA, 2002. [Google Scholar]
- Salmi, O. Eco-efficiency and industrial symbiosis e a counterfactual analysis of a mining community. J. Clean. Prod. 2007, 15, 1696–1705. [Google Scholar] [CrossRef]
- Kumar, A.; Nikhil, K. Environmental impact assessment (Eia) study of metal mines: A critical review. Int. J. Eng. Tech. Res. 2014, 2, 324–326. [Google Scholar]
- Renata, O.; Ana, S.; Andreia, Z. Expanded eco-efficiency assessment of large mining firms. J. Clean. Prod. 2017, 142, 2364–2373. [Google Scholar]
- Pankaj, G.; Mukesh, K.M.; Usha, A.; Charles, V. An integrated AHP-DEA multi-objective optimization model for sustainable transportation in mining industry. Resour. Policy 2018, 74, 101180. [Google Scholar]
- Ilankoon, I.M.S.K.; Tang, Y.; Ghorbani, Y.; Northey, S.; Yellishetty, M.; Deng, X.Y.; McBride, D. The current state and future directions of percolation leaching in the Chinese mining industry: Challenges and opportunities. Miner. Eng. 2018, 125, 206–222. [Google Scholar] [CrossRef] [Green Version]
- Ma, D.; Fei, R.L.; Yu, Y.S. How government regulation impacts on energy and CO2 emissions performance in China’s mining industry. Resour. Policy 2019, 62, 651–663. [Google Scholar] [CrossRef]
- Zhang, J.J.; Rao, Y.H.; Geng, Y.H.; Fu, M.C.; Prishchepov, A.V. A novel understanding of land use characteristics caused by mining activities: A case study of Wu’an, China. Ecol. Eng. 2017, 99, 54–69. [Google Scholar] [CrossRef]
- Li, Y.; Chiu, Y.B.; Lin, T.Y. Coal production efficiency and land destruction in China’s coal mining industry. Resour. Policy 2019, 63, 101449. [Google Scholar] [CrossRef]
- Rao, Y.H.; Xu, Y.; Zhang, J.J.; Guo, Y.Q.; Fu, M.C. Does subclassified industrial land have a characteristic impact on land surface temperatures? Evidence for and implications of coal and steel processing industries in a Chinese mining city. Ecol. Indic. 2018, 89, 22–34. [Google Scholar] [CrossRef]
- Ministry of Land and Resources of China Geological Survey. National Mineral Resources Planning (2016–2020). Available online: http://www.cgs.gov.cn/tzgg/tzgg/201612/t20161206_418714.html (accessed on 1 June 2021). (In Chinese)
- Ministry of Ecology and Environment of the PRC. The Ecological Environmental Protection Plan of the 13th Five-Year. Available online: http://www.mee.gov.cn/zcwj/gwywj/201811/t20181129_676583.shtml (accessed on 1 June 2021). (In Chinese)
- Peng, S.P.; Bi, Y.L. Strategic consideration and core technology about environmental ecological restoration in coal mine areas in the Yellow River basin of China. J. China Coal Soc. 2020, 45, 1211–1221. [Google Scholar]
- Ma, L.; Tian, H.Z.; Kang, L. Eco-environmental impact and spatial control of mineral resources exploitation in the Yellow River Basin. Resour. Sci. 2020, 42, 137–149. [Google Scholar] [CrossRef]
- Ma, L.; Zou, L.; Ren, L.F.; Chung, Y.H.; Zhang, P.Y.; Shu, C.M. Prediction indices and limiting parameters of coal spontaneous combustion in the Huainan mining area in China. Fuel 2020, 264, 116883. [Google Scholar] [CrossRef]
- Qi, R.; Liu, T.Y.; Jia, Q.X.; Sun, L.; Liu, J.Y. Simulating the sustainable effect of green mining construction policies on coal mining industry of China. J. Clean. Prod. 2019, 226, 392–406. [Google Scholar] [CrossRef]
- Wang, M.; Feng, C. Analysis of energy-related CO2 emissions in China’s mining industry: Evidence and policy implications. Resour. Policy 2017, 53, 77–87. [Google Scholar] [CrossRef]
- Liu, X.M.; Meng, X.R. Evaluation and empirical research on the energy efficiency of 20 mining cities in Eastern and Central China. Int. J. Min. Sci. Technol. 2018, 3, 525–531. [Google Scholar] [CrossRef]
- Zhu, X.H.; Chen, Y.; Feng, C. Green total factor productivity of China’s mining and quarrying industry: A global data envelopment analysis. Resour. Policy 2018, 57, 1–9. [Google Scholar] [CrossRef]
- Wu, J.; Li, M.J.; Zhu, Q.Y.; Zhou, Z.X.; Liang, L. Energy and environmental efficiency measurement of China’s industrial sectors: A DEA model with non-homogeneous inputs and outputs. Energy Econ. 2019, 78, 468–480. [Google Scholar] [CrossRef]
- Xiao, C.M.; Wang, Z.; Shi, W.F.; Deng, L.C.; Wei, L.Y.; Wang, Y.W.; Peng, S. Sectoral energy-environmental efficiency and its influencing factors in China: Based on S-U-SBM model and panel regression model. J. Clean. Prod. 2018, 182, 545–552. [Google Scholar] [CrossRef]
- Zhou, Y.; Liang, D.P.; Xing, X.P. Environmental efficiency of industrial sectors in China: An improved weighted SBM model. Math. Comput. Model. 2013, 58, 990–999. [Google Scholar] [CrossRef]
- Han, H.B.; Zhang, X.Y. Exploring environmental efficiency and total factor productivity of cultivated land use in China. Sci. Total Environ. 2020, 726, 138434. [Google Scholar] [CrossRef]
- Cecchini, L.; Venanzi, S. Environmental efficiency analysis and estimation of CO2 abatement costs in dairy cattle farms in Umbria (Italy): A SBM-DEA model with undesirable output. J. Clean. Prod. 2018, 197, 895–907. [Google Scholar] [CrossRef]
- Wang, J.Y.; Wang, S.J.; Li, S.J.; Cai, Q.X.; Gao, S. Evaluating the energy-environment efficiency and its determinants in Guangdong using a slack-based measure with environmental undesirable outputs and panel data model. Sci. Total Environ. 2019, 663, 878–888. [Google Scholar] [CrossRef]
- Tone, K.; Tsutsui, M. An epsilon-based measure of efficiency in DEA-A third pole of technical efficiency. Eur. J. Oper. Res. 2010, 207, 1554–1563. [Google Scholar] [CrossRef]
- Yang, L.; Wang, K.L.; Geng, J.C. China’s regional ecological energy efficiency and energy saving and pollution abatement potentials: An empirical analysis using epsilon-based measure model. J. Clean. Prod. 2018, 194, 300–308. [Google Scholar] [CrossRef]
- Ren, Y.F.; Fang, C.L.; Li, G.D. Spatiotemporal characteristics and influential factors of eco-efficiency in Chinese prefecture-level cities: A spatial panel econometric analysis. J. Clean. Prod. 2020, 260, 120787. [Google Scholar] [CrossRef]
- Cheng, S.H.; Xie, J.H.; Xiao, D.; Zhang, Y. Measuring the Environmental Efficiency and Technology Gap of PM2.5 in China’s Ten City Groups: An Empirical Analysis Using the EBM Meta-Frontier Model. Int. J. Environ. Res. Public Health 2019, 61, 675. [Google Scholar] [CrossRef] [Green Version]
- Li, Y.; Chiu, Y.H.; Lin, T.Y. Energy and Environmental Efficiency in Different Chinese Regions. Sustainability 2019, 11, 1216. [Google Scholar] [CrossRef] [Green Version]
- Chung, Y.H.; Färe, R.; Grosskopf, S. Productivity and undesirable outputs: A directional distance function approach. J. Environ. Manag. 1997, 51, 229–240. [Google Scholar] [CrossRef] [Green Version]
- Piao, S.R.; Li, J.; Ting, C.J. Assessing regional environmental efficiency in China with distinguishing weak and strong disposability of undesirable outputs. J. Clean. Prod. 2019, 227, 748–759. [Google Scholar] [CrossRef]
- Sun, H.P.; Kporsu, A.K.; Taghizadeh-Hesary, F.; Edziah, B.K. Estimating environmental efficiency and convergence: 1980 to 2016. Energy 2020, 208, 118224. [Google Scholar] [CrossRef]
- Song, M.L.; Peng, J.; Wang, J.L.; Zhao, J.J. Environmental efficiency and economic growth of China: A Ray slack-based model analysis. Eur. J. Oper. Res. 2018, 269, 51–63. [Google Scholar] [CrossRef]
- Wang, K.L.; Wang, J.G.; Wang, J.M.; Ding, L.L.; Zhao, M.S.; Wang, Q.W. Investigating the spatiotemporal differences and influencing factors of green water use efficiency of Yangtze River Economic Belt in China. PLoS ONE 2020, 15, 0230963. [Google Scholar] [CrossRef] [PubMed]
- Avkiran, N.K.; Rowlands, T. How to better identify the true managerial performance: State of the art using DEA. Omega 2008, 36, 317–324. [Google Scholar] [CrossRef] [Green Version]
- Avkiran, N.K.; Tone, K.; Tsutsui, M. Bridging radial and non-radial measures of efficiency in DEA. Ann. Oper. Res. 2008, 164, 127–138. [Google Scholar] [CrossRef]
- Theil, T. Economics and Information Theory; North Holland Publishing Company: Amsterdam, The Netherlands, 1967. [Google Scholar]
- Bourguignon, F. Decomposable Income Inequality Measures. Econometrica 1979, 47, 901–920. [Google Scholar] [CrossRef] [Green Version]
- Cowell, F.A. On the Structure of Additive Inequality Measures. Rev. Econ. Stud. 1980, 47, 521–531. [Google Scholar] [CrossRef]
- Shorrocks, A.F. The Class of Additively Decomposable Inequality Measures. Econometrica 1980, 3, 613–625. [Google Scholar] [CrossRef] [Green Version]
- Yang, Q.; Liu, H.J. Regional Difference Decomposition and Influence Factors of China’s Carbon Dioxide Emissions. J. Quant. Tech. Econ. 2012, 29, 36–49. [Google Scholar]
- Malmquist, S. Index numbers and indifference surfaces. Trab. Estad. 1953, 4, 209–242. [Google Scholar] [CrossRef]
- Färe, R.; Grosskopf, S.; Lindgren, B.; Roos, P. Productivity changes in Swedish pharamacies 1980–1989: A non-parametric Malmquist approach. J. Product. Anal. 1992, 3, 85–101. [Google Scholar] [CrossRef]
- Shah, I.H.; Dong, L.; Park, H.-S. Tracking urban sustainability transition: An eco-efficiency analysis on eco-industrial development in Ulsan, Korea. J. Clean. Prod. 2020, 262, 121286. [Google Scholar] [CrossRef]
- Wang, S.H.; Zhao, D.Q.; Chen, H.X. Government corruption, resource misallocation, and ecological efficiency. Energy Econ. 2020, 85, 104573. [Google Scholar] [CrossRef]
- Kang, D.; Lee, D.H. Energy and environment efficiency of industry and its productivity effect. J. Clean. Prod. 2016, 135, 184–193. [Google Scholar] [CrossRef]
- Dong, J.; Cen, Y. Measurement of Highway Capital Stock in China: 1952–2009. J. Transp. Syst. Eng. Inf. Technol. 2011, 11, 20–23. [Google Scholar] [CrossRef]
- Gao, W.; Cheng, J.H.; Zhang, J. The influence of heterogeneous environmental regulation on the green development of mining industry. China Population. Resour. Environ. 2018, 28, 150–161. [Google Scholar]
- Sun, J.S.; Li, G.; Wang, Z.H. Technology heterogeneity and efficiency of China’s circular economic systems: A game meta-frontier DEA approach. Resour. Conserv. Recycl. 2019, 146, 337–347. [Google Scholar] [CrossRef]
- Feng, C.; Wang, M. The economy-wide energy efficiency in China’s regional building industry. Energy 2017, 141, 1869–1879. [Google Scholar] [CrossRef]
- Xing, Z.C.; Wang, J.G.; Zhang, J. Expansion of environmental impact assessment for eco-efficiency evaluation of China’s economic sectors: An economic input-output based frontier approach. Sci. Total Environ. 2018, 635, 284–293. [Google Scholar] [CrossRef]
- Sun, H.; Edziah, B.K.; Kporsu, A.K.; Sarkodie, S.A.; Taghizadeh-Hesary, F. Energy efficiency: The role of technological innovation and knowledge spillover. Technol. Forecast. Soc. Change 2021, 167, 120659. [Google Scholar] [CrossRef]


| Variables | Unit | Max | Min | Mean | Std. Dev |
|---|---|---|---|---|---|
| Labor input | 104 people | 108.42 | 0.02 | 24.19 | 24.25 |
| Capital input | Billion RMB | 4407.66 | 1.01 | 733.53 | 838.00 |
| Land use input | Km2 | 22,068.25 | 11.85 | 2471.90 | 2566.67 |
| Desirable output | Billion RMB | 5742.66 | 6.18 | 1149.83 | 1188.97 |
| Undesirable output | Km2 | 50,182,243.00 | 0.01 | 239,621.73 | 2,850,731.51 |
| Province | 2007 | 2008 | 2009 | 2010 | 2011 | 2012 | 2013 | 2014 | 2015 | 2016 | Mean |
|---|---|---|---|---|---|---|---|---|---|---|---|
| Beijing | 1.0000 | 0.6877 | 1.0000 | 0.7928 | 0.7913 | 1.0000 | 0.8106 | 0.4430 | 0.3838 | 0.4743 | 0.7383 |
| Tianjin | 1.0000 | 1.0000 | 1.0000 | 1.0000 | 1.0000 | 1.0000 | 1.0000 | 1.0000 | 1.0000 | 1.0000 | 1.0000 |
| Hebei | 0.7135 | 0.6953 | 0.5014 | 0.7914 | 1.0000 | 0.9163 | 0.9144 | 0.7971 | 0.7773 | 0.8075 | 0.7914 |
| Shanxi | 0.9308 | 0.7557 | 0.4115 | 0.5441 | 0.6190 | 0.6972 | 0.6377 | 0.1769 | 0.5550 | 0.6478 | 0.5976 |
| Inner Mongolia | 0.6341 | 0.3235 | 0.4908 | 0.5483 | 0.7742 | 0.7735 | 0.6575 | 0.4720 | 0.8580 | 1.0000 | 0.6532 |
| Liaoning | 0.5984 | 0.3625 | 0.4809 | 0.6463 | 0.8416 | 0.8720 | 0.8653 | 1.0000 | 0.6988 | 0.5256 | 0.6891 |
| Jilin | 0.5663 | 0.4698 | 0.4522 | 0.5493 | 0.5316 | 0.5818 | 0.5576 | 0.6308 | 0.6361 | 0.7323 | 0.5708 |
| Heilongjiang | 0.8395 | 0.6172 | 0.4161 | 0.4774 | 0.5045 | 0.5038 | 0.4844 | 0.5226 | 0.4611 | 0.4682 | 0.5295 |
| Shanghai | 1.0000 | 1.0000 | 1.0000 | 1.0000 | 1.0000 | 1.0000 | 1.0000 | 1.0000 | 1.0000 | 1.0000 | 1.0000 |
| Jiangsu | 0.5706 | 0.4964 | 0.4107 | 0.5136 | 0.5413 | 0.5755 | 0.5422 | 0.4351 | 0.6458 | 0.7122 | 0.5443 |
| Zhejiang | 0.8521 | 0.4506 | 0.5582 | 0.7363 | 0.8398 | 1.0000 | 1.0000 | 0.4557 | 1.0000 | 1.0000 | 0.7893 |
| Anhui | 0.5297 | 0.3765 | 0.4271 | 0.5541 | 0.6074 | 0.5463 | 0.5261 | 0.4522 | 0.6017 | 0.6516 | 0.5273 |
| Fujian | 0.8725 | 0.5660 | 0.5795 | 1.0000 | 1.0000 | 1.0000 | 1.0000 | 0.6479 | 1.0000 | 1.0000 | 0.8666 |
| Jiangxi | 0.5801 | 0.5661 | 0.4537 | 0.6166 | 0.7519 | 0.7874 | 0.7604 | 0.6748 | 0.7505 | 0.8483 | 0.6790 |
| Shandong | 1.0000 | 0.5888 | 0.5757 | 0.7138 | 0.7137 | 1.0000 | 0.6964 | 0.5559 | 0.8164 | 1.0000 | 0.7661 |
| Henan | 1.0000 | 0.6653 | 0.5212 | 0.6938 | 0.7491 | 0.7923 | 0.8116 | 0.5373 | 0.7872 | 0.7699 | 0.7328 |
| Hubei | 0.9374 | 0.4099 | 0.4123 | 0.5333 | 0.6942 | 0.8457 | 0.8765 | 0.5303 | 0.9118 | 0.9651 | 0.7116 |
| Hunan | 0.6794 | 0.4520 | 0.5117 | 0.6548 | 1.0000 | 1.0000 | 1.0000 | 0.5279 | 1.0000 | 1.0000 | 0.7826 |
| Guangdong | 1.0000 | 0.6972 | 0.7172 | 1.0000 | 0.7264 | 1.0000 | 1.0000 | 1.0000 | 0.8608 | 1.0000 | 0.9002 |
| Guangxi | 0.6742 | 0.4234 | 0.5008 | 0.5982 | 0.8244 | 1.0000 | 1.0000 | 1.0000 | 1.0000 | 1.0000 | 0.8021 |
| Hainan | 0.5145 | 0.5841 | 0.2843 | 0.4057 | 0.4886 | 0.5062 | 0.4787 | 0.4644 | 0.4348 | 0.4813 | 0.4643 |
| Chongqing | 0.9688 | 1.0000 | 0.4001 | 0.5396 | 0.5605 | 0.6392 | 0.5151 | 0.1540 | 0.4980 | 0.5199 | 0.5795 |
| Sichuan | 0.8950 | 0.4739 | 0.5060 | 0.6842 | 0.9044 | 0.9157 | 0.8442 | 0.6714 | 1.0000 | 1.0000 | 0.7895 |
| Guizhou | 0.5987 | 0.2837 | 0.2879 | 0.5224 | 0.6376 | 0.7078 | 0.8021 | 0.1784 | 0.9289 | 1.0000 | 0.5948 |
| Yunnan | 0.6983 | 0.3306 | 0.3100 | 0.4640 | 0.5479 | 0.5418 | 0.5999 | 0.4523 | 0.5657 | 0.6189 | 0.5130 |
| Tibet | 0.4632 | 0.1515 | 0.1370 | 0.2328 | 0.3477 | 0.4058 | 0.3768 | 0.3830 | 0.4061 | 0.4992 | 0.3403 |
| Shaanxi | 0.7078 | 0.5129 | 0.5101 | 0.5993 | 0.5252 | 0.5379 | 0.6626 | 0.4951 | 0.5649 | 0.7881 | 0.5904 |
| Gansu | 0.5318 | 0.3735 | 0.3460 | 0.4352 | 0.5029 | 0.5014 | 0.5091 | 0.5001 | 0.5527 | 0.6778 | 0.4930 |
| Qinghai | 0.5013 | 0.2491 | 0.1996 | 0.3727 | 0.4678 | 0.4829 | 0.4999 | 0.4448 | 0.4548 | 0.4879 | 0.4161 |
| Ningxia | 0.5555 | 0.4636 | 0.4407 | 0.4894 | 0.4953 | 0.4807 | 0.4930 | 0.0890 | 0.5269 | 0.6512 | 0.4685 |
| Xinjiang | 0.6493 | 0.4550 | 0.4230 | 0.4984 | 0.5085 | 0.5027 | 0.4819 | 0.5095 | 0.4674 | 0.5401 | 0.5036 |
| East area | 0.8523 | 0.6766 | 0.6627 | 0.7954 | 0.8101 | 0.8998 | 0.8442 | 0.6799 | 0.7919 | 0.8475 | 0.7860 |
| Northeast area | 0.6681 | 0.4832 | 0.4497 | 0.5576 | 0.6259 | 0.6525 | 0.6358 | 0.7178 | 0.5987 | 0.5754 | 0.5965 |
| Central area | 0.7762 | 0.5376 | 0.4563 | 0.5994 | 0.7369 | 0.7781 | 0.7687 | 0.4832 | 0.7677 | 0.8138 | 0.6718 |
| West area | 0.6565 | 0.4201 | 0.3793 | 0.4987 | 0.5914 | 0.6241 | 0.6202 | 0.4458 | 0.6520 | 0.7319 | 0.5620 |
| Overall China | 0.7440 | 0.5317 | 0.4924 | 0.6196 | 0.6934 | 0.7456 | 0.7227 | 0.5549 | 0.7143 | 0.7699 | 0.6589 |
| Year | OGTFEE | BGTFEE | WGTFEE | East Area | Northeast Area | Central Area | West Area | ||
|---|---|---|---|---|---|---|---|---|---|
| Value | Contribution Rate | Value | Contribution Rate | Contribution Rate | Contribution Rate | Contribution Rate | Contribution Rate | ||
| 2007 | 0.0309 | 0.0068 | 21.89% | 0.0241 | 78.11% | 28.62% | 4.53% | 19.28% | 25.68% |
| 2008 | 0.0737 | 0.0206 | 28.03% | 0.0530 | 71.97% | 18.67% | 2.78% | 8.63% | 41.90% |
| 2009 | 0.0772 | 0.0294 | 38.08% | 0.0478 | 61.92% | 39.01% | 0.20% | 1.11% | 21.60% |
| 2010 | 0.0451 | 0.0204 | 45.25% | 0.0247 | 54.75% | 32.04% | 1.48% | 2.07% | 19.15% |
| 2011 | 0.0365 | 0.0096 | 26.28% | 0.0269 | 73.72% | 27.91% | 6.83% | 8.39% | 30.59% |
| 2012 | 0.0402 | 0.0129 | 32.03% | 0.0273 | 67.97% | 22.31% | 6.00% | 8.07% | 31.59% |
| 2013 | 0.0398 | 0.0095 | 23.94% | 0.0303 | 76.06% | 27.02% | 6.94% | 10.67% | 31.44% |
| 2014 | 0.1035 | 0.0212 | 20.44% | 0.0824 | 79.56% | 22.33% | 4.73% | 9.58% | 42.92% |
| 2015 | 0.0449 | 0.0052 | 11.64% | 0.0397 | 88.36% | 34.73% | 2.64% | 9.79% | 41.20% |
| 2016 | 0.0363 | 0.0058 | 15.88% | 0.0305 | 84.12% | 32.54% | 3.76% | 8.15% | 39.68% |
| Mean | 0.0528 | 0.0141 | 26.35% | 0.0387 | 73.65% | 28.52% | 3.99% | 8.57% | 32.57% |
Publisher’s Note: MDPI stays neutral with regard to jurisdictional claims in published maps and institutional affiliations. |
© 2022 by the authors. Licensee MDPI, Basel, Switzerland. This article is an open access article distributed under the terms and conditions of the Creative Commons Attribution (CC BY) license (https://creativecommons.org/licenses/by/4.0/).
Share and Cite
Wang, X.; Wang, S.; Xia, Y. Evaluation and Dynamic Evolution of the Total Factor Environmental Efficiency in China’s Mining Industry. Energies 2022, 15, 1232. https://doi.org/10.3390/en15031232
Wang X, Wang S, Xia Y. Evaluation and Dynamic Evolution of the Total Factor Environmental Efficiency in China’s Mining Industry. Energies. 2022; 15(3):1232. https://doi.org/10.3390/en15031232
Chicago/Turabian StyleWang, Xiangqian, Shudong Wang, and Yongqiu Xia. 2022. "Evaluation and Dynamic Evolution of the Total Factor Environmental Efficiency in China’s Mining Industry" Energies 15, no. 3: 1232. https://doi.org/10.3390/en15031232
APA StyleWang, X., Wang, S., & Xia, Y. (2022). Evaluation and Dynamic Evolution of the Total Factor Environmental Efficiency in China’s Mining Industry. Energies, 15(3), 1232. https://doi.org/10.3390/en15031232