1. Introduction
China’s economy has maintained rapid growth and made remarkable economic achievements, but China has also paid a heavy price of destroying the ecological environment and wasting resources. According to the 2020 Environmental Performance Index, China ranks 120th with an environmental performance index of 37.3, far behind the United Kingdom (4th), France (5th), Japan (12th), the United States (24th) and other Western developed countries, and the gap in environmental protection is prominent. Green innovation activities can reduce environmental pollution and gain long-term competitive advantages, achieving a win–win situation for environmental protection and economic development [
1,
2,
3]. Accordingly, China has been deeply aware of the serious environmental problems and has proposed the concept of ecological governance and green development that “Clear waters and green mountains are as good as mountains of gold and silver”, to strengthen the reform of environmental policies, actively implement the green economic transformation strategy, take various measures to manage the green ecological environment, and accelerate the pace of driving enterprises to carry out green innovation. However, although China has successively promulgated many environmental protection laws and regulations, forcing enterprises to meet environmental protection requirements in the production process, there are still quite a few enterprises that have failed to make corresponding adjustments in their business decisions in time. Environmental violations occur frequently and participation in green innovation is low. In view of the slow greening pace of many enterprises’ economic activities, a hot issue in current research is how to effectively drive enterprises to carry out green innovation and enhance their green competitiveness.
The knowledge spillovers and environmental cost spillovers of green innovation often leads to market failures. Most existing studies focus on the driving factors of green innovation from the perspective of national policies based on institutional theory and stakeholder theory. Scholars who support the Porter hypothesis believe that national policies such as environmental regulation and government subsidies can overcome enterprise inertia, force enterprises to carry out green innovation activities, and improve green innovation performance [
4,
5,
6,
7,
8,
9,
10]. For example, Berrone et al. found that government regulation is conducive to improving the green innovation level of enterprises [
5]. Chakraborty et al. found that environmental regulation can effectively promote innovation input and output and promote the green transformation of enterprises [
10]. However, the cost–benefit of environmental governance is asymmetric, and enterprises often passively cater to the government and implement short-sighted environmental protection investment strategies [
11]. Scholars who deny the Porter hypothesis believe that environmental regulation and government subsidies will change the allocation of enterprise resources, increase the cost of enterprise system compliance and pollution control, squeeze out the resource input of green innovation, and reduce the enthusiasm for green innovation [
12,
13,
14,
15,
16,
17,
18]. It is not difficult to discover that there is considerable controversy over the impact of environmental regulations and government subsidies on green innovation. Therefore, enterprises should incorporate environmental issues into strategic decision making, rather than only passively catering to environmental policies [
19].
In recent years, many scholars have turned to exploring the impact of internal factors, such as organizational conditions, executive characteristics, financial performance, and corporate governance on green innovation based on resource-based theory and high-order theory [
20,
21,
22,
23]. Green innovation has the dual characteristics of knowledge spillover and environmental cost spillover, which will force enterprises to face more serious financing problems and agency conflicts [
24]. Based on the theory of information asymmetry, these two resulting problems seriously restrict the green innovation and development of enterprises. Although government subsidies are an effective mechanism to promote green innovation, because of the information asymmetry between the government and enterprises, the opportunistic motivation of management often makes green innovation a tool for obtaining government subsidies and chasing private interests [
25]. In order to meet the environmental standards stipulated by the government, enterprises only purchase pollution control equipment or start from the end of the treatment, and fail to allocate resources to green innovation projects, which is not conducive to the realization of the strategic goal of enterprise sustainable development [
26,
27]. Wu and Hu pointed out that the optimal allocation of resources is conducive to enterprise green innovation [
28]. As a systematic internal governance mechanism, internal control must compensate for the incompleteness of the company’s contract, and it has the capabilities of resource allocation and risk control, which can effectively reduce information asymmetry, alleviate financing constraints and agency conflicts, and then affect the choice and implementation of enterprise innovation strategy [
29,
30], so as to reasonably ensure the achievement of enterprise strategic objectives. In the related research on internal control and enterprise innovation, scholars have also generally agreed with the hypothesis of “reasonable management and control” [
31,
32,
33,
34,
35]. However, few studies have focused on the driving factors of green innovation decision making and risk control from the perspective of internal control implementation.
Based on the internal control system environment during the transition period of China’s market economy, this paper expands the internal influencing factors of enterprise green innovation to the level of green innovation implementation management and risk control, and discusses the impact mechanism of internal control on enterprise green innovation, which not only enriches the theoretical research on the preconditions of enterprise green innovation and the economic consequences of internal control, but also provides empirical evidence that China’s mandatory implementation of the internal control system can promote the sustainable development of enterprises. With China’s situation and from the perspective of micro-enterprise characteristics, this paper combines macro-factors and micro-enterprise behavior to deeply analyze the differences in the impact of internal control on green innovation under different situations, revealing that the impact of internal control on green innovation has state-dependent characteristics, and provides more reliable suggestions for different enterprises. The rest of the paper is arranged as follows. The second part puts forward the benchmark research hypothesis. The third part introduces the data source, index selection and model construction. The fourth part empirically analyzes the impact of internal control on green innovation. The fifth part tests the path mechanism of internal control affecting green innovation. The sixth part further tests it under the condition of heterogeneity. The seventh part includes the research conclusions and suggestions.
2. Theoretical Analysis and Research Hypothesis
Green innovation is not only riskier and more uncertain than general innovation activities, but its dual attributes also lead to dual externalities, which often causes the green innovation activities of enterprises to be abandoned or suspended [
36]. Effective internal control is based on the strategic objectives of enterprises, organically integrates the five elements of internal control into the process of enterprise green innovation, realizes the standardization and institutionalization of green innovation, and promotes the green innovation development of enterprises.
Firstly, a high level of internal control can optimize resource allocation in the enterprise green innovation process. According to the resource-based theory, it is difficult for enterprises to effectively launch green innovation activities by relying only on their own resource accumulation. Improving the green innovation level requires breaking through organizational boundaries, efficiently reconstructing internal and external resources, and optimizing resource allocation and supply. Effective control activities can ensure that all departments within the enterprise perform their respective duties to the greatest extent; form a reasonable check and balance mechanism; guarantee appropriate allocation of rights and responsibilities, and scientific activity process arrangements; identify promptly the operational errors within the company [
37], as well as unclear definitions of responsibilities, buck-passing and other problems; and effectively eliminate the waste and reduce the resource and cost consumption in the process of green innovation. This improves the rational allocation of existing resources, ensures the implementation and refinement of enterprise green innovation projects, and improves the implementation efficiency of green innovation.
Secondly, a high level of internal control can effectively reduce the risk in green innovation. Internal control can minimize the risks in implementing innovation activities through a series of control measures and guarantee the implementation of green innovation activities [
38,
39]. On the one hand, a good internal control environment helps enterprises set goals, ensures the continuity and repeatability of risk assessment activities, effectively identifies potential risks affecting the realization of innovation goals, and determines the risk tolerance consistent with innovation [
40], providing a favorable environment for green innovation. On the other hand, effective risk assessment cannot only identify risks in the implementation of an enterprise green innovation strategy by testing the rationality and effectiveness of various management systems and business processes, but also weigh the existing and potential risks in innovation activities and formulate differentiated risk response strategies in combination with the long-term development strategy, improving the ability to cope with green innovation risks.
Thirdly, a high level of internal control can effectively alleviate agency conflicts in the green innovation process. Internal control can provide effective incentives and supervision for principals and agents, discourage the self-interested behaviors of management, and improve the rationality and efficiency of enterprise green innovation. On the one hand, a good control environment can support an effective check and balance mechanism to restrain agency behavior in the green innovation process according to the status of the strategic development of the enterprise, and apply appropriate incentive policies to encourage the management and employees to participate in green innovation activities, so as to create a good institutional environment and cultural atmosphere. On the other hand, in the absence of effective supervision, managers may avoid investing in risky projects in order to enjoy a comfortable life [
41], and effective internal supervision can ensure that enterprise activities are compatible with enterprise risk-taking capabilities, allowing managers’ behaviors to comply with national policies.
Finally, a high level of internal control can effectively alleviate the financing constraints in the green innovation process. Green innovation activities under the influence of double spillovers are more restricted by financing constraints than general innovation activities [
42]. Green financial instruments can promote green innovation, and external financing is better than internal financing in promoting innovation [
43,
44]. When there is a lack of R&D funds, enterprises often obtain external financing through bank loans, bond financing, equity financing, venture capital and other channels. Efficient information and communication can break the information asymmetry between enterprises and financial institutions, enable financial institutions and other stakeholders to accurately evaluate the green innovation activities of enterprises, alleviate the financing constraints, and improve the external financing capabilities of enterprises. This will provide sufficient capital flow to enterprises for launching green innovation activities and achieving sustainable green innovation.
Thus, as an organic whole, the five elements of internal control are interrelated and blend with each other, actively conveying the green innovation program, jointly dealing with the green innovation risks, alleviating the financing pressure and agency conflicts, urging enterprises to effectively implement green innovation and achieve green transformation. Based on this, the following hypothesis is proposed:
Hypothesis 1 (H1). Under the same conditions, internal control can promote green innovation.
3. Research Design
3.1. Data Sources and Sample Processing
In 2012, China officially listed the development of an ecological civilization as the overall basis for national construction, and green development was acknowledged at the national level. Therefore, we took Chinese A-share listed companies from 2012 to 2020 as samples and determined all variables that should be present, excluding financial, ST- and *ST- listed companies (companies with abnormal financial status or other conditions). Our financial data came from the China Stock Market Accounting Research (CSMAR) database, the data on the number of enterprise green patent applications came from the China Innovation Patent Research Database (CIRD), the internal control data came from the Dibo database (DIB), and other data came from the WIND Economic database (WIND). The main continuous variables in this paper were Winsorized by 1% up and down, and 23,215 sample data of 3430 listed companies were finally obtained.
3.2. Variable Definition
(1) Explained variables. The explained variable is internal control (ic), and the DIB “internal control index” was selected as the measurement index. This index comprehensively evaluates all elements of the enterprise’s internal control, whether independent directors and the board of supervisors express their opinions, and whether the accounting firm issues evaluation reports, etc., that comprehensively and objectively reflect the quality of internal control.
(2) Explanatory variables. The explanatory variable is green innovation (
pat). Existing studies mainly measure enterprise green innovation from the perspective of input and output, but green innovation activities take time from initial input to final output, and there are high risks and uncertainties in the activity process. So, if measured from the perspective of green innovation input, it is possible to overestimate the enterprise green innovation [
45]. Therefore, referring to Qi Shaozhou [
46], from the perspective of green innovation output, the number of enterprise green patents was selected as the proxy variable of enterprise green innovation level.
(3) Intermediary variables. The intermediary variables are enterprise risk (
fr), agency cost (
mcost), financing constraints (
sa) and green innovation investment rationality (
es). Referring to the enterprise risk measurement formula proposed by Altman [
47]:
fr = 3.3
a1 + 1.4
a2 + 1.2
a3 + 0.999
a4 + 0.6
a5, where
a1 is the ratio of earnings before interest and tax (EBIT) to total assets;
a2 is the ratio of retained earnings to total assets;
a3 is the ratio of the listed company’s working capital to total assets;
a4 is the ratio of operating income to total assets;
a5 is the ratio of the sum of the total market value of tradable shares and the total net assets of non-tradable shares to the total liabilities. Referring to Ang et al. [
48], the management expense ratio (
mcost) was used to measure agency cost, that is, the larger the proportion of management expense to operating revenue, the higher the agency cost. Adopting the research method of Cui Huayun et al. [
42], the ratio of interest expense to total debt (
sa) was used as the measurement index of enterprise financing constraints; the difference between the actual innovation scale and the expected innovation scale was used to measure the rationality of green innovation investment. If the actual innovation investment is greater than the expected investment, it indicates that the innovation investment is excessive; otherwise, it indicates that the innovation investment is insufficient. Both excessive and insufficient innovation investment are ineffective investment, that is, the innovation investment is unreasonable. For regression by industry and year, when the residual in Model (1) is in the lowest or highest quarter interval, it is inefficient investment,
es = 1; and when it is in the middle two quantile intervals, it is effective investment, that is, reasonable investment,
es = 0. Referring to the research of Xiao Renqiao [
49], the traditional R&D investment replaces the green R&D investment. This is because it is hard to completely separate green innovation investment from traditional innovation investment. At present, there are no statistical data on green innovation investment, and many traditional innovation projects can effectively improve economic and environmental benefits at the same time.
(4) Control variables. To control other factors affecting internal control, we selected the following control variables: property right nature (
state), establishment time (
age), equity concentration (
top), cash holding ratio (
cash), solvency (
debtr), net cash flow (
cf), executive incentives (
con), capital expenditures (
expend), profitability (
roa), the Big Four (
icq), and the percentage of independent directors (
board). The specific definitions of variables are shown in
Table 1.
3.3. Model Construction
Many companies do not engage in green innovation activities, and the number of green innovation applications is 0. Therefore, the probability distribution of the explained variables here consisted of two parts: continuous distribution and discrete point distribution. The following model was used to demonstrate whether internal control promotes green innovation:
where
ic is the proxy variable of internal control,
control is the control variable (the definitions of variables are shown in
Table 1), and
ε is a random disturbance term.
According to the above, reducing enterprise risks and agency conflicts, alleviating financing constraints, and improving the rationality of innovation investment are the path mechanisms of internal control that affect green innovation. We constructed an intermediary effect model on the basis of Model (1) to further investigate the path mechanism of internal control affecting green innovation.
where
mediator is the intermediary variable, which respectively represents enterprise risk (
fr), agency conflict (
mcost), financing constraints (
sa), and rationality of green innovation investment (
es).
Drawing on the investment prediction model of Richardson [
50] and the definition of innovation inefficient investment by Liu eping [
51], Model (1) was adopted to calculate the expected value of innovation investment, and the residual of the model was used to estimate the rationality of green innovation investment (
es):
where
rd is innovation investment, that is, the logarithm of innovation investment plus 1;
size is the enterprise scale, that is, total assets plus 1 and then take the logarithm;
dual is the combination of two rights, if the chairman and the general manager are the same person,
dual = 1, otherwise,
dual = 0;
top is the shareholding percentage of the largest shareholder, which is used below to represent executive power; and
growth is the growth percentage of operating income. (See
Table 1 for definition of other variables.)
Strategic management research has found that enterprise economic behavior depends on the combined action of internal and external factors, and it exhibits different forms under the action of different situational factors. Furthermore, we examined the impact of heterogeneity factors on the research results from the perspectives of enterprise characteristics, relationship resources, executive power, and government support, and constructed the following model:
where
adjust is the adjustment variable, which respectively represents enterprise characteristics (
state,
size), relationship resources (
rel1,
rel2), executive power (
top) and government subsidies (
bt). Other variables are the same as those in Model (1). Relationship resources include government–enterprise relationship resources and business relationship resources. Government–enterprise relationship resources (
rel1) represent the proportion of executives with government background of the total executives [
52]; business partnership resources (
rel2) represent the proportion of executives with part-time behavior of the total executives [
53]. Government subsidies (
bt) represent the logarithm of the total government subsidies in the current period.
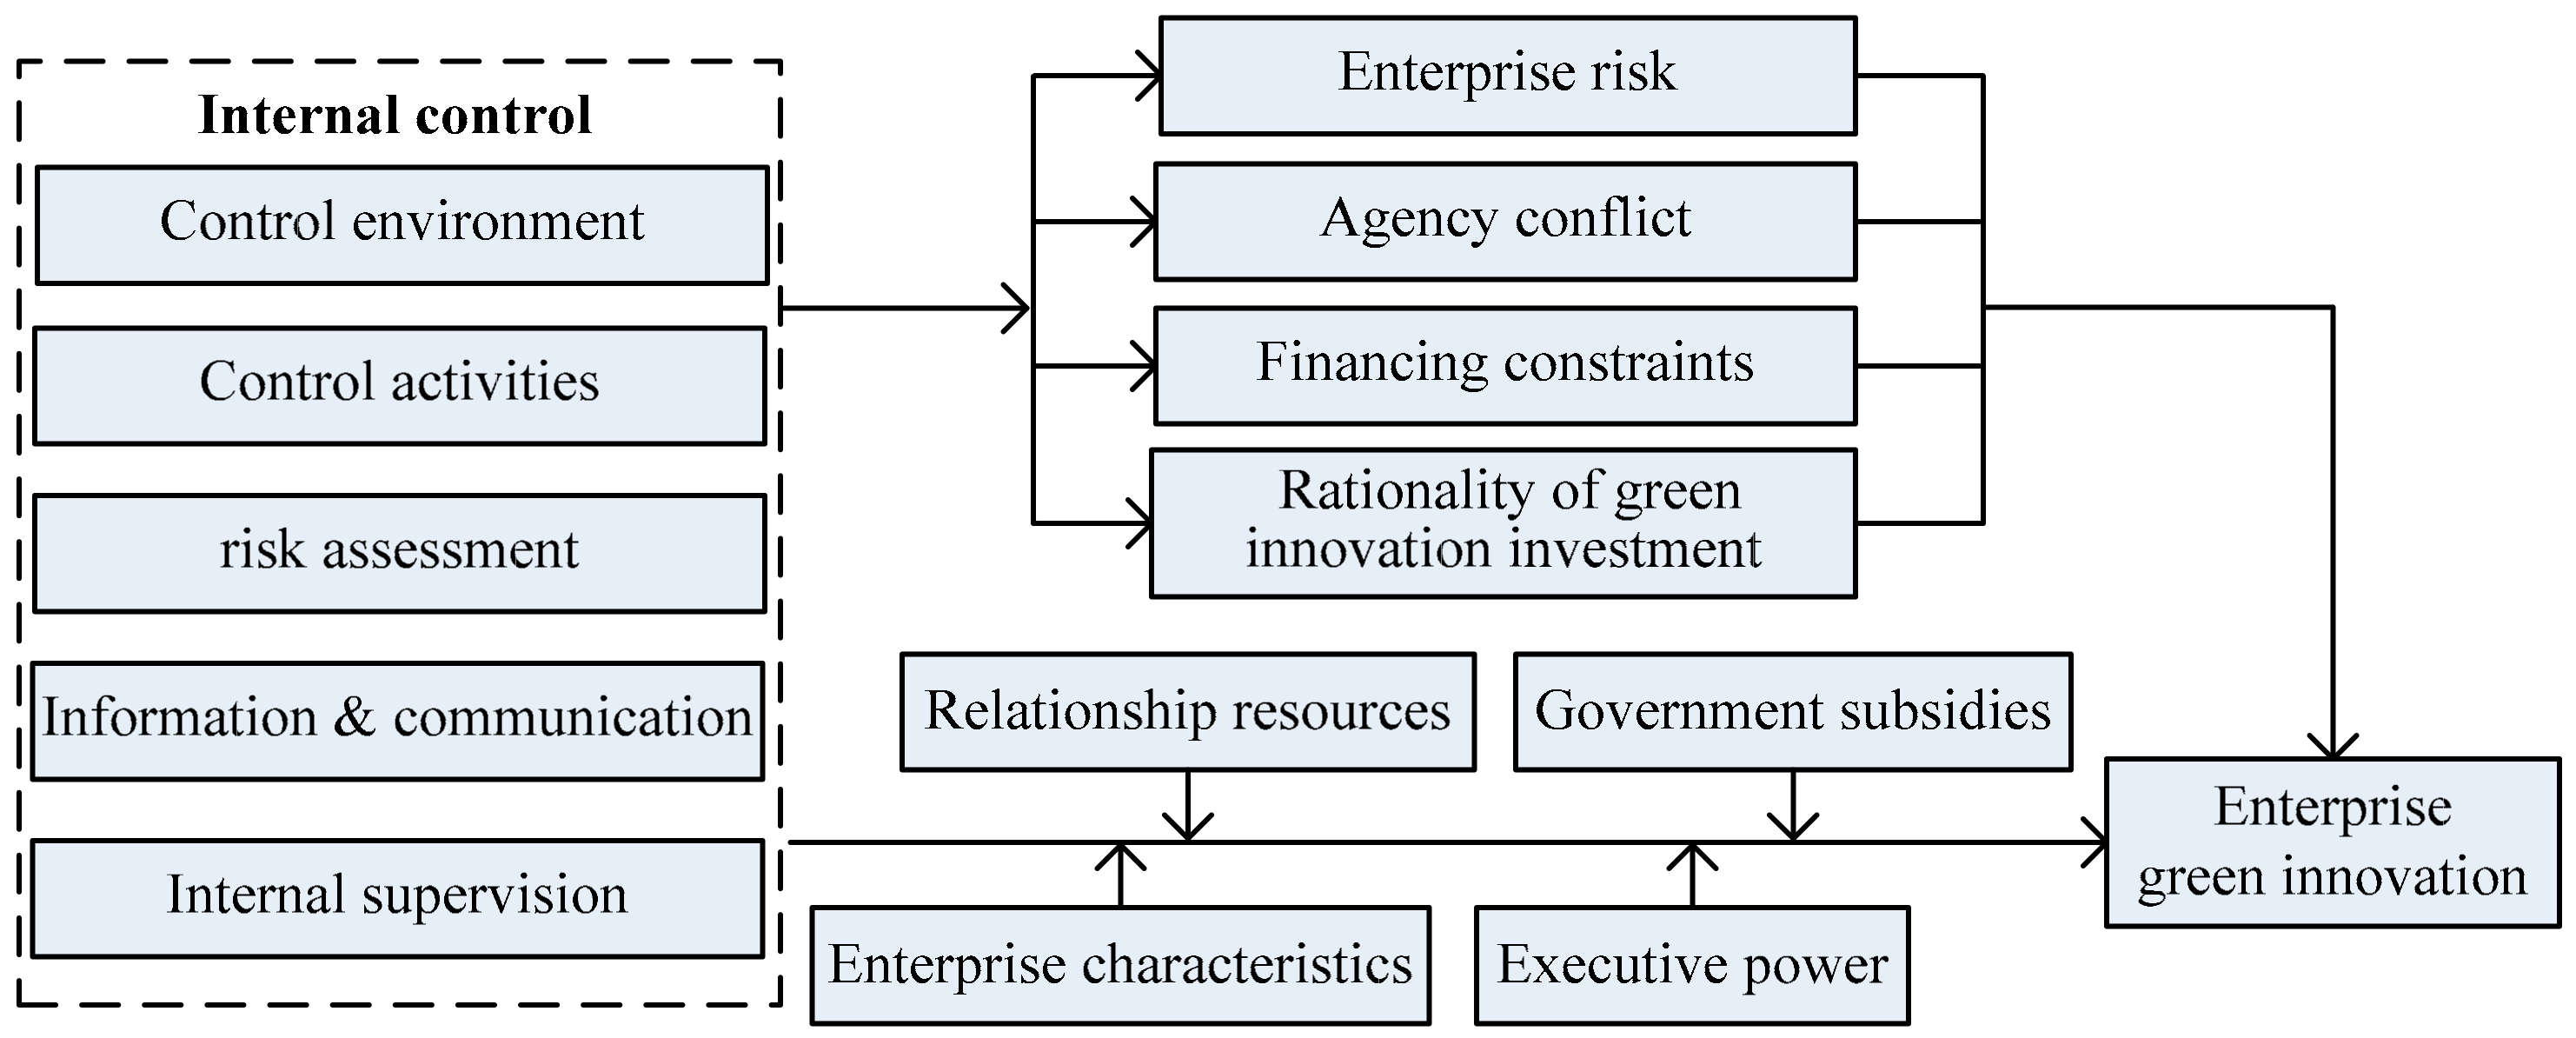
Based on the above research assumptions and models, the research framework diagram was formed and is shown in
Figure 1.
4. Empirical Test
4.1. Descriptive Statistical Analysis
According to
Table 2, the mean of internal control (
ic) was 6.232, the median was 6.497, and the median was slightly higher than the mean, indicating that the internal control quality of most Chinese listed companies has improved. However, the minimum, maximum, and standard deviation of internal control (
ic) were 0, 6.792, and 1.237, respectively, indicating that the quality of internal control among companies is relatively different. The median (0.693) of green innovation (
pat) was smaller than the mean (0.969), indicating that the general level of green innovation of Chinese listed companies is fairly low. The standard deviation of green innovation was 1.222, indicating that the level of green innovation varies greatly among companies. The variance inflation factor test showed that the maximum value of VIF was 1.38, which was less than 10, and the average value of VIF was 1.18, indicating that there was no serious multicollinearity.
4.2. Regression Result Analysis
(1) Green innovation and internal control. The regression results of green innovation and internal control are shown in
Table 3. In column (1), the regression coefficient between internal control
(ic) and green innovation (
pat) was 0.045, and the relationship between the two was significantly positive at the 1% level, supporting Hypothesis 1, indicating that the higher the internal control quality, the higher the green innovation level of listed companies. Profitability (
roa), solvency (
debtr) and executive incentives (
con) were all highly correlated with internal control (
ic), and the estimated results of control variables were basically in line with expectations.
In 2014, China issued the “Compilation Rules for Information Disclosure by Companies Offering Securities to the Public, No. 21”, requiring all listed companies on the main board to disclose internal control audit reports. Accordingly, we divided the samples into two- groups: the non-mandatory disclosure group (2012–2014) and the mandatory disclosure group (2015–2020), to further explore the impact of internal control on green innovation. In column (2), the relationship between ic and pat in the non-mandatory disclosure group was not significant, indicating that internal control at this stage cannot significantly improve green innovation. In column (3), the regression coefficient between ic and pat in the mandatory group was 0.050, which was significant at the 1% level, indicating that the internal control in the mandatory disclosure stage can significantly improve green innovation. This is because, in the non-mandatory disclosure stage, the management will make selective disclosure for their own interests, the reliability of performance prediction is low, and the information transmission and supervision functions of internal control cannot be effectively exerted; while in the mandatory disclosure stage, the reliability of performance prediction is high, and the management will try to reduce the cost of implementing its own internal control on the premise of meeting the mandatory disclosure requirements as much as possible, thereby reducing the crowding out of investment resources.
(2) Green innovation and five elements of internal control. We further tested the impact of the five elements on green innovation, in order to determine the specific role of each element in green innovation. Since the 2020 index of the five elements has not been updated, the sample period for this part is 2012–2019. The test results are shown in
Table 4.
ic1,
ic2,
ic3,
ic4 and
ic5 respectively represent the five elements, namely, control environment, risk assessment, control activities, information & communication, and internal supervision. From the test results, we can see that the relationship between green innovation (
pat) and control environment (
ic1) was not significant, but the relationship between green innovation and the other four elements was significantly positively correlated. The impacts of the five elements of internal control on green innovation are different, which does not mean that the control environment does not play any role in green innovation. The internal control activities and processes beyond the control environment cannot be implemented. In the actual implementation process, internal control is an operating system, and the realization of all control objectives is the result of the joint action of the control environment and other elements.
4.3. Robustness Test
(1) Consider substitute variables for the main variables. Choose other measures of internal control. The whole sample was divided according to the mean of the internal control index. For sample companies whose internal control index is higher than the mean, the value of internal control is 1; otherwise, the value is 0. The number of green invention patent applications was selected as the measurement index of green technology innovation, and Model (2) was used for the robustness test.
(2) Change the handling of extreme values. To avoid the influence of extreme values, we further strengthened the processing of outliers, and Winsorized the upper and lower 2% quantiles for all continuous variables.
(3) Change the model settings. The number of green patent applications of many sample enterprises was 0, and the robustness test was carried out again using the Tobit model.
After the above endogeneity test and robustness test, the main results remained robust and reliable.
5. Mechanism Test
(1) Based on enterprise risk. Internal control helps encourage and motivate the management to take effective measures to prevent or deal with enterprise risks, so as to improve the green innovation level.
Table 5 shows the specific path test results. The regression coefficient between internal control (
ic) and enterprise risk (
fr) in column (2) was −0.185, which was significant at the 1% level, indicating that internal control can effectively reduce enterprise risk. The regression coefficient between green innovation (
pat) and enterprise risk (
fr) in column (3) was −0.013, which was significant at the 1% level, indicating that enterprise risk played a partial intermediary role in the relationship between internal control and green innovation, that is, reducing the enterprise risk level is one of the paths for internal control to improve green innovation.
After calculating the size and strength of the intermediary effect, we found that the marginal size of the indirect impact of internal control on green innovation was 0.0024 (0.185 × 0.013), that is, for every additional unit of internal control, the enterprise risk of 0.185 units will be reduced, and then, the green innovation of 0.0024 units will be increased. The strength of the intermediary effect was 5.54% (0.185 × 0.013/(0.041 + 0.185 × 0.013)), that is, 5.54% of the promotion effect of internal control on enterprise green innovation was realized by reducing the enterprise risk.
(2) Based on agent conflict. The agency problem of managers and controlling shareholders directly affects enterprise innovation. Effectively dealing with the two kinds of agency problems is the key for internal control to act on enterprise green innovation. The regression coefficient between internal control (
ic) and agency cost (
mcost) in column (4) of
Table 5 was −0.005, which was significant at the 1% level, indicating that internal control can alleviate agency conflict. The regression coefficient between green innovation (
pat) and agency cost (
mcost) in column (5) was −0.466, which was significant at the 1% level, indicating that agency problems played a partial intermediary role in the relationship between internal control and green innovation, that is, internal control helps to effectively supervise and balance managers and controlling shareholders, alleviate agency conflicts and reduce agency costs, so as to improve the green innovation level.
After calculating the size and strength of the intermediary effect, we found that the marginal size of the indirect impact of internal control on green innovation was 0.0023 (0.005 × 0.466), that is, for every additional unit of internal control, the agency conflict of 0.005 units will be reduced, and then, the green innovation of 0.0023 units will be increased. The strength of the intermediary effect was 5.38% (0.005 × 0.466/(0.041 + 0.005 × 0.466)), that is, 5.38% of the promotion effect of internal control on enterprise green innovation was realized by reducing agency conflicts.
(3) Based on financing constraints.
Table 6 shows the specific path test results. The regression coefficient between internal control (
ic) and financing constraints (
sa) in column (2) was –0.001, which was significant at the 1% level, indicating that internal control can alleviate financing constraints. The regression coefficient between green innovation (
pat) and financing constraints (
sa) in column (3) was −1.193, which was significantly negative, indicating that financing constraints played a partial intermediary role in the relationship between internal control and green innovation, that is, alleviating financing constraints is an important path for internal control to affect enterprise green innovation.
After calculating the size and strength of the intermediary effect, we found that the marginal size of the indirect impact of internal control on green innovation was 0.0012 (0.001 × 1.193), that is, for every additional unit of internal control, the financing constraints of 0.001 units will be reduced, and then, the green innovation of 0.0012 units will be increased. The strength of the intermediary effect was 2.7% (0.001 × 1.193/(0.043 + 0.001 × 1.193)), that is, 2.7% of the promotion effect of internal control on enterprise green innovation was realized by reducing financing constraints.
(4) Based on the rationality of green innovation investment. The regression coefficients between internal control (
ic) and the rationality of green innovation investment (
es) in column (4) of
Table 6 was 0.010, which was significantly positive, indicating that internal control can effectively improve the rationality of green innovation investment. The regression coefficient between green innovation (
pat) and the rationality of green innovation investment (
es) in column (5) was 0.110, which was significant at the 1% level, indicating that improving the rationality of green innovation investment played a partial intermediary role in the relationship between internal control and green innovation.
After calculating the size and strength of the intermediary effect, we found that the marginal size of the indirect impact of internal control on green innovation was 0.0011 (0.010 × 0.110), that is, for every additional unit of internal control, the rationality of green innovation investment of 0.01 units will be improved, and then, the green innovation of 0.0011 units will be increased. The strength of the intermediary effect was 2.34% (0.010 × 0.110/(0.046 + 0.010 × 0.110)), that is, 2.34% of the promotion effect of internal control on enterprise green innovation was realized by improving the rationality of green innovation investment.
6. Heterogeneity Test
(1) Enterprise characteristics. The property right nature (
state) and enterprise scale (
size) were selected as the main factors of enterprise characteristics. Because of the inherent advantages, state-owned enterprises are more likely to obtain government subsidies and tax incentives, and their survival and competitive pressures are relatively small, which will weaken their emphasis on internal control. Private enterprises are at a disadvantage in resources, have a more urgent need to control risks, and will actively play the guiding and restraining role of internal control. Under the guidance of the current carbon neutrality strategic goal, the development of green innovation has become an important indicator for evaluating administrative officials in China, and the executives of state-owned enterprises have the dual status of “quasi-officials & entrepreneurs”, which will encourage them to pay more attention to the requirements of administrative promotion [
54,
55]. Therefore, even without effective supervision by internal control, the executives of state-owned enterprises will actively launch green innovation activities to accumulate capital for their own administrative promotion. The regulatory effect of property right nature is shown in
Figure 2. In the grouping test results in columns (2) and (3) of
Table 7, we can see that the correlation coefficient between internal control (
ic) and green innovation (
pat) of private enterprises was greater than that of state-owned enterprises, and both types of enterprises were significantly positive. In column (1), the correlation coefficient between
ic×
state and green innovation (
pat) was −0.023, which was significantly negative, indicating that the roles of property right nature and internal control in promoting green innovation are mutually competitive and alternative.
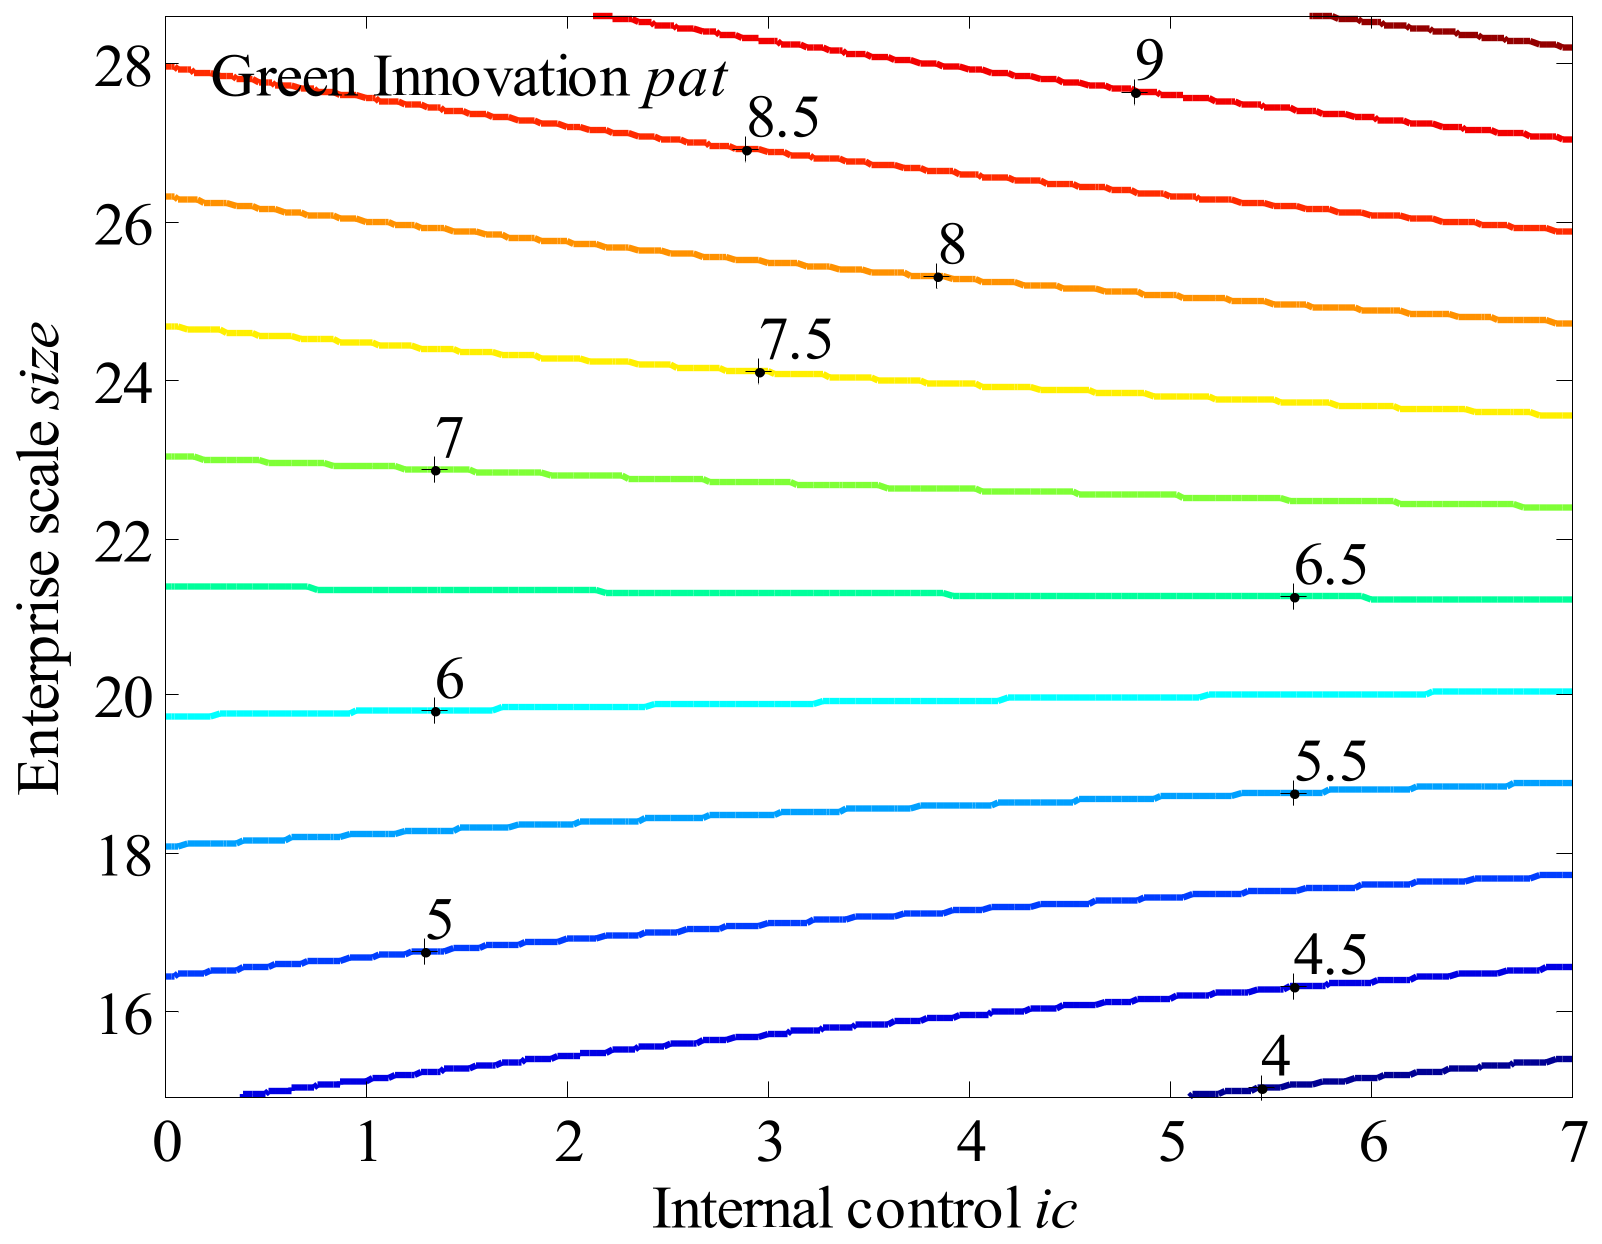
According to the driving hypothesis, the larger the enterprise scale, the more advantages the enterprise has in terms of capital, talent, technology, and other resources, and green innovation requires sufficient resource support. The difference between enterprise scales may affect the impact of internal control on green innovation. The regulatory effect of enterprise scale is visually shown in
Figure 3. In the grouping test results in columns (5) and (6) of
Table 7, we can see that the correlation coefficient between internal control (
ic) and green innovation (
pat) of large-scale enterprises was greater than that of small-scale enterprises, and both types of enterprises were significantly positive. In column (1), the correlation coefficient between
ic×
size and green innovation (
pat) was 0.018, which was significantly positive, indicating that the roles of enterprise scale and internal control in promoting green innovation are interdependent and complementary. Large-scale enterprises have more advantages in the construction of internal control, have the ability to implement more effective internal control, and thus have stronger technological innovation capabilities and more prominent green innovation achievements.
(2) Relationship resources. According to the theory of social capital, relationship resources are relatively important economic resources for enterprises, which can obtain various benefits or business information for enterprises, thereby promoting the development of enterprises. Compared with Western countries, China’s formal institutions are relatively weak. As a substitute for formal institutions, “relationships” can play an important role in economic development, but these special economic resources often need to be maintained by on-the-job consumption [
56]. Therefore, in order to accumulate more social and human capital to enhance competitiveness, enterprises may establish relationships with business partners and government officials through banquets or entertainment [
57,
58]. However, because of the complex economic nature of on-the-job consumption, these various relationship resources are not all effective. Therefore, enterprises need to strengthen their supervision of the maintenance methods and maintenance strength of various relationship resources through internal governance, so as to maximize their effectiveness.
Relationship resources include government–enterprise relationship resources (
rel1) and business relationship resources (
rel2).
Figure 4 and
Figure 5 visually show the regulatory effect of relationship resources. In the grouping test results in columns (2) and (3) and the grouping test results in columns (5) and (6) of
Table 8, one can see that the correlation coefficients between internal control (
ic) and green innovation (
pat) of the two groups were both significantly positive. In columns (1) and (4), one can see that the correlation coefficients between green innovation (
pat) and
ic×
rel1, green innovation (
pat) and
ic×
rel2 were 0.041 and 0.048, respectively, which were significantly positive at the 10 and 1% levels, respectively, indicating that under effective supervision by internal control, relationship resources can actively play an effective role. The role of relationship resources in promoting enterprise green innovation depends on the effective supervision by internal control.
(3) Executive power. The subjects of internal control are senior executives. Powerful executives with decision-making power and resource allocation power tend to weaken the supervision and punishment obligations of internal control while strengthening their personal power, which may override the internal control of the enterprise, resulting in failures of internal control such as “management override” or “selective execution”. Enterprise green innovation contains the dual externalities of the economic environment. In the absence of effective management and control, executives tend to take a risk-averse attitude and do not allocate enterprise resources to green innovation activities but use them for other “short-term and fast” investment activities. In addition, in China, which emphasizes “relationship-based” transactions, powerful executives will consciously use enterprise resources for rent-seeking activities, such as earnings management, laying and maintaining various relationship networks to stabilize power without a strong motivation to obtain promotion through green innovation activities. The regulatory effect of executive power is shown in
Figure 6. From the grouping test results in columns (2) and (3) of
Table 9, one can see that the correlation coefficient between internal control (
ic) and green innovation (
pat) of enterprises with high executive power was less than that of enterprises with small executive power. In column (1), the correlation coefficient between green innovation (
pat) and
ic ×
top was –0.113, which was significantly negative at the 5% level, indicating that the greater the executive power, the greater the weakening effect on the positive relationship between internal control and green innovation.
(4) Government subsidies. Government subsidies cannot only alleviate internal financial constraints and make up for the imbalance between risks and returns caused by “dual externalities”, but also have a leverage effect through the signal transmission mechanism and effectively expand the external financing capacity for green R&D projects. However, because of the existence of information asymmetry and principal–agent problems, executives will also use innovation as a pretext to obtain government subsidies and other government support but use this part of government subsidies for non-innovative R&D activities to meet the short-term development needs of enterprises and their personal interests. In this way, government subsidies may distort market price factors, thus having a negative impact on the sustainable development of enterprises [
31,
32]. At this time, effective internal control can standardize executives’ personal goals to align with enterprise value and improve the driving force of government subsidies on enterprise green innovation. The regulatory effect of government subsidies is visually shown in
Figure 7. The specific test results are shown in
Table 9. From the grouping test results in columns (5) and (6), it can be seen that the correlation coefficient between internal control (
ic) and green innovation (
pat) of the high government subsidies group was less than that of the low government subsidies group. It can be seen in column (4) that the correlation coefficient between green innovation (
pat) and
ic×
bt was 0.002, which was significantly positive at the level of 5%, indicating that government subsidies can positively regulate the promotion by internal control of green innovation.
7. Conclusions and Recommendations
Enterprise green innovation has become an important support for promoting social green transformation and achieving carbon neutrality goals and high-quality economic development. Under conditions of asymmetric R&D information, internal control is the inductive antecedent to drive enterprise green innovation. Based on the internal control system environment during the transition period of China’s market economy, we selected 2012–2020 Chinese A-share listed companies as a sample to explore the impact of internal control on enterprise green innovation, and then explained how enterprise internal control can achieve the “win–win” result of enterprise economic benefits and environmental protection. Overall, internal control can significantly improve enterprise green innovation, mainly reflected in the mandatory disclosure stage of internal control information and the other four elements except the control environment. Enterprise risk, agency conflict, financing constraint, and innovation investment rationality play partial intermediary roles in the relationships among them; that is, reducing enterprise risk and agency conflict, alleviating financing constraint, and improving innovation investment rationality are the path mechanisms for internal control to effectively improve enterprise green innovation performance. Further testing found that property right nature, enterprise scale, relationship resources, executive power, and government subsidies have significant interactive relationships with internal control. For property right nature, the internal control of private enterprises has a greater role in promoting green innovation, and the nature of property rights weakens the role of internal control in promoting green innovation. For enterprise scale, the internal control of large-scale enterprises plays a greater role in promoting green innovation, and the roles of enterprise scale and internal control in promoting green innovation are interdependent and complementary. For relationship resources, the internal control of enterprises with fewer government–enterprise relationship resources and business relationship resources has a great effect on the promotion of green innovation, but internal control can strengthen the effective supervision of relationship resources, and the roles of relationship resources and internal control in promoting green innovation are interdependent and complementary. For executive power, the greater the executive’s power, the more likely it will weaken the supervision and punishment capacities of internal control, and high executive power will weaken the positive relationship between internal control and green innovation. For government subsidies, since effective internal control can improve the utilization rate of government subsidies, they can produce a “synergistic effect” with internal control and positively regulate the effect of internal control on green innovation.
In order to promote the green development of the entire social economy, the government should actively implement the concept of green and low-carbon development, issue and improve internal control guidelines that will guide enterprises to achieve a green transformation, motivate executives to innovate actively, reduce the opportunities for powerful executives to override internal control while intensifying the reform of state-owned enterprise systems, strengthening the synergy between relational resources and government subsidies, and achieving the green and low-carbon upgrade of production processes.
(1) Issue internal control guidelines to guide the green development of enterprises. The green development of enterprises needs to be accompanied by a sound internal control system. Low internal control cannot effectively guarantee green innovation, and it is hard to implement the green development of enterprises. Therefore, the government should improve the implementation rules of the internal control system and issue internal control guidelines such as system construction and risk control that will guide enterprises to launch green innovation.
(2) Intensify the reform of the state-owned enterprise system. Because of the inherent advantages of government and enterprises, state-owned enterprises are not motivated to establish a mechanism that effectively checks and balances the board of directors, managers, and all employees, resulting in internal control often being restricted in the implementation process, unable to give full play to promoting green innovation. In this regard, state-owned enterprises should adhere to the direction of market-oriented reform, improve the internal control and balance mechanism in a market-oriented manner, and improve the effectiveness of innovation and development and environmental protection.
(3) Squeeze the manipulation space of powerful executives. Since the subjects of internal control are people, powerful executives often override internal control and practice selective implementation. Therefore, enterprises need to improve the internal control system, refine the internal control implementation process, incorporate the decision-making and implementation responsibilities of executives into the scope of internal control supervision, and improve the transparency and supervision of internal control information disclosure, so as to reduce the space for executives to override internal control and carry out selective implementation. At the same time, government regulators should also increase the punishment for violations such as rent-seeking arbitrage by enterprise executives and increase the cost of violations.
(4) Give full play to the “combined fist” role of financial subsidies. The government should strengthen the screening and supervision of subsidized enterprises, accurately and effectively design financial subsidy policies, formulate different subsidy policies for different enterprises, and implement different staged subsidy strategies at different enterprise stages, so as to give full play to the guiding role of government subsidies in green technology innovation, eliminate corruption such as enterprise rent-seeking, and promote green innovation.


