Article

Pre-Cooling Concrete System in Massive Concrete Production: Energy Analysis and Refrigerant Replacement

1
Department of Alternative Energy Technology, Faulty of Engineering and Technology, Al-Zaytoonah University, P.O. Box 130, Amman 11733, Jordan
2
Department of Mechanical Engineering, Faculty of Engineering, Tafila Technical University, P.O. Box 179, Tafila 66110, Jordan
3
Indiana Department of Transportation, Indianapolis, IN 46204, USA
*
Authors to whom correspondence should be addressed.
Energies 2022, 15(3), 1129; https://doi.org/10.3390/en15031129
Submission received: 23 December 2021 / Revised: 18 January 2022 / Accepted: 28 January 2022 / Published: 3 February 2022
(This article belongs to the Special Issue Energy Challenges and Smart Applications in Production Systems)

Abstract

:
Several techniques for cooling mass concrete structures were developed in order to increase structural integrity and reduce the influence of cement hydration, which sometimes causes cracking in concrete structures, negatively affecting their durability. This research focuses on cooling system design, initial investment, and the influence of different refrigerants on cooling system performance aims in producing higher quality massive concrete. Cooling aggregates in massive concrete structures such as desert dams can be performed by employing cooled air from an air conditioning duct system or chilled water. The experimental study illustrates the relationship between the coefficient of performance COP, the evaporator temperature, cooling capacity, and refrigerant mass flow rate as a function of the evaporator temperature, cooling capacity, and refrigerant mass flow rate. The findings of the experiments were utilized to verify a numerical model developed utilizing engineering equation solver (EES) software. The performance of the vapor compression of the cooling systems was compared using alternative refrigerants, including R22, R32, and R410a at different operating conditions. This study revealed that R22 refrigerant has a higher coefficient of performance than R32 and R410A, while R32 has the highest cooling capacity among other refrigerants.

1. Introduction

Thermal control plans are required for mass concrete constructions such as desert dams or bridge members in order to regulate the flow of heat generated by exothermic hydration processes in the concrete. When water is added to cement, a chemical process called hydration occurs, resulting in high temperatures and stresses in the core of massive concrete members. It is generally known that concrete has limited tensile strength and thermal conductivity, resulting in large stresses as a consequence of the high-temperature differential between the layers of massive concrete, and structural fractures as a result of the surface’s expansion and contraction at various rates [1]. Concrete cracking reduces the durability and serviceability of concrete [2,3]. Furthermore, if the temperature of the cement paste core rises beyond 57.2 °C, it loses strength, produces larger void pores, and therefore increases permeability [4]. Cooling the concrete components or utilizing additional materials that emit less heat can help to limit the substantial increase in temperature [5,6].
Precooling concrete components after they have been mixed results in a considerable increase in their durability and compressive strength [6]. Improving the quality of the concrete increases the structure’s safety and lowers its maintenance costs. The main cause of reduced concrete durability and the source of structural weakness is inadequate massive concrete quality. Furthermore, inferior concrete quality combined with insufficient concrete cover, as well as coastal environments affected by de-icing salts, resulting in cracking of reinforced concrete structures [7]. According to the corrosion costs and preventative strategies in the United States, up to $3 billion is spent annually on the repair of massive concrete used in bridge decks [8].
Many strategies for controlling the temperature of massive concrete structures are proposed to improve the endurance of massive concrete structures such as desert dams and bridges. Supplementary cementation materials for instance silica fume, fly ash, slag, metakaolin, or opaline rock are added to the concrete to minimize the heat of hydration in concrete constructions [9]. To improve the thermal and mechanical characteristics of concrete, several researchers substituted aggregate with steel slag aggregate [10]. Another way for lowering the temperature of massive concrete is to employ a typical refrigeration system to provide cooled water or ice flakes in the mixing process [11]. Alternatively, an air conditioning system might be used to cool a component of the concrete, such as aggregate [12].
Pre-cooling of the concrete ingredient before the mixing process or cooling the freshly mixed concrete before placing are applied to improve the durability of concrete illustrated in the ACI standards [5,13]. Generally, chilled water-cooled before mixing [11] to decrease the final temperature of the mixture based on the design of the concrete mix, the amount of concrete, and the ambient temperature. Water is a main component of the mixing and it is used as a coolant due to its high specific heat capacity, it can absorb hydration heat in a gradual manner rather than sudden. In very hot weather, an amount of ice is added to the mixture to reduce the mixing temperature in the range of 5 to 14 °C [14]. However, mixing with ice takes more time to avoid the existence of the ice lenses that are later transformed into voids during concrete hardening, causing a reduction in the concrete strength. Another method is to add dozes of liquid nitrogen to the mixture as illustrated by the ACI report [15]. As a cooler, liquid nitrogen LN was injected with the concrete mixing in order to improve the properties of fresh concrete [16,17]. However, several practical safety considerations should be considered during the transport of LN to cool concrete should be considered and used on the San Francisco-Oakland Bay Bridge project [18]. Another method is to cool aggregate to reduce the temperature of the mixture [19]. Aggregates could be cooled using water spray continuously or kept in a shaded area [5,13,20]. Air conditioning systems and fans are used to cool dry or wet aggregate [12,13] or recycled aggregate [21]. A post-cooling system is another method where the concrete is cooled by running water through pipes embedded in it [22].
In terms of global warming potentials (GWP) and ozone depletion potentials (ODP), the majority of traditional refrigeration systems employ harmful refrigerants in terms of Chlorofluorocarbons (CFCs) and hydrofluorocarbons (HFCs) as R11, R12, R22, R113, … [23,24,25,26,27]. As a result, several studies have been conducted to address the issue of harmful refrigerant replacement with minimal global warming potential. R410a was substituted with three types of low global warming potential refrigerants, R32, L41a, and D2Y60, by Alabdulkarem et al. [28]. R32 and L41a were found to be preferable alternatives for replacing R410a. Vali et al. [29] examined the theoretical performance of a conventional refrigeration system with several types of refrigerants, including R22, R32, R290, R152a, R134a, and R1270. Due to environmental concerns, the R1270 was considered to be a superior acceptable refrigerant to replace R22. Xu et al. [30] examined the coefficient of performance (COP) of a vapor-injected heat pump using R410a and R32 in an experimental study. When comparing the refrigeration cycle utilizing R32 to the refrigeration cycle using R410a, performance and capacity improvements of about 9 and 10% were realized, respectively. Tu et al. [31] tested the performance of a residential 3.2 kW heat pump utilizing R410A and R32 under a variety of operating situations. In terms of cooling capacity and performance, the results revealed that R32 is a viable alternative to R410a. Numerically, the COP and cooling capacity were both improved by 6% and 15%, respectively. Panato et al. [32] evaluated the replacement of R410A with low-GWP refrigerants such as R32, R452B, and R454B in an experimental study. The study showed that R32 has a lower energy efficiency than R410A under the conditions examined, but they have a minimal environmental effect due to their lower GWP. Ahmed et al. [33] studied in terms of exergy efficiency for R407A, R600A, R410A, and R134A. The results indicated that the hydrocarbon mixtures with R134A performed better than the other refrigerants. The compressor has the highest amount of exergy losses among the components of the vapor compression system. Fajar et al. [34] investigated the energy and exergy of a conventional refrigeration system by replacing the R410A with R290. The results showed that as compared to the system’s full charge quantity R410A, the compressor’s power consumption and refrigerating capacity dropped by 35.7 and 31.3%, respectively.
The utilization of chillers that operate with refrigerants that are particularly harmful to the environment is one of the primary difficulties generated by pre-cooling concrete in the Middle East. As a result, we attempted to alleviate the hydration problem that causes thermal cracking in mass concrete structures in this study by using a cooling system with low environmental effects and excellent performance through refrigerant substitution. There is a scarcity of knowledge on the design of cooling systems and which of these systems is the most efficient. The current study is the first of its kind to go into depth into the impact of concrete pre-cooling systems. The refrigerants R22 and R410a, which have a global warming potential of 1810 and 1725, have been widely employed in residential air-conditioning systems. R32, which has a low global warming potential of 675, is considered as a substitute for R22 and R410a. The goal of this study is to examine the performance of a vapor compression system with several alternative refrigerants, such as R22, R32, and R410a, under various operating situations.
The laboratory examination of pre-cooling concrete utilizing the continuous aggregate cooling method and chilled water method will be detailed in the following sections. Following that, the influence of such approaches on the engineering qualities of the resulting concrete will be explored. The authors will also present the findings of their numerical analysis of alternate refrigerants in the pre-cooling process under various operating circumstances.

2. Apparatus and Experimental Work

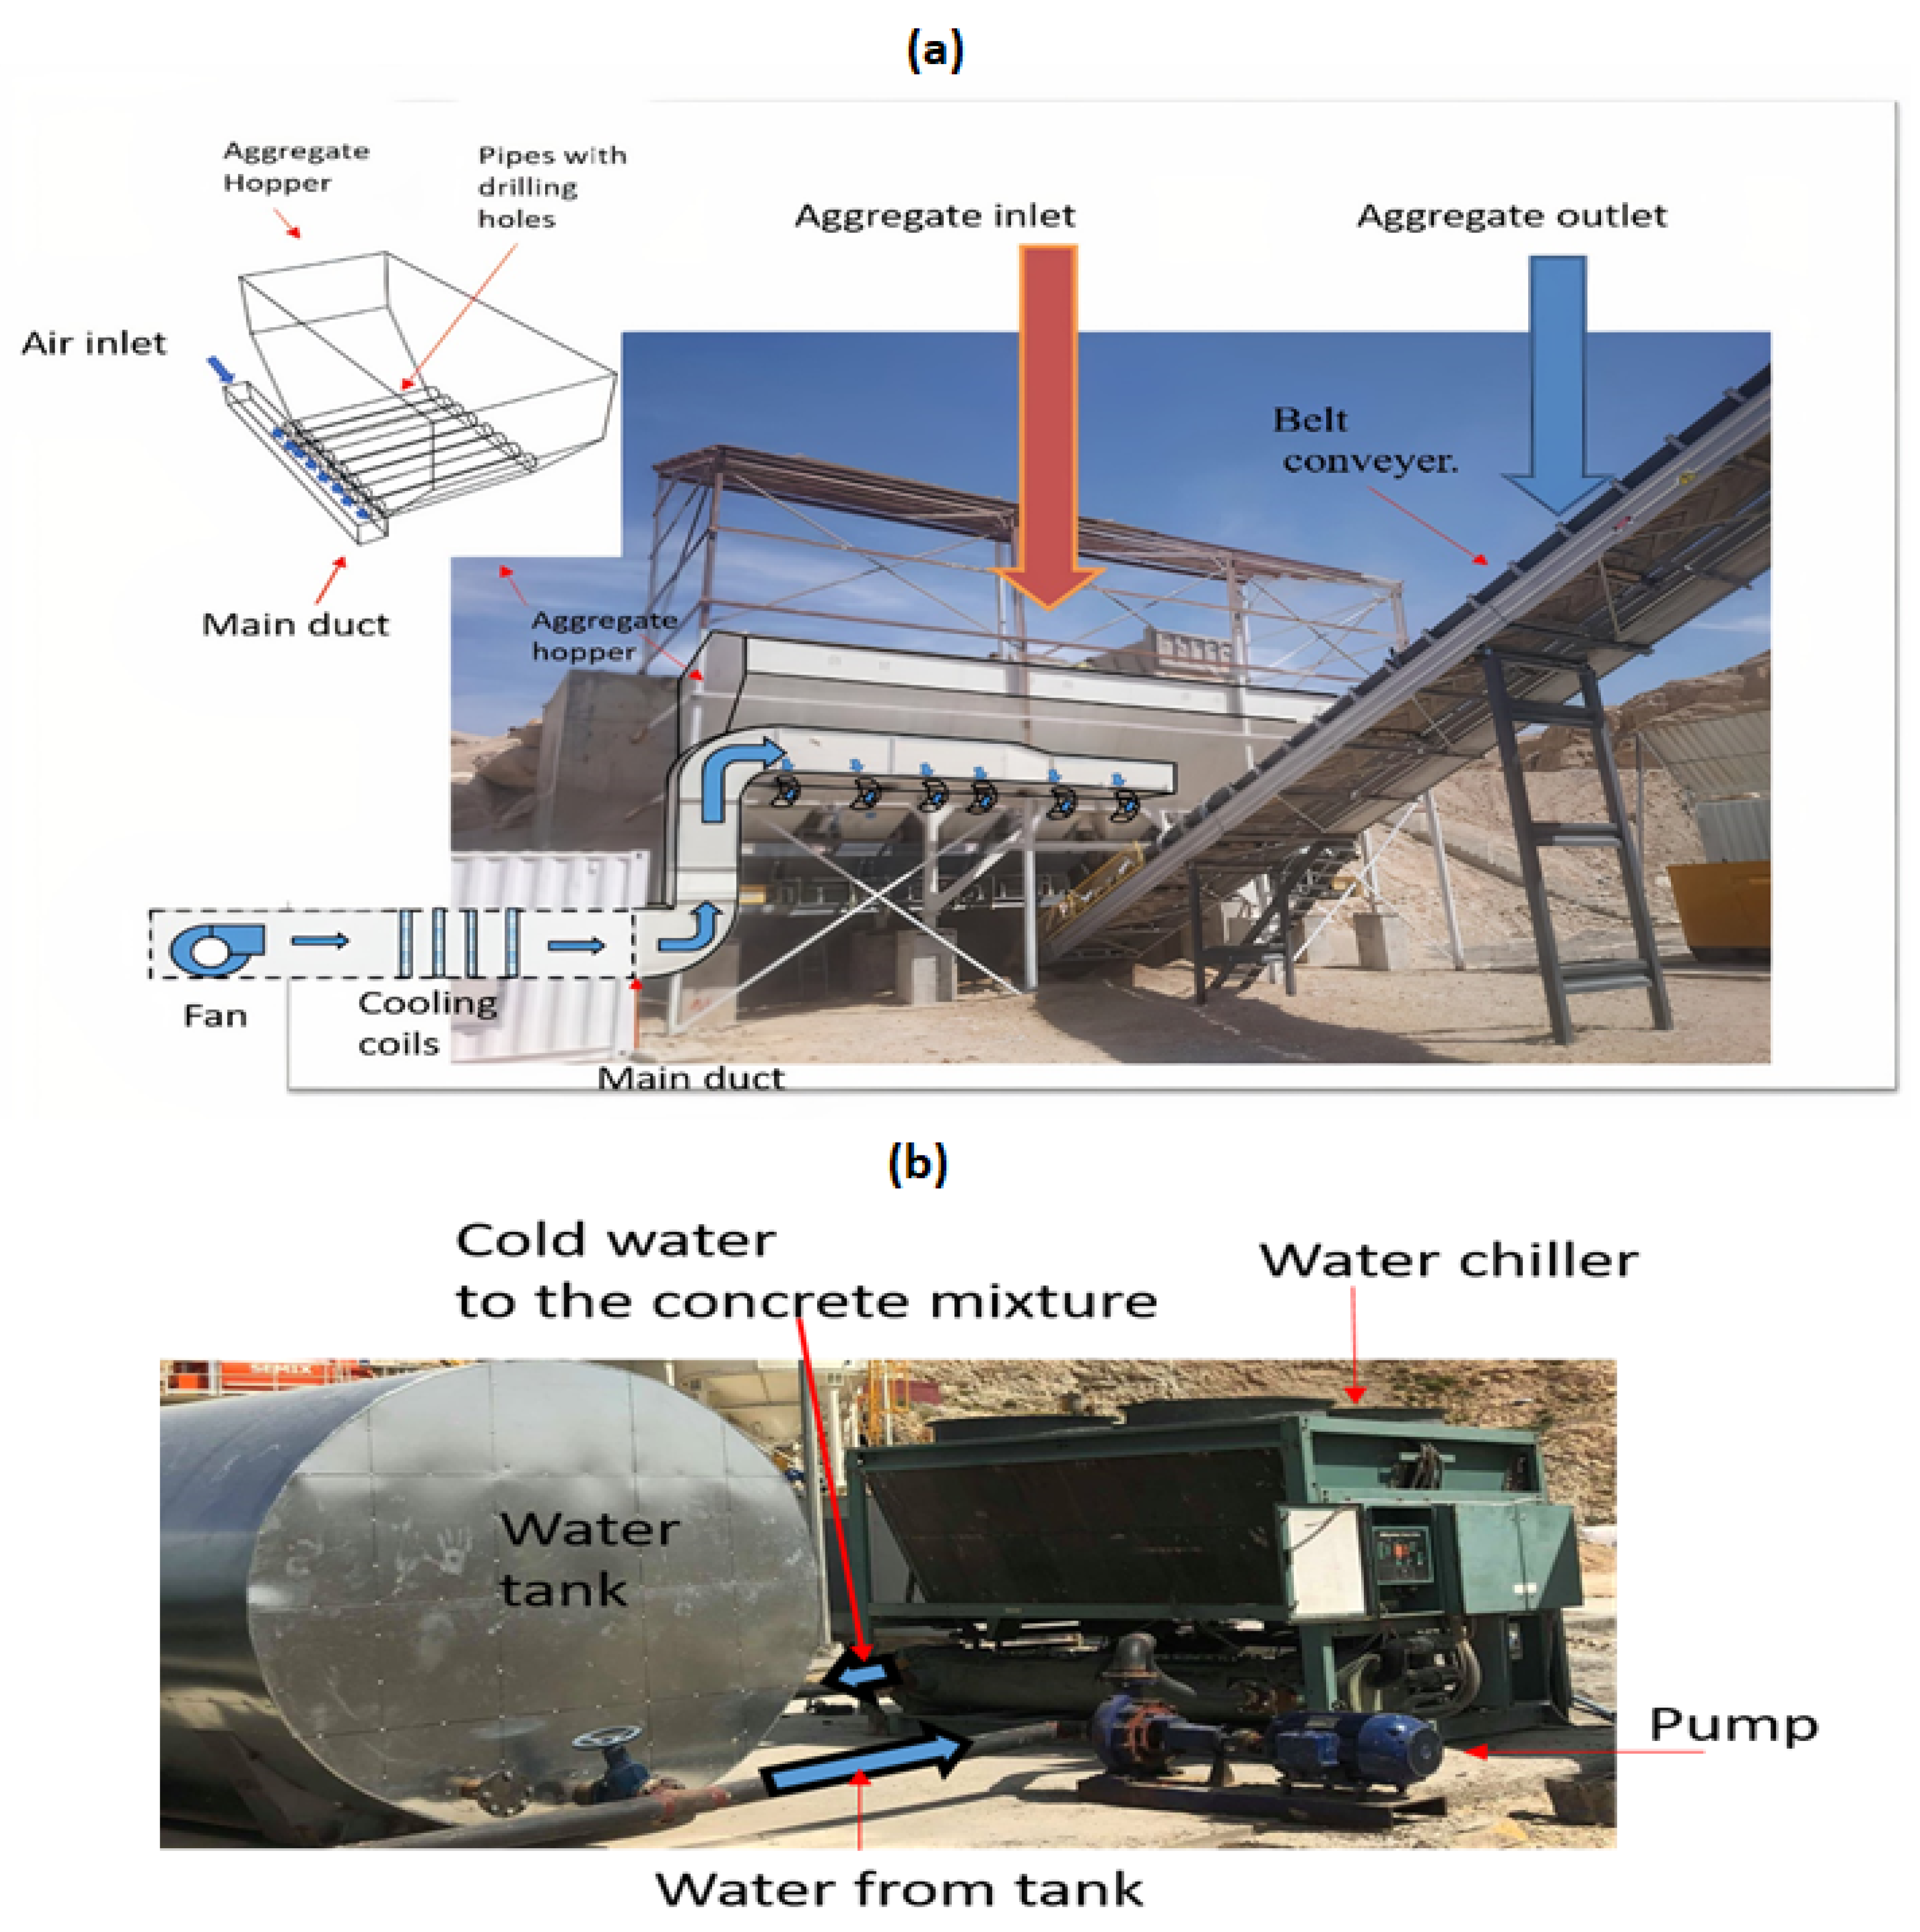
2.1. Description of the Pre-Cooling Concrete Mixture Systems

Two pre-cooling procedures for massive concrete desert dam projects were investigated in the Jordanian city of Ghores-Safi, near Karak. The air-cooling system is depicted in Figure 1a, which includes the main duct, four cooling coils, and a fan to circulate air. The 18,000 volumetric flow rate centrifugal fan circulates air via a filter and four fins-and-tube cooling coils, which progressively cool the air to around 0. To reach the aggregates hopper, this cooled air passes through ducts. The air is then cooled as it flows through drilling holes established within pipes inserted in the aggregate hopper’s lower section illustrated in the upper left side of Figure 1a.
The typical layout of an aggregate cooling system consists of (i) main duct, elbows, connectors, and air duct damper to control the air mass flow rate installed in the main duct (ii) the refrigeration cycle illustrated in Figure 2, the cycle consists of four cooling coils to cool air inside the main duct connected with two compressors, a component for heat rejection (condenser), and four expansion valves to control the refrigerant flow inside the refrigeration system and change of higher pressure to lower pressure. (ii) The aggregate hopper to cool the aggregate (a). During the cooling process, tons of aggregates are maintained within the hopper. The cooled aggregates can then be transported to the concrete manufacturing plant through the outlet belt conveyor. Table 1 shows the major components of the system as well as the initial investment in US Dollars (USD).
Another way of pre-cooling concrete mixtures utilizing the chilled water system is shown in Figure 1b. The water chiller which utilizes 55 HP (40.45 kW) reciprocating hermetic compressors placed in two industrial refrigeration circuits to cool up to 65.1 nominal tons of refrigeration (228.95 kW), is the main component of the cooling system. A centrifugal pump circulates water from storage tanks storing water at a temperature of 20 °C to the chiller. Two types of K-thermocouples with a precision of ±1 are fitted at the water storage tank, and water flows out of the chiller. The cooled water was around 4 °C exited from the chiller in all cases. The concrete mixer received chilled water through 2-inch (50.8 mm) steel pipes. Water volumetric flow rates of up to 250   GPM ( 1.136   m 3 / min ) are provided. Table 2 depicts the system components and their initial investment.

2.2. Experimental Work

The purpose of these tests is to acquire a better understanding of the continuous aggregate cooling system and, in particular, to validate the numerical model discussed later in Section 3. Figure 3 depicts the thermodynamic cycle of the vapor-compression refrigeration plant. It essentially comprises two semi-hermetic reciprocating compressors coupled in parallel to compress a 3.40 mass flow rate refrigerant. Chlorodifluoromethane fluid R22 was utilized as a refrigerant in the experimental device. The fluid’s characteristics are depicted in Table 3. The condenser unit is used to reject heat with air, causing the gaseous refrigerant inside the condenser to condense into a liquid. The condenser is connected to a liquid receiver and cartridge filter, as well as four expansion valves for lowering the refrigerant pressure. Each expansion valve is connected to a cooling coil through fins and a tube evaporator. Four parallel cooling coils in gradation lower the temperature of the ducted air and operate as a heat collector, picking up heat from the ducted air and transferring it to the refrigerant within the tube in this system.
Table 4 lists the sensors used to monitor the refrigerant’s temperature, mass flow rate, and pressure. T-type thermocouples, which generate an output voltage signal in the range of 1 to 5 Volts, are used to record refrigerant temperatures. To measure the temperature of aggregates, a Testo 830 infrared thermometer was acquired. Pressure gauges were used to record the refrigerant gauge pressure datum, and a volumetric Coriolis flowmeter was used to monitor the volumetric flow rates in the refrigeration loop. Two data acquisition modules, the National Instruments ±21.5, Current Analog Input, 16 Channels Module (NI 9208) are used to transform physical circumstances into digital form, which is then stored and analyzed.
At the entrance and exit of each device during the refrigeration cycle, the pressure and temperature of the working fluid are detected and recorded. The gauge pressure is measured with a ±1% accuracy and can measure up to 500   psi ( 34.47   bar ) using the fluid gauge pressure. The mass flow rate of R22 refrigerant was measured at the liquid receiver’s output, which was located downstream of the condenser. A hot-wire anemometer with a diameter of 10 µm, brand Dantec 55P31, was used to monitor the speed of ducted airflow within the range of 0.05–500 m/s and its temperature.
Inside the condenser, the maximum mass flow rate of the refrigerant was set at 3.4 kg/s, and the temperature and gauge pressure at points 1 to 15 were recorded, as shown in Figure 2 and Table 5. The mass flow rate in the evaporator was fixed at 0.85 kg/s, which was a quarter of the mass flow rate in the condenser. The temperature and speed of the ducted air after and before the cooling coils were also recorded in parallel. The temperature of the aggregates was also monitored using an infrared thermometer model Testo 830 placed on the aggregates’ upper surface. For aggregates with a diameter of 30 to 40 mm, the steady-state temperature was between 1 and 2 °C at a distance of 0.5 m from the hopper’s top. The cooling fan’s mass flow rate was maintained at 18,000 m3/h at all times. The same experimental setup was performed and repeated with different mass flow rates of 2.8, 3, and 3.172 kg/s using a gate valve.
The input power   W ˙ i n can be calculated using the equation,
W ˙ i n = m ˙ R 22 ( h 15 h 1 )
The single cooling coil capacity Q L can be calculated by using the equation:
Q ˙ L = m ˙ R 22 ( h c o i l , o u t h c o i l , i n )
From the ratio of the net cooling capacity ( Q ˙ L , t o t a l )   and the drive power   ( W ˙ i n ) , the coefficient of performance COP can be calculated as,
COP = Q ˙ L , t o t a l W ˙ i n

3. Numerical and Experimental Analysis and Discussion

This section deals with a numerical analysis that intends to investigate the use of several alternative refrigerants under various operating conditions in the refrigeration cycle.

3.1. Physical and Chemical Properties of Refrigerates

There are many different types of refrigerants in the market. The working conditions, as well as favorable physical and chemical qualities, should be considered when selecting a suitable refrigerant for a refrigeration system to obtain the largest cooling capacity and coefficient of performance. There is no one refrigerant that has all of the desirable features and can be utilized in the refrigeration system under all working situations. We chose three types of refrigerants for our research: R22, R32, and R410a. Table 3 shows the most important physical and chemical parameters that determine vapor compression performance for three types of selected refrigerants. Appendix A offers a detailed comparison of several types of refrigerants based on their thermodynamic characteristics. The following observations may be drawn based on an extensive assessment of different types of refrigerants in terms of R22, R410A, and R32: (i) Among the various refrigerants, R22 offers significant advantages in terms of specific heat for the liquid phase, freezing point, and liquid phase density; (ii) R410A has superior properties such as conductivity, vapor phase density, compression temperature, oil miscibility, and liquid phase viscosity compared to other refrigerants; (iii) R32, on the other hand, has the best enthalpy of vaporization, specific heat for the vapor, and viscosity for the liquid and vapor phases compared to other refrigerants; (iv) All refrigerants meet the critical pressure, evaporator, and condenser pressure requirements; (v) R22 and R410A are non-flammable refrigerants, however R32 is a moderately flammable refrigerant; (vi) R22 and R32 are non-toxic, however R410A is a toxic compound.

3.2. Simulation and Validation of the Numerical Work

Engineering Equation Solver (EES) was used to model the performance of the conventional refrigeration cycle utilizing various refrigerant types and operating variables. The following assumptions were used to model the vapor compression system in order to simplify the analysis: (i) All components in a refrigeration system operate in a steady-state condition, so all processes are steady flow processes; (ii) all changes in potential kinetic energy in all components are ignored; (iii) pressure drops in the pipelines as condenser and evaporator are ignored; and finally, (iv) isenthalpic process in throttle valve and Isentropic process in the compressor. Figure 3 depicts the flow chart of a system modeling approach for a typical vapor compression refrigerator.
Table 5 shows an example of the measured temperature and the gauge pressure at different points inside the refrigeration cycle illustrated in Figure 2. After the compressors at point 1 in Figure 2, the highest gage pressure was 2.14 MPa and the extreme temperature was 75 °C, as displayed in Figure 2. Before the compressor at point 15, the lowest pressure was 0.027 MPa. The pressure loss inside the condenser was about 1 kPa, while the pressure loss inside the cooling coils was between 0.2 and 0.8 kPa. As shown between points 3 and 7, the pressure drop inside the expansion valves was greatest through the first expansion valve. Between points 6 and 10, the fourth expansion valve had the lowest pressure drop. After the expansion valves, the lowest temperature in the refrigeration cycle was −35 °C.
To calculate the errors, we utilized the following formulae [35,36].
%   Relative   error = | Experimetal Simulated Experimetal × 100 % | ,
Standard   error   of   the   mean ;   SE μ x = standard   deviation   ( SD ) sample   size   ( n ) ,
where; the standard deviation   SD = i = 1 n ( x i μ x ) 2 n 1 , mean μ x = i = 1 n x i n .
The results of the EES model were validated using the experimental results at the same operating condition for conventional refrigeration systems. The experimental results for COP, cooling capacity, and mass flow rate as a function of evaporative temperature for R22 refrigerant are compared to the current experimental data in Figure 4. The predicted COP, cooling capacity, and mass flow rate all agreed well, with average relative errors of 6.3%, 4.56%, and 2.1%, respectively. For the predicted COP, cooling capacity, and mass flow rate, the standard error of the mean was 0.08, 2.44, and 0.008, respectively.

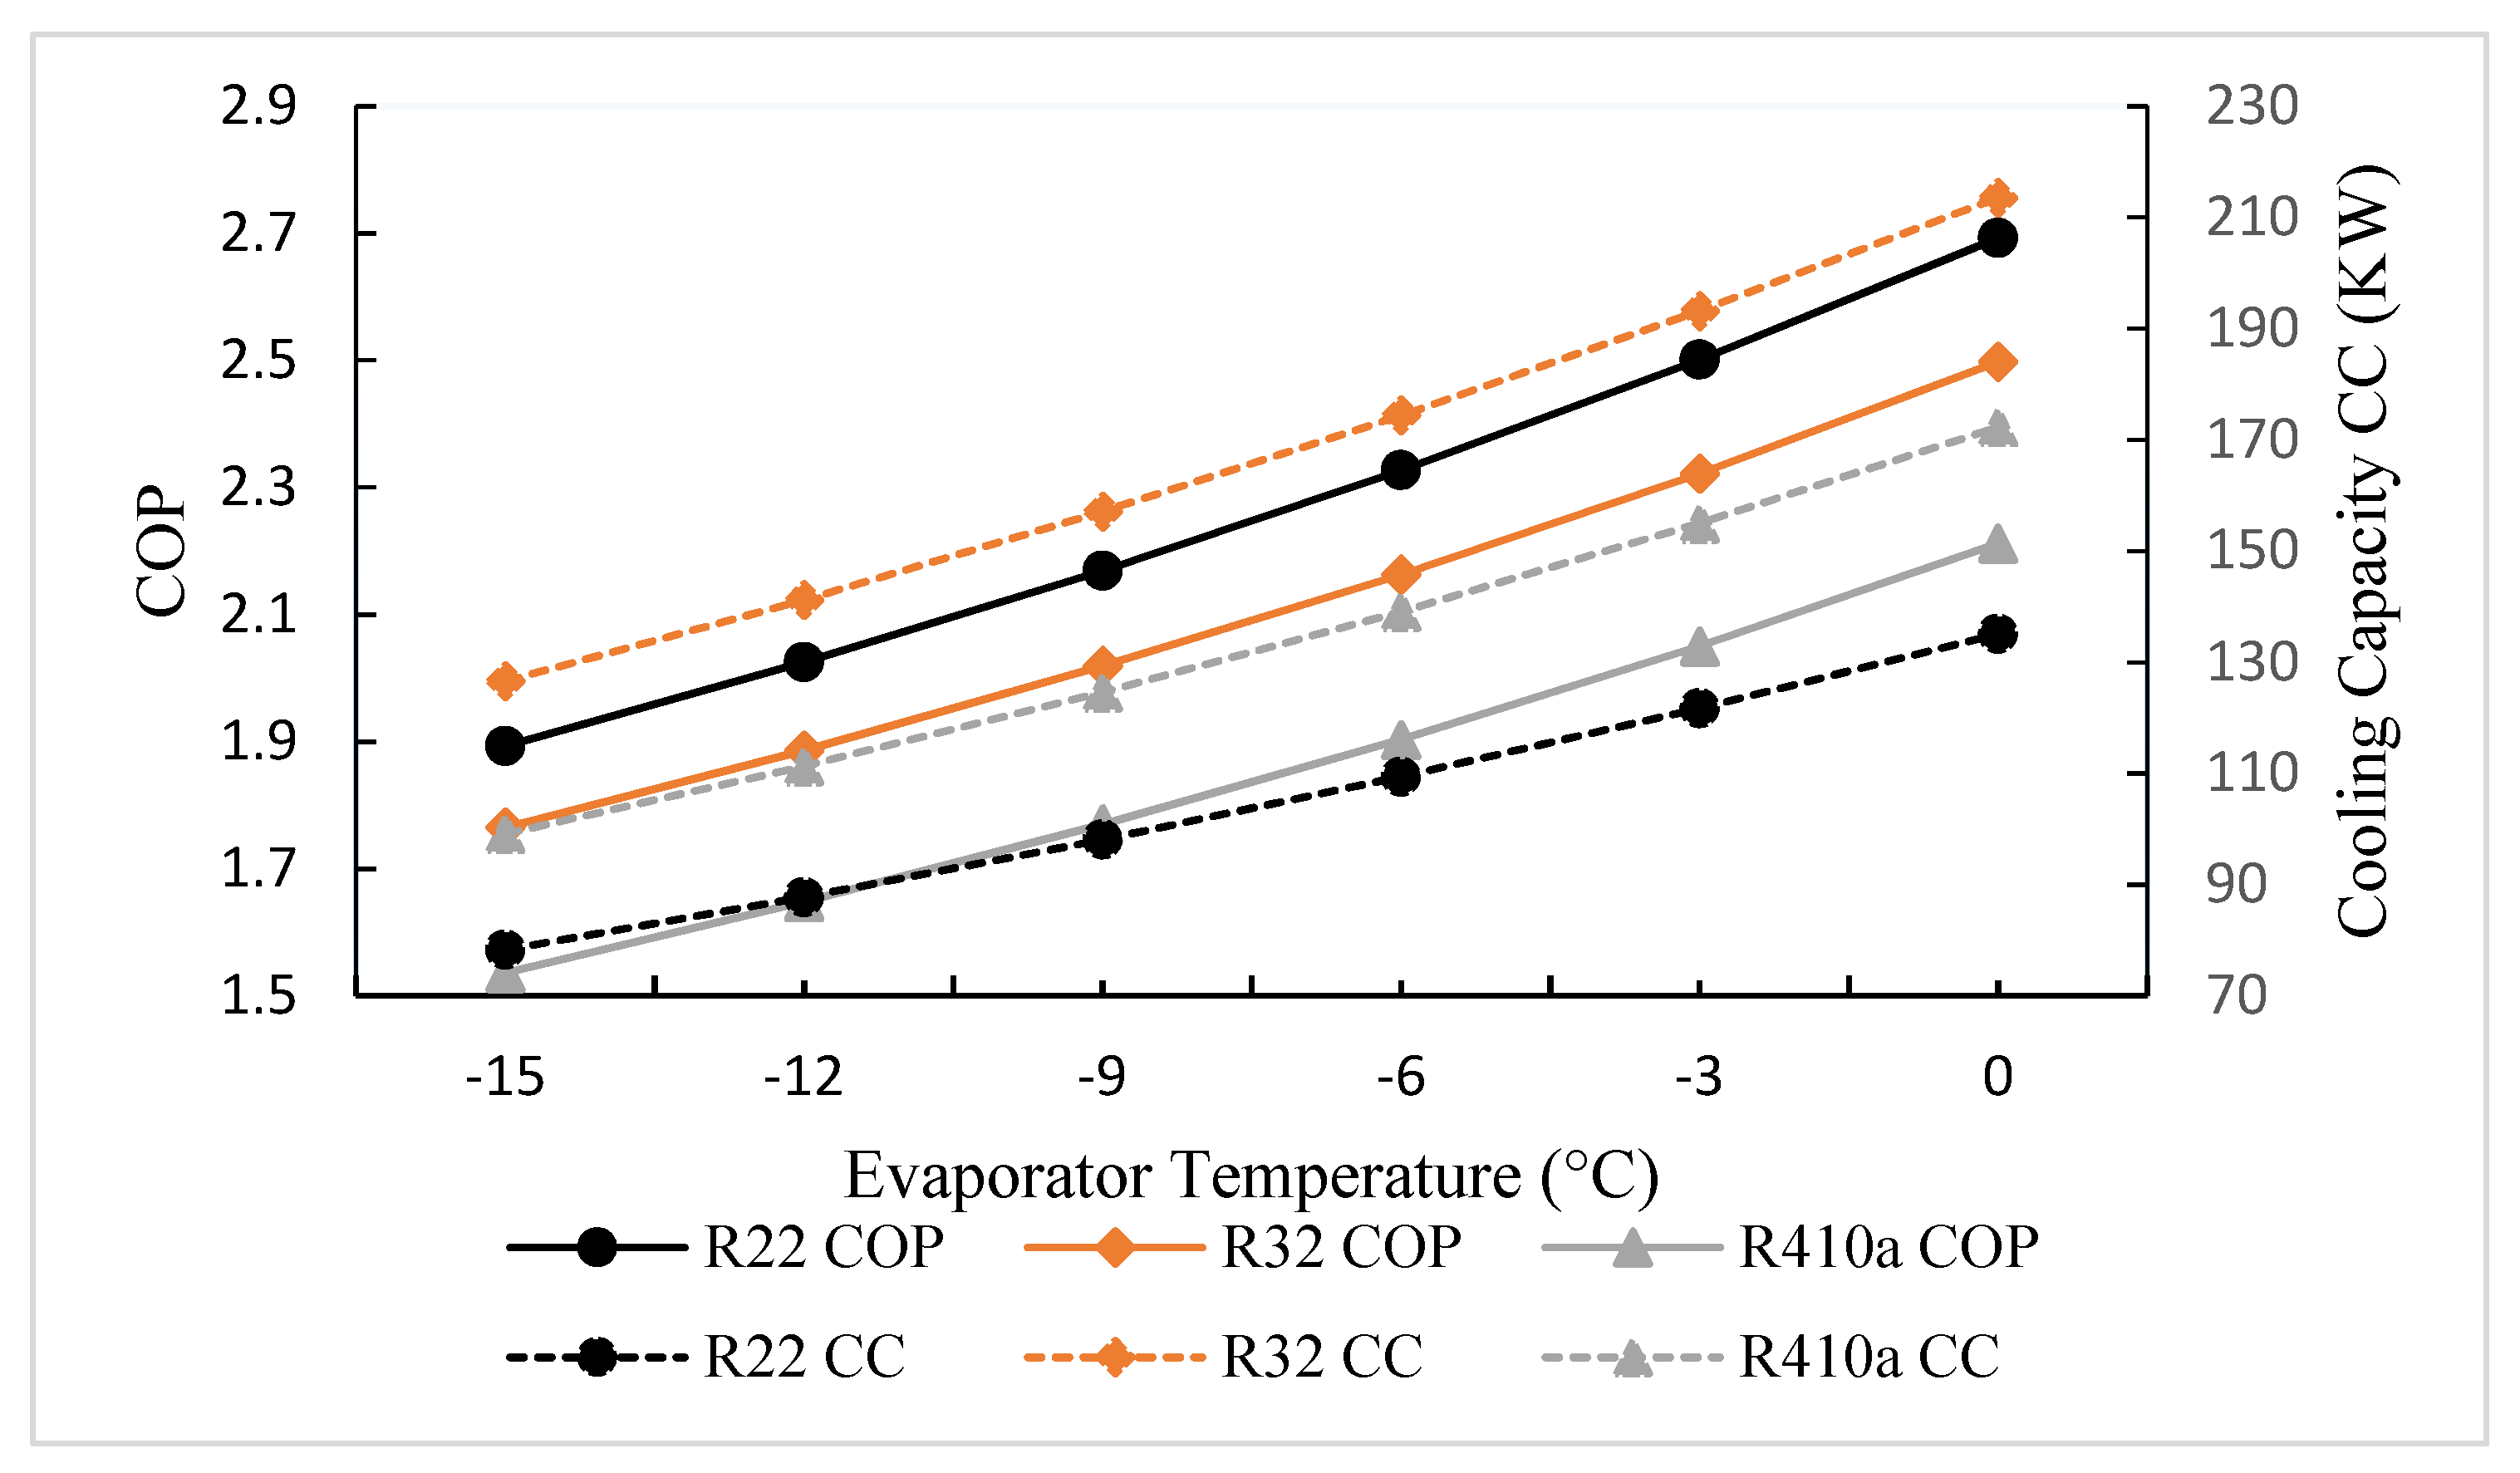
3.3. Results and Discussion

Table 6 shows the operating conditions employed in our analysis. At a constant condensing temperature, Figure 5 and Figure 6 show the fluctuation of COP, cooling capacity, and mass flow rate through the refrigeration system with evaporation temperature for three types of refrigerants: R22, R32, and R410a. For all types of refrigerants, the COP, cooling capacity, and mass flow rate increase as the evaporator temperature rises because the compressor works less as the area under the pressure-volume curve shrinks. On average, the COP for R22 is 6.51% and 17.65% better in comparison to R32 and R410a, respectively. While, on average, the cooling capacity for R32 is 37.6% and 20% higher in comparison to R22 and R410a, respectively, because it has the highest enthalpy of vaporization as depicted in Table 3. To achieve the same evaporative temperate, the recirculation mass flow rate through a refrigeration cycle should be increased on average by 3.6% and 43.5% for R32 and R410a compared to R22.
Table 7 shows a brief comparison of our present research with others [30,31,37,38,39,40]. Despite the fact that comparing our results with others is challenging due to differences in parameters variation such as ambient temperature, mass flow rates, operating state parameters, and instrument accuracy.
Figure 7 indicates the effects of condenser temperature on both COP and cooling capacity for several refrigerant types. The COP and cooling capacity of the vapor compression refrigeration system both decrease as the condenser temperature rises, as shown in this figure. This occurs because as the condenser temperature rises, the quality/dryness fraction of the refrigerant at the exit from the throttle rises, lowering the COP and cooling capacity. In comparison to R32 and R410a, the COP of R22 is % and 18.3% higher, respectively. While R32 has a cooling capacity that is 37.4% larger and 20.5% higher than R22 and R410a, respectively.

4. Conclusions

In this paper, a detailed methodology for the design of cooling systems oriented to produce high-quality massive concrete and lower the cement hydration heat has been presented. The aim of cooling is to increase the durability of massive concrete by reducing the impact of the heat of the hydration. The researchers expect significant progress in applying the findings of this study into the design and construction methods of local mass concrete projects, such as desert dams. In this methodology, different kinds of systems such as duct air cooling systems or chilled water are discussed in order to achieve accurate designs enough to cool tons of concrete before mixing. The novelty of this research is that the study not only discussed the design and the initial cost of the cooling systems, but also the impact of particularly harmful to the environment refrigerant replacement with less harmful refrigerants on the coefficient of performance. Two simple designs of cooling systems have been introduced to cope with the problems of cooling concrete components.
First, A simple effective design of the cooling system was introduced for cooling continuous aggregate using four cooling coils, a fan-duct system, and a heat exchanger inside the aggregate hopper. This method depends upon the speed and temperature of the airflow through the coarse aggregate, the size, the amount and the type of the aggregate, ambient temperatures, relative humidity, and the time of cooling and design of the hopper. Sub-zero air is used to reduce the aggregate temperature. However, the cooling system is designed to be flexible in order to decrease the final temperature of the aggregate based on the design of the concrete mix, the amount of concrete, and the ambient temperature. The air temperature can be controlled by selecting the number of active cooling coils, valves, and air dampers to control the flow rate of air. The paper discussed in detail the initial cost of the air conditioning system, ducts, fan, and hopper.
Use of chiller to produce cold water around 4 °C. Many water storage tanks are required for the production of large volumes of concrete. The method is suitable when fast and large temperature reductions are needed. The installation cost using a mechanical refrigeration chiller is high, but it has a relatively low operational cost. The initial cost for the chilled water-cooling system is reduced by 10% compared with the air conditioning system case.
The issue of harmful refrigerant replacement in the industry with minimal global warming potential is necessary and Mandatory in many countries. Discuss the impact of refrigerant replacement on the performance of the cooling system has discussed in this research in the industrial application used for pre-cooling concrete. The experimental work with a continuous aggregate cooling system utilized refrigerant R22. The results show a good agreement between the experimental and numerical results. New HFC fluids R32, R410a were used in the simulation as an alternative refrigerant with a lower environmental impact. It concluded that the performance of a vapor compression refrigerating unit operating with R22, and its performance compared with new refrigerants R32. The results show that still, refrigerant R22 has more COP than new HFC fluids due to the thermophysical properties of the refrigerant.
Finally, it could be stated that applying the proposed methodologies, an efficient cooling system has been designed. To lower the impact of the cement hydration heat that may reduce the safety and durability of the structure. The researchers recommend a future investigation of moist aggregate cooling approaches and their impact on the properties of concrete mixes under different environmental conditions. The influence of wet aggregate absorption on evaporative cooling and concrete quality, in particular, has to be thoroughly investigated.

Author Contributions

Conceptualization, M.I.A.; methodology, A.A. and M.I.A.; software, M.B.Y. and A.A.; formal analysis, A.A. and M.I.A. investigation—original draft preparation, M.I.A. and A.A. writing—review and editing, S.M.B. and A.A., visualization, M.I.A., A.A., and M.B.Y. All authors have read and agreed to the published version of the manuscript.

Funding

This research received no external funding.

Institutional Review Board Statement

Not applicable.

Informed Consent Statement

Not applicable.

Data Availability Statement

Data availability at the Alternative energy department, Faculty of Engineering and Technology, Al-Zaytoonah University of Jordan.

Conflicts of Interest

The authors declare no conflict of interest.

Nomenclature

VariableDefinitionUnits
EESEngineering Equation Solver
COP The coefficient of performance
h Enthalpy kJ . kg 1
h coil , out Enthalpy at the outlet of the evaporator kJ . kg 1
h coil , in Enthalpy at the inlet of the evaporator kJ . kg 1
h 15 
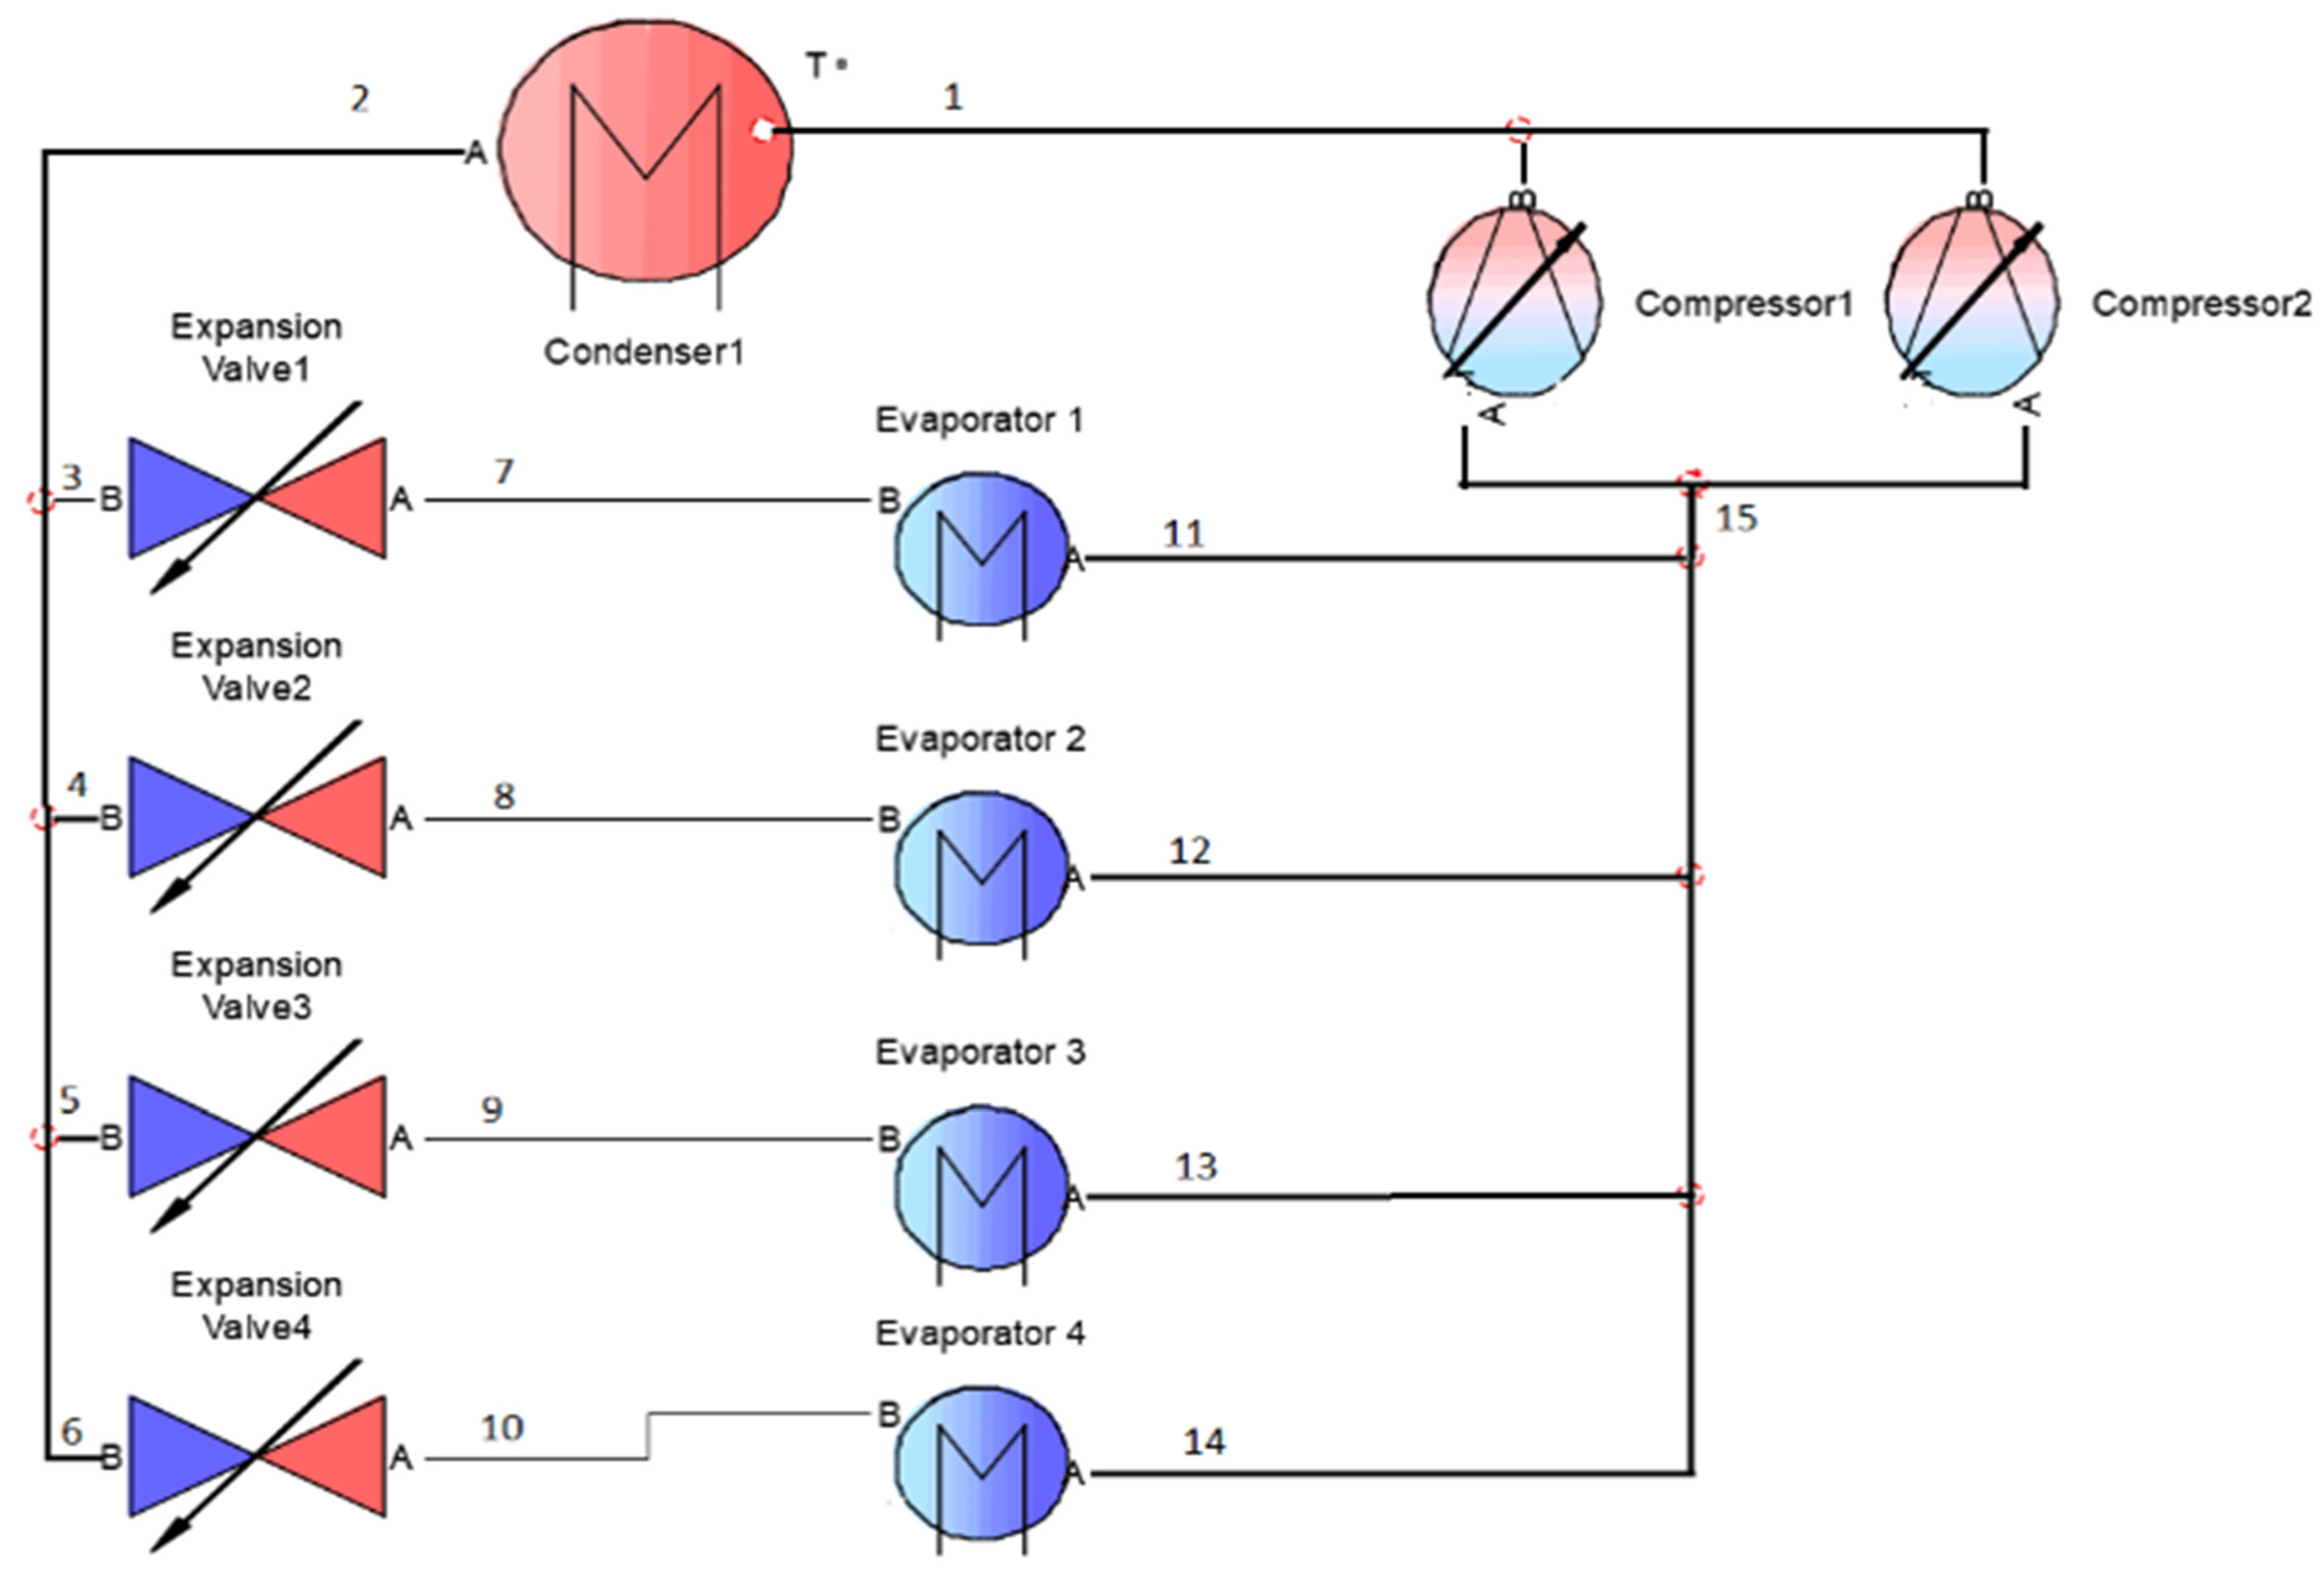
Enthalpy at the inlet of the compressors, see Figure 2 kJ . kg 1
h 1 Enthalpy at the out of the compressors, see Figure 2 kJ . kg 1
m ˙ R 22 Mass flow rate of Refrigerantkg s−1
n Sample   size  
Q ˙ L Cooling coil capacity of single evaporator kW
Q ˙ L , total Net cooling capacity of evaporators kW
SE μ x Standard error of the mean
SD Standard deviation
W ˙ in Drive power in compressors kW

Appendix A. General Assessment of Different Types of Refrigerants

CharacteristicCriteriaEvaluation (1: Best; 3: Worst)Explanation
R22R32R410a
Critical TemperatureIt should be above the condensing temperature123To achieve a high heat transfer at a constant temperature to reduce power consumption by the refrigeration system
Critical PressureIt should be positive and moderateAll refrigerants achieve the criteriaIn case of high pressure, the refrigeration system will be a heavy and bulky. In case of low pressure, the increase possibility of air leakage into the system.
Enthalpy of VaporizationIt should be large as possible312To reduce the mass flow rate per ton of refrigeration. To reduce the area under the curve for superheat and the area reduction due to the throttling process.
ConductivityIt should be high as possible321To control of a size of the condenser and evaporator without any difficulties
Specific Heat for the liquidIt should be small as possible132To minimize the irreversibilities corresponding to throttle process, which leads to increase the liquid subcool.
Specific Heat for the vaporIt should be high as possible312To be less superheating of the vapor.
Evaporator and Condenser PressureIt should be above atmospheric pressureAll refrigerants achieve the criteriaTo prevent the air leakage into refrigeration system which reduce the refrigeration system capacity and the moisture air leads to corrosive tubing of the refrigeration system.
Compression RatioIt should be small as possibleNO evaluationTo prevent the refrigerant leakage occurs around the piston, Moreover, it is a crucial parameter for volumetric efficiency
Freezing PointIt should be small as possible132To prevent the a possibility of occurring blockage due to very low temperature in evaporator
DensityIt should be high as possibleFor LiquidEffects on the size of a compressor, which A high value of density leads in high pressure rise
132
For Vapor
321
Compression TemperatureIt should have a low compression temperature321Increases the wall cylinder temperature after compression process, this requires an external cooling for cylinder walls to prevent material and volumetric losses.
FlammabilityIt must be non-flammable.NoneA2L *NoneTo avoid a fire when subjected to high temperatures
Miscibility with OilIt should not be miscible with the oil321To prevent loss of lubricating strength
ToxicityIt should not be toxicNoneNonetoxicityIt may be come into contact with human beings
ViscosityIt should be as small as possibleFor LiquidTo keep the system pressure drop is small. The less viscosity, the less energy required for its
Circulation
3Same
For Vapor
212
* A2L is non-toxic and mildly flammable refrigerants.

References

  1. Riding, K.A.; Poole, J.L.; Schindler, A.K.; Juenger, M.C.; Folliard, K.J. Evaluation of temperature prediction methods for mass concrete members. ACI Mater. J. 2006, 103, 357–365. [Google Scholar]
  2. Kjellsen, K.O.; Detwiler, R.J.; Gjørv, O.E. Development of microstructures in plain cement pastes hydrated at different temperatures. Cem. Concr. Res. 1991, 21, 179–189. [Google Scholar] [CrossRef]
  3. Portland Cement Association, Portland Cement, Concrete, and Heat of Hydration. 1997, Volume 18, pp. 1–8. Available online: http://readymixmuscat.com/wp-content/uploads/2016/10/pl972.pdf (accessed on 30 January 2022).
  4. Branco, F.A.; Mendes, P.; Mirambell, E. Heat of hydration effects in concrete structures. Mater. J. 1992, 89, 139–145. [Google Scholar]
  5. ACI 207.4R-05Cooling and Insulating System for Mass Concrete. American Concrete Institute (ACI): Farmington Hills, MI, USA, 2005.
  6. Ishee, C.; Surana, S. Hot weather concreting. In Developments in the Formulation and Reinforcement of Concrete, 2nd ed.; Chapter 6; Woodhead Publishing: Cambridge, MA, USA, 2019; pp. 131–150. [Google Scholar] [CrossRef]
  7. Stewart, M.G.; Mullard, J.A. Spatial time-dependent reliability analysis of corrosion damage and the timing of first repair for RC structures. Eng. Struct. 2007, 29, 1457–1464. [Google Scholar] [CrossRef]
  8. Yunovivh, M.; Thompson, N.G.; Balvanyos, T.; Lave, L. Corrosion Costs and Preventative Strategies in the United States; Report FHWARD-01-156; Highway Administration (FHWA), Office of Infrastructure Research and Development: Washington, DC, USA, 2002. [Google Scholar]
  9. Abdel-Raheem, M.; Quintana, O.; Morales, M.; Marroquin-Villa, Y.; Ramos, D.; Hernandez, S. Construction methods used for controlling temperature in mass concrete structure. In Creative Construction Conference 2018, Proceedings of the Creative Construction Conference, Ljubljana, Slovenia, 30 June–3 July 2018; Budapest University of Technology and Economics: Budapest, Hungary, 2018; pp. 139–146. [Google Scholar] [CrossRef]
  10. Abendeh, R.M.; Bani Baker, M. Using steel slag aggregate to strengthen self-compacting concrete durability. Proc. Inst. Civ. Eng. Struct. Build. 2021, 174, pp. 1–15. [Google Scholar] [CrossRef]
  11. Madi, M.; Refaat, N.; Negm El Din, A.; Ziada, F.; Mazen, M.; Ahmed, S.; Hamza, A.S.; El Nahas, E.; Fathy, A.; Fahmy, E.H. The impact of mixing water temperature on portland cement concrete quality. In Proceedings of the CSCE Annual Conference, Vancouver, BC, Canada, 31 May–3 June 2017. [Google Scholar]
  12. Alamayreh, M.I.; Barham, T.; Shaban, N.A.; Olimat, A.N. Design of High Efficiency Aggregate Air Cooling System. In Proceedings of the Second Thermal and Fluids Engineering Conference, Las Vegas, NV, USA, 2–5 April 2017; pp. 2369–2375. [Google Scholar] [CrossRef]
  13. ACI 207.1R-05Guide to Mass Concrete. American Concrete Institute (ACI), ACI Committee 207: Farmington Hills, MI, USA, 2005.
  14. International Commission on Large Dams (ICOLD). Conventional Methods in Dam Construction: Review; Commission Internationale des Grands Barrages: Paris, France, 1990. [Google Scholar]
  15. 305R-10Guide to Hot Weather Concreting. American Concrete Institute (ACI), ACI Committee 305: Farmington Hills, MI, USA.
  16. Nakane, S.; Saito, H.; Ohike, T. Strength development and microstructure of cement and concrete precooled with liquid nitrogen. In Proceedings of the International Conference on Concrete in Hot Climates, Concrete in Hot Climates, Torquay, UK, 21–25 September 1992. [Google Scholar]
  17. Harith, I.K.; Hassan, M.S.; Hasan, S.S. Liquid nitrogen effect on the fresh concrete properties in hot weathering concrete. Innov. Infrastruct. Solut. 2022, 7, 127. [Google Scholar] [CrossRef]
  18. John, G.; Kaufman, A.; Sumodjo, F. Precooling Mass Concrete, Concrete Construction. 2005, 8. pp. 36–40. Available online: https://www.concreteconstruction.net/how-to/materials/precooling-mass-concrete_o (accessed on 21 December 2021).
  19. Basham, K. How to Plan and Manage Curing for Mass Concrete Pours. 29 July 2014. Available online: www.forconstructionpros.com/concrete/equipmentproducts/article/11598829/how-to-plan-and-manage-curing-for-mass-concrete-pours (accessed on 29 January 2022).
  20. Bamforth, P.B. Early-Age Thermal Crack Control in Concrete; CIRIA Report C660; Construction, Built Environment, Civil Engineering: London, UK, 2007. [Google Scholar]
  21. Wang, Y.; Liu, F.; Xu, L.; Zhao, H. Effect of elevated temperatures and cooling methods on strength of concrete made with coarse and fine recycled concrete aggregates. Constr. Build. Mater. 2019, 210, 540–547. [Google Scholar] [CrossRef]
  22. Tasri, A.; Susilawati, A. Effect of cooling water temperature and space between cooling pipes of post-cooling system on temperature and thermal stress in mass concrete. J. Build. Eng. 2019, 24, 100731. [Google Scholar] [CrossRef]
  23. Ben Jemaa, R.; Mansouri, R.; Boukholda, I.; Bellagi, A. Energy and exergy investigation of R1234ze as R134a replacement in vapor compression chillers. Int. J. Hydrogen Energy 2017, 42, 12877–12887. [Google Scholar] [CrossRef]
  24. Alahmer, A.; Wang, X.; Al-Rbaihat, R.; Alam, K.C.A.; Saha, B.B. Performance evaluation of a solar adsorption chiller under different climatic conditions. Appl. Energy 2016, 175, 293–304. [Google Scholar] [CrossRef]
  25. Alahmer, A.; Ajib, S. Solar cooling technologies: State of art and perspectives. Energy Convers. Manag. 2020, 214, 112896. [Google Scholar] [CrossRef]
  26. Alahmer, A.; Alsaqoor, S. Energy efficient of Using Chilled Water System for Sustainable Health Care Facility Operating by Solar Photovoltaic Technology. Energy Procedia 2019, 156, 65–71. [Google Scholar] [CrossRef]
  27. Alahmer, A.; Alsaqoor, S. Simulation and optimization of multi-split variable refrigerant flow systems. Ain Shams Eng. J. 2018, 9, 1705–1715. [Google Scholar] [CrossRef]
  28. Alabdulkarem, A.; Eldeeb, R.; Hwang, Y.; Aute, V.; Radermacher, R. Testing, simulation and soft-optimization of R410A low-GWP alternatives in heat pump system. Int. J. Refrig. 2015, 60, 106–117. [Google Scholar] [CrossRef]
  29. Vali, S.S.; Setty, T.P.; Babu, A. Analytical computation of thermodynamic performance parameters of actual vapour compression refrigeration system with R22, R32, R134a, R152a, R290 and R1270. MATEC Web Conf. EDP Sci. 2018, 144, 4009. [Google Scholar] [CrossRef]
  30. Xu, X.; Hwang, Y.; Radermacher, R. Performance comparison of R410A and R32 in vapor injection cycles. Int. J. Refrig. 2013, 36, 892–903. [Google Scholar] [CrossRef]
  31. Tu, X.; Liang, X.; Zhuang, R. Study of R32 refrigerant for residential air-conditioning applications. In Proceedings of the 23rd International Congress of Refrigeration, Prague, Czech Republic, 21–26 August 2011; p. 259. [Google Scholar]
  32. Panato, V.H.; Pico, D.F.; Bandarra Filho, E.P. Experimental evaluation of R32, R452B and R454B as alternative refrigerants for R410A in a refrigeration system. Int. J. Refrig. 2021, in press. [Google Scholar] [CrossRef]
  33. Ahamed, J.U.; Saidur, R.; Masjuki, H.H. A review on exergy analysis of vapor compression refrigeration system. Renew. Sust. Energ. Rev. 2011, 15, 1593–1600. [Google Scholar] [CrossRef]
  34. Fajar, T.B.; Bagas, P.R.; Ukhi, S.; Alhamid, M.I.; Lubis, A. Energy and exergy analysis of an R410A small vapor compression system retrofitted with R290. Case Stud. Therm. Eng. 2020, 21, 100671. [Google Scholar] [CrossRef]
  35. Al-Dabbasa, M.; Alahmer, A.; Mamkaghd, A.; Gomaae, M.R. Productivity enhancement of the solar still by using water cooled finned condensing pipe. Desalination Water Treat. 2021, 213, 35–43. [Google Scholar] [CrossRef]
  36. Alahmer, A.; Al-Dabbas, M.; Alsaqoor, S.; Al-Sarayreh, A. Utilizing of solar energy for extracting freshwater from atmospheric air, Appl. Sol. Energy 2018, 54, 110–118. [Google Scholar] [CrossRef]
  37. Chen, J.; Yu, J. Performance of a new refrigeration cycle using refrigerant mixture R32/R134a for residential air-conditioner applications. Energy Build. 2008, 40, 2022–2027. [Google Scholar] [CrossRef]
  38. Cheng, S.; Wang, S.; Liu, Z. Cycle performance of alternative refrigerants for domestic air-conditioning system based on a small finned tube heat exchanger. Appl. Therm. Eng. 2014, 64, 83–92. [Google Scholar] [CrossRef]
  39. Tian, Q.; Cai, D.; Ren, L.; Tang, W.; Xie, Y.; He, G.; Liu, F. An experimental investigation of refrigerant mixture R32/R290 as drop-in replacement for HFC410A in household air conditioners. Int. J. Refrig. 2015, 57, 216–228. [Google Scholar] [CrossRef]
  40. Bolaji, B.O. Experimental study of R152a and R32 to replace R134a in a domestic refrigerator. Energy 2010, 35, 3793–3798. [Google Scholar] [CrossRef]
Figure 1. Two pre-cooling concrete mixture methods in the massive concrete structure; (a) Continuous aggregate cooling system and a description of the aggregate hopper and supply duct system; (b) Chilled water system.
Energies 15 01129 g001
Figure 2. The layout of the refrigeration system setup is designed for a continuous aggregate cooling system.
Energies 15 01129 g002
Figure 3. Flow chart of an EES system modeling.
Energies 15 01129 g003
Figure 4. Validation of EES model; (a) validation of COP and cooling capacity of R22, (b) validation of mass flow rate of R22.
Energies 15 01129 g004
Figure 5. Variation of COP and cooling capacity versus evaporating temperature at constant condenser temperature 60 .
Energies 15 01129 g005
Figure 6. The effect of refrigerant mass flow rate on the evaporative temperature at constant condenser temperature 60 .
Energies 15 01129 g006
Figure 7. Variation of COP and cooling capacity versus condenser temperature at constant evaporative temperature −10 .
Energies 15 01129 g007
Table 1. Components and capital investment for the air aggregate cooling system.
ComponentNo. UnitsPropertiesInitial Investment per Unit or mInitial Investment (USD)
Duct7   m Insulated ducts56 USD / m 392
Compressors2Semi hermetic compressor Copeland, model D8DJ-600/-600x, full load capacity is 74 kW , the suction and discharge diameter are 3.1/8   in (9.843 mm) and 1.5/8   in (4.76 mm), respectively.11,284 USD / unit 22,568
Evaporators4Fins and tube Karyer Evaporator, Model: 4,501,421 heat capacity 75 kW . Each has heat transfer area 151 m 2 Inlet diameter 42   mm and outlet diameter 28 mm and the evaporators are connected in parallel.2540 USD / unit 10,160
Fan1Centrifugal fan Model RDY-1000 NICORTA input power 40 kW can increase the pressure up to 2200 Pa. Number of blades 11, impeller diameter 1002   mm and impeller weight 146 kg 6350 USD / unit 6350
Refrigerant135 LRefrigerant R227.31 USD / liter 987
Control and safety1
3
Control unit
Contactor 63 A
282 USD / unit
141 USD / unit
282
423
Pipes Cupper 80 m 24 USD / m 1920
Expansion valve4Thermostatic expansion valve Model: XC-726HW352B suitable for the evaporator heat capacity, Maximum operating pressure limit 35 psi (241 kPa).10 USD / unit 40
Condenser1Karyer Fins and tube condenser has a heat transfer capacity 450 kW9168 USD / unit 9168
Oil separator1100 L 1834 USD / unit 1834
Tank gas1150 L 2540 USD / unit 2540
Filter3Basic filter for particles size matter have a size ranging from 2.5 to 10 µ m and more4.23 USD / unit 13
Sight glass7Indicate too high moisture content and refrigerant deficiency, Working pressure up to 3500 kPa .8.5 USD / unit 60
Container1 2820 USD / unit 2820
Aggregate hopper1Dimensions 5600 × 1560 × 2760 mm 3 4230 USD/unit4230
Total63,787 USD
Table 2. Components and its capital investment for the chilled water system.
ComponentNo. UnitsPropertiesInitial Investment per Unit or mInitial Investment
USD
Chiller1Water chiller
Brand: YORK model YCAZ74BB3
65.1 nominal tons
Two refrigeration circuits
55 HP (40.45 kW) reciprocating hermetic Compressor
Condenser with two fans
Water volume max 250   GPM ( 1.136   m 3 / min )
Refrigerant R-22
98,732 USD/unit40,904
Water tank4Volume of stainless steel tank is 10 m3282011,280
Centrifugal pump1Horizontal centrifugal pump
Volume flow 0–1870 l / m ,
Pressure range 0–16 bar
Speed range 700–3500 rpm
Drive rating 0.37 kW–100   kW
JD2820
Pipes and valves 1834 USD2116
Total57,120
Table 3. The main physical and chemical characteristics of the selected refrigerants.
R22R32R410a
FormulaCHClF2Ch2F2Ch2F2 (50%) + CHF2CF3 (50%)
50% R32 + 50%R125
GroupHalocarbon (HCFC)HFOZeotropic mixture
Molecular Weight [kg/kmol]86.4752.02472.59
Critical Temperature [°C]96.1578.1171.35
Critical Pressure [kPa]499057824902
Critical Density [kg/m3]523.84424.00459.53
Boiling point at 1 ATM [°C]−40.8−51.65−51.5
Latent Heat of Vaporization at 25 °C [kJ/kg]182.74270.910190.6
Specific heat of liquid (25 °C) [kJ/kg.k]1.2571.941.69
Specific heat of vapor (101.3 kPa) [kJ/kg.k]0.6620.8480.822
Specific heat ratio (25 °C, 101.325 kPa) 1.1851.2521.175
Thermal conductivity (25 °C, saturated gas) [mW/(m·K)]11.412.415.5
Freezing Point [°C]−160−136−155
Density (25 °C, saturated liquid) [kg/m3]1191958.81061
Density (25 °C, saturated gas) [kg/m3]44.247.33965.6
Viscosity (25 °C, saturated liquid) [μPa·s]165.8121120.9
Viscosity (25 °C, saturated gas) [μPa·s]12.712.313.9
Solubility in water (25 °C, 101.325 kPa) [%]0.30.21Negligible
Ozone Depletion Potential (ODP)0.05500
Global Warming Potential (GWP)18106751725
FlammableA1
None
A2L
Mildly Flammable
Lower flammability limit (% vol.): 12.7
Upper flammability limit (% vol.): 33.4
A1
None
ToxicityNon-toxicNon-toxicAllowance exposure limit (AEL): 1000 ppm
very low toxicity
Table 4. List of sensors used in the experiment.
SensorsPropertiesUsage
T-type thermocouples (copper/constantan)Low temperature within a range between −200 °C to 200 °C and it has uncertainty ±0.15 °C.Measuring the temperatures of refrigerant
Infrared thermometer model Testo 830Operating temperature between −20 to +50 °C with accuracy ±2 °C or ±2% of mv and has 0.1 °C resolution.Measuring the temperature of aggregate
Fluid gauge pressure1% accuracy and can measure up to 500 psi (3447.4 kPa)The refrigerant gauge pressure
Volumetric flow meterMeasurement field 0–6 kg / s and ±0.2% uncertaintyThe refrigerant volumetric flow rates
The platinum resistance thermometer probeDantec 55P31with a wire has a diameter 10 µm and 1.25 mm long has a measuring range 0.05–500 m / s   used to measure the speed of the air and temperature.Measure the speed and temperature of the air after the cooling coils.
Table 5. Temperature and gauge pressure were monitored experimentally at various stages throughout the refrigeration cycle with a mass flow rate of 3.40   kg   s 1   inside the condenser.
State No.Pressure
(MPa)
Temperature
(°C)
State No.Pressure (MPa)Temperature
(°C)
12.1407590.067−35
22.13963100.068−35
31.70054110.067−10
41.50042120.066−10
51.20335130.067−10
61.00020140.067−10
70.067−35150.027−10
80.066−35
Table 6. Operating Conditions were employed in this study.
ParameterNominal ValueParametric Range
Condenser Temperature (°C)60 °C40 °C–70 °C
Evaporative Temperature (°C)−10 °C−15 °C–0 °C
Mass flow rates3.4 kg/s2–5 kg/s
Compressor efficiency0.8
Table 7. Comparison of current work of alternative refrigerants with other researcher’s work reported in the literature [30,31,37,38,39,40].
ReferenceRefrigerant UsedCOPCooling Capacity (CC)
Xu et al. [30]R410A, R32COPR32 > COPR410A
Improvement using R32 up to 9% compared to R410A
CCR32 > CCR410A
Improvement using R32 up to 10% compared to R410A
Tu et al. [31]R410A, R32COPR32 > COPR410A
Improvement using R32 up to 6% compared to R410A
CCR32 > CCR410A
Improvement using R32 up to 15% compared to R410A
Chen and Yu [37]mixture R32/R134A, R22COPR32/R134a > COPR22
Improvement using mixture R32/R134A in a range of 8–9% compared to R22
CCR32/R134a > CCR22
Improvement using R32/R134A up to 9.5% compared to R22
Cheng et al. [38]R32, R290, R22, R410ACOPR32 > COPR290 > COPR410A > COPR22
COP of R32 and R290 were higher than R22 by 26.8% and 20.4%, respectively.
COP of R32 and R290 were higher than R410A by 7.3% and 2.1% higher, respectively.
CCR32 > CCR290 > CCR410A > CCR22
CC of R32 is 20.7% and 4.2% higher than that of R22 and R410A, respectively
Tian et al. [39]mixture R32/R290, R410ACOPR410A > COPR32/R290
COP of mixture R32/R290 is 6.0% lower than that of R410A
COPR32/R290 > COPR410A
CC of the mixture R32/R290 is 6.1% higher than that of R410A
Bolaji [40]R152a, R32, R134ACOPR152A > COPR134A > COPR32
COP of R32 is 8.5% lower than that of R134A; COP of R152A is 4.7% higher than that of R134A
Current Study;
Alamayreh et al.
R22, R410A, R32COPR22 > COPR32 > COPR410A
COP for R22 is better in comparison to R32 and R410A by 6.51% and 17.65%, respectively.
Improvement in COP using R32 up to 12% compared to R410A
CCR32 > CCR410A > CCR22
CC of R32 is 37.6% and 20% higher than that of R22 and R410A, respectively
Publisher’s Note: MDPI stays neutral with regard to jurisdictional claims in published maps and institutional affiliations.

