Article

Resource Efficiency and Thermal Comfort of 3D Printable Concrete Building Envelopes Optimized by Performance Enhancing Insulation: A Numerical Study

by
Blessing Onyeche Ayegba
1,
King-James Idala Egbe
2,
Ali Matin Nazar
2,
Mingzhi Huang
1 and
Mohammad Amin Hariri-Ardebili
3,4,*
1
School of Civil Engineering and Architecture, Wuhan University of Technology, Wuhan 430070, China
2
Institute of Port, Coastal and Offshore Engineering, Ocean College, Zhejiang University, Zhoushan 316021, China
3
Department of Civil Environmental and Architectural Engineering, University of Colorado, Boulder, CO 80309, USA
4
College of Computer, Mathematical and Natural Sciences, University of Maryland, College Park, MD 20742, USA
*
Author to whom correspondence should be addressed.
Energies 2022, 15(3), 1069; https://doi.org/10.3390/en15031069
Submission received: 5 January 2022 / Revised: 28 January 2022 / Accepted: 29 January 2022 / Published: 31 January 2022
(This article belongs to the Special Issue Advances in Energy-Efficient Buildings)

Abstract

:
3D concrete printing has gained tremendous popularity as a promising technique with the potential to remarkably push the boundaries of conventional concrete technology. Enormous research efforts have been directed towards improving the material properties and structural safety of 3D printed concrete (3DPC) over the last decade. In contrast, little attention has been accorded to its sustainability performance in the built environment. This study compares the energy efficiency, operational carbon emission, and thermal comfort of air cavity 3DPC building envelopes against insulated models. Four insulations, namely expanded polystyrene (EPS), extruded polystyrene (XPS), polyurethane foam (PUF), and fiberglass (FG), are iteratively paired with three different 3DPC mix designs, and their resulting performances are reported. A numerical optimization analysis is performed to obtain combinations of 3DPC building models and insulation with the least energy expenditure, carbon production, and thermal efficiency. The results indicate that insulation considerably enhances the overall environmental performance of 3DPC structures. The optimization process also demonstrates the potential of using 3D printable fiber reinforced engineered cementitious concrete (3DPFRECC) with polyurethane infill for amplified sustainable performance in modern construction.

Graphical Abstract

1. Introduction

In recent years, the prominent emphasis on the rapidly changing global climate and energy crisis has necessitated increased research in sustainable construction technologies [1,2]. In this context, the advancement of extrusion-based additive manufacturing, also known as 3D concrete printing (3DCP), has gained momentum in the architecture, engineering, and construction (AEC) industry as a dominant option for a cleaner construction footprint [3,4,5,6]. The vote in favor of 3DCP is based on its potential to address the numerous environmental challenges attributed to the traditional construction methods: it drastically reduces labor and material costs, minimizes wastes, requires low mechanical energy, and cuts down construction time [7,8,9]. Additionally, this construction approach broadens the scope of geometrical freedom in building designs and allows for the modulation of materials and components to obtain optimal structural performance and functionalities [7,10]. However, the usual method of 3D concrete printing creates structures with heterogeneous and hollow features, which pose certain technological challenges to its practicality on large-scale applications [11]. Accordingly, numerous studies are underway to improve the mechanical performance of 3DPC for extensive utilization in the construction industry. Some of the pertinent issues under investigation in this context include the properties of 3D printable cementitious materials [12,13,14], precision and quality control [15], modification of material rheology and thixotropy [5], and anisotropic behavior in the mechanical properties of printed concrete [16,17].
The 3D concrete printing process essentially builds a physical object layer by layer based on a predefined digital model [1,18]. The essential material properties that have been found to influence the 3D additive construction are flowability, buildability, extrudability, and open time [11,16,19]. These properties constitute the major parameters on which several experiments are conducted globally using varied concrete mix designs. The materials used in the 3DPC mix essentially comprise binders such as ordinary Portland cement (OPC), or a combination of cement, fine aggregates, and admixtures such as fly ash and silica fume [10]. However, modified mixes have been developed using rheology-enhancing admixtures, reinforcing additives, and high-performing binder variants [5,16,20]. Other studies have investigated the methods of material placement, hydration control, and reinforcement appropriate for improving the 3D printable concrete [15,21]. In terms of mix proportions, a study on the effect of mineral admixtures on 3D printable concrete reported a water-cement ratio of 0.4 and a sand-binder to admixture ratio of 1:3 for an optimal mix [22]. Another study on cement self-compacting mix considers a water-cement ratio of 0.42 and a sand-binder ratio of 1.542 to be optimal for 3D printing [23]. Additionally, the characteristics of the 3D printer, such as its nozzle velocity, shape, and printing method on concrete performance, are the focus of other empirical studies [24,25].
However, advances towards a sustainable built environment are focused on improved technologies and material characteristics, overall energy efficiency, and ecosystem preservation [26]. Thus, in addition to fulfilling the strength requirement, the 3DPC building must be habitable and resource-efficient [11]. Although comprehensive research on the ecological impacts of 3DPC is limited, some investigative studies have revealed insufficient energy and thermal efficiencies and high percentages of carbon emissions in 3DPC compared to conventional concrete envelopes [10,11]. Robati et al. [27] examined the correlation between the 3DPC mix design and its resultant thermal performance. The outcome showed that the thermal efficiency of 3D printable concrete is significantly influenced by the mix design, particularly its aggregate mass and material proportion. A recent analysis by He et al. [7] revealed that the energy efficiency and thermal comfort of 3D printed structures could be enhanced through hybridization and integration with existing technologies. In the research, a modular 3D printed vertical concrete green wall system (3D-VtGW) was developed and assembled with 3D printed multifunctional wall elements, which served a dual purpose as the building envelope and the bearer of an external green wall system. The prototype significantly reduced the exterior wall surface temperature and exhibited notable energy-saving potentials. Further, the literature has described the development and application of insulation to building envelopes to reduce energy consumption and greenhouse emissions (GHG) in modern construction [28,29,30,31]. The most widely used insulating materials reported are expanded polystyrene (EPS), fiberglass, and polyurethane foam (PUF) [32]. These infills have been integrated into the material repository of prominent building information and energy performance modeling software. However, there is a limited investigation on these insulating materials’ effect on the energy efficiency and carbon emissions of 3DPC building envelopes.
To obtain a more extensive evaluation of the behavior of insulated 3DPC, it is imperative to quantify the effects of insulation on the sustainability performance of 3DPC structures. It is carried out by investigating optimal combinations of insulation and concrete walls, which result in the least damage to the built environment. Accordingly, this paper examines the energy efficiency, carbon emissions, and thermal comfort of three insulated 3DPC walls with distinct mix designs. An optimization analysis is conducted, and conclusions are drawn based on the wall and infill combination with the most period of thermal comfort and the least percentage of energy expenditure and carbon emissions.

2. Materials and Methods

This study aims to obtain an optimized combination of 3DPC wall and insulating material, demonstrating higher thermal and energy efficiencies and reduced carbon emissions. To achieve this goal, each uninsulated 3DPC model is initially analyzed for its sustainability performance. It is then paired with different insulating materials. Finally, each combination’s resultant efficiency is evaluated based on an entire building performance analysis. Figure 1 presents the outline of the adopted methodology.

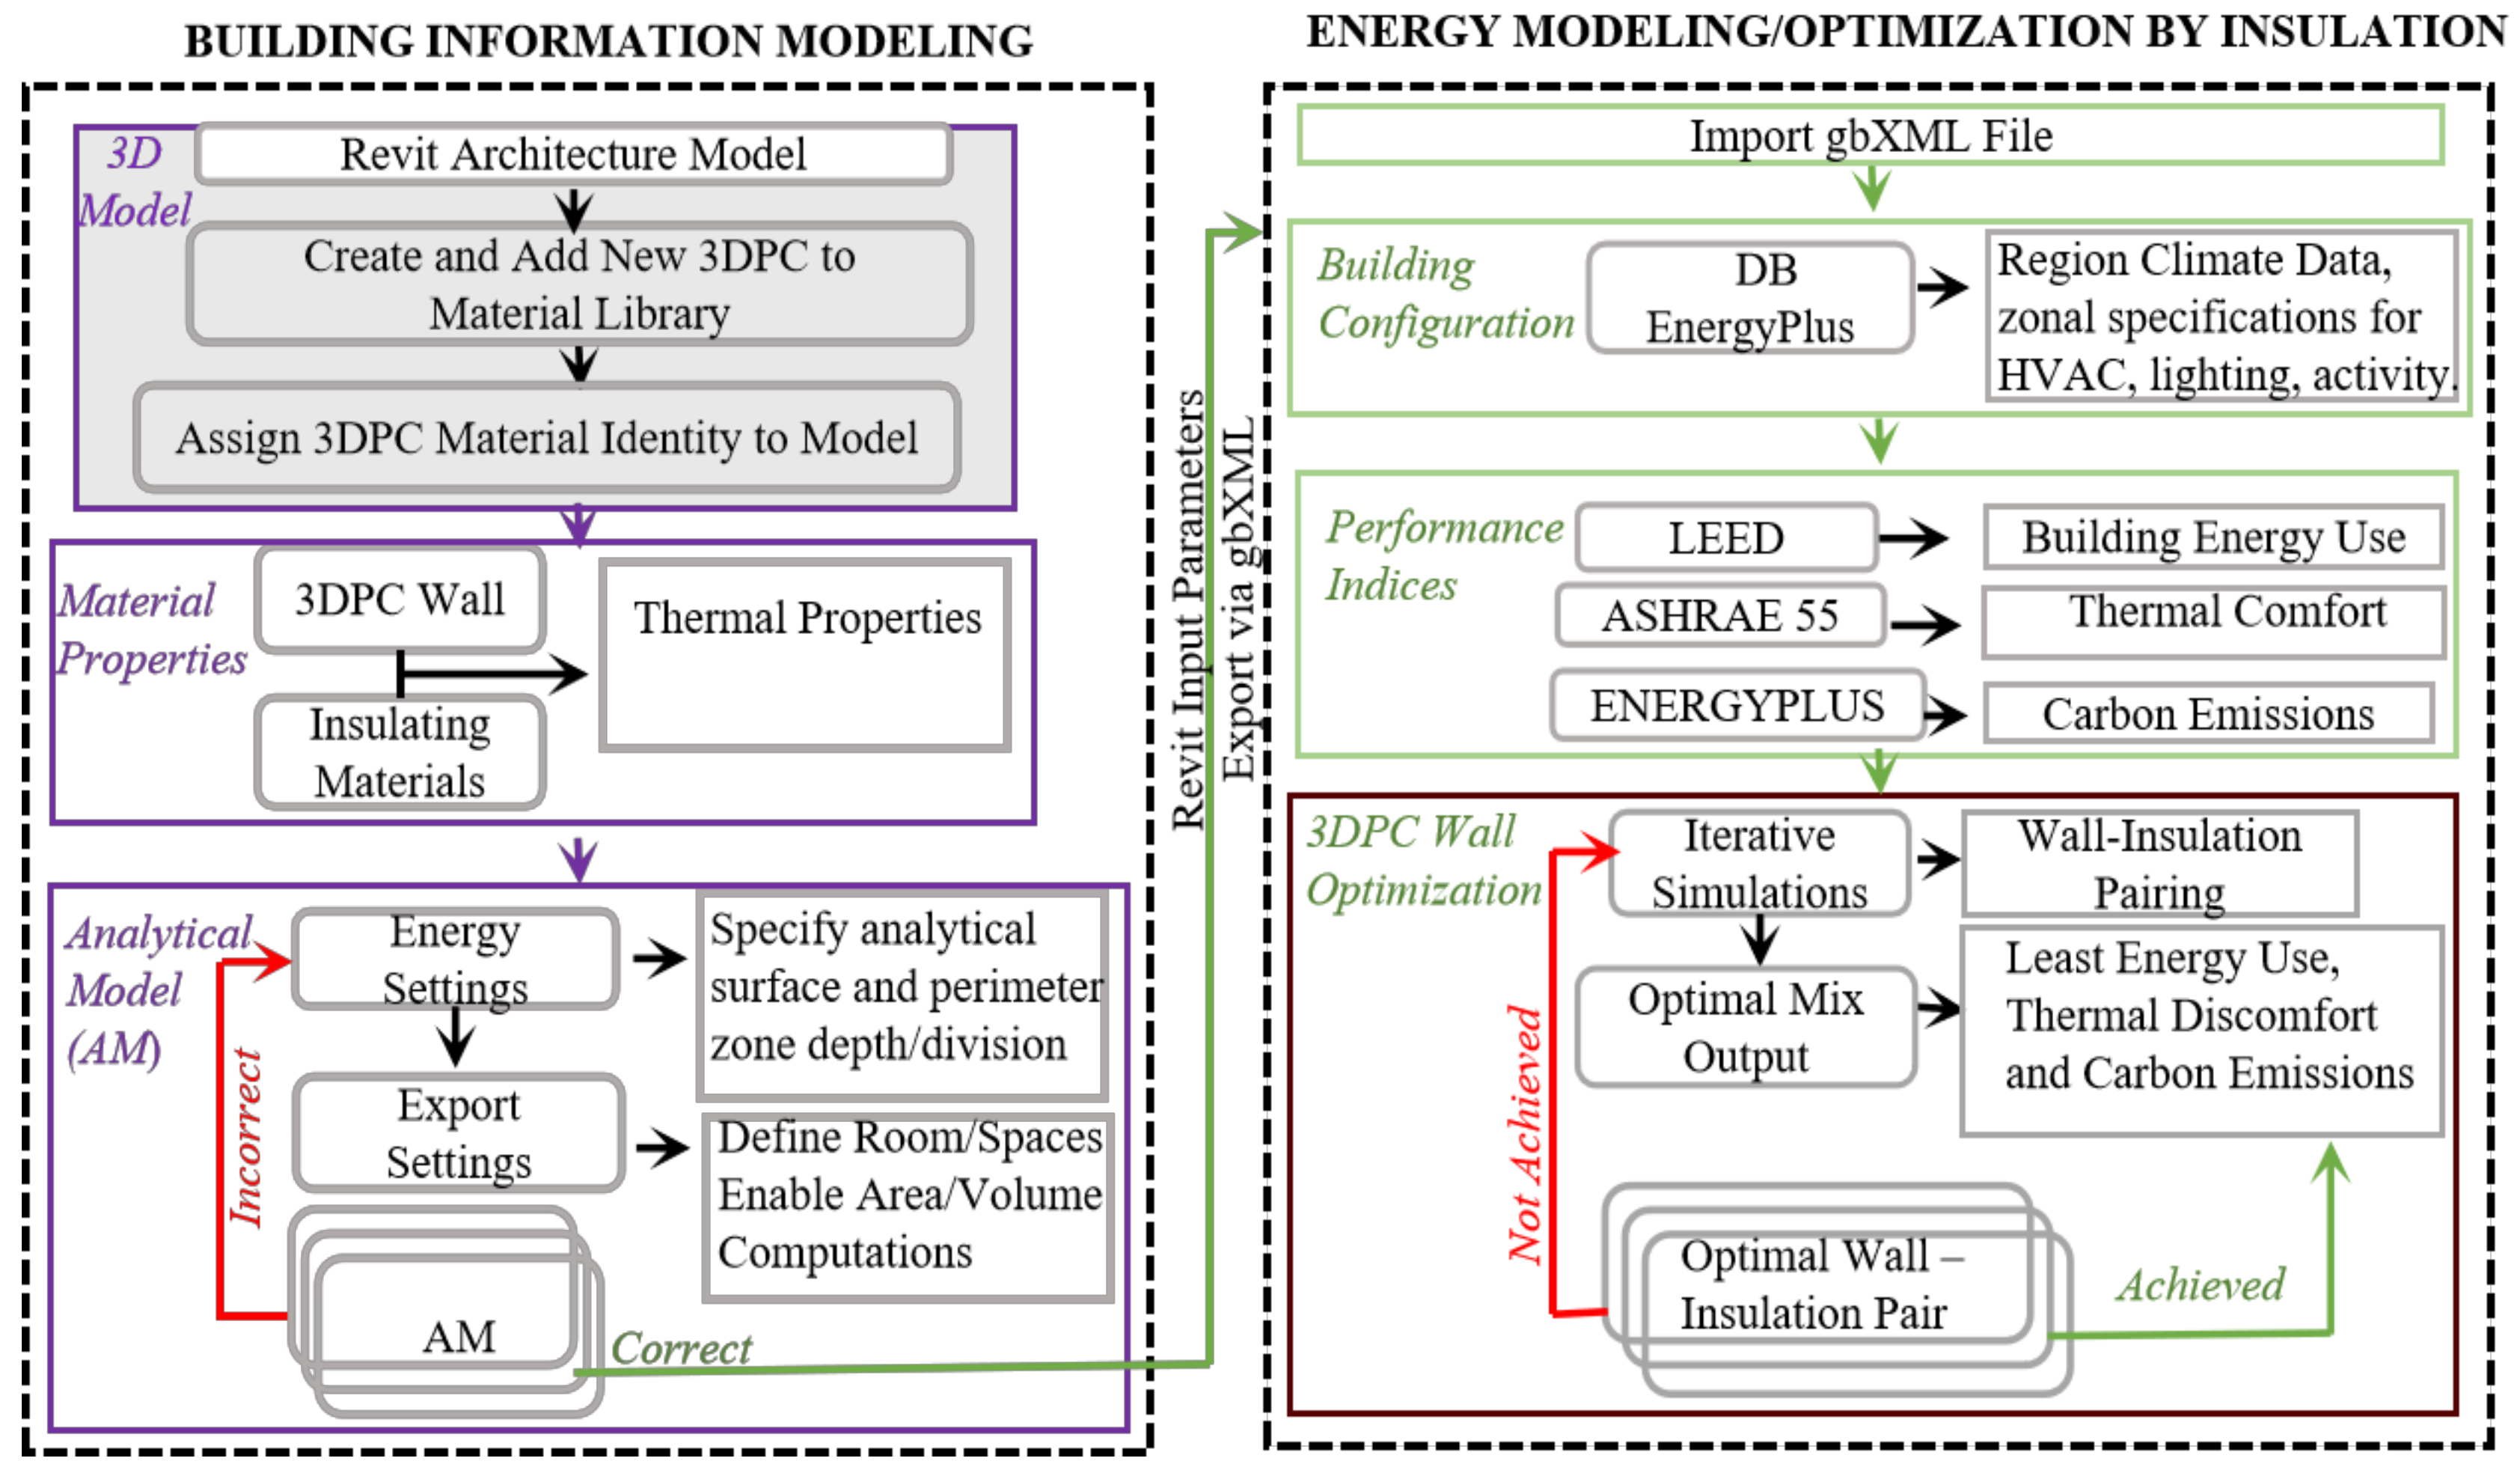
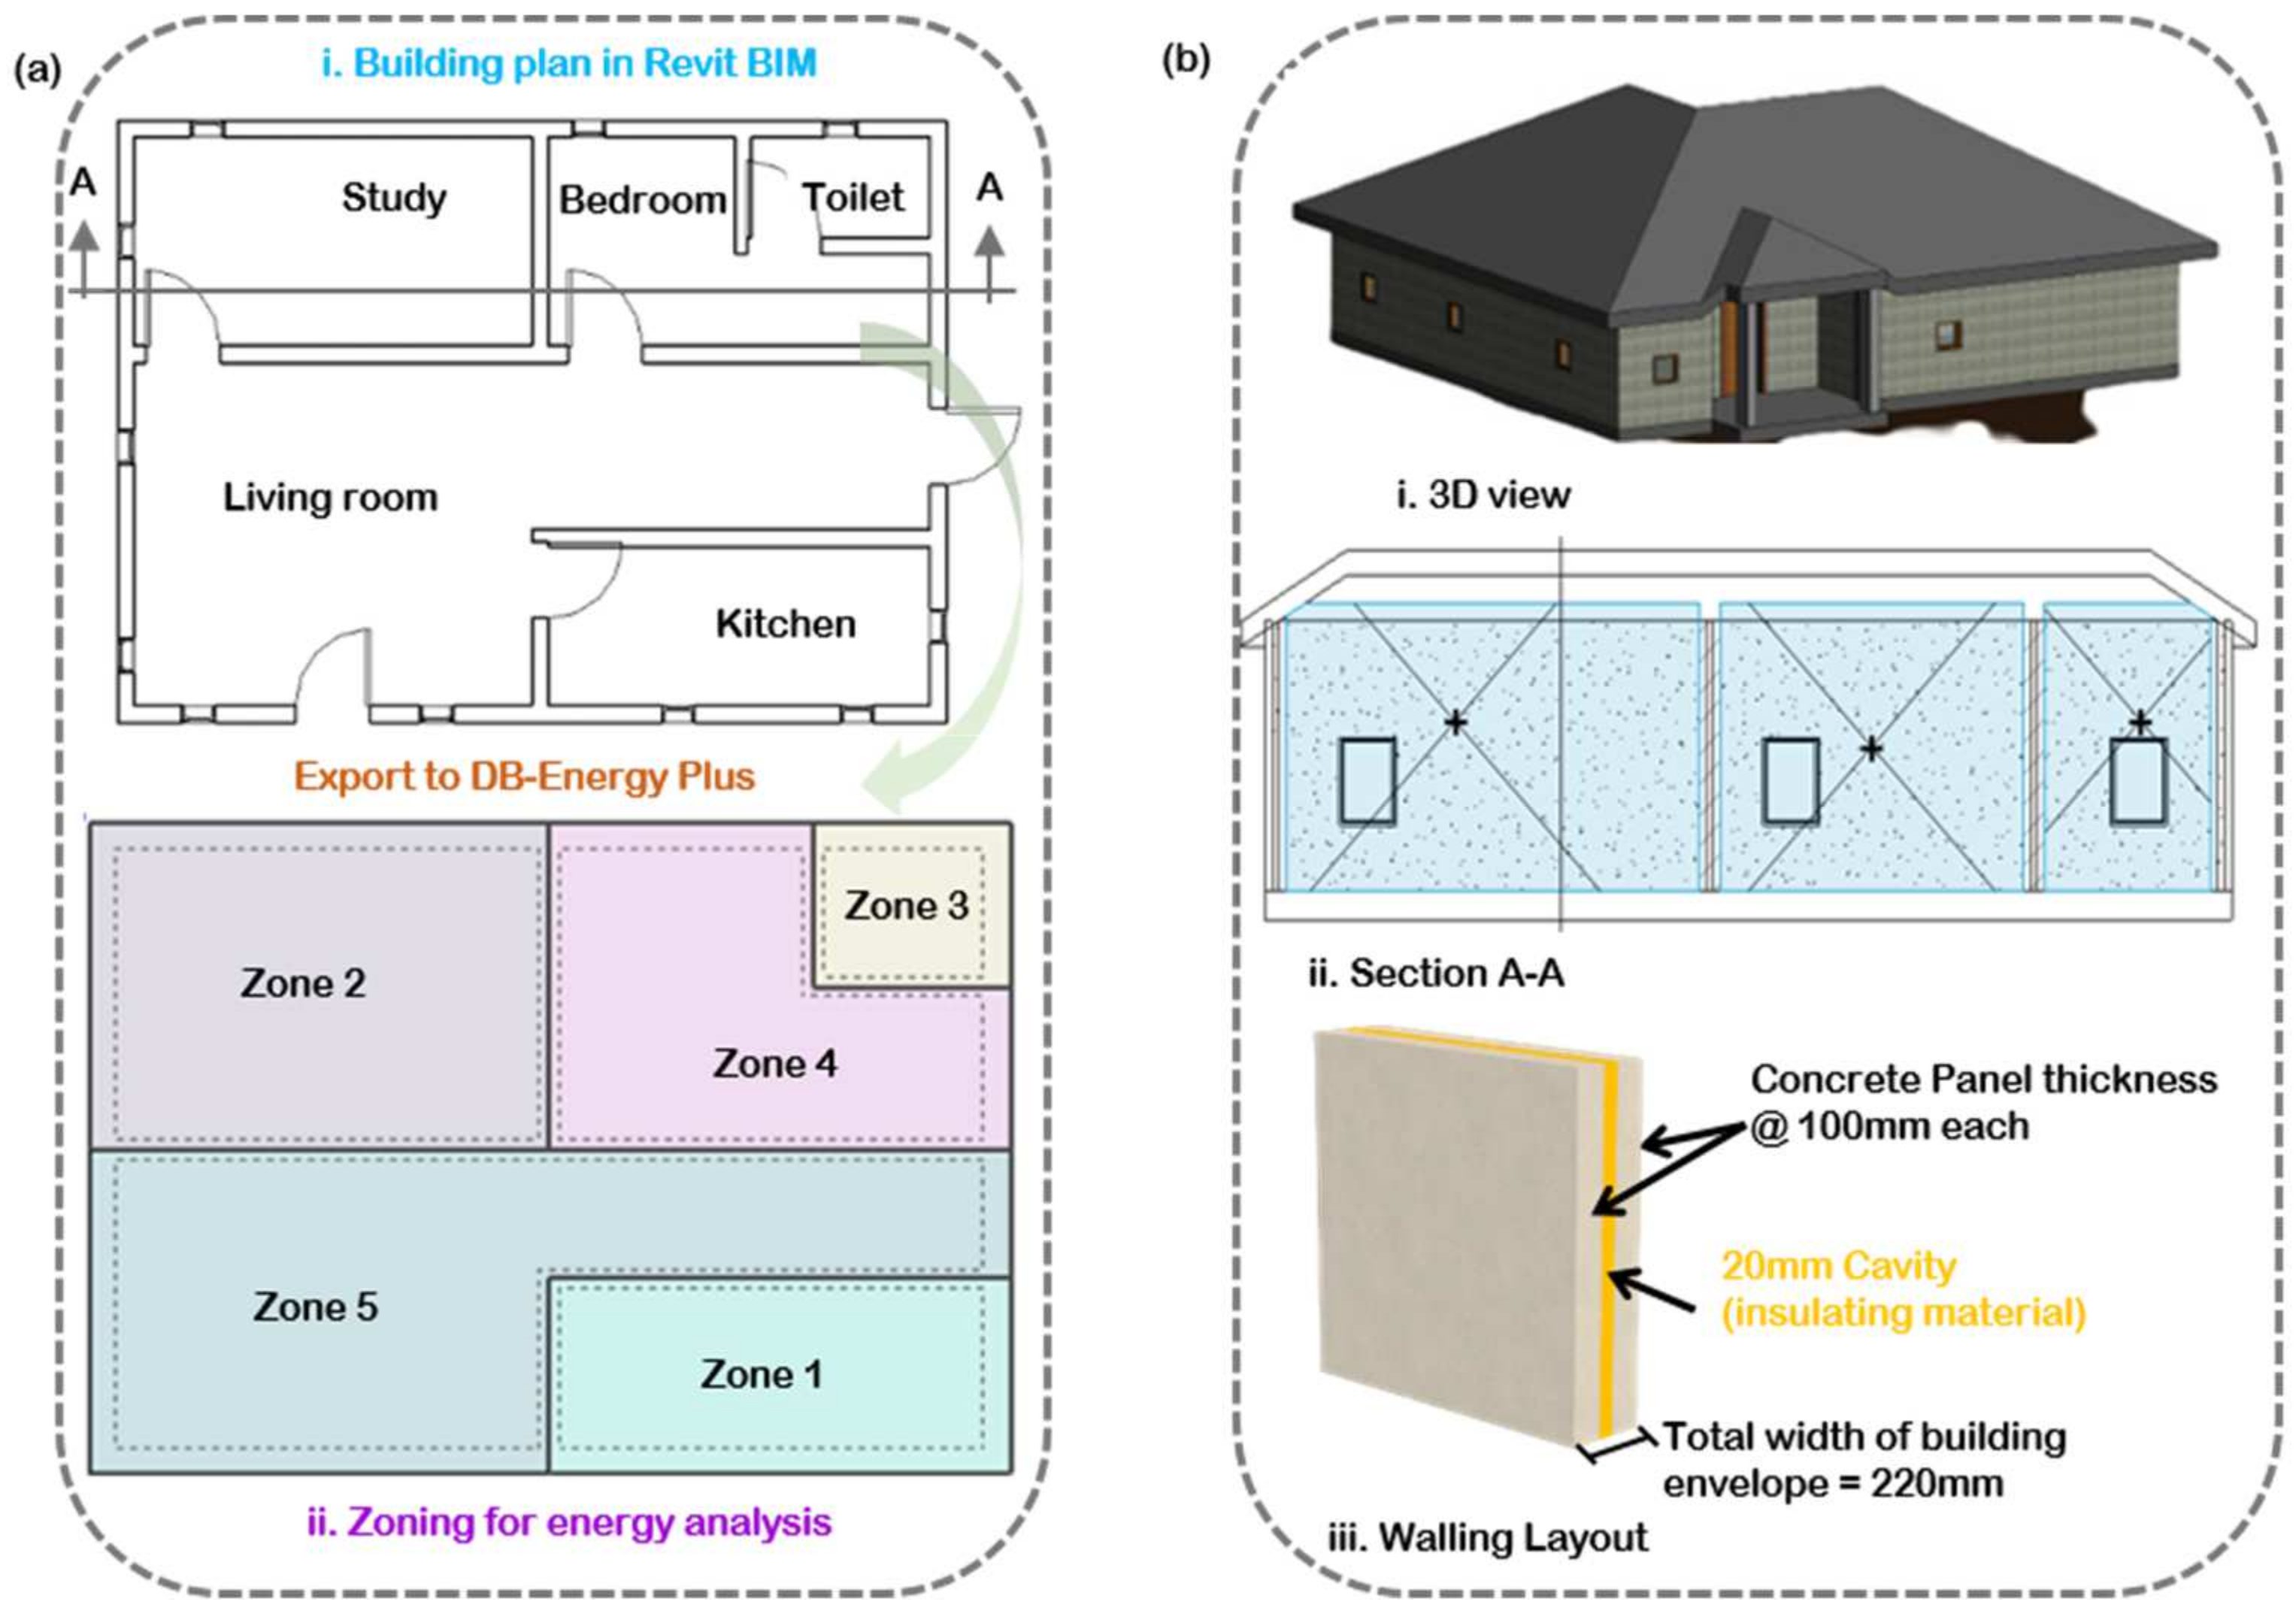
2.1. Model Development

A three-dimensional model of a residential building is developed on the Revit building information modeling (BIM) software. Revit is a widely used BIM tool with an interoperability function that enables building geometry and thermal data transfer to energy simulation tools via the Green Building XML (gbXML) schema [33]. Figure 2 illustrates the plan, zones, and walling layout of the building model. The literature indicates that numerous factors influence buildings’ energy and thermal efficiencies. These factors range from the composition and design of the building envelope to the external climatic conditions surrounding the building system [10,34,35]. However, the material composition of the building envelope is the only factor considered in this study. The walls account for up to 25–30% of energy loss [36]. Hence the external walls of the building model are the specific focus of this investigation.

2.2. DPC Mix Designs

At this stage of the methodology, the material composition and properties of the external walls are defined. As inferred from the literature, extensive research has been conducted to optimize the printability and post-print parameters of 3DPC using different variations in materials and mix proportions. Therefore, three distinct 3DPC mix designs were adopted in this study based on previous optimization experiments. The mix proportions of each prototype are presented in Table 1. The first prototype (Mix 1) is a printable high-performance fiber-reinforced fine aggregates (HPFRFA) mix [37,38]. It was developed as an optimal mix by researchers at Loughborough University. It was printed into a slab with a thickness of 200 mm, compressive strength of 110 MPa, and flexural strength of 13 MPa and 16 MPa in both directions.
The second mix design considered is the 3D printable fiber-reinforced cementitious concrete (3DPFRCC) with polyvinyl alcohol (PVA) fibers [19]. The prototype developed was a hollow L-shaped structure with 78 × 60 × 90 cm dimensions and was printed in 150 min. This result was found to demonstrate the excellent buildability and printability of the mix design. The third prototype (Mix 3) adopted in this study is a 3D printable fiber-reinforced engineered cementitious concrete (3DPFRECC) mix combined with three admixtures for improved thixotropic and rheological properties [39]. The additives comprised attapulgite nano clay (ANC), a hydroxypropyl methylcellulose viscosity modifying agent (VMA), and a polycarboxylate-based high-range water reducer (HRWR). The mix was printed into solid slabs, which exhibited 9.6% more ultimate strain than the cast concrete samples. Each mix design was used separately to model the base case residential building at a uniform wall thickness of 200 mm to observe the definitive influence of the different concrete mixes in the analysis.

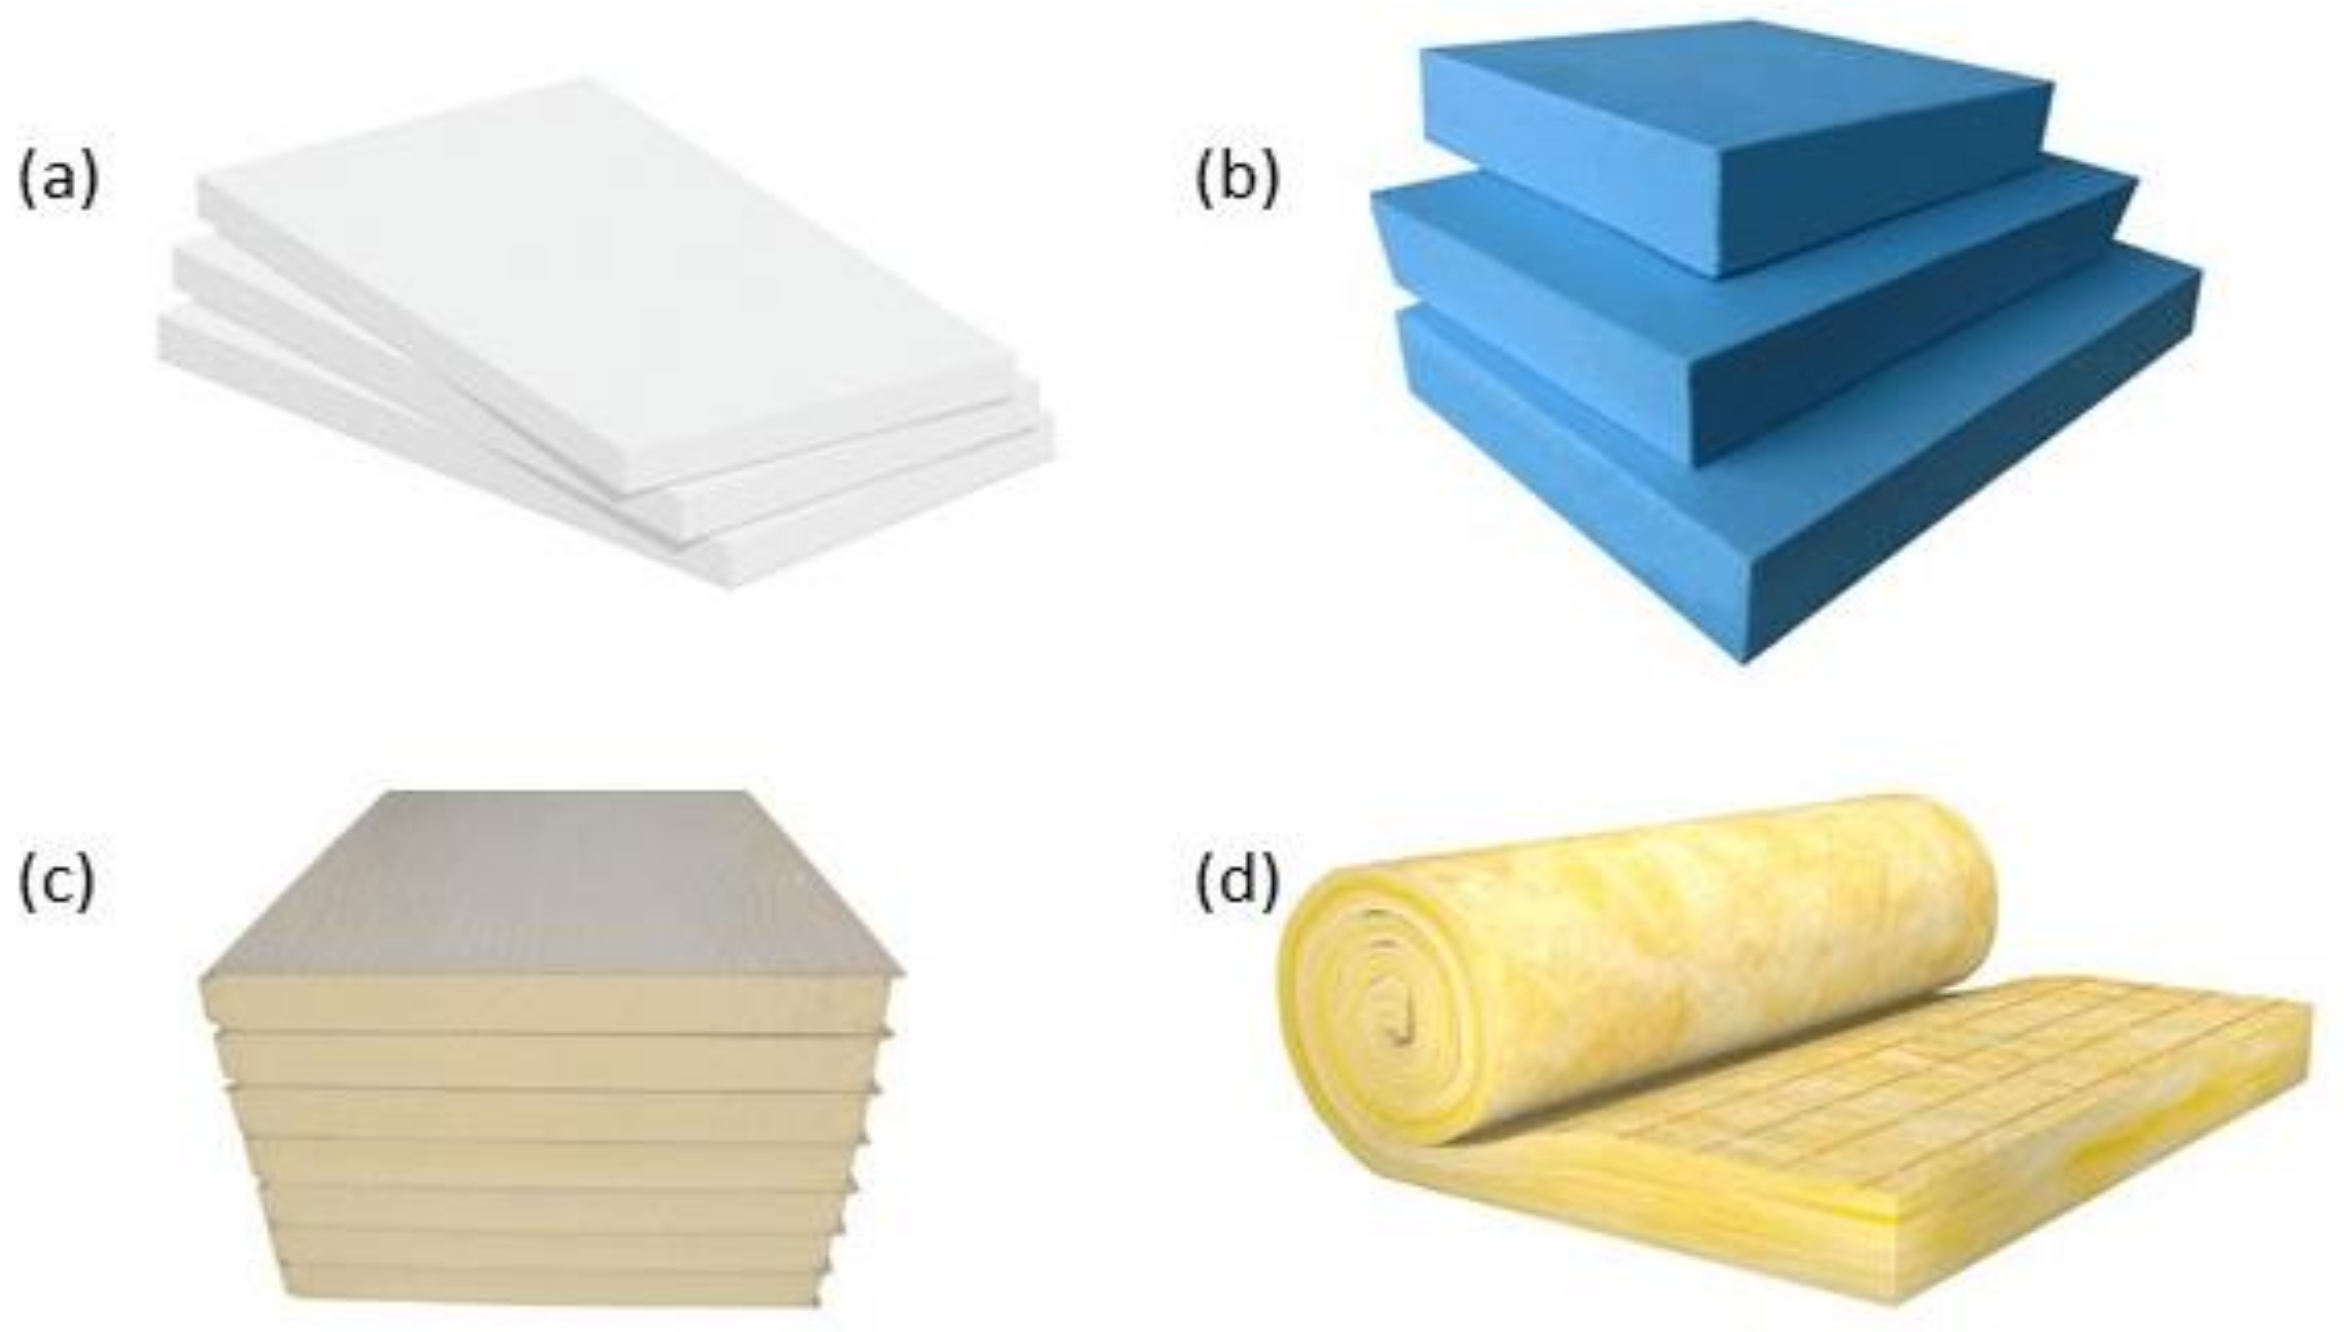
2.3. Insulation Materials

Building envelope insulation is vital for the thermal and energy efficiency of a building because the envelope accounts for 50–60% of total heat gained and lost in the structure [40]. The selection process of the insulation materials considered in this study is based on their life-cycle costs, reusability, and thermal, mechanical, and moisture resistant behavior. The four insulating materials selected in this study include expanded polystyrene (EPS), extruded polystyrene (XPS), polyurethane foam (PUF), and Fiberglass (FG) (Figure 3).
EPS is a well-established insulation material that has been extensively incorporated in various building applications as a lightweight concrete aggregate, decorative molding, backfilling, and as a core in panel application for buildings [41,42,43]. EPS is considered a durable and economical material characterized by its light yet rigid foam with good thermal insulation, impact resistance, load-bearing capacity at low weight, absolute water, and vapor barrier, and airtightness in controlled environments [41]. The extruded polystyrene foam (XPS) is a moisture-resistant material with a stable thermal resistivity value and high compressive strength and is peculiar for its recyclability [44]. Further, PUF has been widely used in thermal insulation in industrial fields due to its relatively low thermal conductivity, low density, and remarkable mechanical properties [45,46]. Fiberglass insulation, also known as glass wool, is an easily available, low-cost insulating material made by a typical combination of glass (35% or more of which is recycled glass), sand, soda ash, limestone, and other minerals. Fiberglass insulation has many applications in green building projects due to its good thermal, acoustic, and fire-safe qualities [47].

2.4. Thermal Transmittance of 3DPC Mix Designs

Thermal transmittance or U-value is an important parameter that influences the thermal environment of the building envelope. The U-value defines the ability of an element of structure to transmit heat under steady-state conditions [48]. This ability is dependent on the thickness and thermal conductivity(K-value) of the structure under consideration. To estimate the thermal transmittance of Mixes 1, 2, and 3, their thermal conductivities were first calculated using the prediction formula adopted from the experimental study by Kim et al. [49]. The thermal conductivity of a given mix design can be expressed as a function of the volume fraction of mix proportions, W/C ratio, temperature, and moisture conditions of concrete. The volumetric computation of aggregates in the mix designs was obtained to calculate their respective thermal transmittance (U-values). The absolute volume of fine aggregates was obtained from its mass and specific density as follows [50]:
A b s o l u t e   v o l u m e = Mass   of   loose   material   kg Specific   density   of   material × Density   of   Water   kg m 3
where the density of water is 1000 [kg/m3] (62.4 [lb/ft3]) at 4 °C (39°F). The specific gravity for cement, fine aggregate, silica fume, and fly ash is taken as 3.15, 2.59, 2.35, and 2.35, respectively [50].
Thus, the thermal conductivity of λ each mix design was predicted using the Equations (1) and (2) as follows:
λ = k r e f   0.293 + 1.01 A G × 0.8 × 1.62 1.54 W | C + 0.2 R h × 1.05 0.0025T ] × [ 0.86 + 0.0036 S | A ]
where λ = Thermal conductivity of concrete, AG = Volume fraction of aggregate in concrete, W/C = Water-cement ratio, Rh = Relative humidity, T = Temperature, S/A = Volume fraction of fine aggregate in concrete, and k r e f   is a referenced thermal conductivity measured from specimens at a condition of AG = 0.70, W/C = 0.4, S/A = 0.4, T = 20 °C, and Rh = 1.0.
The value of k r e f   is experimentally equal to 1. In the study by Kim et al. [49], the authors established a close relationship between the thermal conductivity of concrete predicted from Equation (2) and the measured values by achieving a sample correlation coefficient of 0.95, thus making the prediction model reasonable for heat conduction analysis of concrete elements. Moreso, Equation (2) was used to calculate the thermal conductivities of 3D printable concrete, M25 concrete, and first-class bricks based on average climatic conditions in Mumbai [10]. The base case building considered in this study is a single-story residential building with a built-up area of 1200 m2 and a panel thickness of 100 mm (combined thickness of 200 mm) based on conventional building models in China. The location-based climatic conditions used include an average external temperature of 21.5 °C and relative humidity of 78% over a typical meteorological year.
Thermal transmittance is expressed as the reciprocal of thermal resistance (R-value). The R-value is derived from the thermal conductivity and thickness as:
R = W a l l   t h i c k n e s s T h e r m a l   c o n d u c t i v i t y
λ = 1 R
The wall thickness of 200 mm was kept constant in the estimation of the R-value for each mix. Thus, using Equations (3) and (4), the U-values of mixes 1, 2, and 3 were obtained as 3.9 W/m2K, 3.8 W/m2K, and 2.6 W/m2K, respectively.

2.5. Energy Simulation and Optimization Analysis

The energy modeling software used to analyze the building performance of the model is the DesignBuilder EnergyPlus (DB-EnergyPlus) simulation package [51]. DB-EnergyPlus is a powerful energy modeling program that provides engineers and designers access to various environmental performance simulation capabilities, including whole-building energy consumption, daylighting, HVAC, and financial analysis [51]. The software is fully integrated with an enormous repository of location and weather files, geometry, construction and materials, thermal zones, occupancy operating schedules, and HVAC systems. Bernado et al. [52] utilized the DB-EnergyPlus tool in developing a calibrated energy simulation model of a school building to investigate the impact of improving its ventilation system on energy performance. Other researchers employed DB-EnergyPlus to analyze and optimize perforated double-skin facades and thermal bridges of vacuum insulation panels [53,54].
The properties of the materials and the building site information served as input data for the energy analysis tool. After creating a standard Revit Architecture model of the building, an analytical model (AM) was set up to generate a gbXML file. Preparation of the Revit analytical model is crucial to the success of the transition process. The analytical model is based on the definition of rooms and spaces, which are superimposed on the underlying Revit architectural model [51]. Next, the design was manually exported to DB-EnergyPlus using the Export gbXML dialog built into Revit. Next, the building model was partitioned into zones. Energy simulation outputs such as heat gains, emissions, daylighting, and energy use of each zone are visualized separately. To observe the specific influence of the input data on the behavior of the external walls, the default configurations and values of the other building features such as glazing, roof, and door specifications were maintained for each material combination analyzed. The input parameters used in the energy analysis are outlined in Table 2.
The energy efficiency indicator utilized in the analysis is the LEED energy expenditure evaluation. The specifications used to quantify thermal comfort are provided by the American Society of Heating, Refrigerating and Air-conditioning Engineers (ASHRAE Standard 55-2010) [55]. This standard predicts the thermal comfort of building spaces based on six environmental and personal factors: relative humidity, airspeed velocity, air temperature, radiant temperature, occupants’ clothing insulation, and metabolic rates. The DB-EnergyPlus simulation software was configured to compute thermal comfort based on the ASHRAE Standard 55 using the specified values for the given factors. The standard uses quantitative indices known as the Predictive Mean Vote (PMV) and Percentage of People Dissatisfied (PPD) to measure the degree of thermal neutrality experienced by a group of occupants based on a seven-point thermal sensation ranging from −3(Cold) to +3(Hot). ASHRAE 55 specifies that a space is considered thermally comfortable if at least 80% of its occupants can be expected not to object to the ambient condition, i.e., the majority experience thermal sensations between the range of −0.5 and +0.5 (Neutral) on the PMV scale.
The ASHRAE 55 Adaptive Comfort Model [55] was adopted to assess thermal comfort at both 80% and 90% acceptability limits and measure the number of occupied hours beyond the occupants’ thermal comfort zone. Table 3 presents the matrix of material combinations selected for optimization analysis.

3. Results and Discussion

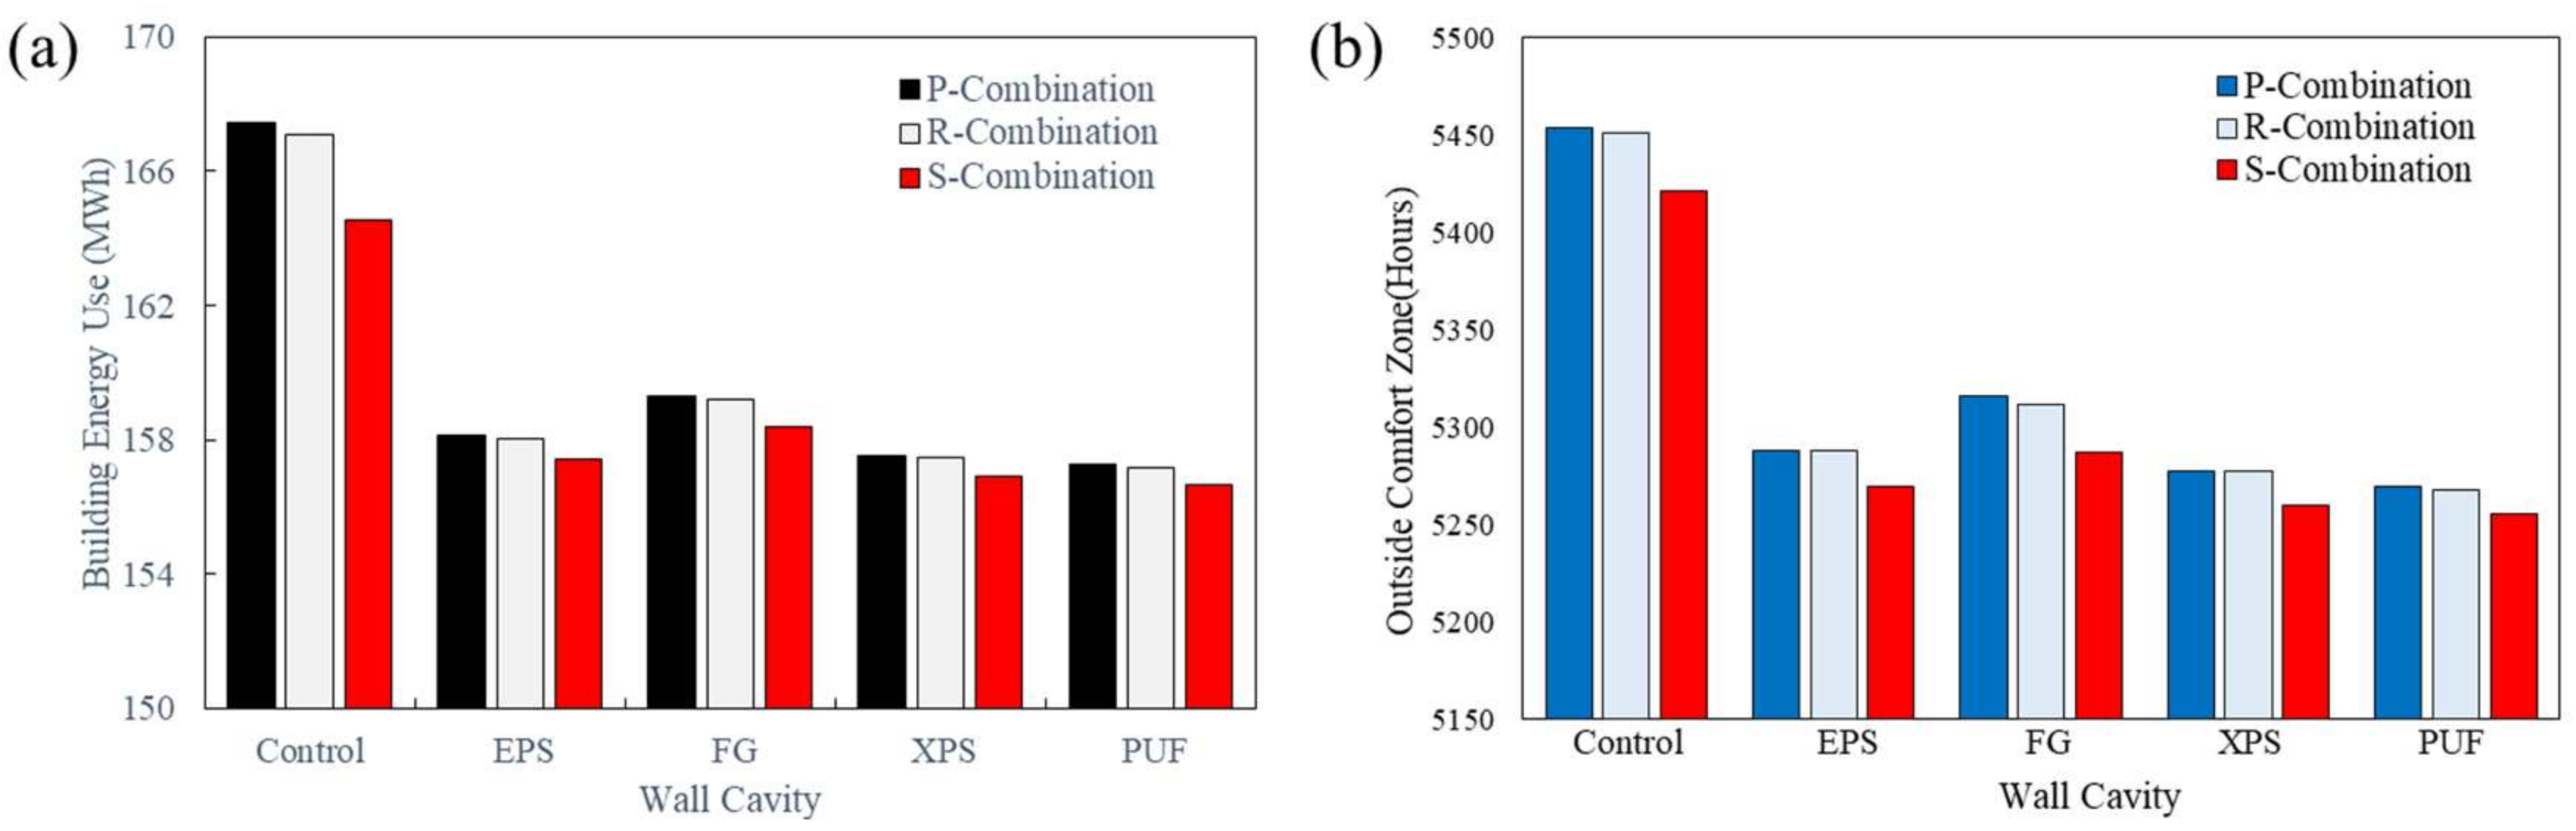
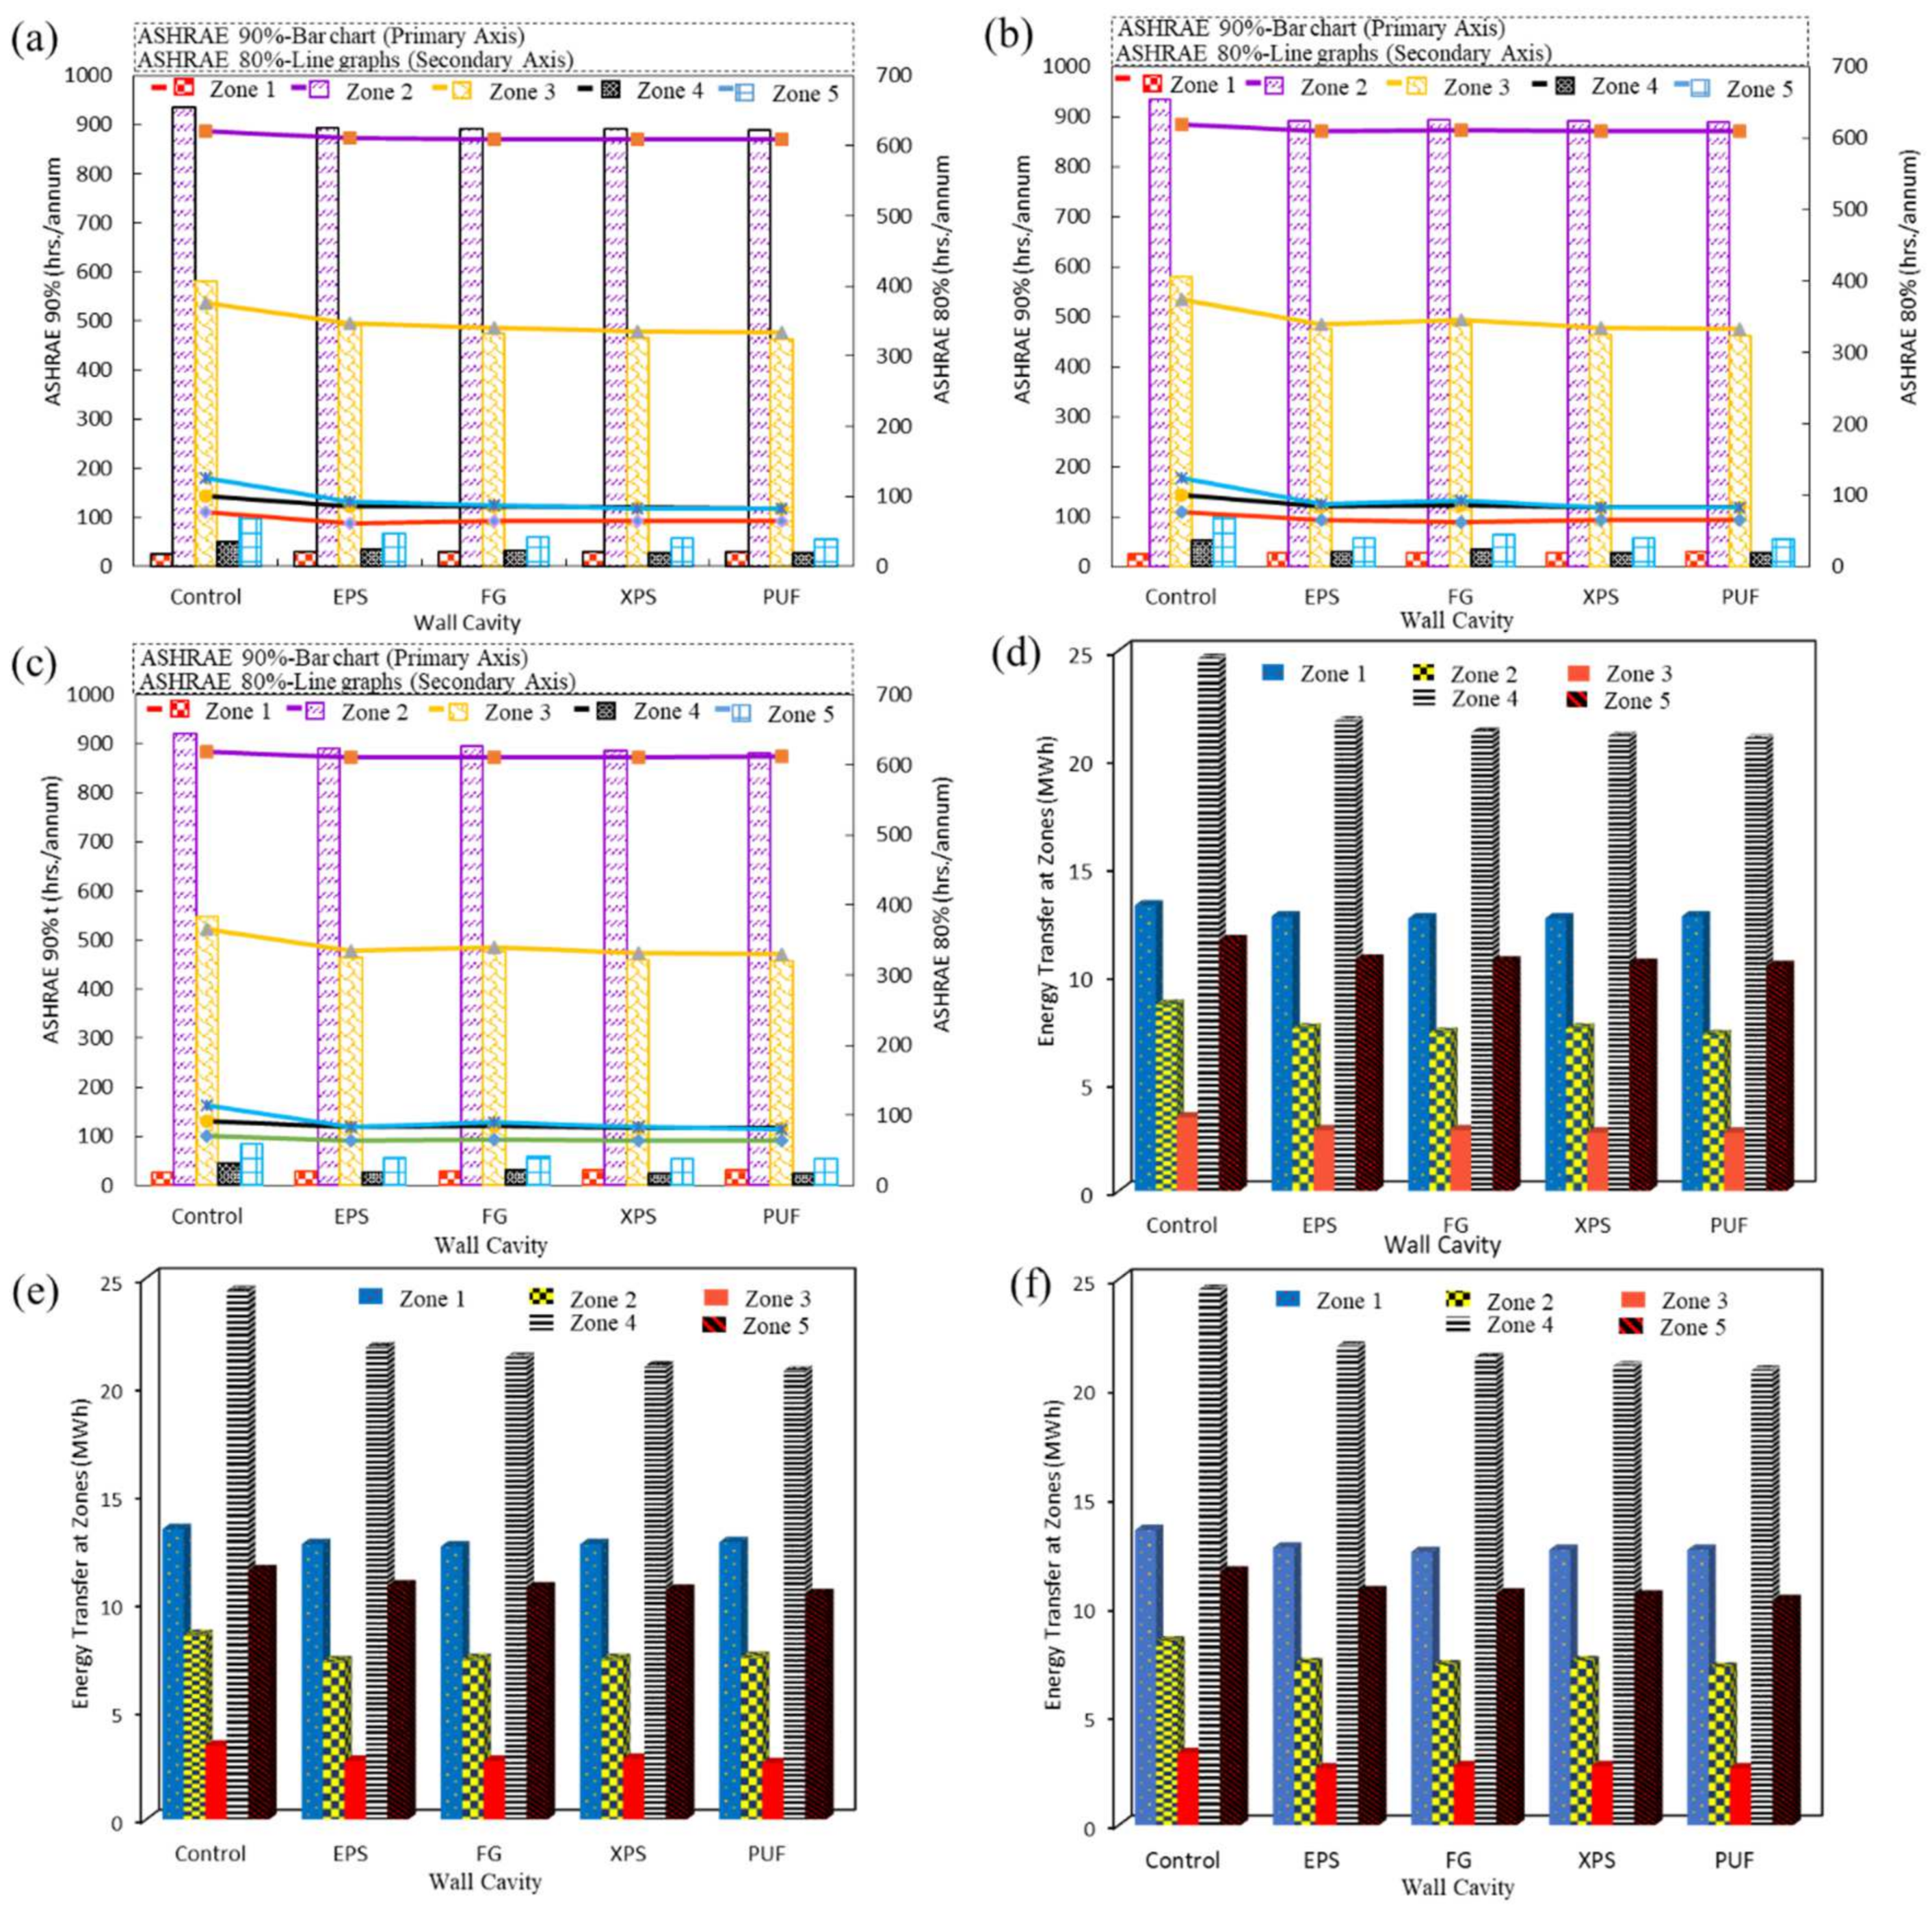
3.1. Energy Efficiency and Thermal Comfort Performance

Figure 4a illustrates the energy efficiency of insulated 3DPC building envelopes. The energy sources specified for this analysis are mainly electricity and natural gas. An evident difference can be observed in the energy expenditure between the insulated walls and the control models (P0, R0, and S0). This is indicative of higher operational energy demand by the air cavity walls. The insulation notably reduced the building energy use by an average of 8300 KW over a typical meteorological year. Moroever, FG-insulated walls expended more energy across the board in comparison to the other insulated models. The fiberglass infill used is the 20 mm thick R-22 with thermal conductivity of 0.0465 W/m.K. The EPS and XPS insulated envelopes show similar energy efficiency behaviors and are 1079 KW lower in annual energy consumption than the FG- insulated walls. The EPS and XPS insulating materials have thermal conductivity values of 0.035 W/m.K and 0.03 W/m.K, respectively, with the same thickness, which implies a 30% lower heat transfer rate than the fiberglass insulation. Interestingly, the thermal conductivity of the PU foam used is 0.028 Wm.K, and the PU-insulated envelopes expended 1900 KW of energy less than the FG-infilled walls. Obviously, the energy efficiency of the insulating materials is indicative of their thermal transmittance. Ultimately, InsS-4 was found to be the optimal combination with the least energy requirement, saving approximately 9500 KW more energy than the control models and 1400 KW more than insulated walls.
Figure 4b portrays the impact of insulation on the thermal performance of 3DPC walls. The observed trend among the insulated models is similar to their energy-saving performance. Typically, long periods of thermal discomfort require proportionate measures of energy expenditure for temperature regulation. The air cavity wall models averaged 160 h more discomfort hours than insulated walls, meaning that more hours of mechanical heating and cooling were required by the occupants within the uninsulated enclosure. All the walls insulated with polyurethane cut down occupants’ thermal discomfort hours by about 178 h compared to control models. Overall, the InsS-4 building required 187 h less mechanical cooling through the year than all three control models and showed only a slight decrease in discomfort hours among infilled models.
The adaptive thermal comfort and energy transfer results at the zone level are portrayed in Figure 5. The ASHRAE 55 Adaptive Comfort Model [55] was adopted to assess thermal comfort at both 80% and 90% acceptability limits. It uses the Predicted Mean Vote (PMV) to set the requirements for indoor thermal conditions, and it stipulates at least 80% of the occupants be satisfied with the prevailing thermal environment. Figure 5a–c shows the number of hours during which 80% and 90% of the occupants objected to the thermal condition at each zone for combinations P, R, and S. Zones 2 and 1 represent the spaces with the highest and least periods of thermal unacceptability. This is possibly due to the specified zone activities, lighting requirements, and equipment installments at the zoning stage of energy modeling. The effect of the wall insulation is relatively prominent at zone 2. The Zone 2 P0 wall in Figure 5a produced 38 more hours of thermal unacceptability than the Zone 2 InsS-4 wall.
As seen in Figure 5d–f, the general trend for zonal energy transfer shows that each insulated zone lost lowered amounts of energy through the building envelope in comparison to the uninsulated models. It is evident that zone 4 transferred the highest energy in apparent contrast to the other zones. This observation can be attributed to the initial zone specifications imputed at the start of the analysis process. The influence of the insulation is clearly visible at this zone, where the insulated envelopes transferred approximately 700 KW less energy through its surface when compared with the control models. Although all insulated models demonstrate roughly equal amounts of energy loss across the board, there is actually an estimated difference of 800 KW of energy transfer between all PU-walls than the other insulated models. Ultimately, mix 3 and PU insulation (InsS-4) revealed the least thermal energy loss, 3800 KW less energy transferred than the control wall at zone 2.

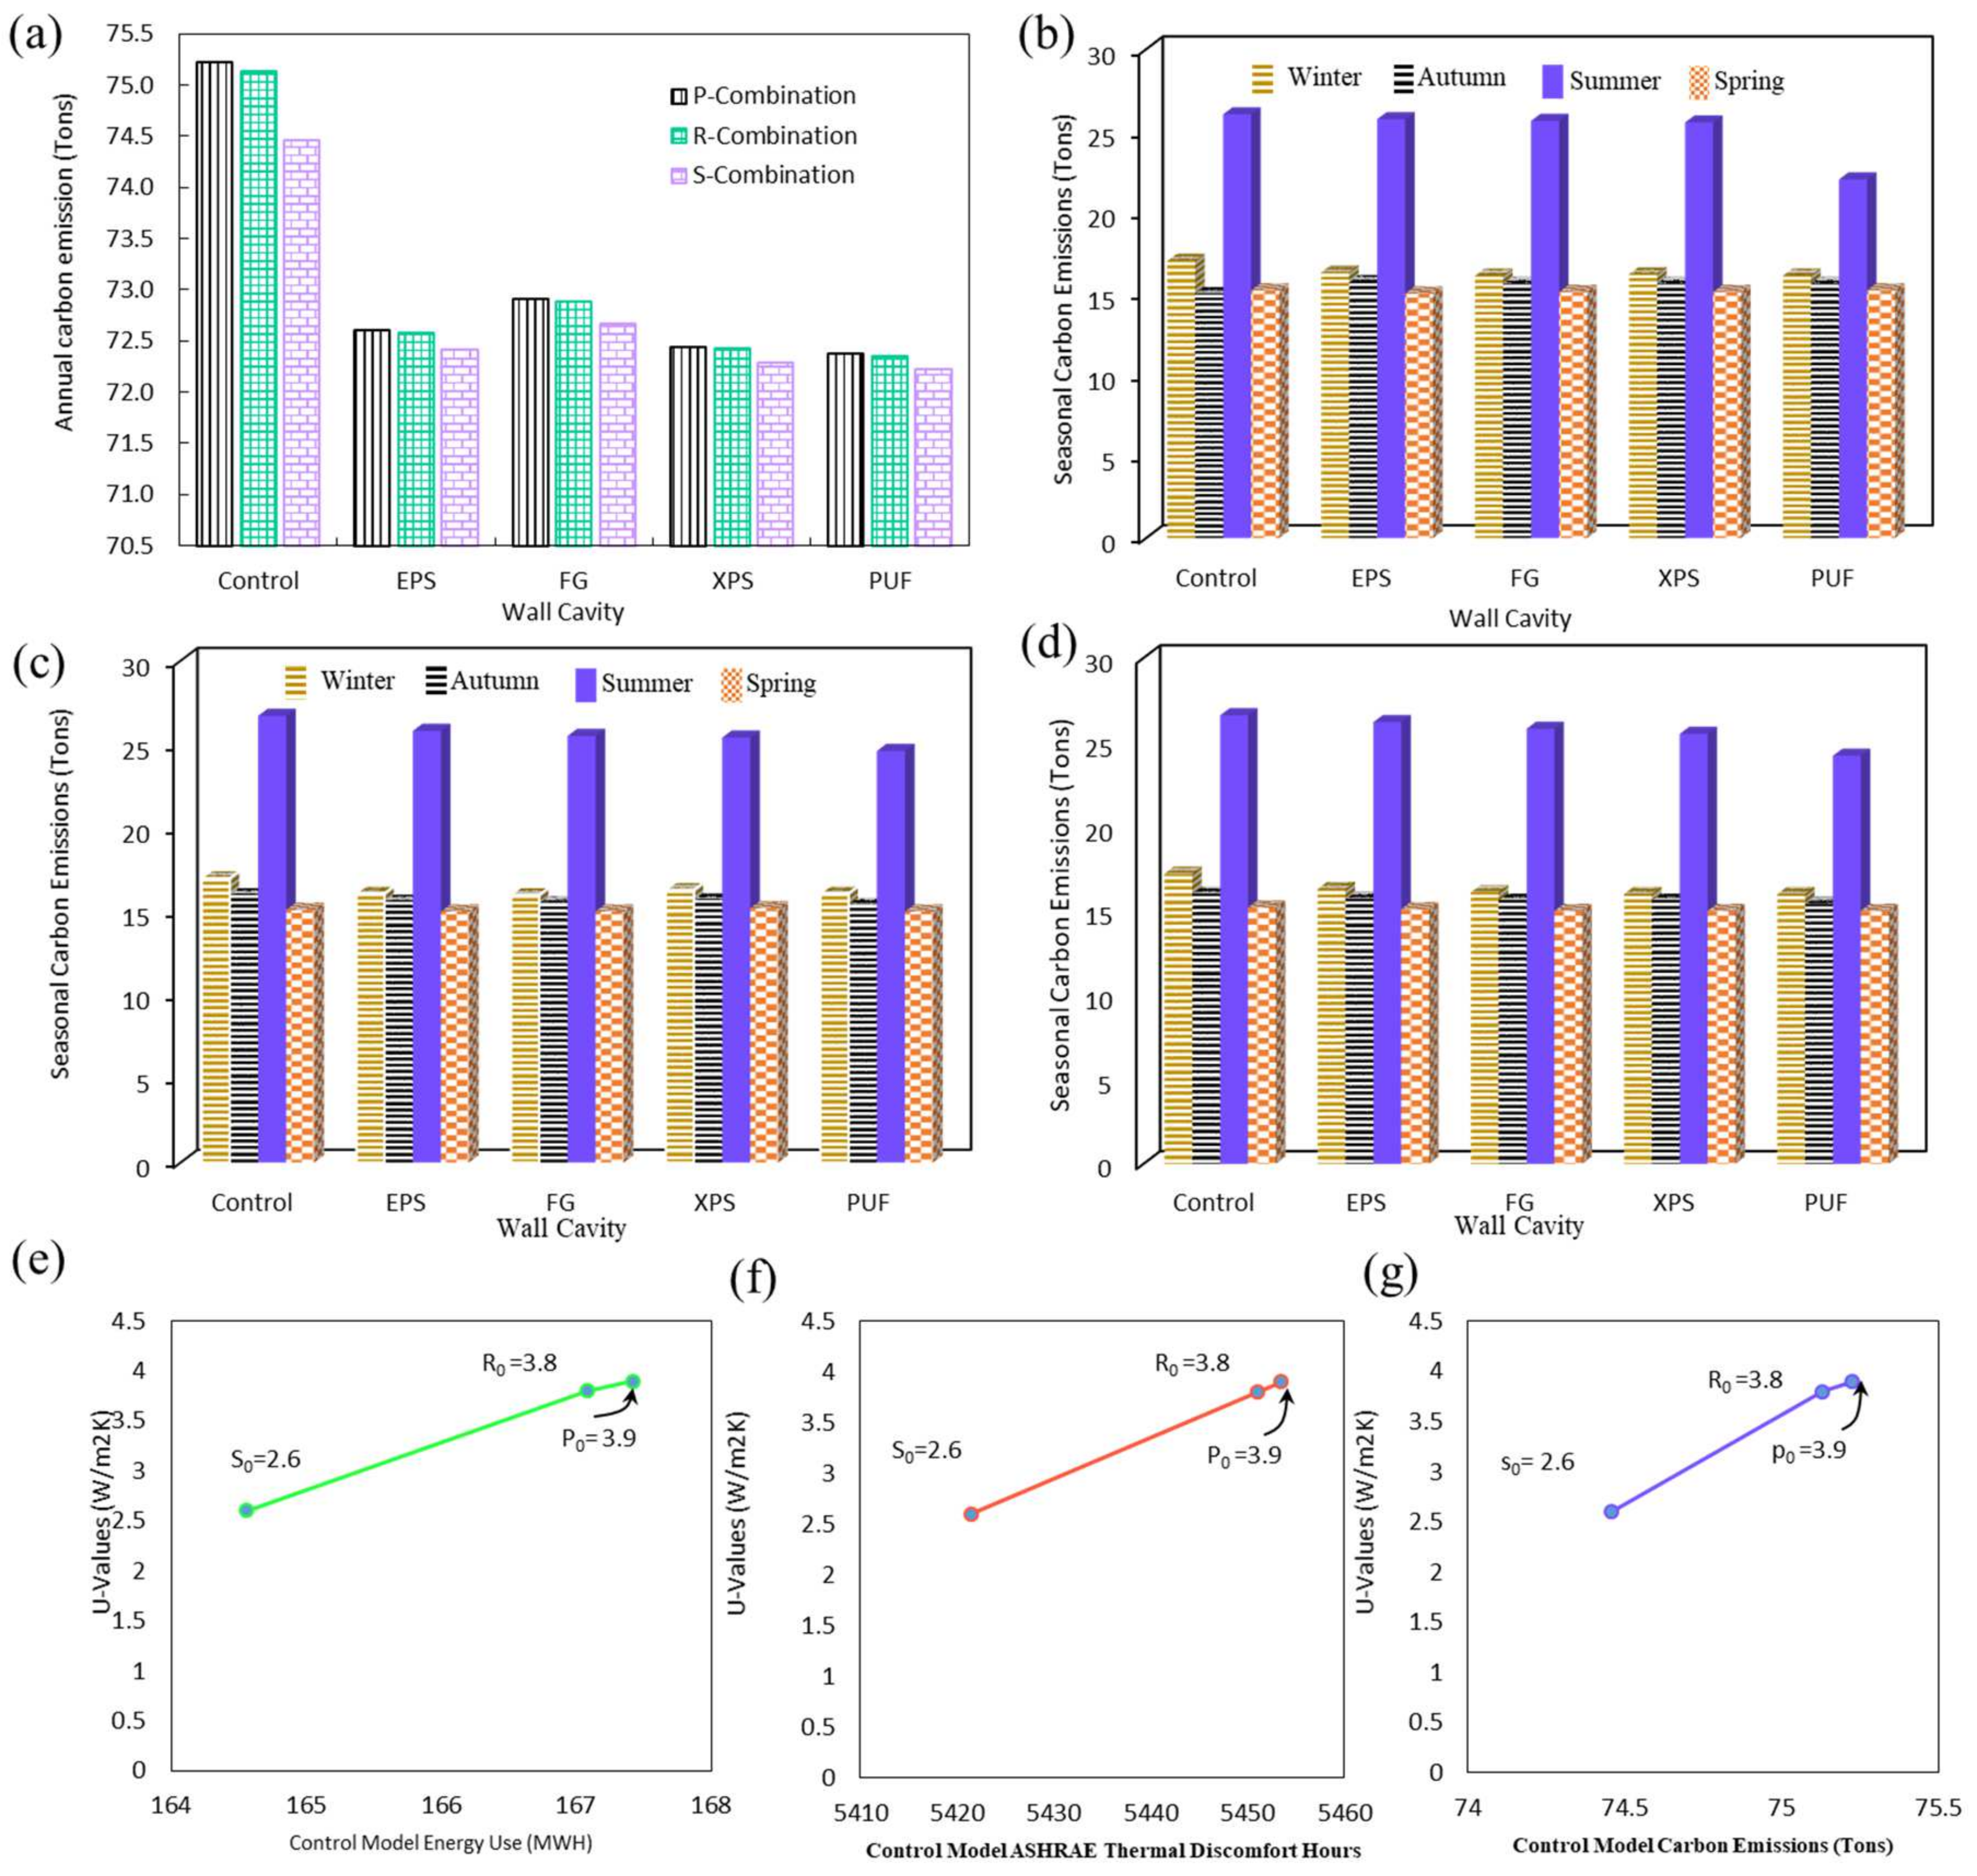
3.2. Operational Carbon Emissions

Figure 6a shows the overall effect of insulation on the operational carbon production of 3DPC walls. Operational carbon is a function of the fuel type and the efficiency of the energy systems used in the building. High carbon production can be attributed to correspondingly high operational energy use. Carbon emissions are visibly higher in control 3DPC walls than the models with cavity insulation. The result indicates that the carbon footprint of the control models is 2400 kg higher than the insulated combinations under the same building designs and climatic conditions. Further, the fiberglass-insulated cavity walls gave off slightly more emissions in the insulated wall category. From comparative computations, the FG-infilled walls emitted roughly 285 kg, 337 kg, and 504 kg more carbon than EPS, XPS, and PU-insulated walls, respectively. Moreover, the InsS-4 wall model produced approximately 2700 kg less carbon than P0, R0, and S0 walls.
The seasonal breakdown of carbon emissions shown in Figure 6b–d illustrates that carbon production is 1.5 times higher in summer than in other seasons in insulated and uninsulated walls. This is partly due to the increased space cooling energy consumption required in the notoriously humid subtropical climate of the building’s location, with dew points often reaching 26 °C or more. The analysis indicated that the InsS-4 combination lowered summer carbon emissions by an average of 2096 kg and 2800 kg compared to the insulated and uninsulated models, respectively. The infilled wall emissions in the other seasons show similar trends. However, closer observation shows that the PU-insulated combinations generally emit slightly lesser amounts of carbon when compared to insulated walls. Overall, the InsS-4 proved to be the optimal pair with the least annual and seasonal carbon production.

3.3. The U-Value Effect

Figure 6e–g illustrates the impact of thermal transmittance on the performance variations in energy and thermal efficiencies of mixes 1, 2, and 3. Only the uninsulated mixes (P0, R0, and S0) are considered to observe this correlation distinctly. Previous computations show that S0 has the lowest U-value at 2.6 Wm2/K. As a result, the output of annual energy use for wall S0 is 2863 KW and 2519 KW lower than those of P0 and R0, respectively. The same trend can be observed in the carbon emissions and thermal discomfort results, with S0 showing amplified sustainability performance than the other air cavity walls. On average, S0 produced 767 kg of carbon less than P0 and 674 kg less than R0 without insulation. By inference, 3DPC building envelopes with low U-values expend less energy to maintain comfortable conditions within the building, minimizing operational carbon emissions.

4. Conclusions

This study has described the sustainability behavior of insulated 3DPC wall cavities and the proposed combination of components for improved energy and thermal performance of printed building envelopes. The energy efficiency, operational carbon emissions, and thermal comfort performance of the digital 3D structure were analyzed with the DB-EnergyPlus modeling software and were observed to improve considerably when paired with insulating materials. Furthermore, optimization analysis was conducted to determine what combination of 3DPC mix design and insulation demonstrated amplified resource efficiency. The following conclusions have been drawn from this numerical study:
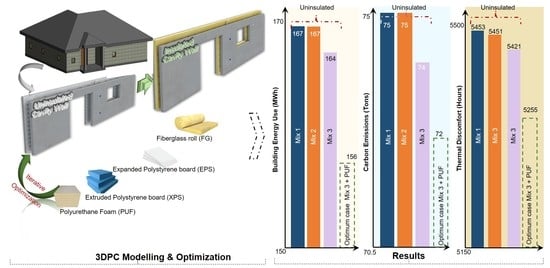
  • The polyurethane-insulated wall element saved approximately 9500 KW more energy than the uninsulated models and 1400 KW more than the walls with expanded polystyrene, extruded polystyrene, and fiberglass insulations.
  • The analysis also indicated that the PUF-insulated walls lowered summer carbon emissions by an average of 2096 kg and 2800 kg compared to the insulated and uninsulated models, respectively.
  • The PUF-insulated building required 187 h less mechanical cooling through the year than the uninsulated envelopes and showed a slight decrease in discomfort hours compared to other insulated models.
  • Additionally, the research showed that 3DPC building fabrics with low thermal transmittance make for more habitable and resource-efficient buildings.
  • Ultimately, the results characterize the energy-saving potential of PUF-insulated 3D Printed Fiber Reinforced Engineered Cementitious Concrete (3DPFRECC) walls as an optimal combination for sustainable construction. Although the variation in the ecological performance between the insulated and control 3DPC models seems marginal over a one-year span, the cumulative difference would add up to a significant amount of GHG emissions and energy use over the structure’s lifespan.
  • Based on the results in this study, it is safe to say that similar improvements in thermal and energy efficiency can be achieved by extending the applicability of polyurethane insulation to other concrete technologies such as cast-in-place concrete walls.
This study is not without its limitations. First, the exact experimental conditions and parameters used in the 3DPC mix designs adopted are not reproduced but only simulated and designed based on actual standards. Secondly, the analysis carried out in this work was totally dependent on the typical meteorological conditions of the building location under consideration. Additionally, this study focused only on the external walls of the building while adopting the default configurations of all other building components. Future research and developments are encouraged to improve the material composition of 3DPC with an increased focus on their thermal performance and ecological behavior with emerging insulation technologies.

Author Contributions

Conceptualization, B.O.A. and K.-J.I.E.; methodology, B.O.A.; software, B.O.A.; investigation, B.O.A., K.-J.I.E., M.H., A.M.N. and M.A.H.-A.; writing—original draft, B.O.A.; resources, M.A.H.-A.; data curation, B.O.A., K.-J.I.E., A.M.N. and M.A.H.-A.; writing—review and editing, K.-J.I.E., M.H., A.M.N. and M.A.H.-A.; supervision, M.A.H.-A. and M.H. All authors have read and agreed to the published version of the manuscript.

Funding

This research received no external funding.

Institutional Review Board Statement

Not applicable.

Informed Consent Statement

Not applicable.

Data Availability Statement

Not applicable.

Conflicts of Interest

The authors declare no conflict of interest.

References

  1. Bock, T. The Future of Construction Automation: Technological Disruption and the Upcoming Ubiquity of Robotics. Autom. Constr. 2015, 59, 113121. [Google Scholar] [CrossRef]
  2. Beyhan, F.; Selçuk, S.A. 3D Printing in Architecture: One Step Closer to a Sustainable Built Environment. Lect. Notes Civ. Eng. 2018, 20, 253–268. [Google Scholar]
  3. Anjum, T.; Dongre, P.; Misbah, F.; Nanyam, V.P.S.N. Purview of 3DP in the Indian Built Environment Sector. Procedia Eng. 2017, 196, 228–235. [Google Scholar] [CrossRef]
  4. Balletti, C.; Ballarin, M.; Guerra, F. 3D Printing: State-of-the-art and Future Perspectives. J. Cult. Herit. 2017, 26, 172–182. [Google Scholar] [CrossRef]
  5. Panda, B.; Tan, M.J. Experimental Study on Mix Proportion and Fresh Properties of Fly Ash Based Geopolymer for 3D Concrete Printing. Ceram. Int. 2018, 44, 10258–10265. [Google Scholar] [CrossRef]
  6. Suntharalingam, T.; Gatheeshgar, P.; Upasiri, I.; Poologanathan, K.; Nagaratnam, B.; Rajanayagam, H.; Navaratnam, S. Numerical Study of Fire and Energy Performance of Innovative Light-Weight 3D Printed Concrete Wall Configurations in Modular Building System. Sustainability 2021, 13, 2314. [Google Scholar] [CrossRef]
  7. He, Y.; Zhang, Y.; Zhang, C.; Zhou, H. Energy-Saving Potential of 3D Printed Concrete Building with Integrated Living Wall. Energy Build. 2020, 222, 110110. [Google Scholar] [CrossRef]
  8. Perkins, I.; Skitmore, M. Three-dimensional Printing in the Construction Industry: A Review. Int. J. Constr. Manag. 2015, 15, 1–9. [Google Scholar] [CrossRef] [Green Version]
  9. De Schutter, G.; Lesage, K.; Mechtcherine, V.; Nerella, V.N.; Habert, G.; Agusti, I.J. Vision of 3D Printing with Concrete—Technical, Economic and Environmental Potentials. Cem. Concr. Res. 2018, 112, 25–36. [Google Scholar] [CrossRef]
  10. Mahadevan, M.; Francis, A.; Thomas, A. A Simulation-Based Investigation of Sustainability Aspects of 3D Printed Structures. J. Build. Eng. 2020, 32, 101735. [Google Scholar] [CrossRef]
  11. Sun, J.; Xiao, J.; Li, Z.; Feng, X. Experimental Study on the Thermal Performance of a 3D Printed Concrete Prototype Building. Energy Build. 2021, 241, 110965. [Google Scholar] [CrossRef]
  12. Paul, S.C.; Van Zijl, G.P.; Tan, M.J.; Gibson, I. A Review of 3D Concrete Printing Systems and Materials Properties: Current Status and Future Research Prospects. Rapid Prototyp. J. 2018, 24, 784–798. [Google Scholar] [CrossRef] [Green Version]
  13. Rushing, T.S.; Stynoski, P.B.; Barna, L.A.; Al-Chaar, G.K.; Burroughs, J.F.; Shannon, J.D.; Kreiger, M.A.; Case, M.P. Investigation of Concrete Mixtures for Additive Construction. In 3D Concrete Printing Technology; Elsevier: Oxford, UK, 2019; pp. 137–160. [Google Scholar]
  14. Wolfs, R.; Bos, F.; Salet, T. Early Age Mechanical Behaviour of 3D Printed Concrete: Numerical Modelling and Experimental Testing. Cem. Concr. Res. 2018, 106, 103–116. [Google Scholar] [CrossRef]
  15. Zak, G.; Haberer, M.; Park, C.B.; Benhabib, B. Mechanical Properties of Short-Fibre Layered Composites: Prediction and Experiment. Rapid Prototyp. J. 2000, 6, 107–118. [Google Scholar] [CrossRef]
  16. Rehman, A.U.; Kim, J.H. 3D Concrete Printing: A Systematic Review of Rheology, Mix Designs, Mechanical, Microstructural, and Durability Characteristics. Materials 2021, 14, 3800. [Google Scholar] [CrossRef]
  17. Kim, K.; Park, S.; Kim, W.S.; Jeong, Y.; Lee, J. Evaluation of Shear Strength of RC Beams with Multiple Interfaces Formed Before Initial Setting Using 3D Printing Technology. Materials 2017, 10, 12. [Google Scholar] [CrossRef] [Green Version]
  18. Marais, H.; Christen, H.; Cho, S.; De Villiers, W.; Van Zijl, G. Computational Assessment of Thermal Performance of 3D Printed Concrete Wall Structures with Cavities. J. Build Eng. 2021, 41, 102431. [Google Scholar] [CrossRef]
  19. Weng, Y.; Li, M.; Liu, Z.; Lao, W.; Lu, B.; Zhang, D.; Tan, M.J. Printability and Fire Performance of a Developed 3D Printable Fiber Reinforced Cementitious Composites Under Elevated Temperatures. Virtual Phys. Prototyp. 2019, 14, 284–292. [Google Scholar] [CrossRef]
  20. Zhu, B.; Pan, J.; Nematollahi, B.; Zhou, Z.; Zhang, Y.; Sanjayan, J. Development of 3D Printable Engineered Cementitious Composites with Ultra-High Tensile Ductility for Digital Construction. Mater. Des. 2019, 181, 108088. [Google Scholar] [CrossRef]
  21. Wangler, T.; Lloret, E.; Reiter, L.; Hack, N.; Gramazio, F.; Kohler, M. Digital Concrete Opportunities and Challenges. RILEM Tech. Lett. 2016, 1, 67–75. [Google Scholar] [CrossRef]
  22. Inozemtcev, A.; Korolev, E.; Qui, D.T. Study of Mineral Additives for Cement Materials for 3D—Printing in Construction. IOP Conf. Ser. Mater. Sci. Eng. 2018, 356, 032009. [Google Scholar] [CrossRef]
  23. Nerella, V.; Näther, M.; Iqbal, A.; Butler, M.; Mechtcherine, V. Inline Quantification of Extrudability of Cementitious Materials for Digital Construction. Cem. Concr. Compos. 2019, 95, 260–270. [Google Scholar] [CrossRef]
  24. Malaeb, A.; Tourbah, F.; Hamzeh, O. 3D Concrete Printing: Machine and Mix Design. 3D Conc. Print. Technol. 2015, 1, 15–136. [Google Scholar]
  25. Kashani, A.; Ngo, T. Optimisation of Mixture Properties for 3D Printing of Geopolymer Concrete—Department of Infrastructure Engineering, The University of Melbourne, Australia. In Proceedings of the 35th ISARC, Berlin, Germany, 20–25 July 2018; pp. 259–266. [Google Scholar]
  26. Kaszyńska, M.; Skibicki, S.; Hoffmann, M. 3D Concrete Printing for Sustainable Construction. Energies 2020, 13, 6351. [Google Scholar] [CrossRef]
  27. Robati, M.; McCarthy, T.J.; Kokogiannakis, G. Incorporating Environmental Evaluation and Thermal Properties of Concrete Mix Designs. Constr. Build. Mater. 2016, 128, 422–435. [Google Scholar] [CrossRef] [Green Version]
  28. Wang, H.; Chiang, P.C.; Cai, Y.; Li, C.; Wang, X.; Chen, T.L.; Wei, S.; Huang, Q. Application of Wall and Insulation Materials on Green Building: A Review. Sustainability 2018, 10, 3331. [Google Scholar] [CrossRef] [Green Version]
  29. Zuo, J.; Zhao, Z.-Y. Green Building Research–Current Status and Future Agenda: A Review. Renew. Sustain. Energy Rev. 2014, 30, 271–281. [Google Scholar] [CrossRef]
  30. Roldan, L.V.; Perez, L.G.; Amores, L.F.; Ibarra, A. Potential Use of Vegetal Biomass as Insulation in Extreme Climates of Ecuador. Enfoque UTE 2015, 6, 23–41. [Google Scholar]
  31. Tangjuank, S. Thermal Insulation and Physical Properties of Particle Boards from Pineapple Leaves. Int. J. Phys. Sci. 2011, 6, 4528–4532. [Google Scholar]
  32. Huang, H.; Zhou, Y.; Huang, R.; Wu, H.; Sun, Y.; Huang, G.; Xu, T. Optimum Insulation Thicknesses and Energy Conservation of Building Thermal Insulation Materials in Chinese Zone of Humid Subtropical Climate. Sustain. Cities Soc. 2020, 52, 101840. [Google Scholar] [CrossRef]
  33. Chen, S.A. Green Building Information Modelling Approach: Building Energy Performance Analysis and Design Optimization. MATEC Web Conf. 2018, 169, 01004. [Google Scholar] [CrossRef] [Green Version]
  34. Pomfret, L.; Hashemi, A. Thermal Comfort in Zero Energy buildings. Energy Procedia 2017, 134, 825–834. [Google Scholar] [CrossRef] [Green Version]
  35. Latha, P.K.; Darshana, Y.; Venugopal, V. Role of Building Material in Thermal Comfort in Tropical Climates—A Review. J. Build. Eng. 2015, 3, 104–113. [Google Scholar] [CrossRef]
  36. Abanda, F.H.; Byers, L. An Investigation of the Impact of Building Orientation on Energy Consumption in a Domestic Building Using Emerging BIM (Building Information Modelling). J. Energy 2016, 97, 517–527. [Google Scholar] [CrossRef]
  37. Le, T.T.; Austin, S.A.; Lim, S.; Buswell, R.A.; Gibb, A.G.F.; Thorpe, T. Mix Design and Fresh Properties for High—Performance Printing Concrete. Mater. Struct. Constr. 2012, 45, 1221–1232. [Google Scholar] [CrossRef] [Green Version]
  38. Law, R.; Buswell, R.A.; Austin, S.A.; Le, T.T.; Gibb, A.G.F.; Lim, S.; Thorpe, T. Hardened Properties of High—Performance Printing Concrete. Cem. Concr. Res. 2012, 42, 558–566. [Google Scholar]
  39. Bao, Y.; Xu, M.; Soltan, D.; Xia, T.; Shih, A.; Clack, H.L.; Li, V.C. Three-dimensional Printing Multifunctional Engineered Cementitious Composites (ECC) for Structural Elements. In Proceedings of the RILEM International Conference on Concrete and Digital Fabrication, Zurich, Switzerland, 9–12 September 2018; pp. 115–128. [Google Scholar]
  40. Kumar, D.; Alam, M.; Zou, P.X.W.; Sanjayan, J.G.; Ahmed, R. Comparative Analysis of Building Insulation Material Properties and Performance. Renew. Sustain. Energy Rev. 2020, 131, 110038. [Google Scholar] [CrossRef]
  41. Aisyah, S.; Mustapa, S.; Khairi, M.; Rashid, A. Application of Expanded Polystyrene (EPS) in Buildings and Constructions: A Review. J. Appl. Polym. Sci. 2019, 136, 47529. [Google Scholar]
  42. Schackow, A.; Effting, C.; Folgueras, M.V.; Güths, S.; Mendes, G.A. Mechanical and Thermal Properties of Lightweight Concretes with Vermiculite and EPS Using Air-Entraining Agent. Constr. Build. Mater. 2014, 57, 190–197. [Google Scholar] [CrossRef]
  43. Sariisik, A.; Sariisik, G. New Production Process for Insulation Blocks Composed of EPS and Lightweight Concrete Containing Pumice Aggregate. Mater. Struct. 2012, 45, 1345–1357. [Google Scholar] [CrossRef]
  44. Papadopoulos, A.M. State of the Art in Thermal Insulation Materials and Aims for Future Developments. Energy Build. 2005, 37, 77–86. [Google Scholar] [CrossRef]
  45. Yang, C.; Fischer, L.; Maranda, S.; Worlitschek, J. Rigid Polyurethane Foams Incorporated with Phase Change Materials: A State-of-the-Art Review and Future Research Pathways. Energy Build. 2015, 87, 25–36. [Google Scholar] [CrossRef]
  46. Lee, Y.; Choi, S.; Choe, K.; Kim, S. Physical And Mechanical Characteristics of Polyurethane Foam Insulators Blown By HFC. In Proceedings of the Fifteenth International Offshore and Polar Engineering Conference, Seoul, Korea, 19 June 2005; p. ISOPE-I-05-424. [Google Scholar]
  47. Roy, B. Glass-Wool Insulation: ECBC Compliance and Green Building Aspect. Key Eng. Mater. 2015, 632, 39–44. [Google Scholar] [CrossRef]
  48. Willoughby, J. Insulation. In Plant Engineer’s Reference Book, 2nd ed.; Butterworth-Heinemann: Oxford, UK, 2002; pp. 18–30. [Google Scholar]
  49. Kim, K.H.; Jeon, S.E.; Jin-Keun, K.; Yang, S. An Experimental Study on Thermal Conductivity of Concrete. Cem. Concr. Res. 2003, 33, 363–371. [Google Scholar] [CrossRef]
  50. Kosmatka, S.H.; Wilson, M.L. Fly Ash, Slag, Silica fume, and Natural Pozzolans. In Design and Control of Concrete Mixes, 15th ed.; Portland Cement Association: Skokie, IL, USA, 1996; pp. 57–72. [Google Scholar]
  51. Designbuilder. Available online: https://designbuilder.co.uk/training/tutorials (accessed on 9 September 2021).
  52. Bernardo, H.; Quintal, E.; Oliveira, F. Using a calibrated building energy simulation model to study the effects of improving the ventilation in a school. Energy Procedia 2017, 113, 151–157. [Google Scholar] [CrossRef]
  53. Blanco, J.M.; Buruaga, A.; Rojí, E.; Cuadrado, J.; Pelaz, B. Energy Assessment and Optimization of Perforated Metal Sheet Double Skin Facades Through Design Builder; A Case Study in Spain Skin Fac. Energy Build. 2016, 111, 326–336. [Google Scholar] [CrossRef]
  54. Emond, F.; Ahn, J.; Kim, J.; Kim, J. Computing Thermal Bridge of VIP in Building Retrofits Using DesignBuilder. Energy Procedia 2015, 78, 400–405. [Google Scholar]
  55. ANSI/ASHRAE Standard 55-2010: Thermal Environmental Conditions for Human Occupancy. Available online: https://www.ashrae.org (accessed on 9 September 2021).
Figure 1. A flowchart showing the stepwise approach of the numerical study.
Energies 15 01069 g001
Figure 2. Building information: (a) (i) Building plan; (a) (ii) Zoning layout; (b) (i) Building Elevation; (b) (ii) Sectional view; (b) (iii) Walling layout.
Energies 15 01069 g002
Figure 3. Insulating materials: (a) Expanded polystyrene boards (b) Extruded polystyrene boards; (c) Polyurethane foam insulation panels; (d) Fiberglass roll sheet.
Energies 15 01069 g003
Figure 4. (a) Insulation effect on 3DPC building energy use; (b) Effect of insulation on 3DPC thermal comfort efficiency.
Energies 15 01069 g004
Figure 5. Performance of insulated 3DPC at ASHRAE thermal comfort acceptability limits for (a) Mix 1; (b) Mix 2; (c) Mix 3. Insulation effects on thermal energy transfer of 3DPC Walls for (d) Mix 1; (e) Mix 2; (f) Mix 3.
Energies 15 01069 g005
Figure 6. (a) Insulation effects on operational carbon emissions of infilled wall cavities. Variations in seasonal carbon production of insulated 3DPC walls for (b) Mix 1, (c) Mix 2, (d) Mix 3. (e) Correlation between U-value and energy use. (f) Correlation between U-value and thermal comfort performance. (g) Correlation between U-value and carbon emissions.
Energies 15 01069 g006
Table 1. Mix Designs of the Adopted 3DPC Prototypes.
MaterialsMix Proportions [kg/m3]
Mix 1Mix 2Mix 3
Portland cement579613.7729
Calcium aluminate cement--55
Fine Aggregate (Sand)1241767.2495
Silica fume8357.5110
Water232402.8400
Fly ash165287.7253
Water-cement ratio0.280.280.25
Flour Silica--55
ANC, HRWA, VMA--6,6,6
PVA fiber-21.2926
Source[37][19][39]
Table 2. Building Input Parameters *.
ParametersValues
Thermal conductivity of EPS0.035 (W/m.K)
Thermal conductivity of FG0.0465 (W/m.K)
Thermal conductivity of XPS0.03 (W/m.K)
Thermal conductivity of PUF0.028 (W/m.K)
Roof Insulation0.39 (W/m2K)
Floor insulation0.46 (W/m2K)
Infiltration rate 0.7 (ac/h)
HVAC equipmentFan coil unit (4-pipe)
Lighting power density5 W/m2
Occupancy density55 m2/person
* As obtained from the location-based building information repository on DB-EnergyPlus.
Table 3. Building Component Optimization Matrix (Aij).
Mix DesignsControl ModelsEPSFGXPSPU
Mix 1P0InsP-1InsP-2InsP-3InsP-4
Mix 2R0InsR-1InsR-2InsR-3InsR-4
Mix 3S0InsS-1InsS-2InsS-3InsS-4
Publisher’s Note: MDPI stays neutral with regard to jurisdictional claims in published maps and institutional affiliations.

