1. Introduction
The EU has implemented different policies in order to reduce the impact of climate change in the last decades. The reduction in CO
2 emissions from the energy sector has been a key issue in the European energy and climate change policies, as this sector has been the main producer of greenhouse gas (GHG) emissions (more than 80%) [
1]. In this context, climate policies and energy have been greatly integrated into the EU, where policies related to the use of efficient energy and the development of clean production technologies have been greatly used in the climate change framework [
2].
In 2007, the EU highlighted the importance of ensuring that global average temperature increases do not exceed pre-industrial levels by more than 2 °C [
3]. Subsequently, the 2020 Climate and Energy Package [
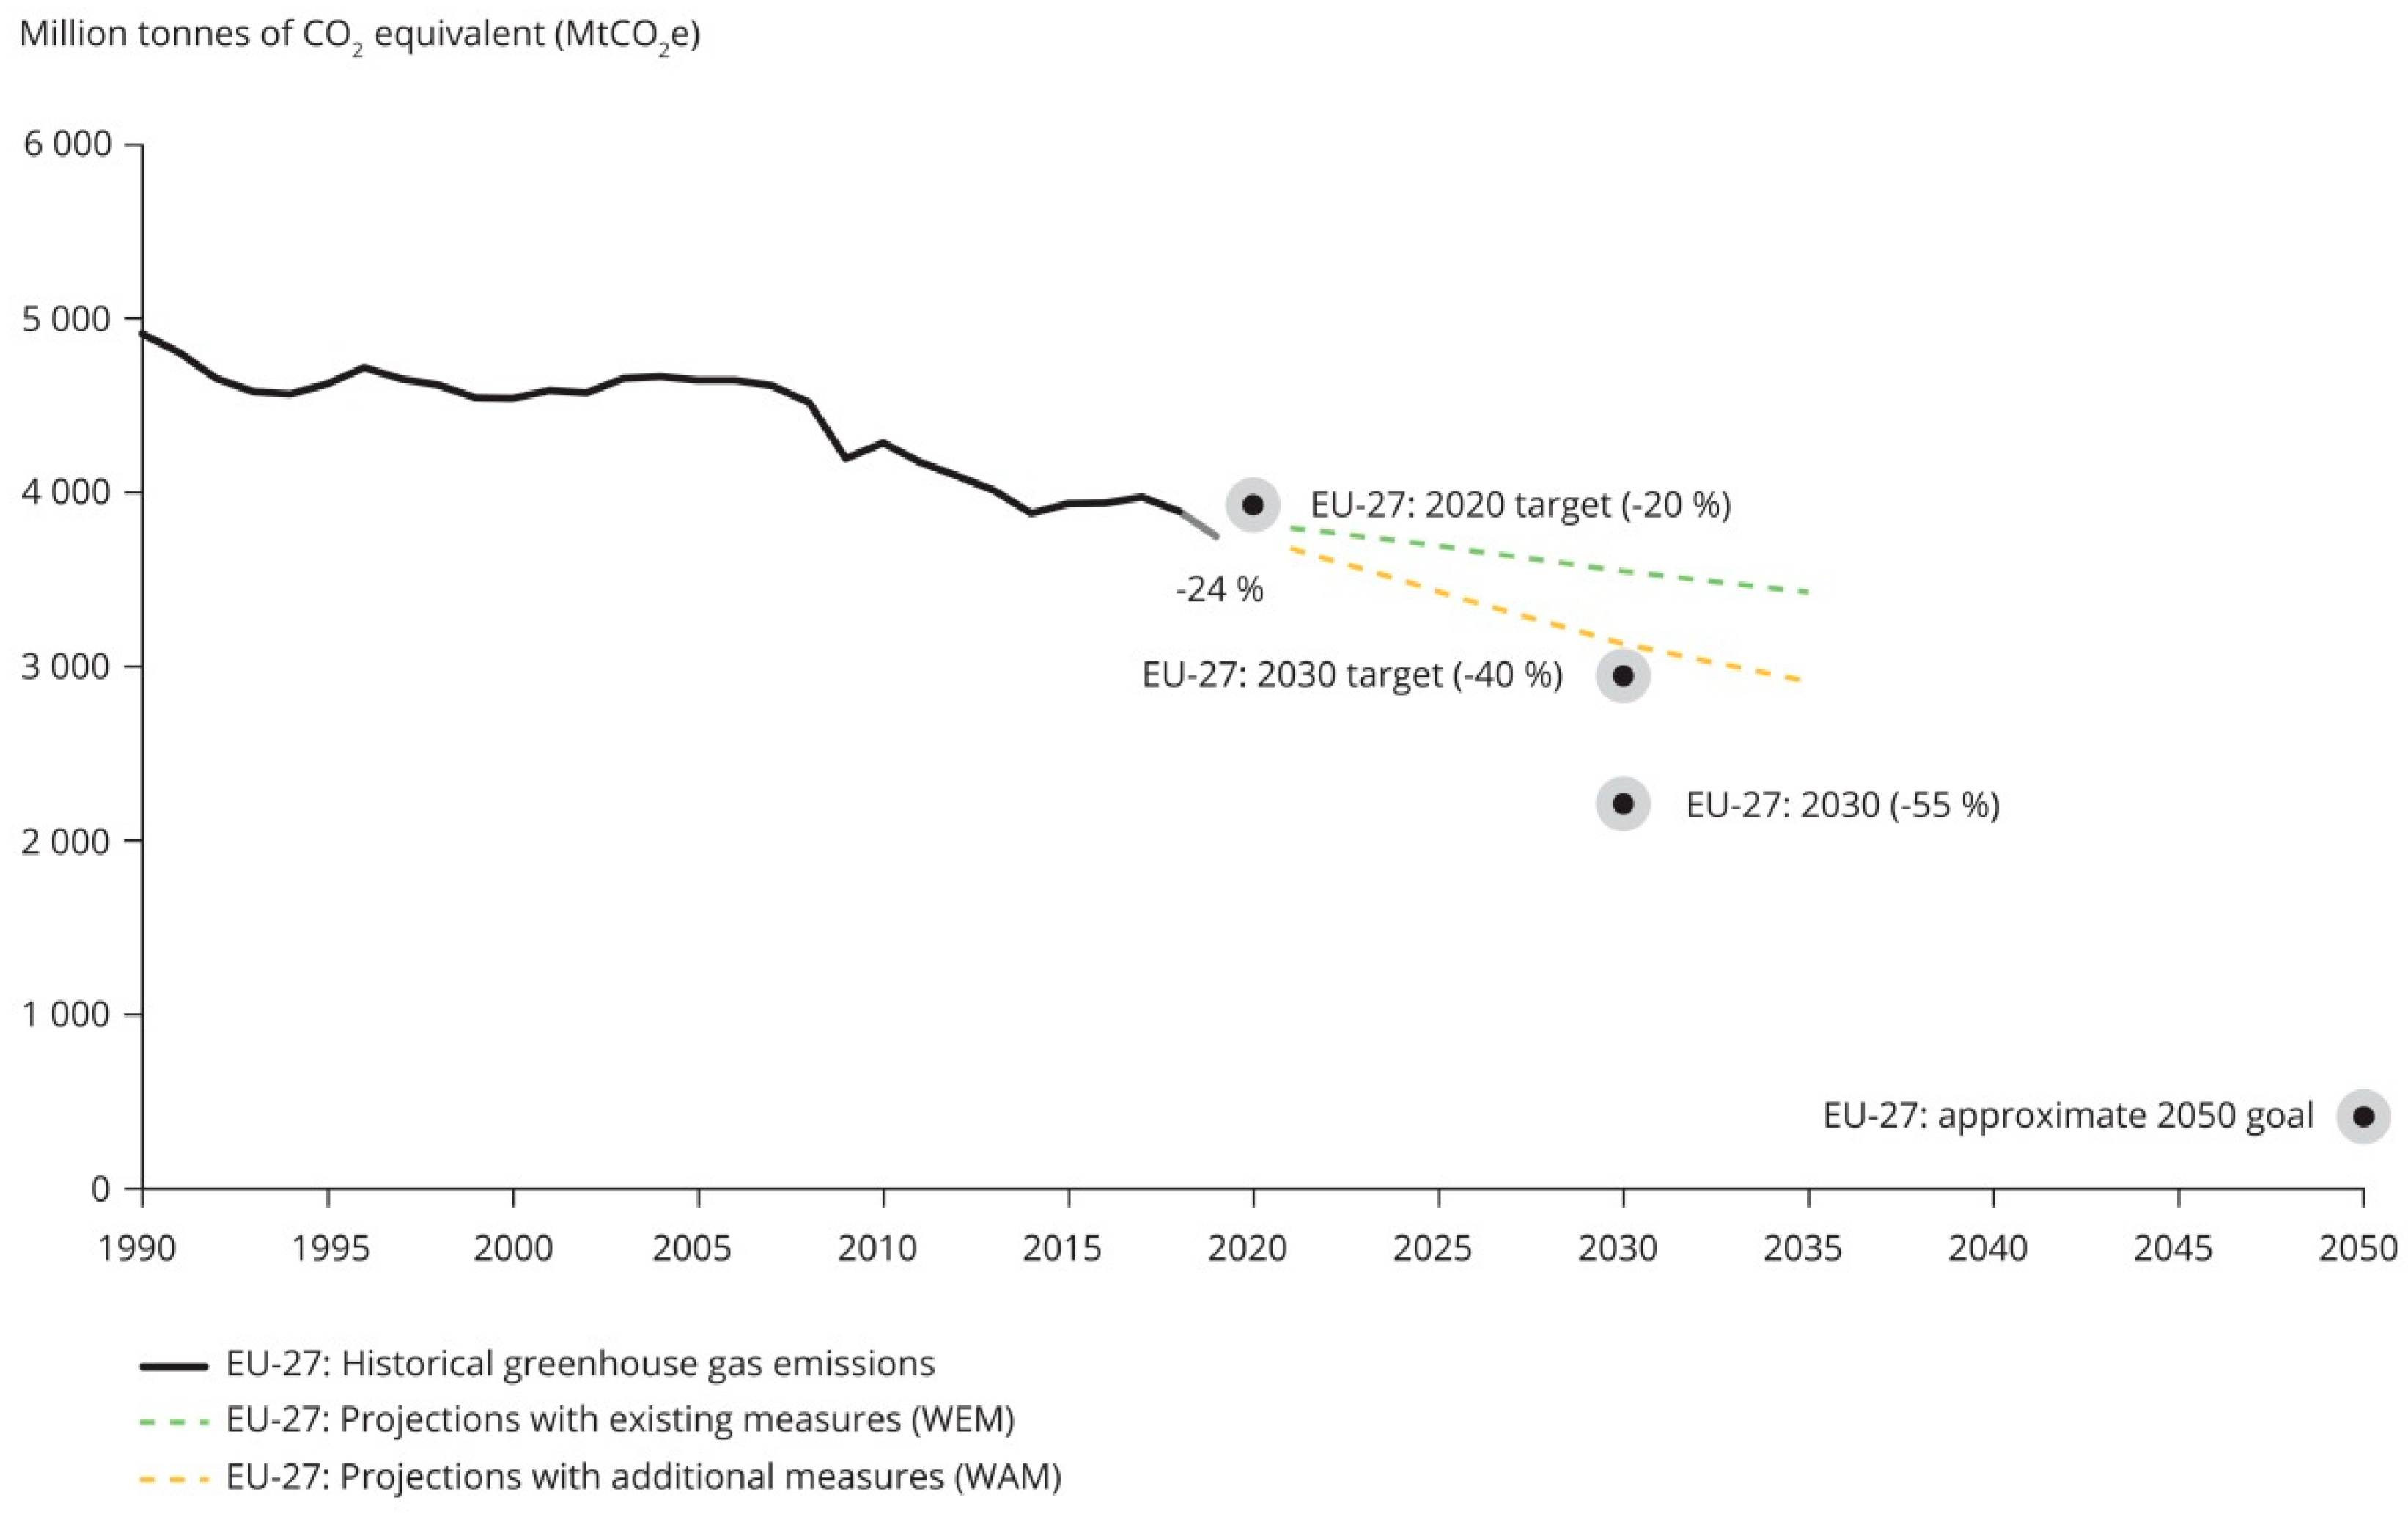
4] was approved, which set the strategies and policies related to energy and climate policies up to 2020. It was based mainly on the development of renewable energies (RES-E), complemented by measures of energy efficiency. More specifically, it established the following three key targets: (i) 20% cut in GHG emissions (from 1990 levels), (ii) 20% of EU energy from renewables, and (iii) 20% improvement in energy efficiency.
Although climate change was the main driver of the 2020 Climate and Energy Package, energy policy challenges were also extensively treated in this context. The following three main goals were set in the EU energy policy: supply security, sustainability, and competitiveness. Thus, different actions were developed, such as the promotion of RES-E in order to achieve their large-scale deployment, the promotion of technologies of carbon capture, and storage of the investment or investment in nuclear energy in member states that wished to do so [
5]. Likewise, from the side of the demand, energy efficiency has been an essential issue for achieving 2020 targets. These targets should be achieved from all economic sectors, but the power sector has been expected to play a main role in the achievement of both (GHG emissions and RES-E) [
6].
Subsequently, the EU adopted the 2030 Framework for Climate and Energy [
7], the aim of which is to meet a more secure, sustainable, and competitive energy system and to help the EU to achieve its long-term 2050 GHG reduction target. In this context, the following goals were set: (i) 40% cut in GHG emissions (from 1990 levels), (ii) (at least) 27% of EU energy from renewables, and (iii) (at least) 27% energy savings. Policies related to RES-E development, energy efficiency, and sustainability were emphasized again. This framework was developed on the basis of the 2020 Climate and Energy Package and it is also in line with the longer-term perspective established in the roadmap for moving to a competitive low-carbon economy by 2050 [
8] and the Energy Roadmap 2050 [
9].
More recently, in December 2019, the EU presented the European Green Deal [
10], which aims to make Europe climate neutral by 2050. In order to achieve its decarbonisation objectives, the European Commission adopted a set of proposals to make the EU’s climate, energy, transport, and taxation policies fit for reducing net GHG emissions by at least 55% by 2030, compared to 1990 levels. Additionally, the Commission proposed to increase the binding target for renewable sources in the EU’s energy mix to 40% and to increase energy efficiency targets and make them binding to achieve an overall 36–39% reduction in final and primary energy consumption.
Figure 1, extracted from the report
Trends and projections in Europe 2020 prepared by the European Environment Agency (EEA) [
11], shows the evolution of GHG emissions in the EU since 1990, and the different reduction objectives set.
From a global point of view, different studies have focused on determining the key factors for a reduction in GHG emissions. Rehman et al. [
12] studied the effect of energy consumption, economic development, and population growth on CO
2 emissions in Pakistan by means of a grey relational analysis. They concluded that the increase in GHG emissions, especially those related to the transportation sector, is strongly linked to population growth. In addition, ref. [
13], by means of a non-homogenous discrete grey model, analysed which sectors will be the main generators of GHG emissions in the medium term.
Furthermore, ref. [
14] analysed the relationships among GHG emissions, income level, and consumption of renewable and non-renewable energy in Mexico for the period of 1990–2015. The study showed a strong relationship between economic growth (related to GDP) and the use of non-renewable energies, with increasing GHG emissions.
Regarding the situation of the United States, characterised by being one of the main GHG emitters in relative terms (carbon dioxide emissions per person), ref. [
15] studied the impacts of clean energy policies on total carbon emissions, electricity consumption, and carbon intensity. Its conclusion, after a study with a panel data set for 48 continental states from 1990 to 2008, is that more aggressive demand-side policies are needed.
Sun et al. [
16] reviewed the clean electricity policies of the EU, Australia, China, India, and the United States, since the power industry and policymakers in almost all countries are focused on clean energy development. The study showed the diversity of the scope, intensity, and comprehensiveness of clean energy policies.
With regard to the role of carbon taxation, several studies [
17,
18] have analysed its effectiveness worldwide. They have shown that although carbon and fuel taxes seem to be effective in reducing CO
2 emissions in various countries, the implementation of these policies entails serious difficulties in many cases.
Focusing on the case of the EU, and since the energy sector is the one that has contributed the most to GHG emissions, the analysis of the effects of climate change policies in this sector can be of interest for obtaining a better understanding of what specific policies involve a reduction in GHG emissions. As explained below, previous literature has shown that the analyses have mainly been based on climate policies related to the supply side, and consequently, had too narrow a focus. In addition, dynamic approaches do not precisely provide the effects of each specific policy.
In this context, the main contribution of this paper, and where its novelty lies, is the approach to both the supply and demand energy policies in the EU and their impact on the reduction in GHG emissions and electricity consumption. This information could allow policymakers to know the strengths and weaknesses of various climate-related power sector policies and will be especially relevant in future climate change policymaking in order to achieve the targets set.
Much of the previous literature, in order to assess the effectiveness of climate and energy policies, has presented the effects of different policies on RES-E investments or RES-E capacity [
19]. As shown in
Figure 2, according to [
20], there is wide diversity regarding support schemes in the EU. Some countries, such as France, Germany, and Spain, have different types of support schemes operating in combination (for example, for different types of renewable technology). In this context, ref. [
21] studied the effects of RES-E support policies on the development of these clean production technologies in 23 member states over the period of 1990–2007 by using a panel-corrected standard error estimator. The conclusion was that some RES-E support policies (quota obligations, product labelling, research, and development programs) were not drivers towards RES-E development. Nevertheless, incentives/subsidy policies (including feed-in systems (FISs)) were effective in promoting RES-E. On the other hand, ref. [
22] analysed the effects of FIS policies on promoting leader RES-E in 26 member states for the period between 1992 and 2008. Using the panel data method, they did not find robust evidence that the mere existence of this policy had driven wind energy development.
García-Álvarez et al. [
23] studied the effects of FISs and quota obligation policies on the solar photovoltaic installed capacity in the EU-28 for the period between 2000 and 2014. The method was a pooled ordinary least square regression clustered on the country level. Their results indicated that only FISs had significant impacts on the solar photovoltaic installed capacity. Nevertheless, the main design features of this policy—tariff size and contract duration—did not have a significant effect on the development of this RES-E. However, ref. [
24] investigated the effect of feed-in systems (FISs) on the investment in wind and solar photovoltaic energy by means of the panel data method in the EU-27 over the period of 1992–2015. Their results indicated that the mere existence of an FIS policy did not necessarily increase wind and solar photovoltaic investment, but policy design features were often more important for increasing RES-E investment.
Therefore, there is no unanimity about the effects of RES-E support policies on RES-E development in the EU. Moreover, a suitable proxy of the decarbonisation in the power sector cannot be given by increased RES-E capacity, greater RES-E generation, or higher RES-E investment. Thus, a mere increase in RES-E capacity without reducing electricity generation based on fossil fuels cannot be a solution to climate change [
19].
Ultimately, from a climate change perspective, what matters is if the policies are effective in reducing GHG emissions rather than if they increase RES-E. In this context, as several interdependent variables affect electricity market behaviour, and therefore, CO2 emission evolution, various approaches have been used with the aim of analysing the contribution of different technical and socio-economic factors.
Karmellos et al. [
6] studied, by means of a decomposition analysis model, the driving factors of CO
2 emissions from the electricity sector in the EU-28 in the period of 2000–2012. They considered five driving factors—activity level, electricity intensity, electricity generation efficiency, fuel mix, and electricity trade. Their results showed that electricity intensity reduction was the main factor in times of economic growth, whilst the contribution of the rest of the factors happened later. Similarly, ref. [
25] analysed the effects of RES-E and non-RES-E, real income, and trade openness on CO
2 emissions on the environmental Kuznets curve model for the EU between 1980 and 2012 by using panel estimation techniques robust to cross-sectional dependence. They concluded that RES-E and trade reduced CO
2 emissions, while non-RES-E contributed to environmental degradation.
Furthermore, ref. [
26] studied, by means of the panel data method, the effects of both environmental regulation and awareness on CO
2 emissions in 17 EU countries (Austria, the Czech Republic, Denmark, Finland, France, Germany, Greece, Hungary, Ireland, Italy, Lithuania, Poland, Portugal, the Slovak Republic, Spain, Sweden, and the United Kingdom) over the period from 1995 to 2017. Environmental tax revenue was used as a proxy of the stringency of environmental regulation, and the accumulated number of RES-E support policies was used as a proxy of environmental awareness. The results showed that both variables (environmental regulation and awareness) were effective in reducing CO
2 emissions.
By means of index decomposition analysis, ref. [
27] studied the drivers of CO
2 emissions for electricity generation in the EU over two subperiods, 2000–2007 and 2007–2015. Their results showed that changes in the fossil fuel mix, by means of the replacement of coal by gas, and efficiency improvements in electricity use were the main drivers of CO
2 reductions in the period of 2000–2007. However, in the period of 2007–2015, RES-E development, as well as efficiency improvements in both fossil electricity production and use became the main drivers of the decrease in CO
2 emissions.
More generally, ref. [
28] estimated, over the period of 2000–2019, the impact of RES-E energy, bioenergy efficiency, biofuels, urbanization, population, and real gross domestic product (GDP) per capita on CO
2 emissions in EU countries by using the panel data method. The results showed that clean production technologies, as well as bioenergy factors, were negatively correlated with CO
2 emissions. However, urbanization, population, and real GDP per capita were positively correlated with such emissions.
In addition, dynamic approaches were also developed in order to study dynamic changes. In this context, ref. [
29] investigated the distribution dynamics of energy consumption and CO
2 emissions, their intensities, as well as the carbonization index, over the period of 1970–2010 in 23 European member states. The method was based on the dynamics of cross-section distributions. The results showed that the convergence patterns hypothesis was not valid. Thus, major differences were observed in member states according to climate type with respect to the analysed variables. Hence, the importance of national and European energy and climate policies can be implemented in terms of the non-convergence paradigm. Similarly, ref. [
30] determined, by means of hierarchical methods, the tendency of changes related to energy decarbonisation, as well as distinguished typological groups of EU member states with similar dynamics in this research field. The analysis was applied to 26 member states (except Malta and Great Britain) between 2000 and 2018. Their results showed that the implementation of climate policy by the individual countries was the main factor in reducing CO
2 emissions. Nevertheless, they found two groups of member states—those that were reluctant to dynamically reduce CO
2 emissions (Central and Eastern European countries) and those member states that supported a strong climate policy (the rest of the EU countries).
At this point, and as mentioned above, previous literature [
6,
26,
27,
28,
29] has shown that the analyses were mainly based on climate policies related to the supply side, and dynamic approaches do not precisely provide the effects of each specific policy. Therefore, the objective of this study was to go a little further in the study of the supply and demand energy policies in the EU, analysing their impact on the reduction in GHG emissions and on electricity consumption. This information will allow policymakers to have a better understanding of the effectiveness of the aforementioned policies in order to achieve the targets set.
3. Results
The descriptive statistics are shown in
Table 1. Once the non-normality of the explanatory and continuous control variables was confirmed, and considering that Pearson’s correlation coefficient did not work well for discrete variables as it was very sensitive to violations of normality assumptions, Spearman’s rank correlations were calculated. When there is a perfect linear relationship among the predictors, the estimates for a regression model cannot be uniquely computed. Given this, a multicollinearity study (analysis of the variance inflation factors (VIF)) was carried out in order to rule out, if necessary, any of the predictors. As a result, the variable RPS_PV (related to PV solar support policies) shows significant collinearity, and therefore, it was discarded.
As mentioned above, Hausman tests were conducted in order to select between fixed-effects or random-effects models. The null hypothesis established that there is no systematic difference between the coefficients estimated by the two methods. According to the results (Χ2 (13d.f.) = 316.75 for Model 1, Χ2 (13d.f.) = 34.78 for Model 2, Χ2 (13d.f.) = 37.53 for Model 3), in the three models, this hypothesis was rejected, indicating the suitability of a fixed-effects model. To control for possible heteroscedasticity problems, the proposed models used robust standard errors.
A summary of the results of the three fixed-effects panel regression models is included in
Table 2.
Regarding the support policies (FIS and quota obligation) of the two main RES-E (wind and PV solar energy) and their impact on carbon intensity in the electricity sector, the results of Model 2 support Hypothesis 1 in the case of wind energy, as both FIS_WIND (β = −6.748
p = 0.000) and RPS_WIND (β = −4.802
p = 0.000) have a negative and statistically significant influence. In the case of PV solar energy, although the sign of the coefficient goes in the direction that would be expected, the analysis shows that Hypothesis 1 is not supported, as the variable FIS_PV is not statistically significant (
p = 0.634). This means that a reduction in carbon intensity might be expected through the introduction of support policies of RES-E. The significance of the support policies for wind energy, compared to those developed for photovoltaic solar energy, may come from the fact that its installed power is considerably higher. The results obtained in this study, for the case of the EU, are in line with those obtained by [
15] for the case of the United States.
Regarding energy taxes policies and their link with carbon intensity and electricity consumption, both Hypotheses 2 and 3 are not supported by the analysis. According to the results obtained from Models 2 and 3, the variable TAX_POL is not statistically significant (
p = 0.782 in Model 2 and
p = 0.809 in Model 3). Similar results have been obtained in previous studies in the case of the EU [
39,
40], as well as Latin America [
41] and the United States [
15]. On the other hand, results obtained by [
18] for the Netherlands showed a slight difference, in the sense that an energy tax has a small impact on household energy demand in the short term.
Finally, Hypothesis 4 raised a possible relationship between the establishment of clean energy policies and the reduction in electricity carbon emissions. In this sense, according to Model 1, support energy policies have a negative (in the sense of reduction) and statistically significant effect on electricity carbon emissions (FIS_WIND, β = −0.750
p = 0.001; RPS_WIND, β = −1.123
p = 0.000; FIS_PV, β = −0.388
p = 0.025). This result leads us to accept Hypothesis 4. On the contrary, this hypothesis is not supported in the case of energy taxes policies, as the variable TAX_POL is, again, not statistically significant (
p = 0.384). Both results indicate a relationship analogous to the one proposed by [
6,
27] for the EU, and the one indicated by [
15] for the United States, reinforcing its validity.
Other interesting results can be extracted from the analysis of the proposed models, examining what was obtained in the case of the control variables. A more in-depth discussion of these results is presented in
Section 4.
4. Discussion and Conclusions
The EU has developed important efforts in enacting various clean energy policies in order to reduce GHG emissions in the last decades. In this context, actions related to the development of RES-E, the encouragement of energy efficiency, and sustainable development have been highlighted [
3,
4,
7,
8]. Thus, both supply-side and demand-side changes are required in the energy systems in the period of 2020–2030 and going towards 2050 [
42].
Obtaining a better understanding of the effects of these specific clean energy actions on reducing GHG emissions may be especially of interest. This information could be incorporated into policymaking in order to facilitate the achievement of the climate change goals set by the EU.
Nevertheless, the previous literature has been mainly focused either on analysing a specific policy in particular (when GHG emissions are conditioned by both the supply side and the demand side) or studying its effectiveness on alternative measures (such as the growth of clean energy industries) but not its ability to decrease carbon emissions. In this context, this paper adds to the literature by presenting the effects of both supply-side (FIS, RPS) and demand-side (energy taxes) policies and empirical evidence of the impact of these policies on the reduction in carbon emissions.
In this context, the objective of this study was to analyse both supply and demand policies in order to obtain a better understanding of what specific measures are successful in curbing GHG emissions. This information could allow policymakers to know the strengths and weaknesses of various climate-related power sector policies and will be especially relevant for future climate change policymaking in order to achieve the targets set.
At this point, we address in more depth the interpretation of the results obtained, focusing especially on the key findings regarding the impact of clean energy policies.
Model 1, where GHG emissions were used as the dependent variable, revealed interesting effects. As mentioned in
Section 3, Hypothesis 4 stated that the implementation of clean energy policies leads to a reduction in GHG emissions. According to the results obtained, it can be concluded that the adoption of support policies for renewables from the supply-side point of view, at least in terms of the types used in the EU (FIS and RPS), has a significant impact on the reduction in total carbon emissions. In this sense, in the case of wind energy, there is a greater incidence than in the case of photovoltaic solar energy since the installed wind power and contribution is much higher. On the other hand, if we focus on the fuel mix of power generation, we can conclude that the share of RES-E and hydro has a significant impact on the reduction in emissions.
Additionally, we can verify the influence, to a much lesser degree, of the unemployment rate and the demand for energy for heating in the variation of GHG emissions. In this sense, an increase in the unemployment rate is associated with less economic activity and, in addition, with a reduction in electricity demand and, therefore, in carbon emissions [
15,
28]. In the case of the increase in the demand for energy for heating, a slight effect is observed in the increase in GHG emissions, in line with the results from [
35,
37].
Model 2 considered carbon intensity as a dependent variable. This model was used to test the effectiveness and influence of RES-E support policies (supply side) on the objective of reducing carbon intensity, as proposed in Hypothesis 1. The results lead us to conclude that the introduction of RES-E support policies in the EU has had a very significant impact on reducing carbon intensity in the period of 2000–2019. These policies have been particularly effective in the case of wind energy. In the case of PV solar energy support policies, it can be concluded that they have also had a certain impact but to a lesser degree due to the lower contribution of this technology to the mix of power generation (5% in 2020 compared to 14% for wind energy).
In addition, Models 2 and 3 were used to test the impact of energy taxes policies (demand side) on the achievement of two different objectives, namely the reduction in carbon intensity in Model 2 and the reduction in energy consumption in Model 3. In both cases, we can conclude that, up to now, energy tax policies from the demand-side point of view do not seem to have a relevant impact on reducing GHG emissions, carbon intensity, or energy consumption. It seems that energy taxes alone cannot promote more sustainable energy consumption patterns or substantially modify household behaviour that can lead to a significant reduction in energy consumption or in carbon emissions.
In summary, it can be stated that when comparing the performance of both supply and demand policies in the EU, it can be observed that supply-side policies have been clearly more effective in terms of reducing carbon intensity, but not so much in terms of global emissions, as the global consumption of electricity has increased.
Therefore, considering these results and those obtained in other countries, as a first recommendation for stakeholders, we can hope that the maintenance and strengthening of the supply-side policies can help the EU to achieve the objectives set out in the European Green Deal. In this sense, it is necessary to continue with policies to promote renewable energy generation and enhance energy efficiency if effective climate mitigation is to be achieved. Previous studies [
6,
15,
27] have reflected on the impact of FISs and RPSs in the development of clean energy industries. The purposes of these clean energy policies include the mitigation of carbon emissions, to stimulate green economic development, and to secure a diversified energy supply. This research makes a contribution to the literature by means of empirical evidence of the carbon reduction effects of these policies. Another measure that could contribute to strengthening the impact of RES-E would be a commitment to technological improvement through investment in research, development, and innovation. This could result in improving the energy efficiency of generation facilities and reducing their environmental impact.
As another recommendation, it could be necessary to rethink energy tax policies due to their lack of effectiveness in reducing energy demand (as it has been shown in [
15,
40,
41] and in the results obtained in this paper). Reinforcing actions and more aggressive policy efforts might, therefore, be necessary to mitigate carbon emissions in the EU. Hale [
43] showed that consumers′ environmental awareness is the main driver for creating sustainable consumption and pointed out the need to deepen policies related to this issue. In this sense, the adoption of public policies to promote environmental awareness (for example, by promoting school campaigns on responsible energy consumption) might be an effective complementary measure for energy taxes. Likewise, ref. [
44] showed that in terms of communication, significant gaps persist when addressing public concerns, and a way to promote consumers’ awareness is through communication improvement. The message should be easy to read, simple to understand, and succinct. Other measures could be the maintenance and improvement of subsidies for the energy efficiency of existing buildings, the promotion of passive houses, or an increase in investment for the replacement of inefficient appliances.
Regarding the limitations of this study, it is necessary to acknowledge that the sample did not include a large number of countries, which may have affected the results by using the panel data method. Likewise, the analysis of the effects of supply-side policies related to RES-E support policies might be more exhaustive, as the choice of design elements in these policies could be as important for promoting RES-E as the choice of the specific policy. Further research should consider these issues by expanding the analysis to a larger sample, such as the case of the (Organization for Economic Co-operation and Development (OECD) countries in order to increase the number of observations. Moreover, regarding supply-side policies, the analysis should incorporate two additional design elements (amount and contract duration) in order to obtain a better understanding of the main strengths and/or weaknesses of each policy in reducing CO2 emissions.


