
A Study on Improving Economy Efficiency of Pumping Stations Based on Tariff Changes


Abstract
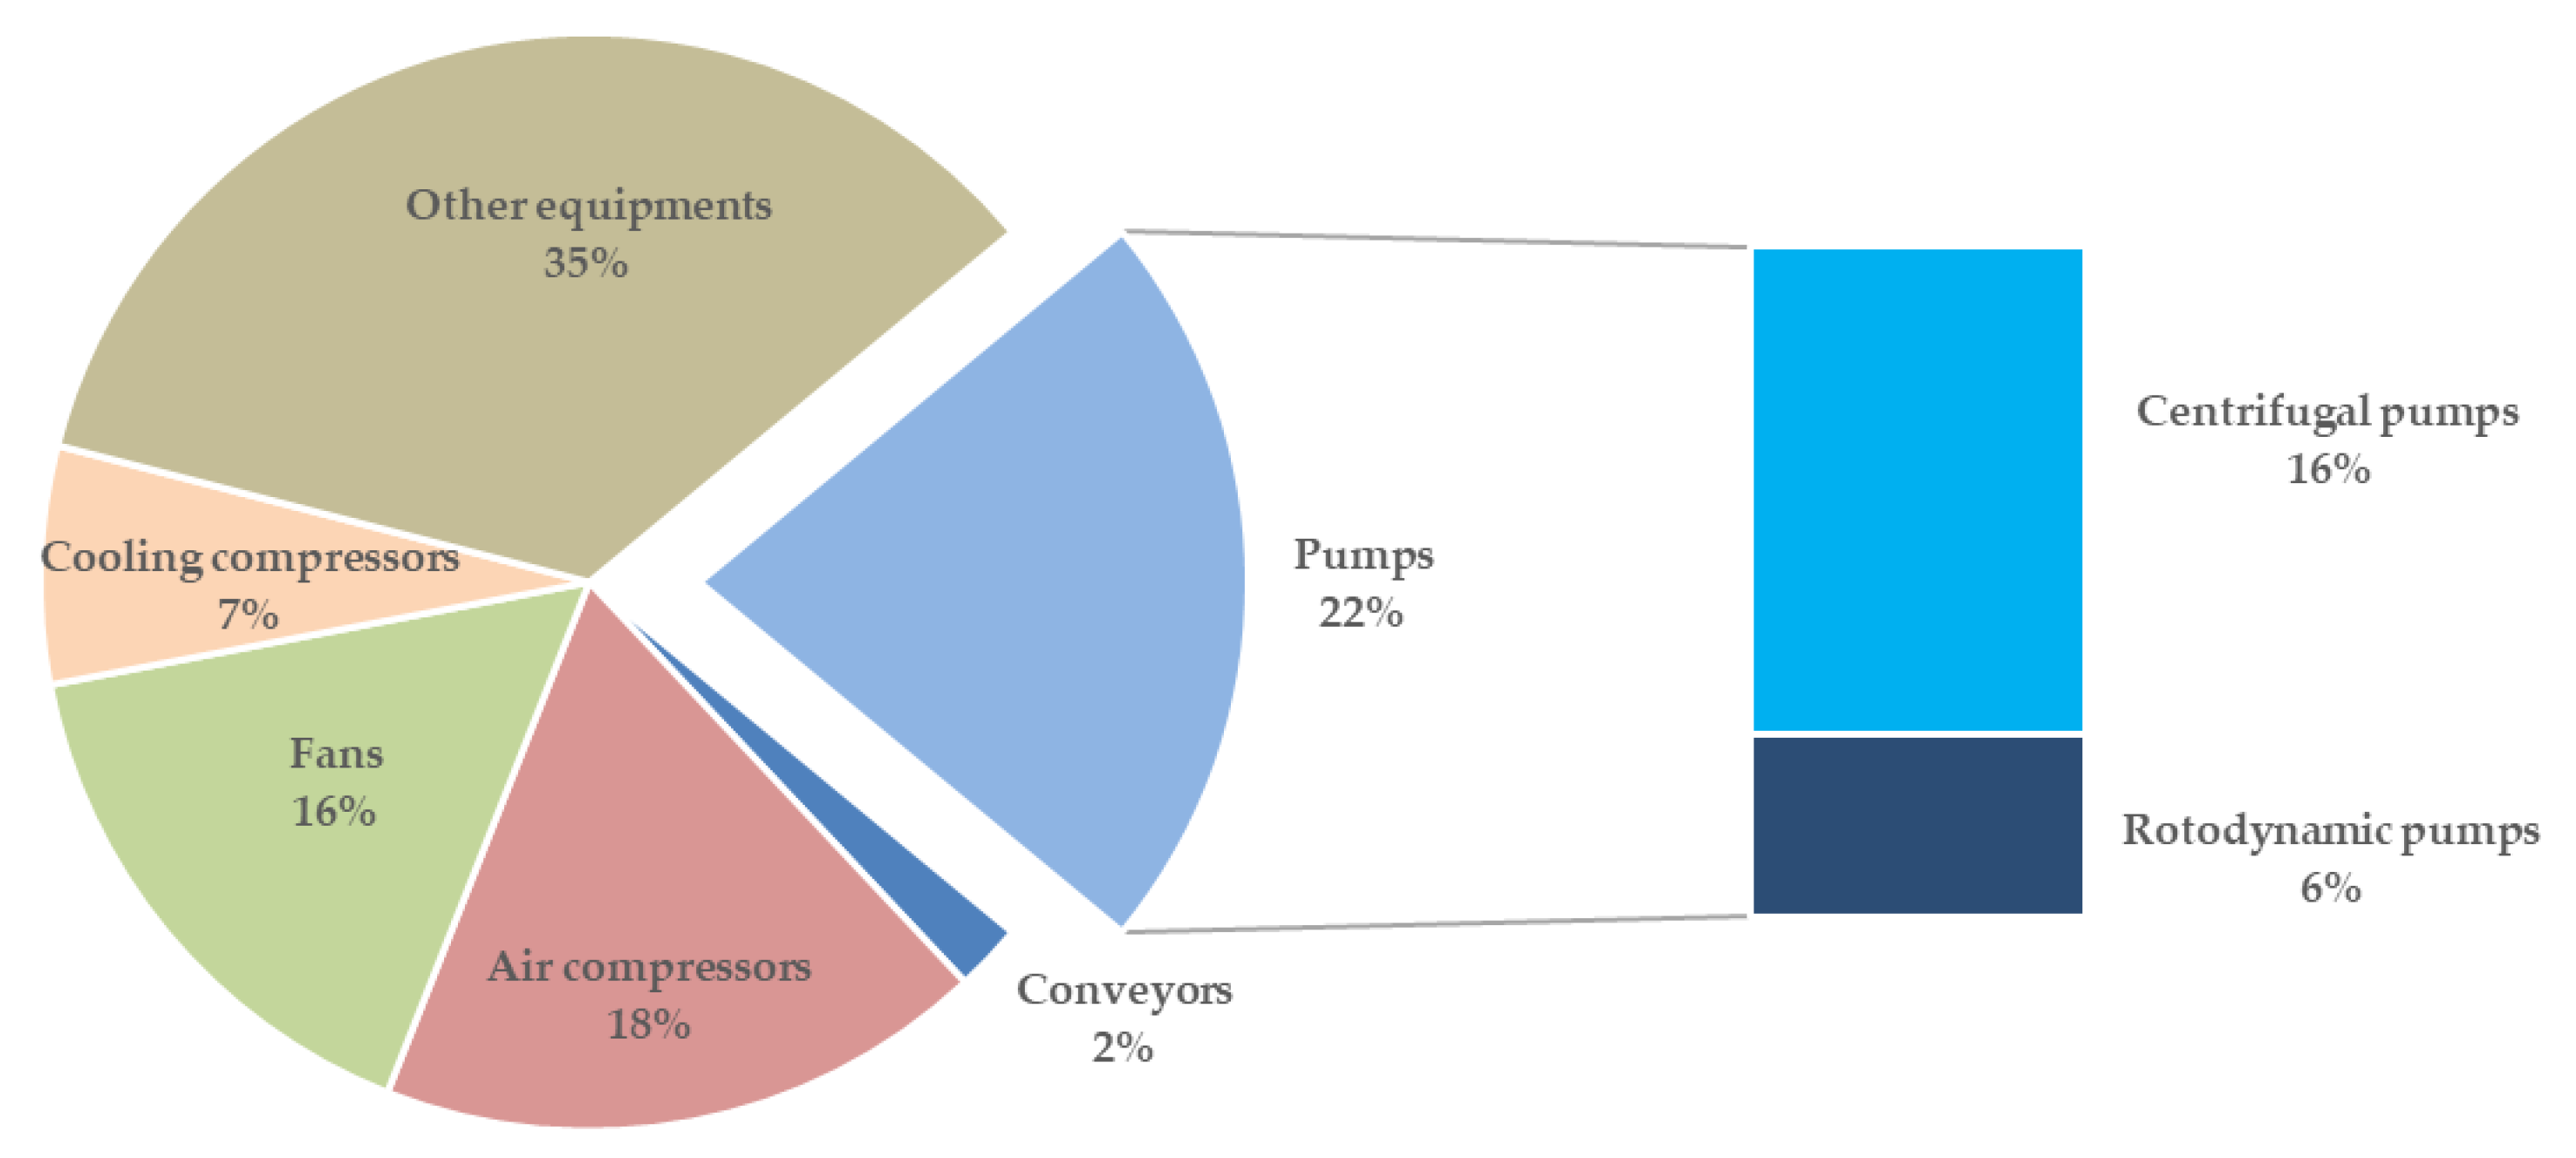
1. Introduction
2. Market Energy in Poland—Structure of Tariffs Energy
- -
- cut greenhouse gas emissions by at least 40% (compared to 1990);
- -
- increase the share of renewable energy by at least 32%;
- -
- improve energy efficiency by at least 32.5%.
3. Materials and Methods
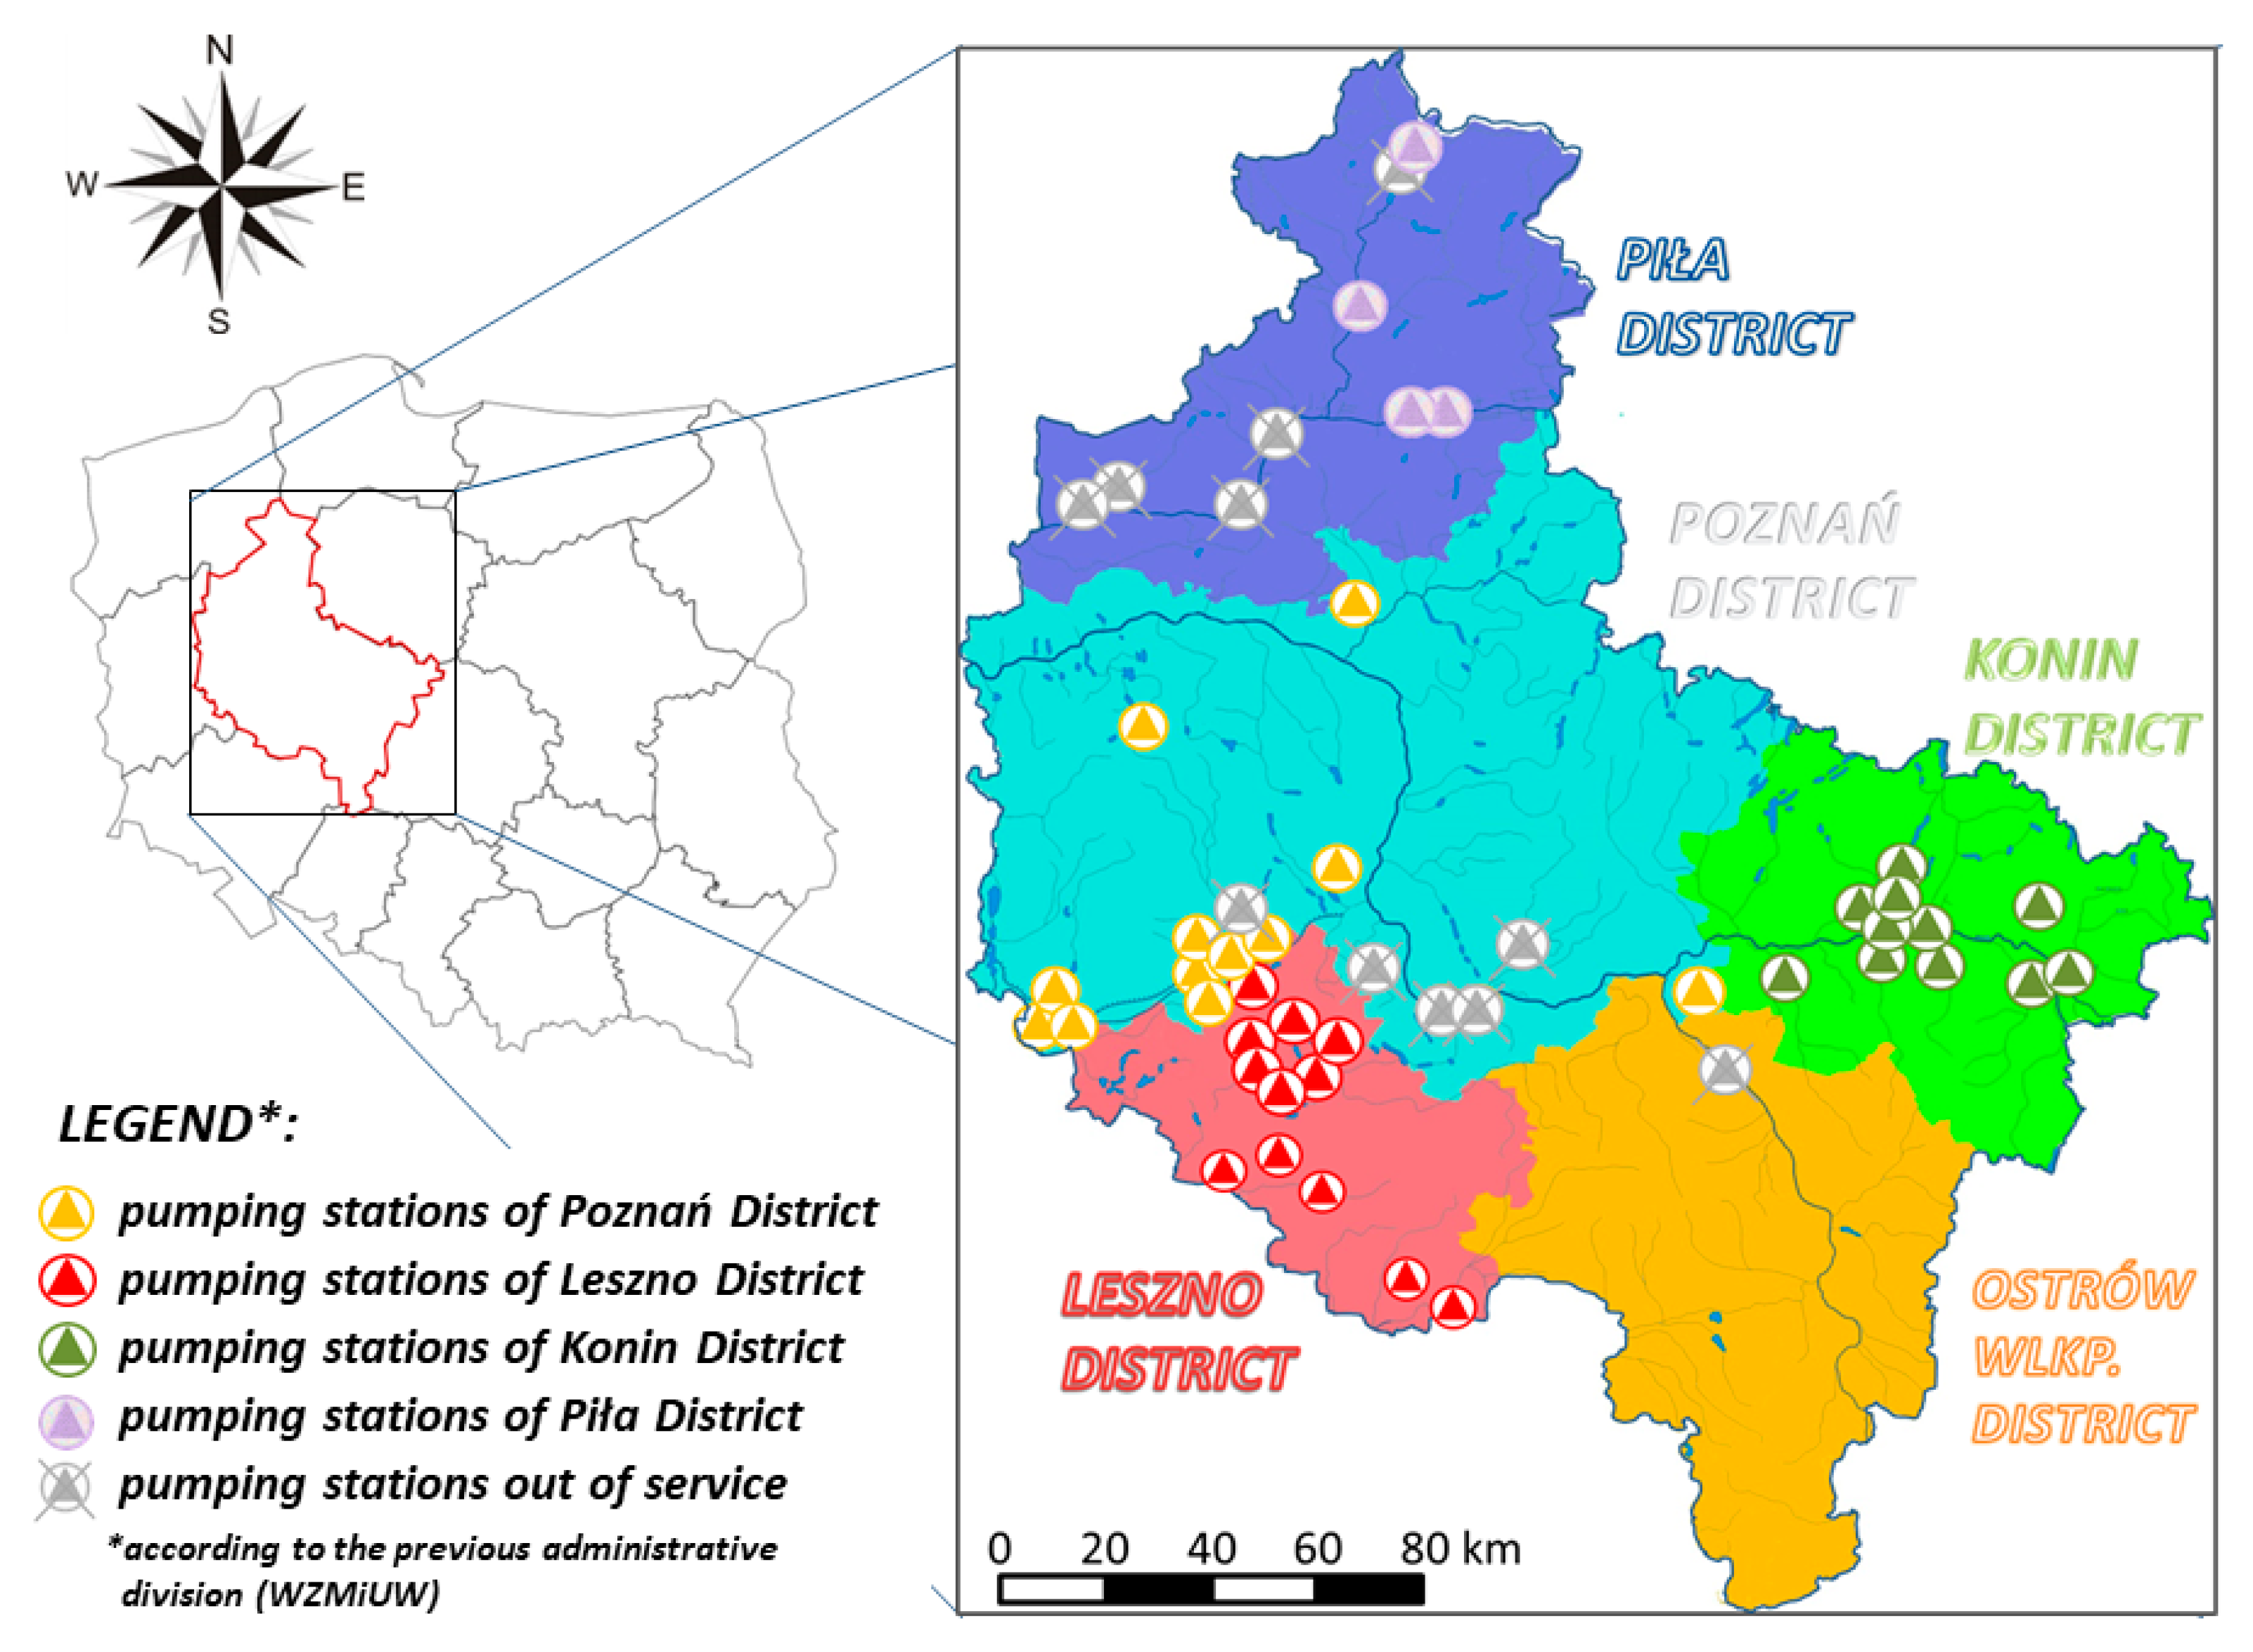
3.1. Study Site Characterization and Analyzed Data
- FV is the future value, which transfers all the cost from the past to the base year (2021);
- PV is the present value or current value of the future of energy savings;
- pt is the interest factor, which is described by Equation (2):
- r is the interest rate (nominal);
- t is the number of years.
- rr is the real interest rate;
- r is the nominal interest rate;
- i is the inflation rate.
- fixed tariffs (in this work called 24 h tariffs);
- time of use (TOU) tariffs (often named multi-zone or multi-part tariffs).
3.2. Hydro-Meteorological Conditions and Their Influence on Pumping Stations’ Work
3.3. Energy Cost Calculation
- Opoi is the payment for electricity and distribution services (PLN);
- Ci is the electricity price in a given time zone k (PLN·kWh−1);
- SSVn is the fixed component of the grid rate (PLN·kW−1·miesiąc−1);
- Pi is the contracted capacity (kW);
- SZVnk is the variable component of the network rate for the time zone k (PLN·kWh−1);
- Epik is the amount of energy taken from the grid, in the time zone k (kWh);
- r is the number of time zones.
- fixed costs, independent of the amount of energy consumed and contracted capacity;
- variable costs, depending on the amount of active energy consumed;
- fixed costs, depending on the amount of contracted capacity.
- Opoi(MOD) is the payment for electricity and distribution services (PLN);
- A is the fixed costs independent of the amount of energy consumed and contracted capacity (PLN);
- Epik is the amount of energy taken from the grid, in the time zone k (kWh);
- B is the variable costs, depending on the amount of active energy consumed, (PLN·kWh−1);
- C is the fixed costs, depending on the amount of contracted capacity (PLN·kW−1).
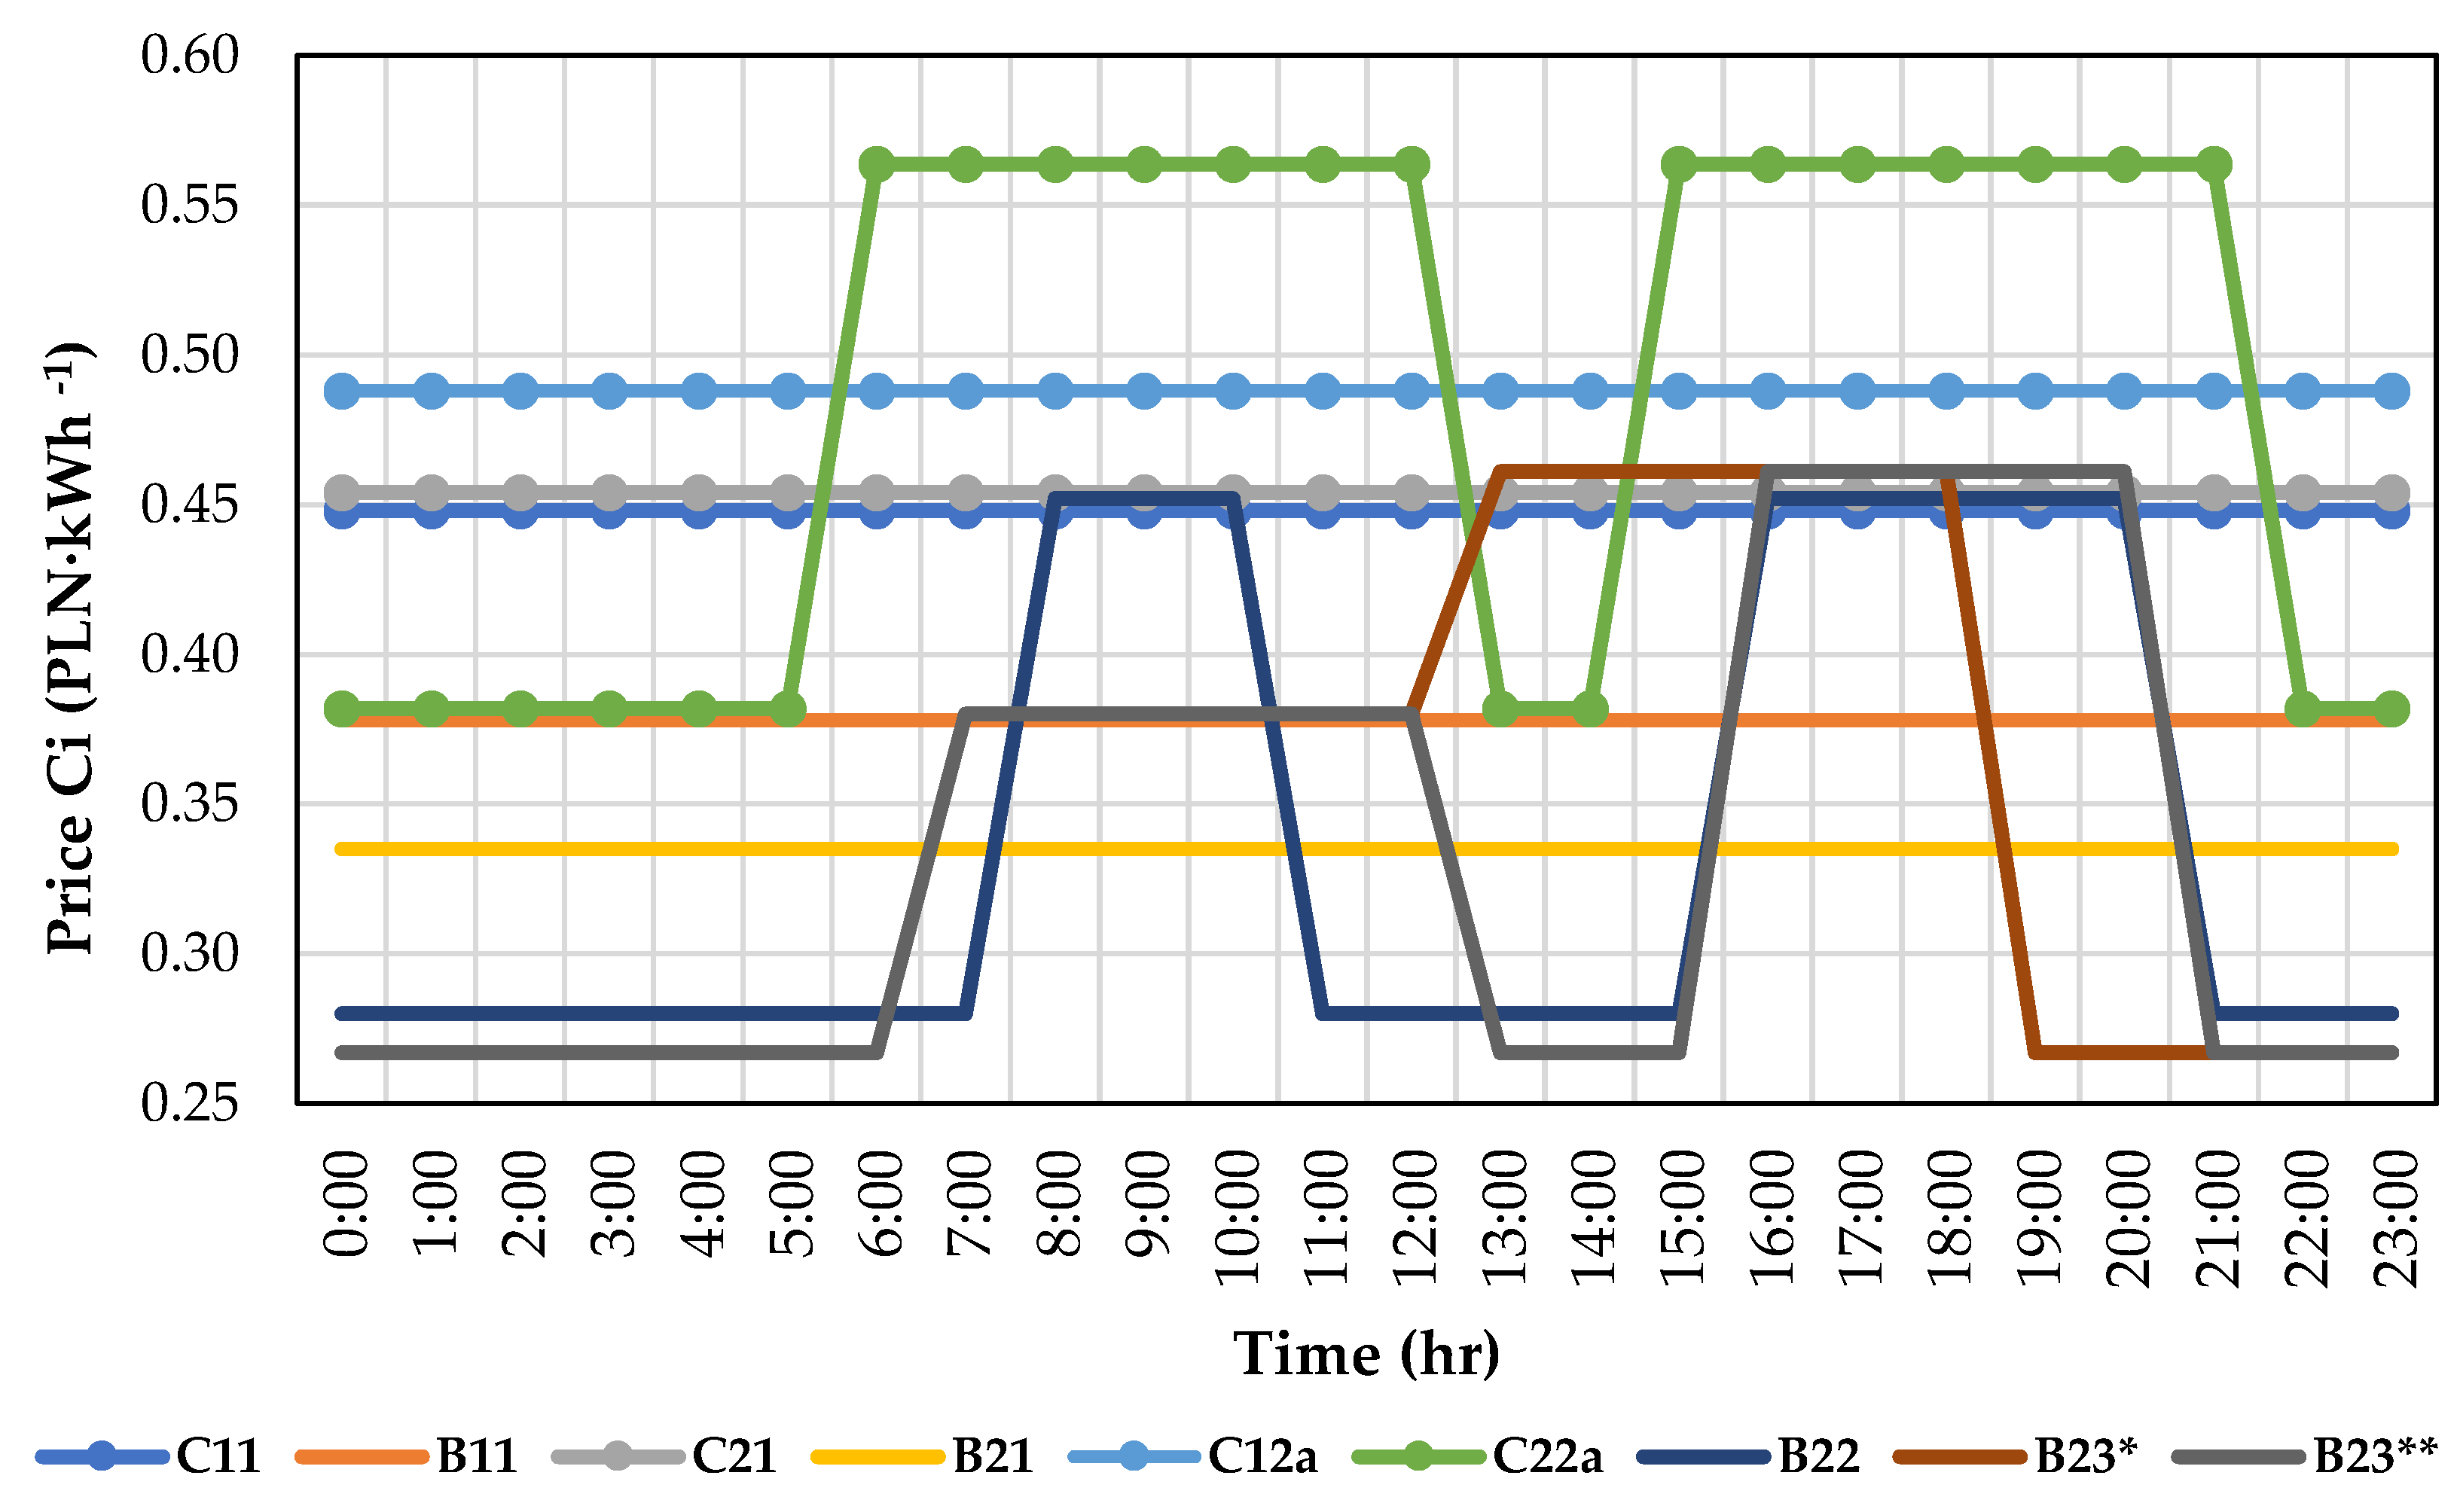
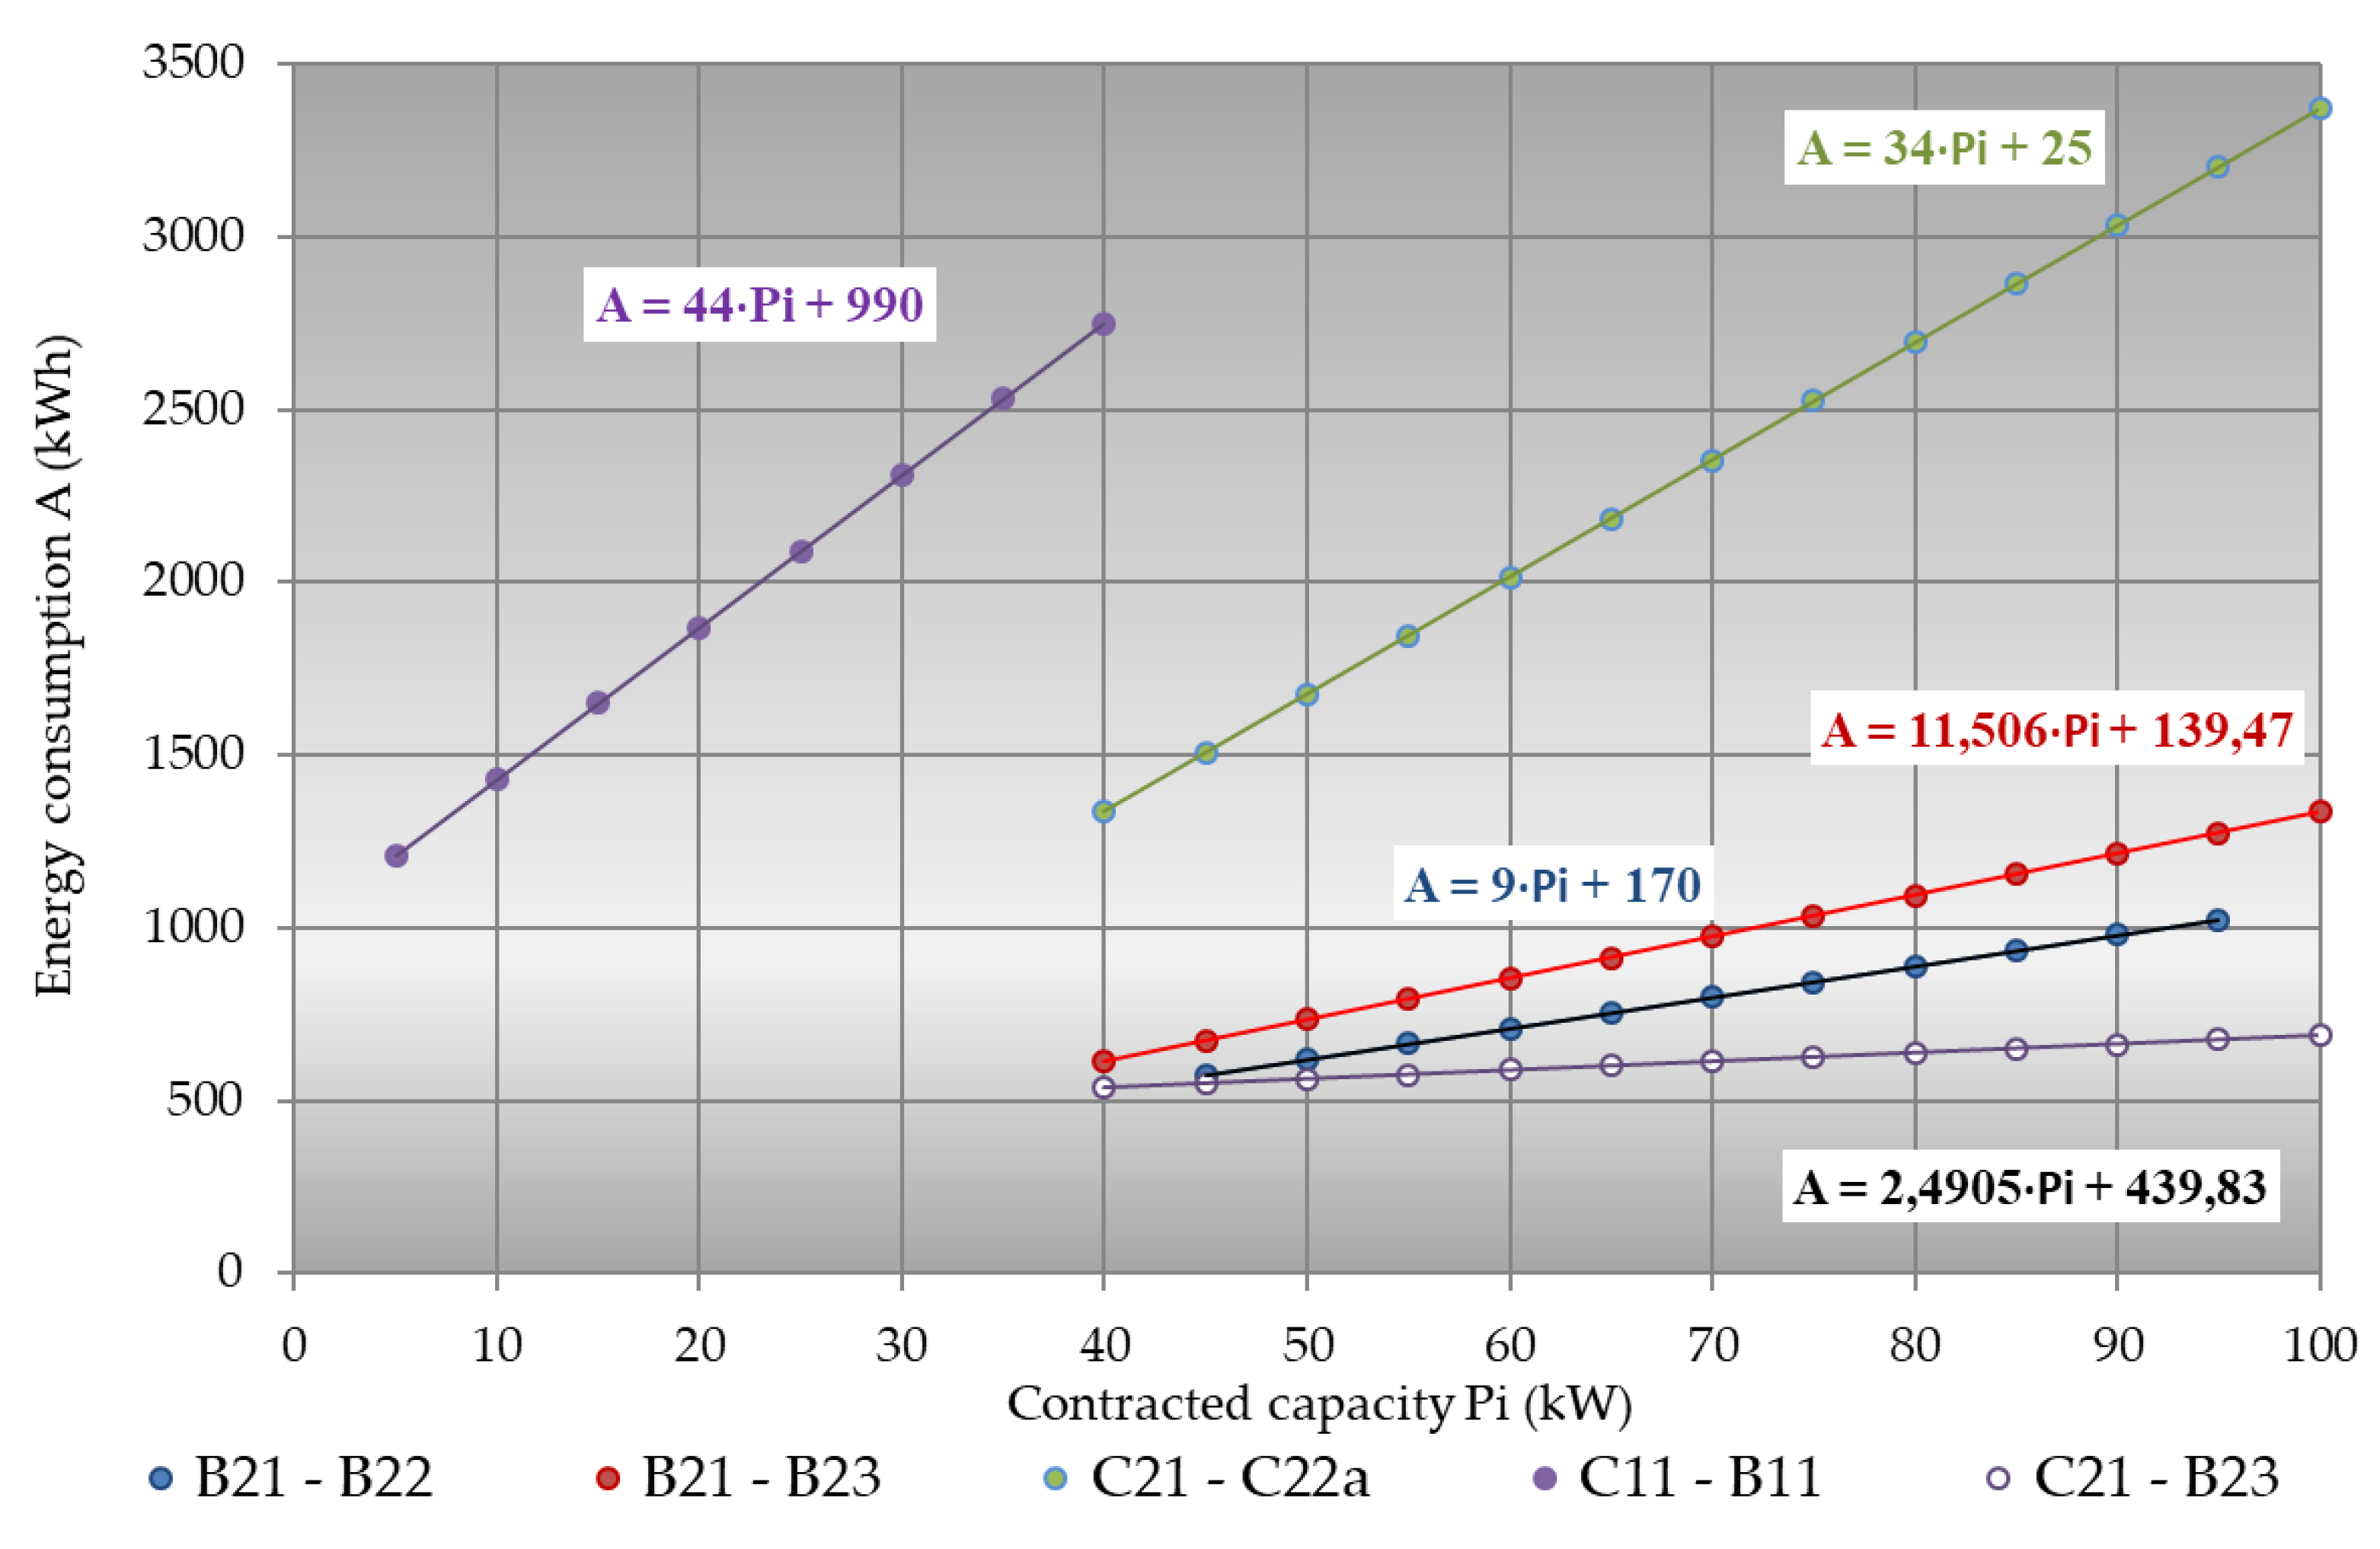
3.4. Energy Charges at Different Zone Tariffs—Profitability Ratios (PR)
- E is the average unit price (expenditure) for consumed active energy (PLN·kWh−1);
- C is the cost of active energy (PLN);
- A is the amount of active energy consumed (kWh).
- changing the tariff and minimizing the average rate of charges for the consumed active energy;
- optimizing the contracted capacity (Pi).
- One-zone tariff (24 h):
- Two-zone tariff:
- Multi-zone tariff:
- PRI,II,III is the relative value of the profitability ratio index in tariffs (-);
- P is the average price for active energy (PLN·kWh−1);
- STc is the energy rate at a 24 h tariff zone taking into account additional charges related to the energy consumed, i.e., network and industry charges (PLN·kWh−1);
- STI is the energy rate at tariff zone I, taking into account additional charges related to the energy consumed, i.e., network and industry charges (PLN·kWh−1);
- STII is the energy rate at tariff zone II, taking into account additional charges related to the energy consumed, i.e., network and industry charges (PLN·kWh−1);
- STIII is the energy rate at tariff zone III, taking into account additional charges related to the energy consumed, i.e., network and industry charges (PLN·kWh−1);
- EII is the amount of peak energy (at tariff zone I) in relation to the 24 h rate (STI/STc) (-);
- EIII is the amount of off-peak energy ratio in relation to the 24 h rate (STII/STc) (-);
- EIIII is the amount of energy expressed as an indicator of the energy in the remaining hours in relation to the daily rate (STIII/STc) (-);
- αpeak is the share of energy consumed in the peak zone (-);
- αoffpeak is the share of energy consumed in the off-peak zone (-).
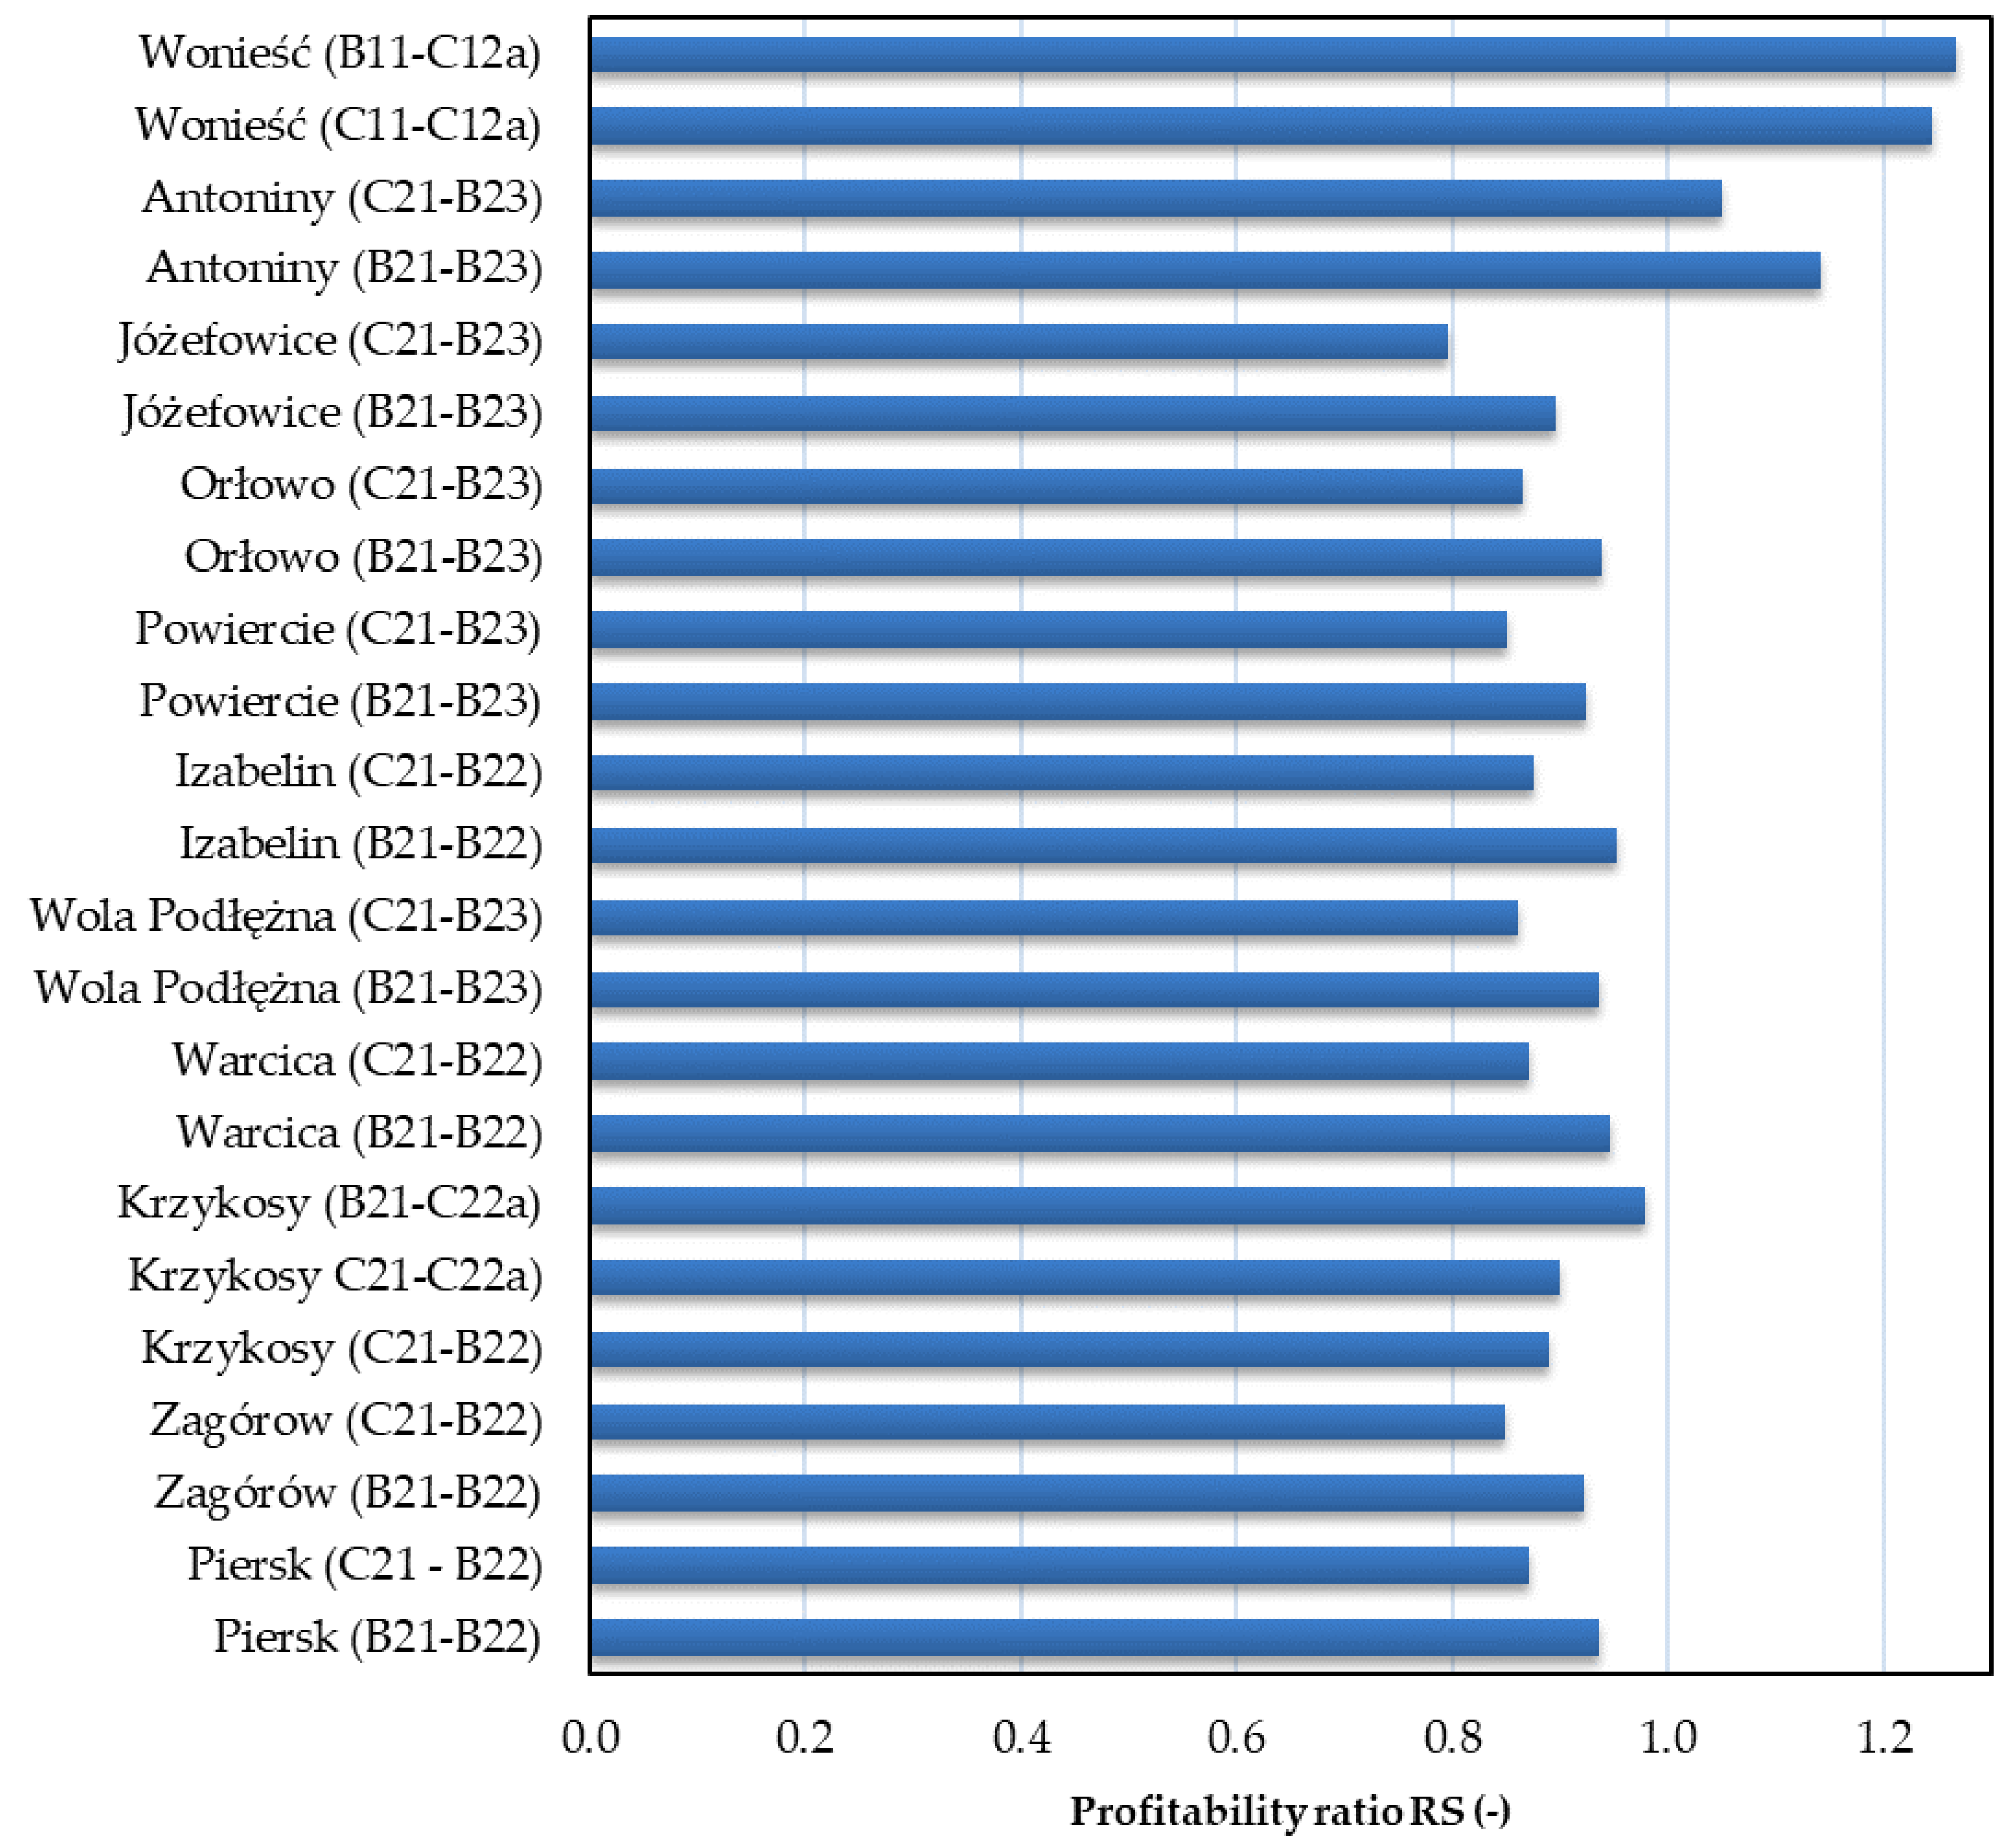
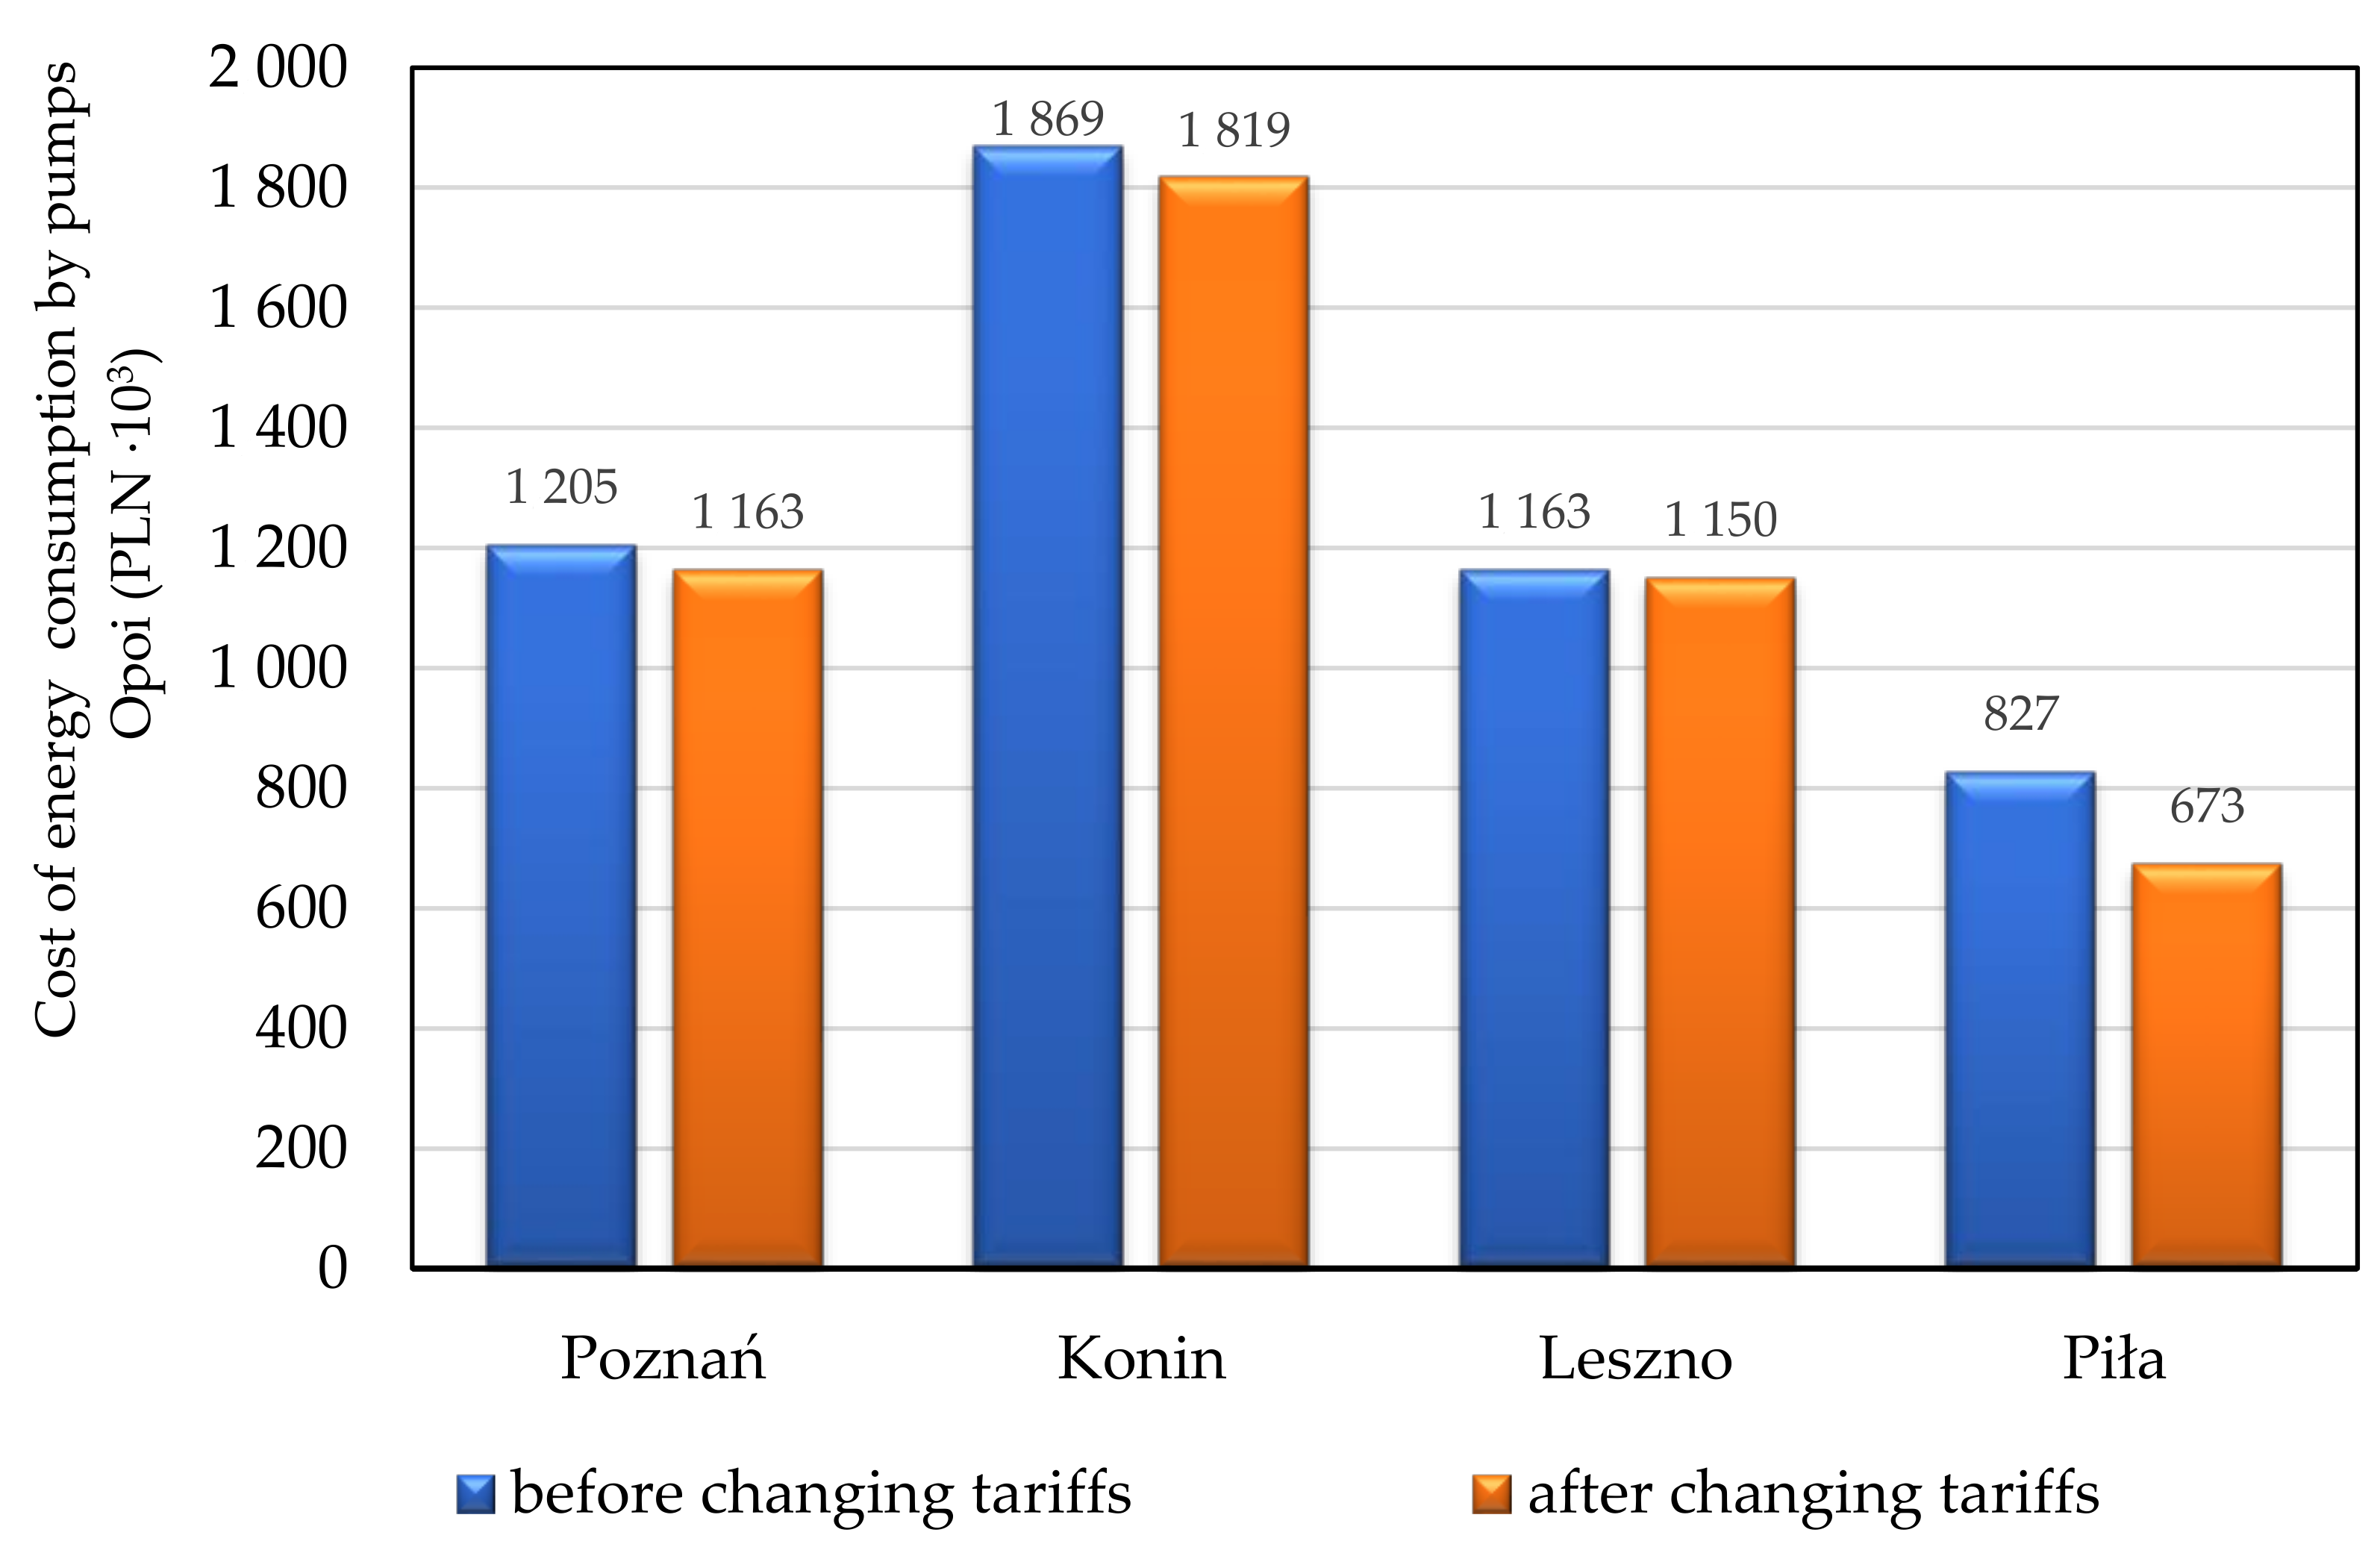
4. Results
Profitability from Changing Energy Tariffs
5. Discussion
6. Conclusions
- the amount of energy used in the process of pumping water and the amount of energy used for purposes related to the general operation of the pumping station (lighting, heating, etc.);
- the power of the largest pump unit, which affects the level of contracted capacity and, thus, increases costs;
- the conditions of water inflow to the pumping station, specifying the number and frequency of starts (the larger the inlet tank, the greater the possibility of adjusting the pump operation to off-peak hours).
Funding
Institutional Review Board Statement
Informed Consent Statement
Data Availability Statement
Conflicts of Interest
References
- Abdelaziz, E.A.; Saidur, R.; Mekhilef, S. A review on energy saving strategies in industrial sector. Renew. Sustain. Energy Rev. 2011, 15, 150–168. [Google Scholar] [CrossRef]
- Shankar, V.K.A.; Umashankar, S.; Paramasivam, S.; Hanigovszki, N. A comprehensive review on energy efficiency enhancement initiatives in centrifugal pumping system. Appl. Energy 2016, 181, 495–513. [Google Scholar] [CrossRef]
- U.S. Energy Information Administration. International Energy Outlook 2021. Available online: https://www.eia.gov/outlooks/ieo/ (accessed on 1 September 2021).
- GUS; Statistics Poland. Local Data Bank. Available online: https://bdl.stat.gov.pl/BDL/dane/podgrup/tablica (accessed on 7 November 2021).
- Jędral, W. Res and energy efficiency in context of challenges for electricity generation and utilization on energy in Poland. Rynek Energii 2019, 5, 144–156. [Google Scholar]
- Waide, P.; Brunner, C. Energy-Efficiency Policy Opportunities for Electric Motor-Driven Systems; IEA Energy Papers 2011/07; OECD Publishing: Paris, France, 2011; pp. 1–132. [Google Scholar] [CrossRef]
- European Commission (EC). Study on Improving the Energy Efficiency of Pumps. 2001. Available online: https://www.google.com/url?sa=t&rct=j&q=&esrc=s&source=web&cd=&ved=2ahUKEwjMvu7V2bT1AhXsiIsKHfmQCNcQFnoECAQQAQ&url=https%3A%2F%2Fwww.jacobalbertsen.dk%2Fkomposit%2FDarmstadtrapport.pdf&usg=AOvVaw0vhrRGFmmscPTYFA667sRO (accessed on 1 September 2021).
- Hovstadious, G. Industrial Energy Efficiency Project: Pump Systems Optimization—End User Training; United Nations Industrial Development Organization: Cape Town, South Africa, 2012. [Google Scholar]
- Waghmode, L.Y.; Birajdar, R.S.; Joshi, S.G. a life cycle cost analysis approach for selection of a typical heavy usage multistage centrifugal pump. In Proceedings of the 8th Biennial ASME Conference on Engineering Systems Design and Analysis, Torino, Italy, 4–7 July 2006; Volume 2, pp. 865–873. [Google Scholar] [CrossRef]
- Kim, M.; Choi, T.; Kim, M.; Han, S.; Koo, J. Optimal operation efficiency and control of water pumps in multiple water reservoir system: Case study in Korea. Water Sci. Technol. Water Supply 2015, 15, 59–65. [Google Scholar] [CrossRef]
- Augustyn, T. Energy efficiency and savings in pumping systems—The holistic approach. In Proceedings of the Southern African Energy Efficiency Convention (SAEEC), Johannesburg, South Africa, 14–15 November 2012; pp. 1–7. [Google Scholar] [CrossRef]
- Bykowski, J.; Napierała, M.; Przybyła, C. Energy efficiency assessment of retrofits’ land reclamation pumping stations. Annu. Set Environ. Prot. 2015, 17, 1413–1427. [Google Scholar]
- Zheng, G.; Huang, Q. Energy optimization study of rural deep well two-stage water supply pumping station. IEEE Trans. Control Syst. Technol. 2015, 24, 1308–1316. [Google Scholar] [CrossRef]
- Napierala, M.; Bykowski, J. Approach to divide of land reclamation pumping stations work at polder areas. Wiadomości Melior. Łąkarskie 2017, 60, 73–78. [Google Scholar]
- NRP. National Report of President of ERO. 2019. Available online: https://www.google.com/url?sa=t&rct=j&q=&esrc=s&source=web&cd=&ved=2ahUKEwiE5KXIttr0AhXuAhAIHVWaAwUQFnoECCMQAQ&url=https%3A%2F%2Fwww.ure.gov.pl%2Fdownload%2F2%2F478%2FNationalReport2019.pdf&usg=AOvVaw3nOHRmgOr-rF2YMVPiOENI (accessed on 1 September 2021).
- Energy Law from April 10, 1997 (Journal of Laws No. 54, Item 348, as Amended). Available online: https://isap.sejm.gov.pl/isap.nsf/download.xsp/WDU19970540348/U/D19970348Lj.pdf (accessed on 1 September 2021).
- Minister of Economy. The Energy Policy of Poland until 2030, M.P. Monit. Pol. 2010, 2, 27–149. Available online: http://isap.sejm.gov.pl/isap.nsf/DocDetails.xsp?id=WMP20100020011 (accessed on 7 December 2021).
- Ministry of Climate and Environment (MCE). Energy Policy of Poland until 2040. Available online: https://www.gov.pl/web/klimat/polityka-energetyczna-polski (accessed on 7 December 2021).
- Eurlex. European Union Legislation. Available online: https://eur-lex.europa.eu/summary/chapter/18.html?expand=1807#arrow_1807 (accessed on 7 December 2021).
- Nafkha, R.; Gajowniczek, K.; Ząbkowski, T. Do Customers Choose Proper Tariff? Empirical Analysis Based on Polish Data Using Unsupervised Techniques. Energies 2018, 11, 514. [Google Scholar] [CrossRef]
- European Parliament (EP). DIRECTIVE (EU) 2018/2002 on energy efficiency. Off. J. Eur. 2018, 328, 210–230. Available online: https://eur-lex.europa.eu/legal-content/EN/TXT/?uri=uriserv%3AOJ.L_.2018.328.01.0210.01.ENG (accessed on 6 December 2021).
- Tariff Regulation (TR). Regulation of the Minister of Energy of March 6, 2019, on Detailed Rules for the Formation and Calculation of Tariffs and Settlements in Trading in Electricity, Dz.U. 2019 poz. 503. Available online: http://isap.sejm.gov.pl/isap.nsf/DocDetails.xsp?id=WDU20190000503 (accessed on 6 December 2021).
- Szydło, R.; Wiśniewska, S.; Tyrańska, M.; Dolot, A.; Bukowska, U.; Koczyński, M. Employer Expectations Regarding the Competencies of Employees on the Energy Market in Poland. Energies 2021, 14, 7233. [Google Scholar] [CrossRef]
- Grycan, W. Legislative support for improving sustainable and smart electricity consumption in polish residential sector. J. Clean. Prod. 2020, 266, 121995. [Google Scholar] [CrossRef]
- Ghani, G.M. Does trade liberalization effect energy consumption? Energy 2012, 43, 285–290. [Google Scholar] [CrossRef]
- Rys, M.; Wilczynski, A. Examination of energy tariffs efficiency impact on energy demand. Electr. Rev. 2006, 82, 82–83. [Google Scholar]
- Billewicz, K. Effectiveness of DSR—Between stimulus and response. Przegląd Elektrotechniczny 2012, 88, 308–314. [Google Scholar]
- Weron, R. Electricity price forecasting: A review of the state-of-the-art with a look into the future. Int. J. Forecast. 2014, 30, 1030–1081. [Google Scholar] [CrossRef]
- Kowalska-Pyzalska, A.; Maciejowska, K.; Suszczynski, K.; Sznajd-Weron, K.; Weron, R. Turning green: Agent-based modeling of the adoption of dynamic electricity tariffs. Energy Policy 2014, 72, 164–174. [Google Scholar] [CrossRef]
- Aymerich, I.; Rieger, L.; Sobhani, R.; Rosso, D.; Corominas, L. The Difference Between Energy Consumption and Energy Cost: Modelling Energy Tariff Structures for Water Resource Recovery Facilities. Water Res. 2015, 81, 113–123. [Google Scholar] [CrossRef]
- Water Law (WL). Internet System of Legal Acts. Available online: https://isap.sejm.gov.pl/isap.nsf/DocDetails.xsp?id=WDU20170001566 (accessed on 5 December 2021).
- Central Statistical Office (CSO). Statistical Yearbook of Agriculture. Branch Yearbooks; Central Statistical Office: Warsaw, Poland, 2014; p. 445. Available online: https://stat.gov.pl/obszary-tematyczne/roczniki-statystyczne/roczniki-statystyczne/rocznik-statystyczny-rolnictwa-2014,6,8.html (accessed on 7 December 2021).
- Napierala, M.; Bykowski, J.; Przybyla, C.; Mrozik, K. Functioning of low lift pumping stations on polders—A case study of Zagorow, Poland. FEB Fresenius Env. Bull. 2018, 27, 6598–6609. [Google Scholar]
- Grycan, W. Energy efficiency improvement—A case study of electricity consumption in polish households. In Proceedings of the 2019 4th International Conference on Smart and Sustainable Technologies (SpliTech), Split, Croatia, 18–21 June 2019; pp. 1–5. Available online: https://ieeexplore.ieee.org/abstract/document/8783192 (accessed on 26 October 2021).
- European Commission (EC). Communication from the Commission on the Revision of the Method for Setting the Reference and Discount Rates. OJ C 14, 19.1.2008. pp. 6–9. Available online: https://eur-lex.europa.eu/legal-content/EN/ALL/?uri=CELEX%3A52008XC0119%2801%29 (accessed on 5 December 2021).
- Cousins, T. Using time of use (TOU) tariffs in industrial, commercial and residential applications effectively. TLC Eng. Solut. 2009. Available online: http://www.tlc.co.za/white_papers/pdf/using_time_of_use_tariffs_in_industrial_commercial_and_residential_applications_effectively.pdf (accessed on 5 December 2021).
- Kottek, M.; Grieser, J.; Beck, C.; Rudolf, B.; Rubel, F. World Map of the Köppen-Geiger climate classification updated. Meteorol. Z. 2006, 15, 259–263. [Google Scholar] [CrossRef]
- World Meteorological Organization (WMO). World Weather Information Service. Available online: https://worldweather.wmo.int/en/city.html?cityId=26 (accessed on 3 December 2021).
- Mrozik, K. Assessment of Retention Potential Changes as an Eslement of Suburbanization Monitoring on Example of an Ungauged Catchment in Poznan Metropolitan Area (Poland). Annu. Set Environ. Prot. 2016, 18, 188–200. [Google Scholar]
- Mrozik, K. The Impact of Soil Cultivations Methods on Retention Capacity of Kania Rriver Basin. Wasserwirtschaft 2012, 102, 75–79. [Google Scholar] [CrossRef]
- Łabędzki, L.; Ostrowski, J. Precipitation Preventing a Deficit of Readily Available Soil Water in Arable Soils in Poland. Atmosphere 2018, 9, 121. [Google Scholar] [CrossRef]
- Van der Molen, W.H.; Beltrán, J.M.; Ochs, W.J. Guidelines and Computer Programs for the Planning and Design of Land Drainage Systems; FAO Irrigation and Drainage Paper 62; FAO: Rome, Italy, 2007; p. 250. [Google Scholar]
- Smedema, L.K.; Vlotman, W.F.; Rycroft, D.V. Modern Land Drainage: Planning and Management of Agricultural Drainage Systems; CRC Press: London, UK, 2004. [Google Scholar]
- Walczak, N.; Hammerling, M.; Bykowski, J.; Walczak, Z. Economic and Hydraulic Criteria for Maintenance of Good Condition of Drainage Ditches. J. Agribus. Rural Dev. 2015, 35, 137–146. [Google Scholar] [CrossRef]
- IPPC. Zmiana Klimatu. Raport Syntetyczny. Wkład Grup Roboczych I, II, III do Czwartego Raportu Oceniającego Międzyrządowego Zespołu ds. Zmian Klimatu; Wyd. IOŚ: Warsaw, Poland, 2009; p. 112. (In Polish) [Google Scholar]
- Starkel, L.; Kundzewicz, Z.W. Consequences of climate change for spatial organization of Poland. Nauka 2008, 1, 103–118. [Google Scholar]
- Van Overloop, P. Model Predictive Control on Open Water Systems; Delft University Press: Delft, The Netherlands, 2006; p. 192. [Google Scholar]
- Van Overloop, P.J. Drainage control in water management of polders in the Netherlands. Irrig. Drain. Syst. 2006, 20, 99–109. [Google Scholar] [CrossRef]
- Van Zuidam, B.G. Modeling the Seasonal Change of Aquatic Vegetation in Ditches. Master’s Thesis, Wageningen University, Wageningen, The Netherlands, 2009. [Google Scholar]
- Walczak, N.; Walczak, Z.; Hämmerling, M.; Przedwojski, B. Analytical Model for Vertical Velocity Distribution and Hydraulic Roughness at the Flow Through River Bed and Valley with Vegetation. Annu. Set Environ. Prot. 2013, 15, 405–419. [Google Scholar]
- Van Overloop, P.; Schuurmans, J.; Brouwer, R.; Burt, C.M. Multiple-Model Optimization of Proportional Integral Controllers on Canals. J. Irrig. Drain Eng. 2005, 131, 190–196. [Google Scholar] [CrossRef][Green Version]
- Baghlani, A. Optimal Control of Pumping Station in Open Channels by Metaheuristic Firefly Algorithm. Int. J. Optim. Civ. Eng. 2012, 2, 369–382. [Google Scholar]
- Nowicki, R.; Bate, M. An Intelligent Approach to Anomaly Detection at Work of Machines Driven by Electric Motors. Masz. Elektr. Zesz. Probl. 2013, 2, 241–246. [Google Scholar]
- Mala-Jetmarova, H.; Sultanova, N.; Savic, D. Lost in optimisation of water distribution systems? A literature review of system operation. Environ. Model. Softw. 2017, 93, 209–254. [Google Scholar] [CrossRef]
- Wang, Y.; Too Yok, K.; Wu, W.; Simpson, A.R.; Weyer, E.; Manzie, C. Minimizing Pumping Energy Cost in Real-Time Operations of Water Distribution Systems Using Economic Model Predictive Control. J. Water Resour. Plan. Manag. 2021, 147, 04021042. [Google Scholar] [CrossRef]
- Olsson, G. Water and Energy: Threats and Opportunities; IWA Publishing: London, UK, 2002. [Google Scholar]
- Moradi-Jalal, M.; Mariño, M.A.; Afshar, A. Optimal design and operation of irrigation pumping stations. J. Irrig. Drain. Eng. 2003, 129, 149–154. [Google Scholar] [CrossRef]
- Sterling, M.; Coulbeck, B. A dynamic programming solution to optimization of pumping costs. Proc. Inst. Civ. Eng. 1975, 59, 813–818. [Google Scholar]
- Giacomello, C.; Kapelan, Z.; Nicolini, M. Fast hybrid optimization method for effective pump scheduling. J. Water Resour. Plan. Manag. 2013, 139, 175–183. [Google Scholar] [CrossRef]
- Kurian, V.; Narasimhan, S.; Narasimhan, S. Optimal scheduling of rural water supply schemes. In Proceedings of the 5th IFAC Conference on Advances in Control and Optimization of Dynamical Systems (ACODS), Hyderabad, India, 18–22 February 2018; pp. 142–147. [Google Scholar]
- Ormsbee, L.E.; Reddy, S.L. Nonlinear heuristic for pump operations. J. Water Resour. Plan. Manag. 1995, 121, 302–309. [Google Scholar] [CrossRef]
- Bagirov, A.; Barton, A.; Mala-Jetmarova, H.; Al Nuaimat, A.; Ahmed, S.; Sultanova, N.; Yearwood, J. An algorithm for minimization of pumping costs inwater distribution systems using a novel approach to pump scheduling. Math. Comput. Model. 2013, 57, 873–886. [Google Scholar] [CrossRef]
- Blinco, L.J.; Simpson, A.R.; Lambert, M.F.; Marchi, A. Comparison of pumping regimes for water distribution systems to minimize cost and greenhouse gases. J. Water Resour. Plan. Manag. 2016, 142, 04016010. [Google Scholar] [CrossRef]
- Goldman, F.E.; Mays, L.W. The application of simulated annealing to the optimal operation of water systems. In Proceedings of the 29th Annual Water Resources Planning and Management Conference, Tempe, AZ, USA, 6–9 June 1999; pp. 1–16. [Google Scholar]
- Wegley, C.; Eusuff, M.; Lansey, K. Determining pump operations using particle swarm optimization. In Proceedings of the Joint Conference on Water Resource Engineering and Water Resources Planning and Management, Minneapolis, MN, USA, 30 July–2 August 2000; pp. 1–6. [Google Scholar]
- Raso, L.; Schwanenberg, D.; van de Giesen, N.C.; van Overloop, P.J. Short-term optimal operation of water systems using ensemble forecasts. Adv. Water Resour. 2014, 71, 200–208. [Google Scholar] [CrossRef]
- Grycan, W. Congruent modelling as a tool for forecasting of households electricity consumption. In Proceedings of the 2016 Progress in Applied Electrical Engineering (PAEE), Koscielisko-Zakopane, Poland, 26 June–1 July 2016. [Google Scholar] [CrossRef]
- Spees, K.; Lave, L. Impacts of responsive load in PJM: Load shifting and real time pricing. Energy J. 2008, 29, 101–122. [Google Scholar] [CrossRef]
- Alvisi, S.; Franchini, M. A Methodology for Pumping Control Based on Time Variable Trigger Levels. Procedia Eng. 2016, 162, 365–372. [Google Scholar] [CrossRef]
- Nęcka, K. Efficiency analysis of changing rate of group on example of sewage treatment plant. Agric. Eng. 2012, 16, 257–266. [Google Scholar]
- Zhang, H.; Zhao, F.; Fang, K.; Sutherland, J.W. Energy-conscious flow shop scheduling under time-of-use electricity tariffs. CIRP Ann. Manuf. Technol. 2014, 63, 37–40. [Google Scholar] [CrossRef]


| Tariff Symbol X1,X2,X3,X4 | ||
|---|---|---|
| X1 | B | Consumer of energy from the medium voltage grid |
| C | Consumer of energy from the low voltage grid | |
| X2 | 1 | Contracted capacity ≤ 40 kW |
| 2 | Contracted capacity > 40 kW | |
| X3 | 1 | One time zone (24 h) |
| 2 | Two time zones (off-peak, on-peak) | |
| 3 | Three time zones (off-peak, mid-peak, on-peak) | |
| X4 | a | Division of the day into peak and off-peak |
| b | Division of the day into a day and night | |
| Districts of WZMiUW | Pumping Stations | Q∑ (m3/s) | Fp∑ (ha) | P∑ (kW) |
|---|---|---|---|---|
| KONIN | 11 | 35.2 | 42,609 | 2477 |
| POZNAŃ | 12 | 12.4 | 7544 | 836 |
| LESZNO | 12 | 13.0 | 7477 | 753 |
| PIŁA | 4 | 5.5 | 2231 | 484 |
| OSTRÓW WLKP | 1 | 1.6 | 264 | 82 |
| Districts of WZMiUW | 2010–2013 | 2014 | 2015 | 2016 | 2017 | 2018 | 2019 | 2020 | 2021 | Total |
|---|---|---|---|---|---|---|---|---|---|---|
| Poznań | 156,251 | 40,781 | 42,576 | 44,449 | 46,405 | 48,447 | 50,578 | 52,804 | 55,127 | 537,418 |
| Konin | 134,341 | 35,063 | 36,606 | 38,216 | 39,898 | 41,653 | 43,486 | 45,399 | 47,397 | 462,059 |
| Leszno | 161,576 | 42,171 | 44,027 | 45,964 | 47,986 | 50,098 | 52,302 | 54,603 | 57,006 | 555,733 |
| Piła | 42,408 | 11,068 | 11,555 | 12,064 | 12,595 | 13,149 | 13,727 | 14,331 | 14,962 | 145,859 |
| TOTAL: | 494,575 | 129,084 | 134,764 | 140,693 | 146,884 | 153,347 | 160,094 | 167,138 | 174,492 | 1,701,070 |
Publisher’s Note: MDPI stays neutral with regard to jurisdictional claims in published maps and institutional affiliations. |
© 2022 by the author. Licensee MDPI, Basel, Switzerland. This article is an open access article distributed under the terms and conditions of the Creative Commons Attribution (CC BY) license (https://creativecommons.org/licenses/by/4.0/).
Share and Cite
Napierała, M. A Study on Improving Economy Efficiency of Pumping Stations Based on Tariff Changes. Energies 2022, 15, 799. https://doi.org/10.3390/en15030799
Napierała M. A Study on Improving Economy Efficiency of Pumping Stations Based on Tariff Changes. Energies. 2022; 15(3):799. https://doi.org/10.3390/en15030799
Chicago/Turabian StyleNapierała, Michał. 2022. "A Study on Improving Economy Efficiency of Pumping Stations Based on Tariff Changes" Energies 15, no. 3: 799. https://doi.org/10.3390/en15030799
APA StyleNapierała, M. (2022). A Study on Improving Economy Efficiency of Pumping Stations Based on Tariff Changes. Energies, 15(3), 799. https://doi.org/10.3390/en15030799