
Assessment of Energy Sustainability Issues in the Andean Community: Additional Indicators and Their Interpretation


Abstract
:1. Introduction
- To adapt the WEC methodology and select indicators for calculating energy sustainability indices for the members of the Andean Community that rely on hydroelectric power;
- To select and calculate additional indicators and to explain the WETI ranks of the Andean Community countries;
- To identify the factors influencing the energy sectors of the Andean Community members and such characteristics as energy security, energy equity, environmental sustainability, and country context, with the aim of integrating them into one system in the future.
2. Materials and Methods
2.1. The System of Indicators Developed by the Authors Is Based on the World Energy Trilemma Framework and the Energy Sustainability Index of the World Energy Council
2.2. The Proposed Methodology for Assessing Energy Sustainability
3. Literature Review
4. Results
5. Discussion
6. Conclusions and Implications
- Energy sustainability indicators that are used to assess energy security, energy equity, and environmental sustainability that were proposed by the WEC as part of the Energy Trilemma framework provide for comparing countries but do not produce detailed results that can be explained. The situation with country context assessment is even more complicated as countries differ significantly from each other in many characteristics.
- WEC indicators can be adjusted when analyzing groups of countries in such a way that takes into account their economic and geographical conditions, the availability of fossil fuels, and the potential of using renewable energy sources, including hydropower. It will make it impossible to compare countries using global ranks, but it allows for comparing countries that are similar in their socio-economic and geographic parameters, which will help to develop energy policies for both individual countries and their unions.
- The analysis of the WEC methodology using open sources revealed that many indicators in the methodology are interconnected and the assessment of individual indicators should be supplemented by taking into account their interconnections. For example, the shortage of fossil fuels stimulates the use of renewable energy sources, which requires significant investments from the state. An increase in generation volumes leads to a decrease in costs and prices, which makes energy more available. The complex impact of energy facilities on the environment is manifested in different types of emissions, impact on soils, and landscape disturbances, even in the case of hydropower.
- The proposed adapted methodology for calculating energy sustainability indices in countries with a dominant role of hydropower (Latin America, Andean Community) includes twelve main indicators and six additional ones. The energy security dimension includes the following indicators: the percentage of imports, diversity of electricity generation, and energy storage (petroleum reserves, gas reserves, and carbon reserves); the energy equity dimension comprises access to electricity (% of the population), electricity prices, and gasoline prices. The environmental sustainability dimension includes final energy intensity, low carbon electricity generation, and CO2 emissions per capita. The country context dimension includes macroeconomic stability, effectiveness of government, and innovation capacity. Additional indicators include hydropower nominal capacity, hydropower generation, and the amount of electricity purchased with an average salary, which have been analyzed in this article. Three more additional indicators—hydropower potential, methane emissions associated with hydropower generation, and governmental subsidies and grants for hydropower generation—are important to take into account; to calculate them, special information is required. This system allows for obtaining detailed assessments, comparing the performance and development results of countries with similar economic, geographic, and political characteristics, and explaining the results.
- The values of the selected indicators and indices for the four dimensions of energy sustainability in the proposed methodology characterize the state of the energy sector of the Andean Community countries and correspond to their grades in the WEC ranking.
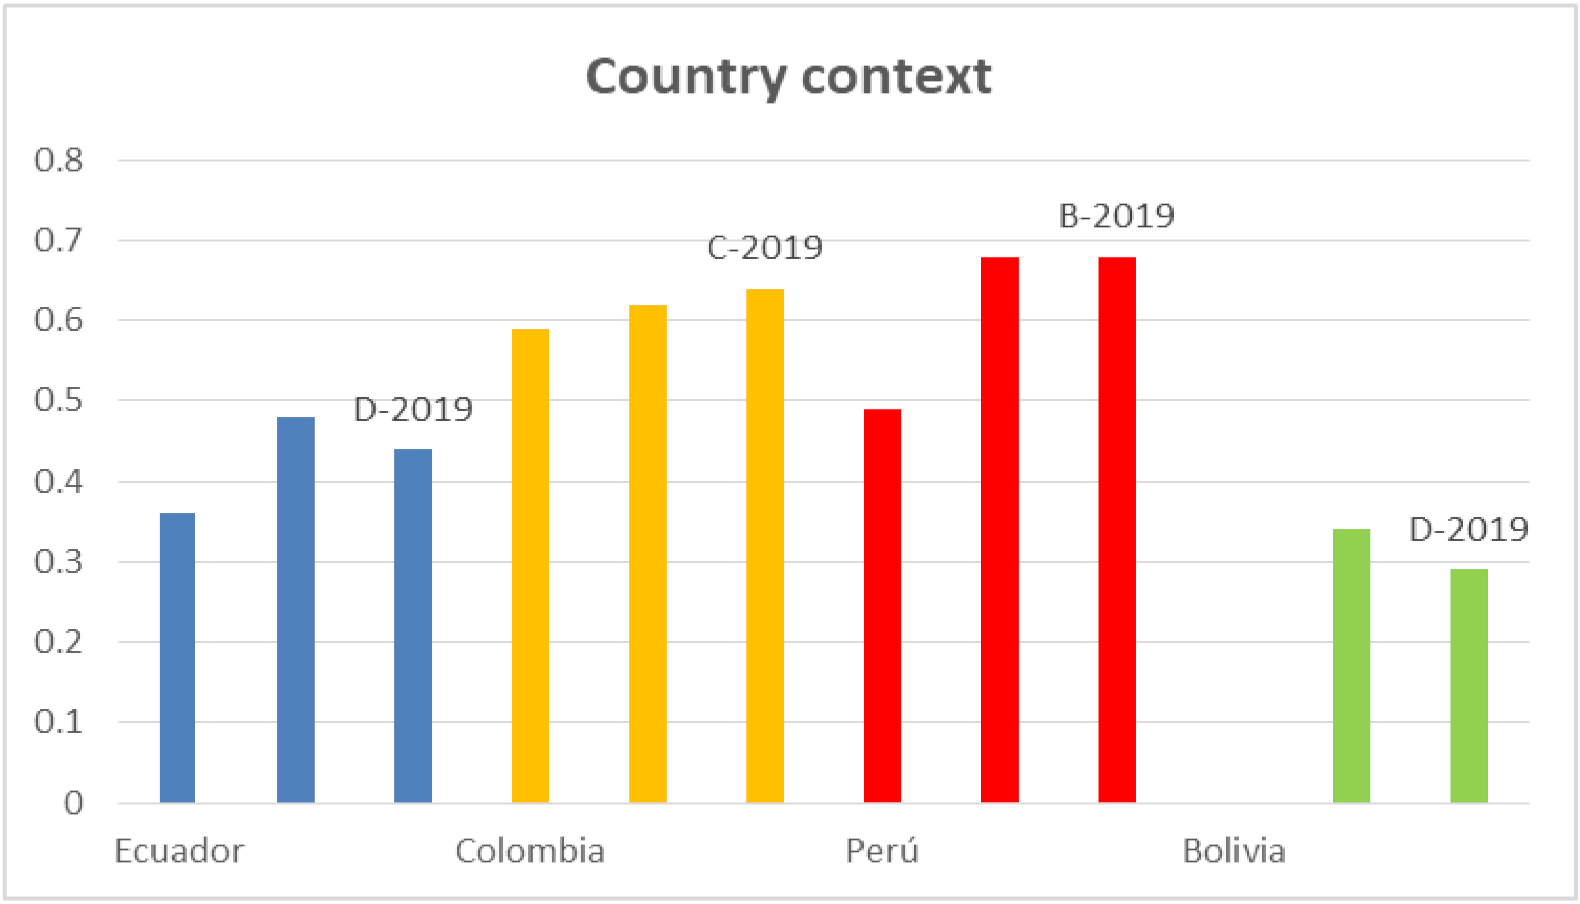
- The resulting average scores for the members of the Andean Community are approximately equal and do not correspond to the countries’ Energy Trilemma ranks. This is explained by averaging and the fact that integral metrics consist of a variety of indicators which influence each other. It also proves that rankings are not informative enough. Columbia and Peru score higher according to the new methodology (0.64 and 0.635 in 2019, respectively), which is explained by their better developed economies and policies and more powerful energy sectors (11,800 and 5100 MW, respectively). This is confirmed by the hydropower generation indicators (57 and 31 TWh). At the same time, Ecuador has a significant potential for hydropower generation and greatly grew in this area over the period of three years (19.7–20.5–24 TWh).
- As the example of the Andean Community shows, being ranked as an outsider does not reflect such characteristics as the economic and production results of the energy sector, energy accessibility, and the environmental impact of the energy sector, as well as the government’s efforts to improve management in the industry.
- The study revealed the factors that influence the energy sector of the Andean Community, which include the following: hydropower potential, hydropower nominal capacity, hydropower generation, the availability of energy for the population in terms of per capita income, the anthropogenic impact of hydroelectricity on natural ecosystems in terms of methane emissions, as well as state programs in areas of hydroelectricity, including projects for small-scale hydroelectric power plants and subsidies for the population.
- By taking into account additional indicators related to hydropower in the countries of the Andean Community, it becomes possible to supplement the previously obtained estimates on the levels of energy sustainability with information on hydropower generation, which allows for making better conclusions.
- Hydropower has a number of great advantages, including low production costs, the use of renewable energy sources, and zero emissions, which makes it more competitive in comparison with other energy sources and, in general, ensures an increase in energy sustainability. However, the challenges that this sector is associated with should be assessed. They include hydrographic requirements, human impact on water resources, and vast investments.
Author Contributions
Funding
Institutional Review Board Statement
Informed Consent Statement
Conflicts of Interest
Appendix A

References
- Litvinenko, V.S.; Tsvetkov, P.S.; Dvoynikov, M.V.; Buslayev, G.V. Baryery realizatsii vodorodnykh initsiativ v kontekste ustoychivogo razvitiya globalnoy energetiki. Zap. Gorn. Inst. 2020, 244, 421–431. [Google Scholar]
- Yurak, V.V.; Dushin, A.V.; Mochalova, L.A. Protiv ustoychivogo razvitiya: Stsenarii budushchego. Zap. Gorn. Inst. 2020, 242, 242–247. [Google Scholar]
- Stroykov, G.A.; Babyr, N.V.; Ilin, I.V.; Marchenko, R.S. System of comprehensive assessment of project risks in energy industry. Int. J. Eng. Trans. A Basics 2021, 34, 1778–1784. Available online: https://www.ije.ir/article_132525.html (accessed on 11 September 2021).
- Greene, D.L. Measuring Energy Sustainability. In Linkages of Sustainability; Graedel, T.E., van der Voet, E., Eds.; The MIT Press: Cambridge, MA, USA, 2009; Chapter 20; pp. 354–373. [Google Scholar]
- Catrini, A.P.; Catrini, A.P.; Piacentino, A.; Markovska, N.; Guzović, Z.; Mathiesen, B.V.; Ferrari, S.; Duić, N.; Lund, H. Sustainable development of energy, Water and Environment Systems. Energy 2020, 190, 116432. Available online: https://www.sciencedirect.com/science/article/pii/S0360544219321279 (accessed on 13 May 2021).
- Lopez, G.; Aghahosseini, A.; Bogdanov, D.; Lopez, G.; Aghahosseini, A.; Bogdanov, D.; Theophilus, N.O.; Ghorbani, N.; Caldera, U.; Prada Rivero, A.; et al. Pathway to a fully sustainable energy system for Bolivia across power, heat, and transport sectors by 2050. J. Clean. Prod. 2021, 293, 126195. Available online: https://www.sciencedirect.com/science/article/pii/S0959652621004157 (accessed on 15 September 2021). [CrossRef]
- World Energy Council. London. Available online: https://www.worldenergy.org/ (accessed on 17 May 2021).
- Mastepanov, A.; Chigarev, B. The Energy Trilemma Index Kak Ocenka Energeticheskoj Bezopasnosti. Obshchestvenno-Delovoj Nauchnyj Zhurnal Energeticheskaya Politika. 2020. Available online: https://energypolicy.ru/a-mastepanov-b-chigarev-the-energy-trilemma-index-kak-oczenk/energetika/2020/17/21/ (accessed on 30 May 2021).
- Nasibov, V.; Alizade, R. Comparative analysis of trend of change of Azerbaijan’s energy sector functioning stability at the current development stage. E3S Web Conf. 2020, 178, 01050. Available online: https://www.e3s-conferences.org/articles/e3sconf/abs/2020/38/e3sconf_hsted2020_01050/e3sconf_hsted2020_01050.html (accessed on 23 May 2021). [CrossRef]
- World Energy Council. World Energy Trilemma 2011: Policies for the Future—Assessment of Country Energy and Climate Policy. Available online: https://www.worldenergy.org/publications/entry/world-energy-trilemma-2011-policies-for-the-future-assessment-of-country-energy-and-climate-policy (accessed on 14 June 2021).
- World Energy Council. World Energy Trilemma Index 2019 Full Report. Available online: https://www.worldenergy.org/publications/entry/world-energy-trilemma-index-2019 (accessed on 14 June 2021).
- World Energy Council. World Energy Trilemma Index 2020 Full Report. Available online: https://www.worldenergy.org/publications/entry/world-energy-trilemma-index-2020 (accessed on 14 June 2021).
- Mastepanov, A.M.; Bushuev, V.V.; Voropaj, N.I.; Sumin, A.M. Problemy obespecheniya energeticheskoj bezopasnosti v usloviyah vysokoj geopoliticheskoj, ekologicheskoj, ekonomicheskoj i tekhnologicheskoj neopredelennosti. Aktual. Probl. Nefti Gaza 2017, 3, S1–S14. Available online: https://cyberleninka.ru/article/n/problemy-obespecheniya-energeticheskoy-bezopasnosti-v-usloviyah-vysokoy-geopoliticheskoy-ekologicheskoy-ekonomicheskoy-i (accessed on 10 July 2021).
- Mahova, L.A.; Hajkin, M.M.; Lapinskas, A.A. Economic challenges and problems related to natural resources management as a consequence of human capital accumulation. Utop. Prax. Latinoam. 2019, 24, 138–143. [Google Scholar]
- Quiroz Cabascango, V.E.; Bazhin, V.Y. Influence of the natural gas composition and flue gas recirculation in a reverberatory furnace for nickel alloys. IOP Conf. Ser. Mater. Sci. Eng. 2020, 919, 032027. [Google Scholar] [CrossRef]
- Khoshnava, S.M.; Rostami, R.; Zin, R.M.; Kamyab, H.; Majid, M.Z.A.; Alireza, Y.; Mardani, A. Green efforts to link the economy and infrastructure strategies in the context of sustainable development. Energy 2020, 193, 116759. Available online: https://www.sciencedirect.com/science/article/abs/pii/S0360544219324545?via%3Dihub (accessed on 20 September 2021). [CrossRef]
- Litvinenko, V.S. The Role of Hydrocarbons in the Global Energy Agenda: The Focus on Liquefied Natural Gas. Resources 2020, 9, 59. Available online: https://www.mdpi.com/2079-9276/9/5/59 (accessed on 14 September 2021). [CrossRef]
- Porfir’ev, B.N.; Roginko, S.A. Al’ternativnaya energetika i social’no orientirovannaya ekonomika. St.-Peterbg. Gos. Univ. 2016, 3, 4–19. [Google Scholar]
- Tcvetkov, P.S.; Cherepovitsyn, A.E.; Fedoseev, S.V. The Changing Role of CO2 in the Transition to a Circular Economy: Review of Carbon Sequestration Projects. Sustainability 2019, 11, 5834. [Google Scholar] [CrossRef] [Green Version]
- Lantz, T.L.; Ioppolo, G.; Yigitcanlar, T.; Arbolino, R. Understanding the correlation between energy transition and urbanization. Environ. Innov. Soc. Trans. 2021, 40, 73–86. Available online: https://www.sciencedirect.com/science/article/abs/pii/S2210422421000332 (accessed on 20 September 2021). [CrossRef]
- Ullah, A.; Zhang, Q.; Raza, S.A.; Ali, S. Renewable energy: Is it a global challenge or opportunity? Focusing on different income level countries through Panel Smooth Transition Regression Model. Renew. Energy 2021, 177, 689–699. Available online: https://www.sciencedirect.com/science/article/abs/pii/S0960148121008156 (accessed on 26 September 2021). [CrossRef]
- Blazquez, J.; Fuentes, R.; Manzano, B. On some economic principles of the energy transition. Energy Policy 2020, 147, 111807. Available online: https://www.sciencedirect.com/science/article/abs/pii/S0301421520305267 (accessed on 21 September 2021). [CrossRef]
- Marinina, O.; Nevskaya, M.; Jonek-Kowalska, I.; Wolniak, R.; Marinin, M. Recycling of Coal Fly Ash as an Example of an Efficient Circular Economy: A Stakeholder Approach. Energies 2021, 14, 3597. [Google Scholar] [CrossRef]
- Chong, C.T.; Fan, Y.V.; Lee, C.T.; Klemeš, J.J. Post COVID-19 energy sustainability and carbon emissions neutrality. Energy 2022, 241, 122801. [Google Scholar] [CrossRef]
- Vasilev, Y.N.; Cherepovitsyn, A.E.; Tsvetkova, A.Y.; Komendantova, N. Promoting Public Awareness of Carbon Capture and Storage Technologies in the Russian Federation: A System of Educational Activities. Energies 2021, 14, 1408. [Google Scholar] [CrossRef]
- Vasil’ev, Y.N.; Strojkov, G.A. Obzor prakticheskih instrumentov povysheniya obshchestvennoj osvedomlennosti o tekhnologiyah sekvestracii SO2 za rubezhom. RISK 2020, 1, S73–S77. [Google Scholar]
- Strojkov, G.A.; Il’inova, A.A.; Romasheva, N.V. Perspektivy i obshchestvennye effekty proektov sekvestracii i ispol’zovaniya uglekislogo gaza. Zap. Gorn. Inst. 2020, 244, 493–502. [Google Scholar]
- Alekseenko, S.V. Novyj etap chetvertogo energeticheskogo perekhoda. Energ. Prom. Ross. 2019, 18, 11–38. Available online: https://www.eprussia.ru/epr/374/9335671.htm (accessed on 16 September 2021).
- Oficial’nyj sajt Ministerstva Inostrannyh del Rossijskoj Federacii. Vneshnyaya Politika. Regional’nye Organizacii i Ob”edineniya. Organizacii Latinoamerikanskogo Regiona. Available online: https://www.mid.ru/organizacii-latinoamerikanskogo-regiona/-/asset_publisher/0vP3hQoCPRg5/content/id/400674 (accessed on 13 August 2021).
- World Energy Trilemma Index 2021. Available online: https://www.worldenergy.org/publications/entry/world-energy-trilemma-index-2021 (accessed on 20 November 2021).
- Official Cite of World Energy Council. World Energy Trilemma Index. Available online: https://www.worldenergy.org/transition-toolkit/world-energy-trilemma-index (accessed on 5 August 2021).
- Castillo, T.; García, F.; Mosquera, L.; Rivadeneira, T.; Segura, K.; Yujato, M. Panorama Energético de América Latina y El Caribe 2018; Círculo Publicitario: Quito, Ecuador, 2018; 405p, Available online: http://www.olade.org/publicaciones/panorama-energetico-de-america-latina-y-el-caribe-2018/ (accessed on 11 June 2021).
- Castillo, T.; García, F.; Mosquera, L.; Rivadeneira, T.; Segura, K.; Yujato, M. Panorama Energético de América Latina y El Caribe 2019; Círculo Publicitario: Quito, Ecuador, 2019; 439p, Available online: http://www.olade.org/publicaciones/panorama-energetico-de-america-latina-y-el-caribe-2019/ (accessed on 11 June 2021).
- Castillo, T.; García, F.; Mosquera, L.; Rivadeneira, T.; Schuschny, A.; Segura, K.; Yujato, M. Panorama Energético de América Latina y El Caribe 2020; Círculo Publicitario: Quito, Ecuador, 2020; 353p, Available online: http://www.olade.org/publicaciones/panorama-energetico-de-america-latina-y-el-caribe-2020/ (accessed on 11 June 2021).
- Lavellaja, M.; Scalese, F. Impacto Fiscal de la Política de Estímulos a la Sustitución del Parque Automotor por Vehículos Eléctricos; CEPALL: Santiago, Chile, 2019; 64p, Available online: https://www.cepal.org/es/publicaciones/44592-impacto-fiscal-la-politica-estimulos-la-sustitucion-parque-automotor-vehiculos (accessed on 23 June 2021).
- World Bank. World Development Indicators 2015. In The Little Green Data Book; No.97715; World Bank: Washington, DC, USA, 2015; 239p. [Google Scholar]
- World Bank. World Development Indicators 2016. In The Little Green Data Book; World Bank: Washington, DC, USA, 2016; 237p. [Google Scholar]
- World Bank. World Development Indicators 2017. In The Little Green Data Book; World Bank: Washington, DC, USA, 2017; 240p. [Google Scholar]
- United Nations Sustainable Development. Agenda 21; United Nations: Rio de Janeiro, Brazil, 1992; Available online: https://sustainabledevelopment.un.org/outcomedocuments/agenda21 (accessed on 23 August 2021).
- United Nations General Assembly. Transforming Our World: The 2030 Agenda for Sustainable Development; United Nations: New York, NY, USA, 2015; Available online: https://sdgs.un.org/2030agenda (accessed on 25 August 2021).
- International Atomic Energy Agency; United Nations Department of Economic and Social Affairs; International Energy Agency; Eurostat, European Environment Agency. Energy Indicators for Sustainable Development: Guidelines and Methodologies; International Atomic Energy Agency: Vienna, Austria, 2005; 161p, Available online: https://www.iaea.org/publications/7201/energy-indicators-for-sustainable-development-guidelines-and-methodologies (accessed on 28 August 2021).
- Neil, G. Managing the energy trilemma: The case of Indonesia. Energy Policy 2013, 54, 184–193. [Google Scholar] [CrossRef]
- Ali Shah, S.A.; Longsheng, C.; Solangi, Y.A.; Ahmad, M.; Ali, S. Energy trilemma based prioritization of waste-to-energy technologies: Implications for post-COVID-19 green economic recovery in Pakistan. J. Clean. Prod. 2021, 284, 124729. [Google Scholar] [CrossRef] [PubMed]
- Weiss, O.; Pareschi, G.; Georges, G.; Boulouchos, K. The Swiss energy transition: Policies to address the Energy Trilemma. Energy Policy 2021, 148, 111926. [Google Scholar] [CrossRef]
- Gunnarsdottir, I.; Davidsdottir, B.; Worrell, E.; Sigurgeirsdottir, S. Review of indicators for sustainable energy development. Renew. Sustain. Energy Rev. 2020, 133, 110294. Available online: https://www.sciencedirect.com/science/article/abs/pii/S1364032120305827?via%3Dihub (accessed on 31 July 2021). [CrossRef]
- Berjawi, A.E.H.; Walker, S.L.; Patsios, C.; Hosseini, S.H.R. An evaluation framework for future integrated energy systems: A whole energy systems approach. Renew. Sustain. Energy Rev. 2021, 145, 111163. [Google Scholar] [CrossRef]
- Song, L.; Fu, Y.; Zhou, P.; Lai, K.K. Measuring national energy performance via Energy Trilemma Index: A Stochastic Multicriteria Acceptability Analysis. Energy Econ. 2017, 66, 313–319. [Google Scholar] [CrossRef]
- Raphael, J.H.; McCauley, D.; Sovacool, B.K. Resolving society’s energy trilemma through the Energy Justice Metric. Energy Policy 2015, 87, 168–176. [Google Scholar]
- Raphael, H.; McCauley, D.; Zarazua de Rubens, G. Balancing the energy trilemma through the Energy Justice Metric. Appl. Energy 2018, 229, 1191–1201. [Google Scholar] [CrossRef] [Green Version]
- Yu, F.F.; Alharthi, M.; Bhatti, Z.; Sun, L.; Rasul, F.; Hanif, I.; Iqbalf, W. The dynamic role of energy security, energy equity and environmental sustainability in the dilemma of emission reduction and economic growth. J. Environ. Manag. 2021, 280, 111828. [Google Scholar] [CrossRef]
- Olabi, A.G. Energy quadrilemma and the future of renewable energy. Energy 2016, 108, 1–6. [Google Scholar] [CrossRef]
- Altintas, K.; Vayvay, O.; Apak, S.; Cobanoglu, E. An Extended GRA Method Integrated with Fuzzy AHP to Construct a Multidimensional Index for Ranking Overall Energy Sustainability Performances. Sustainability 2020, 12, 1602. [Google Scholar] [CrossRef] [Green Version]
- Mangla, S.K.; Luthra, S.; Jakhar, S.; Gandhi, S.; Muduli, K.; Kumar, A. A step to clean energy-sustainability in energy system management in an emerging economy context. J. Clean. Prod. 2020, 242, 118462. [Google Scholar] [CrossRef]
- Azzam, A.; El Zayat, M.; Marzoukc, M. Integrated approach for sustainability assessment in power plant projects using Building Information Modeling. Energy Sustain Dev. 2022, 66, 222–237. [Google Scholar] [CrossRef]
- Šprajc, P.; Bjegović, M.; Vasić, B. Energy security in decision making and governance—Methodological analysis of energy trilemma index. Renew. Sustain. Energy Rev. 2019, 114, 109341. [Google Scholar] [CrossRef]
- World Energy Council. World Energy Trilemma Index 2017: Monitoring The Sustainability of National Energy Systems. Available online: https://www.worldenergy.org/publications/entry/world-energy-trilemma-index-2017-monitoring-the-sustainability-of-national-energy-systems (accessed on 14 June 2021).
- World Energy Council. World Energy Trilemma Index 2018 Full Report. Available online: https://www.worldenergy.org/publications/entry/world-energy-trilemma-index-2018 (accessed on 14 June 2021).
- WEC Trilemma: Country Profile—Ecuador. Available online: https://trilemma.worldenergy.org/#!/country-profile?country=Ecuador&year=2020 (accessed on 12 August 2021).
- Ministerio de Energía de Ecuador. Expansión de la Generación; Ministerio de Energía de Ecuador: Quito, Ecuador, 2020; Chapter 4; pp. 138–197. Available online: https://www.recursosyenergia.gob.ec/wp-content/uploads/2020/01/4.-EXPANSION-DE-LA-GENERACION.pdf (accessed on 14 August 2021).
- WEC Trilemma: Country Profile—Columbia. Available online: https://trilemma.worldenergy.org/#!/country-profile?country=Colombia&year=2020 (accessed on 12 August 2021).
- WEC Trilemma: Country Profile—Peru. Available online: https://trilemma.worldenergy.org/#!/country-profile?country=Peru&year=2020 (accessed on 12 August 2021).
- WEC Trilemma: Country Profile—Bolivia. Available online: https://trilemma.worldenergy.org/#!/country-profile?country=Bolivia&year=2020 (accessed on 12 August 2021).
- Mirovoj Atlas Dannyh. Available online: https://knoema.ru (accessed on 17 August 2021).
- Our World in Data. Available online: https://ourworldindata.org/electricity-mix (accessed on 17 August 2021).
- The World Bank. Available online: https://www.worldbank.org/en/home (accessed on 18 August 2021).
- Trading Economics. Available online: https://tradingeconomics.com/ (accessed on 18 August 2021).
- Statista Industry Overview. Available online: https://www.statista.com/statistics/263492/electricity-prices-in-selected-countries/ (accessed on 19 August 2021).
- International Energy Agency. Available online: https://www.iea.org/data-and-statistics/charts/global-energy-intensity-1990-compared-to-2018 (accessed on 20 August 2021).
- Our World in Data. Electricity Generation from Low-Carbon Sources. Available online: https://ourworldindata.org/grapher/low-carbon-electricity?tab=chart&time=2014..2019&country=ECU~COL~BOL~PER (accessed on 20 August 2021).
- The World Bank. CO2 Emissions. Available online: https://data.worldbank.org/indicator/EN.ATM.CO2E.PC?locations=EC (accessed on 20 August 2021).
- Klaus, S.; World Economic Forum. The Global Competitiveness Report 2019. Available online: http://www3.weforum.org/docs/WEF_TheGlobalCompetitivenessReport2019.pdf (accessed on 23 August 2021).
- Klaus, S.; World Economic Forum. The Global Competitiveness Report 2017–2018. Available online: http://www3.weforum.org/docs/GCR2017-2018/05FullReport/TheGlobalCompetitivenessReport2017%E2%80%932018.pdf (accessed on 24 August 2021).
- The World Bank. Worldwide Governance Indicators. Available online: https://govdata360.worldbank.org/indicators/h580f9aa5?country=ECU&indicator=388&countries=HTI,CHE&viz=line_chart&years=1996,2019 (accessed on 24 August 2021).
- Bonilla, A.B.; Cadena, M.; Delgado, D.; Moreno, A.; Álamos, C. Precios de la Energía de América Latina y el Caribe. In Informe Annual Abril 2021; Organización Latinoamericana de Energía: Quito, Ecuador, 2021; Available online: http://biblioteca.olade.org/opac-tmpl/Documentos/old0462.pdf (accessed on 7 December 2021).
- La Política de Salarios Mínimos en el Ecuador y Sus Impactos. Available online: https://www.espae.espol.edu.ec/wp-content/uploads/2017/01/gestion_salariosminimos.pdf (accessed on 8 December 2021).
- Salario Mínimo 2021 Mensual en Colombia. Available online: https://www.salariominimocolombia.net/ (accessed on 8 December 2021).
- Perú—Salario Mínimo. Available online: https://datosmacro.expansion.com/smi/peru (accessed on 8 December 2021).
- Bolivia—Salario Mínimo. Available online: https://datosmacro.expansion.com/smi/bolivia (accessed on 8 December 2021).
- Whiteman, A.; Rueda, S.; Akande, D.; Elhassan, N.; Escamilla, G.; Arkhipova, J. Renewable Energy Statistics 2020; The International Renewable Energy Agency (IRENA): Abu Dhabi, United Arab Emirates, 2020; 408p, Available online: https://www.irena.org/publications/2020/Jul/Renewable-energy-statistics-2020 (accessed on 18 September 2021).
- Eurostat. Energy Statistics. Available online: https://ec.europa.eu/eurostat/web/energy (accessed on 22 September 2021).
- Catolico, A.C.C.; Maestrini, M.; Strauch, J.C.M.; Giusti, F.; Hunte, J. Socioeconomic impacts of large hydroelectric power plants in Brazil: A synthetic control assessment of Estreito hydropower plant. Renew. Sustain. Energy Rev. 2021, 151, 111508. Available online: https://www.sciencedirect.com/science/article/pii/S1364032121007875 (accessed on 24 September 2021). [CrossRef]
- Bayazıt, Y. The effect of hydroelectric power plants on the carbon emission: An example of Gokcekaya dam, Turkey. Renew. Energy 2021, 170, 181–187. Available online: https://www.sciencedirect.com/science/article/pii/S0960148121001439 (accessed on 25 September 2021). [CrossRef]
- Jong, P.; Barreto, T.; Tanajura, C.A.S.; Oliveira-Esquerre, K.P.; Kiperstok, A.; Torres, E.A. The Impact of Regional Climate Change on Hydroelectric Resources in South America. Renew. Energy 2021, 173, 76–91. Available online: https://www.sciencedirect.com/science/article/pii/S096014812100433X (accessed on 25 September 2021). [CrossRef]

| Indicators/Country | Ecuador | Colombia | Peru | Bolivia |
|---|---|---|---|---|
| Population, mln. | 17.37 | 50.33 | 32.51 | 11.47 |
| GDP, USD thous. of mln. | 108 | 323 | 230 | 41 |
| GDP per capita, USD | 6261 | 6419 | 7098 | 3578 |
| Oil reserves, mln. of USA barrels | 1303 | 2041 | 345 | 190 |
| Natural gas reserves, Gm3 | 4 | 90 | 299 | 253 |
| Coal reserves, Mt | 0 | 5912 | 7 | 0 |
| Primary energy production, Mtoe | 31.02 | 137.41 | 62.71 | 17.24 |
| Energy per unit of GDP, kep/USD 2011 PPA | 0.08 | 0.06 | 0.08 | 0.09 |
| Renewable sources/GDP, kep/USD 2011 PPA | 0.01 | 0.01 | 0.02 | 0.01 |
| Total energy consumption, Mtoe | 13.38 | 32.14 | 21.51 | 6.79 |
| Country/Year | 2017 | 2018 | 2019 | ||||
|---|---|---|---|---|---|---|---|
| Rank (Out of 125 Countries) | Grade | Rank (Out of 125 Countries) | Grade | Rank (Out of 128 Countries) | Grade | ||
| Ecuador | 64 | BBC | 62 | CBB | 45 | ABBd | |
| Colombia | 45 | BCA | 48 | BCA | 49 | BCAc | |
| Bolivia | 101 | CCD | 99 | CCD | 84 | BCCd | |
| Peru | 55 | BCB | 51 | BBA | 58 | ACBb | |
| Latam countries | Highest | Uruguay (35) | CBA | Uruguay (28) | BBA | Uruguay (17) | ABAb |
| Lowest | Honduras (108) | DDD | Honduras (109) | DDD | Nicaragua (102) | DCCd | |
| Indicators | Country | Unit | 2017 | 2018 | 2019 |
|---|---|---|---|---|---|
| Percentage of imports (petroleum products) | Ecuador | % | 51 | 50 | 54 |
| Colombia | % | 12 | 6 | 9 | |
| Peru | % | 58 | 59 | 46 | |
| Bolivia | % | 19 | 21 | 26 | |
| Max. | % | Grenada (138) | Dominican R. (135) | Panama (134) | |
| Min. | % | Colombia (12) | Colombia (6) | Colombia (9) | |
| Diversity of electricity generation sources | Ecuador | № | 5 | 5 | 5 |
| Colombia | № | 5 | 5 | 5 | |
| Peru | № | 5 | 5 | 5 | |
| Bolivia | № | 5 | 5 | 5 | |
| Max. | № | Argentina (8) | Argentina (8) | Argentina (8) | |
| Min. | № | Haiti (3) | Haiti (3) | Haiti (3) | |
| Energy storage: petroleum reserves | Ecuador | Years | 16 | 9 | 7 |
| Colombia | Years | 5 | 5 | 6 | |
| Peru | Years | 29 | 29 | 28 | |
| Bolivia | Years | 12 | 11 | 11 | |
| Max. | Years | Venezuela (282) | Venezuela (282) | Venezuela (282) | |
| Min. | Years | Costa Rica (0) | Costa Rica (0) | Costa Rica (0) | |
| Energy storage: gas reserves | Ecuador | Years | 3 | 5 | 3 |
| Colombia | Years | 9 | 9 | 6 | |
| Peru | Years | 19 | 20 | 16 | |
| Bolivia | Years | 15 | 17 | 15 | |
| Max. | Years | Bolivia (15) | Bolivia (17) | Bolivia (15) | |
| Min. | Years | Belice (0) | Belice (0) | Belice (0) | |
| Energy storage: carbon reserves | Ecuador | Years | 0 | 0 | 0 |
| Colombia | Years | 67 | 71 | 70 | |
| Peru | Years | 28 | 36 | 40 | |
| Bolivia | Years | 0 | 0 | 0 | |
| Max. | Years | Colombia (67) | Colombia (71) | Colombia (70) | |
| Min. | Years | Ecuador (0) | Ecuador (0) | Ecuador (0) |
| Indicators | Country | 2017 | 2018 | 2019 |
|---|---|---|---|---|
| Import dependence for petroleum products (0.33) | Ecuador | 0.69 | 0.65 | 0.64 |
| Colombia | 1.00 | 1.00 | 1.00 | |
| Peru | 0.63 | 0.59 | 0.70 | |
| Bolivia | 0.94 | 0.88 | 0.86 | |
| Diversity of electricity generation (0.33) | Ecuador | 0.40 | 0.40 | 0.40 |
| Colombia | 0.40 | 0.40 | 0.40 | |
| Peru | 0.40 | 0.40 | 0.40 | |
| Bolivia | 0.40 | 0.40 | 0.40 | |
| Energy storage: petroleum reserves (0.11) | Ecuador | 0.06 | 0.03 | 0.02 |
| Colombia | 0.02 | 0.01 | 0.02 | |
| Peru | 0.10 | 0.10 | 0.10 | |
| Bolivia | 0.04 | 0.04 | 0.04 | |
| Energy storage: gas reserves (0.11) | Ecuador | 0.16 | 0.25 | 0.19 |
| Colombia | 0.47 | 0.45 | 0.38 | |
| Peru | 1.00 | 1.00 | 1.00 | |
| Bolivia | 0.79 | 0.85 | 0.94 | |
| Energy storage: carbon reserves (0.11) | Ecuador | 0.00 | 0.00 | 0.00 |
| Colombia | 1.00 | 1.00 | 1.00 | |
| Peru | 0.42 | 0.51 | 0.57 | |
| Bolivia | 0.00 | 0.00 | 0.00 |
| Country | 2017 | 2018 | 2019 |
|---|---|---|---|
| Ecuador | 0.26 | 0.27 | 0.25 |
| Colombia | 0.58 | 0.57 | 0.56 |
| Peru | 0.51 | 0.52 | 0.55 |
| Bolivia | 0.43 | 0.43 | 0.45 |
| Indicators | Country | Unit | 2017 | 2018 | 2019 |
|---|---|---|---|---|---|
| Access to electricity (% of population) | Ecuador | % | 99.20 | 98.70 | 100.00 |
| Colombia | % | 98.50 | 98.50 | 99.70 | |
| Peru | % | 94.80 | 95.20 | 98.34 | |
| Bolivia | % | 91.80 | 92.80 | 96.30 | |
| Max. | % | Chile (100) | Chile (100) | Ecuador (100) | |
| Min. | % | Cuba (83) | Nicaragua (88) | Bolivia (96.30) | |
| Electricity prices | Ecuador | USD/kWh | 0.10 | 0.09 | 0.09 |
| Colombia | USD/kWh | 0.13 | 0.13 | 0.12 | |
| Peru | USD/kWh | 0.14 | 0.13 | 0.13 | |
| Bolivia | USD/kWh | 0.09 | 0.11 | 0.10 | |
| Max. | USD/kWh | Brazil (0.22) | Chile (0.26) | Mexico (0.25) | |
| Min | USD/kWh | Cuba (0.03) | Cuba (0.04) | Cuba (0.06) | |
| Gasoline prices | Ecuador | USD/L | 0.52 | 0.53 | 0.55 |
| Colombia | USD/L | 0.85 | 0.80 | 0.75 | |
| Peru | USD/L | 0.90 | 0.92 | 0.90 | |
| Bolivia | USD/L | 0.55 | 0.54 | 0.54 | |
| Max. | USD/L | Chile (0.92) | Costa Rica (0.95) | Costa Rica (0.93) | |
| Min. | USD/L | Ecuador (0.52) | Ecuador (0.53) | Cuba (0.49) |
| Indicators | Country | 2017 | 2018 | 2019 |
|---|---|---|---|---|
| Access to electricity (% of population) (0.33) | Ecuador | 0.95 | 0.89 | 1 |
| Colombia | 0.91 | 0.86 | 0.96 | |
| Peru | 0.69 | 0.6 | 0.79 | |
| Bolivia | 0.52 | 0.4 | 0.58 | |
| Electricity prices (0.33) | Ecuador | 0.63 | 0.77 | 0.84 |
| Colombia | 0.47 | 0.59 | 0.68 | |
| Peru | 0.42 | 0.59 | 0.63 | |
| Bolivia | 0.68 | 0.68 | 0.79 | |
| Gasoline prices (0.33) | Ecuador | 0.98 | 1 | 0.86 |
| Colombia | 0.17 | 0.35 | 0.41 | |
| Peru | 0.05 | 0.07 | 0.69 | |
| Bolivia | 0.92 | 0.98 | 0.89 |
| Country | 2017 | 2018 | 2019 |
|---|---|---|---|
| Ecuador | 0.85 | 0.89 | 0.9 |
| Colombia | 0.52 | 0.60 | 0.68 |
| Peru | 0.39 | 0.42 | 0.70 |
| Bolivia | 0.71 | 0.69 | 0.75 |
| Indicators | Country | Unit | 2017 | 2018 | 2019 |
|---|---|---|---|---|---|
| Final energy intensity | Ecuador | MJ/USD 2011 PPP GDP | 3.34 | 3.41 | 3.62 |
| Colombia | MJ/USD 2011 PPP GDP | 2.42 | 2.34 | 2.26 | |
| Peru | MJ/USD 2011 PPP GDP | 2.46 | 2.78 | 2.79 | |
| Bolivia | MJ/USD 2011 PPP GDP | 5.15 | 5.17 | 4.95 | |
| Max. | MJ/USD 2011 PPP GDP | Haiti (10.09) | Haiti (9.95) | Haiti (10.11) | |
| Min. | MJ/USD 2011 PPP GDP | Panama (2.27) | Panama (2.27) | Panama (2.17) | |
| Low carbon electricity generation | Ecuador | TWh | 16 | 20 | 21 |
| Colombia | TWh | 50 | 62 | 61 | |
| Peru | TWh | 26 | 31 | 33 | |
| Bolivia | TWh | 2 | 2 | 3 | |
| Max. | TWh | Brazil (478) | Brazil (507) | Brazil (526) | |
| Min. | TWh | Haiti (0.09) | Haiti (0.09) | Haiti (0.09) | |
| CO2 emissions per capita | Ecuador | Tons of CO2 per c. | 2.39 | 2.48 | 2.38 |
| Colombia | Tons of CO2 per c. | 1.58 | 1.58 | 1.74 | |
| Peru | Tons of CO2 per c. | 1.68 | 1.71 | 1.71 | |
| Bolivia | Tons of CO2 per c. | 2.15 | 2.15 | 2.15 | |
| Max. | Tons of CO2 per c. | Tri.Tob. (24.7) | Tri.Tob. (3.76) | Tri.Tob. (23.81) | |
| Min. | Tons of CO2 per c. | Haiti (0.32) | Haiti (0.33) | Haiti (0.32) |
| Indicators | Country | 2017 | 2018 | 2019 |
|---|---|---|---|---|
| Final energy intensity (0.33) | Ecuador | 0.86 | 0.85 | 0.82 |
| Colombia | 0.98 | 0.99 | 0.99 | |
| Peru | 0.97 | 0.93 | 0.92 | |
| Bolivia | 0.63 | 0.62 | 0.64 | |
| Low carbon electricity generation (0.33) | Ecuador | 0.03 | 0.04 | 0.04 |
| Colombia | 0.1 | 0.12 | 0.11 | |
| Peru | 0.05 | 0.06 | 0.062 | |
| Bolivia | 0.004 | 0.004 | 0.004 | |
| CO2 emissions per capita (0.33) | Ecuador | 0.91 | 0.91 | 0.91 |
| Colombia | 0.95 | 0.95 | 0.94 | |
| Peru | 0.94 | 0.94 | 0.94 | |
| Bolivia | 0.92 | 0.92 | 0.92 |
| Country | 2017 | 2018 | 2019 |
|---|---|---|---|
| Ecuador | 0.6 | 0.6 | 0.59 |
| Colombia | 0.68 | 0.69 | 0.68 |
| Peru | 0.65 | 0.64 | 0.64 |
| Bolivia | 0.52 | 0.51 | 0.52 |
| Indicators | Country | Unit | 2017 | 2018 | 2019 |
|---|---|---|---|---|---|
| Macroeconomic stability | Ecuador | Ranking | 91/137 | 87/140 | 92/141 |
| Colombia | Ranking | 62/137 | 56/140 | 43/141 | |
| Peru | Ranking | 37/137 | 1/140 | 1/141 | |
| Bolivia | Ranking | 82/137 | 84/140 | 88/141 | |
| Max. Latam | Ranking | Chile (1) | Chile (1) | Chile (1) | |
| Min. Latam | Ranking | Venezuela (137) | Venezuela (140) | Venezuela (141) | |
| Effectiveness of government | Ecuador | Scale −2.15; 2.15 | −0.32 | −0.26 | −0.4 |
| Colombia | Scale −2.15; 2.15 | −0.07 | −0.09 | 0.07 | |
| Peru | Scale −2.15; 2.15 | −0.13 | −0.25 | −0.07 | |
| Bolivia | Scale −2.15; 2.15 | −0.38 | −0.32 | −0.7 | |
| Max. Latam | 2.15 | Chile (0.84) | Chile (1.08) | Chile (1.06) | |
| Min. Latam | −2.15 | Haiti (−2.07) | Haiti (−1.91) | Haiti (−2.02) | |
| Innovation capacity | Ecuador | Ranking | 111/137 | 88/140 | 88/141 |
| Colombia | Ranking | 73/137 | 73/140 | 77/141 | |
| Peru | Ranking | 113/137 | 89/140 | 90/141 | |
| Bolivia | Ranking | X | 122/140 | 124/141 | |
| Max. Latam | Ranking | Mexico (50) | Mexico (56) | Mexico (52) | |
| Min. Latam | Ranking | Haiti (138) | Haiti (137) | Haiti (139) |
| Indicators | Country | 2017 | 2018 | 2019 |
|---|---|---|---|---|
| Macroeconomic stability (0.33) | Ecuador | 0.33 | 0.38 | 0.35 |
| Colombia | 0.55 | 0.6 | 0.7 | |
| Peru | 0.73 | 1 | 1 | |
| Bolivia | 0.41 | 0.4 | 0.37 | |
| Effectiveness of government (0.33) | Ecuador | 0.45 | 0.43 | 0.4 |
| Colombia | 0.48 | 0.47 | 0.51 | |
| Peru | 0.46 | 0.44 | 0.48 | |
| Bolivia | 0.41 | 0.42 | 0.33 | |
| Innovation capacity (0.33) | Ecuador | 0.3 | 0.64 | 0.58 |
| Colombia | 0.73 | 0.79 | 0.71 | |
| Peru | 0.27 | 0.59 | 0.56 | |
| Bolivia | X | 0.19 | 0.17 |
| Country | 2017 | 2018 | 2019 |
|---|---|---|---|
| Ecuador | 0.36 | 0.48 | 0.44 |
| Colombia | 0.59 | 0.62 | 0.64 |
| Peru | 0.49 | 0.68 | 0.68 |
| Bolivia | 0.33 | 0.34 | 0.29 |
| Indicators/Country | Ecuador | Colombia | Peru | Bolivia | ||||||||
|---|---|---|---|---|---|---|---|---|---|---|---|---|
| Years | 2017 | 2018 | 2019 | 2017 | 2018 | 2019 | 2017 | 2018 | 2019 | 2017 | 2018 | 2019 |
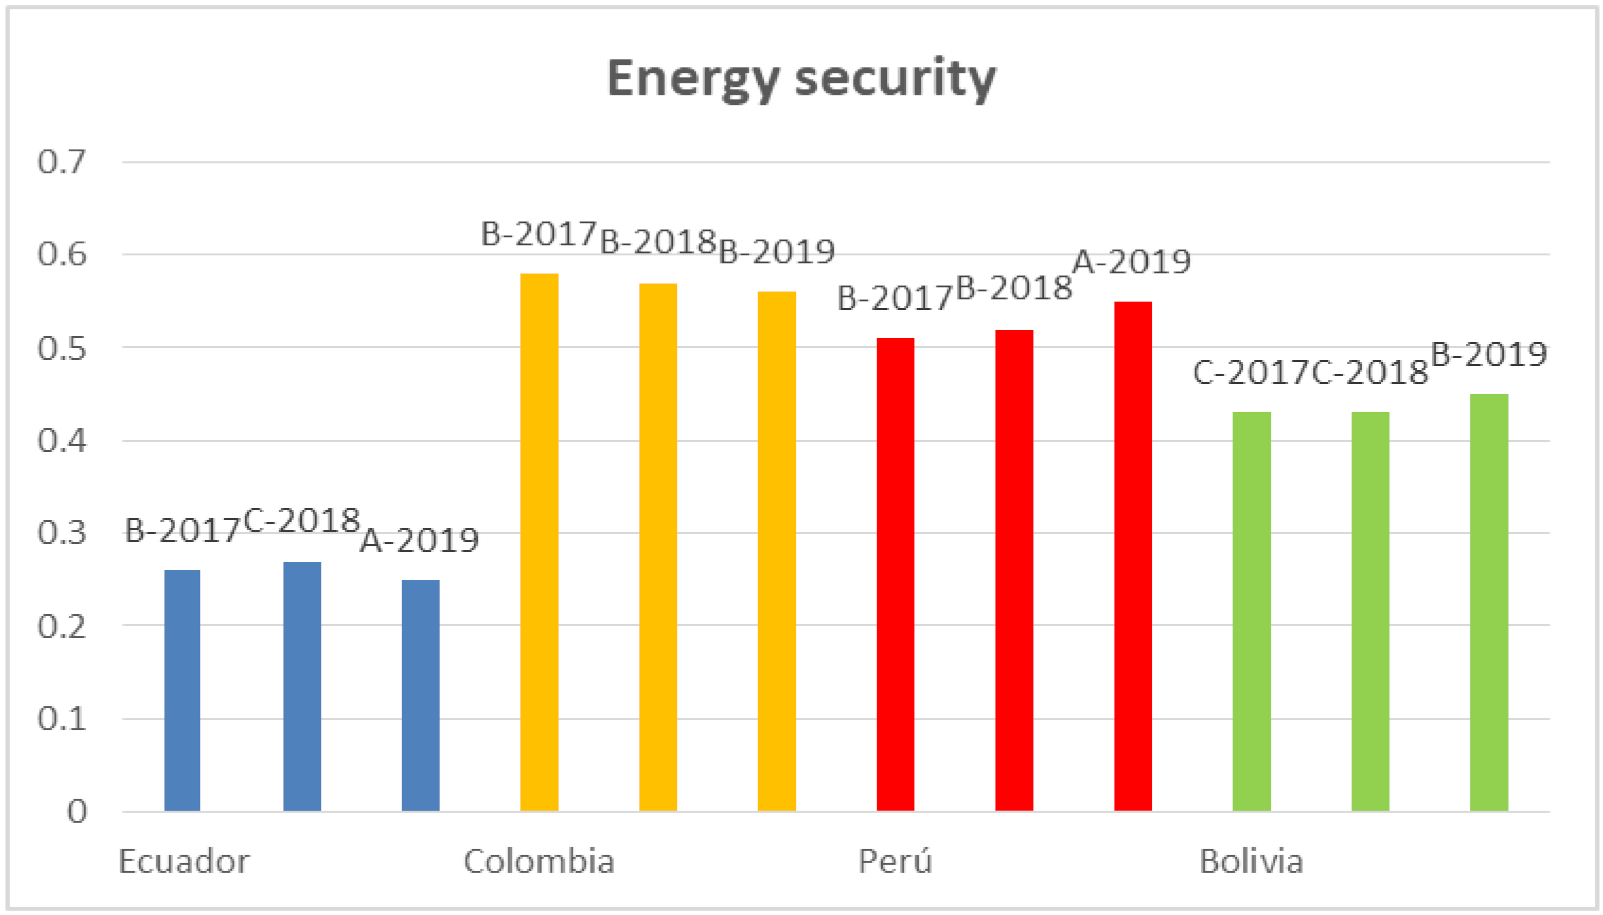
| Energy security | 0.26 | 0.27 | 0.25 | 0.58 | 0.57 | 0.56 | 0.51 | 0.52 | 0.55 | 0.43 | 0.43 | 0.45 |
| Energy equity | 0.85 | 0.89 | 0.9 | 0.52 | 0.6 | 0.68 | 0.39 | 0.42 | 0.7 | 0.71 | 0.69 | 0.75 |
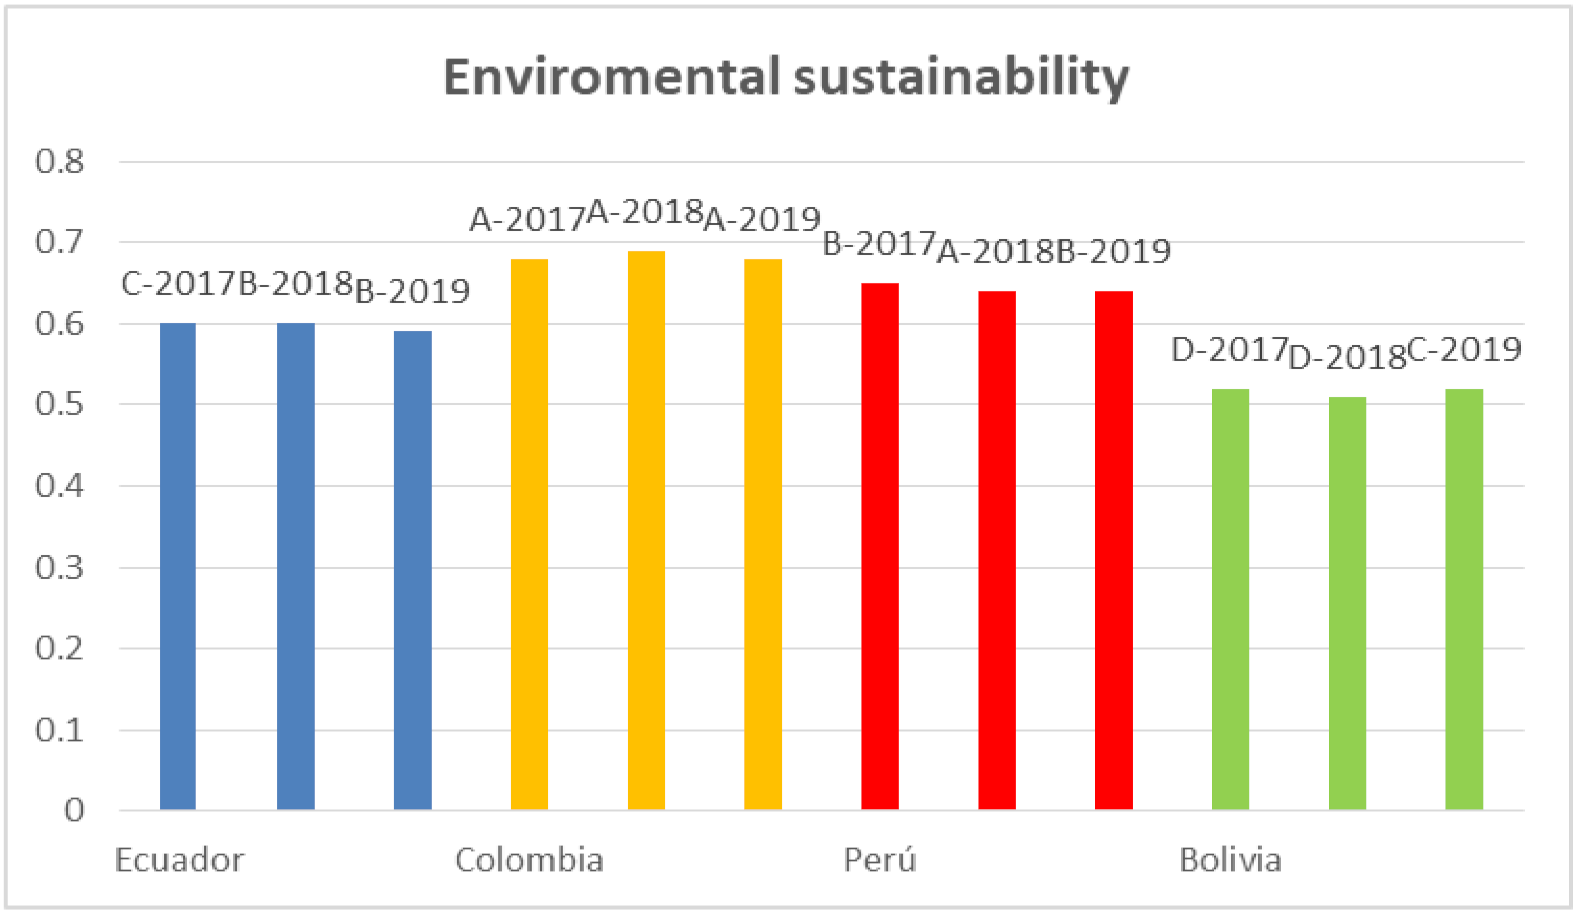
| Enviromental sustainability | 0.6 | 0.6 | 0.59 | 0.68 | 0.69 | 0.68 | 0.65 | 0.64 | 0.64 | 0.52 | 0.51 | 0.52 |
| Country context | 0.36 | 0.48 | 0.44 | 0.59 | 0.62 | 0.64 | 0.49 | 0.68 | 0.68 | X | 0.34 | 0.29 |
| Average | 0.549 | 0.576 | 0.566 | 0.593 | 0.62 | 0.64 | 0.514 | 0.542 | 0.635 | X | 0.523 | 0.545 |
| Rating | 64 | 62 | 45 | 45 | 48 | 49 | 50 | 51 | 58 | 101 | 99 | 84 |
| Additional indicators (Absolute values) | ||||||||||||
| Hydropower nominal capacity, MW | 4.500 | 5.000 | 5.000 | 11.650 | 11.700 | 11.800 | 4.700 | 4.900 | 5.100 | 550 | 650 | 750 |
| Hydropower generation, TWh | 19.7 | 20.5 | 24 | 59 | 58.5 | 57 | 29 | 30 | 31 | 2.2 | 2.8 | 3.4 |
| The amount of electricity purchased for the average salary, MWh | 8.14 | 8.72 | 9.35 | 10.63 | 10.65 | 10.66 | 8.61 | 9.01 | 7.19 | 7.07 | 6.23 | 6.42 |
Publisher’s Note: MDPI stays neutral with regard to jurisdictional claims in published maps and institutional affiliations. |
© 2022 by the authors. Licensee MDPI, Basel, Switzerland. This article is an open access article distributed under the terms and conditions of the Creative Commons Attribution (CC BY) license (https://creativecommons.org/licenses/by/4.0/).
Share and Cite
Ponomarenko, T.; Reshneva, E.; Mosquera Urbano, A.P. Assessment of Energy Sustainability Issues in the Andean Community: Additional Indicators and Their Interpretation. Energies 2022, 15, 1077. https://doi.org/10.3390/en15031077
Ponomarenko T, Reshneva E, Mosquera Urbano AP. Assessment of Energy Sustainability Issues in the Andean Community: Additional Indicators and Their Interpretation. Energies. 2022; 15(3):1077. https://doi.org/10.3390/en15031077
Chicago/Turabian StylePonomarenko, Tatiana, Ekaterina Reshneva, and Alexander Patricio Mosquera Urbano. 2022. "Assessment of Energy Sustainability Issues in the Andean Community: Additional Indicators and Their Interpretation" Energies 15, no. 3: 1077. https://doi.org/10.3390/en15031077
APA StylePonomarenko, T., Reshneva, E., & Mosquera Urbano, A. P. (2022). Assessment of Energy Sustainability Issues in the Andean Community: Additional Indicators and Their Interpretation. Energies, 15(3), 1077. https://doi.org/10.3390/en15031077