Article

Stochastic versus Fuzzy Models—A Discussion Centered on the Reliability of an Electrical Power Supply System in a Large European Hospital

by
Constâncio António Pinto
1,2,*,
José Torres Farinha
1,3,
Hugo Raposo
1,3 and
Diego Galar
4
1
CEMMPRE, Department of Mechanical Engineering, University of Coimbra, 3030-788 Coimbra, Portugal
2
Department of Mechanical Engineering, Universidade Nacional de Timor-Leste, Av. Cidade de Lisboa, Díli, Timor-Leste
3
Instituto Superior de Engenharia de Coimbra/Instituto Politécnico de Coimbra (ISEC/IPC), Department of Mechanical Engineering, 3030-199 Coimbra, Portugal
4
Department of Civil, Environmental and Natural Resources Engineering, Lulea University of Technology, 97187 Luleå, Sweden
*
Author to whom correspondence should be addressed.
Energies 2022, 15(3), 1024; https://doi.org/10.3390/en15031024
Submission received: 29 December 2021 / Revised: 21 January 2022 / Accepted: 26 January 2022 / Published: 29 January 2022
(This article belongs to the Special Issue Modeling and Optimization of Electrical Systems)

Abstract

:
This paper discusses the Reliability, Availability, Maintainability, and Safety (RAMS) of an electrical power supply system in a large European hospital. The primary approach is based on fuzzy logic and Petri nets, using the CPNTools software to simulate and determine the most important modules of the system according to the Automatic Transfer Switch. Fuzzy Inference System is used to analyze and assess the reliability value. The stochastic versus fuzzy approach is also used to evaluate the reliability contribution of each system module. This case study aims to identify and analyze possible system failures and propose new solutions to improve the system reliability of the power supply system. The dynamic modeling is based on block diagrams and Petri nets and is evaluated via Markov chains, including a stochastic approach linked to the previous analysis. This holistic approach adds value to this type of research question. A new electrical power supply system design is proposed to increase the system’s reliability based on the results achieved.

1. Introduction

Electric power supply systems play a strategic function in any big hospital. Therefore, the manager must have a high level of maintenance services to keep the electric power installation running. If a failure occurs, it can cause severe problems for hospital activities, including risk of death for the patients. Therefore, the electrical installation system must be designed to keep the system running at maximum availability in the most reliable way. As managing this type of physical asset is risky, its maintenance and reliability are strategic. The study presented in this paper aims to help improve the reliability and availability of systems using Petri nets. A fuzzy inference system and a stochastic time Petri Net were used to simulate and enhance the existing systems through a new model more reliable. For simulations, the CPNTools and Fuzzy MATLAB were used. This paper is a further step in the first author’s research [1,2]; hence, there are some data similarities because the hospital of the case study is the same. The structure of this paper is as follows. Section one corresponds to the introduction; section two presents the state-of-the-art, which discusses some theoretical framework about maintenance of electrical power systems in hospitals, their Reliability, Availability, Maintainability, and Safety (RAMS), the Petri nets, the Fuzzy Inference system, the Stochastic Time Petri Nets, Markov Chains, and the CPNTols simulator software; section three presents a description of the electrical power supply system of a large European hospital, including the profile of thre hospital, the modeling the hospital electrical systems using block diagrams, focusing on generators, Automatic Transfer Switches (ATS), and Uninterruptible Power Supplies (UPS); section four presents a dynamic modeling of the hospital’s electrical system using Petri nets, which discusses the modeling of the hospital electrical system using Petri set software simulator CPNTools, the hospital electrical system block diagrams, the fuzzification data processing, the modeling based on Markov chains and stochastic matrixes processes, and analyzing stochastic versus fuzzy process; section five discusses solutions and results; and finally, section six presents the conclusions.

2. Theoretical Framework

2.1. Maintenance of Electrical Systems in Hospitals
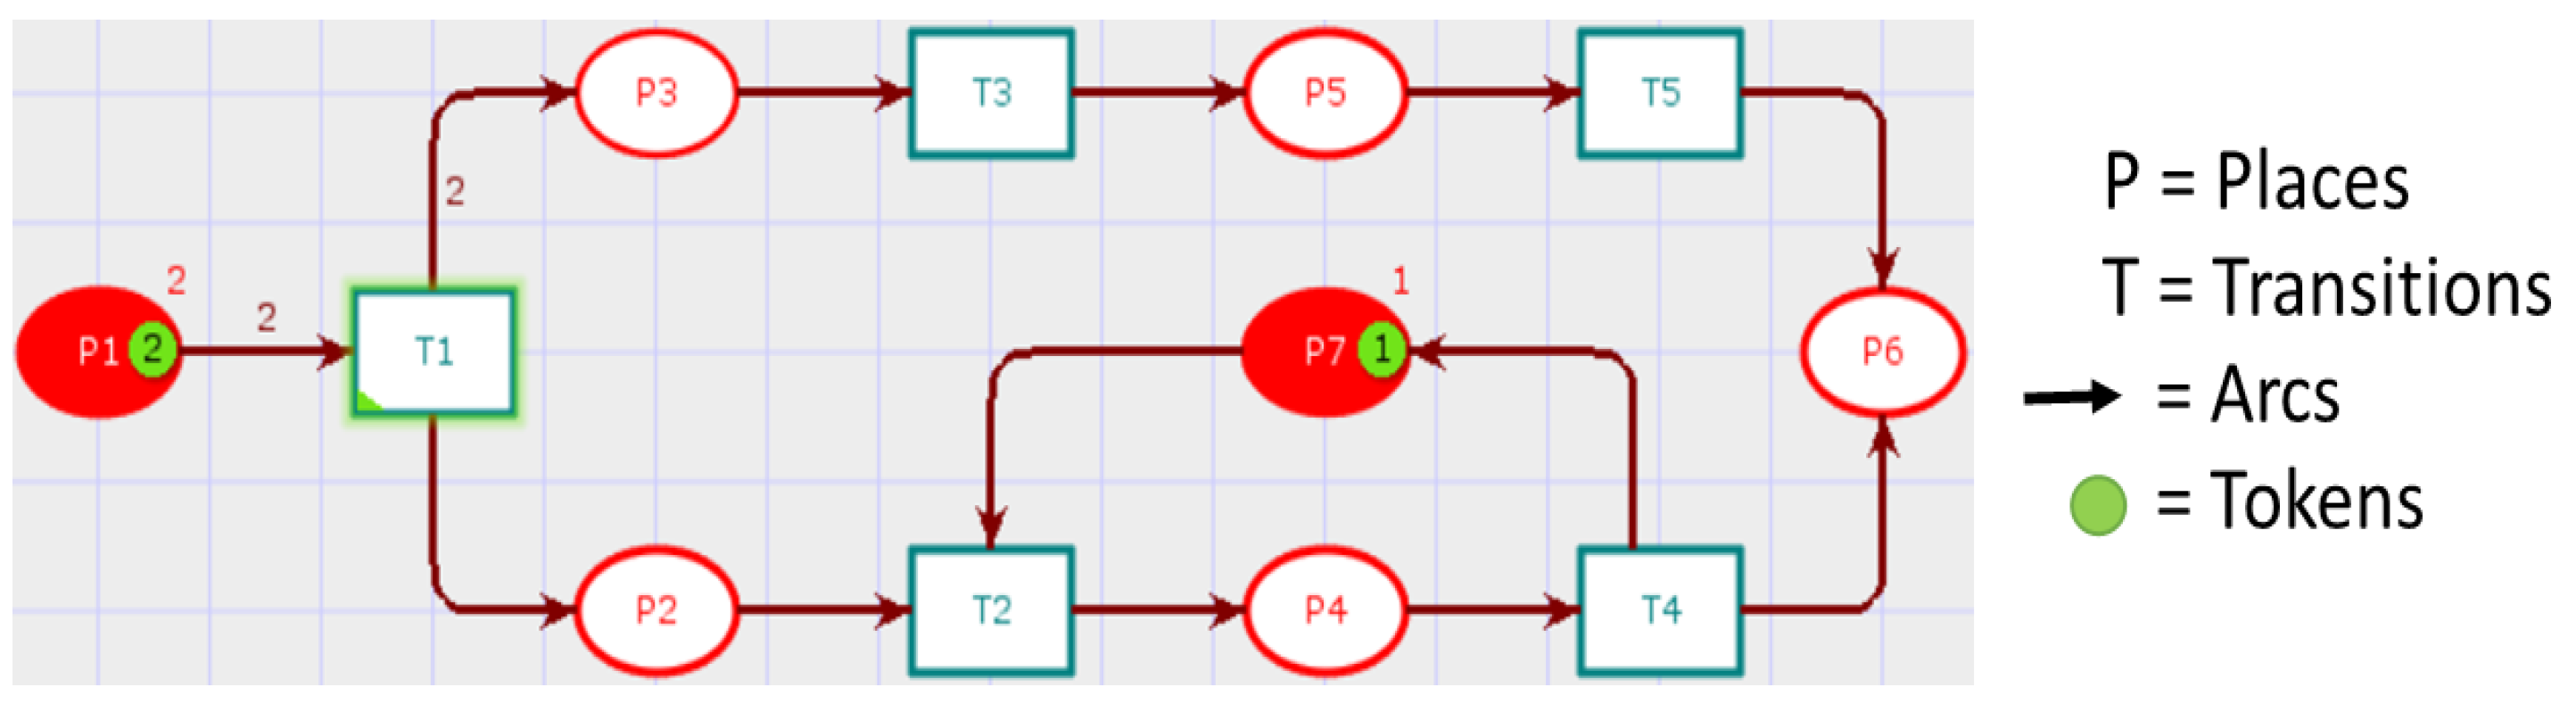
Maintenance of power supply systems is particularly essential for safety and reliability in hospitals [3] due to the consequences of failure. The complexity of today’s systems augments the need for proper maintenance. Although they were speaking about manufacturing, Ni et al. made a relevant point: “Maintenance operations in a modern manufacturing system are complex because they need the integration of several sources of information, including: (a) current machine conditions and its degradation profiles; (b) system configurations; (c) availability of maintenance crews and resources; (d) the current Work-In-Process (WIP) in the system; and (e) the throughput target” [4]. According to Hennequin et al. (2016), preventive maintenance increases availability improves product quality, reduces costs, and generally improves productivity [5]. Macchi et al. (2020) argue that “smart maintenance appears to be a promising concept to shape advanced maintenance systems built in the digital era” [6]. At this point, there are many different preventive maintenance options, each with its benefits. The trick is to pick the best one. The optimal preventive maintenance will significantly improve efficiency [7]. To this end, Lagrange et al. suggested that “the benefits provided by an improvement of the energy resilience… could achieve by installing a microgrid in a hospital fed by renewable energy sources” [8]. Balali and Valipour (2021) proposed reducing energy consumption in hospitals and health centers using passive strategies when designing them. Unfortunately, very few studies have examined the use of this type of strategy in hospitals and health centers [9]. In this way, some recent work has used modeling to discover better methods of hospital maintenance. For example, Yousefli et al. used hospital maintenance data for multi-agent simulation to improve workflow management. They found simulation reduced the time to respond to maintenance requests, an essential factor when dealing with critical systems [10]. Christiansen tested a model approach using over 33,500 h of measurements from a German medical center to assess time-dependency and the weekly sum of the demand for electrical energy due to medical laboratory plug loads [11]. Maintaining a hospital’s electricity system is essentially a risk management task; operators must always be vigilant, trained in safety measures, and understand and use the latest technology. RAMS aims to prevent failures, breakdowns, and delays in production and service processes to improve time, cost, and system performance. Despite the ubiquity of the RAMS concept, more research is needed on hospital assets to ensure quality management efforts for internal and external customer satisfaction, guided by international standards. RAM analysis is the basis for complex system performance analysis [12]. Sutton (2015) add that RAM programs are “an integral part of any risk management system” [13]. Sharma and Sharma (2012) pointed out that the popularity of RAM has increased substantially in recent years due to rising operation and maintenance costs [14]. Pirbhulal et al. present RAMS analysis of critical infrastructures (CIs) subject to failure modes [15]. Reliability, Availability, Maintenance, and Safety are essential to pay attention to; these variables ensure that products and services are not interrupted and sustainable. Therefore, an experienced manager must always be aware of risk management in the hospital context.

2.2. Petri Nets

This paper is closely related to the evolution of the authors’ research. The following few sections are strongly supported by previous work [1]. A Petri net (PN) can be defined as follows:
The Petri net consists of 5 tuples N = (P, T, I, O, Mo), which is defined as the five tuples N = (P, T, 1, 0, Mo) by the Petri net, where:
P = {P1, P2, …, Pm} is a finite set;
T = {t1, t2, …, tn} is a finite transition set, P U T and PT =;
I(P, T) N is an input function that defines an arc directed from a place to a transition, where N is the set of negative integers;
(T, P) N is the output function that defines the arc from the transition to the place, and Mo: P N is the starting point.
The marking (M) is the movement of tokens to places in the Petri net system. The number and position of tokens may change during implementation due to the Petri network’s transitions. A simulation example shown in Figure 1. The Petri net contains:
P = {p1, p2, …, p7};
T = {t1, t2, …, t5};
I (t1, p1) = 2, I (t1, pi) = 0 for i = 2, 3, …, 7;
I (t2, p2) = 1, I (t2, p7) = 1, I (t2, pi) = 0 for i = 1, 3, 4, 5, 6;
O (t1, p2) = 1, O (t1, p3) = 2, O (t1, pi) = 0 for i = 1, 4, 5, 6, 7;
O (t2, p4) = 1, O (t2, pi) = 0 for i = 1, 2, 3, 5, 6, 7;
Mo = (2 0 0 0 0 0 1)T.
Petri nets are widely used for modeling asynchronous events, processing synchronization, concurrent operations, sequential operations, conflicts, or resource sharing [16]. Pinto et al. conclude the importance of Petri nets in maintenance management because it is beneficial for analyzing and simulating complex systems to increase asset function and operation reliability and availability [1]. Grunt and Briš suggest using an extension of Petri nets, i.e., Stochastic Petri Nets (SPNs), as a suitable modeling tool for time-dependent events such as fire escalation or gas cloud explosion [17]. Aloini et al. used Colored Petri Nets (CPNs) to model risk factors in Enterprise Resource Planning (ERP) projects to deal with the problem of interdependence in risk assessment [18]. Meanwhile, Li et al. proposed a layered Petri net method to describe coupling relations and add flexibility to computational processes during complex rule-based risk analysis and assessment [19]. In another work, Li et al. propose a Timed Colored Petri net (TCCP-net) and a time–space coupling safety constraint to conduct a time–space coupling hazard analysis [20]. Liu et al. also defined a probabilistic Colored Petri Net model comprising basic models, rules, logical operators, and transitions that describe threat propagation between nodes [21].

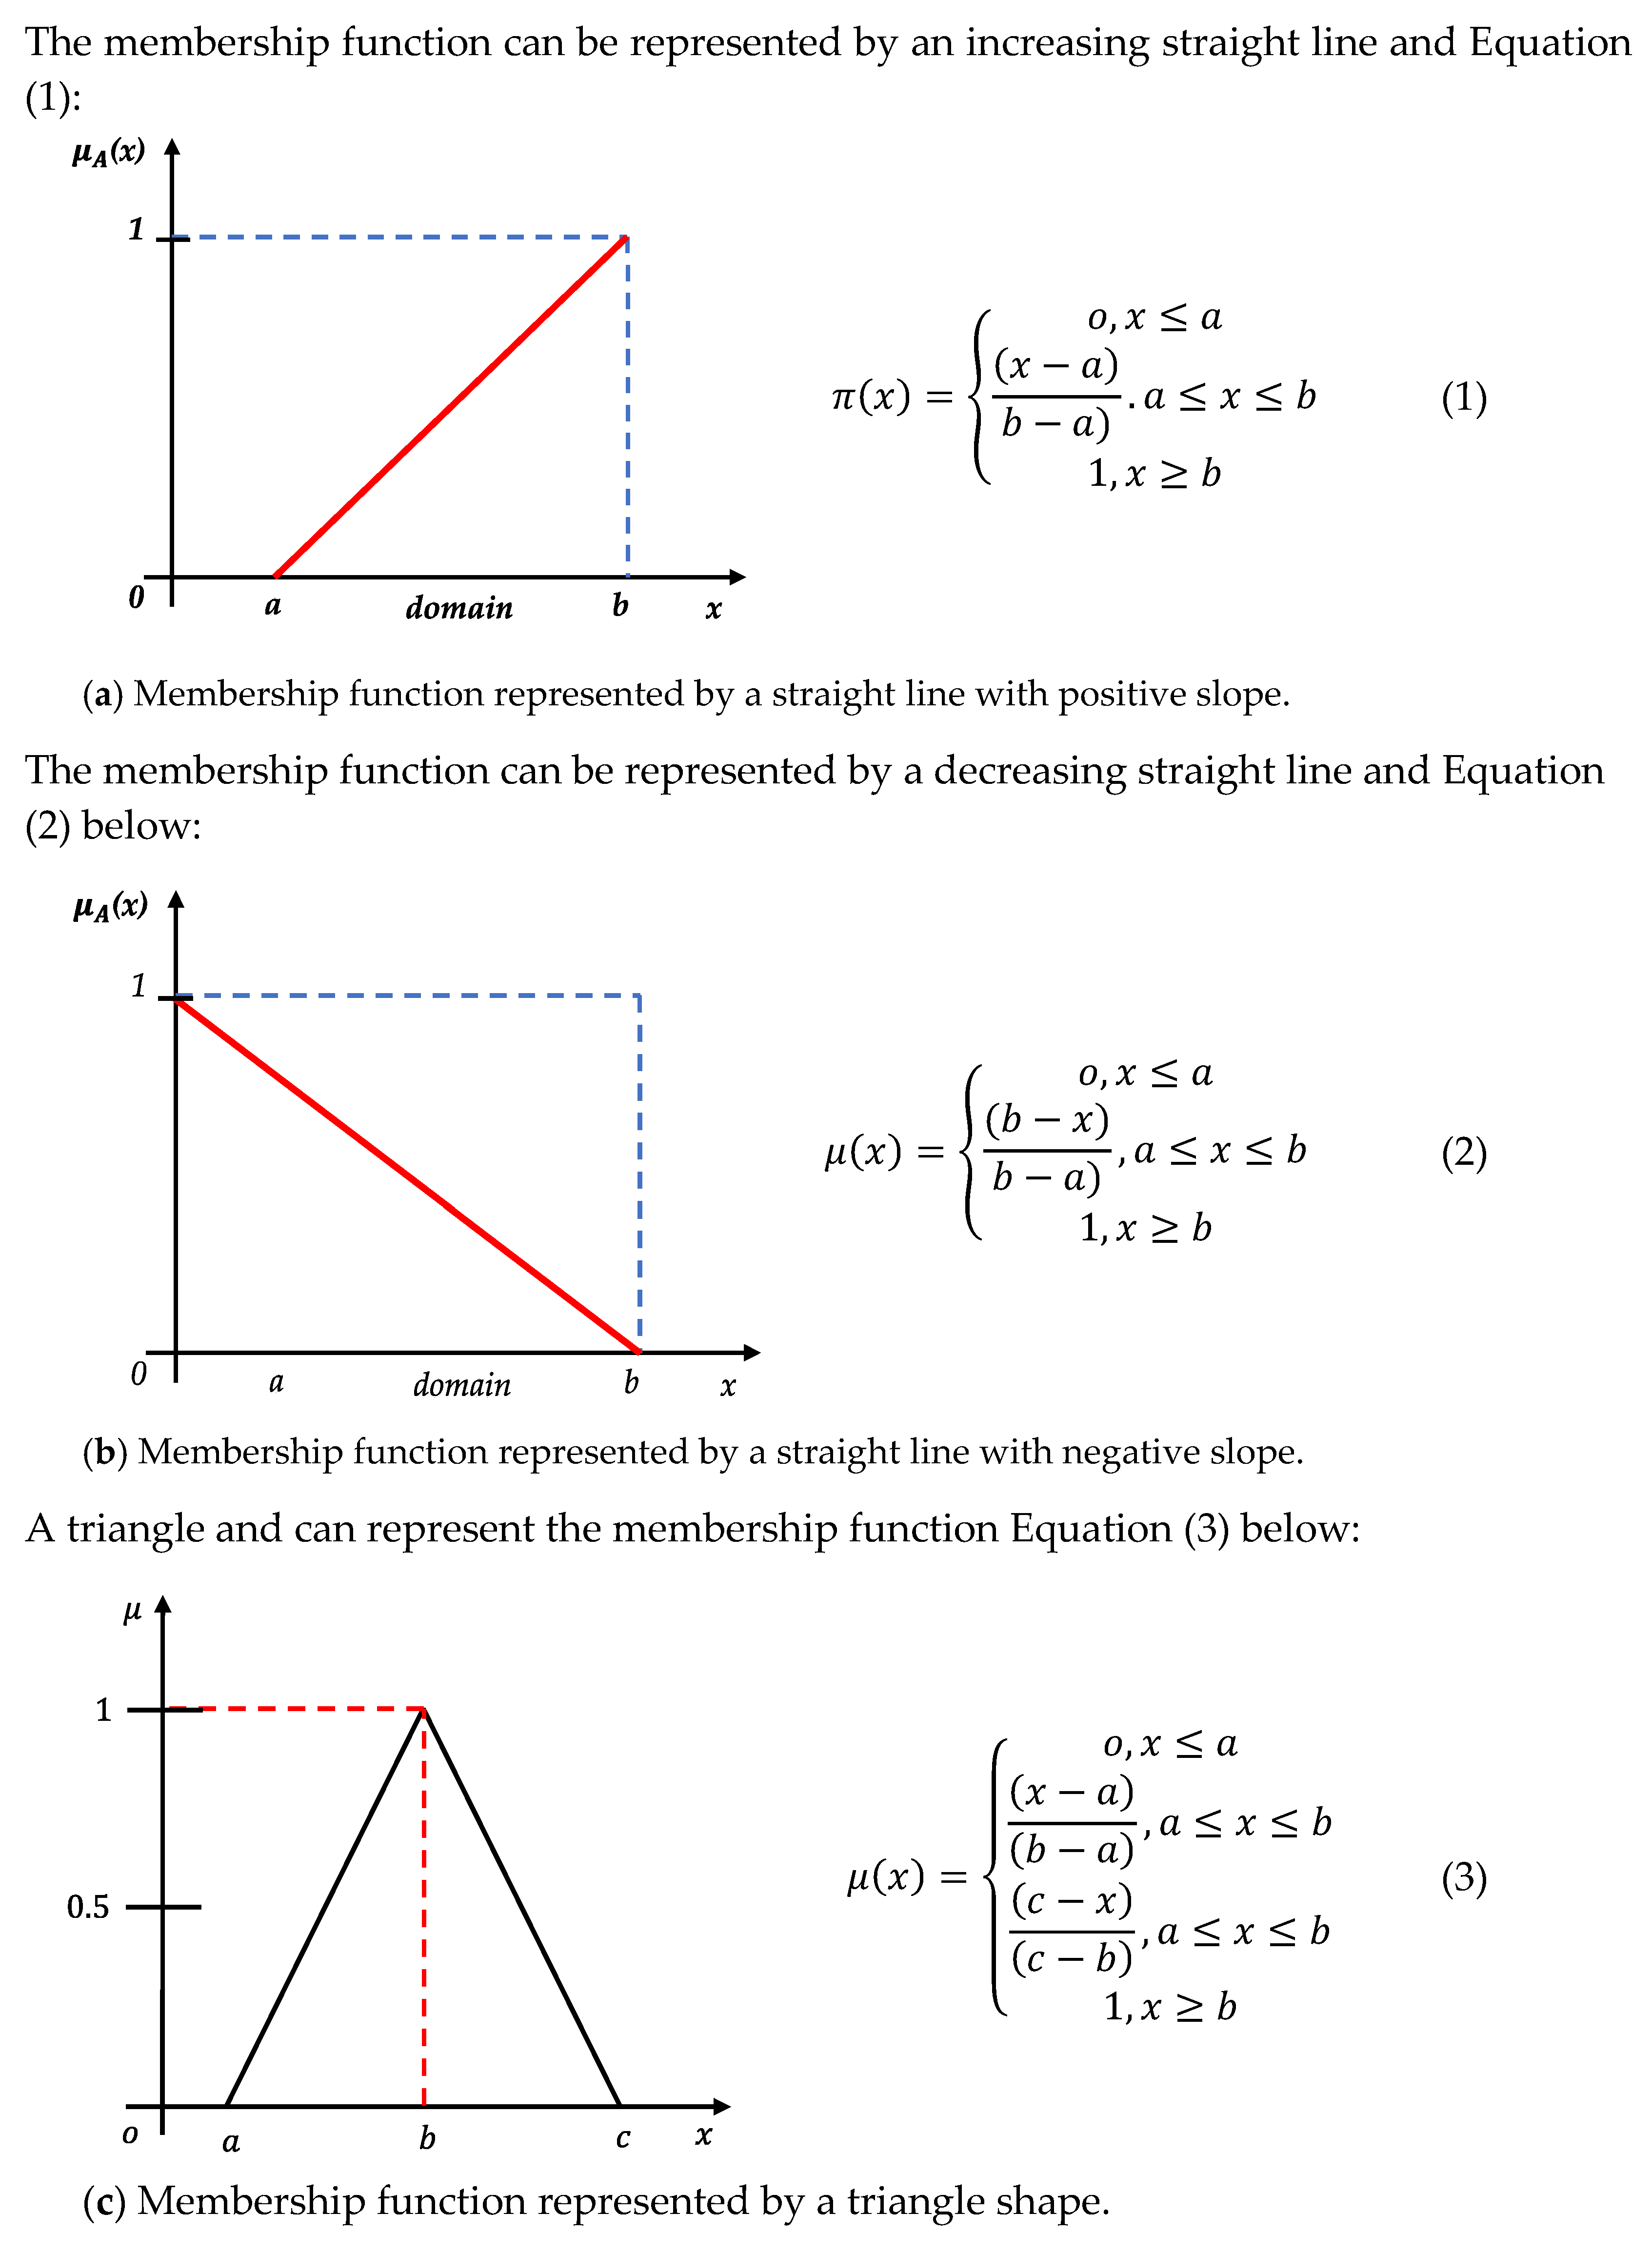
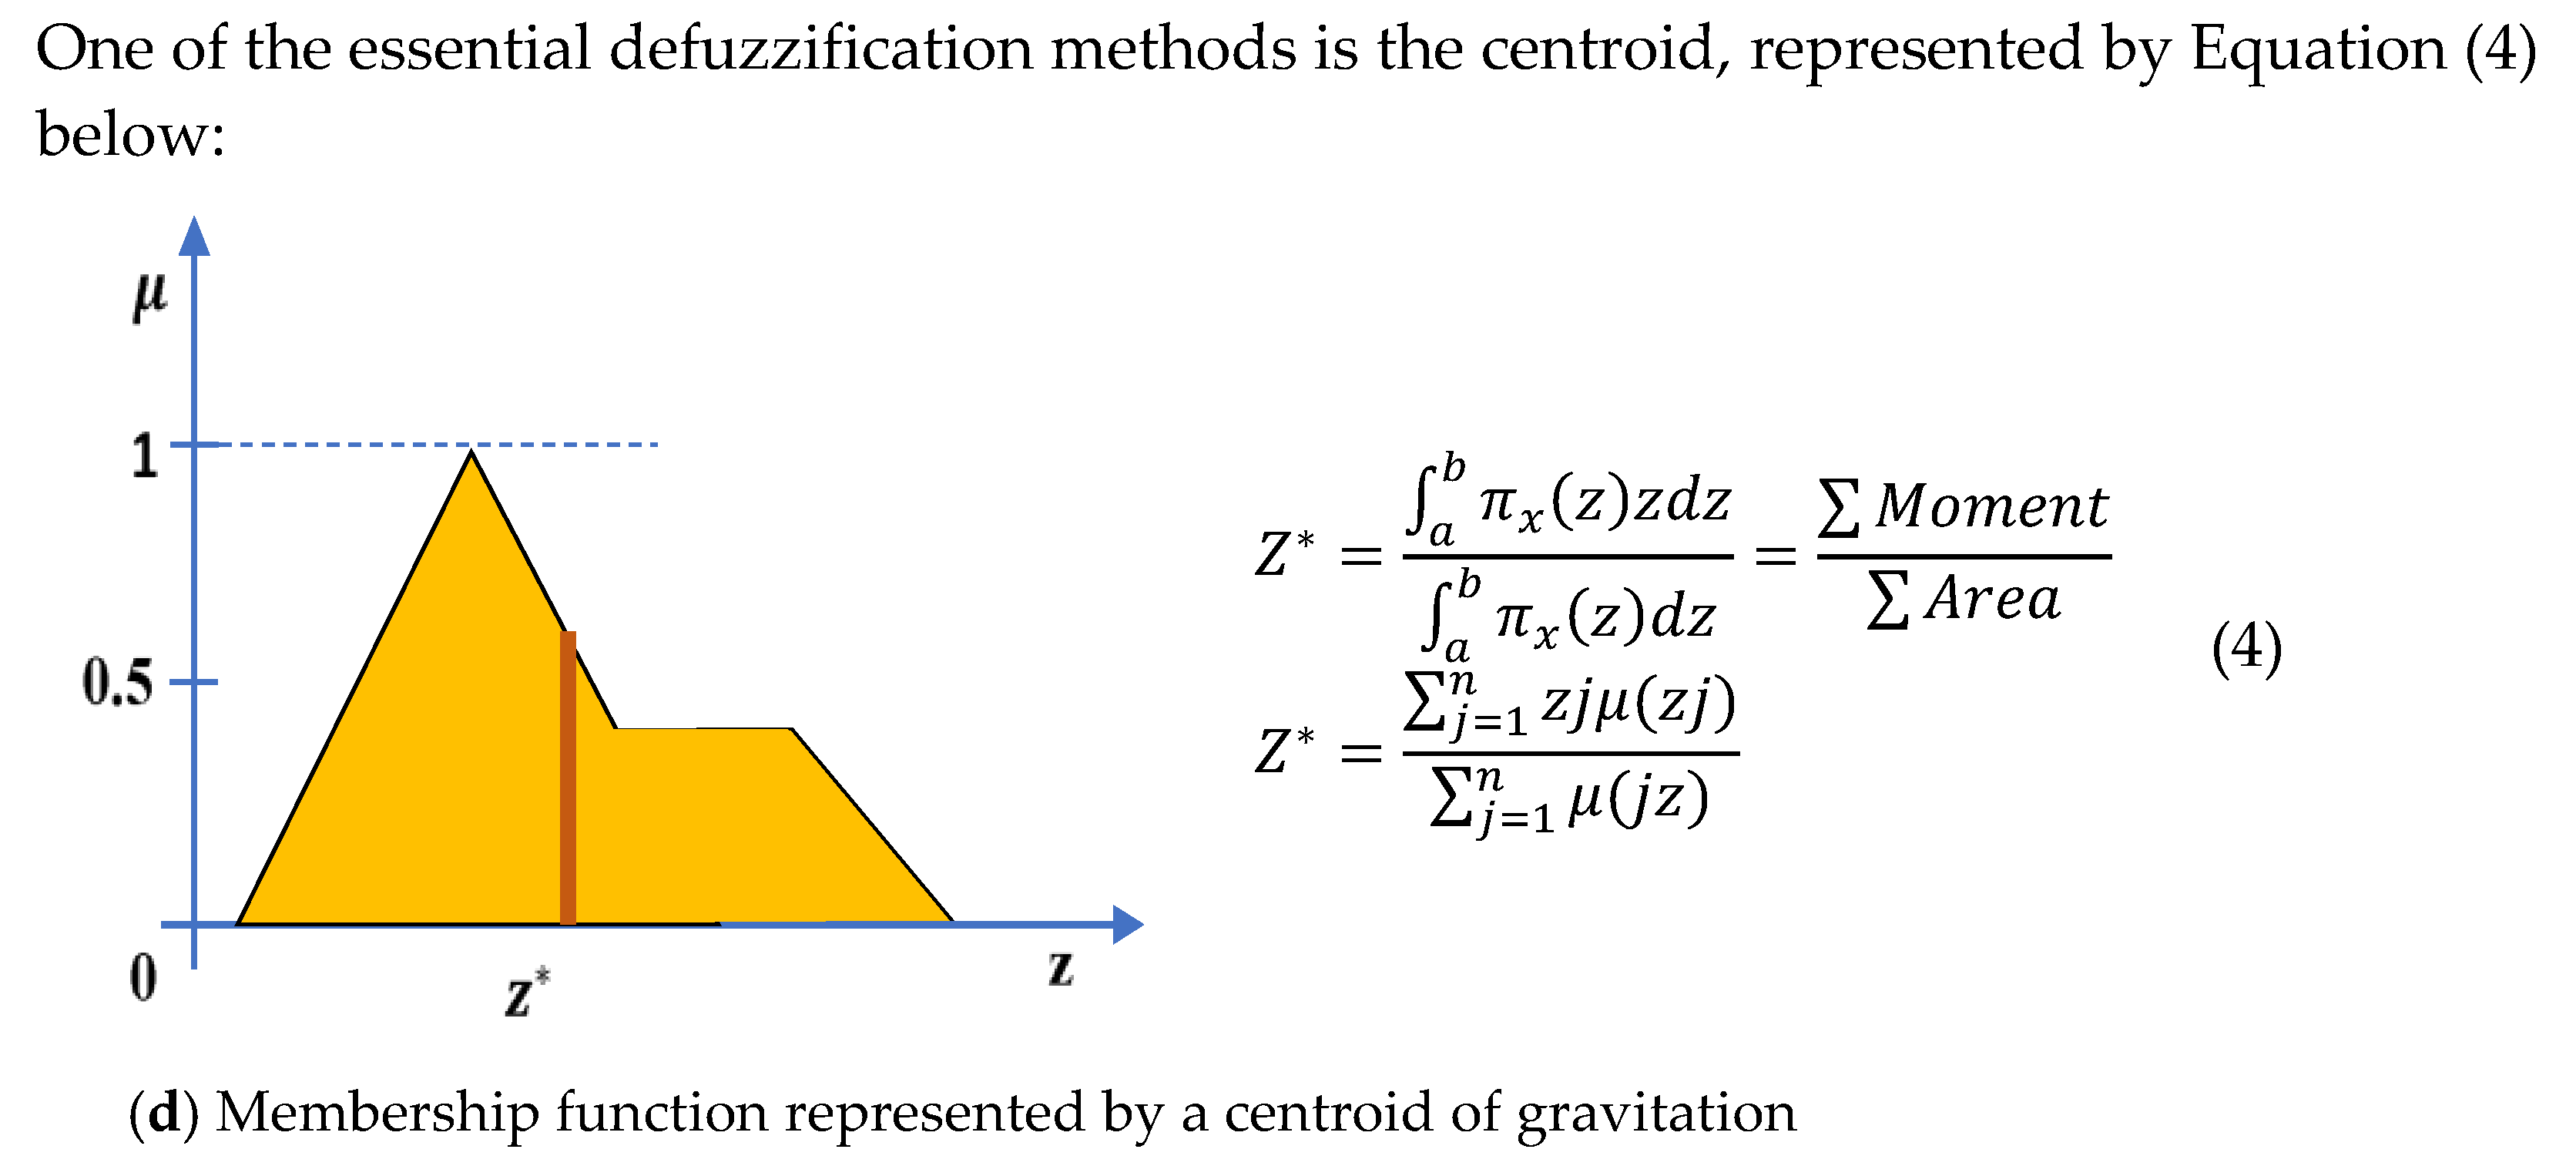
2.3. Fuzzy Inference System (FIS)

Fuzzy logic allows an analysis where the data is fuzzy or unclear; then, some ideas initiate a science to solve fuzzy problems; the elements or formulas closely related to our research are as follows, regarding the membership function, as shown in Figure 2.
The fuzzy Petri net of Fuzzy Inference System (FIS) combines two disciplines; fuzzy logic and Petri net theory are designed to answer obscure or unclear problems in the system under analysis. Therefore, we use FIS to search solutions for obscure problems about assets or systems that do not have historical data but must have well-defined answers on Reliability, Availability, Maintenance, and Safety (RAMS) performance. Many researchers have developed studies on this subject. According to Kiran et al., soft computing tools such as FIS provide a simple but powerful way to predict performance [22]. Yel and Yalpir applied FIS modeling to predict wastewater treatment plant effluent quality. They concluded that the approach was effective and reliable [23]. Furthermore, Ain et al. argued that as the number of rules increases, the task of defining them in FIS becomes time-consuming and “ultimately increases the chance of manual errors” [24]. Akgun et al. presented a program called MamLand to construct a Mamdani fuzzy inference system and employed it in MATLAB [25]. In more recent work, Bizimana and Altunkaynak (2020) used the Mamdani fuzzy inference system (Mamdani) to develop a comprehensive fuzzy model of the incipient motion of sediment. Still, they noted problems training the fuzzy model [26]. In their work on weight on drill bit prediction models, Khosravanian et al. compared the Mamdani-type FIS to another FIS, the Sugeno-type. The results convincingly demonstrated the superiority of the Sugeno-type FIS for Weight On Bit (WOB) prediction [27]. Pinto et al. used Petri nets and FIS Mamdani modeling to simulate and analyze the components of an electric power supply system in a hospital using MATLAB. The authors concluded that the advantage of FIS is that it uses human experience to provide a faster solution than conventional techniques [2]. Gonbadi et al. propose a generic two-stage fuzzy inference system for dynamic prioritization of customers in the real world [28]. After that, Jain and Singh proposed a two-phase decision model using FIS; these latter researchers used the fuzzy Kano philosophy on the sustainable environment to select sustainable suppliers for a large-scale industry [29]. Based on the preceding, it seems the fuzzy Petri net and fuzzy inference system have a very high potential to solve complex reliability problems in obscure or unclear systems.

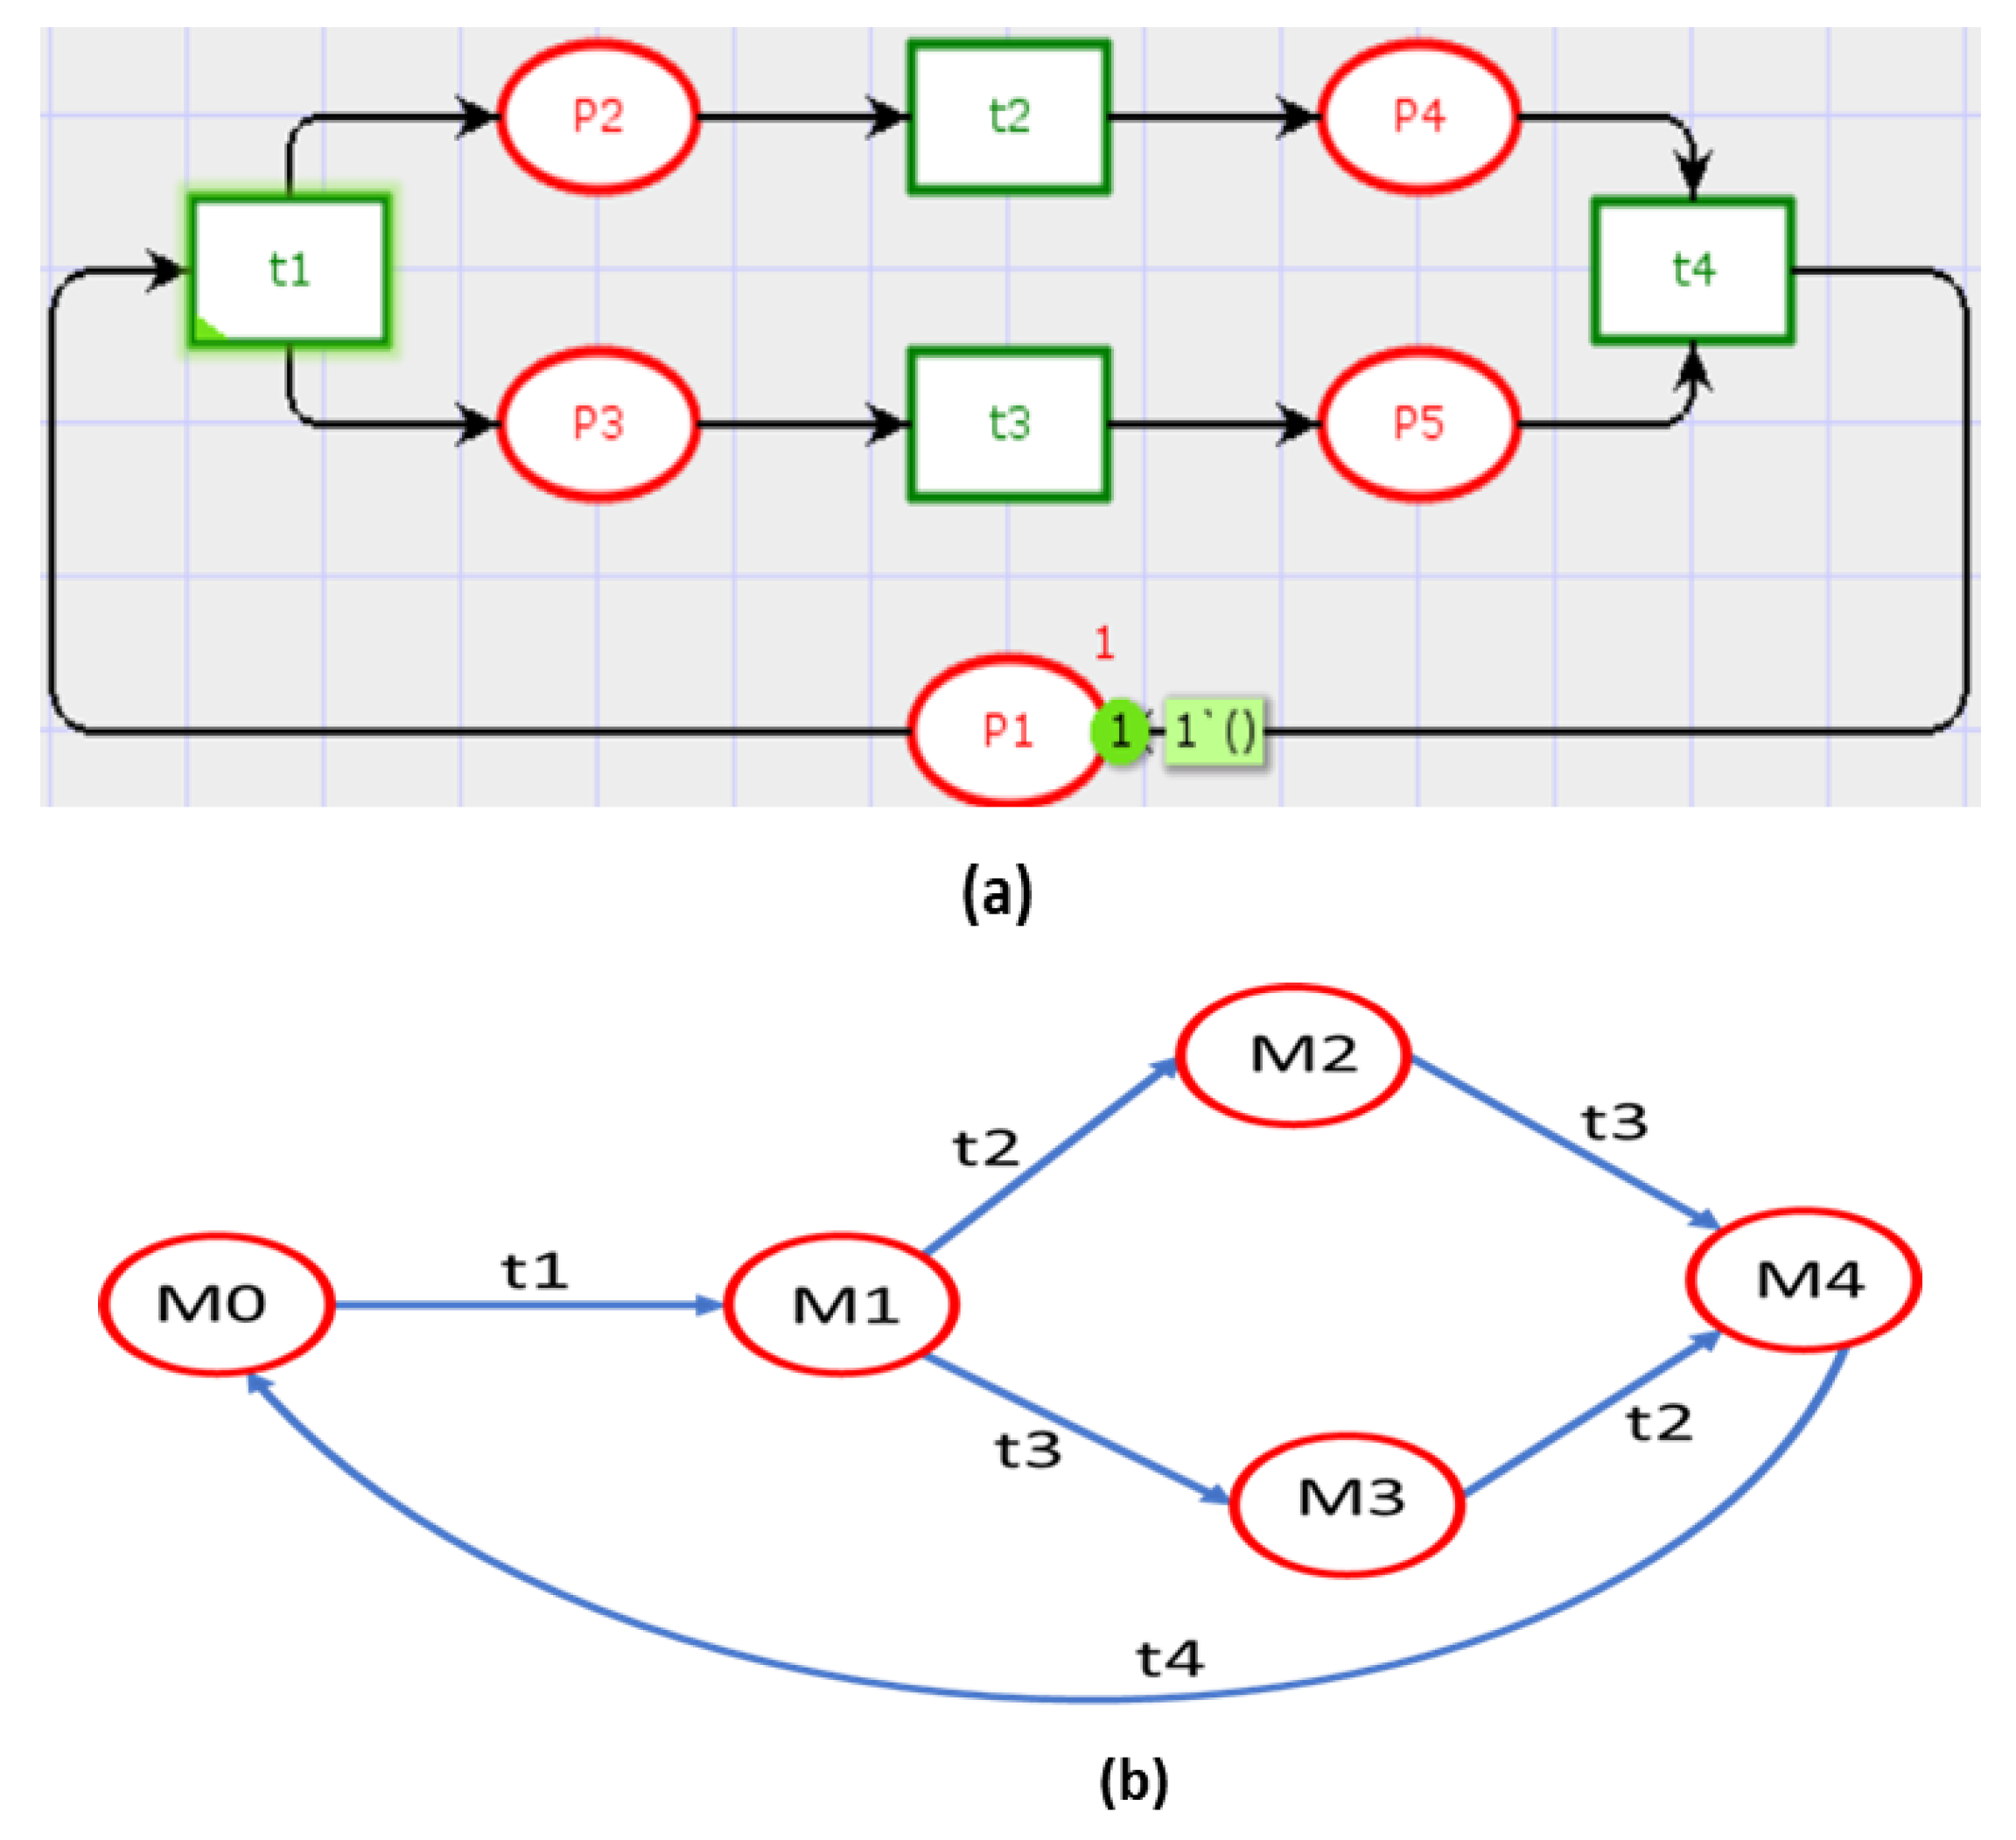
2.4. Stochastic Time Petri Nets (STPNs) and Markov Chains

Stochastic time Petri nets (STPNs) combine stochastic processes with Petri net theory and are used to find answers to complicated and challenging problems. We use STPNs to model and simulate the behavior of a system to identify potential problems. This approach is essential when a system does not have historical data, but the organization needs rigorous knowledge on its reliability, availability, and maintainability to improve its performance. In their work on risk assessment of groundwater contamination, Jiang et al. created the fuzzy stochastic model that combines the input vector fuzzy cluster with the activation function of the radial basis in a stochastic neural network [30]. Finally, Sharifi et al. used a stochastic fuzzy-robust approach to tackle the uncertainty of second-generation biofuel network design parameters. They applied the weighted sum method [31]. In their study of the reliability of a system dedicated to renewable energies using stochastic Petri nets, Mahdi et al. initiated a “time factor”, whereby the associated times on each transition were random variables following distribution laws. They also proposed using Monte Carlo simulations, Markovian chains, or other state diagrams [32]. On the other hand, Volovoi and Peterson (2011) distinguish between Markov chains and SPN, noting that each state represents the system as a whole in the former. Still, the states of individual components are described in the latter, and the systems state is inferred from its components [33]. Finally, Dhople et al. developed a stochastic hybrid systems framework. It is usually used in system performance analysis to analyze the Markov model. This framework is based on an analytical tool developed for stochastic processes called stochastic hybrid systems [34]. Wang et al. incorporated the Markov chain concept into a fuzzy stochastic prediction of stock indexes to attain better accuracy and confidence [35]. To sum up, as these examples suggest, the STPN is a sophisticated tool that can be used to understand complex and multidimensional systems.
The Stochastic Petri Net (SPN) is a six-tuple (P, T, I, O, M0, Λ ) where (P, T, I, O, M0) is the Petri net, Λ : T R is the set of levels where λ k is the exponential distribution rate of the individual ignition time Gk (x|M) is related to the transition tk, and
P (Places) = {P1, P2, …, P24};
T (Transitions) = {T1, T2, …, T22};
I (Input);
O (Output);
M0 (Marking).
Figure 3 shows an example of an STPN.
With: M0 = (1 0 0 0 0) T, M1 = (0 1 1 0 0)T, M2 = (0 0 1 1 0)T, M3 = (0 1 0 0 1)T, and M4 = (0 0 0 1 1)T.
[ π 1   π 2   π 3   π 4   π 5   π 6   π 7 ] [   0.2   0.8 0 0 0 0 0 0 0.3 0 0 0.35 0.35 0 0 0.7 0.3 0 0 0 0 0 0.7 0 0.3 0 0 0 0 0 0 0 0.27 0 0.73 0 0 0 0 0 0.27 0.73 0 0 0 0 0 0 1 ]
π 0 , π 1 , π 2 , π 3 , π 4 = 1
Our case study is a large hospital in Europe without historical data. In earlier work, we used Petri nets to identify the most critical equipment and systems on the electrical power supply system. To determine the reliability function, we used FIS [2]. We use another approach to compare them in this work and confirm the results: the “Stochastic versus Fuzzy” approach. We also use Markov chains for simulation and to simplify the matrix. The supporting concepts are as follows:
Stochastic Classification Process
1. A stochastic process is a time-dependent random variable. Therefore, we have a function with two arguments, X (t, ω), where:
t τ is time, with as a possible set of times, usually (0, ∞), (−∞, ∞),
{0, 1, 2,…}, or {…−2, −1, 0, 1, 2,…};
ω∈ Ω, as before, is the experimental result, where is the entire sample space.
The value of X (t, ω) is called the state.
2. A stochastic process X (t, ω) is a discrete state if the variable Xt (ω) is discrete for each time t, and a continuous state if Xt (ω) is also continuous.
3. The stochastic process X (t, ω) is a discrete-time process if the specified time consists of separate and isolated points. It is a continuous-time process if it is a connected interval; note that it can be infinite.
4. A stochastic process X(t) is a Markov chain if for all t1 < ... < tn < t, and there is a set A; A1,…, An
P (X (t) ∈ A | X (t1) ∈ A1,…, X (tn) ∈ An}
= P (X (t) ∈ A | X (tn) ∈ An).
The conditional distribution of X(t) is the same in two different conditions:
  • Observations of process X at several moments in the past;
  • Only the most recent observations of X.
The continuous-time Markov chain is a stochastic process with a Markov property. The distribution of future conditions at time t + s, given the present state, if all past states depend only on the current state and do not depend on the past is as follows:
P {future | past, present} = P {future | now}.
Then, only its current state matters for the future development of the Markov process, and it does not matter how the process came to be in this state.
Discrete-Value Process and Continuous-Value. X (t) is a discrete-value process if the set of all possible values of X (t) at all times t is the computable set Sx; otherwise, X (t) is a continuous value process.
Discrete-time and continuous-time processes. An educational process X(t) is a discrete-time process if X(t) is defined only for a set of instantaneous times, tn = nT, where T is a constant and n is an integer; otherwise, X(t) is a continuous-time process.
A Markov chain with discrete-time (discrete-time Markov chain) is a process with discrete-time when X(t) has a discrete value. Mathematically, the probability of moving from state i to j in time t is expressed as:
pij (t) = P (X (t + 1) = j | X (t) = i)
= P (X (t + 1) = j | X (t) = i, X (t − 1) = h, X (t − 2) = g,…)
The probability of transition to the h-step is expressed as:
Pij (h) (t) = P (X (t + h) = j | X (t) = i)
The three main procedures involved in the Markov analysis process are as follows:
Construct a transition probability matrix;
Calculate the probability of an event in the future;
Determine the steady-state conditions.
Matrix Approach: The transition probabilities of a step pij can be written in an n × n transition probability matrix:
Energies 15 01024 i003
The intersection of row i-th and column j-th intersection is pij, the probability of transition from state i to state j. From every state, a Markov chains make transitions to one and only one state. States destinations are disjoint and exhaustive events; therefore, the total of each row is equal to 1:
pi1 + pi2 + … + pin = 1.

2.5. CPNTools Software Simulator Description

Petri nets are traditionally divided into low-level and high-level Petri nets. Colored Petri nets belong to the latter class and are characterized by the combination of Petri nets and programming languages. As Jensen and Kristensen (2009) argued, the CPN modeling language is general purpose. It does not aim to model a specific class of systems. Instead, it aims to model a comprehensive class of systems characterized as concurrent systems. Typical application domains are communication protocols, data networks, distributed algorithms, and embedded systems. CPN networks also apply to modeling systems where concurrency and communication are key features. Examples include business processes and workflows, manufacturing systems, and agent systems [36]. The definition of the Petri net model using the CPNTools software is shown in Figure 4.

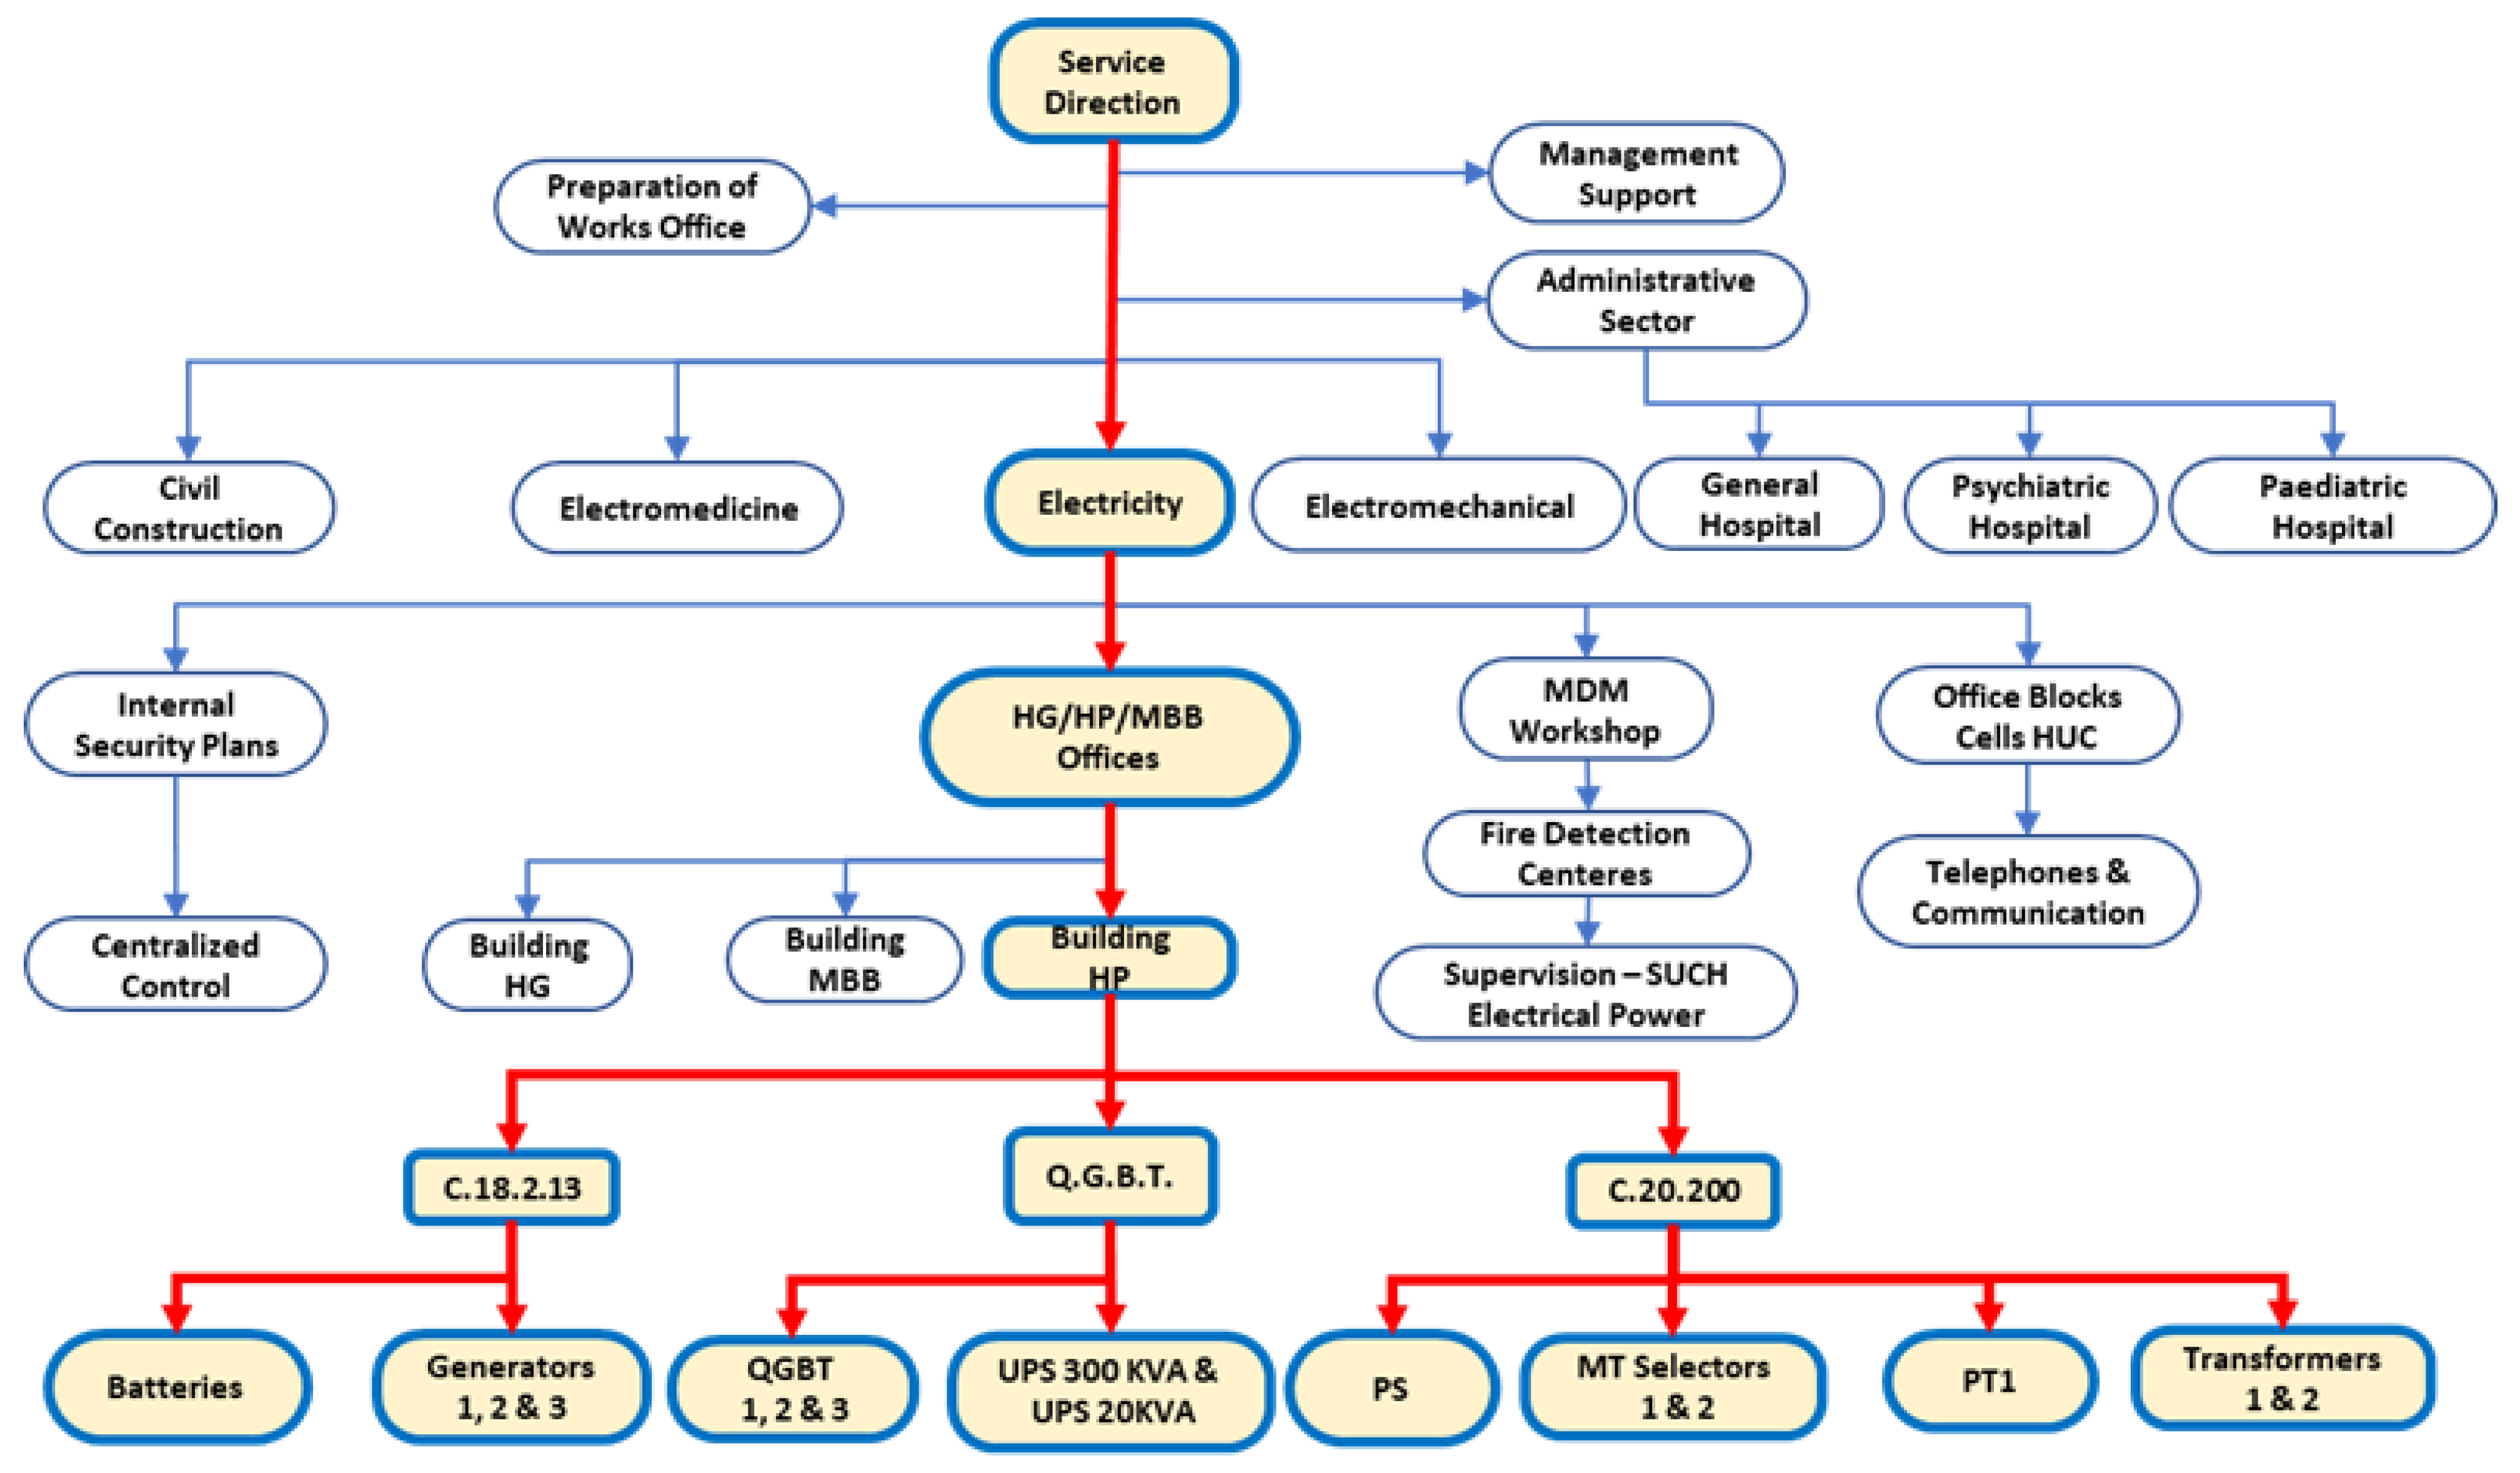
3. Description of Electrical Power Supply System of a Large European Hospital

3.1. Profile of a Large European Hospital

The case study focuses on a big European hospital, built in 2005 and accredited by the National Health Agency in 2010. The total building area is 90,000 m2. The main building consists of 21 structural bodies in which all health care services are installed—building A consists of 14 pavement levels located between the fourth and seventh floors. Building B is a supporting building consisting of equipment management and service facilities, warehouses, workshops, and power plants. This paper focuses on the hospital Emergency Power Supply System (EPSS). This system has the following equipment: UPS (Uninterruptible Power Supply) 300 KVA consists of two units; 1000 KVA generator composed of three units; ATS (Auto Transfer Switch) consists of only one unit; 8 KVA UPS consists of two units; 20 KVA UPS consists of 20 units; three-unit transformer; PT (Power Transfer) two units; Input LVDB (Low Voltage Distribution Board) three units; 6 LVDB central output units and other peripheral instrument correction batteries, LV distribution network, standard or emergency indoor lighting, signal and barrier outputs, regular or emergency outlets; and terrestrial networks. This study focuses on electrical energy power supply, using the time Petri net, fuzzy inference system, and stochastic methods to analyze and diagnose the function and reliability of power supply systems, and proposes a new approach to improve its reliability.

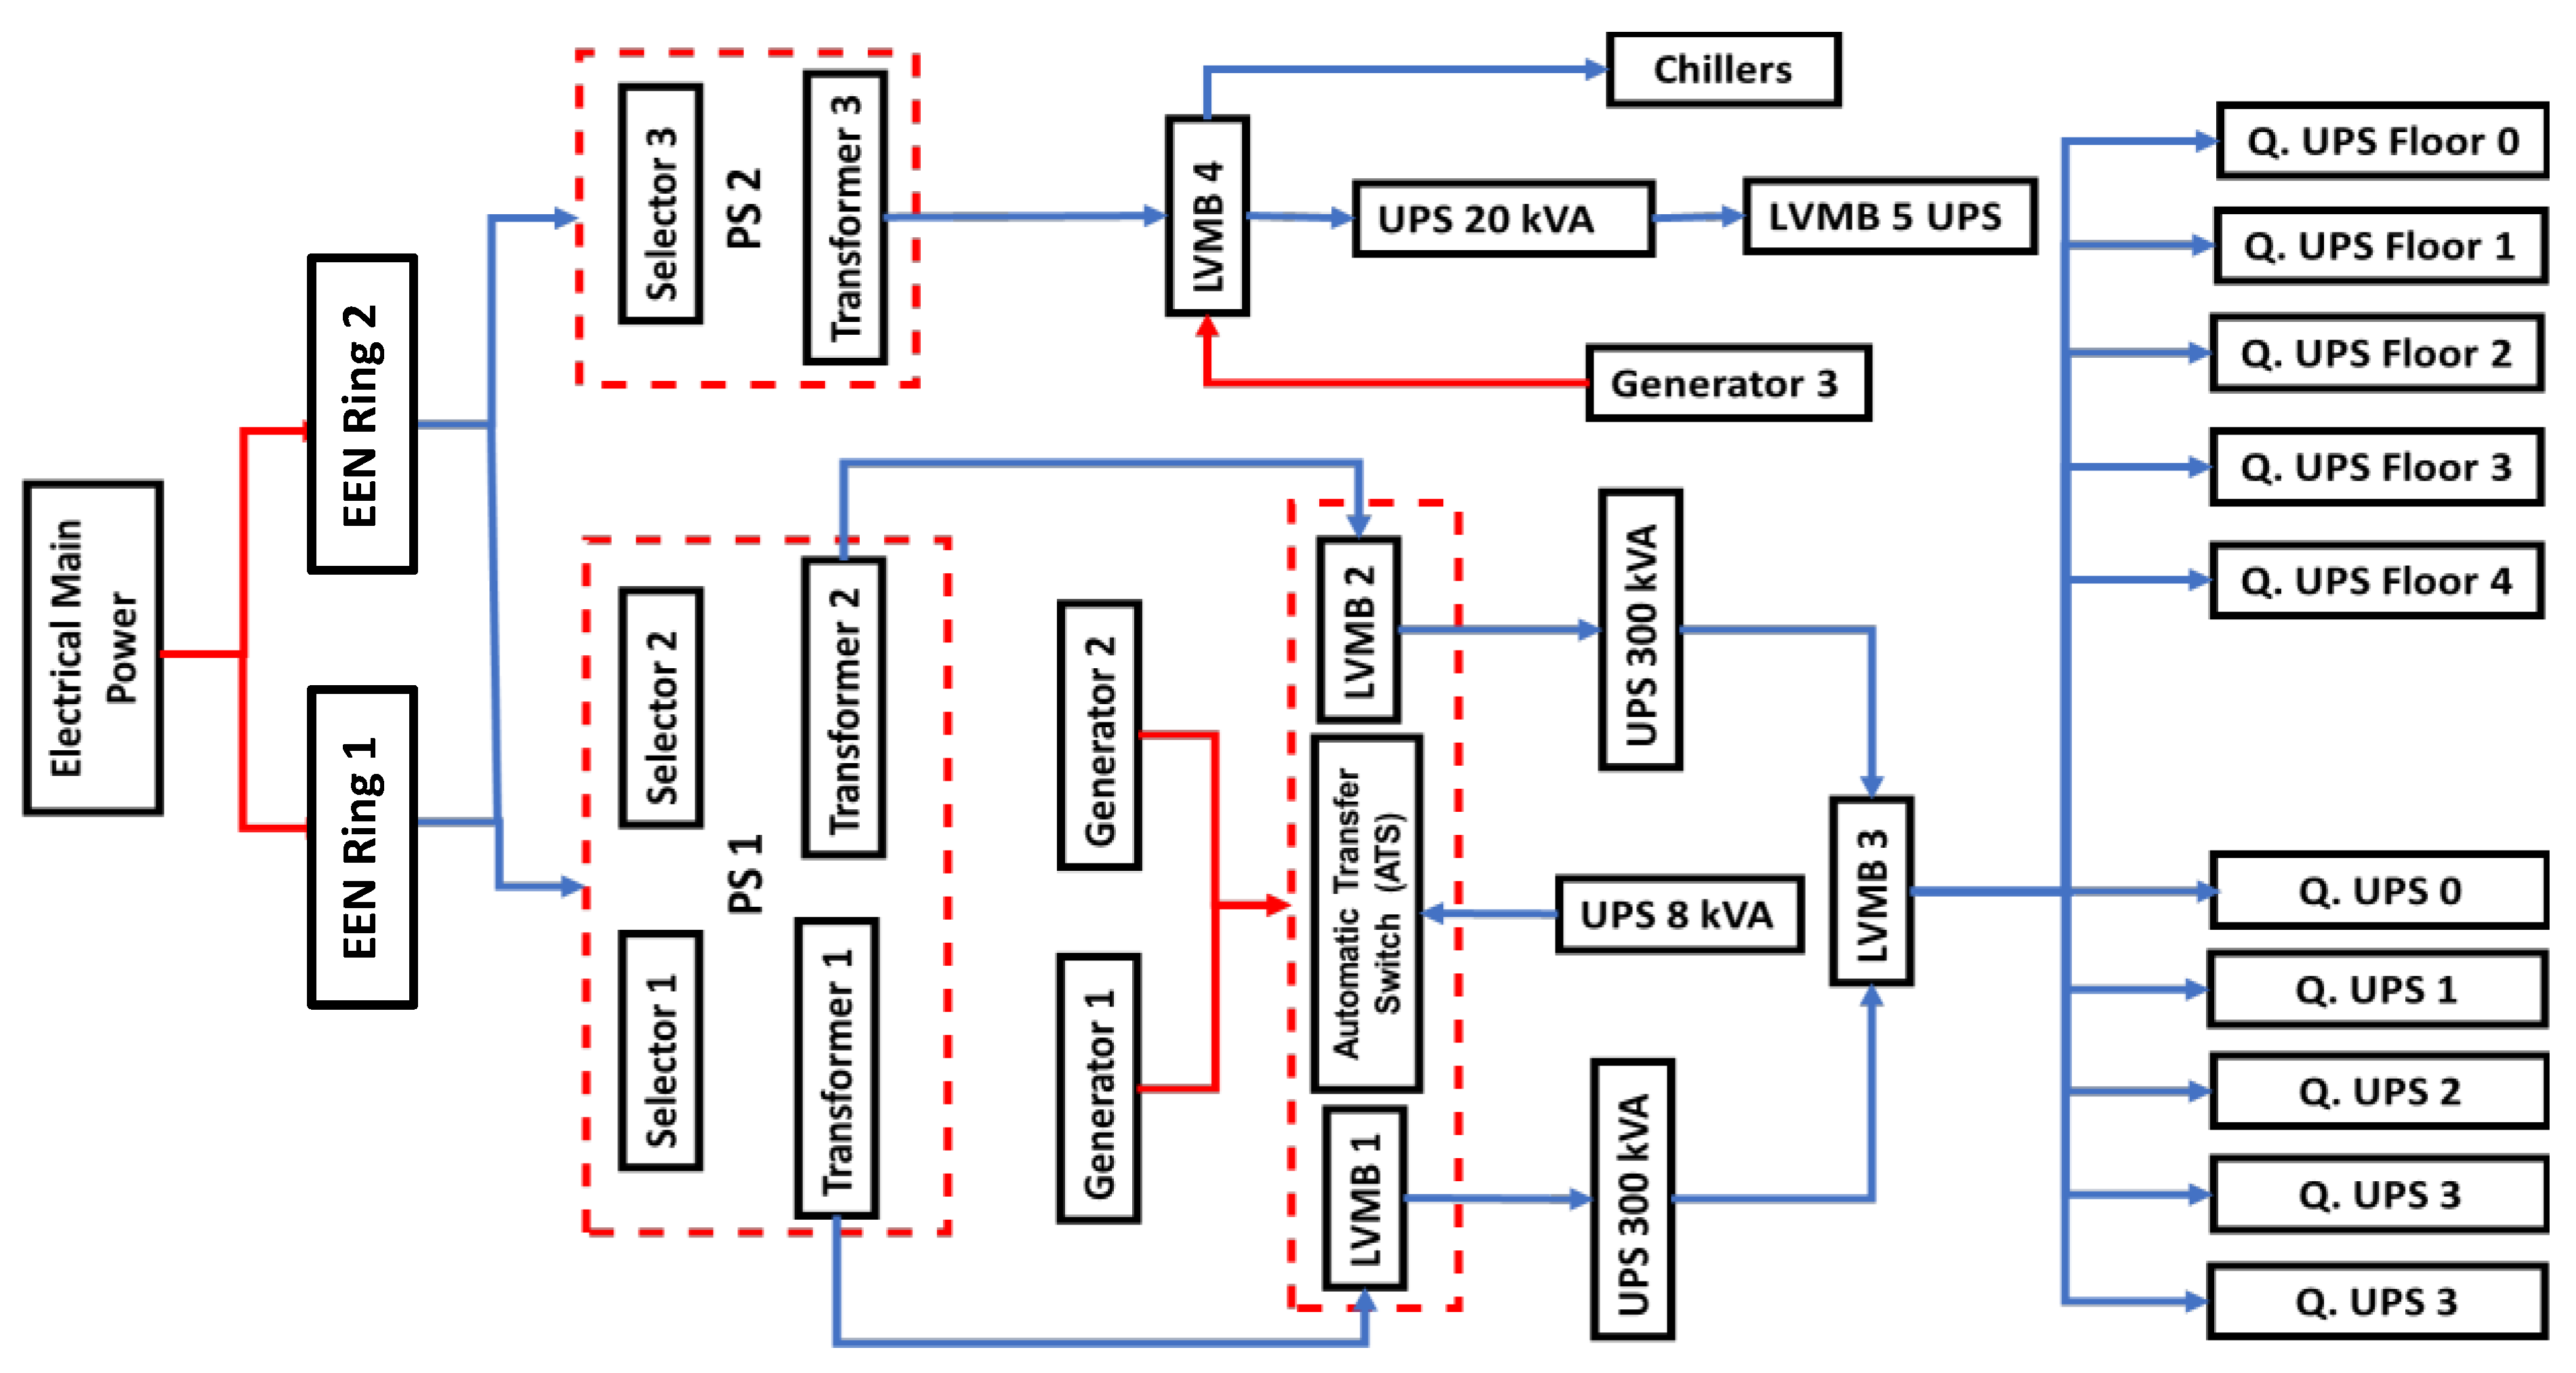
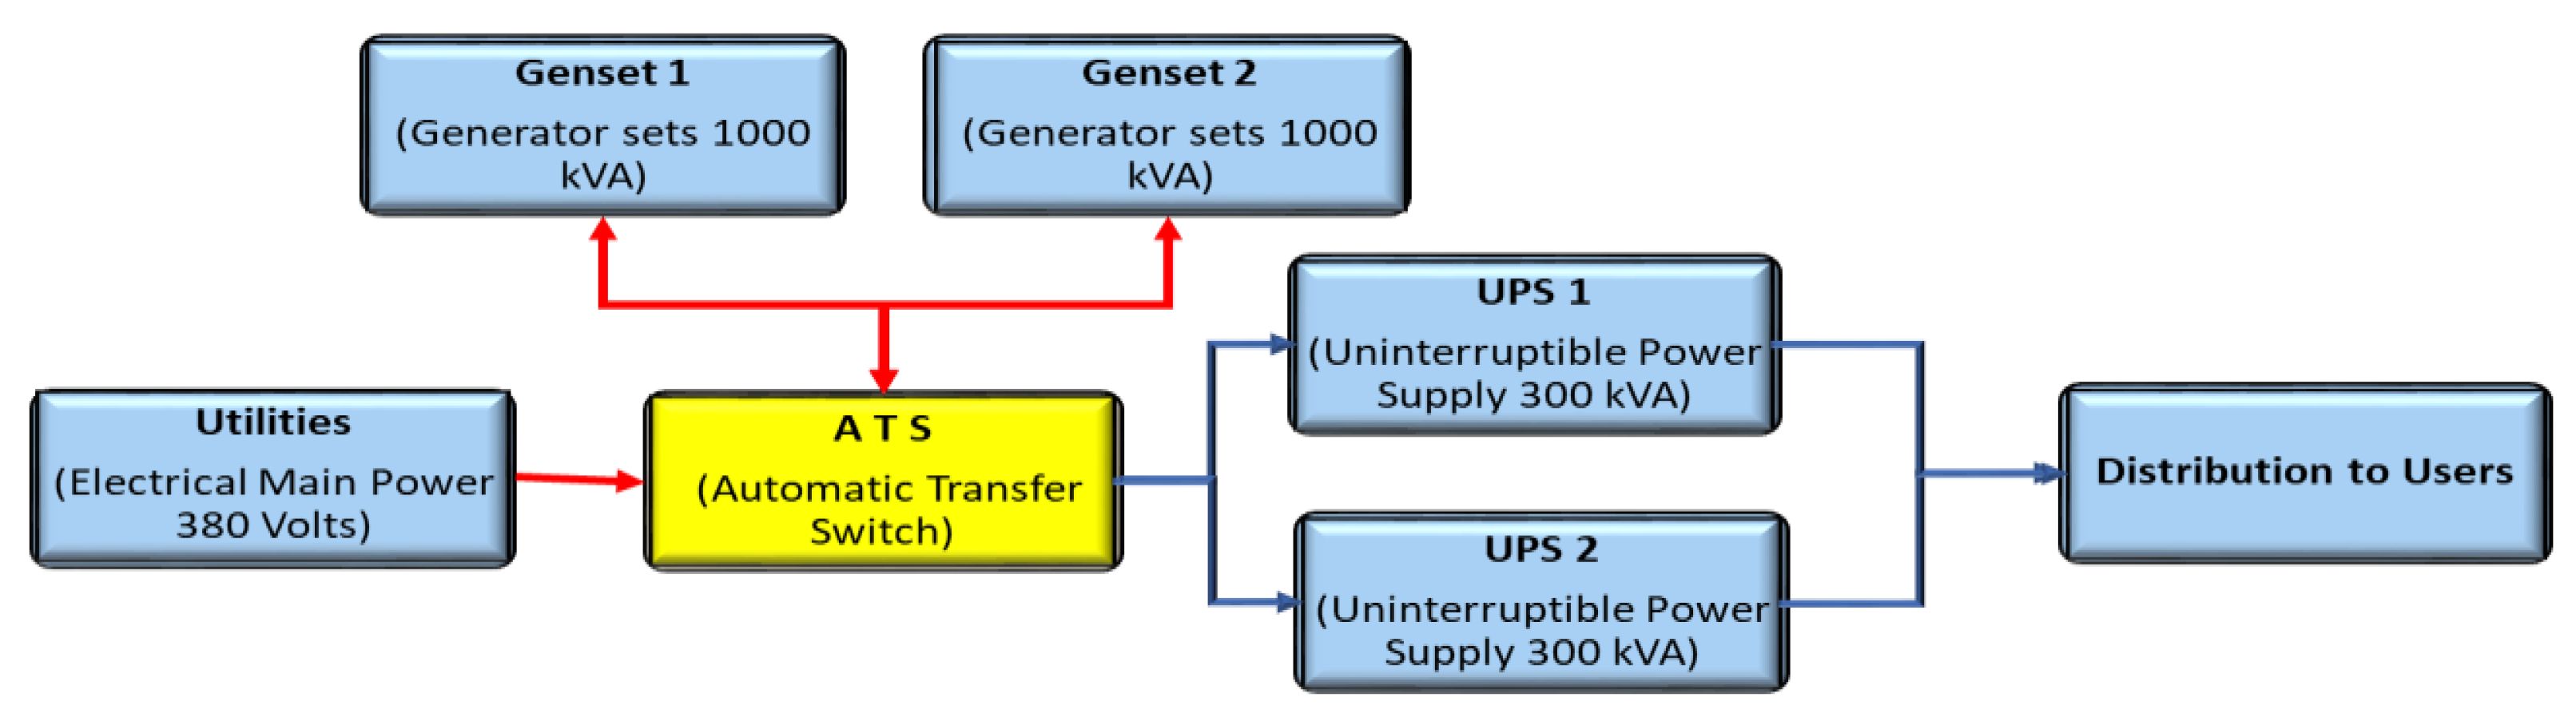
3.2. Modeling the Hospitals Electrical System Using Block Diagrams

To analyze the hospital electrical power systems, we followed the following steps: asset observation, data definition, and modeling; asset functions and analysis; installation functioning; simulation tools, such as Petri nets, MATLAB to FIS, stochastic, and Markov chains; simulation, analysis, and evaluation of assets reliability; and evaluation of research results. The process is shown in Figure 5.
Using Petri nets to model the complex asset, the following methods were used: Asset Hierarchy Block Diagram (AHBD); Asset Process Flowchart (APFD); Asset Functional Block Diagram (AFBD); and asset modeling using Petri nets. The asset hierarchy block diagram, shown in Figure 6, is the system’s organization that manages the hospital. The red line represents a theoretical form of Reliability Centered Maintenance (RCM) called boundary definition; we only deal with the electrical system on assets in the bold red line.

3.3. Generators, Automatic Transfer Switch (ATS), and UPS

In the event of a failure in the primary energy supply, the hospital is equipped with two generators units: 1000 kVA and a 500 kVA generator unit, both with diesel engines. The command board and the high power group transfer (1000 kVA) have installed a synchronization system to operate in parallel to meet the high-risk units. In contrast, another team with (500 kVA) for the service unit is not at risk; Figure 7 illustrates a process flowchart, service assets, which are modelled using block diagrams.
Figure 8 synthetically describes how the energy system works in a hospital. All of them consist of the following elements: the main entrance of electrical energy that supports the entire system of hospital activities; the inputs of the two generator units have 1000 kVA each to supply critical units; input from one generator with 500 kVA for non-critical units; and output to end-users, both critical and non-critical. According to hospital standards, the asset functional block diagram provides a good overview of planning care.

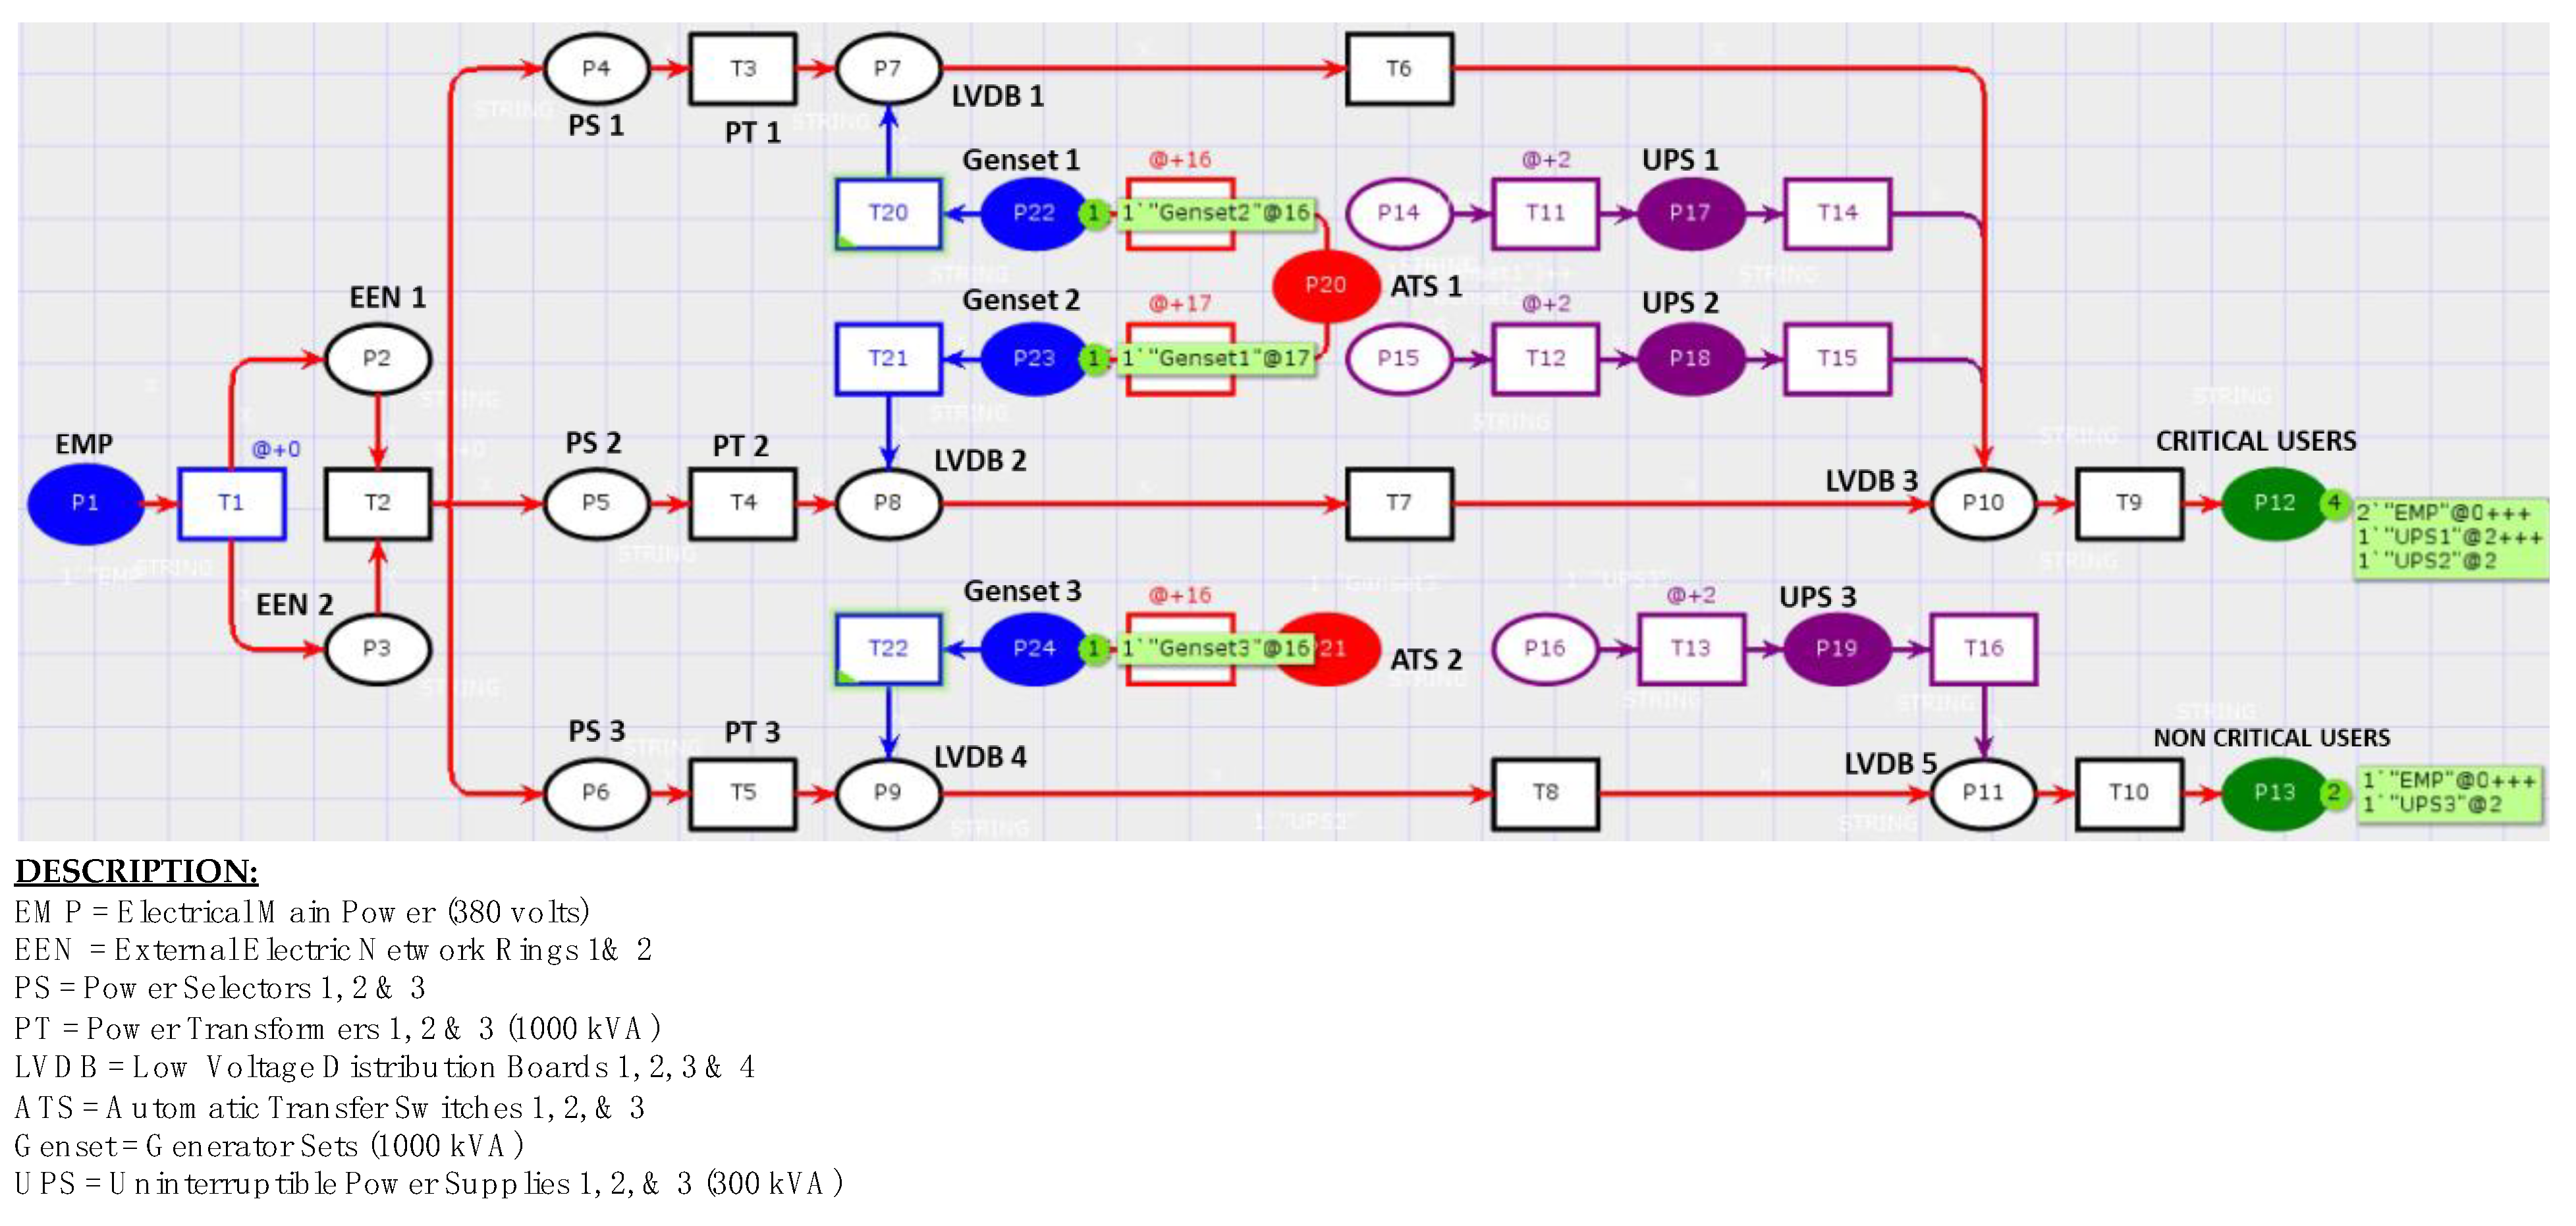
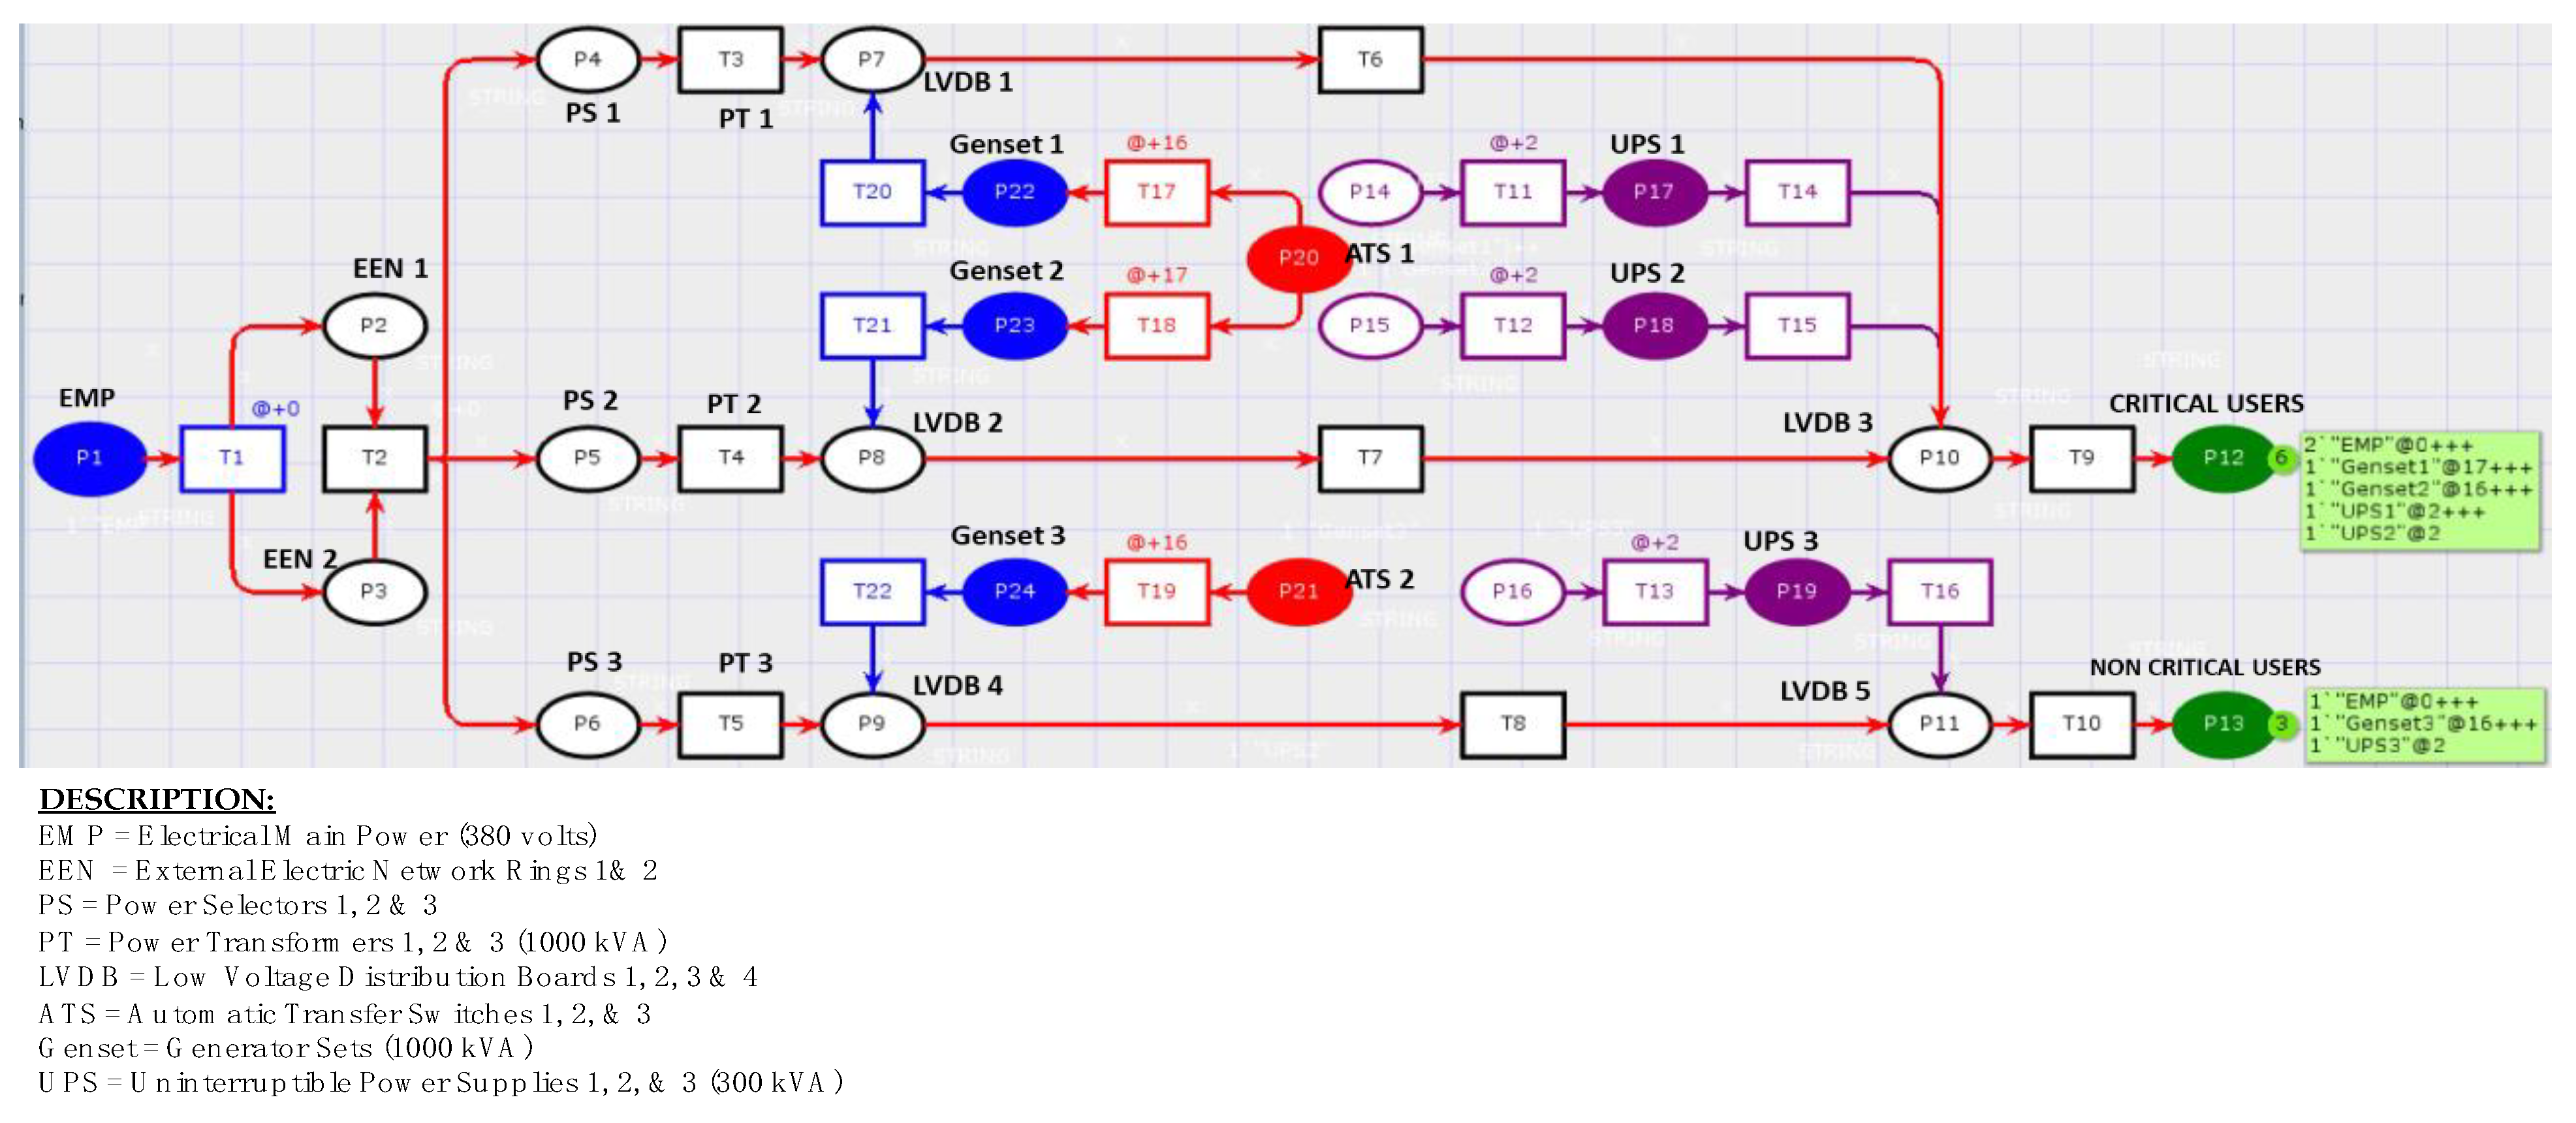
4. Dynamic Modeling of the Hospitals Electrical System Using Petri Nets

4.1. Modeling the Hospital Electrical System Using Petri Net Software Simulator CPNTools

To analyze the dynamic modeling of the emergency power supply system in a hospital and its shortcomings using the Petri net simulator, the CPNTols software program, through Figure 9, Figure 10 and Figure 11, represents the electrical circuits illustrated in Figure 7 and Figure 8, which include the Electrical Main Power (EMP) that is fed from the External Electrical Network (EEN 1 and 2). Starting at points 1, 2, and 3 on the selector, current flows into transformers 1, 2, and 3; the electric current is then forwarded to the low voltage distribution boards (LVDB) 1, 2, and 4, and is sent to UPS 1, 2, and 3; then, it goes to LVDBs 3 and 5 and, finally, to the user, which permits the hospital to run as expected.
In some situations, the Petri net series has a transition time; for example, there is a chance that the token will be issued from the generator when the UPS runs out of energy, between 15 to 20 s. The use of Petri nets in the case under study indicates the essential items or modules of the system. In this way, we can quickly diagnose the hospital power supply system reliability aiming to suggest maintenance procedures to ensure its highest availability.
This approach allows analysis and simulation of schematic diagrams representing electrical system assets through tokens moving from one place to another, according to the system’s natural functioning. In this way, the critical equipment of the electrical system in the hospital are easily identified.

4.2. Hospital Electrical System Block Diagrams

This section evaluates whether installing a hospital electrical system is safe in terms of reliability. After carefully observing the entire set of assets, the question to be answered is: which is the most critical and sensitive component or piece of equipment in the whole asset system? The schematic diagram in Figure 12 illustrates the electrical circuit and shows how the Electrical Main Electricity (EMP) source enters in service, controlled by the Automatic Transfer Switch (ATS), which has no redundancy. If there is a failure, it is through the ATS that Gensets one and two are activated; then, the electric power is forwarded to UPS 1 and 2 (uninterruptible power supply) of 300 kVA. Next, the power is sent to the loads (users).
The next step analyzes the critical systems in the hospital’s electrical circuit; then, it must determine the devices on the system that can cause physical asset malfunctions. For example, if the main power EMP fails, the UPS 1 and 2, with 300 kVA, automatically turn on and continue to supply electricity to the load, eliminating the danger of downtime; UPS 1 and 2, with 300 kVA, will power generators 1 and 2 with 1000 kVA power. Notice that only one ATS manages generators 1 and 2 (Figure 12)—if it does not work, the generators must be activated manually, which compromises the hospital system. A further question arises: how does a reliable network respond to situations like this? To answer the question and provide a new and more reliable solution, we simulate and model the problem through two ATS using a block diagram shown in Figure 13.
In the block diagram of Figure 13, if there is a disconnection from the main supply, UPS 1 and 2 will turn on. ATS activates Genset 1 and 2 to continue charging UPS one and two while waiting for external main power to restart; if one UPS or Genset is damaged, it will be replaced by another UPS and Genset. Fatal accidents will not occur, so the design increase reliability and implies additional maintenance care.
Therefore, we conclude that system components are critical for hospital electrical functioning, and ATS is vital. As a result, electrical circuits became the target of our research to identify the module’s main functions and potential system failures. However, the hospital did not provide historical data, a significant constraint for the analysis. Due to this, in our study, we use a fuzzy inference system that permits us, through fuzzification, to overcome this difficulty.

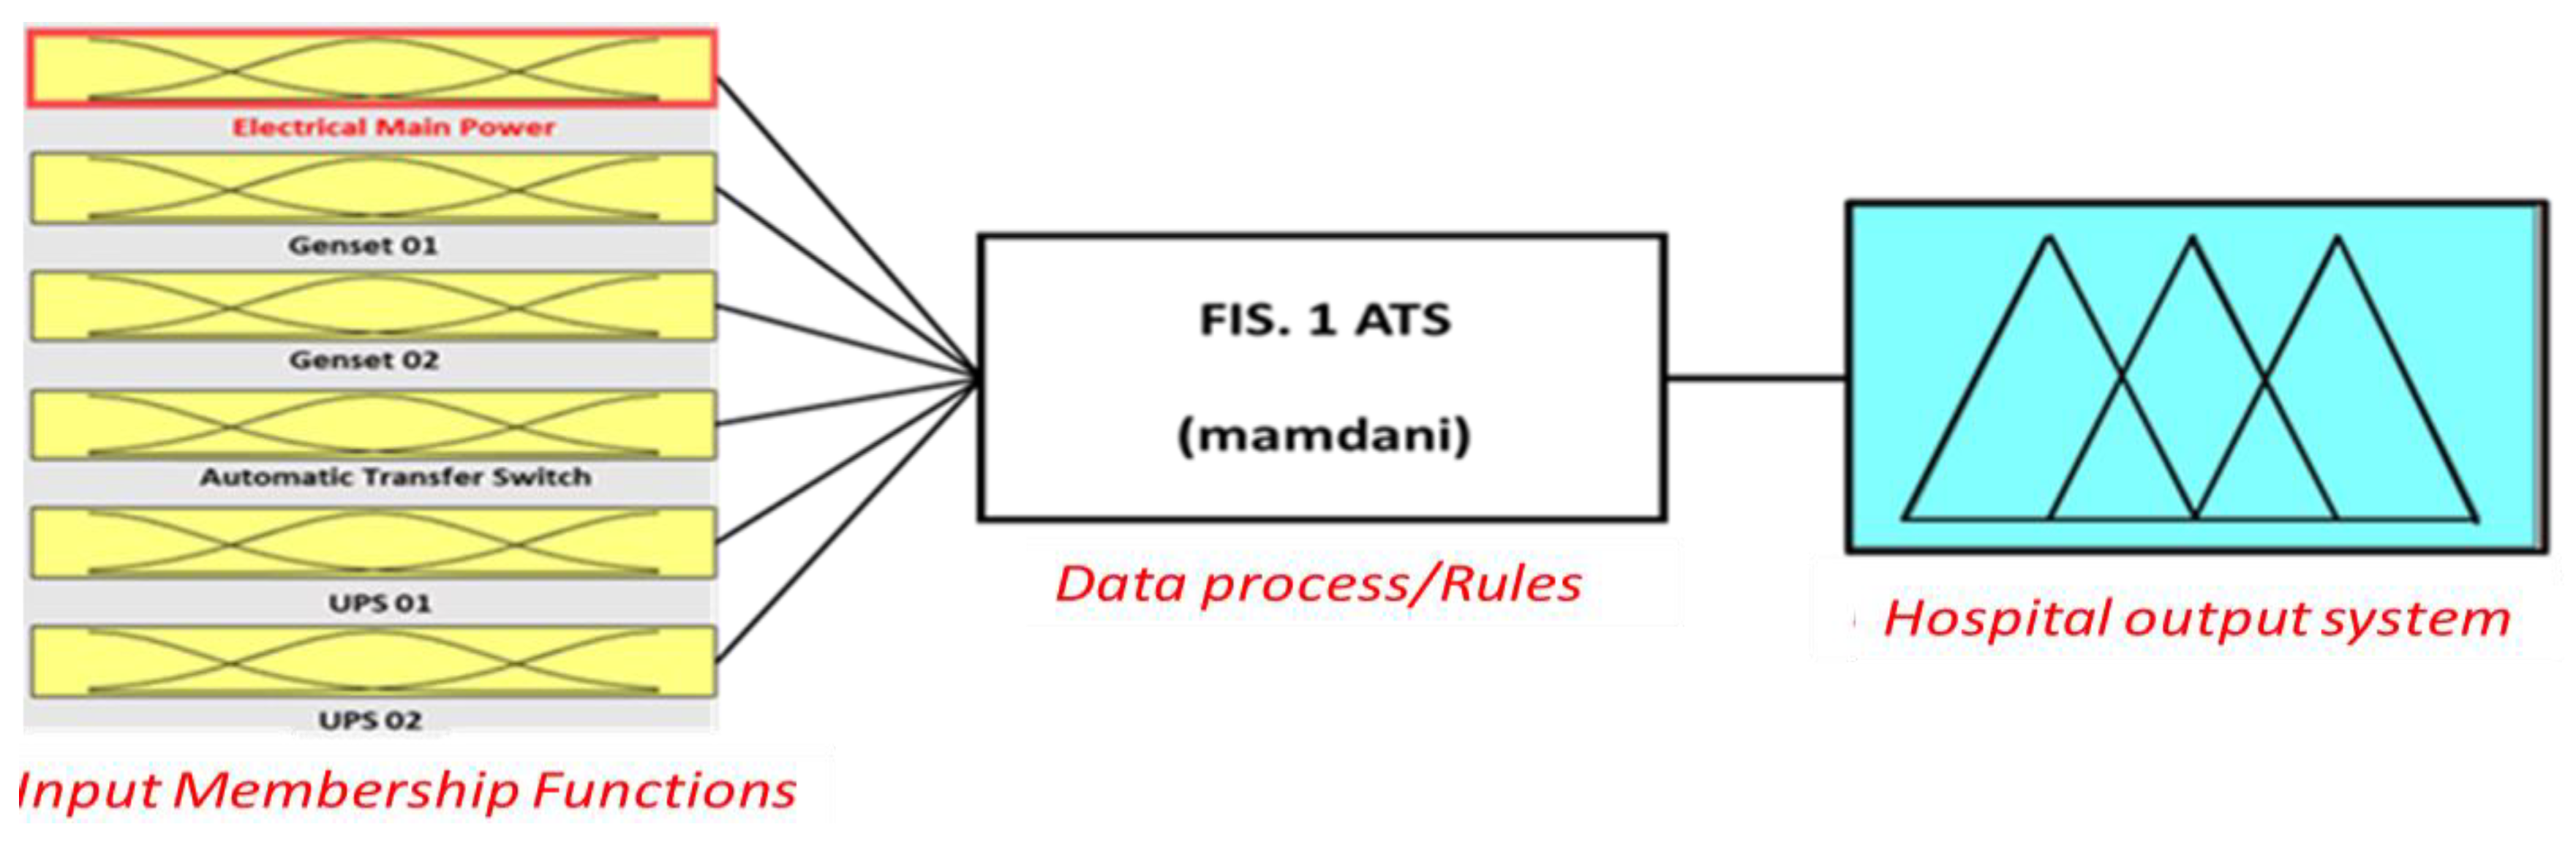
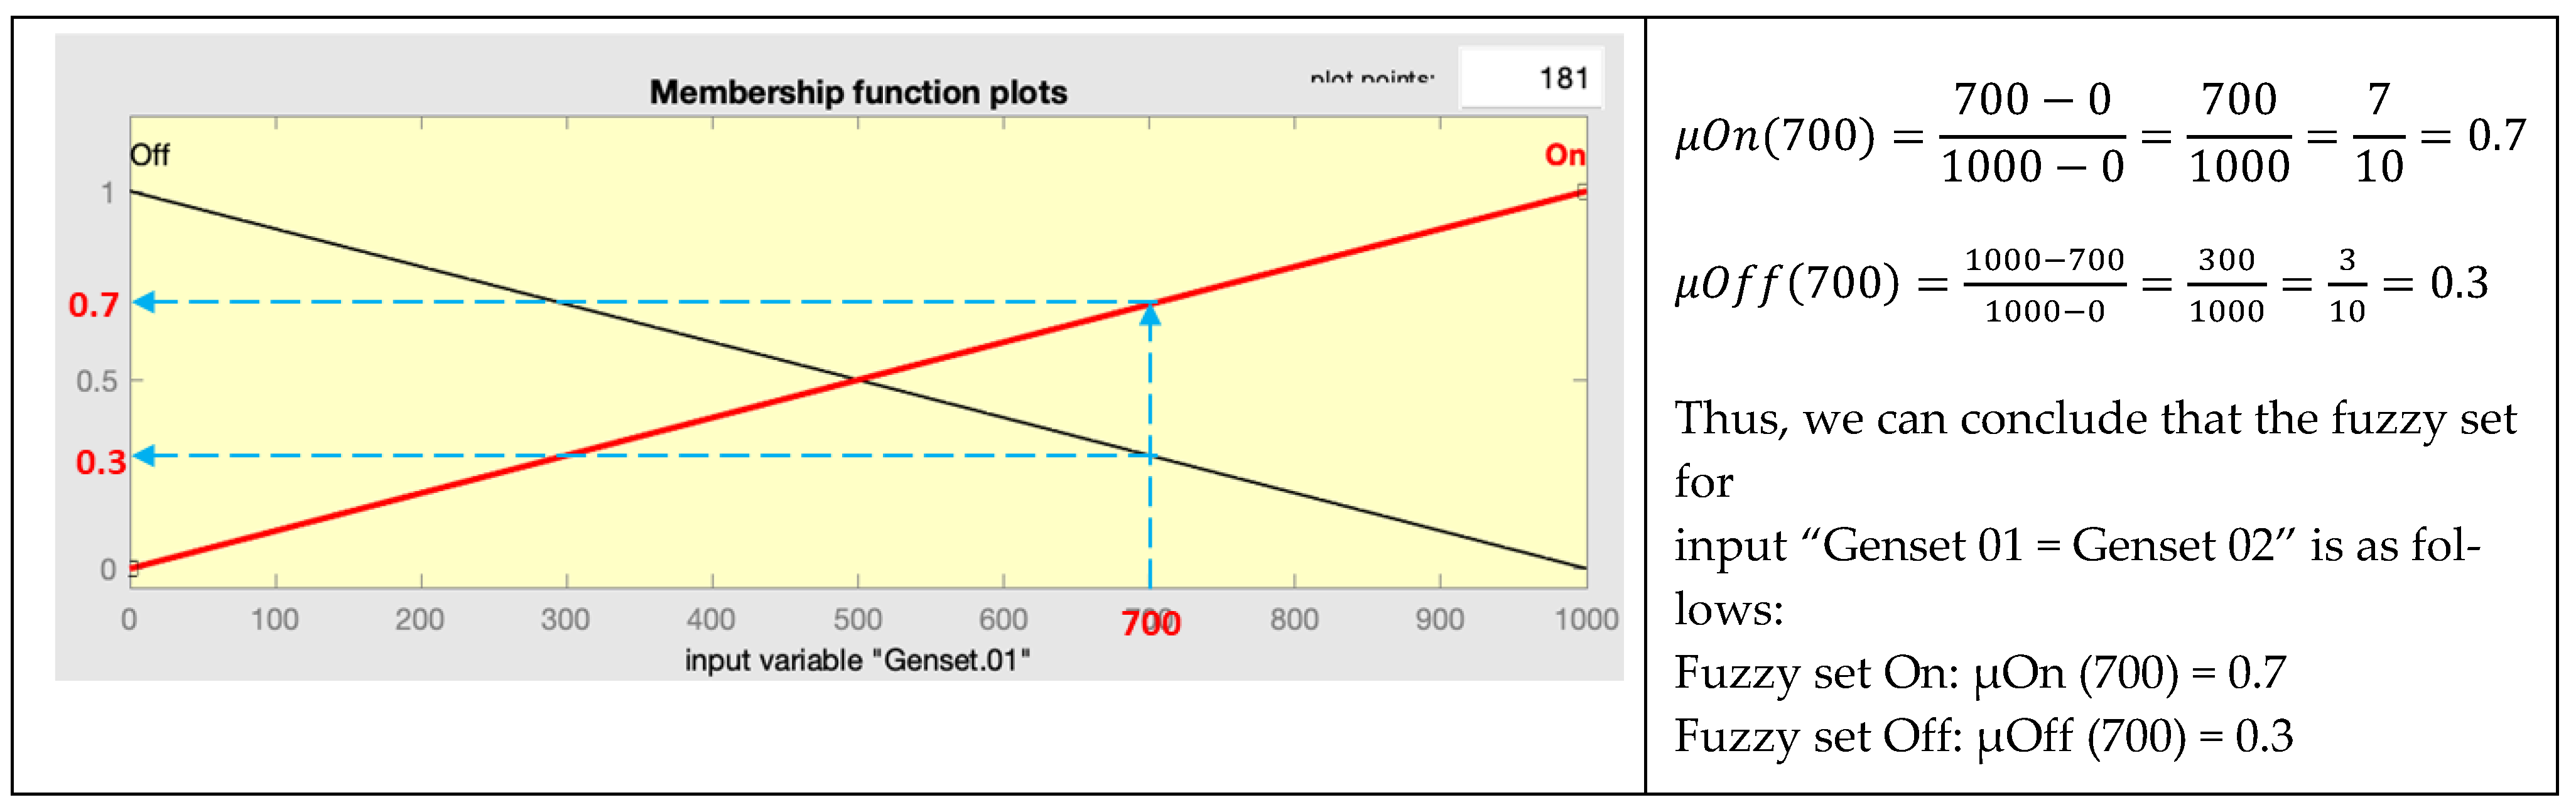
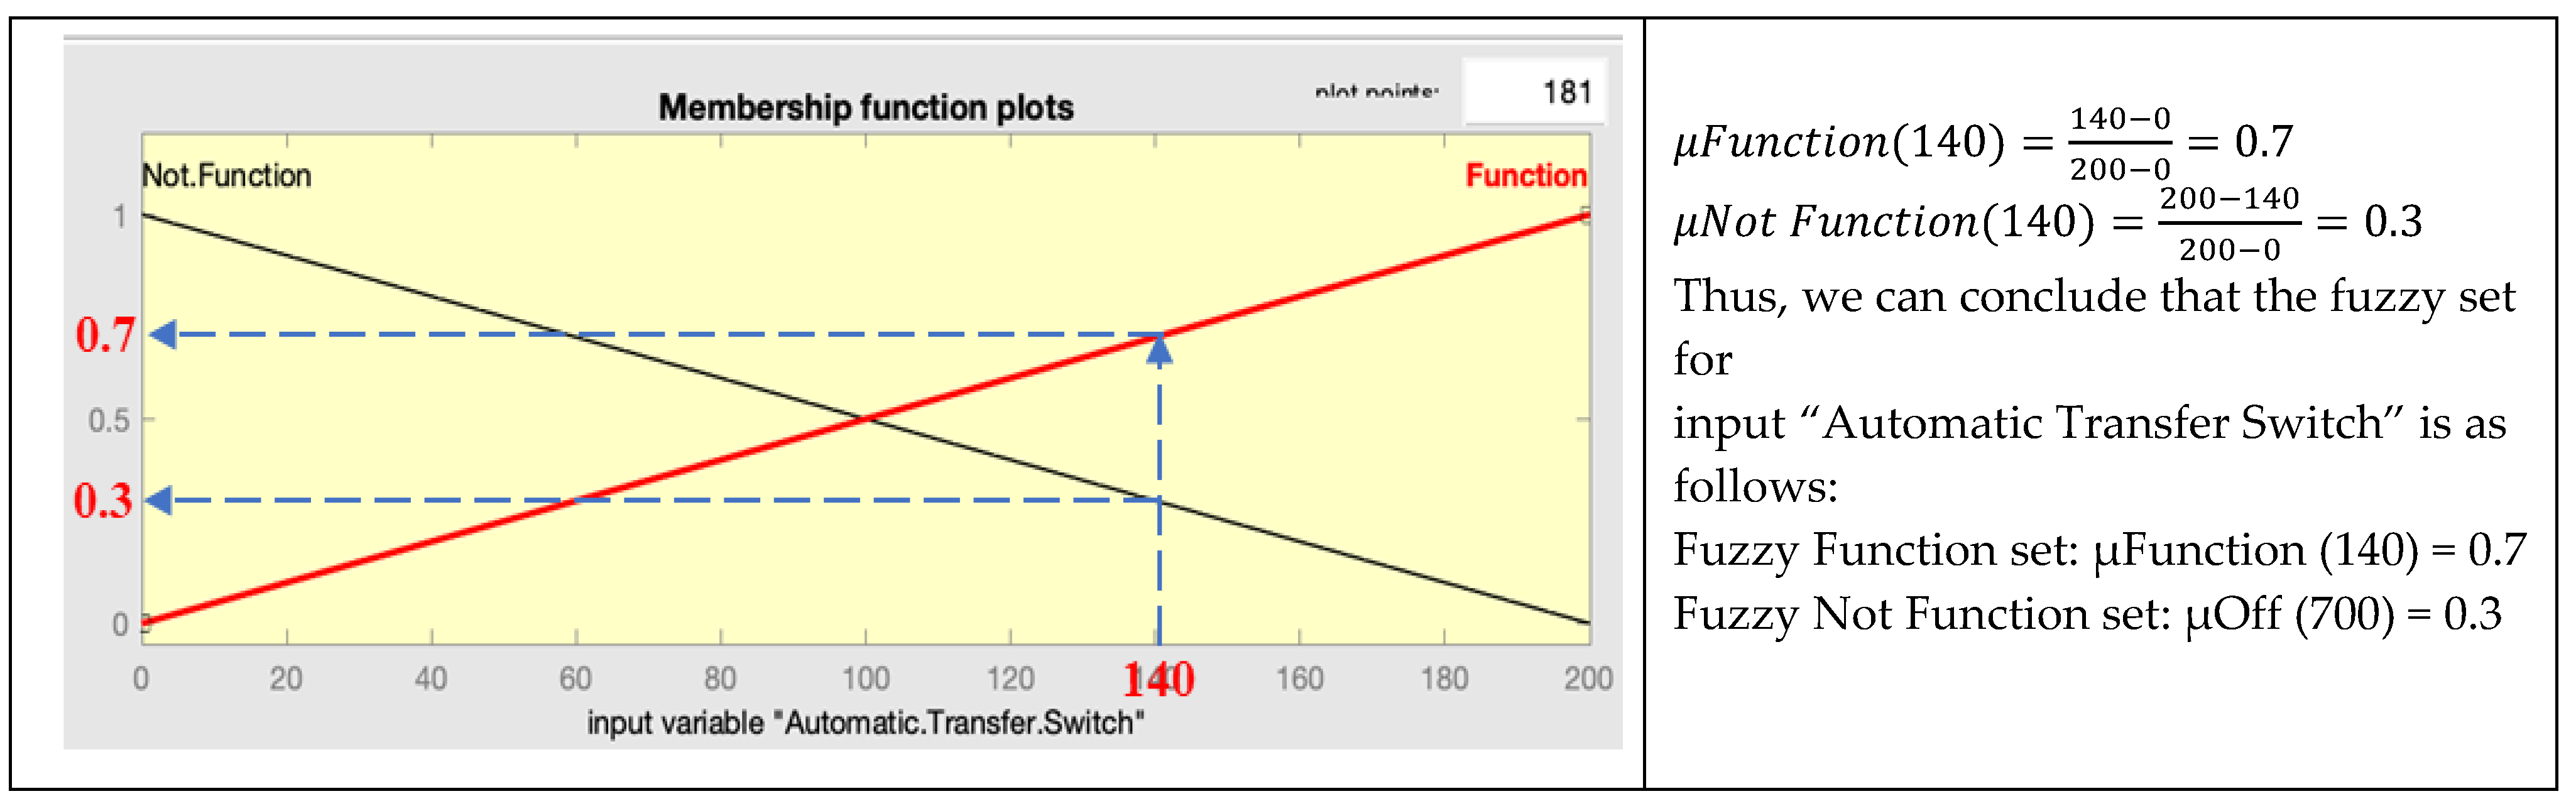
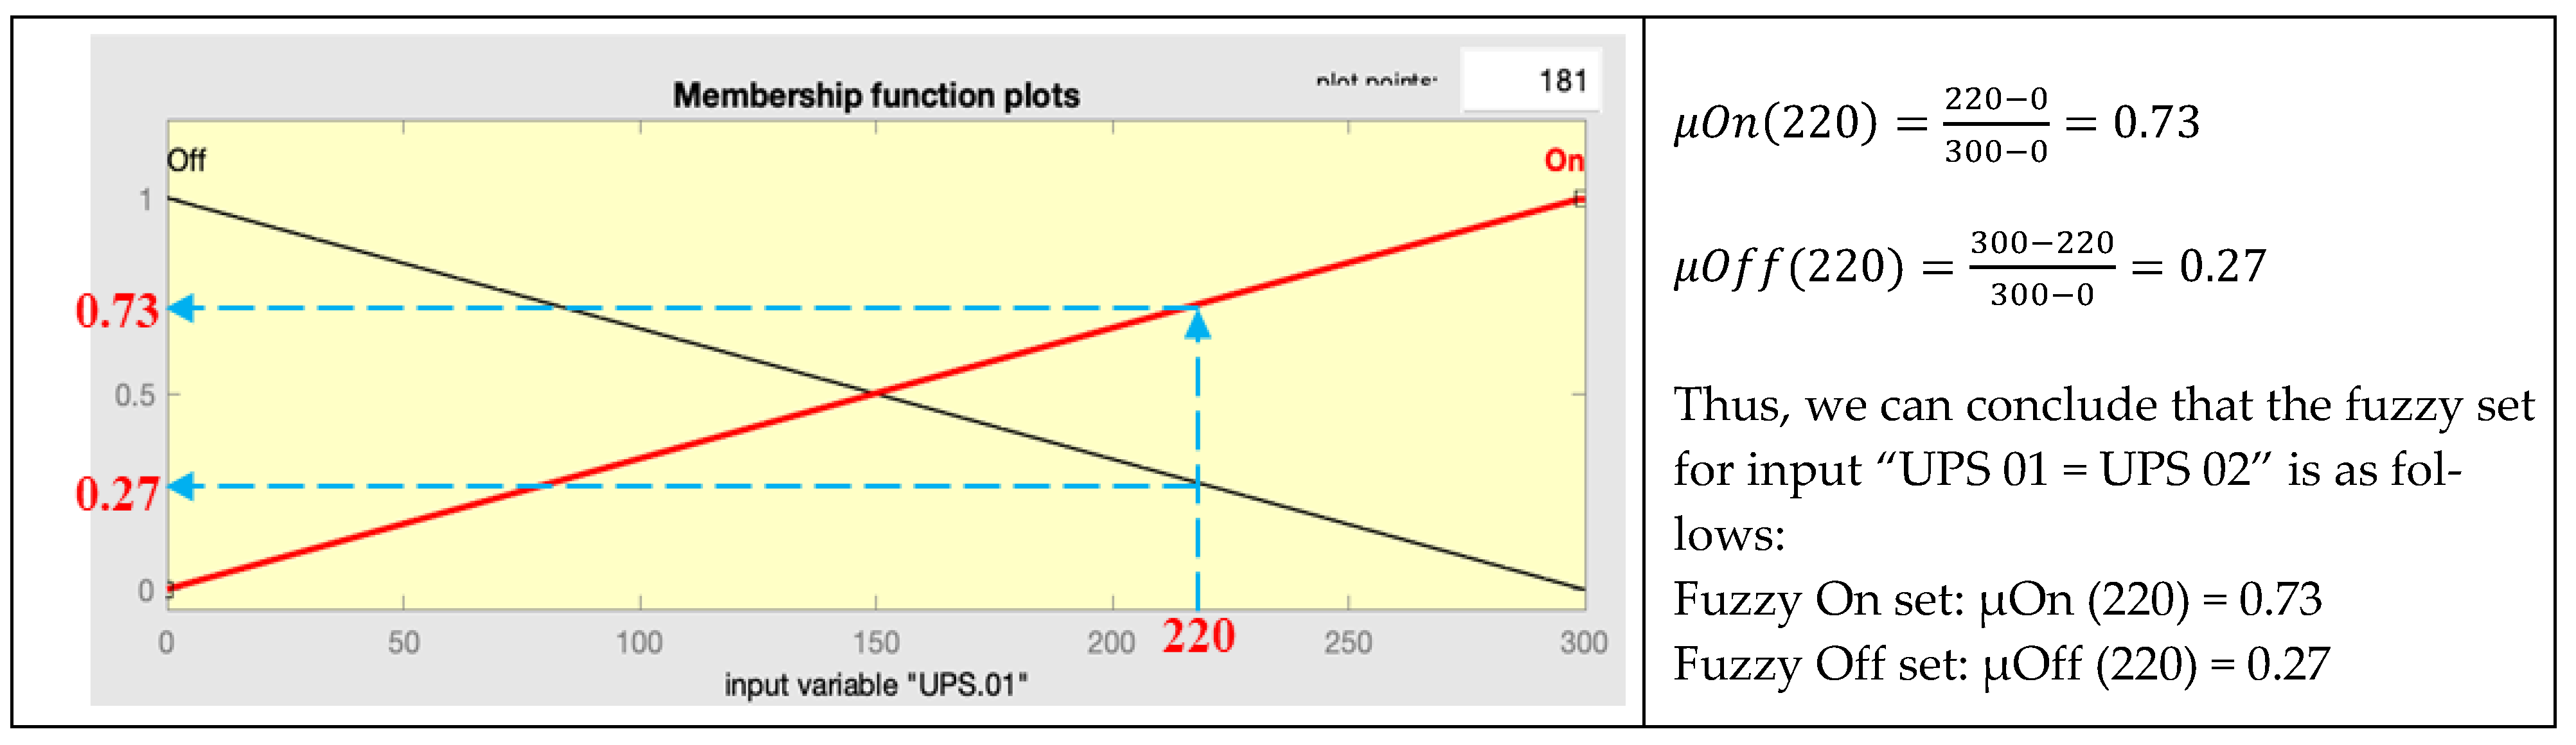
4.3. Fuzzification Data Processing

The FIS design in this study involved six important parameters for input with their respective values obtained from each item in the hospital assets, as shown in Table 1.
The process of defuzzification of the six essential items in the assets (as shown in Table 1) as input and output of fuzzy logic is shown in Figure 14.
Using Petri nets and block diagram designs to find the most critical instruments or items in an asset. And the MATLAB fuzzy inference system is used to determine how reliable and available the plan is to carry out its tasks. The various states define the system’s input and output functions with setpoints defined in the installation. It includes information and conditions, as shown in Table 2.
After analyzing the hospital electrical system, using Petri nets and block diagram drawings to find the most critical instrument in the asset [1], using the values from Table 1 and the FIS MATLAB simulation [2], we used the formula in Figure 2 to determine the membership function shown in Figure 15, Figure 16, Figure 17 and Figure 18.
The input variables are as follows: electrical main power = 420; Genset 01 and 02 = (700 × 2); automatic transfer switch = 140; and UPS 01 and UPS 02 = (220 × 2). Then, the values shown in Table 3 are achieved.
Therefore, the maximum and minimum values for each of them are:
Maximum value:   µ 1 = 0 ;   µ 2 = 0.8 ;   µ 3 = 0.7 ; µ 4 = 0.7 ; µ 5 = 0.7 ; µ 6 = 0.73 ;   µ 7 = 0.73 .
Minimum value:   µ 1 = 0 ;   µ 2 = 0.2 ;   µ 3 = 0.3 ; µ 4 = 0.3 ; µ 5 = 0.3 ; µ 6 = 0.27 ;   µ 7 = 0.27 .
The Defuzzification Mamdani method used Centroid Of Gravity (COG). In this case, it is used the minimum value of µ because the rules are “AND”:
µ 1 = 0 ;   µ 2 = 0.2 ;   µ 3 = 0.3 ; µ 4 = 0.3 ; µ 5 = 0.3 ; µ 6 = 0.27 and µ 7 = 0.27 .
Z = ( µ 2 x 1 ) + ( µ 3 x 2 ) + ( µ 4.5   x 3 ) + ( µ 6.7 x 4 ) ( µ 2 + µ 3 + µ 4.5 + µ 6.7 )
Z = ( 0.2 34.5 ) + ( 0.3 55.5 ) + ( 0.3 64.5 ) + ( 0.27 85.5 ) ( 0.2 + 0.3 + 0.3 + 0.27 ) = 61.3
Therefore, according to fuzzy calculations, the average asset reliability is around 61.3%, meaning it is no maximum.

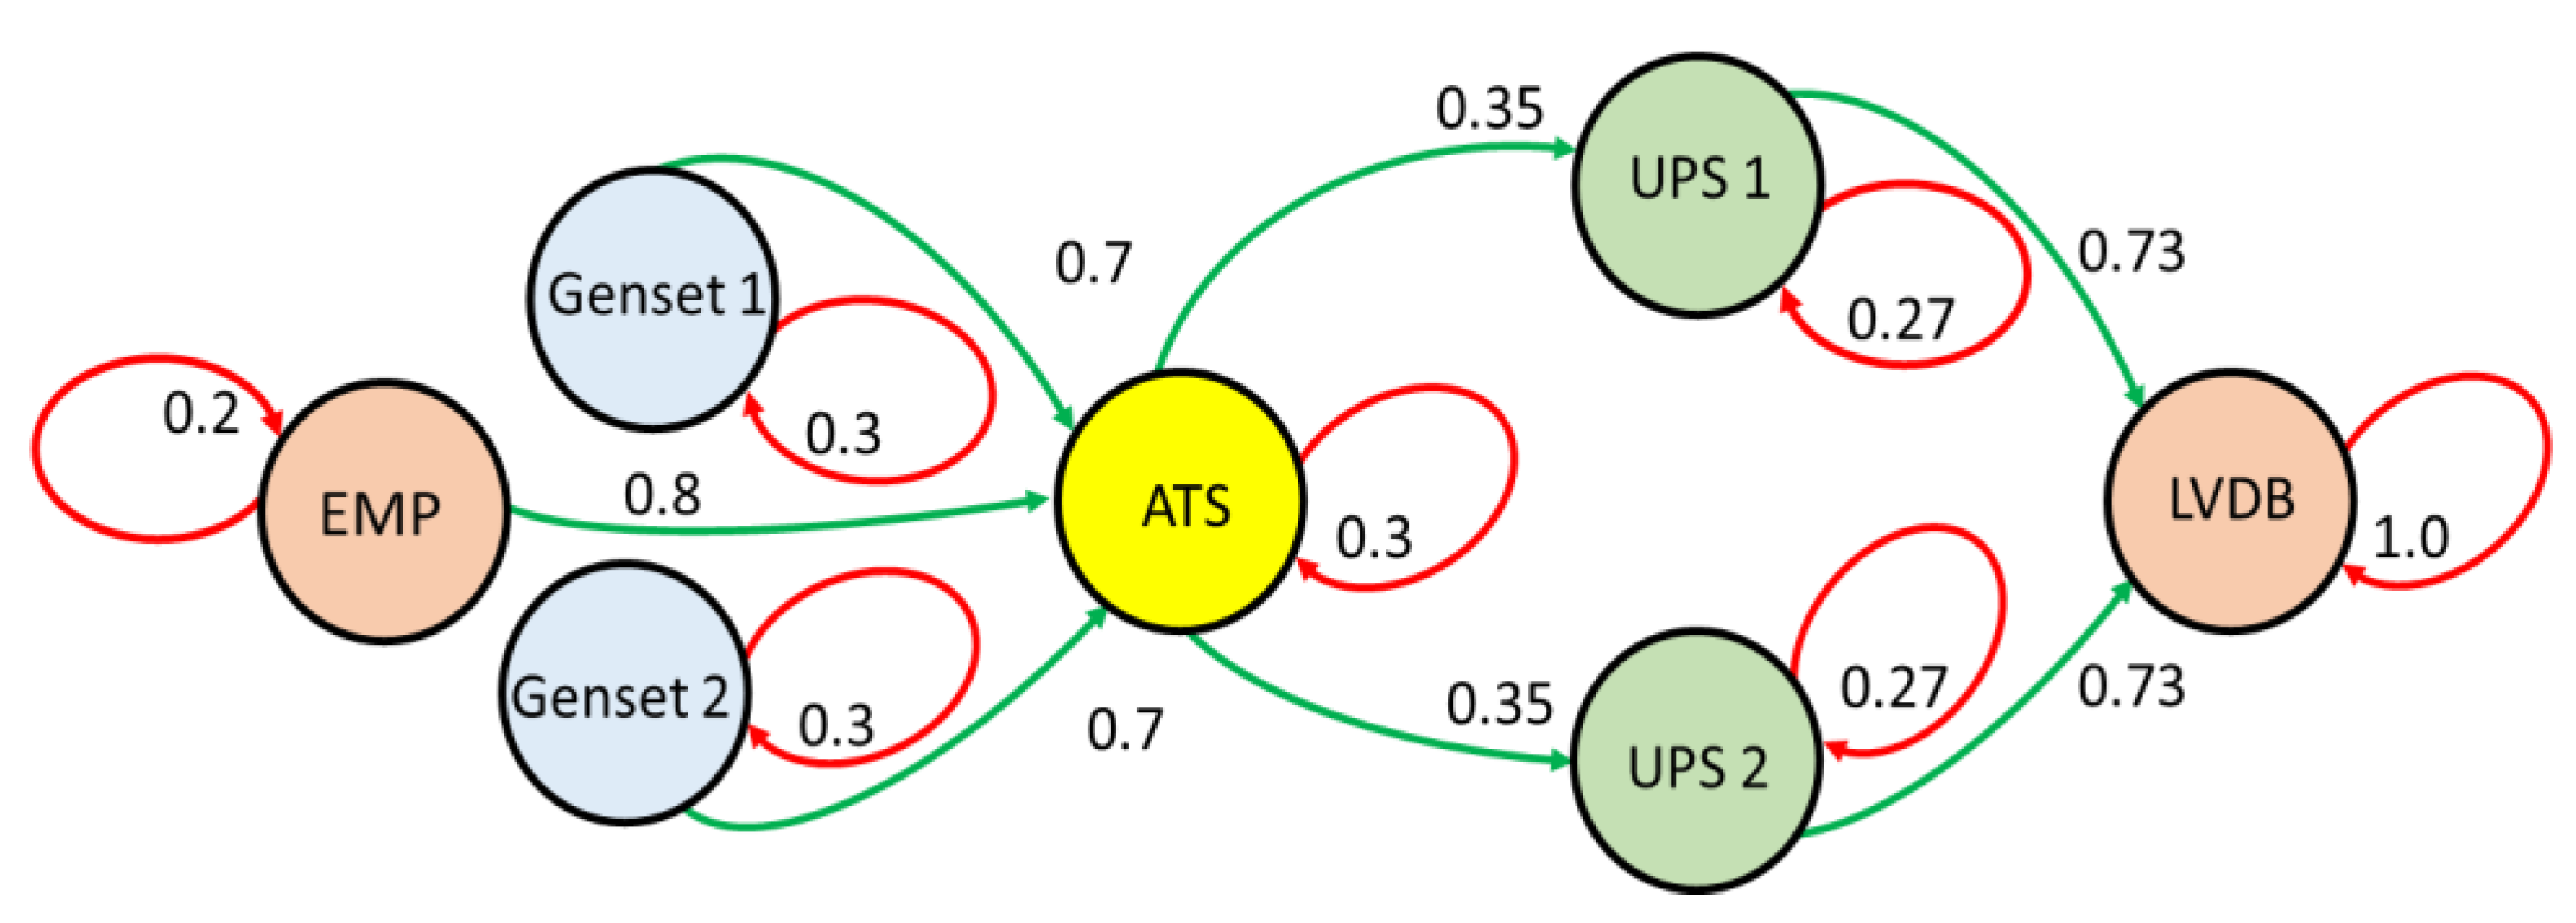
4.4. Modeling with Markov Chains and Stochastic Matrixes Processes

As mentioned, the research site does not provide historical data; therefore, we use FIS to manage incomplete and unclear data. To demonstrate the relevance of this approach, we compare it to the stochastic process. Based on Figure 15, Figure 16, Figure 17 and Figure 18, with the results of the defuzzification of each module of equipment of the hospital electrical power circuit, we use a Markov chain, whose simulation is shown in Figure 19; we assume the minimum defuzzification value is the return value at the source, and the maximum value is the transfer value to the next source in the circuit.
After simulating the data in the defuzzification results of a Markov chain, we transfer the data into a table matrix (Table 4) to analyze the data according to the stochastic rules.
Using the information in Table 4, we can change the shape to a stochastic matrix, where the parameter “from ==> to” corresponds to the approach in matrix A:
A = [   0.2   0.8 0 0 0 0 0 0   0.3 0 0   0.35   0.35 0   0   0.7   0.3   0   0   0   0   0   0.7   0   0.3   0   0   0 0 0 0 0   0.27 0   0.73   0 0 0 0 0   0.27   0.73   0 0 0   0   0   0   1 ]
Knowing that the state probabilities stabilize after several periods, at specific values, being called Markov Chain Limit State (or Steady State) Probabilities, then, after the stochastic matrix is designed, we must determine the variables in the stochastic process; these are generally replaced by the symbols π1, π2, π3, and πn in the formula as follows: π A = π. Based on the transition matrix formula, we can arrange the multiplication matrix equation as follows:
[ π 1   π 2   π 3   π 4   π 5   π 6   π 7 ] [   0.2   0.8 0 0 0 0 0 0 0.3 0 0 0.35 0.35 0 0 0.7 0.3 0 0 0 0 0 0.7 0 0.3 0 0 0 0 0 0 0 0.27 0 0.73 0 0 0 0 0 0.27 0.73 0 0 0 0 0 0 1 ] = [ π 1   π 2   π 3   π 4   π 5   π 6   π 7 ]
Then, using the substitution and the elimination methods, we can change the form of the matrix into the following equations according to the applicable rules of the algebra.
Energies 15 01024 i004
Next, we rearrange them into separate sequences according to the laws of matrix algebra; we call these matrices A, B, and π, as shown below:
Energies 15 01024 i005
To find the values of the π variables, we must find the value of the inverse matrix A, using the following algebraic formula: A   π = B     A 1   A   π =   A 1 B     π   =   A 1 B . Based on the formulas, we compute the inverse value of matrix A with Microsoft Excel or MATLAB software. Then, the result is multiplied by the value of matrix B, giving the following values of the π variables:
Energies 15 01024 i006
From the calculation, the results are shown in Table 5.
The length calculation results show that the value of all π variables that have been added together is equal to 1 or, in other words, the importance of one (1); this is the uniqueness of the stochastic approach. Therefore, we conclude that each variable involved in the stochastic process contributes 14.3% to the system’s function.

4.5. Stochastic versus Fuzzy Processes

Researchers’ goal is to select adequate tools to analyze clear and accurate data. Unfortunately, data are often unclear and inaccurate, or worse, data in the field are not available. If this is the case, we can look for statistics that match the circumstances we face as described in [1,2]. We can use Petri nets to determine the most sensitive and critical instruments or items in an asset. Still, we can use a fuzzy inference system to analyze asset reliability. However, when the data are inaccurate and unclear, we can also use Petri net’s stochastic time. This section examines these two approaches and analyzes their usefulness in our situation. The similarities and differences between stochastic and fuzzy processes are shown in Table 6.
The table shows several differences; however, previous studies suggest integrated stochastic and fuzzy approaches produce the most reliable and valuable research results. As some problems have to be solved by the fuzzy system and others have to be solved by the stochastic approach, we can conclude that they are complementary. The stochastic process detects every tool/item that performs its function sequentially. In this case, each tool contributes 14.3% when seven tools are involved; then, 7 × 0.143 = 1; this is what the stochastic Markov chain requires.

5. Discussion

The research about hospital power electrical energy systems used several tools: Petri nets, fuzzy inference systems, and stochastic approaches based on Markov chains.
We can define the different steps in the analysis to achieve the reliability objectives that can be included in a RAMS analysis as follows: (1) to determine Standard Operating Procedure (SOP) for the asset (e.g., the most critical items for planned maintenance; (2) to identify the electrical and mechanical modules that need to be isolated when an intervention is required, with the objective to not cause danger or hazards; (3) to create a hierarchical list of assets to identify the modules of the system to intervene quickly; (4) to provide the asset process flow chart; (5) to perform Petri net modeling, and MATLAB simulation; (6) to establish a more reliable function of the system and to avoid operational failure.
As a supporting document, we need to: (1) identify the system’s weakest points; (2) redesign the asset system to eliminate system weaknesses; (3) simulate the practical solution to improve asset system reliability; (4) take the best decision for the desired system reliability.
Based on the preceding analysis, we can conclude that strict strategic management is required to ensure the reliability of the hospital electric power supply system. The decision to implement the new design for the system has obvious advantages compared to the one installed.

6. Conclusions

This paper demonstrates the advantages of using a powerful and relevant tool such as a Petri net to model and analyze a complex hospital electrical system. With Petri nets simulation, step by step, the most sensitive and critical hospital component was identified: in the case study was the Automated Transfer System. As no historical maintenance is available, the authors used the Fuzzy Inference System (FIS) and Petri net stochastic timing to analyze the system with excellent results. Based on FIS results, the case study examined shows that the average asset function only reaches 60% reliability and availability because the asset function effectiveness is only between 45% and 75%. Additionally, using Stochastic Markov analysis, connected with the preceding approach, it was demonstrated that each variable involved in the stochastic process contributes 14.3% to the system’s function. Based on the primary, we show that the conjunction of the preceding approaches permits us to know, in detail, the functioning of the system and the contribution of each mode to the global reliability of the system.

Author Contributions

Conceptualization, C.A.P. and J.T.F.; methodology, C.A.P.; software, C.A.P.; validation, critical analysis about the methodology and results; J.T.F., H.R. and D.G.; formal analysis, C.A.P.; investigation, C.A.P.; resources, C.A.P.; data curation, J.T.F.; writing—preparation of the original draft, C.A.P.; writing—reviews and editing, J.T.F.; visualization, C.A.P.; supervision, J.T.F.; fund acquisition, J.T.F. All authors have read and approved the published version of the manuscript.

Funding

This research is sponsored by FEDER funds through the program COMPETE—Programa Operacional Factores de Competitividade—and by national funds through FCT—Fundação para a Ciência e a Tecnologia—under the project UIDB/00285/2020.

Institutional Review Board Statement

Not applicable.

Informed Consent Statement

Not applicable.

Data Availability Statement

Data is contained within the article.

Conflicts of Interest

The authors declare no conflict of interest.

References

  1. Pinto, C.A.; Farinha, J.T.; Singh, S. Contributions of Petri Nets to the Reliability and Availability of an Electrical Power supply system in a Big European Hospital—A Case Study. WSEAS Trans. Syst. Control. 2021, 16, 21–42. [Google Scholar] [CrossRef]
  2. Pinto, C.A.; Farinha, J.T.; Singh, S.; Raposo, H. Increasing the reliability of an Electrical Power supply system in a Big European Hospital through the Petri Nets and Fuzzy Inference System Mamdani Modeling. Appl. Sci. 2021, 11, 2604. [Google Scholar] [CrossRef]
  3. American Hospital Association (AHA). Hospital Engineering Handbook; American Hospital Association: Chicago, IL, USA, 1980; ISBN 0-939450-74-7. [Google Scholar]
  4. Ni, J.; Gu, X.; Jin, X. Preventive maintenance opportunities for large production systems. CIRP Ann. 2015, 64, 447–450. [Google Scholar] [CrossRef]
  5. Hennequin, S.; Ramirez Restrepo, L.M. Fuzzy model of joint maintenance and production control under sustainability constraints. IFAC-PapersOnLine 2016, 49, 1216–1221. [Google Scholar] [CrossRef]
  6. Macchi, M.; Roda, I.; Fumagalli, L. On the focal concepts of maintenance in the Digital era. IFAC-PapersOnLine 2020, 53, 84–89. [Google Scholar] [CrossRef]
  7. Sheu, S.-H.; Chang, C.-C.; Chen, Y.-L.; Zhang, Z.G. Optimal preventive maintenance and repair policies for multi-state systems. Reliab. Eng. Syst. Saf. 2015, 140, 78–87. [Google Scholar] [CrossRef]
  8. Lagrange, A.; de Simón-Martín, M.; González-Martínez, A.; Bracco, S.; Rosales-Asensio, E. Sustainable microgrids with energy storage to increase power resilience in critical facilities: An application to a hospital. Int. J. Electr. Power Energy Syst. 2020, 119, 105865. [Google Scholar] [CrossRef]
  9. Balali, A.; Valipour, A. Prioritization of passive measures for energy optimisation designing sustainable hospitals and health centers. J. Build. Eng. 2021, 35, 101992. [Google Scholar] [CrossRef]
  10. Yousefli, Z.; Nasiri, F.; Moselhi, O. Maintenance workflow management in hospitals: An automated multi-agent facility management system. J. Build. Eng. 2020, 32, 101431. [Google Scholar] [CrossRef]
  11. Christiansen, N.; Kaltschmitt, M.; Dzukowski, F.; Isensee, F. Electricity consumption of medical plug loads in hospital laboratories: Identification, evaluation, prediction, and verification. Energy Build. 2015, 107, 392–406. [Google Scholar] [CrossRef]
  12. Calixto, E. Reliability, Availability, and Maintainability (RAM Analysis). In Gas and Oil Reliability Engineering; Elsevier: Amsterdam, The Netherlands, 2016; pp. 269–470. [Google Scholar] [CrossRef]
  13. Sutton, I. Reliability, Availability, and Maintainability. In Process Risk and Reliability Management; Elsevier: Amsterdam, The Netherlands, 2015; pp. 667–688. [Google Scholar] [CrossRef]
  14. Sharma, R.K.; Sharma, P. An integrated framework to optimise RAM and cost decisions in a process plant. J. Loss Prev. Process Ind. 2012, 25, 883–904. [Google Scholar] [CrossRef]
  15. Pirbhulal, S.; Gkioulos, V.; Katsikas, S. A Systematic Literature Review on RAMS analysis for critical infrastructures protection. Int. J. Crit. Infrastruct. Prot. 2021, 33, 100427. [Google Scholar] [CrossRef]
  16. Wang, J. Timed Petri Nets: Theory and Application; Springer: Boston, MA, USA, 1998; ISBN 978-1-4615-5537-7. [Google Scholar]
  17. Grunt, O.; Briš, R. SPN as a tool for risk modeling of fires in process industries. J. Loss Prev. Process Ind. 2015, 34, 72–81. [Google Scholar] [CrossRef]
  18. Aloini, D.; Dulmin, R.; Mininno, V. Modeling and assessing ERP project risks: A Petri Net approach. Eur. J. Oper. Res. 2012, 220, 484–495. [Google Scholar] [CrossRef]
  19. Li, W.; He, M.; Sun, Y.; Cao, Q. A novel layered fuzzy Petri nets modelling and reasoning method for process equipment failure risk assessment. J. Loss Prev. Process Ind. 2019, 62, 103953. [Google Scholar] [CrossRef]
  20. Li, Z.; Wang, S.; Zhao, T.; Liu, B. A hazard analysis via an improved timed coloured Petri net with time-space coupling safety constraint. Chin. J. Aeronaut. 2016, 29, 1027–1041. [Google Scholar] [CrossRef] [Green Version]
  21. Liu, X.; Zhang, J.; Zhu, P. Modeling cyber-physical attacks based on probabilistic coloured Petri nets and mixed-strategy game theory. Int. J. Crit. Infrastruct. Prot. 2017, 16, 13–25. [Google Scholar] [CrossRef]
  22. Kiran, T.R.; Rajput, S.P.S. An effectiveness model for an indirect evaporative cooling (IEC) system: Comparison of artificial neural networks (ANN), adaptive neuro-fuzzy inference system (ANFIS) and fuzzy inference system (FIS) approach. Appl. Soft Comput. 2011, 11, 3525–3533. [Google Scholar] [CrossRef]
  23. Yel, E.; Yalpir, S. Prediction of primary treatment effluent parameters by Fuzzy Inference System (FIS) approach. Procedia Comput. Sci. 2011, 3, 659–665. [Google Scholar] [CrossRef] [Green Version]
  24. Ain, Q.; Iqbal, S.; Khan, S.; Malik, A.; Ahmad, I.; Javaid, N. IoT Operating System Based Fuzzy Inference System for Home Energy Management System in Smart Buildings. Sensors 2018, 18, 2802. [Google Scholar] [CrossRef] [PubMed]
  25. Akgun, A.; Sezer, E.; Nefeslioglu, H.; Gokceoglu, C.; Pradhan, B. An easy-to-use MATLAB program (MamLand) for the assessment of landslide susceptibility using a Mamdani fuzzy algorithm. Comput. Geosci. 2012, 38, 23–34. [Google Scholar] [CrossRef]
  26. Bizimana, H.; Altunkaynak, A. Modeling the initiation of sediment motion under a wide range of flow conditions using a Geno-Mamdani Fuzzy Inference System method. Int. J. Sediment Res. 2020, 35, 467–483. [Google Scholar] [CrossRef]
  27. Khosravanian, R.; Sabah, M.; Wood, D.A.; Shahryari, A. Weight on drill bit prediction models: Sugeno-type and Mamdani-type fuzzy inference systems compared. J. Nat. Gas Sci. Eng. 2016, 36, 280–297. [Google Scholar] [CrossRef]
  28. Gonbadi, A.M.; Katebi, Y.; Doniavi, A. A generic two-stage fuzzy inference system for dynamic prioritization of customers. Expert Syst. Appl. 2019, 131, 240–253. [Google Scholar] [CrossRef]
  29. Jain, N.; Singh, A.R. Sustainable supplier selection under must-be criteria through a Fuzzy inference system. J. Clean. Prod. 2020, 248, 119275. [Google Scholar] [CrossRef]
  30. Jiang, X.; Mahadevan, S.; Yuan, Y. A fuzzy stochastic neural network model for structural system identification. Mech. Syst. Signal Process. 2017, 82, 394–411. [Google Scholar] [CrossRef]
  31. Sharifi, M.; Hosseini-Motlagh, S.-M.; Samani, M.R.G.; Kalhor, T. Novel resilient-sustainable strategies for second-generation biofuel network design considering Neem and Eruca Sativa under hybrid stochastic fuzzy robust approach. Comput. Chem. Eng. 2020, 143, 107073. [Google Scholar] [CrossRef]
  32. Mahdi, I.; Chalah, S.; Nadji, B. Reliability study of a system dedicated to renewable energies using stochastic Petri nets: Application to photovoltaic (PV) system. Energy Procedia 2017, 136, 513–520. [Google Scholar] [CrossRef]
  33. Volovoi, V.; Peterson, D.K. Coupling reliability and logistical considerations for complex system of systems using Stochastic Petri Nets. In Proceedings of the 2011 Winter Simulation Conference (WSC), Phoenix, AZ, USA, 11–14 December 2011. [Google Scholar] [CrossRef]
  34. Dhople, S.V.; DeVille, L.; Domínguez-García, A.D. A Stochastic Hybrid Systems framework for analysis of Markov reward models. Reliab. Eng. Syst. Saf. 2014, 123, 158–170. [Google Scholar] [CrossRef] [Green Version]
  35. Wang, Y.-F.; Cheng, S.; Hsu, M.-H. Incorporating the Markov chain concept into a fuzzy stochastic prediction of stock indexes. Appl. Soft Comput. 2010, 10, 613–617. [Google Scholar] [CrossRef]
  36. Jensen, K.; Kristensen, L. Coloured Petri Nets: Modeling and Validation of Concurrent Systems; Springer Nature: Basingstoke, UK, 2009. [Google Scholar]
Figure 1. Example of Petri Net using CPNTools Software System.
Energies 15 01024 g001
Figure 2. Shapes and formulas for membership functions and the centroid method for defuzzification.
Energies 15 01024 g002aEnergies 15 01024 g002b
Figure 3. (a) STPN Model and (b) Reachability Graph.
Energies 15 01024 g003
Figure 4. Definition of Petri Nets with CPNTools Software.
Energies 15 01024 g004
Figure 5. Step by Step Research Methodology in Block Diagrams.
Energies 15 01024 g005
Figure 6. Facilities and Equipment Services Asset Hierarchy Block Diagram (AHBD) [1].
Energies 15 01024 g006
Figure 7. Facilities and Equipment Services Asset Process Flow Diagram (APFD) [1,2].
Energies 15 01024 g007
Figure 8. Facilities and Equipment Services Asset Functional Block Diagram (AFBD) [1].
Energies 15 01024 g008
Figure 9. Using CPNTools software for modeling and simulating stochastic time Petri nets on an electric power supply system.
Energies 15 01024 g009
Figure 10. When the 300 kVA 1, 2, and 3 UPS are running out of energy, the ATS will activate the 1, 2, and 3 1000 kVA generators to ensure safety and energy continuity in the system.
Energies 15 01024 g010
Figure 11. This stochastic time Petri net series shows all tokens from EBM, UPS 1, 2, and 3, and Genset 1, 2, and 3 when transferring their tokens to the users, and the regular operation returns.
Energies 15 01024 g011
Figure 12. Modules with a Slight Increase in Reliability, via 1 ATS, 2 UPS, and 2 Gensets.
Energies 15 01024 g012
Figure 13. Design for improved reliability due to redundancy, with two ATS, two UPS, and two generators.
Energies 15 01024 g013
Figure 14. Fuzzy logic design variable inputs and output [2].
Energies 15 01024 g014
Figure 15. Electrical Main Power (EMP).
Energies 15 01024 g015
Figure 16. Genset 1 and 2.
Energies 15 01024 g016
Figure 17. Automatic Transfer Switch (ATS).
Energies 15 01024 g017
Figure 18. Uninterrupted Power Supply (UPS) 1 and 2.
Energies 15 01024 g018
Figure 19. Simulation of Markov chain.
Energies 15 01024 g019
Table 1. The six essential parameters for input.
No.Name of ItemsValuesUnits
1Electrical Main Power380MVA
2Gensets 011000KVA
3Gensets 021000KVA
4Automatic Transfer Switch (ATS)Connect to Electrical Main Power or GensetsNot Applicable
5UPS 01300KVA
6UPS 02300KVA
Table 2. The value membership function input.
Main Power420
Genset 1 and 27002 Genset
ATS140
UPS 1 and 22202 UPS
Table 3. The calculated value of the input membership function.
Fuzzy Low setµLow (420)0
Fuzzy Normal setµNormal (420)0.8
Fuzzy High setµHigh (420)0.2
Fuzzy set OnµOn (700)0.7
Fuzzy set OffµOff (700)0.3 × 2Two Genset
Fuzzy Function setµFunction (140)0.7
Fuzzy Not Function setµOff (700)0.3
Fuzzy set OnµOn (220)0.73
Fuzzy set OffµOff (220)0.27 × 2 Two UPS
Table 4. Stochastic Matrix from Figure 19.
From Energies 15 01024 i001
EMBATSGenset 1Genset 2UPS 1UPS 2LVDBTo
EM0.2000000 Energies 15 01024 i002
AST0.80.30.70000
Genset 1000.30000
Genset 20000.3000
UPS 100.35000.2700
UPS 200.350000.270
LVDB00000.730.731
Table 5. Result of Calculations.
0.14286=π1=EMP
0.14286=π2=ATS
0.14286=π3=Genset 1
0.14286=π4=Genset 2
0.14286=π5=UPS 1
0.14286=π6=UPS 2
0.14286=π7=LVDB
∑ = 1
Table 6. Stochastic versus Fuzzy.
Problems Faced by ResearchersStochastic vs. Fuzzy
Unclear and inaccurate dataYESYES
Data not available in the fieldNOYES
Data that can be added according to human experienceNOYES
Rules are made based on human logic on dataNOYES
Discrete state and continuous stateYESYES
Discrete-time and continuous-timeYESYES
Multidimensional problemsYESYES
Complicated dataYESYES
Publisher’s Note: MDPI stays neutral with regard to jurisdictional claims in published maps and institutional affiliations.

