Article

An Empirical Analysis of Renewable Energy Contributions Considering Green Consumer Values—A Case Study of Poland

by
Paweł Bartoszczuk
1,*,
Uma Shankar Singh
2 and
Małgorzata Rutkowska
3
1
SGH Warsaw School of Economics, Collegium of Business Administration, 02-554 Warsaw, Poland
2
Institute of Management, University of Szczecin, 71-004 Szczecin, Poland
3
Faculty of Management, Wroclaw University of Science and Technology, 50-370 Wroclaw, Poland
*
Author to whom correspondence should be addressed.
Energies 2022, 15(3), 1027; https://doi.org/10.3390/en15031027
Submission received: 4 January 2022 / Revised: 24 January 2022 / Accepted: 25 January 2022 / Published: 29 January 2022
(This article belongs to the Special Issue Energy Decision Making: Problems, Methods, and Tools)

Abstract

:
This article examines the acceptance of renewable energy in the adoption of the climate package, taking into account the GREEN consumer values among consumers in Poland. The research problem addressed in this paper relates to the measurement of consumer values in terms of the GREEN concept; specifically, consumer acceptance of the available offerings provided by real businesses. In addition, consumer needs are important in terms of ensuring the acceptance of renewable energy, which will create opportunities for its production in the context of the Fit 55 climate package. The study formulates some research questions and hypotheses to justify the concept with empirical data by applying statistical tests. The study is presented in several sections with a detailed presentation of secondary and primary data. The main outcome of the research is based on the primary data using a structured survey questionnaire administered in Poland and 557 collected samples. Nowadays, the responsibility also lies with consumers, as green consumption will entail green production. The research concludes that Poland’s consumers have a good level of acceptance of RES, based on the current green energy situation of Poland, which may lead to sustainability and will benefit policy makers in government, corporations and end consumers.

1. Introduction

Poland has a specific historical dependence on coal energy. Therefore, transformation toward renewable energy is very difficult and costly. According to the European Commission’s calculations, energy transformation in Poland will cost as much as EUR 240 billion [1]. The government of Poland is working to ensure that the investment of the Just Transition Fund (JTF) is specifically in the area of transformational developments. As per the study conducted in Poland on the main sources of electricity in the future, fossil fuel dependency, mainly on coal and gas, will continue until 2040 [1]. However, proportional changes in fossil fuel use will be visible, with the concentration of fossil fuel emission sources tensing towards zero between the present and 2040, including the implementation of all common renewable energy sources [1]. Data analyzed by NASA indicated that the increasing concentration levels of carbon components, mostly carbon dioxide, need to be addressed. The level has increased for 13 years, from 2006 to 2019. The current CO2 concentration of about 411 ppm has generated an increase of 1.1 °C in the global Earth temperature compared to the pre-industrial era (late 19th century).
Countries have decided to decrease emissions of carbon. In this adaptation process, Germany is implementing a plan to decrease carbon emissions by a minimum of 80% of the current level by 2050, and has developed an implementation map for the execution of this process [2]. Energy-sourced carbon dioxide (CO2) emissions make up the largest share of GHG emissions and account for about 85% of the total GHG emissions in Germany today [1]. The European Union has demonstrated consistent execution in terms of the protection of the climate and the environment. Policies related to energy sector development that prioritize the achievement of targets established by the European Commission are the key tool for promoting the green energy. The targets formulated in the “European Green Deal” documents go beyond those of the Paris Agreement. The European Union aim to be a climate-neutral by 2050. These goals are appropriate from an environmental standpoint and must have coordinated support across the political spectrum as well as larger alignment with goals related to the development of economic infrastructure taking into account the social conditions of member countries. An economic slowdown of the European economy has occurred due to the COVID-19 crisis, and challenges of economic stagnation are still ongoing and are visible in community life.
Currently, questions related to the current scenario arise. One such question relates to the importance and degree of prioritization that member states assign to climate, and another is the implementation of transition in the energy sector. The implementation of the energy transition will require unconditional effort in terms of convincing the societies and countries involved about the policy formulation and implementation [3]. The changes in the Polish energy sector to date show the motivation of the government, although the energy sector also experienced the pandemic. It has emphasized the growing economic and political problems related to the enormous costs of domestic energy production from coal and lignite, and accelerated the decreasing in the use of these raw materials. The government department responsible for the energy sector had a discussion with trade unions in 2020 and decided on the transition away from coal for energy production in Poland [3]. An independent scientific advisory board was established under European climate law, and a “carbon budget” was implemented to control the process of determining the emissions reduction target for 2040. The “fit for 55” package also contains recommendations for reforming the EU’s whole 2030 climate and energy policy, including laws on energy efficiency, land use and forestry, renewable energy, new car emissions, and the Energy Taxation Directive. The carbon trading system’s procedure should be enhanced according to this proposal.
The European Green Deal financing will be reinforced by a green finance strategy and will receive massive public resources to be spent on research and innovation, according to von der Leyen’s ideas. It is worth noting that the European Green Deal is partially supported by the EU budget and the Next Generation EU Facility, with climate goals accounting for 30% of the expenditure. The WHO recently announced new air quality recommendations (the previous one was announced in 2005) on which governments can base their decisions. Significantly, ultrafine particles have now been included in the records for the first time. Unfortunately, the conclusions of these recommendations are very discouraging—almost 100% of the population lives in areas where pollution levels exceed standards. Air pollution caused by the burning of fossil fuels, oil and coal is one of the biggest threats to humans and has fatal consequences. This is why it is so important to change energy sources. In addition, current models predict that catastrophic meteorological phenomena, such as fires and hurricanes, will increase. Therefore, there is no choice for humanity but to switch to clean energy. Unfortunately, the coal lobby—not only in Poland, but also in Australia, for example—is very strong and influences government decisions [4].
The development of renewable energy and the exploration of resources are in the developmental stage, where European Union (EU) countries are participating more aggressively, making decisions regarding the implementation of strategies to achieve the goals of “The European Green Deal” [5], and committing to greater usage of renewable energy sources (RES). Sustainable energy consumption is the main goal of the state authorities in Poland. This goal favors the switching over of energy production from coal to RES [6]. Sustainable growth may be possible only with collaborative efforts towards the implementation of RES; although it is challenging, this is the only way to reduce costs to make a viable business model [7,8]. The climate policy implementation of the EU is the key motivation for Poland to revive its energy sector and make the transformation from traditional energy sources to RES [9]. The development of global economy depends widely on the energy resources. The energy must be cheap and should be green. Though awareness programs have been a widespread approach used by many organizations, questions remain about the acceptance and adaptability of the end consumer [10]. There is a necessity for energy transition worldwide, but the whole world is facing the same challenges. It is crucial to keep in mind to the protection of vulnerable households and implement policies to combat hidden energy poverty [11].
The main research problem was established based on an extensive literature review conducted to look for gaps in policy that needed to be addressed for the benefit of society and governments. Renewable energy sources are not new, and perhaps awareness regarding their consumption and accessibility is not widespread among consumers. The main problem is assessing the GREEN consumer values while considering renewable energy sources. Consumers are the final decision makers in the consumer world, so the available options must satisfy their needs and it must be assured that they are willing to consume the products or services [12,13]. In the process of assessment, the climate package deal of the EU is also being assessed to analyze the current situation of Poland in terms of the acceptance of the EU climate package commitment. The research further formulated some questions and hypotheses in order to assess this problem following a systematic process. Based on these facts, the study framed some relevant questions: What is the current status of renewable energy production in Poland? By what means is Poland showing the year-on-year growth in the production and consumption of renewable energy. What is the importance of climate package adoption for Poland? How is Poland shaping GREEN consumer values among consumers? The study is presented in Section 6 sections where the Section 1 is the Introduction, the Section 2 presents the Theoretical Background, Materials and Methods are presented as Section 3, the Section 4 contains the Results of the research, the Section 5 includes a Discussion, and the Section 6 contains the Conclusions and a discussion of the possible directions of future research.

2. Theoretical Background

The capacity renewable energy sources is not only increasing with each year, but it is doing so at a very fast pace (the increase in 2019 was nine times faster than in 2018). At the end of last year, RES installations in Poland had a total capacity of 9106 MW [14]. In this country, most renewable energy is generated by installations based on wind power and biomass. Interestingly, solar energy is only in fourth place in the ranking of the most used sources of power; photovoltaics-based sources have seen the largest increase in recent times. The amount of energy generated from solar radiation in Poland was 2,261,347 MW in 2020—a year-on-year increase of over 150% [15]. The relationship and importance of elements impacting the public acceptability of wind energy were outlined, particularly in close proximity to wind farms. Literature reviews, surveys, variance analysis, and linear regression analysis were all used in the research [16]. The following characteristics, impacting the fixing of a microgeneration structure, were discovered in the paper: age, gender, type of dwelling, ownership and size, environmental consciousness, usage of a subsidy program, and attitudes regarding costs and market-related concerns [17]. When evaluating the impact of these characteristics over time, socioeconomic and residence characteristics, as well as environmental behavior, appeared to have a fixed effect on the installation of residential microgeneration systems, with market acceptance fluctuations being primarily related to market conditions.

2.1. Renewable Energy

Nowadays, civilization is shifting towards a more circular economy, including the use of renewable energy sources. On the one hand, fossil fuels are being depleted, and hence, it is necessary to look deeper and further away to obtain them, and this process can cause accidents [18] such as oil leaks from tankers into oceans [19]. Climate warming, which is largely caused by the depletion of non-renewable energy sources, is causing water levels to rise. Higher temperatures and a warmer climate can cause infectious diseases, such as malaria, to spread more rapidly [20]. A fact confirming the ongoing green transformation is that coal’s share of electricity generation has dropped below 70% [7]. On the other hand, thanks to prosumer photovoltaics and onshore wind power installations, the share of RES has increased. The number of gas-fired cogeneration units has also increased. Photovoltaic capacity has increased to 4 GW. Electricity production has fallen by 3.8 percent, while demand has reduced by 2.1 percent. Net electricity imports have grown to 13.3 TWh, accounting for 7.8% of Poland’s electrical consumption. Steam coal usage and production have both decreased. Coal reserves grew in 2020, reaching 15 million tons.
Most people associate the concept of renewable energy sources with solar and wind radiation energy. In fact, it is these ways of generating RES energy that are the most common. In 2019, they accounted for 90% of the share of new green capacity [14]. Data from the International Renewable Energy Agency (IRENA) from the end of 2019 indicate that installations of these types achieved a total capacity of as much as 2537 GW [2,21]. According to IRENA’s study, energy-derived carbon dioxide (CO2) emissions must be reduced by 70% by 2050 compared to current levels in order to meet climate objectives. Switching to renewable power on a large scale might achieve 60% of these savings; a 75% reduction may be reached if renewables for heating and transportation are included, and 90% may be possible if energy efficiency is improved. Such investments definitely dominate when it comes to new generation capacities around the world; in 2019, they accounted for about 72% of all such projects. As a consequence, at the end of 2019, renewable energy accounted for 34.7 percent of the global energy mix. Asia is leading the way in renewable energy development, with more than half of the capacity increases in the previous year coming from Asia.
Hypothesis 1 (H1).
Poland is participating with full capacity in renewable energy production and consumption.

2.2. Climate Package

In the evolution of the European Green Deal, the passage of the European climate law in 2021 was a significant step forward. A legally enforceable climate neutrality target for 2050, as well as a transitional goal for 2030, was created, along with a strategy for achieving these goals [9]. The Commission also proposed lifting the 2030 greenhouse gas (GHG) reduction target from 40% to at least 55%, based on an impact-assessed climate plan, in comparison to 1990 levels. The EU amended its global commitment to the Paris Agreement in December 2020, establishing this 55 percent target for 2030 [11]. If Europe wants to become the world’s first climate-neutral country by 2050 and if the European Green Deal is to become a reality, these carbon reductions must be reached within the next decade. With today’s recommendations, the Commission proposes legislative steps to accomplish the goals set out in the European Climate Law and to substantially restructure Europe’s economy and society for a fair, green, and successful future (Figure 1).
The package consists of 13 repair kits. These are new proposals or new regulations. The new targets for 2030 include RES: Among other targets, there is an aim to source 40 percent of energy from RES. There will be national indicative targets, and there will also be sector targets. By 2030, it is intended to reduce energy consumption by at least 9 percent. By 2030, at least 49 percent of the share of energy used in buildings is intended to be renewable. There is also an aim to reduce EU ETS emissions by 61 percent by 2030. The package proposes an annual emission reduction of 4.2 percent (instead of 2.2 percent in other systems). Increasing the availability of renewable energy by 2.5 will contribute to renewables meeting the energy needs of countries, including Poland. Investments in fossil fuels are to be excluded from the fund. All new cars registered from 2035 will be zero-emission models.
Furthermore, the European Investment Bank (EIB) has linked its investment activities to climate goals, as defined in the EIB Climate Bank Action Plan. The Commission adopted a Communication on an Investment Plan for a Sustainable Europe in January 2020, also known as the European Green Deal Investment Plan. The Communication aims to increase transition finance by mobilizing €1 trillion in sustainable investment over the next decade using the EU budget and additional mechanisms such as Invest EU, as well as creating an enabling environment for sustainable investment.
The Commission proposed (April 2021) a Directive on corporate sustainability reporting, which would review and strengthen the existing Non-Financial Reporting Directive criteria on firms’ disclosure of social and environmental performance and impacts. The new Sustainable Finance Strategy is expected to be issued later this year, rather than in the second quarter of 2021 as planned. The €17.5 billion Just Transition Fund was formed in June 2021 to assist persons and communities most affected by the transition to climate neutrality. It is a part of the Just Transition mechanism, which includes a variety of funds and funding options and is expected to attract at least €100 billion in public and private investment. The LIFE Program, which was approved in April 2021 and has a budget of €5.4 billion in current prices for the years 2021–2027, is the only EU fund dedicated solely to environmental and climate objectives.
Hypothesis 2 (H2).
Climate package adoption and implementation in Poland is impossible for the government to implement if the country lacks commitment towards the European Green Deal.

2.3. Green Consumer Values

The 21st century is the era of dedication towards the environment and to protecting the earth. For this, the most important factor is to be active and sensitive towards our consumption patterns [23]. The market produces everything as per the demand of consumers. There are environmental impacts caused throughout the market. The European Union has made a commitment to implement the aforementioned climate package [24]. Now, consumers share the same responsibility as the green consumption will attract green production. GREEN consumer values are related to individuals accepting the use of green products and services. Values are individual beliefs that are shaped over time within the self and influence a person’s everyday activities [25]. There are many factors that act as driving forces to build values, but the most important is the common understanding and acceptance of an individual regarding the effects of the changes in the environment on human life. This is the time to act promptly to protect ecosystems by modifying our consumption patterns. The concept can well understood with greater explorations and explanations the facilitate understanding of real life consumer values [26]. Consumption patterns represent practices that constitute an element of human behavior that persists over time and transfers to the next generation. A consistent choice to create awareness about green products and services among our peers and colleagues will expand the implementation of green consumption [27].
Adopting this common practice will establish the idea of green consumption in consumers’ minds. Though green consumption advocacy is widespread, encouraging the practice it is still a real challenge [28]. It is not an activity but rather a process of changing consumption patterns to protect ecosystems. A continual effort, with dedication and commitment to environmental sustainability, can be a stepping stone to GREEN consumer values [23]. Though the green concept is currently an attractive global trend, the participation of consumers can make it an established sustainable practice [29]. Green practices are not new and there are many studies already available in different areas of management and business. Nonetheless, there is still a huge requirement for the exploration of GREEN consumer values and to establish some specific values that can be accepted among consumers globally [24]. In the market, consumers are, on a practical level, the decision makers regarding the sustainability of any product or service. The market is also highly competitive with a variety of offerings of different degrees of sustainability [30]. Consumers can play a crucial role in the acceptance or rejection of an offering if it is not aligned with their values. Earlier, the awareness of green consumption was not much higher but now it is well understood and accepted among consumers [28].
Competitions among brands for offerings of green products or services are generating more opportunities for consumers to choose their value propositions [31]. Access to information and communication technology has allowed consumers across the world to be reachable [32]. Governments are also stakeholders and responsible for policy formulations that can ensure the successful implementation of sustainability strategies [33]. Consumer preference for specific option out of a broad range of offerings is a byproduct of consumer values. If a choice is based on concern for the environment, then it is informed by GREEN consumer values. Values are unique beliefs that cause an individual to make a particular decision regarding consumption [28]. They are shaped within the mind and are made visible in one’s activity. Consumer values represent a state of motivation towards consumption based on internal stimuli. Individual consumption is completely based on values that are shaped by survival instincts [25]. GREEN consumer values regarding renewable energy sources, specifically Solar, Wind, Hydro, Geothermal, and Biomass, are the main theme of this research, and are examined to obtain an understanding about consumers in Poland based on primary data using a survey questionnaire [25].
Hypothesis 3 (H3).
GREEN consumer values of consumers in Poland are low and consumption of renewable energy sources is not currently an acceptable program.

3. Materials and Methods

The research was quantitative in nature and was established on the basis of a well-structured research method. The research used quantitative methods supported by an extensive study of the relevant literature. A research gap was identified after an exploration of the literature contributions in this specific area of climate package adoption and green energy contributions. GREEN consumer values was the key concept taken to evaluate the consumer acceptance of the aforesaid concepts [34]. The geographical scope of the study was Poland with a broader contextual consideration of European Union (EU) countries. The GREEN concept represents a major at the present time and this research was aligned with these environmental concerns [35]. Climate package adoption and implementation requires the enforcement of the EU in order to protect the environment [36]. Poland is committed to environmental protection, but higher energy prices may be slowing down the process.
As Poland has one of the largest energy systems in the European Union, it was chosen as an example. The Polish energy system is in the top 10 in terms of macro-energy metrics. In the European Union, the Polish economy is ranked as follows: seventh in terms of GDP (in 2018—EUR 496.4 billion in current prices), and sixth in terms of population (37.9 million). In terms of gross primary and final energy consumption in 2018, Poland was in sixth place. The overall worldwide energy consumption in 2018 was 4490.7 PJ. The average gross domestic energy consumption per capita in the United States was around 116 GJ, which is somewhat less than the European average of 137.1 GJ. In 2018, direct energy usage was 3551.8 PJ. Industry was the economic sector that consumed the most direct energy (34.5 percent). The transportation industry came in second in terms of consumption, with a share of 27 percent in 2018. In 2018, households utilized 23% of all energy, agriculture used 4.6 percent, and other users were responsible for 9% [37].
Though the Polish government is in agreement regarding the acceptance and implementation of climate package [38], the implementation will be possible only upon the acceptance of consumers in Poland. The GREEN consumer values concept is a measurement instrument assessing the acceptance of renewable energy sources (RES) [25]. The aim of this research was to measure the consumer acceptance of renewable energy sources and analyze the situation of Poland’s government in terms of its participation in the EU climate package program. The climate package is an additional aspect of this research. The GREEN concept and renewable energy consumption can be possible only if there is an alignment with the adoption of the EU climate package [39]. The research is presented with an introduction to the relevant literature that justifies this concept [40]. A methodological approach was adopted that included with sub sections presenting different data trends related to the adoption of EU climate package guidelines and the acceptance of renewable energy sources with reference to the GREEN consumer values [24].

3.1. Methodological Approach

The methodological approach adopted for the research was a key aspect of this study, and involved the application of mixed methods to strengthen the research. Secondary data were collected from various sources available online or in print [41]. Numeric data were made freely available and researchers are permitted to use it as required. Primary data were also collected to understand the consumer mindset in terms of the acceptance of renewable energy sources [42]. The conceptual scope encompassed the EU climate package concept, as well as renewable energy sources and GREEN consumer values. The study was conducted from May 2021 to November 2021, covering a period of seven months [43]. A cross-sectional study was conducted to gather data, which were presented in the Section 4 [14,30].
The concept of the study was built via a study of the secondary literature, which are discussed above as literature and further presented with the available data in the form of an analysis of data trends [40,44]. Secondary literature is crucial to ensure clarity of the concepts behind this research. The available secondary data also provided a roadmap with numerical values related to the contributions towards and development of the adoption of the climate package in Poland [45]. Nevertheless the secondary data about the acceptance of renewable energy sources in Poland in comparison to European Union’s overall acceptance also has been an important foundation in terms of the justification of this study [38,39]. Secondary data were used for the presentation of EU and Poland’s performance in terms of the use of renewable energy sources as well as the climate package’s implementation and development [36].
The main outcome of the research was based on the primary data collected using a well-structured survey questionnaire, used as the measuring instrument for GREEN consumer values with respect to five renewable energy sources, namely Solar, Wind, Hydro, Geothermal, and Biomass [25]. This research could not ignore the need for and importance of primary data, which are the main determinant for the acceptance of renewable energy among consumers in Poland. The survey instrument was divided into two parts: one part for demographic data and another part for conceptual aspects. There were six items measuring the GREEN consumer values. These six items, measured based on all five categories of renewable energy sources, constituted thirty items altogether. A simple random sampling technique of probability sampling was chosen to gather responses by qualified respondents. The sample of 557 respondents selected for the data collection included individuals from different voivodships of Poland [46,47,48]. Statistical tests such as mean, ANOVA, correlation, and regression analyses were applied to the primary data for analysis using SPSS 25 statistical software [49].

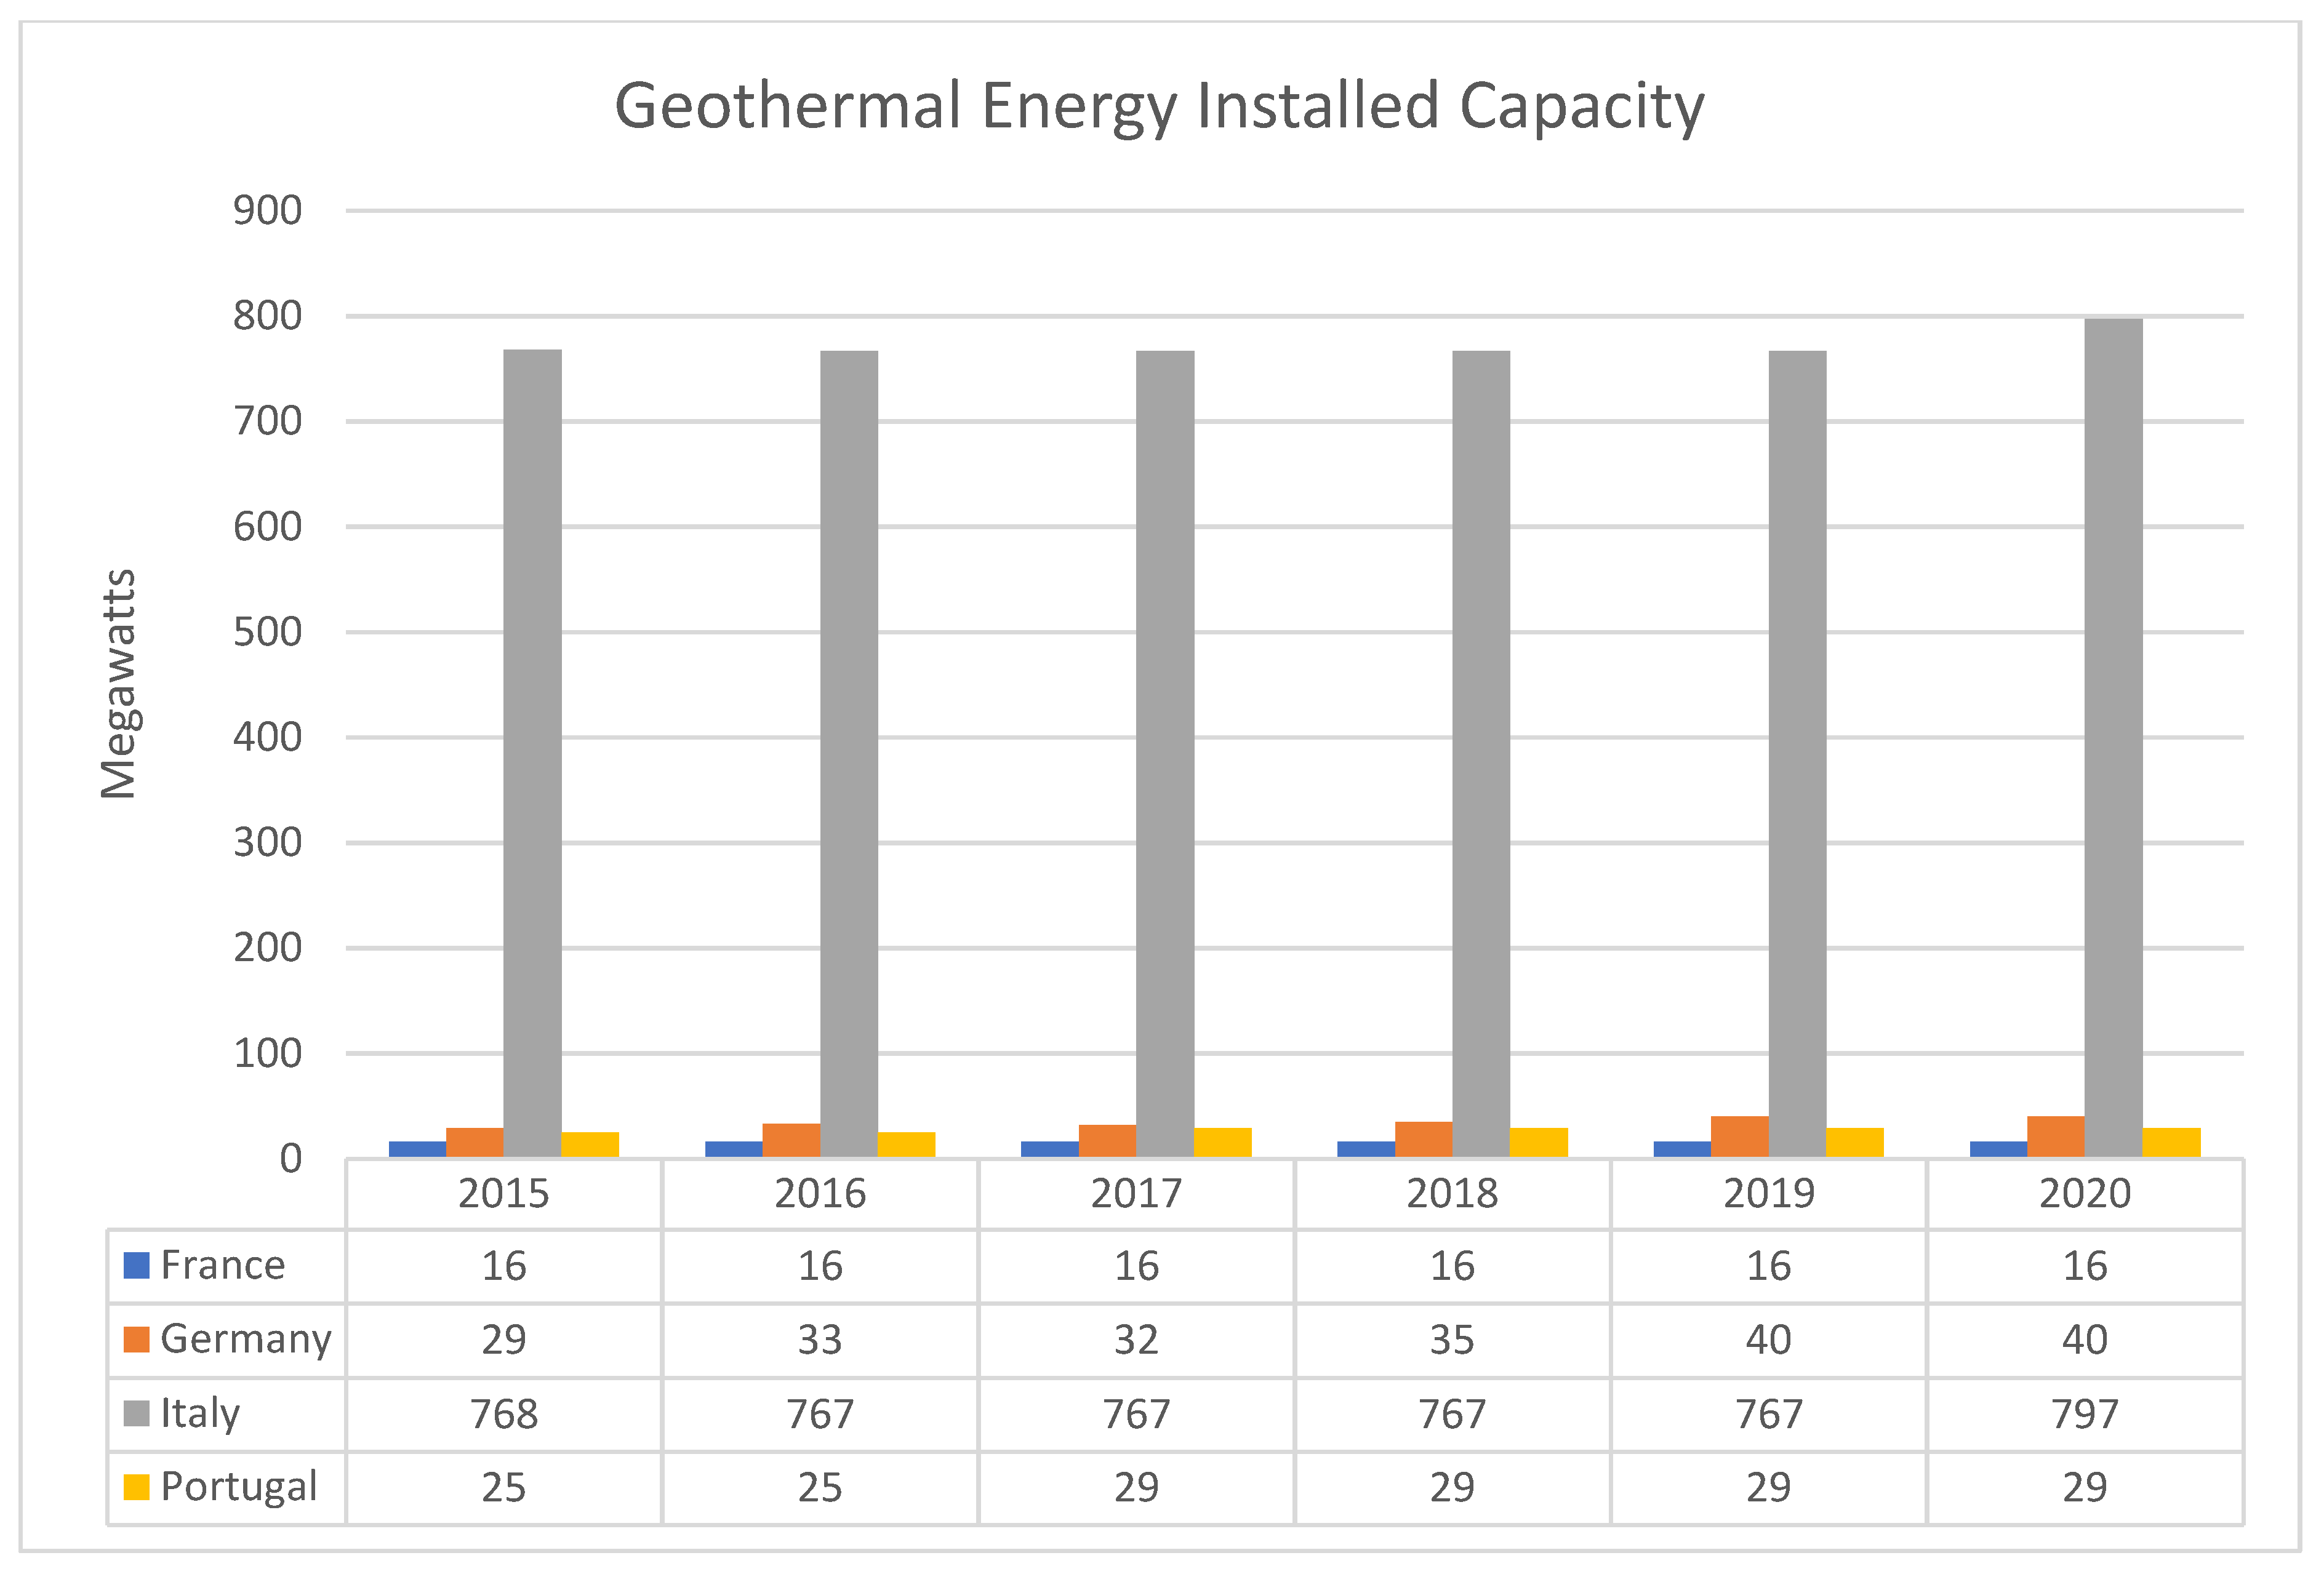
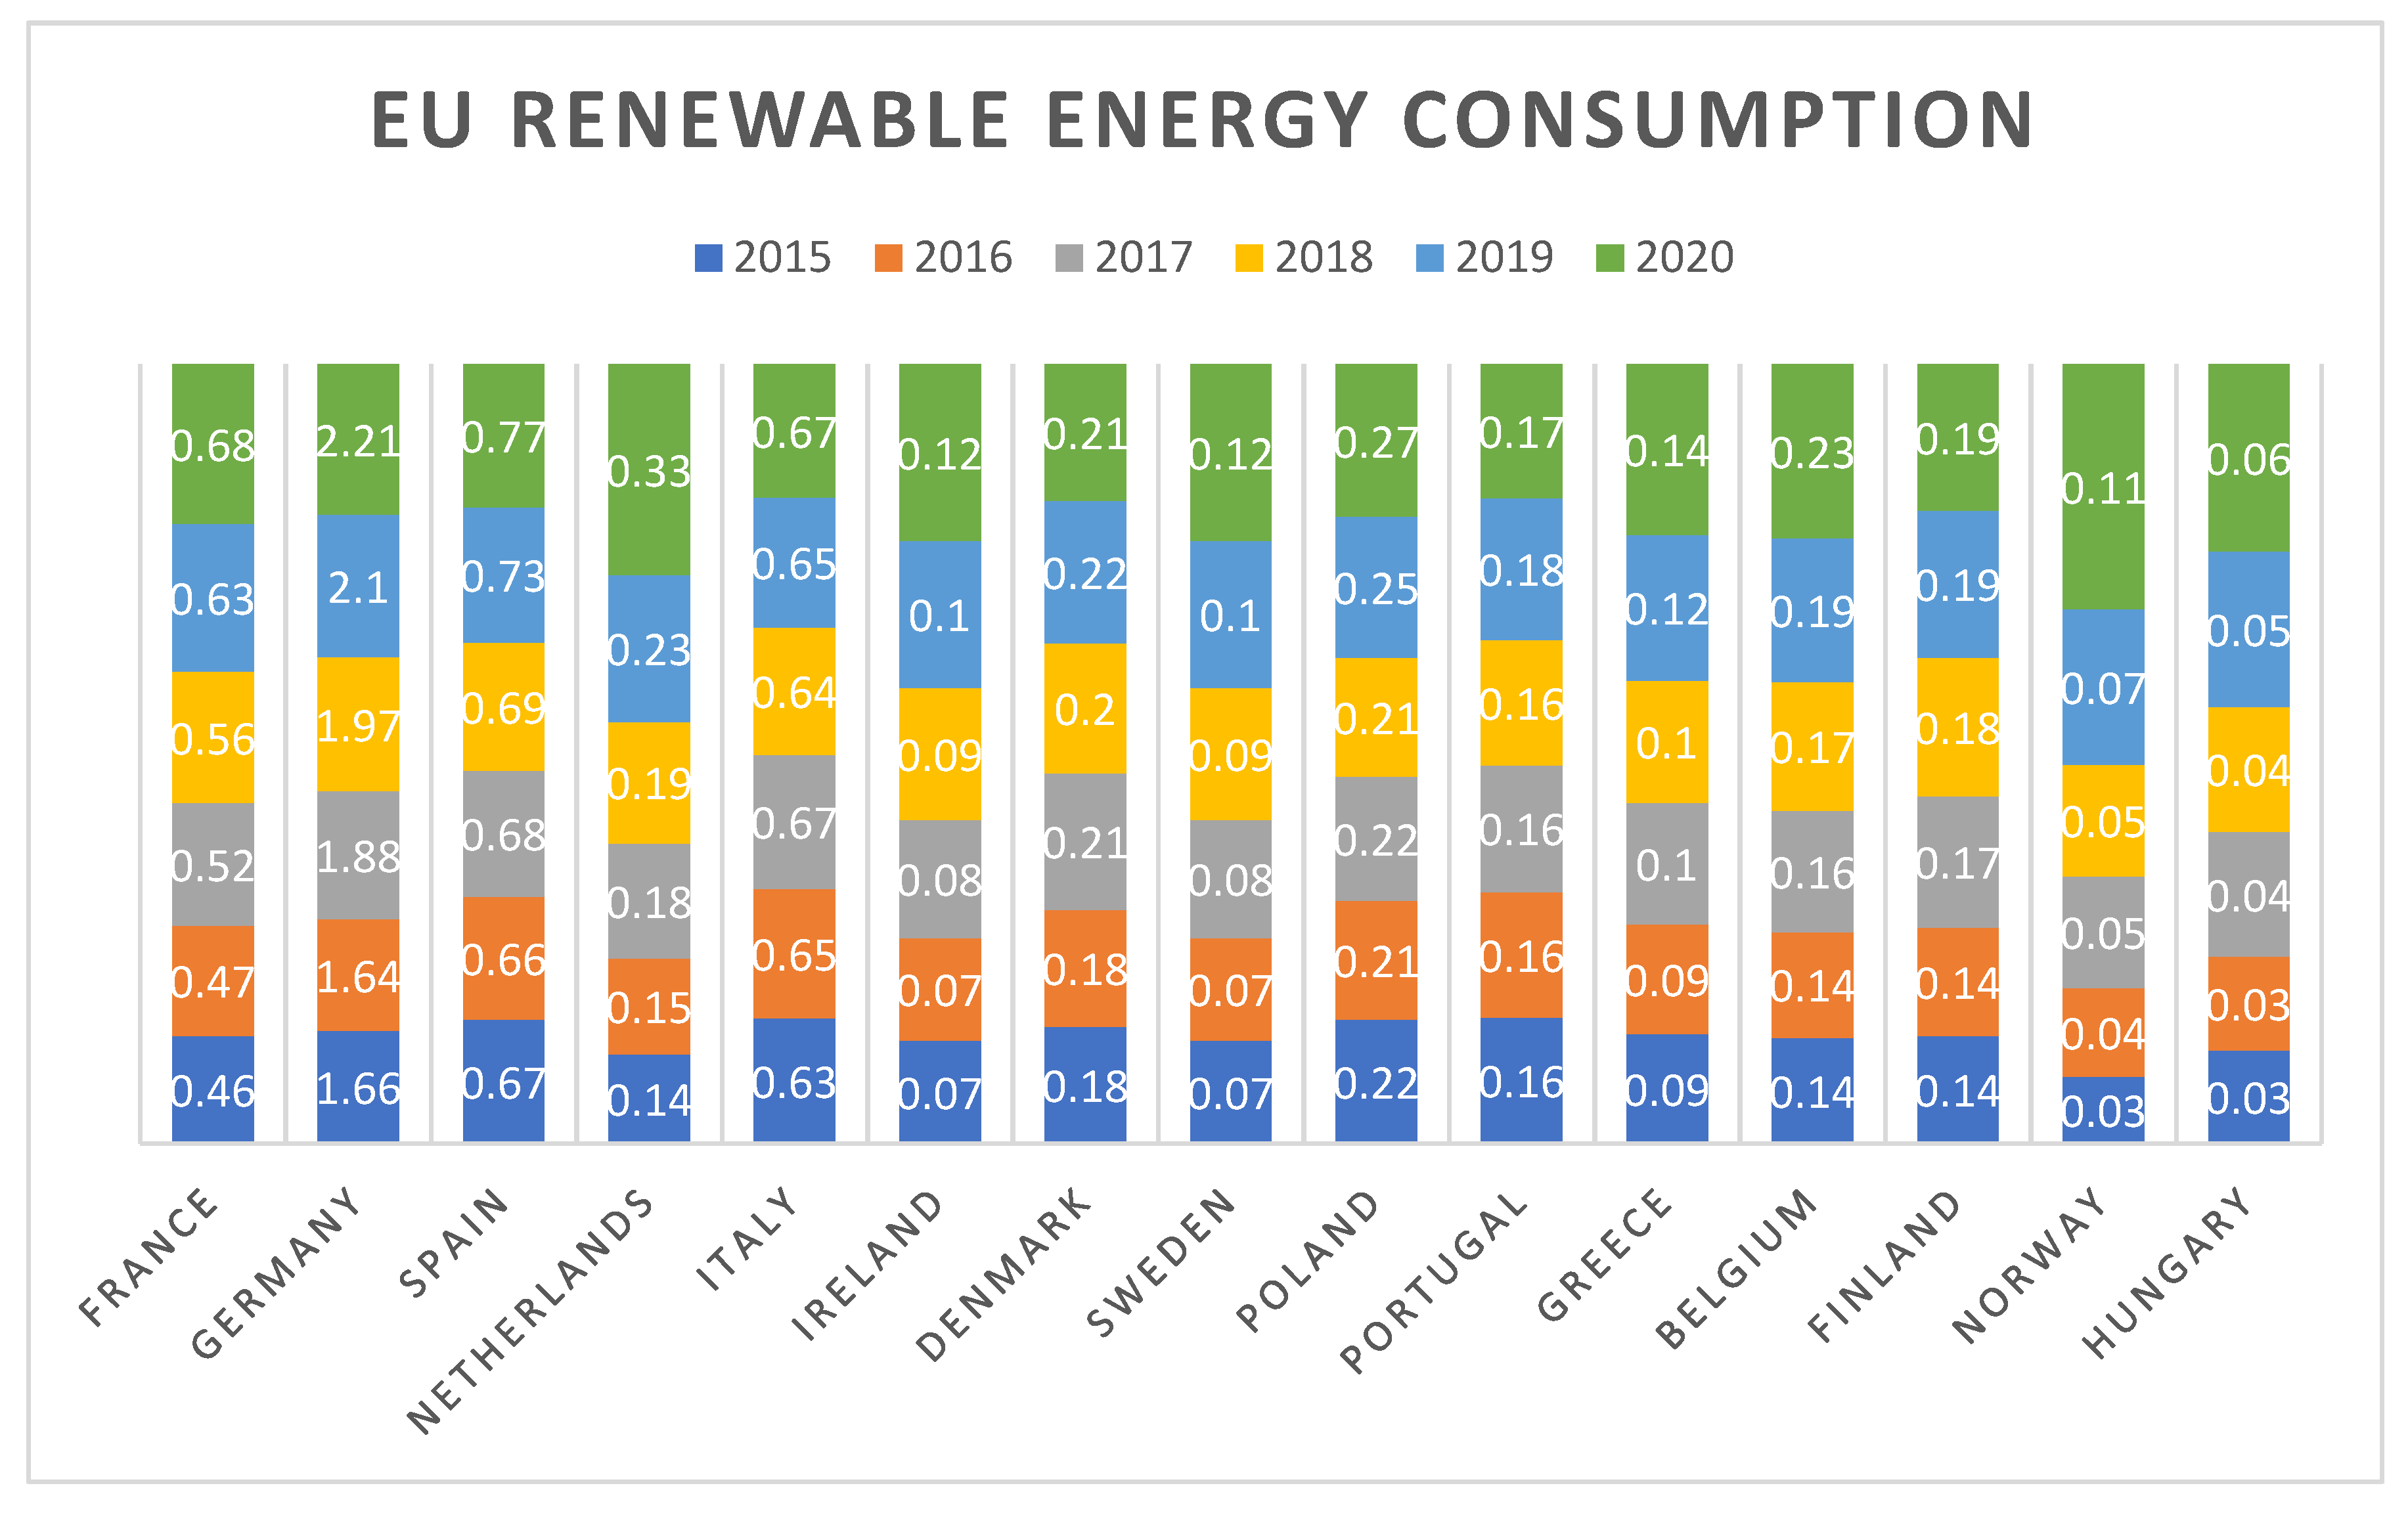
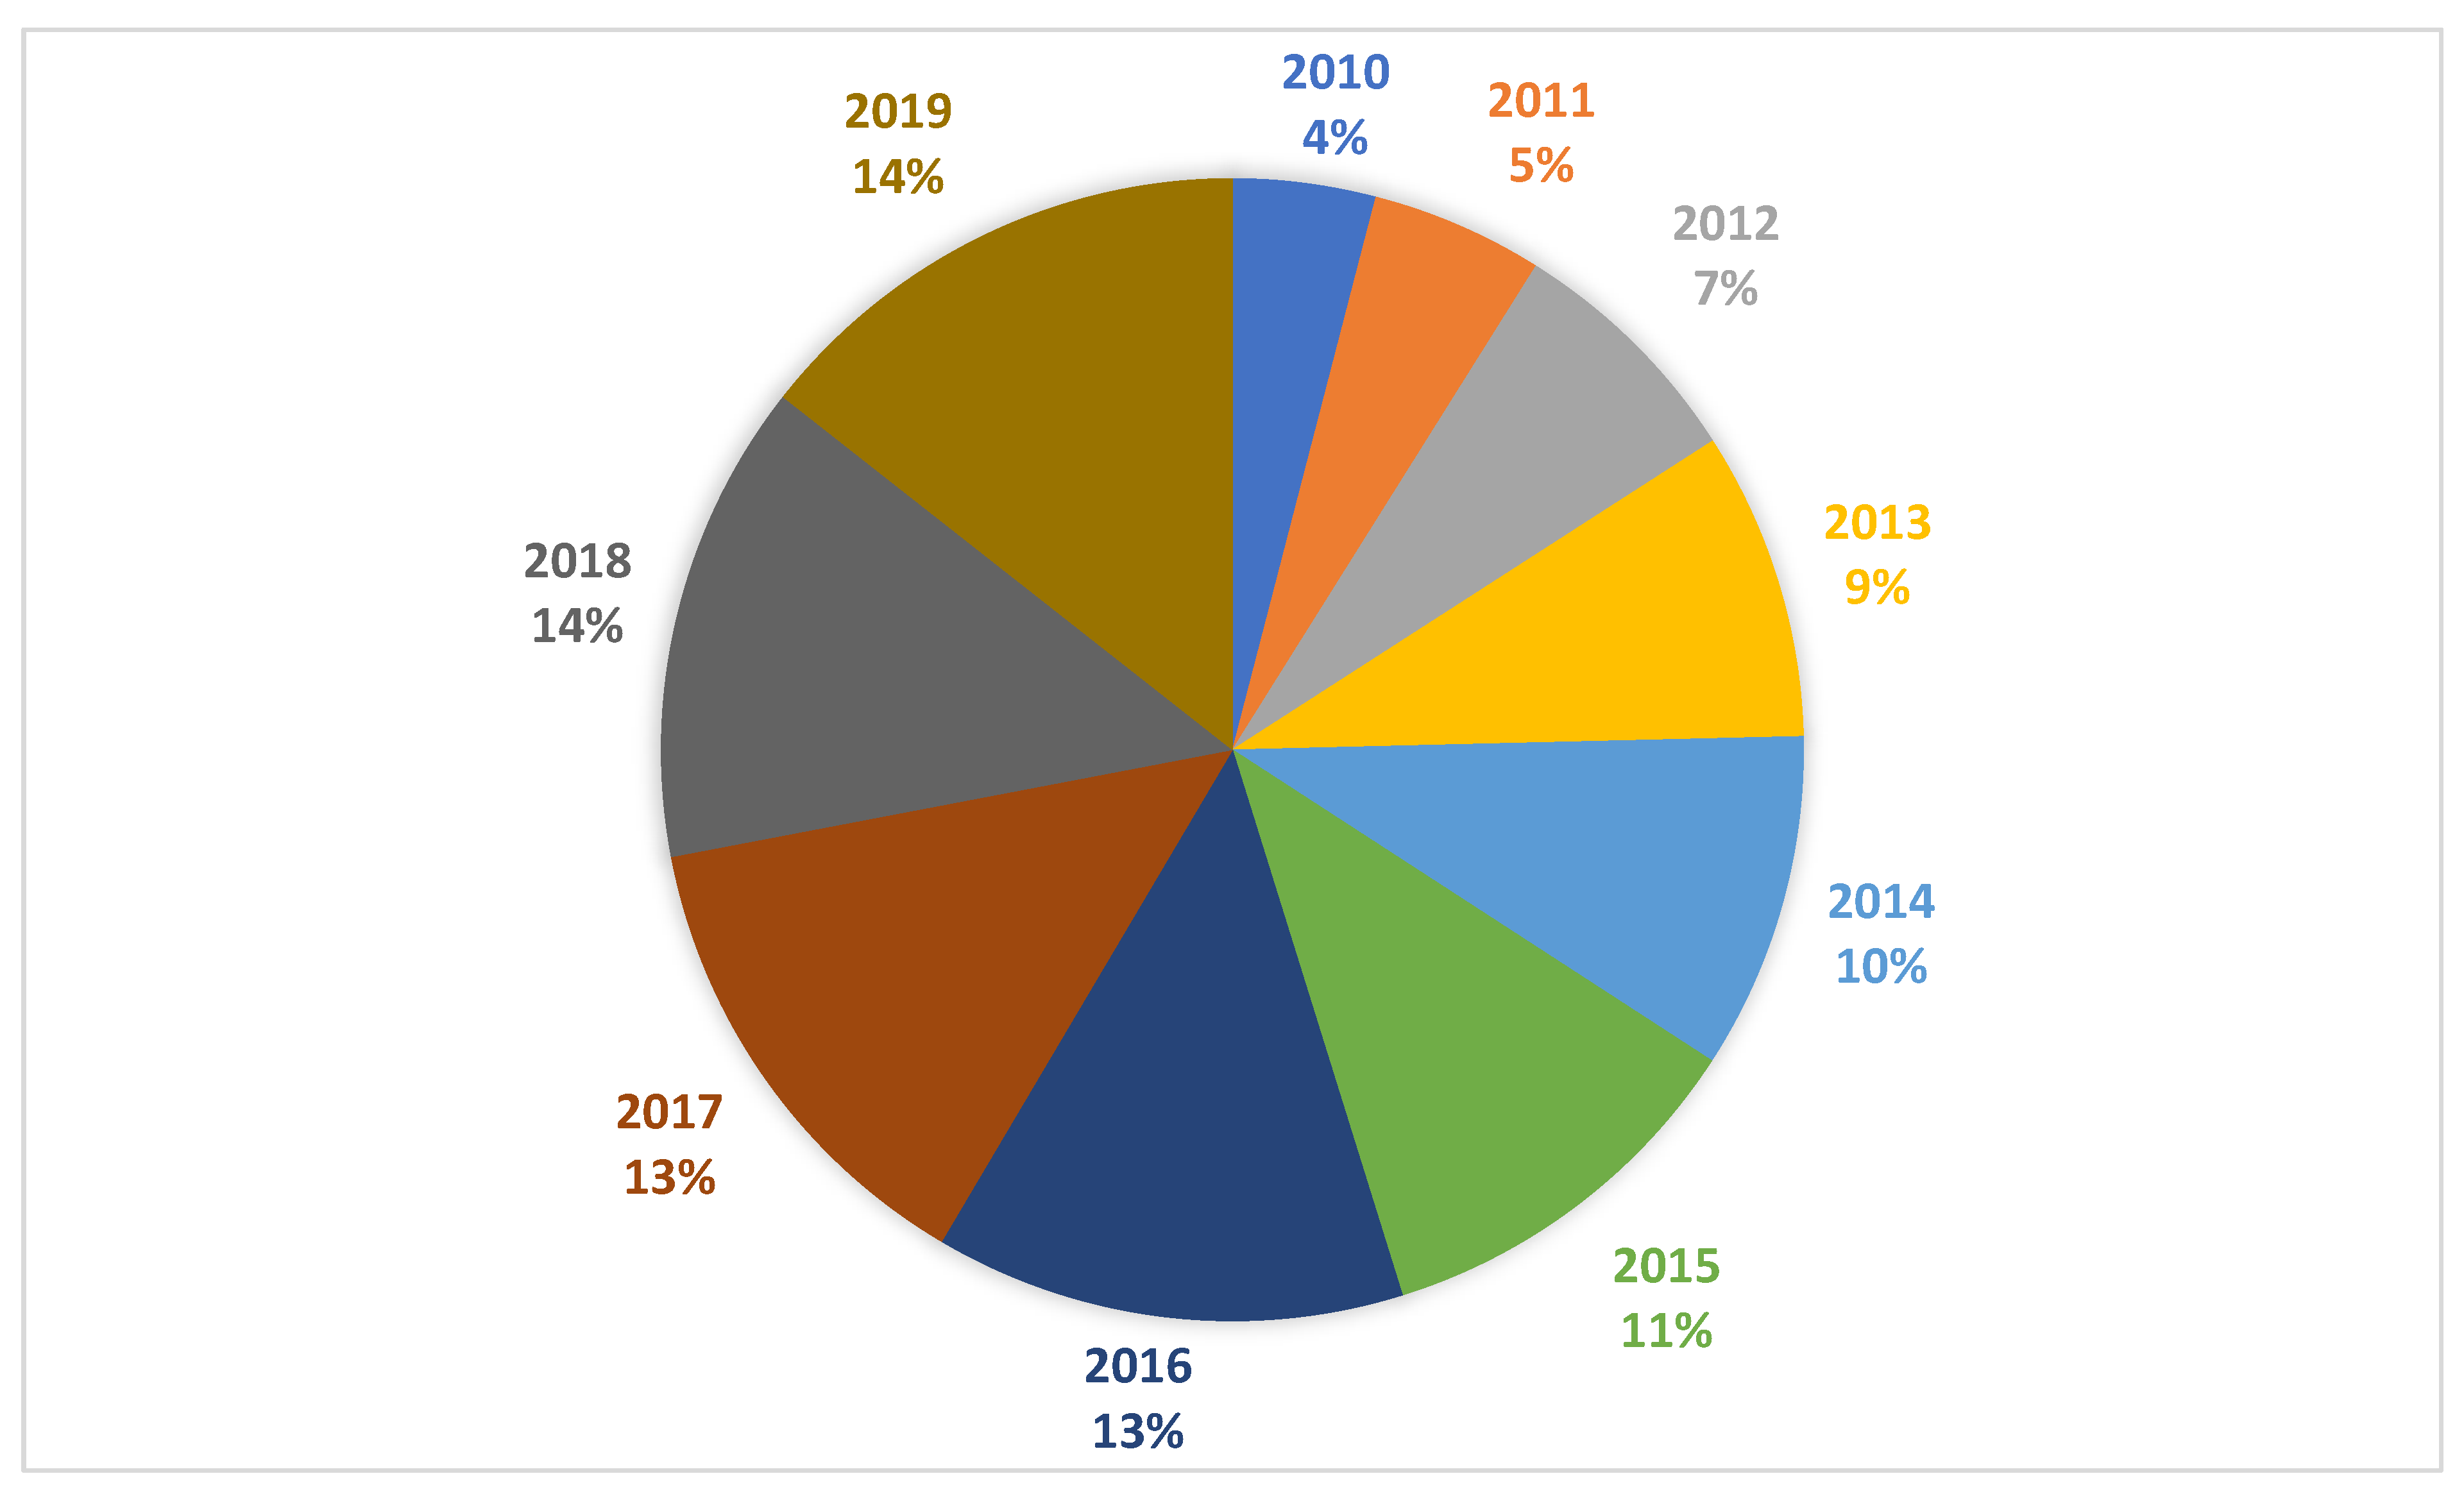
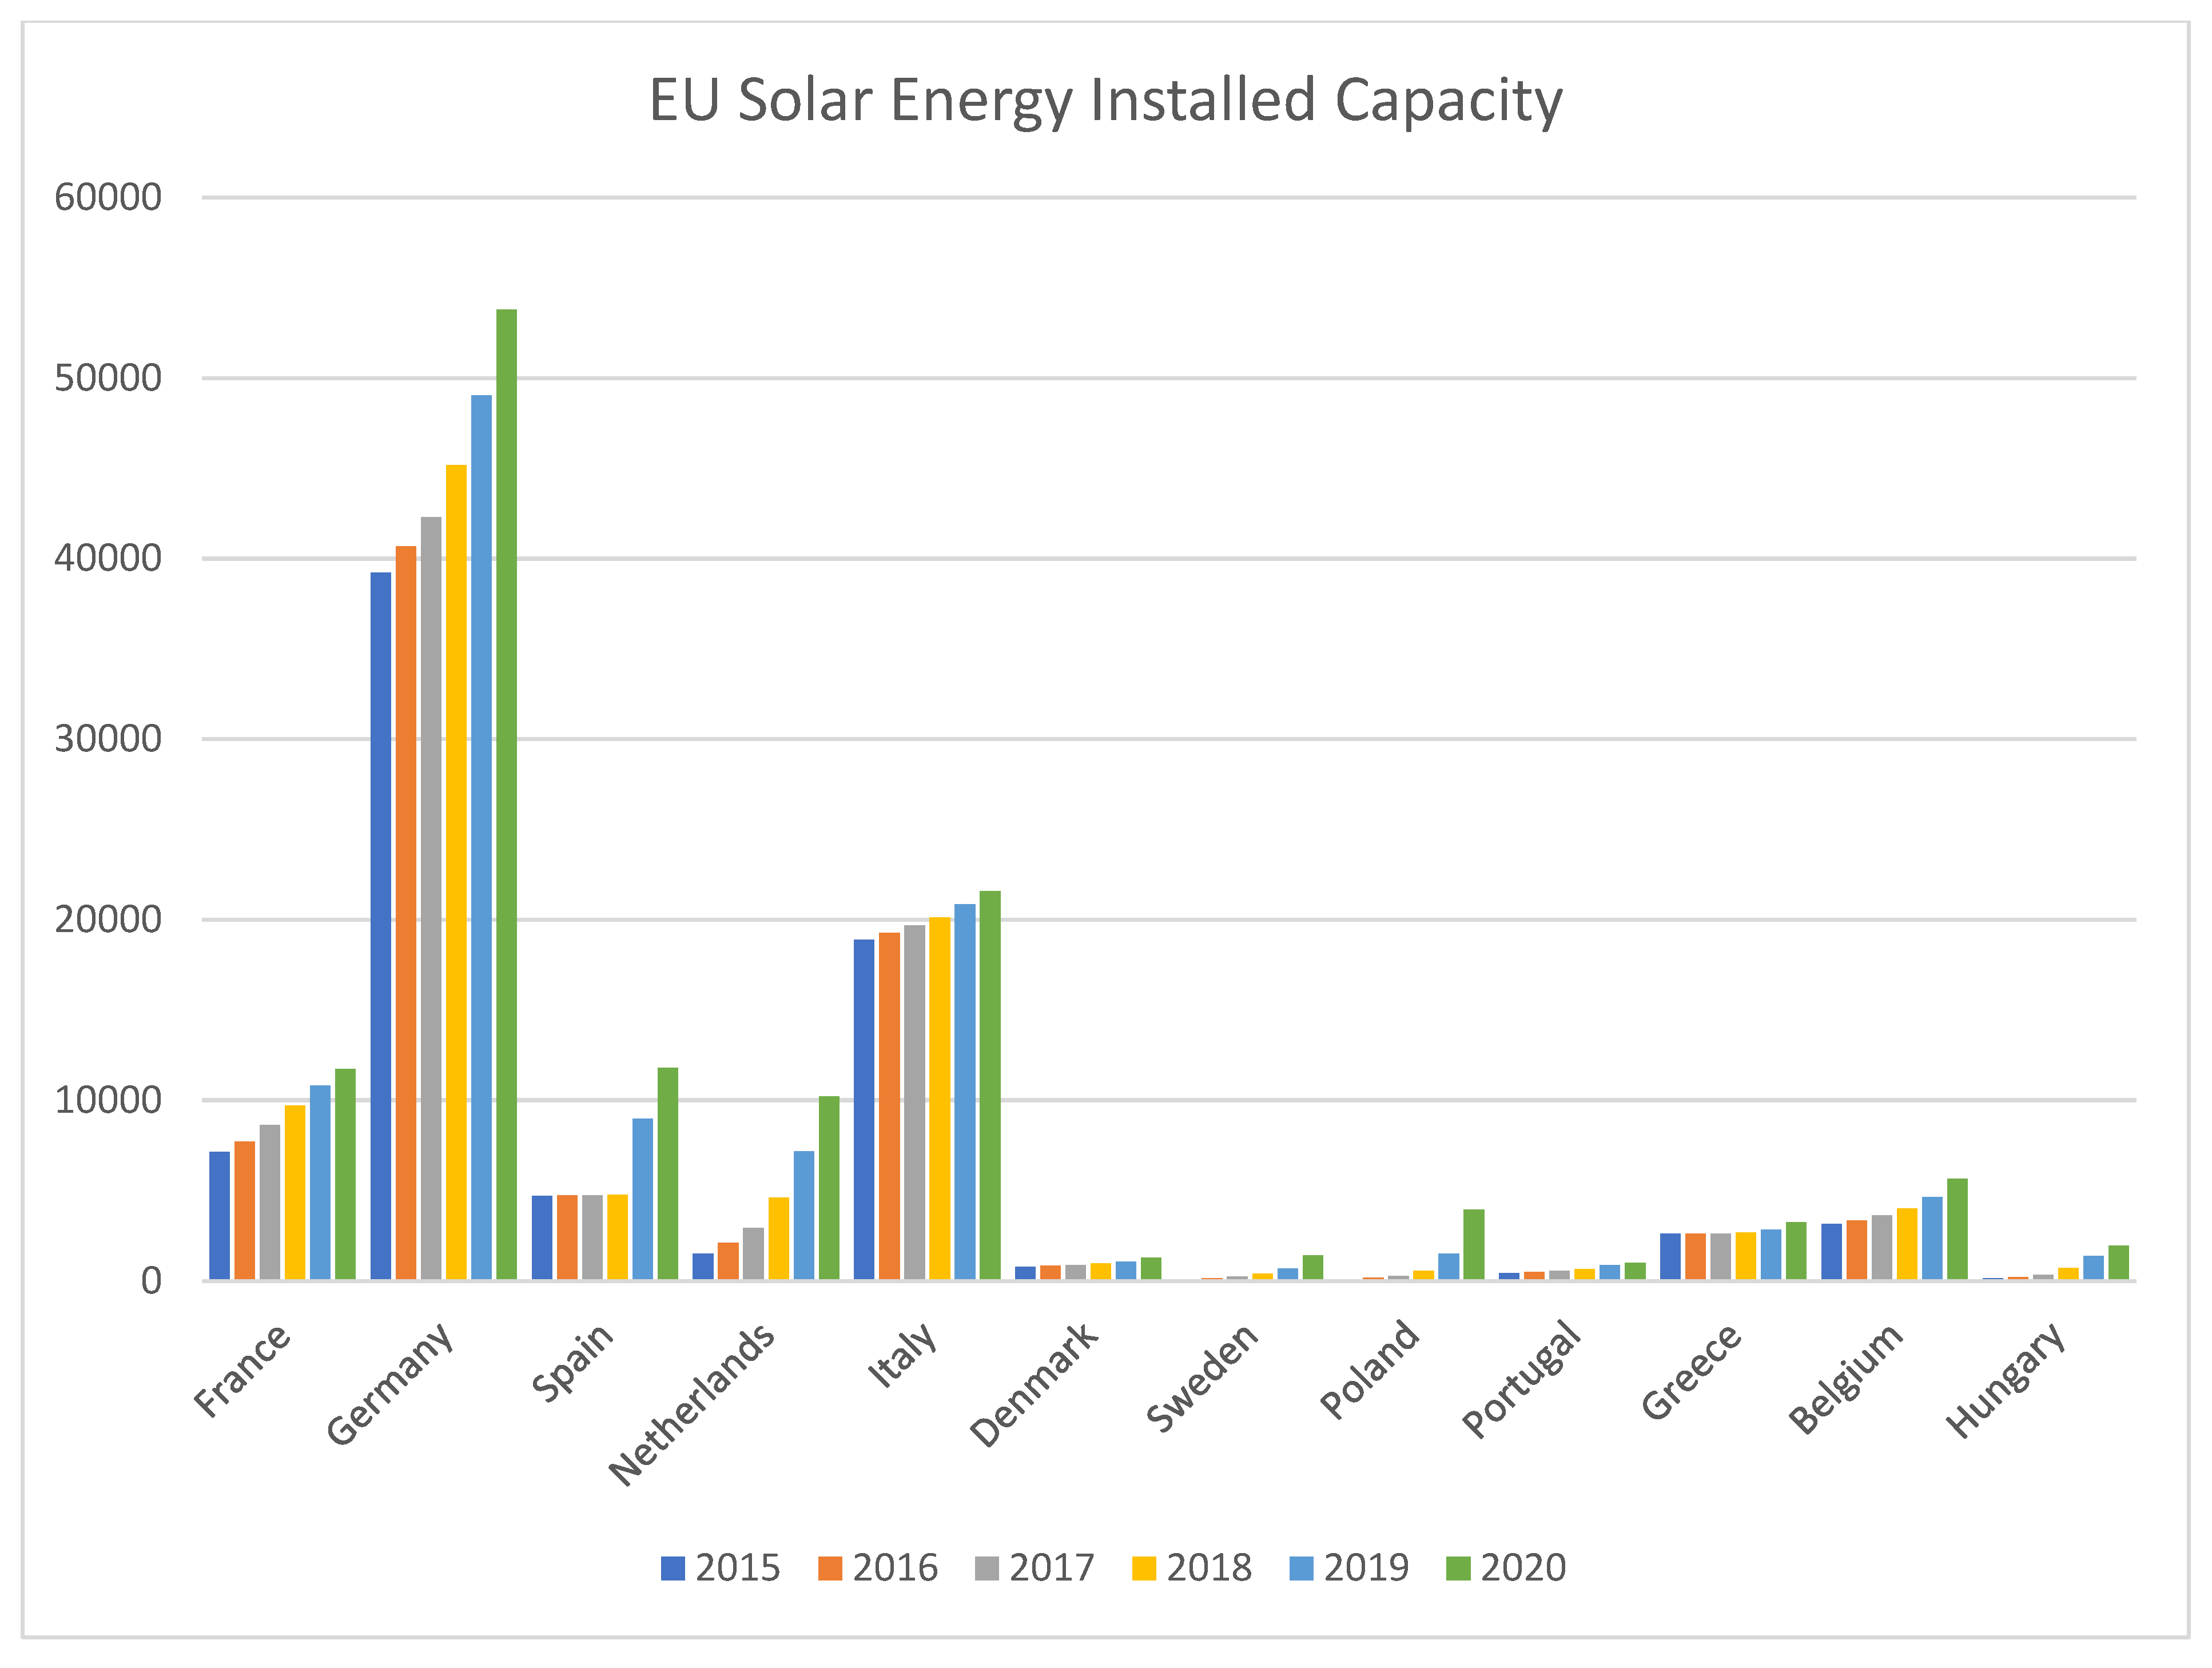
3.2. EU Data Trends for Renewable Energy

The Renewable Energy Country Attractiveness Index (RECAI) ranking published by Earnest Young (EY) in July 2021 has ranked 54 countries in descending order of attractiveness. The European Union (EU)’s fifteen countries are included among these fifty four countries (Table 1). Countries can use this RECAI score for the self-assessment of attractiveness and their participation in renewable energy generation [50]. The EU’s participation in renewable energy generation and promotion is presented here, extracted from the RECAI EY report. Only EU countries are listed here, with a comparative ranking among countries with the same scores, for the better understanding of the particular situation in Europe. This study was focused on an exploration of the situation regarding Poland with consideration of relevant opportunities and its participation in the adoption of renewable energy. Poland was ranked in ninth position in 2019 among the fifteen European countries included. The previous year’s rank was also the same, showing that there is a huge scope of development for the country.
The European Union’s mission to embrace green energy by adopting the climate package requires the promotion of renewable energy sources. The whole world is worried about climate change and one of the solutions for this is renewable energy generation. This study incorporated the published report RECAI, EY, which was conducted in the year 2019 and published in the year 2021 [50]. The five renewable energy sources, namely Solar, Wind, Hydro, Geothermal, and Biomass, were the main themes of this study (Table 2). European Union countries were extracted from the report to assess their scores and their participation in the use of renewable energy sources. EU 15 countries were presented in descending order of their overall score and ranking. Solar Photovoltaic (Solar PV) and Solar Concentrated Solar Power (Solar CSP) were the two subcategories of Solar Energy. Wind Energy is divided in two subcategories—onshore and offshore. Hydro, Geothermal, and Biomass had comparatively lower scores in this report. France was in the top position in Europe and Hungary held the lowest position, whereas Poland was in the ninth position with a good score. The country can explore many opportunities to build self-sustained energy infrastructure and can attract investment into renewable energy resources. Poland can be a good country for investment in renewable energy sources. The government should motivate corporations and citizens with financial incentives promoting the production and consumption of renewable energy.
Records of the installed capacity of solar energy are presented (Figure 2) for six years from 2015 to 2020 for the selected countries (Table 1) from the European Union. The twelve countries presented from the EU are France, Germany, Spain, the Netherlands, Italy, Denmark, Sweden, Poland, Portugal, Greece, Belgium, and Hungary, with their respective contributions in terms of installed capacities for Solar energy production included [51]. The presented data included twelve countries out of fifteen countries, as the data for Ireland, Finland, and Norway were not available and were excluded from the study. In this category Germany has been ahead of other countries since the year 2015 and maintains its position with year-on-year growth up to the year 2020. Italy, France, Spain, the Netherlands, Belgium, and Greece had consecutive rankings of 2nd, 3rd, 4th, 5th, 6th, and 7th with good growth every year from 2015 to 2020. Sweden, Portugal, and Hungary showed flat growth. Poland was at a low production level in the year 2015, with flat growth until the year 2018. For the years 2019 and 2020, Poland showed almost 300% growth year-on-year, which is a commendable success in terms of solar energy installation.
The installed geothermal energy capacities in the countries of the EU between 2015 and 2020 are presented (Figure 3); it can be seen that only four out of fifteen countries in the list have available data [51]. Italy was the leading country, with the highest installed capacity for Geothermal energy generation, although this capacity was the almost same for all the five years. Germany was the second in terms of installation and showed substantial growth, adding more installations year-on-year from 2015 to 2020. Portugal was holder of the third rank with the same capacity for 2015 and 2016, and again with low growth and the same capacity for 2017–2020. France had the fourth rank with the same installed capacity for all six years.
European Union countries’ participation in renewable energy generation and their shares of renewable energy sources (Table 3) are presented for years 2019 and 2020, two consecutive years [51]. The EU countries with relevant data available are France, Germany, Spain, Netherlands, Italy, Sweden, Poland, Portugal, Greece, Belgium, Finland, Norway, and Hungary, and their contributions are shown. Ireland and Denmark are two countries from the main list that are not included here due to the absence of relevant data. The renewable energy sources are divided into three categories, namely wind, solar, and others. An additional column is included, which presents the total renewable energy generation in both years. EU countries need to improve their processes to achieve better and faster inclusion of renewable energy sources. Poland, despite being positioned almost in the middle of the list, has huge potential. Poland can become a country with a well-developed renewable energy infrastructure, thereby supporting the environmental success of the EU and the world.
Renewable energy consumption data were very important in this current research as they made it possible to assess the market potential and opportunities for the new installations. EU renewable energy consumption data are available (Figure 4) for all the fifteen countries incorporated in the RECAI study (Table 1) [43]. The consumption trend is presented for six years, 2015 to 2020, to enable an understanding of the growth of renewable energy consumption. France showed slow growth but there was an increase in renewable energy consumption since 2015 on a year-on-year basis. Germany increased its consumption the most in these six years, though its year-on-year growth needs a further push to increase consumer acceptance. Spain and Italy showed almost the same trend for renewable energy consumption, with very little development over the six years. The Netherlands, Denmark, Poland, Portugal, Belgium, and Finland were similar in their renewable energy consumption and their year-on-year growth, which was much slower, requiring a strong push to align with the EU commitment to climate package. Ireland, Sweden, Greece, Norway, and Hungary lagged behind, with far less renewable energy being consumed over these years. As part of their journey to meet their climate commitments, these countries need to plan and implement new policies supporting and promoting renewable energy consumption. Moreover, Poland is currently progressing slowly in this regard and more effort is needed to align the country’s renewable resource consumption with EU climate package adoption goals.

3.3. Poland Data Trends for Renewable Energy

Poland is committed to participation in the EU climate package adoption program. The country has undergone positive development since from 2010 to 2019 in terms of it’s the renewable energy installed capacity [52]. Poland is expanding its capacity with the development of renewable energy (Figure 5). In the year 2010, renewable energy contributed only 4% of total energy installations in Poland. In 2011, this number increased by 1%, reaching 5%. In the year 2012, this figure increased by 2%, reaching the level of 7%. Furthermore, the contribution reached 9% in 2013, representing a year-on-year growth of 2%. In the years 2014 and 2015, there was 1% year-on-year growth, with contributions of 10% and 11%, respectively, being reached. The years 2016 and 2017 both had 13% contribution levels, with the growth from 2015 to this point being 2%. Again, the years 2018 and 2019 showed identical 14% contributions, with 1% growth compared to the year 2017.
If erroneous judgments in the energy business are made, the forecast assumptions in this area will show a decreased risk in terms of future expenditures. It is worth mentioning that the period from 2035 to 2050 is predicted to be quite steady, meaning that Poland’s energy balance is expected to remain relatively constant. Renewable energy sources and natural gas, on the other hand, will continue to rise in importance in the energy structure, but coal and oil will play a substantial, but still limited, part in the energy structure [52]. A 450 MW gas-steam block at the “Stalowa Wola” power plant was commissioned. The decrease in the capacity of the lignite-fired power plant resulted from the decommissioning of blocks at the “Pątnów” power plant. Solar energy developed significantly in 2020.
Poland’s share of individual renewable energy sources within its total installed capacity for renewable energy is presented (Figure 6). Poland’s installed capacity for Wind represents the highest share, contributing to 65% of its total renewable energy installed capacity in 2019 (Figure 6). Biomass and Biogas have an installed capacity that constitutes a 19% share in the total installed capacity for renewable energy, making them the second biggest contributor. Hydropower’s installed capacity ranks third with an 11% share in the total installed capacity for renewable energy. Solar holds the fourth rank with the lowest sharing of 5% as per the record of the year 2019.
Although fossil fuels will remain the dominant source of energy, their proportional share will decrease from 80% to 60%; two systems will be available: traditional emission-based and emission-free energy [1]. This means that Poland intends to create, within 20 years, an additional emission-free infrastructure with a capacity comparable to its current conventional capacity. As a consequence, the two systems will function together in our energy mix. What is the best approach to achieve this? The proposals to build nuclear power plants are the most divisive. Many experts strongly disagree with the 69 percent predicted capability [1]. Furthermore, environmentalists’ objections and the public’s understanding of the potential threat of disaster and pollution are not the only issues of concern; investment expenses are also a significant consideration, particularly those related to locating a contractor and a good credit package. After all, such large projects cannot be funded from the government’s coffers. Because Poland is not one of the world’s wealthiest countries, there are numerous voices calling for the country to abandon plans to build a nuclear power plant. Several high-efficiency conventional power plants might be built with this money, resulting in significant additional employment for Polish professionals and laborers. This topic is currently being debated, and no solid, final choices have been made. When it comes to the Polish energy sector mix in the next two decades, it should be noted that it differs dramatically from the predictions offered by many experts and scientists. It also differs from the objectives presented in the European Green Deal [16,17,18,19,20].

3.4. GREEN Consumer Values Data for Poland

The mean, median, and mode are the most basic statistical measures of the distribution of responses relating to the parameters of the six items representing GREEN consumer values for each renewable energy source. Furthermore, these are the criteria that determine whether the parametric test or a non-parametric test should be used [46,53,54]. It is known that if the mean, median, and mode are equal to each other, then the researcher should adopt the parametric test. If there are any inequalities among the mean, median, or mode, then the researcher should adopt the non-parametric test. Here, it is clearly shown (Table 4) that the mean, median, and mode were almost equal to each other in all cases. This, the parametric test was adopted in this study [43,55].
The mean value is the mathematical average of responses, which is 4 or near to 4 in most cases, except for a few that are 3 or more, showing that most of the respondents agree or strongly agree with the points presented in the respective items for each renewable energy source (RES). The median is the mid value, which divides the upper range and the lower range, and the mid value is also 4 in almost all cases, and all renewable energy sources have this score except for only a few Geothermal and Biomass renewable energy sources that have scores of less than 4. This shows that respondents accept the renewable energy sources with responses of “agree” or “strongly agree” for all renewable energy sources. The mode is the most frequently occurring value among a set of responses; 4 is the most frequently occurring value, showing that the respondents have confidence in their level of agreement for all parameters for almost all of the renewable energy sources.
The analysis of variance test performed for the five renewable energy sources Solar, Wind, Hydro, Geothermal, and Biomass was considered based on the six items for GREEN consumer values [56,57,58]. There were six demographic variables taken as the factors (Table 5). Renewable energy sources (RES) were presented with F values and significance levels with respect to Gender, Age, Marital Status, Educational Background, Family Income/Month, and Occupation. The Solar energy source showed a high significance level of 0.000 for five factors, with the exception of the Occupation factor, which was higher at 0.272. This shows there was variance in the opinions regarding Occupation for Solar energy, although other five factors do not show any variance. The Wind energy source also showed the same trend as Solar, where Occupation had a significance level of 0.251, which showed a variance in opinion among respondents based on their occupation. However, the other five factors did not show any deviation with Wind energy, highlighting their agreement. The Hydro energy source also followed the same trend as Solar and Wind. However, the significance level was 0.689, which was comparatively higher, illustrating the variance in opinion. However, results for the other five factors were below the accepted region of significance for Hydro energy. The Geothermal energy source had an insignificant value for Gender of 0.582, a value for Family Income/Month of 0.277, and a value for Occupation of 0.349, demonstrating high variance in the opinions of respondents. The Geothermal energy source had significant results for three factors. The biomass energy source showed highly insignificant values for Gender, Marital Status, and Occupation, with the values of 0.760, 0.486, and 0.291, respectively, clarifying the variance in the opinions of respondents. At the same time, the other three factors showed significant levels of acceptance. The variance in opinions regarding Geothermal and Biomass energy was due the lack of availability of these renewable energy sources in Poland.
Renewable energy sources are presented based on their correlations with each other in terms of the primary data collected from consumers in Poland (Table 6) [18,59]. The five energy sources Solar, Wind, Hydro, Geothermal, and Biomass are assessed with the items of the GREEN consumer values. Each energy source is summarized in terms of the six items and their respective levels of understanding. Correlation tests were performed with the 0.01 significance level, where all correlations were highly significant. The energy sources are presented as columns and rows and their intersection points show their correlation values. The highest correlation was between Solar and Wind, showing that they are the most preferred by respondents and they are similarly accepted. The lowest correlation was between Solar and Geothermal, which shows that, in terms of respondents’ opinions, there was comparatively less correlation between them. The reason of this was a lack of usage of Geothermal energy, which should actually be highly correlated with Solar energy. Solar and Hydro energy had a correlation of 0.683; Solar and Biomass had a correlation of 0.669. Further, Wind and Hydro were correlated at a level of 0.728; Wind and Geothermal were correlated at 0.646; Wind with Biomass were correlated at 0.701. Hydro and Geothermal were correlated at 0.772; Hydro and Biomass had a correlation of 0.721; Biomass and Solar had a 0.669 correlation level. All correlation values were highly accepted in this specific case of Poland.
Regression analysis was conducted for the purpose of assessing the effect of each of the renewable energy sources on the renewable energy sources as aggregated dimensions from the data collected for GREEN consumer values. Renewable Energy Sources were considered as the dependent variable and Solar Energy, Wind Energy, Hydro Energy, Geothermal Energy, and Biomass Energy were taken as the independent variables or predictors (Table 7). The study was conducted with the 0.05 significance level, which showed a highly significant result of 0.000 for all the tests. Solar Energy showed the Beta value of 0.867, implying a 86.7% correlation, and the B value was 0.776, meaning the effect size of Solar Energy on Renewable Energy Sources was 77.6%. Wind Energy and Renewable Energy Sources showed a Beta value of 0.891, which was equivalent to a correlation of 89.1%, and a B value of 0.815, which implied a 81.5% effect size. Hydro Energy had a Beta value of 0.890 and a B value of 0.778, implying a correlation of 89% and an effect size of 77.8% on the Renewable Energy Sources. Geothermal Energy had a Beta value of 0.863, and a B value of 0.767, representing 86.3% correlation and a 76.7% effect size on the Renewable Energy Sources. Biomass Energy showed a 0.876 Beta value and a B value of 0.751, meaning the correlation was 87.6%, and the effect size was 75.1% on the Renewable Energy Sources.
GREEN consumer values were assessed using the following statistical tests: mean, median, mode, analysis of variance, correlation, and regression. The results for all tests were within the acceptable range of significance levels. The statistical assessment strengthened and justified this research within the framework of the current requirements. Consumer acceptance of renewable energy sources is the key for the success of the EU’s mission to implement its climate package, which is a long journey. However, small steps will not be enough to reach this goal on time. Poland is a country with an abundance of resources and opportunities. Polish consumers also have significant agreement in terms of the acceptance of renewable energy, as shown in the results of the statistical tests. Wind Energy represents the highest contribution in terms of consumer opinion as per the regression test. Still, other renewable energy sources also have considerable potential to contribute to future growth with adequate exploration and implementation and with sufficient awareness among consumers.

4. Results

The research outcomes were based on the primary data mainly but, at the same time, secondary data were also highly useful in this study [59]. The secondary data constituted the basis of the concept building around the ideas of renewable energy, climate package adoption, and GREEN consumer values, which is well explained in Section 3. The RECAI ranking was the basis for the ranking of EU countries in terms of their attractiveness and also served as a basis for assessing the progress of the implementation of renewable energy sources in Europe and Poland. The primary data were the basis for understanding the consumer acceptance of renewable energy sources in Poland. This outcome relied on the use of the six GREEN consumer values items with the five renewable energy sources—Solar, Wind, Hydro, Geothermal, and Biomass.

4.1. Renwable Energy and EU Climate Package Adoption in Poland

The RECAI rankings and attractiveness scores for the EU countries showed the commitment of the fifteen included countries, where France, Germany, Spain, and the Netherlands showed considerably strong performance. Poland held a comparatively middling rank but had a score of 57.5, which was comparatively better than many other EU countries (Table 1). Poland was found to have positively participated in the alignment with the EU climate package mission to adopt green energy usage in various sectors. Further EU country scores for the five renewable energy sources showed attractive and positive contributions from the same EU members, with France, Germany, Spain, and the Netherlands leading in their individual participation and also leading in terms of development. Poland’s score was also appreciable, with a competitive contribution with almost all the renewable energy sources (Table 2). The research question regarding the current status of renewable energy production and the importance of climate package adoption in Poland was answered, with the empirical data justifying the answer with valid data sources.
The record of EU countries’ individual participation in terms of installed capacities for Solar, Wind, and Geothermal energy showed their year-on-year development for the six years between 2015 and 2020. Solar energy’s installed capacity in the EU was led by Germany for all six years and the contribution increased significantly every year (Figure 2). Poland showed a huge development over the six years, which amounted to a doubling in its capacity every other year, but still lagged behind the benchmark countries’ positions. Wind energy’s installed capacity in Europe was again led by Germany, which was far ahead of the other countries (Figure 7). Wind energy’s installed capacity in Poland was much lower and the growth of installation year-on-year was also slower. Geothermal energy’s installed capacity was lacking among the EU countries (Figure 3). Only a few countries were concentrating on this; throughout the included years, Italy’s capacity in this area was almost twenty times greater than the second highest capacity shown in the table for 2020, which was that of Germany. Poland had no published data regarding the installed capacity of this energy source.
The renewable energy generation among EU countries during the two years of 2019 and 2020 was presented in terms of three categories—Wind, Solar and Others. In these categories, Germany was the leading country for renewable energy production in both years (Table 3). Poland ranked much lower with comparatively far less production of renewable energy. The growth from 2019 to 2020 was not much higher. There was less development for all countries of the EU in 2020 as compared to 2019. The EU’s renewable energy consumption trend is presented in a consolidated form for the six years from 2015 to 2020 (Figure 4). Germany’s consumption was the highest in all years compared to other EU countries. As well as Germany, other countries such as Spain, Italy, and France followed the trend towards greater consumption of renewable energy. Poland had far less consumption of renewable energy with respect to other EU countries. Poland’s renewable energy installation increased from 4% to 14% in the ten years from 2010 to 2019 (Figure 4), which represents a good level of development but this improvement was still less than the level of the EU’s goal for this period. Poland had the highest installed capacity for Biomass and Biogas, at 65%, and least capacity for Hydro power, at 5%, in the 2019 record of individual capacities (Figure 6). The research question about the year-on-year growth in the production and consumption of renewable energy is presented compared with other countries for a better understanding of the ongoing scenario of the green energy production and consumption status in Poland.

4.2. Renewable Energy and GREEN Consumer Values in Poland

GREEN consumer values among Poland’s consumers were evaluated with respect to five renewable energy sources—Solar, Wind, Hydro, Geothermal, and Biomass. A well-structured survey questionnaire used to collect data with the online distribution. Secondary data was given an emphasis over those of the EU countries and the data were further analyzed for Poland among the EU countries. The main goal of the primary data was to obtain a real understanding of consumers’ renewable energy consumption and their opinions on GREEN consumer values. The answer to the research question regarding Poland’s shaping of GREEN consumer values among consumers is answered here with the statistical tests based on primary data and presented with a detailed view of each renewable energy source. This answers are more reliable due to their being provided by respondents who were consumers based in Poland.
Solar energy was the first energy source included in this study and had a very high acceptance level for all six items as indicated by the mean, median and mode (Table 4). One-way ANOVA analysis was conducted with the six demographic variables as the factors, namely Gender, Age, Marital Status, Educational Background, Family Income/Month, and Occupation (Table 5). Two values were presented—the F value and significance level—which were the determinants of variance in opinion, showing that only occupation the factor had an insignificant value. The correlation of Solar with other four renewable energy sources was very high, showing that respondents had high acceptance for all of the renewable energy sources (Table 6). Regression analysis justified a significant result with a correlation of 86.7% and a 77.6% effect size for renewable energy sources (Table 7).
Wind energy was the second energy source involved in this study with a highly accepted values for all six items with respect to mean, median and mode (Table 4). One-way ANOVA analysis showed a significant acceptance of the outcome with an insignificant result for the occupation factor only out of the six factors (Table 5). Wind energy showed an acceptable correlation with the other four renewable energy sources (Table 6). Wind energy showed a highly significant outcome, where the correlation was 89.1% and the effect size was 81.5% on renewable energy sources (Table 7).
Hydro energy also had the same level of acceptance, as determined by the mean, median, and mode, with respect to six items of renewable energy sources (Table 4). The analysis of variance for Hydro energy, using one-way ANOVA, was performed, where only the occupation factor had an insignificant result. The other five factors showed a significant outcome (Table 5). Hydro energy’s correlation showed good agreement with the other four renewable energy sources (Table 6). Hydro energy had an 86.3% of correlation and a 76.7% effect size on renewable energy sources, with a very highly significant result (Table 7).
Geothermal energy had an acceptable mean, median, and mode but a lower mean than Solar, Wind, and Hydro with most of the items (Table 4). Geothermal energy had a very insignificant outcome with Gender, Family Income/Month, and Occupation, showing the variance in the opinions of respondents on these three categories (Table 5). Geothermal energy showed a good correlation with the other four renewable energy sources, with an acceptable relationship (Table 6). Geothermal energy showed a correlation of 86.3% and an effect size of 76.7% with a highly acceptable significance level in terms of renewable energy sources (Table 7).
The biomass energy source was the lowest-ranked energy source in the sequence analyzed in this study, with a comparatively lower mean as compared to the other energy sources, but the median and mode were the same and fell within the acceptable range for all six items included in the study (Table 4). Biomass energy showed an insignificant value for Gender, Marital Status, and occupation, which explained the variance in the respondents’ opinions for these three factors (Table 5). The other three factors showed a significant outcome. Biomass energy had an acceptable level of correlation with the other renewable energy sources (Table 6). Biomass energy showed an acceptable significance level with 87.6% correlation and a 75.1% effect size on the renewable energy sources.

5. Discussion

Poland is a land of abundance of natural resources for renewable energy generation, meaning that it is capable of participating in the EU’s mission to implement its climate package commitment. The analysis of secondary data and the obtained results show that the EU is pushing itself in terms of the climate package’s adoption and implementation. Poland is still lagging behind but its willingness cannot be denied. Poland’s commitment is clearly visible in the expansion of its installation of its green energy production system. Biomass and Biogas have the highest share in the installed capacity for renewable energy sources. Financial constraints are the major challenge for the country regarding this implementation. A financial incentive package is the current requirement for Poland, which can be the driving force for the climate package program’s implementation. The presented results make the concept clear that the EU includes many countries under one umbrella but only an ethos of care for all and the implementation of a unified approach to care can bring about inclusive success based on a greater cause. There were three hypotheses formulated above for the testing of the concept and to obtain an empirical validation justifying the formulated research question with a valid solution.
The results are based on primary data collected to assess Green consumer values to predict the consumer market’s potential for the adoption of renewable energy sources. The mean, median, mode, significance level of variance, correlation and effect analysis showed positive acceptance among consumers in Poland in terms of the acceptance of renewable energy sources. Wind energy had the maximum level of acceptance but solar energy also had the same level of acceptance. Hydro energy could be a major contributor to energy generation but it is comparatively less accepted among consumers. Geothermal energy does not have much awareness among consumers as per their responses. However, it could be one of the major sources for renewable energy generation as consumers are accepting solar energy. Biomass energy also has little acceptance among consumers, and the reasons may be its non-availability or price. However, the country can have an improved capacity and performance as the consumer market is ready to consume renewable energy, and the country has all the needed resources to expand its renewable energy production capacity compared to other countries of the EU. The hypothesis that the results regarding the GREEN consumer values for consumers in Poland are low and renewable energy source consumption cannot be an acceptable program and will be rejected is disconfirmed as the data analysis and results validates that consumers are ready to accept renewable energy sources. Consumer responses also show a high acceptance of the GREEN consumer values components.
Climate package adoption as a concept is the main requirement of this decade. Countries are promoting their achievements, but the question arises as to whether they are enough. The EU’s mission to involve all countries and to push them to make further progress is a noble idea. The current research revealed the dynamics of business. Today, the market is driven by consumer acceptance. This study revealed the consumer acceptance of the renewable energy sources based on the GREEN consumer values. Poland’s government and policies are aligned with the goals of renewable energy production. The consumer acceptance of the renewable energy was also revealed. Thus, the gap between the production and consumption market is visible. More installations and operations are required with renewable energy sources that can serve the ready-to-consume market. The results obtained from the secondary and primary data analysis are crucial to derive a well-structured model to invite investors from around the world to explore opportunities concerning renewable energy sources in Poland. The research hypothesis on the adoption and implementation of the climate package in Poland is impossible for the government, because the country’s lack of involvement in the European Green Deal is also rejected. Poland is committed and using all available machinery and resources to ensure alignment with the European Green Deal and the data provide assurance that, in the coming years, Poland will compete with other countries in terms of increasing its participation in the adoption and implementation of the climate package.
Although there are related studies being conducted all around the world, the fact that this research is specially focused on measuring the consumer acceptance of green energy constitutes the uniqueness to this research. A detailed discussion on the outcomes and the results of this research is presented. All included sections justify the concept stated in the problem statement and also reflected in the title of this paper, namely the measurement of the contribution of renewable energy sources in terms of adoption of the climate package with respect to GREEN consumer values. Furthermore, the subsections of the Section 4 present the relevant outcomes of the analysis of the relationship between climate package adoption status and the acceptance of renewable energy sources among consumers. Poland is committed to align itself with European commitments to environmental care by implementing the climate package deal with an increased capacity of renewable energy generation and moving over to the acceptance of GREEN consumer values. Future progress can only be achieved by the countries in which consumers believe in ideas related to green consumption and adopt the global imperatives towards change. Poland is well prepared to participate in this noble endeavor to establishing a sustainable world for everyone. Another hypothesis, namely that Poland is participating with full capacity in renewable energy production and consumption, is also rejected. Poland’s competence and capacity regarding the implementation of increased renewable energy production and consumption is at its initial stage and the country must go much further to fulfill its green energy commitment by exploring opportunities and striving to achieve better performance relative to other European Union countries.

6. Conclusions, Limitations and Future Research

Research this this area is an ongoing process that continues to evolve, with different views being advanced in different studies. Still, conclusions can be drawn from the current research based on the results and discussion presented in this study.
  • Renewable energy has a good level of acceptance among consumers in Poland, and thus, it can fulfill Poland’s energy generation requirements and create business opportunities for many corporations.
  • Renewable energy generation will reduce the exploitation of non-renewable natural resources, thereby contributing to a sustainable future.
  • The EU is a world leader in sustainable energy adoption, but failure in aligning with the green concept can cause Poland to be less valued among the EU countries.
  • Consumers are gaining awareness and accepting the use of green products. This is shaping GREEN consumer values, which are the future of the consumer market.
  • The future will include a shift from conventional energy to renewable energy and countries already adopting the concept will lead the energy business.
  • Adoption of the EU climate package is a requirement that must be accepted and implemented by all members of the EU. Poland must make the maximum effort to adopt the climate package with an enhancement of its renewable energy production capacity.
Nonetheless, many challenges were encountered in this research, which can be considered as limitations of the study. The EU climate package and green deal are bulky concepts with many additional dimensions. Binding these concepts in a small research project itself is a limitation. Still, the research executed all possibilities to justify the acceptance of these concepts. Assessing consumer preferences and establishing a correlated idea for their understanding is another challenge. The study applied the concept of GREEN consumer values with the belief that it is the most appropriate concept for this study. The study provided justification that the most preferred and available renewable energy sources were Solar, Wind, Hydro, Geothermal, and Biomass. The selection of the geographic scope was another issue, as the RECAI ranking was used to select Poland. The EU has a list of fifteen countries in the RECAI ranking, and Poland is almost in the middle of this list; this ranking was assumed to be a good study of consumers in Poland. The concept of green energy and RES is a vast subject and many researchers are inclined towards this idea. There are plenty of relevant studies available in the literature so the finding of a cutting-edge research gap is based on identifying a critical issue related to this research. This research mostly assessed the GREEN consumer values, which were assumed to be crucial in terms of consumption. However, consumers are not well aware about happenings in this sector and related policies adopted by the government.
In the future, renewable energy research will have a broad scope and provide many opportunities for academicians, industry participants and researchers worldwide. Future research will open avenues for comparison among concepts and countries. This research will help government agencies and policy makers to understand the views of individuals and consumers regarding climate package adoption. In addition, this research will help common people to understand the climate package idea and the status of its adoption by Poland. This research article provides a summary of the current situation in Poland from all dimensions. Society will benefit from this report as it will be informed about the motivation of the government and individuals within the country regarding environmental issues. Furthermore, a comparative study of Poland and India will be developed in future research, which is already under discussion and its methodological development is being considered. Moreover, there is the prospect, based on this concept, to implement similar research in many countries in Europe and Asia in order to measure the pulse of global consumers regarding the acceptance of the concept. Many comparisons among countries are also possible, enabling a picture of the status of the global and local situations in a single frame.

Author Contributions

Conceptualization, M.R.; methodology, P.B. and U.S.S.; validation, M.R. and P.B.; formal analysis, P.B.; investigation, U.S.S.; resources, M.R.; data curation, P.B.; writing—original draft preparation, U.S.S.; writing—review and editing, P.B., M.R. and U.S.S.; visualization, P.B.; project administration, M.R.; funding acquisition, M.R. All authors have read and agreed to the published version of the manuscript.

Funding

This research received no external funding. The APC was funded by the Warsaw School of Economics, Warsaw, Poland.

Institutional Review Board Statement

The study was conducted according to the guidelines of the Declaration of Helsinki. Ethical review and approval were not applicable for this study, due to it not involving humans or animals.

Informed Consent Statement

The research excludes a consent statement because the study did not involve humans.

Data Availability Statement

The authors chose to exclude the reporting of data for public access but they can be made available on individual request for usage in future research.

Conflicts of Interest

The authors declare no conflict of interest.

References

  1. Kiciński, J. Green Energy Tranformation in Poland. Bull. Pol. Acad. Sci. Tech. Sci. 2021, 69, e136213. [Google Scholar] [CrossRef]
  2. Palzer, A.; Henning, H.-M. WHAT Will the Energy Transformation Cost? Pathways for Transforming the German Energy System by 2050; Fraunhofer Institute For Solar Energy Systems ISE: Freiburg, Germany, 2015. [Google Scholar]
  3. Energy Transition in Poland|2021 Edition-Forum Energii. Available online: http://forum-energii.eu/en/analizy/transformacja-2021 (accessed on 5 July 2021).
  4. Pawlicka, K. Prof. Lidia Morawska Zmieniła Bieg Historii. Z Badań Polki Korzystają Rządy na Całym Świecie. Available online: https://kobieta.wp.pl/prof-lidia-morawska-zmienila-bieg-historii-z-badan-polki-korzystaja-rzady-na-calym-swiecie-6690123083979424a (accessed on 19 November 2021).
  5. Brodny, J.; Tutak, M. Analyzing Similarities between the European Union Countries in Terms of the Structure and Volume of Energy Production from Renewable Energy Sources. Energies 2020, 13, 913. [Google Scholar] [CrossRef] [Green Version]
  6. Serowaniec, M. Sustainable Development Policy and Renewable Energy in Poland. Energies 2021, 14, 2244. [Google Scholar] [CrossRef]
  7. Jałowiec, T.; Wojtaszek, H. Analysis of the RES Potential in Accordance with the Energy Policy of the European Union. Energies 2021, 14, 6030. [Google Scholar] [CrossRef]
  8. Brodny, J.; Tutak, M.; Saki, S.A. Forecasting the Structure of Energy Production from Renewable Energy Sources and Biofuels in Poland. Energies 2020, 13, 2539. [Google Scholar] [CrossRef]
  9. Witkowska, A.; Wądołowska, B.; Krawczyk, D.A. Development of Renewable Energy Sources in Poland in Light of European Energy Policy. Environ. Sci. Proc. 2021, 9, 11. [Google Scholar] [CrossRef]
  10. Brodny, J.; Tutak, M.; Bindzár, P. Assessing the Level of Renewable Energy Development in the European Union Member States. A 10-Year Perspective. Energies 2021, 14, 3765. [Google Scholar] [CrossRef]
  11. Karpinska, L.; Śmiech, S. Will Energy Transition in Poland Increase the Extent and Depth of Energy Poverty? J. Clean. Prod. 2021, 328, 129480. [Google Scholar] [CrossRef]
  12. Uma Shankar Mishra; Uma Shankar Singh Assessment of Need for Vertical Coordination in Supply Chain of Vegetable Industry. Int. Food Res. J. 2015, 22, 1417–1423.
  13. Singh, U.S.; Sahin, O. A Literary Excavation of University Brand Image Past to Present. Int. J. Soc. Sci. Educ. Stud. 2017, 3, 174–187. [Google Scholar] [CrossRef]
  14. Odnawialne Źródła Energii–Co Warto Wiedzieć. Available online: https://www.innogy.pl/pl/portal-o-energii-dla-domu/2020/odnawialne-zrodla-energii (accessed on 18 November 2021).
  15. O’Shaughnessy, E.; Heeter, J.; Shah, C.; Koebrich, S. Corporate Acceleration of the Renewable Energy Transition and Implications for Electric Grids. Renew. Sustain. Energy Rev. 2021, 146, 111160. [Google Scholar] [CrossRef]
  16. Guan, J.; Zepp, H. Factors Affecting the Community Acceptance of Onshore Wind Farms: A Case Study of the Zhongying Wind Farm in Eastern China. Sustainability 2020, 12, 6894. [Google Scholar] [CrossRef]
  17. Karytsas, S.; Vardopoulos, I.; Theodoropoulou, E. Factors Affecting Sustainable Market Acceptance of Residential Microgeneration Technologies. A Two Time Period Comparative Analysis. Energies 2019, 12, 3298. [Google Scholar] [CrossRef] [Green Version]
  18. Gromada, A.; Trebska, P.; Wysokinski, M. Use of Renewable Energy in the European Union-Trends of Change. In Proceedings of the 2019 International Conference “Economic Science for Rural Development” No 51, Jelgava, Latvia, 9–10 May 2019; pp. 122–128. [Google Scholar]
  19. Wang, H.; Wang, J.; Liu, Y.; Chen, L. Marine Renewable Energy Policy in China and Recommendations for Improving Implementation. IOP Conf. Ser. Earth Environ. Sci. 2018, 121, 052069. [Google Scholar] [CrossRef]
  20. Chen, C.; Pinar, M.; Stengos, T. Determinants of Renewable Energy Consumption: Importance of Democratic Institutions. Renew. Energy 2021, 179, 75–83. [Google Scholar] [CrossRef]
  21. Global Energy Transformation: A Roadmap to 2050 (2019 Edition). Available online: https://www.irena.org/publications/2019/Apr/Global-energy-transformation-A-roadmap-to-2050-2019Edition (accessed on 21 November 2021).
  22. RAPORT: Nowy Fit For 55 Zmieni Sposób Życia Europejczyków-BiznesAlert.Pl. Available online: https://biznesalert.pl/raport-pakiet-klimatyczny-fot-for-55-prawo-klimatyczne-oze-energetyka/ (accessed on 18 November 2021).
  23. Zhang, X.; Dong, F. Why Do Consumers Make Green Purchase Decisions? Insights from a Systematic Review. Int. J. Environ. Res. Public Health 2020, 17, 6607. [Google Scholar] [CrossRef]
  24. Pinto, D.C.; Nique, W.M.; Añaña, E.d.S.; Herter, M.M. Green Consumer Values: How Do Personal Values Influence Environmentally Responsible Water Consumption?: Green Consumer Values. Int. J. Consum. Stud. 2011, 35, 122–131. [Google Scholar] [CrossRef]
  25. Haws, K.L.; Winterich, K.P.; Naylor, R.W. Seeing the World through GREEN-Tinted Glasses: Green Consumption Values and Responses to Environmentally Friendly Products. J. Consum. Psychol. 2014, 24, 336–354. [Google Scholar] [CrossRef]
  26. Singh, U.S.; Mishra, U.S. Vegetable Supply Chain: A Conceptual Study. Food Sci. Qual. Manag. 2013, 15, 45–60. [Google Scholar]
  27. Singh, U.S.; Mishra, U.S. Bibhuti Bhusan Mishra Vertical Coordination for Optimization of the Vegetable Supply Chain. Int. Food Res. J. 2014, 21, 1387–1394. [Google Scholar]
  28. Bailey, A.A.; Mishra, A.; Tiamiyu, M.F. GREEN Consumption Values and Indian Consumers’ Response to Marketing Communications. J. Consum. Mark. 2016, 33, 562–573. [Google Scholar] [CrossRef]
  29. Bina, O. The Green Economy and Sustainable Development: An Uneasy Balance? Environ. Plan. C Gov. Policy 2013, 31, 1023–1047. [Google Scholar] [CrossRef] [Green Version]
  30. Chen, P.; Zhao, R.; Yan, Y.; Li, X. Promotional Pricing and Online Business Model Choice in the Presence of Retail Competition. Omega 2020, 94, 102085. [Google Scholar] [CrossRef]
  31. Testa, F.; Pretner, G.; Iovino, R.; Bianchi, G.; Tessitore, S.; Iraldo, F. Drivers to Green Consumption: A Systematic Review. Environ. Dev. Sustain. 2021, 23, 4826–4880. [Google Scholar] [CrossRef]
  32. Sachdeva, S.; Jordan, J.; Mazar, N. Green Consumerism: Moral Motivations to a Sustainable Future. Curr. Opin. Psychol. 2015, 6, 60–65. [Google Scholar] [CrossRef]
  33. Surarchith, N.K.; Singh, U. A Study on the Service Quality and It’s Relation to CRM in Telecom Industry. Ind. Eng. Lett. 2013, 3, 50–58. [Google Scholar]
  34. Chen, Y.-S.; Lin, C.-L.; Chang, C.-H. The Influence of Greenwash on Green Word-of-Mouth (Green WOM): The Mediation Effects of Green Perceived Quality and Green Satisfaction. Qual. Quant. 2014, 48, 2411–2425. [Google Scholar] [CrossRef]
  35. Kryk, B.; Guzowska, M.K. Implementation of Climate/Energy Targets of the Europe 2020 Strategy by the EU Member States. Energies 2021, 14, 2711. [Google Scholar] [CrossRef]
  36. GUS Gospodarka Paliwowo-Energetyczna w Latach 2018 i 2019. Available online: https://stat.gov.pl/obszary-tematyczne/srodowisko-energia/energia/gospodarka-paliwowo-energetyczna-w-latach-2018-i-2019,4,15.html (accessed on 13 December 2021).
  37. von Homeyer, I.; Oberthür, S.; Jordan, A.J. EU Climate and Energy Governance in Times of Crisis: Towards a New Agenda. J. Eur. Public Policy 2021, 28, 959–979. [Google Scholar] [CrossRef]
  38. Kulovesi, K.; Oberthür, S. Assessing the EU’s 2030 Climate and Energy Policy Framework: Incremental Change toward Radical Transformation? Rev. Eur. Comp. Int. Environ. Law 2020, 29, 151–166. [Google Scholar] [CrossRef]
  39. Singh, S.; Singh, U.S. A Study Assessing the Brand Loyalty Creation by Promotion Mix for KOTON Brand. J. Xi’an Shiyou Univ. 2020, 14, 26–46. [Google Scholar] [CrossRef]
  40. Singh, D.U.S. A Conceptual Approach Correlating Behavioral Neuroscience with Vertically Coordinated Vegetable Supply Chain. Sch. J. Arts Humanit. Soc. Sci. 2018, 6, 1021–1027. [Google Scholar] [CrossRef]
  41. Rutkowska, M.; Bartoszczuk, P.; Singh, U.S. Management of GREEN Consumer Values in Renewable Energy Sources and Eco Innovation in INDIA. Energies 2021, 14, 7061. [Google Scholar] [CrossRef]
  42. Singh, U.; Kamaran, A.K. Academic Learning and Early Childhood Behavior. J. Humanit. Sci. 2016, 20, 9–18. [Google Scholar]
  43. Piwowarski, M.; Singh, U.S.; Nermend, K. The Cognitive Neuroscience Methods in the Analysis of the Impact of Advertisements in Shaping People’s Health Habits. Eur. Res. Stud. J. 2019, XXI, 457–471. [Google Scholar] [CrossRef] [Green Version]
  44. Cohen, J. Statistical Power Analysis. Curr. Dir. Psychol Sci 1992, 1, 98–101. [Google Scholar] [CrossRef]
  45. Faul, F.; Erdfelder, E.; Lang, A.-G.; Buchner, A. G*Power 3: A Flexible Statistical Power Analysis Program for the Social, Behavioral, and Biomedical Sciences. Behav. Res. Methods 2007, 39, 175–191. [Google Scholar] [CrossRef]
  46. Shieh, G. Power and Sample Size Calculations for Multivariate Linear Models with Random Explanatory Variables. Psychometrika 2005, 70, 347–358. [Google Scholar] [CrossRef]
  47. Nermend, K.; Łatuszyńska, M. (Eds.) Experimental and Quantitative Methods in Contemporary Economics: Computational Methods in Experimental Economics (CMEE) 2018 Conference; Springer Proceedings in Business and Economics; Springer International Publishing: Cham, Switzerland, 2020; ISBN 978-3-030-30250-4. [Google Scholar]
  48. 2019 Renewable Energy Country Attractiveness Index (RECAI) 2021. Available online: https://www.ey.com/en_pl/recai (accessed on 12 November 2021).
  49. Statistical Review of World Energy | Energy Economics | Home. Available online: https://www.bp.com/en/global/corporate/energy-economics/statistical-review-of-world-energy.html (accessed on 1 December 2021).
  50. Szywała, M. Projekt Polityki Energetycznej Polski Do Roku 2050–Możliwe Scenariusze i Perspektywy Rozwoju. 14. Securitologia 2016, 2, 105–118. [Google Scholar]
  51. Brown, L.D.; Cai, T.T.; DasGupta, A. Confidence Intervals for a Binomial Proportion and Asymptotic Expansions. Ann. Statist. 2002, 30, 160–201. [Google Scholar] [CrossRef]
  52. Singh, U.S. Cost estimation using econometric model for restaurant business. Quant. Methods Econ. 2019, 20, 209–216. [Google Scholar] [CrossRef]
  53. Singh, U.S.; Bradosti, H. Acceptability of Banking Operations in Iraqi Kurdistan. Res. J. Financ. Account. 2015, 6, 276–286. [Google Scholar]
  54. Aboagye, B.; Gyamfi, S.; Ofosu, E.A.; Djordjevic, S. Status of Renewable Energy Resources for Electricity Supply in Ghana. Sci. Afr. 2021, 11, e00660. [Google Scholar] [CrossRef]
  55. Apergis, N.; Pinar, M. The Role of Party Polarization in Renewable Energy Consumption: Fresh Evidence across the EU Countries. Energy Policy 2021, 157, 112518. [Google Scholar] [CrossRef]
  56. Asiedu, B.A.; Hassan, A.A.; Bein, M.A. Renewable Energy, Non-Renewable Energy, and Economic Growth: Evidence from 26 European Countries. Environ. Sci. Pollut. Res. 2021, 28, 11119–11128. [Google Scholar] [CrossRef] [PubMed]
  57. Liobikienė, G.; Dagiliūtė, R.; Juknys, R. The Determinants of Renewable Energy Usage Intentions Using Theory of Planned Behaviour Approach. Renew. Energy 2021, 170, 587–594. [Google Scholar] [CrossRef]
  58. Sabishchenko, O.; Rębilas, R.; Sczygiol, N.; Urbański, M. Ukraine Energy Sector Management Using Hybrid Renewable Energy Systems. Energies 2020, 13, 1776. [Google Scholar] [CrossRef] [Green Version]
  59. Bradosti, H.; Singh, U. Public Awareness of Financial Market in Iraqi Kurdistan. Eur. J. Bus. Manag. 2015, 7, 300–308. [Google Scholar]
Figure 1. Fit for 55 EU [22].
Energies 15 01027 g001
Figure 2. EU solar energy installed capacity 2015–2020 [50].
Energies 15 01027 g002
Figure 3. EU geothermal energy installed capacity 2015–2020 [51].
Energies 15 01027 g003
Figure 4. EU renewable energy consumption 2015–2020.
Energies 15 01027 g004
Figure 5. Poland RES capacity installed total 2010–2019 [49].
Energies 15 01027 g005
Figure 6. Poland’s share of individual capacity installed in 2019 [3].
Energies 15 01027 g006
Figure 7. EU wind energy installed capacity 2015–2020 [42,43].
Energies 15 01027 g007
Table 1. EU country rankings in terms of RECAI scores.
CountryScoreRECAI EU RankRECAI EU Rank (Previous)
France67.411
Germany67.022
Spain61.234
Netherlands61.043
Italy59.757
Ireland59.666
Denmark59.375
Sweden57.7810
Poland57.599
Portugal56.9108
Greece56.71111
Belgium56.21214
Finland55.71312
Norway54.71413
Hungary51.91515
Source: 2019 Renewable Energy Country Attractiveness Index (RECAI), Ernst & Young, 2021 [50].
Table 2. EU renewable energy sources based on RECAI scores.
CountryRenewable Energy Sources’ Specific Scores
Solar EnergyWind EnergyHydro
Energy
Geothermal
Energy
Biomass
Energy
Solar PVSolar CSPOnshoreOffshore
France53.122.754.851.940.639.045.9
Germany52.416.851.351.434.340.349.3
Spain51.028.047.826.122.414.628.0
Netherlands46.315.048.344.821.218.444.4
Italy48.841.344.731.244.942.238.9
Ireland43.918.747.541.322.218.241.8
Denmark43.515.249.449.017.014.340.1
Sweden40.914.649.339.233.017.242.6
Poland47.512.944.533.832.517.040.2
Portugal46.536.542.122.535.922.937.7
Greece45.540.846.628.336.524.439.3
Belgium41.317.748.527.626.522.141.5
Finland33.414.955.930.722.314.950.4
Norway37.613.750.139.344.816.227.9
Hungary45.119.939.111.019.931.228.4
Source: 2019 Renewable Energy Country Attractiveness Index (RECAI), Ernst & Young, 2021 [50].
Table 3. EU renewable energy generation 2019 and 2020.
Year20192020
Renewable Energy Sources
CountryWindSolarOthersTotalWindSolarOthersTotal
France34.611.710.757.140.613.110.664.3
Germany125.946.450.4222.7131.050.650.8232.4
Spain53.115.15.673.853.220.86.580.5
Netherlands11.55.35.822.715.38.18.732.0
Italy20.223.725.669.518.726.025.770.3
Sweden19.80.713.033.528.11.111.040.1
Poland15.10.77.723.515.72.07.925.6
Portugal13.71.33.618.612.41.74.018.1
Greece7.34.40.412.19.34.90.414.6
Belgium9.74.25.219.213.05.15.323.5
Finland6.10.113.219.48.10.311.219.5
Norway5.50.10.35.99.90.10.310.3
Hungary0.71.52.24.50.62.42.15.1
Source: EU renewable energy generation 2019 and 2020 [42,43].
Table 4. Mean, median, and mode GREEN consumer values for renewable energy sources.
Renewable Energy SourcesSolarWindHydroGeothermalBiomass
Parameters
It is important to me that the energy I use does not harm the environmentMean4.164.083.973.943.87
Median4.004.004.004.004.00
Mode4.004.004.004.004.00
I consider the potential environmental impact of my actions when making energy usage decisionsMean3.863.823.793.793.77
Median4.004.004.004.004.00
Mode4.004.004.004.004.00
My energy consumption habits are affected by my concern for our environmentMean3.673.713.803.673.67
Median4.004.004.004.004.00
Mode4.004.004.004.004.00
I am concerned about wasting the resources of our planet when I use energyMean3.533.563.653.613.59
Median4.004.004.004.004.00
Mode4.004.004.004.004.00
I would describe myself as environmentally responsible using energyMean3.753.683.703.673.70
Median4.004.004.004.004.00
Mode4.004.004.004.004.00
I am willing to be inconvenienced in order to accept the use of energy that is more environmentally friendlyMean3.613.673.633.563.52
Median4.004.004.003.503.00
Mode4.004.004.003.003.00
Table 5. ANOVA renewable energy sources with factors.
RESSolarWindHydroGeothermalBiomass
Factors
GenderF14.0546.9183.8470.3030.093
Sig.0.0000.0090.0500.5820.760
AgeF5.0023.0173.8518.0424.923
Sig.0.0010.0180.0040.0000.001
Marital StatusF5.59310.7126.2459.0640.723
Sig.0.0040.0000.0020.0000.486
Education
Background
F6.7757.9227.0406.2128.786
Sig.0.0000.0000.0000.0000.000
Family Income/MonthF4.5585.2999.4241.2804.030
Sig.0.0010.0000.0000.2770.003
OccupationF1.2901.3480.5641.1131.245
Sig.0.2720.2510.6890.3490.291
Table 6. Correlation of renewable energy sources.
Energy SourcesSolar
Energy
Wind
Energy
Hydro
Energy
Geothermal
Energy
Biomass
Energy
Solar Energy10.833 **0.683 **0.624 **0.669 **
Wind Energy0.833 **10.728 **0.646 **0.701 **
Hydro Energy0.683 **0.728 **10.772 **0.721 **
Geothermal Energy0.624 **0.646 **0.772 **10.744 **
Biomass Energy0.669 **0.701 **0.721 **0.744 **1
** Correlation is significant at the 0.01 level (two-tailed).
Table 7. Regression analysis of renewable energy sources with factors.
Independent Variables
Predictor
Dependent Variable
Renewable Energy Sources
BBetaSig.
Solar Energy0.7760.8670.000
Wind Energy0.8150.8910.000
Hydro Energy0.7780.8900.000
Geothermal Energy0.7670.8630.000
Biomass Energy0.7510.8760.000
Significant at the 0.05 level.
Publisher’s Note: MDPI stays neutral with regard to jurisdictional claims in published maps and institutional affiliations.

