Article

Numerical Study on Vortex Structures and Loss Characteristics in a Transonic Turbine with Various Squealer Tips

1
National Key Laboratory of Science and Technology on Aero-Engine Aero-Thermodynamics, School of Energy & Power Engineering, Beihang University, Beijing 100191, China
2
AECC Shenyang Engine Research Institute, Shenyang 110015, China
*
Author to whom correspondence should be addressed.
Energies 2022, 15(3), 1018; https://doi.org/10.3390/en15031018
Submission received: 30 December 2021 / Revised: 27 January 2022 / Accepted: 27 January 2022 / Published: 29 January 2022
(This article belongs to the Special Issue Advanced Technologies in Gas Turbines)

Abstract

:
Cavity width and height are two key geometric parameters of squealer tips, which could affect the control effect of squealer tips on tip leakage flow (TLF) of gas turbines. To explore the optimal values and the control mechanisms of cavity width and height, various cases with different cavity widths and heights are investigated by solving the steady Reynolds Averaged Navier–Stokes (RANS) equations. In this study, the range of cavity width is 9.2–15.1 τ, and that of cavity height is 1.0–3.5 τ. The results show that the optimal value of cavity height is 2.5–3.0 τ, and that of cavity width is about 10.0–10.5 τ. The small cavity width could restrain the breakdown of tip leakage vortex (TLV) and reduce the extra mixing loss. Both small cavity width and large cavity height could enhance the blocking effect on the TLF, reducing the corresponding mixing loss. However, both of them will inhibit the length of the scraping vortex (SV), which is bad for the control of loss. In addition, large cavity height could reduce the loss inside the clearance, while small cavity width could not. This work could provide a reference for the design of squealer tip.

1. Introduction

In turbomachinery, to avoid the scratch between the rotor blade and the casing, the existence of tip gap is required. As the pressure on the suction side of the rotor blade is smaller, the air flow inevitably flows from the pressure side to the suction side through the gap, forming tip leakage flow (TLF) which could cause significant adverse effects on the aerodynamic and thermal performances of turbomachinery. Especially in gas turbine, the loss caused by TLF is recognized as a major part of aerodynamic loss, which could be more than 30% of the total aerodynamic loss of rotor passage [1]. To improve the efficiency of gas turbine and make full use of energy, the control of TLF and its loss is of great significance.
The tip leakage loss mainly includes the entropy increase in the gap and the loss caused by the mixing between TLF and main-flow [2]. Further, many subsequent studies [3,4,5] have proved that the latter is the major source of tip leakage loss. According to the theory about variable cross-section pipe flow, the mixing loss is primarily affected by the leakage rate and the velocity difference between the TLF and the main-flow. Therefore, the key to lower the tip leakage loss is to control the leakage rate and momentum of TLF.
At present, there are various methods with potential to control TLF. According to whether there is energy input, these methods consist of passive control methods and active control methods. The former includes squealer tip [6], winglet tip [7], and the latter includes tip injection [8], plasma actuator [9] and so on. The main function of tip injection is to cool the blade tip. It is difficult to maintain the effective control of leakage flow using tip injection. In addition, the winglet tip and other control methods are limited by material strength, thermal characteristics and other factors, and have not been applied in practical engineering.
Squealer tip is an effective and feasible passive control method for TLF, which is often used in unshrouded high pressure turbines [10]. With the introduction of squealer tip, the vortex structures become more complex near the casing endwall, especially inside the cavity. Besides the tip leakage vortex (TLV) caused by TLF in the channel, there are three vortices dominated by scraping vortex (SV) inside the cavity [11]. The other two are corner vortices near both side rims, named pressure side squealer corner vortex (PSCV) and suction side squealer corner vortex (SSCV), respectively. These vortices inside the cavity, especially the SV, have a blocking effect on the TLF [12]. The SV is significantly affected by the relative motion of the casing [13], which could cause the large variation in leakage rate [14]. In the further studies of the controlling mechanism, it is demonstrated that the SV inside the cavity acts as a labyrinth tooth, thus forming the aero-labyrinth like a sealing effect [15]. The study has clarified that the SV plays a dominant role in the controlling of the TLF. In addition, the cavity could be used for flow control in other fields [16]. So far, the control mechanism of squealer tip on the TLF has been fully studied and understood, which provides a guide for the geometric optimization of squealer tips.
The geometric optimization of squealer tips involves many geometric parameters, such as width of squealer rim [17], cavity height [18] and cutback rim [19]. In addition, the inclined pressure side rim could enhance the flow separation at the top of the rim and block the TLF into the clearance [20]. The study of Senel et al. [21] shows that the increase in the height and width of cavity could enlarge the sizes of the PSCV and the SSCV, enhancing the blocking effect.
Most of the above literatures only investigated the TLF characteristics under subsonic conditions. However, there are significant differences in flow characteristics between subsonic and transonic conditions. In terms of the evolution of TLV, TLV may be affected by shock wave under transonic conditions [22], which is more likely to break down and cause additional mixing loss [23]. Further research shows that inlet conditions and blade rotation will have a certain impact on the breakdown of TLV [24,25,26]. However, to the author’s knowledge, few studies have considered the effect of squealer tip geometry on the breakdown of TLV in transonic turbines.
As mentioned above, although there are a lot of researches on the geometric parameters of squealer tip, no specific design method for squealer tips has been proposed. Moreover, the control mechanisms of various geometric parameters on tip leakage loss are not explained clearly. In addition, some conclusions of previous studies about cavity geometry are obtained under subsonic conditions. These conclusions may not be applicable under the transonic condition. It is necessary to study the influence of cavity width and depth on TLV of transonic turbines.
Therefore, two key geometric parameters of conventional cavity tips, the cavity width and cavity height, are studied numerically in this paper. To clarify the accuracy of the numerical method and improve the reliability of the numerical results, the grid independence is validated through six numerical examples with different grid densities, and the numerical method is verified based on the public experimental data of transonic high-pressure turbine PW E3. After that, several numerical cases of six kinds of cavity widths and five kinds of cavity heights are simulated, and the optimal value ranges of cavity width and cavity height are summarized, respectively. To reveal the influence mechanism of above two geometric parameters on aerodynamic performance, the effects of cavity width and height on loss distribution, vortex structures and TLF are analyzed in Section 3.2 and Section 3.3, respectively. Firstly, several cases with obvious aerodynamic benefits are selected. Secondly, the axial distributions of loss in these cases are analyzed in detail, and the regions where the loss changes significantly with the cavity width and height are determined. Then, the formation and development of vortex structures in these regions are analyzed. Finally, combined with the production mechanism of loss, the control mechanisms of cavity width and height on loss in the tip region are revealed. The work of this study could provide a reference for the design of turbine cavity tip and a more in-depth perspective for the study of TLF in turbines.

2. Methodology

2.1. Research Object and Geometric Parameters

In this study, a transonic single-stage high-pressure turbine is studied numerically to reveal the effects of the width and height of cavity on TLF. The main aerodynamic and geometric parameters of the turbine under the design condition are shown in Table 1. The relative Mach number at the outlet (Mar,2) indicates that the flow is supersonic in some region of the rotor, so it is highly likely that there are shock waves in the tip region of the rotor. The Reynolds number (Rer,2) in the table is calculated by taking chord length as the reference length and outlet relative velocity as the reference velocity.
Previous study [15] has demonstrated that the mechanism of cavity tip controlling TLF is the aero-labyrinth sealing effect. In addition, it is generally believed that the sealing effect of labyrinth seals largely depends on the spacing and height of labyrinth tooth. Similarly, the width and height of cavity are the key geometric parameters affecting TLF in gas turbines. Therefore, conventional cavity tips with different cavity widths and heights are studied in this paper.
The geometric sketch of cavity squealer tip and the definition of cavity width are shown in Figure 1. Here, the direction of TLF is approximated by the normal direction of the mean camber line. The width of the cavity is measured along this direction. Since the width of the cavity varies along the axial direction, the maximum cavity width (W) is adopted in this paper to characterize the width of the entire cavity.
Six kinds of cavity widths, named ‘width 1’–‘width 6’ in decreasing order, and five cavity heights, are investigated. The maximum width of cavity is 15.1 τ, 12.5 τ, 11.8 τ, 11.0 τ, 10.4 τ, and 9.2 τ, respectively. The height of cavity (H) is 1.0 τ, 1.5 τ, 2.5 τ, 3.0 τ, and 3.5 τ.

2.2. Numerical Methods

The software ANSYS CFX19.0 is used to solve the steady compressible viscous Reynolds Averaged Navier–Stokes (RANS) equations in this study. The shear stress transport (SST) turbulence model is employed for equations’ closure. CFX solver is a fully implicit pressure-based solver and uses time pursuing finite volume method to solve the RANS equations. The spatial discretization uses a high resolution scheme. According to the research of Menter et al. [27], thanks to the implicit coupling solution method and the algebraic multi-grid algorithm, CFX can simulate various cases in a large Mach number range. Thus, CFX could be a good choice for the numerical simulation of transonic turbines.
The computational domain comprises a single stator channel and a single rotor channel. In the numerical simulations of this study, the determined total temperature, stagnation pressure and turbulence intensity are given at the inlet. The static pressure at the outlet is alterable to meet the total-to-total pressure ratio requirements of the turbine design state. In this paper, both sides in the circumferential direction of the computational domain are rotational periodic surfaces. At the interface between rotor and stator, the mixing-plane model is used to model frame and change pitch. In this study, all the walls are set as adiabatic with no slip.

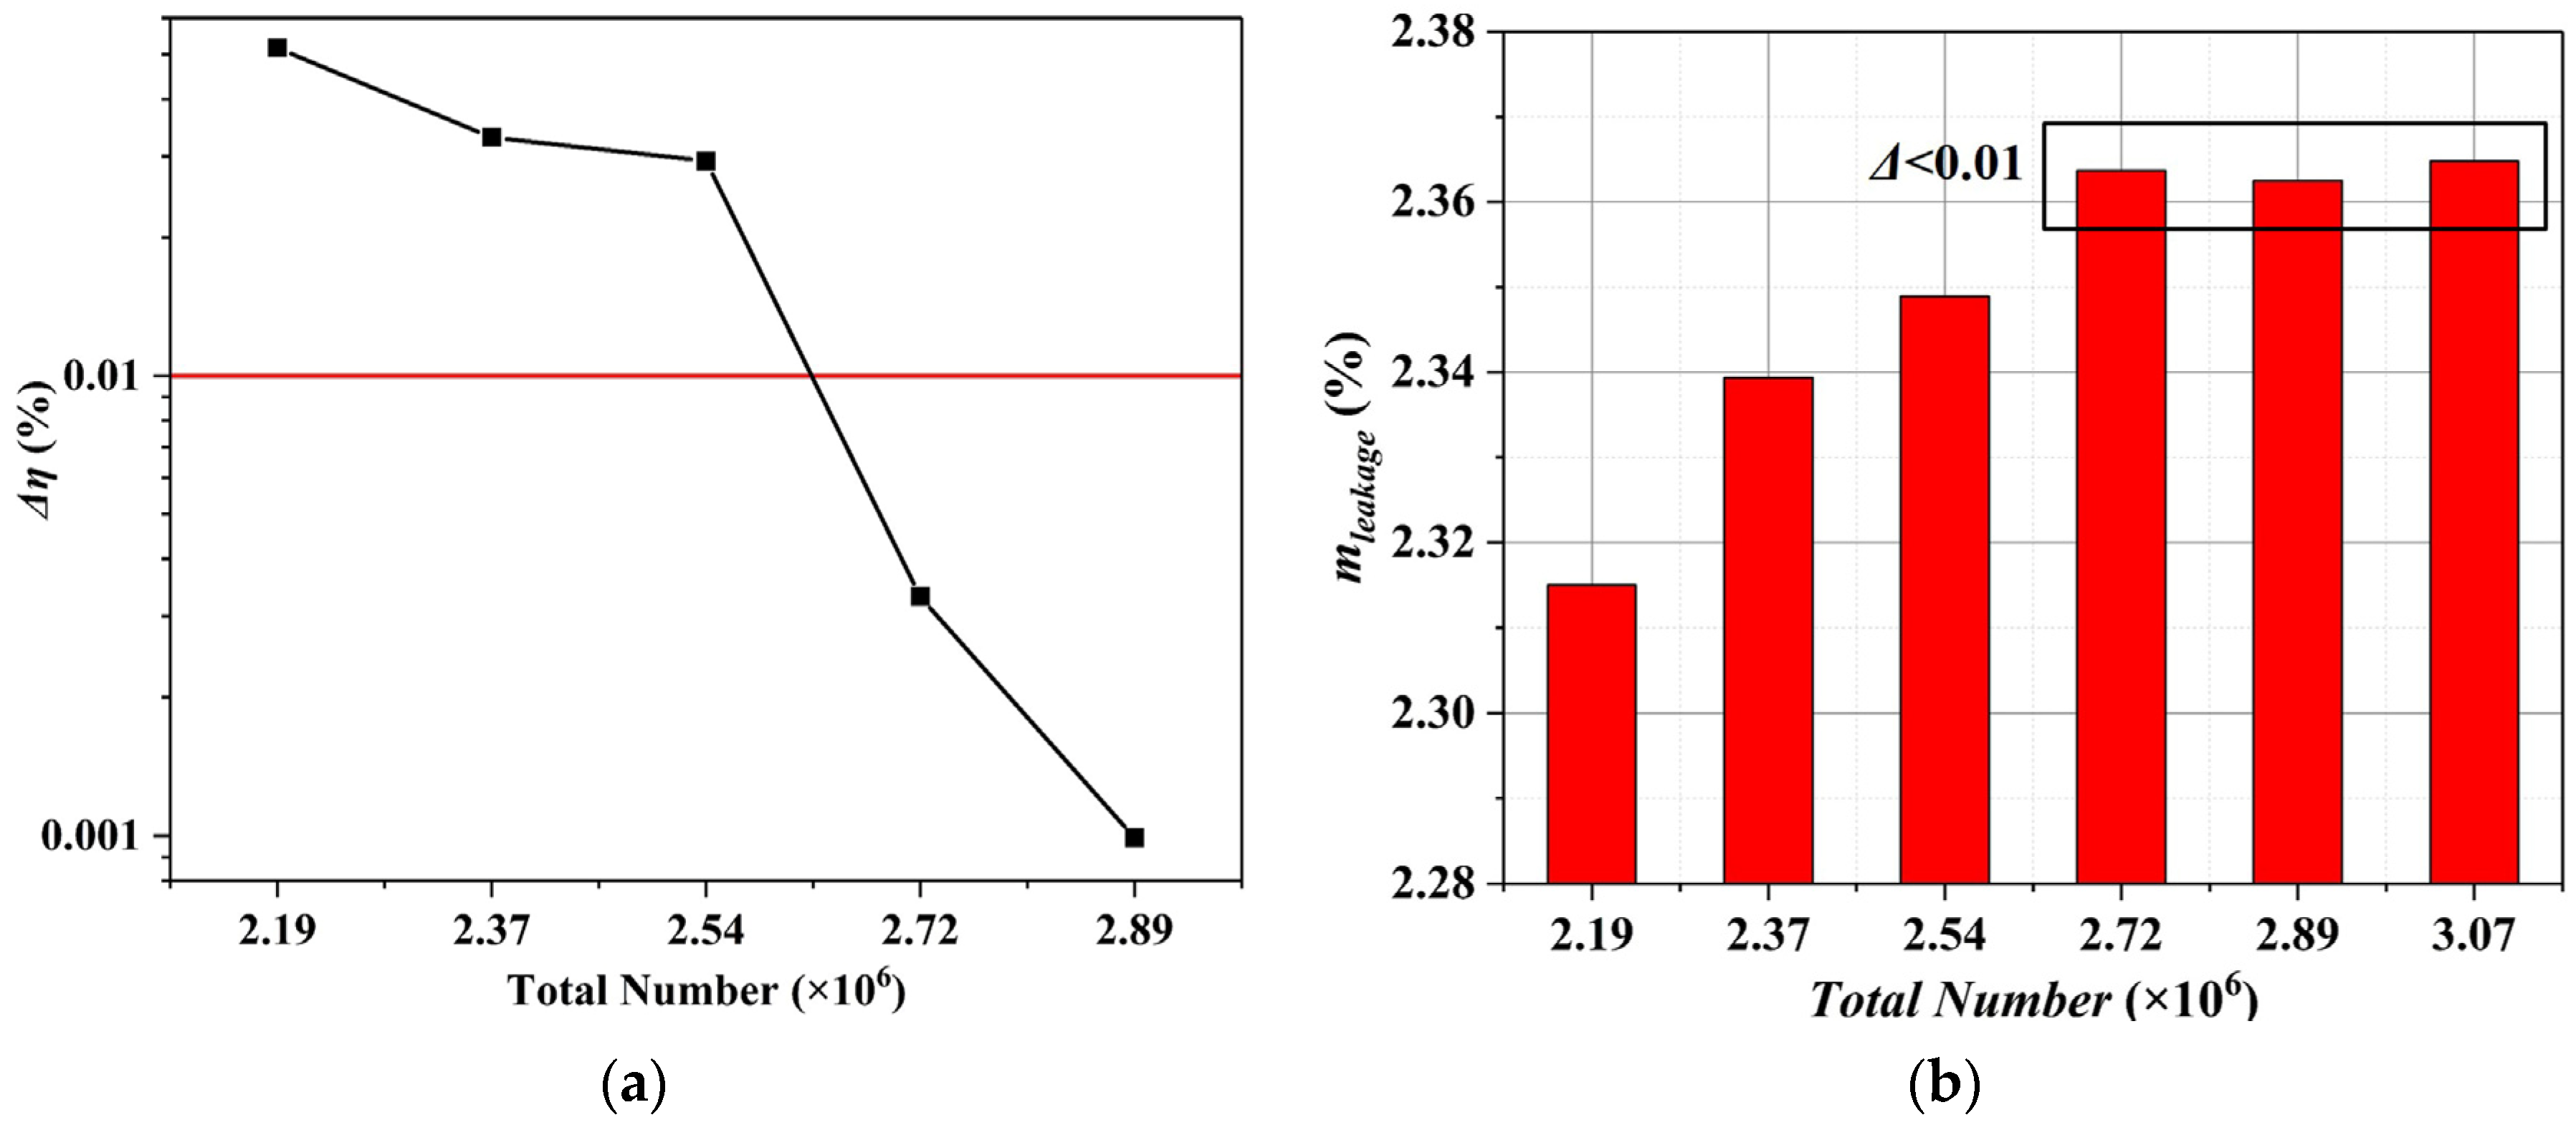
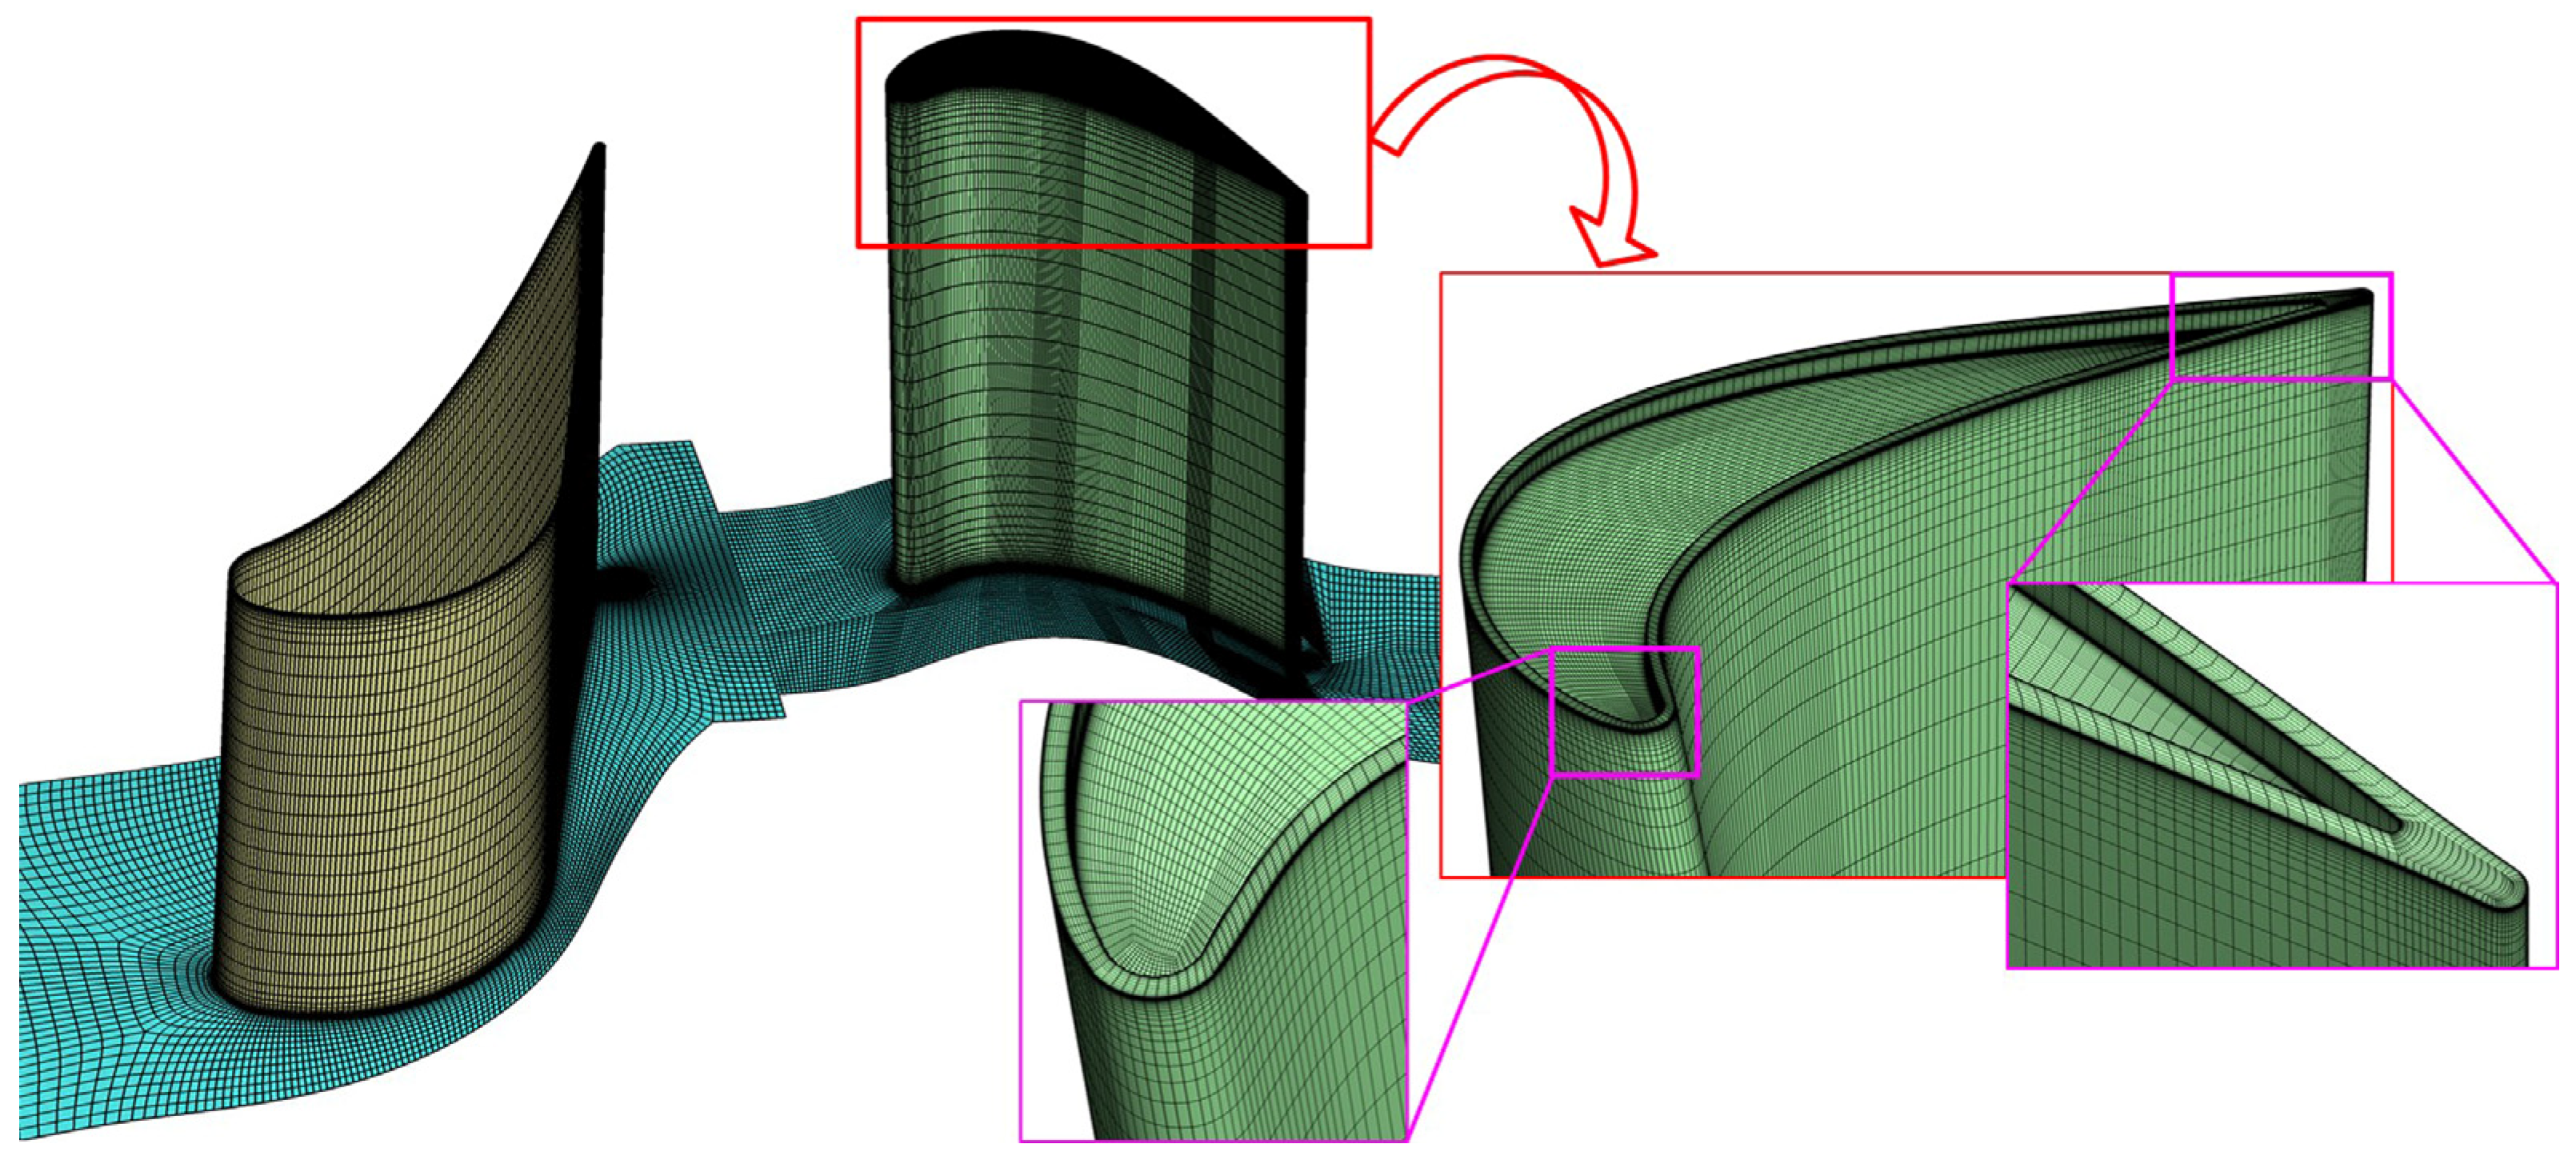
2.3. Mesh Generation and Independence Validation

Meshes of the stator and rotor domain are generated by the software Autogrid5 and ICEM CFD, respectively. Both stator domain and rotor domain are meshed with H4O topology. In addition, an O-shape topology is selected to mesh the region inside the clearance of rotor domain. The grid near the two blades and the grid details of the rotor tip are illustrated in Figure 2. The grid near the wall is locally refined, and the wall distance of the first mesh cell is set to 0.001 mm. The averaged Y+ of stator vane is about 2, and that of rotor blade is about 1, which has met the requirements of numerical methods used in this study. To avoid the unnecessary effects of different meshing methods on the numerical simulation results, in all the following cases, the mesh of stator domain remains fixed and the mesh topology of rotor domain remains unchanged.
Grid independence validation is performed in this paper to prevent the insufficient grid density from affecting the accuracy of the numerical results. Six kinds of cases with increasing number of grid cells are investigated to determine the radial mesh number in the clearance. The distributions of grids at different positions in rotor domains of six cases are shown in Table 2.
According to the numerical results, the variation in turbine stage efficiency (Δη) and the normalized tip leakage flow rate (mleakage) are presented in Figure 3. Here, Δη is the difference between the turbine stage efficiency of each case and that of Grid 6. In this paper, the turbine stage efficiency is the isentropic efficiency of turbine, which is defined as [28]:
η = h 0 * h 2 * h 0 * h 2 , i s *
When the grid number exceeds 2.72 × 10⁶, the change in the normalized tip leakage flow rate and turbine stage efficiency is less than 0.01%, which is negligible. This indicates that 32 grid cells in the spanwise direction of clearance are dense enough and does not affect the numerical results significantly. Thus, in all the following cases, the grid number in the spanwise direction of clearance is set to 32.
Grid independence validations in other directions are performed in the same way. The results show that the number of grids in the streamwise, pitchwise and spanwise directions of Grid 4 is large enough to meet the requirements of numerical accuracy. Thus, Grid 4 is selected in this study.

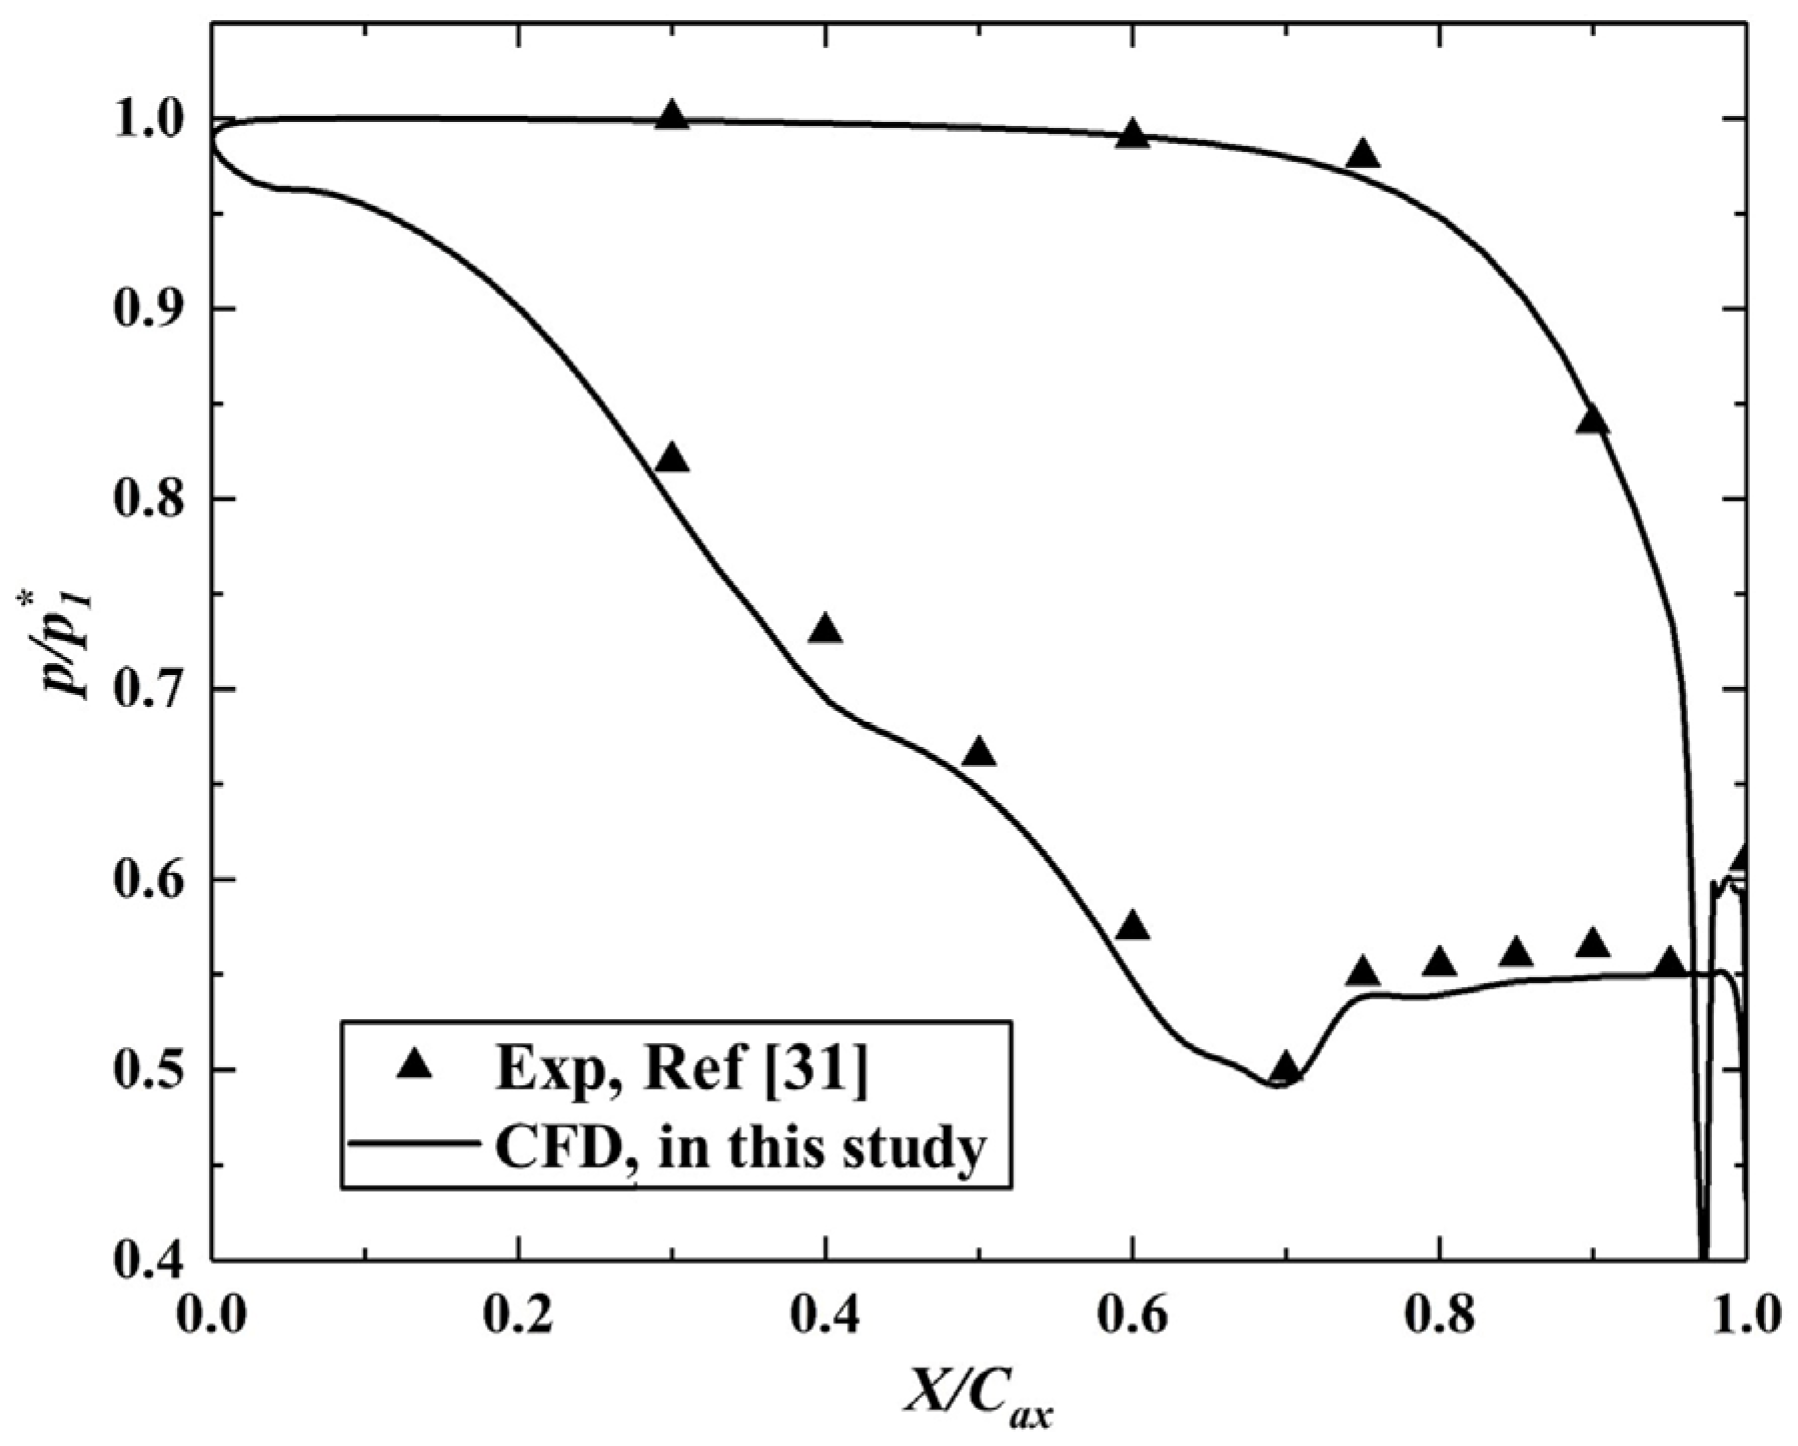
2.4. Numerical Validation

Previous studies of our team [29,30] have proved that the above numerical method can accurately predict the aerodynamic performance and flow field details under subsonic condition. Considering that there is transonic flow in this study, it is necessary to further validate the accuracy of the numerical method. Thus, the flow field in PW E3 high-pressure turbine is simulated by using the same numerical method.
According to the published data of PW E3 high-pressure turbine [31], the outlet relative Mach number of this turbine is 1.23, which indicates that it is also a transonic turbine. Moreover, the total-to-total pressure ratio of PW E3 high-pressure turbine is 4.0, which is close to that of the turbine used in this study. The flow characteristics in PW E3 are similar to the turbine in this study. Thus, it is acceptable to validate the numerical method by comparing the numerical results and published experimental data of PW E3.
The pressure distributions of blade tip section (90% span) obtained by numerical simulation and experiment are presented in Figure 4. The numerical results and experimental are in good agreement. In the region close to the APG, the boundary layer separation could occur [32,33]. In particular, the good agreement near the 0.7 Cax indicates that the numerical method in this study could accurately predict the separated flow under the adverse pressure gradient. In general, the numerical method and results in this study are reliable.

3. Results and Discussion

3.1. Aerodynamic Performance

The stage efficiency of turbine reflects the overall aerodynamic performance of a turbine. In this paper, the stage efficiency of turbine with flat tip is set as the baseline, and the efficiency increment of each case reflects the difference of aerodynamic performance, as illustrated in Figure 5. Obviously, no matter what the value of cavity width is, there is an optimal value range of cavity height, which is about 2.5–3.0 τ. With the decrease in the cavity width, the effect of cavity width on the turbine stage efficiency is more significant. When the cavity width reaches ‘width 5’, the turbine stage efficiency could be improved by about 0.14% by choosing the reasonable cavity height.
In Figure 5b, the variation in the turbine stage efficiency shows that there is also an optimal value of cavity width, which makes the aerodynamic performance best. The optimal value of cavity width is affected by the cavity height. When the cavity height is close to the optimal range, the optimal cavity width is about 10.0–10.5 τ. In addition, the greater the cavity height is, the greater the influence of cavity width on the turbine stage efficiency is. When the cavity height is 3.5 τ, the variation in the turbine stage efficiency caused by cavity width could be about 0.09%. The cavity height has a more significant effect on the turbine stage efficiency relative to cavity width.

3.2. Effect of Cavity Width

The influence of cavity width on turbine aerodynamic performance has been described above. To reveal its influence mechanism, this section will gradually analyze it from three different perspectives: loss distribution characteristics, flow characteristics in the passage and the characteristics of TLF.
When the cavity height is 2.5 τ, the aerodynamic performances of six cases with different cavity widths are significantly different. In addition, to present the effect of cavity width on flow field and loss more clearly, three cases with cavity width of ‘width 1’, ‘width 5’ and ‘width 6’ and cavity height of 2.5 τ are analyzed in the remainder of this section.

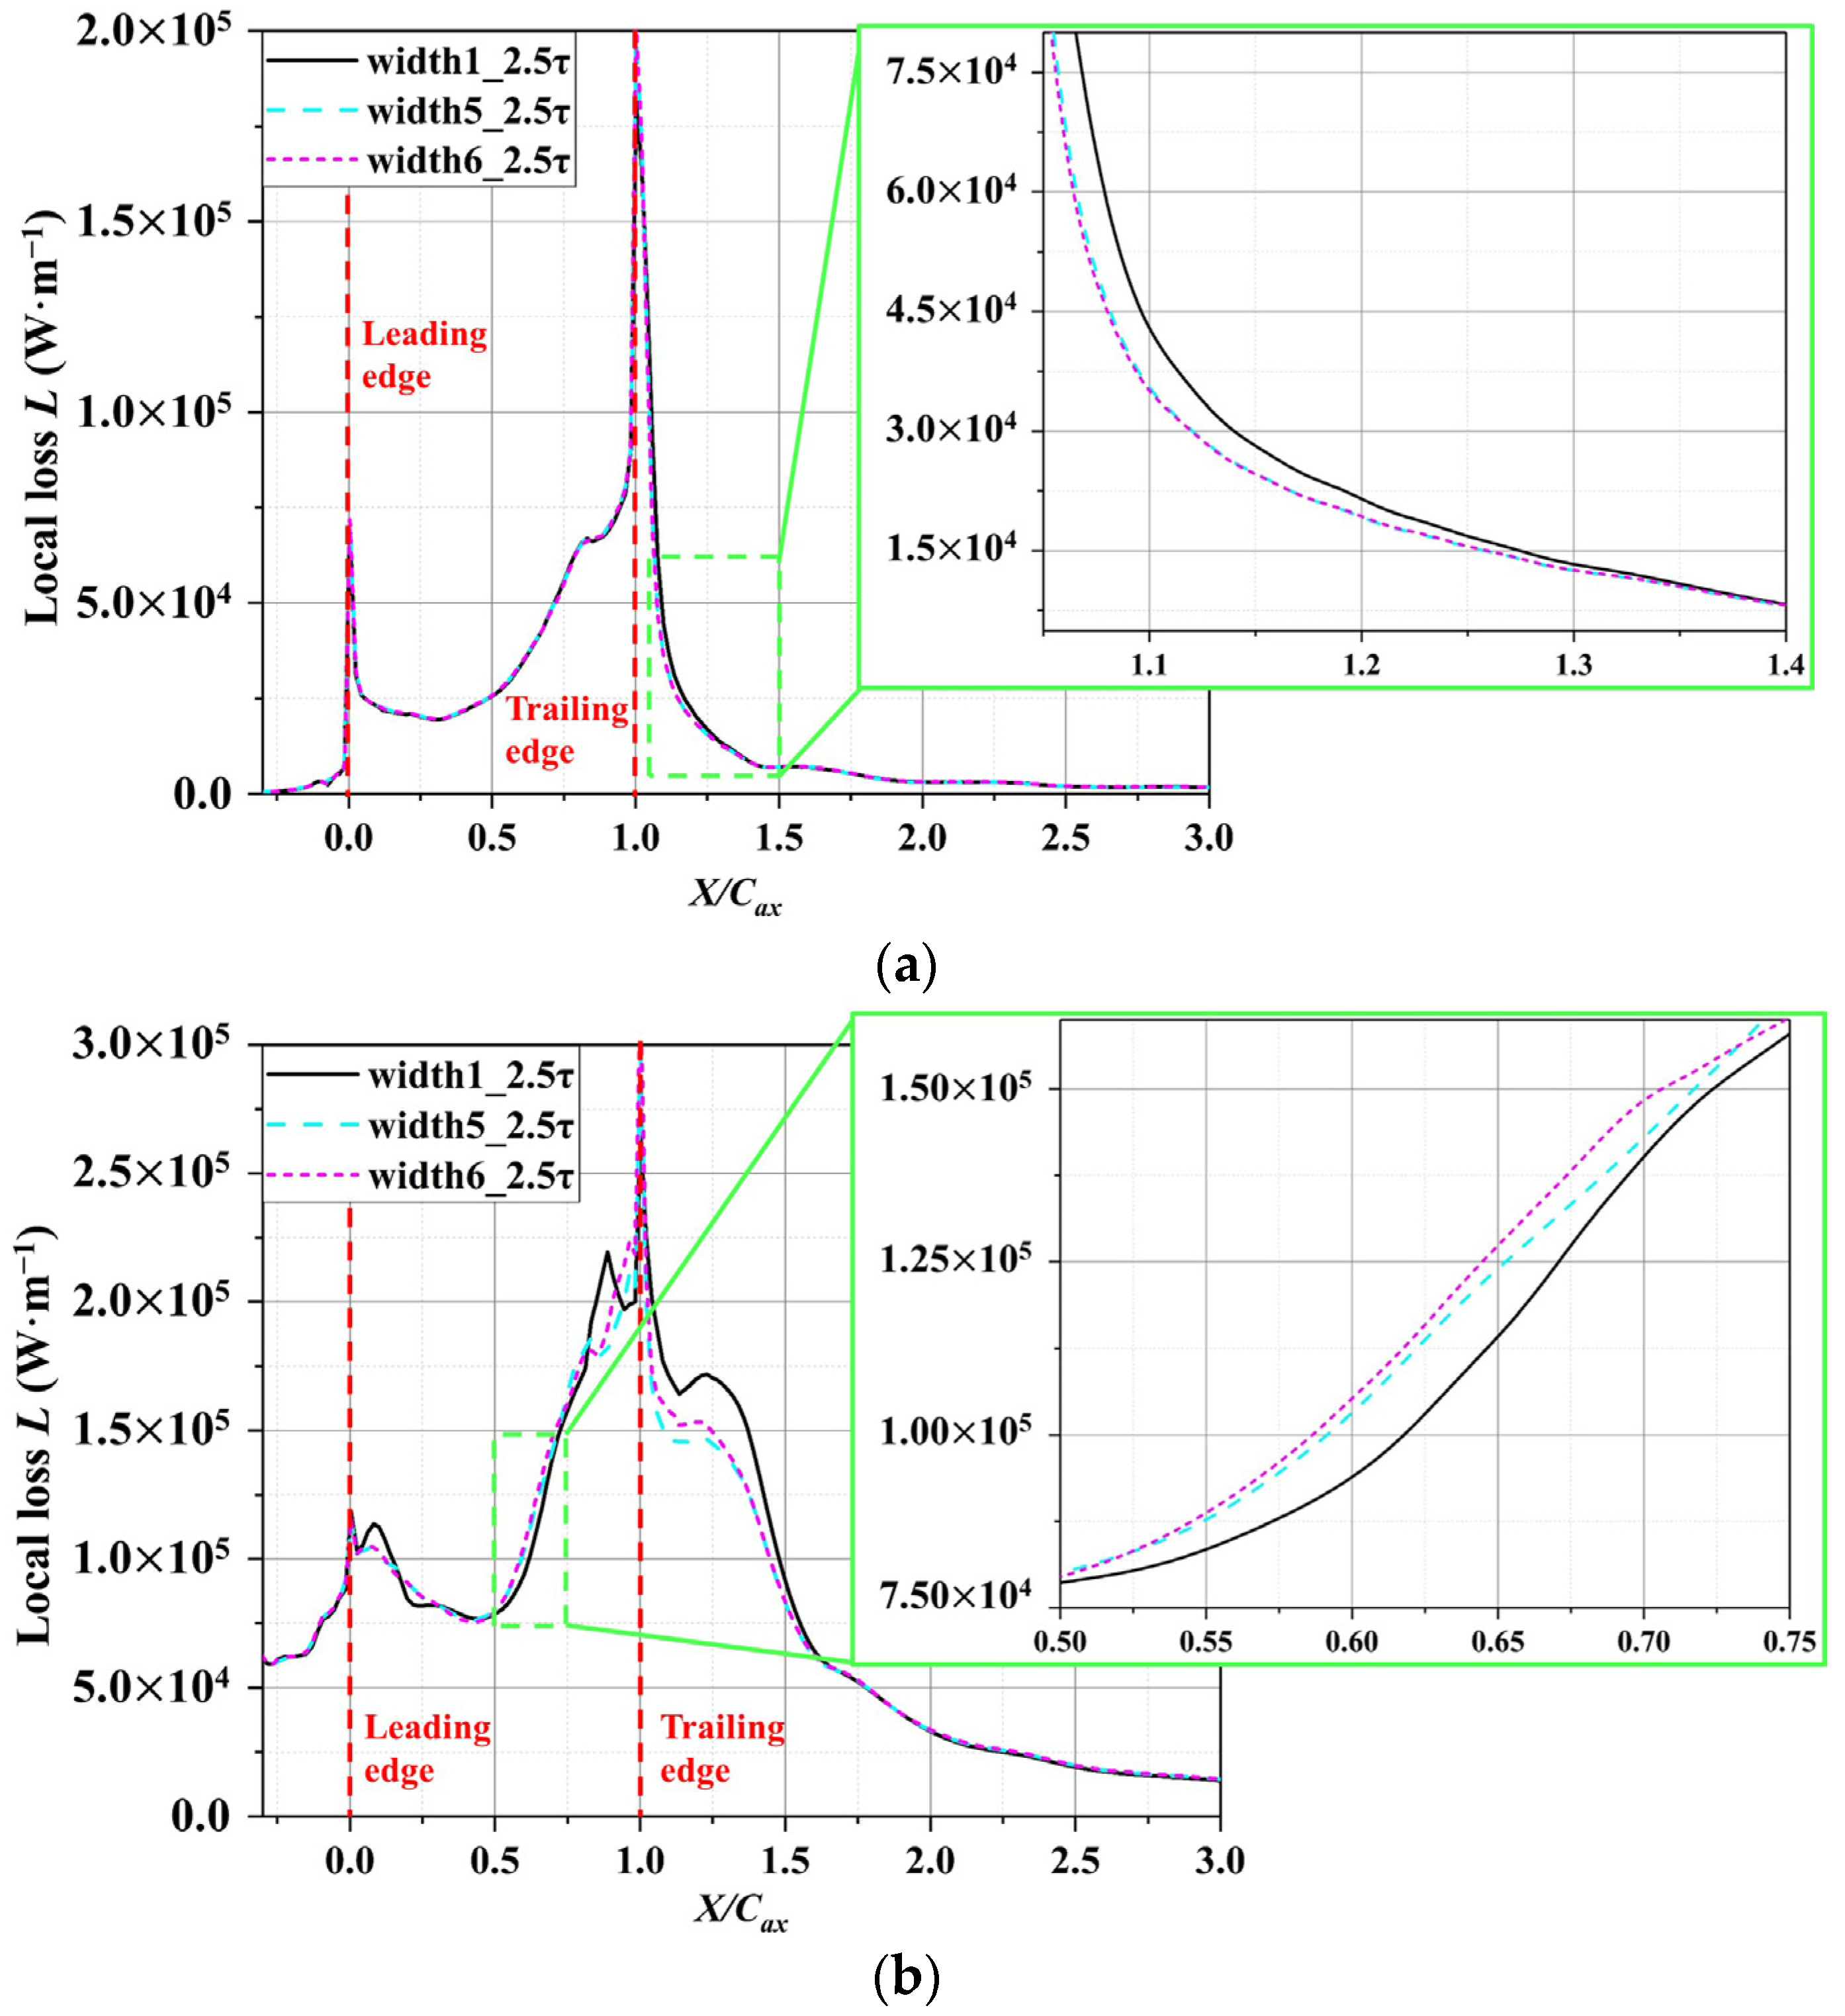
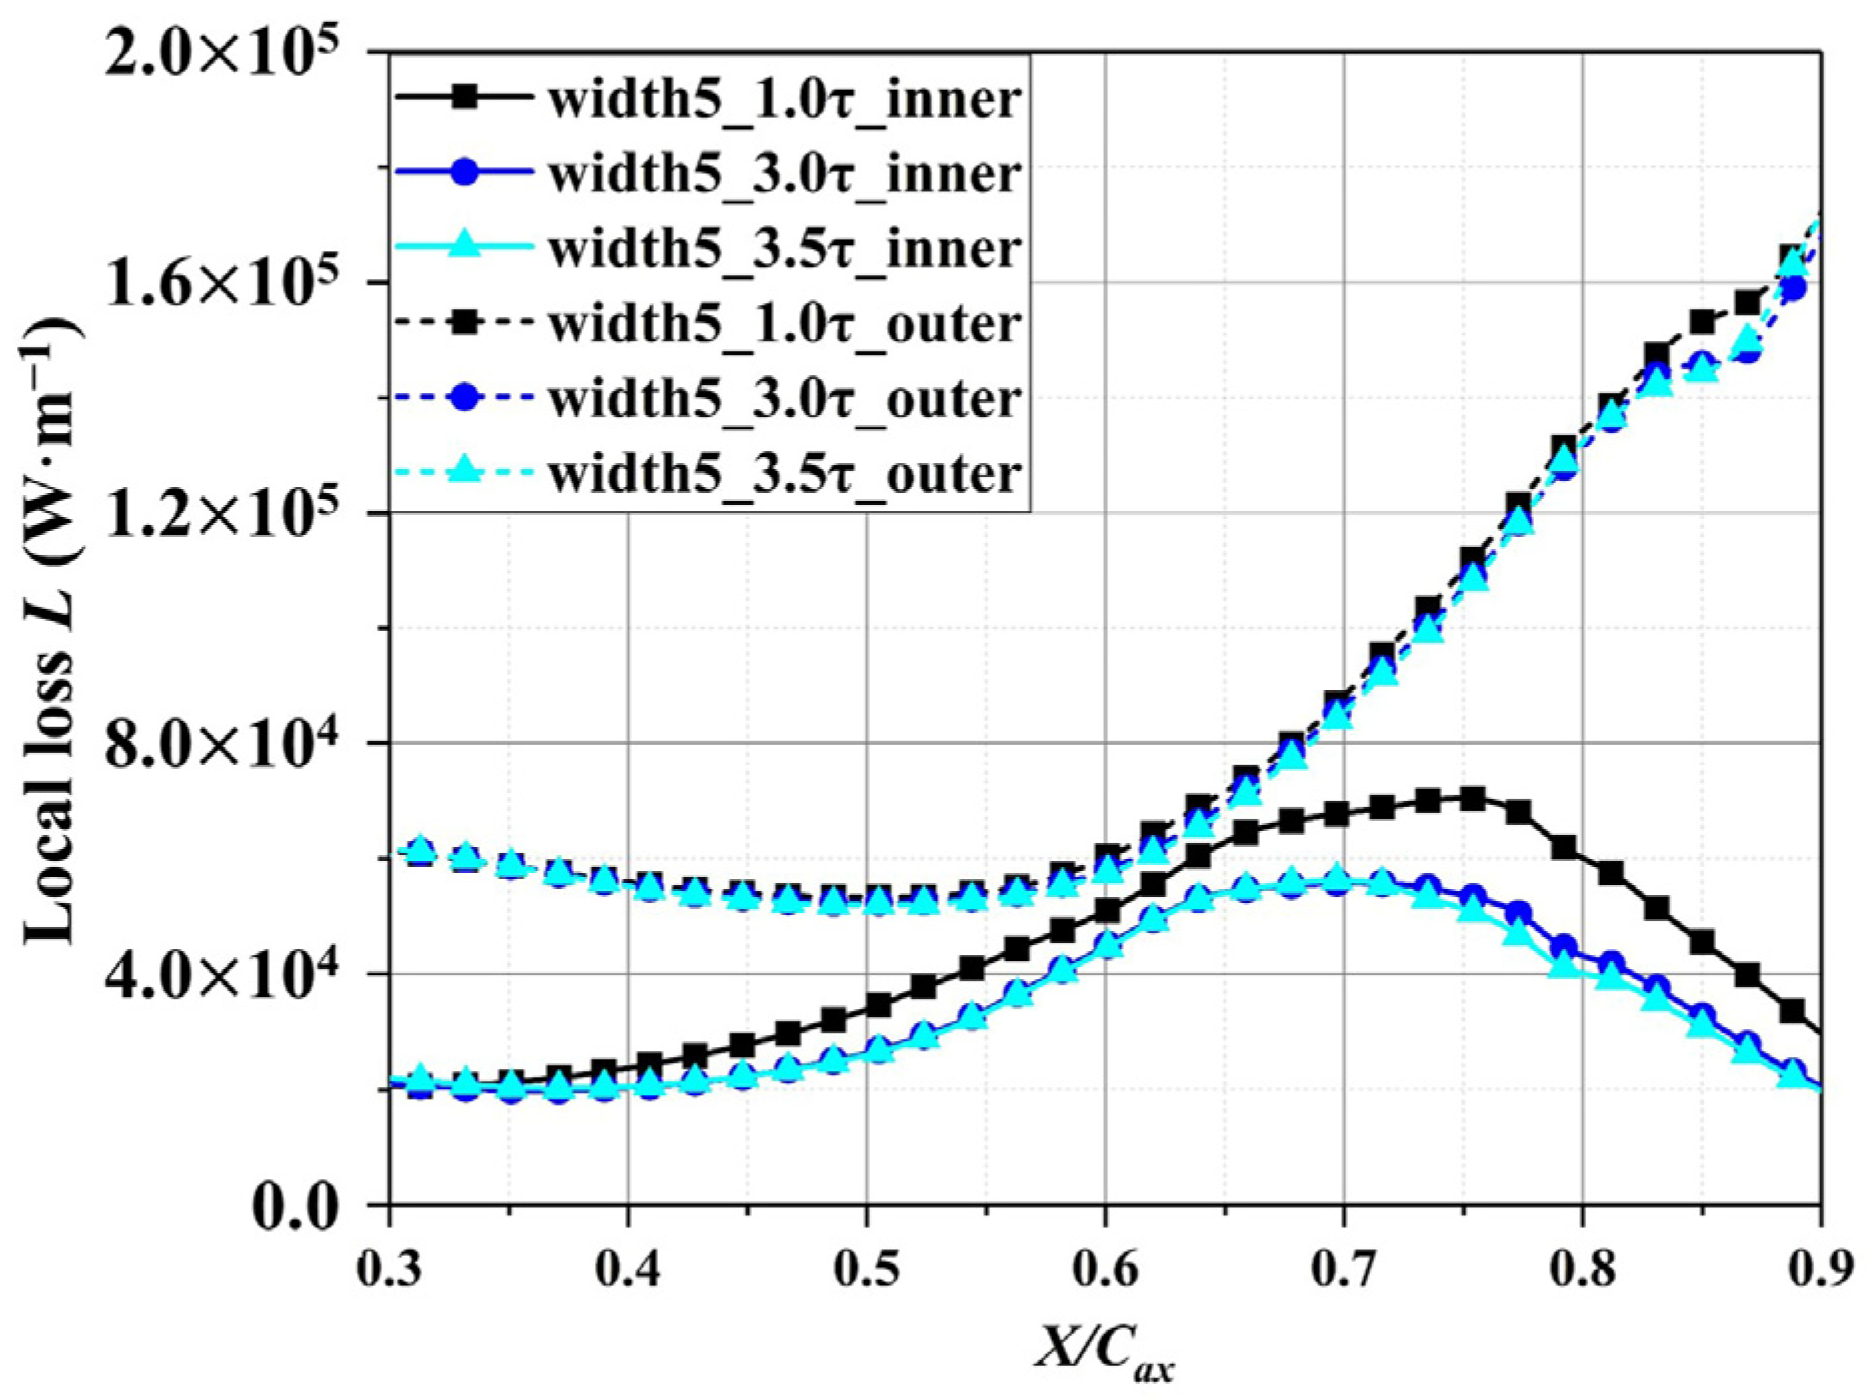
3.2.1. Analysis of Aerodynamic Loss

Before revealing the influence mechanism of cavity width on aerodynamic performance, it is necessary to determine the differences of loss distribution caused by the change of cavity width to clarify its action area. The dissipation function Φ represents the work term by the viscous force of fluid to resist the deformation, which irreversibly converts the mechanical energy of the fluid to the thermal energy. It can measure the local mixing loss caused by the viscous shear of fluid. In this paper, it is used to measure the loss caused by TLF. The dissipation function can be obtained according to the following equation [34]:
Φ = μ eff 2 ( u i x j + u j x i ) 2 2 3 μ eff ( u i x i ) 2
where μ eff is the effective viscosity. The effective viscosity is the sum of dynamic viscosity and eddy viscosity. By integrating the dissipation function Φ on different sections, the local loss L on the section could be obtained, as follows:
L = A Φ d A
where A is the area of the integral region.
It is well known that the tip geometry mainly affects the flow field and loss of the upper half span of the rotor blade. Therefore, in this paper, the dissipation function Φ in the region over 50% span of different axial sections are integrated, as presented in Figure 6a. In addition, the upper half blade span could be divided into two regions, which are dominated by TLV and upper passage vortex (UPV), respectively, as shown in Figure 6b. The boundary between the two regions is about 80% span.
First, the distribution of local loss along the axial direction in the range of 50–80% span is presented in Figure 7a. In the channel (0.0–1.0 Cax), cavity width has few effects on the loss in the range of 50–80% blade span. In the early stage of the formation of TLV, most of the TLF is involved in the TLV, which is difficult to have a significant impact on the flow field and loss in the range of 50–80% blade span. Downstream of trailing edge, UPV dissipates rapidly under the influence of the adverse pressure gradient (APG) near the trailing edge. Thus, the loss decays rapidly at the 1.0–1.5 Cax. In addition, the interaction between TLV and UPV in this axial range is obvious, and the mixing loss in this region will change significantly with the variation in TLV. This is why there are obvious differences in the losses of the three cases with different cavity widths in this axial range. When the cavity width changes from ‘width 1’ to ‘width 5’, the loss decreases significantly, which means that the mixing between TLV and UPV is weakened. This is most likely caused by the weakening of TLV.
To reveal the effects of cavity width on TLV and its loss, Figure 7b shows the distribution of local loss along axial direction over 80% blade span. With the decrease in the cavity width, the loss in the channel increases slightly, which indicates that larger cavity width (‘width 1’) could inhibit TLF better. It should be noted that the composition of loss in the channel over 80% span is extremely complex, which could be roughly divided into the loss inside the clearance and the mixing loss outside the clearance. The causes of loss variation in this region will be analyzed in detail later.
Here, more importantly, the most significant loss variation occurs within the half of axial chord length (Cax) downstream of the trailing edge of rotor blade. When the cavity width decreases from ‘width 1’ to ‘width 5’, the aerodynamic loss in this position decreases significantly. However, as the cavity width further decreases to ‘width 6’, the loss of this position increases slightly. Thus, it can be inferred that the loss in this axial range is affected by two mechanisms. One may be the mixing of TLV and main-flow, which may be larger with the decrease in cavity width. The other is not clear, and needs further analysis on flow field to confirm. However, it could be determined that the loss caused by this mechanism could be reduced with the decrease in cavity width.

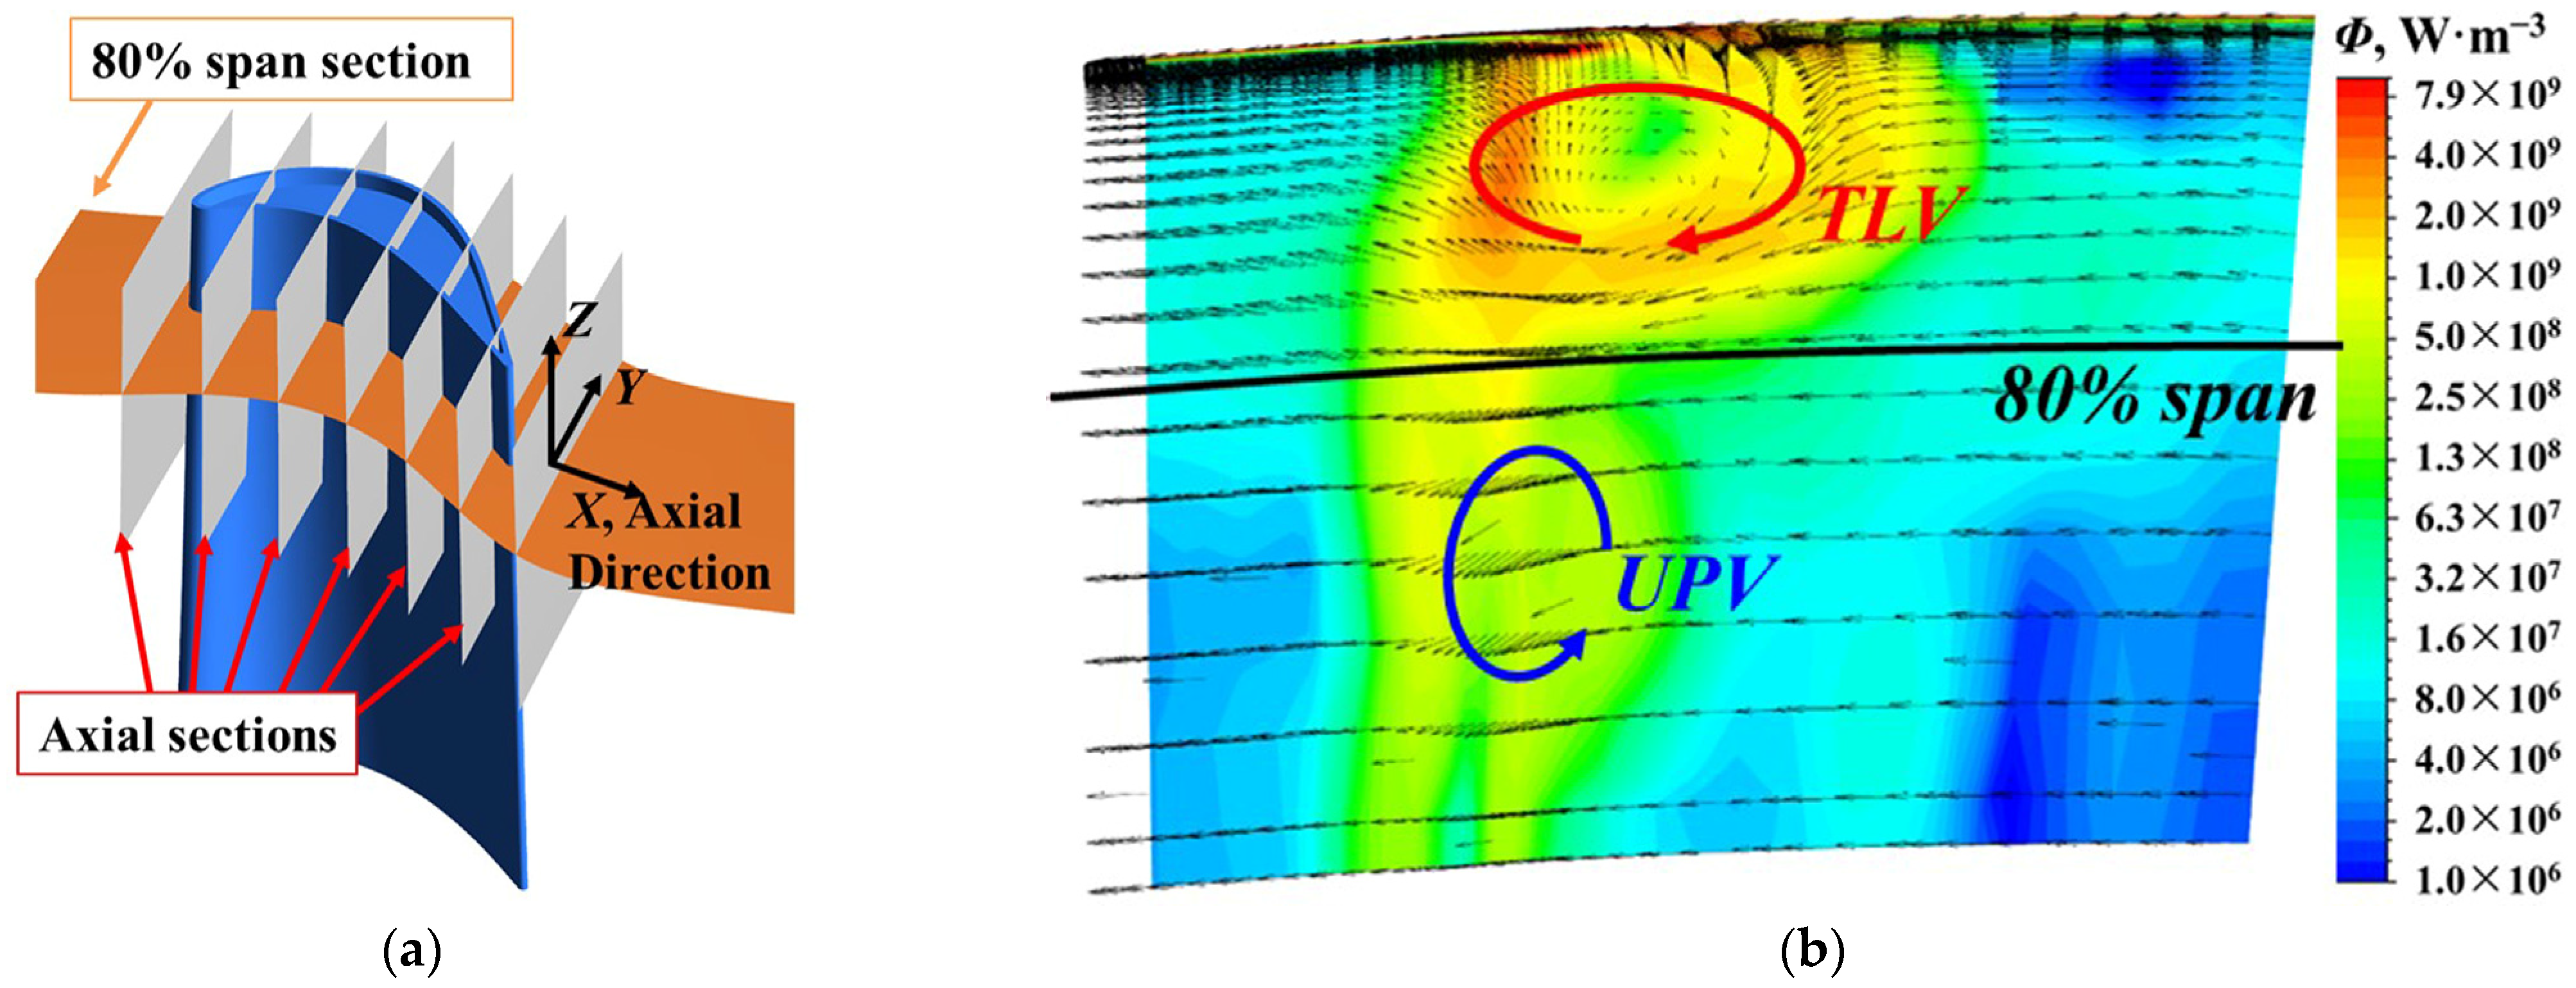
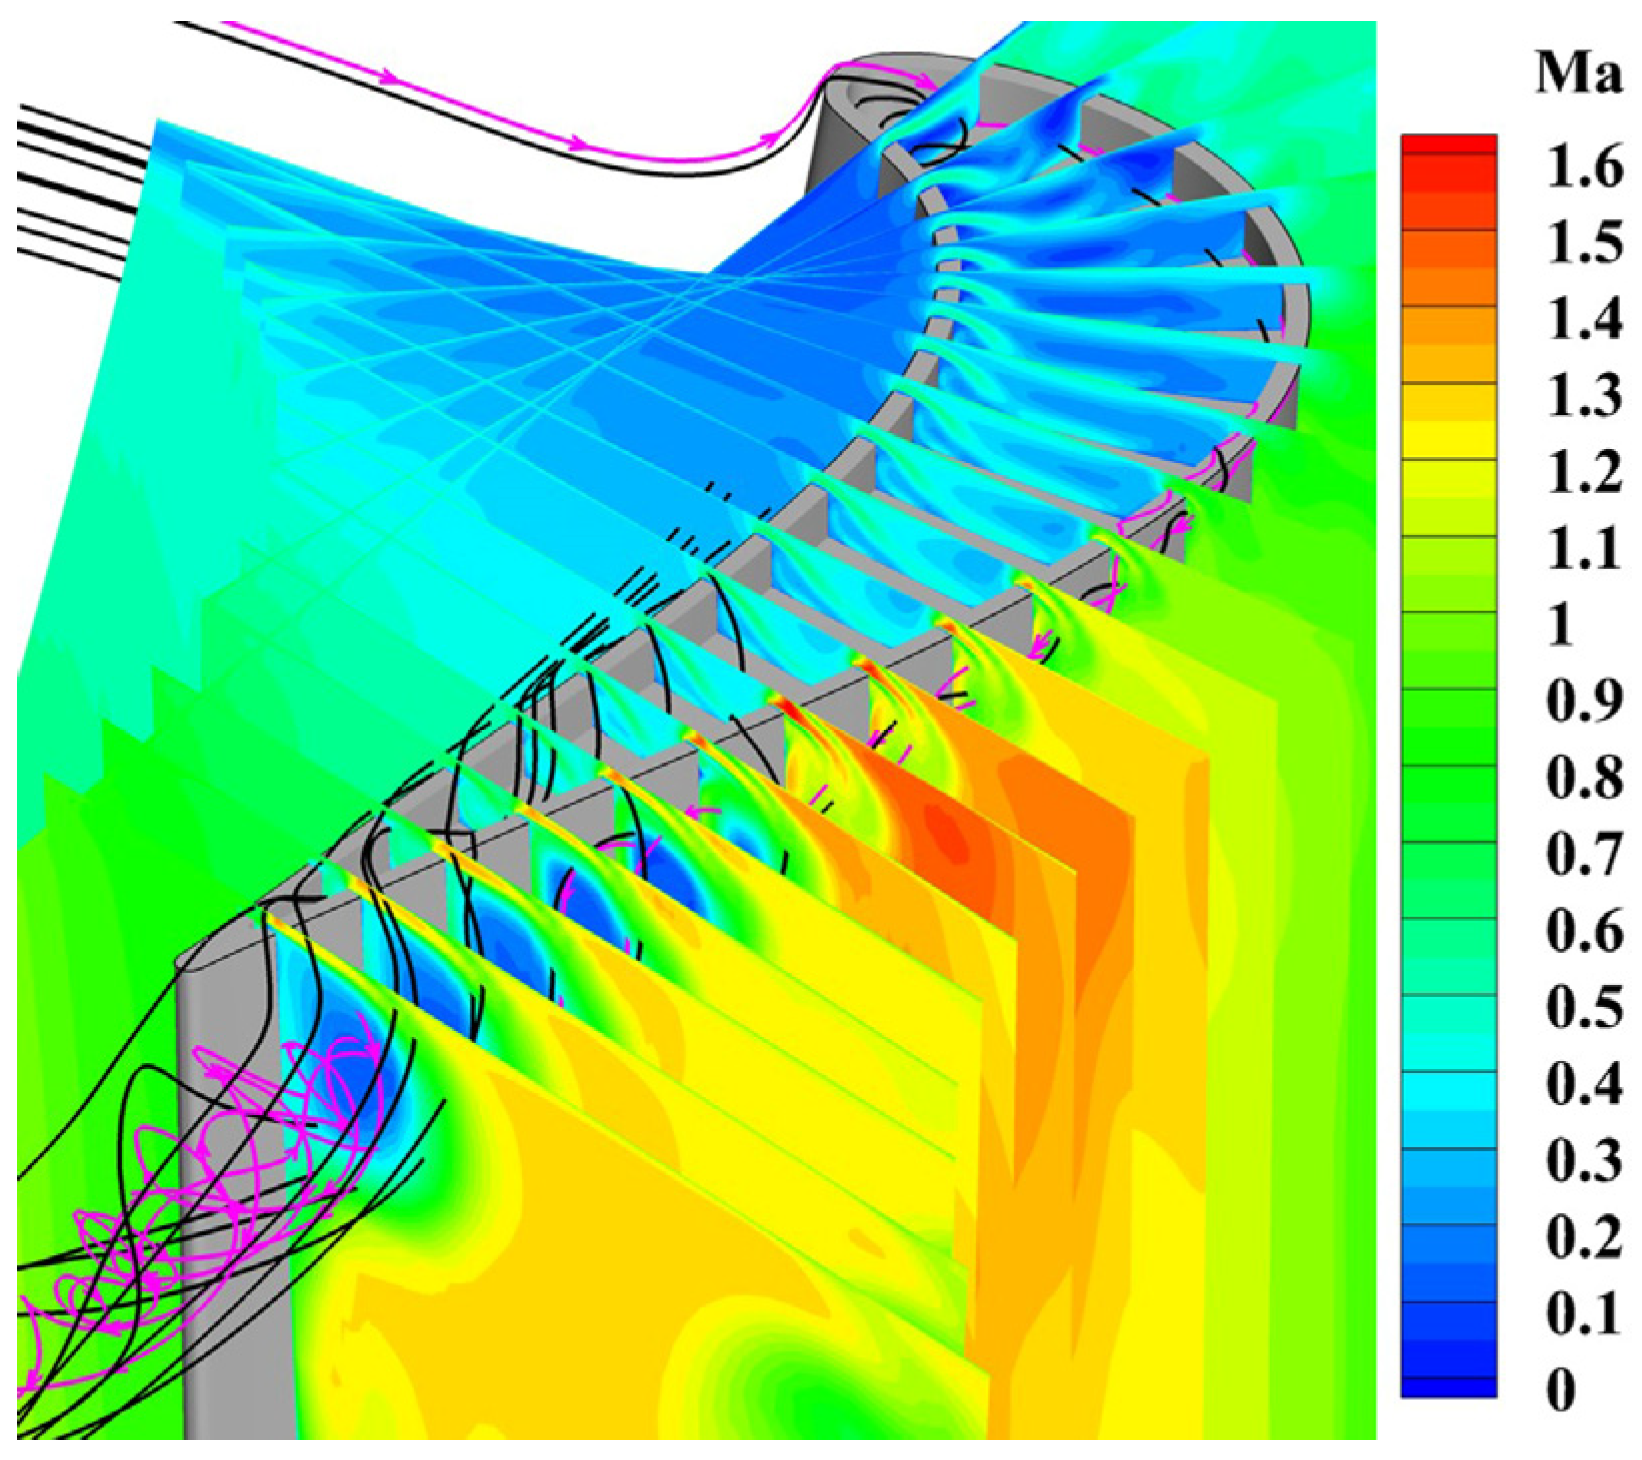
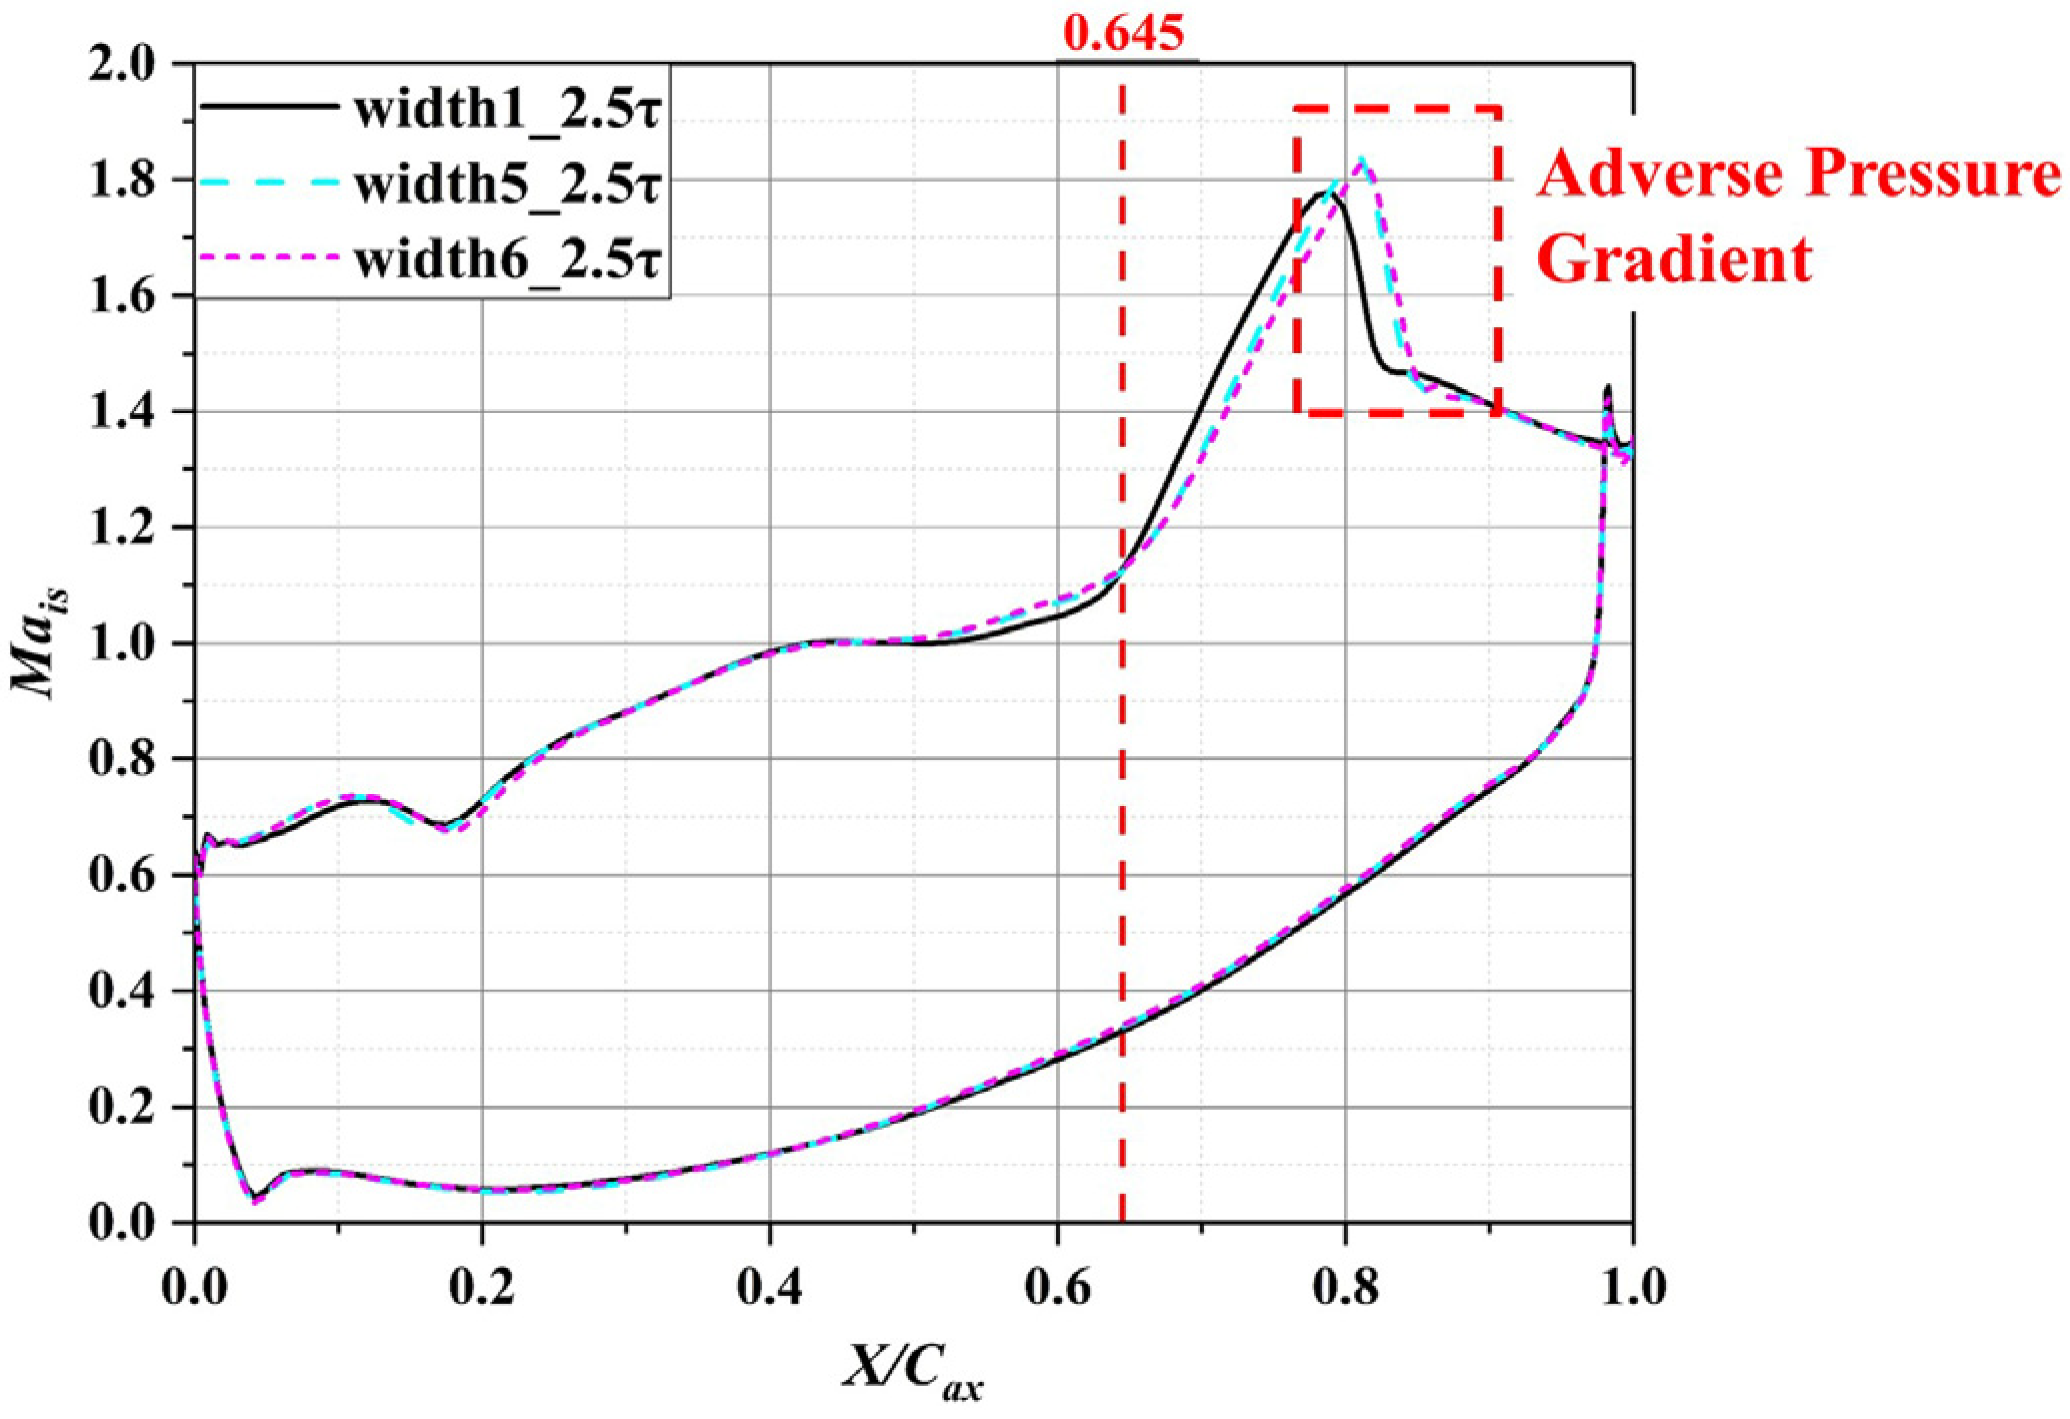
3.2.2. Characteristics of Flow Field in the Passage

To reveal the mechanisms of loss in the tip region downstream of trailing edge, Figure 8 illustrates the distribution of Mach number on different sections in the tip region, as well as the streamlines. The Mach number downstream of the throat drops sharply under the effect of shock wave. Downstream of the shock wave, the backflow of the fluid in the TLV core implies the breakdown of TLV. The breakdown of TLV could cause extra mixing loss inside the vortex core [23].
According to the previous analysis, there are two different mechanisms causing the loss, one of which is the mixing loss between TLV and main-flow. Through the analysis of flow field in the tip region, it could be determined that another loss mechanism is the breakdown of TLV.
The most significant characteristic caused by the TLV breakdown is the backflow in the vortex core. To obtain the location where the TLV breakdown occurs, the reverse flow regions of three cases are shown in Figure 9. Here, the reverse flow regions are identified by the iso-surface with streamwise velocity (VS) of 0 m/s, and are colored by streamwise vorticity (ωS). Streamwise velocity and streamwise vorticity are defined as follows:
V S = V a cos θ V c sin θ
ω S = ω a cos θ ω c sin θ
where, the subscript a and c represent the axial component and circumferential component, respectively. θ is the velocity flow angle of main-flow. The breakdown of TLV leads to the rapid decrease in vortex intensity in the reverse flow region, so the streamwise vorticity in this area is small in all the three cases.
The starting location, ending location and axial length of reverse flow regions are summarized in Table 3. From ‘width 1’ to ‘width 5’, the axial length of reverse flow region is reduced significantly, which indicates that the TLV breakdown is restrained. Correspondingly, the loss in the range of 1.0–1.5 Cax is reduced sharply, as shown in Figure 7b. When the cavity width is less than the value of ‘width 5’, the inhibiting effect of decreasing the cavity width on the TLV breakdown appears obvious as marginal effect, and the corresponding loss has only a small change.
To reveal the cause of this change, a preliminary understanding on vortex breakdown is necessary. According to the quasi-cylindrical vortex stability theory of Hall [35], the vortex breakdown could be affected by the APG.
To measure the APG, Figure 10 shows the isentropic Mach number (Mais) distribution at 95% blade span, which reveals the effect of cavity width on blade loading. The isentropic Mach number is defined as [28]:
M a is = 2 γ 1 [ ( p ref * p ) γ 1 γ 1 ]
where, γ is the ratio of specific heat, and p ref * represents the reference total pressure, which is equal to the maximum static pressure on the blade surface.
At the position of 0.5–0.645 Cax downstream of the leading edge, the pressure of suction surface decreases with the decrease in cavity width. At the position of 0.8 Cax, there is a strong APG caused by the shock wave, leading to the breakdown of TLV. With the decrease in the cavity width, the position where the APG appears moves downstream, but the APG is intensified significantly. The delayed occurrence of strong APG results in the corresponding delay of TLV breakdown, which is consistent with the data described in Table 3.
In summary, smaller cavity width could delay the occurrence of APG and restrain the breakdown of TLV, resulting in the reduction of extra mixing loss caused by vortex breakdown.

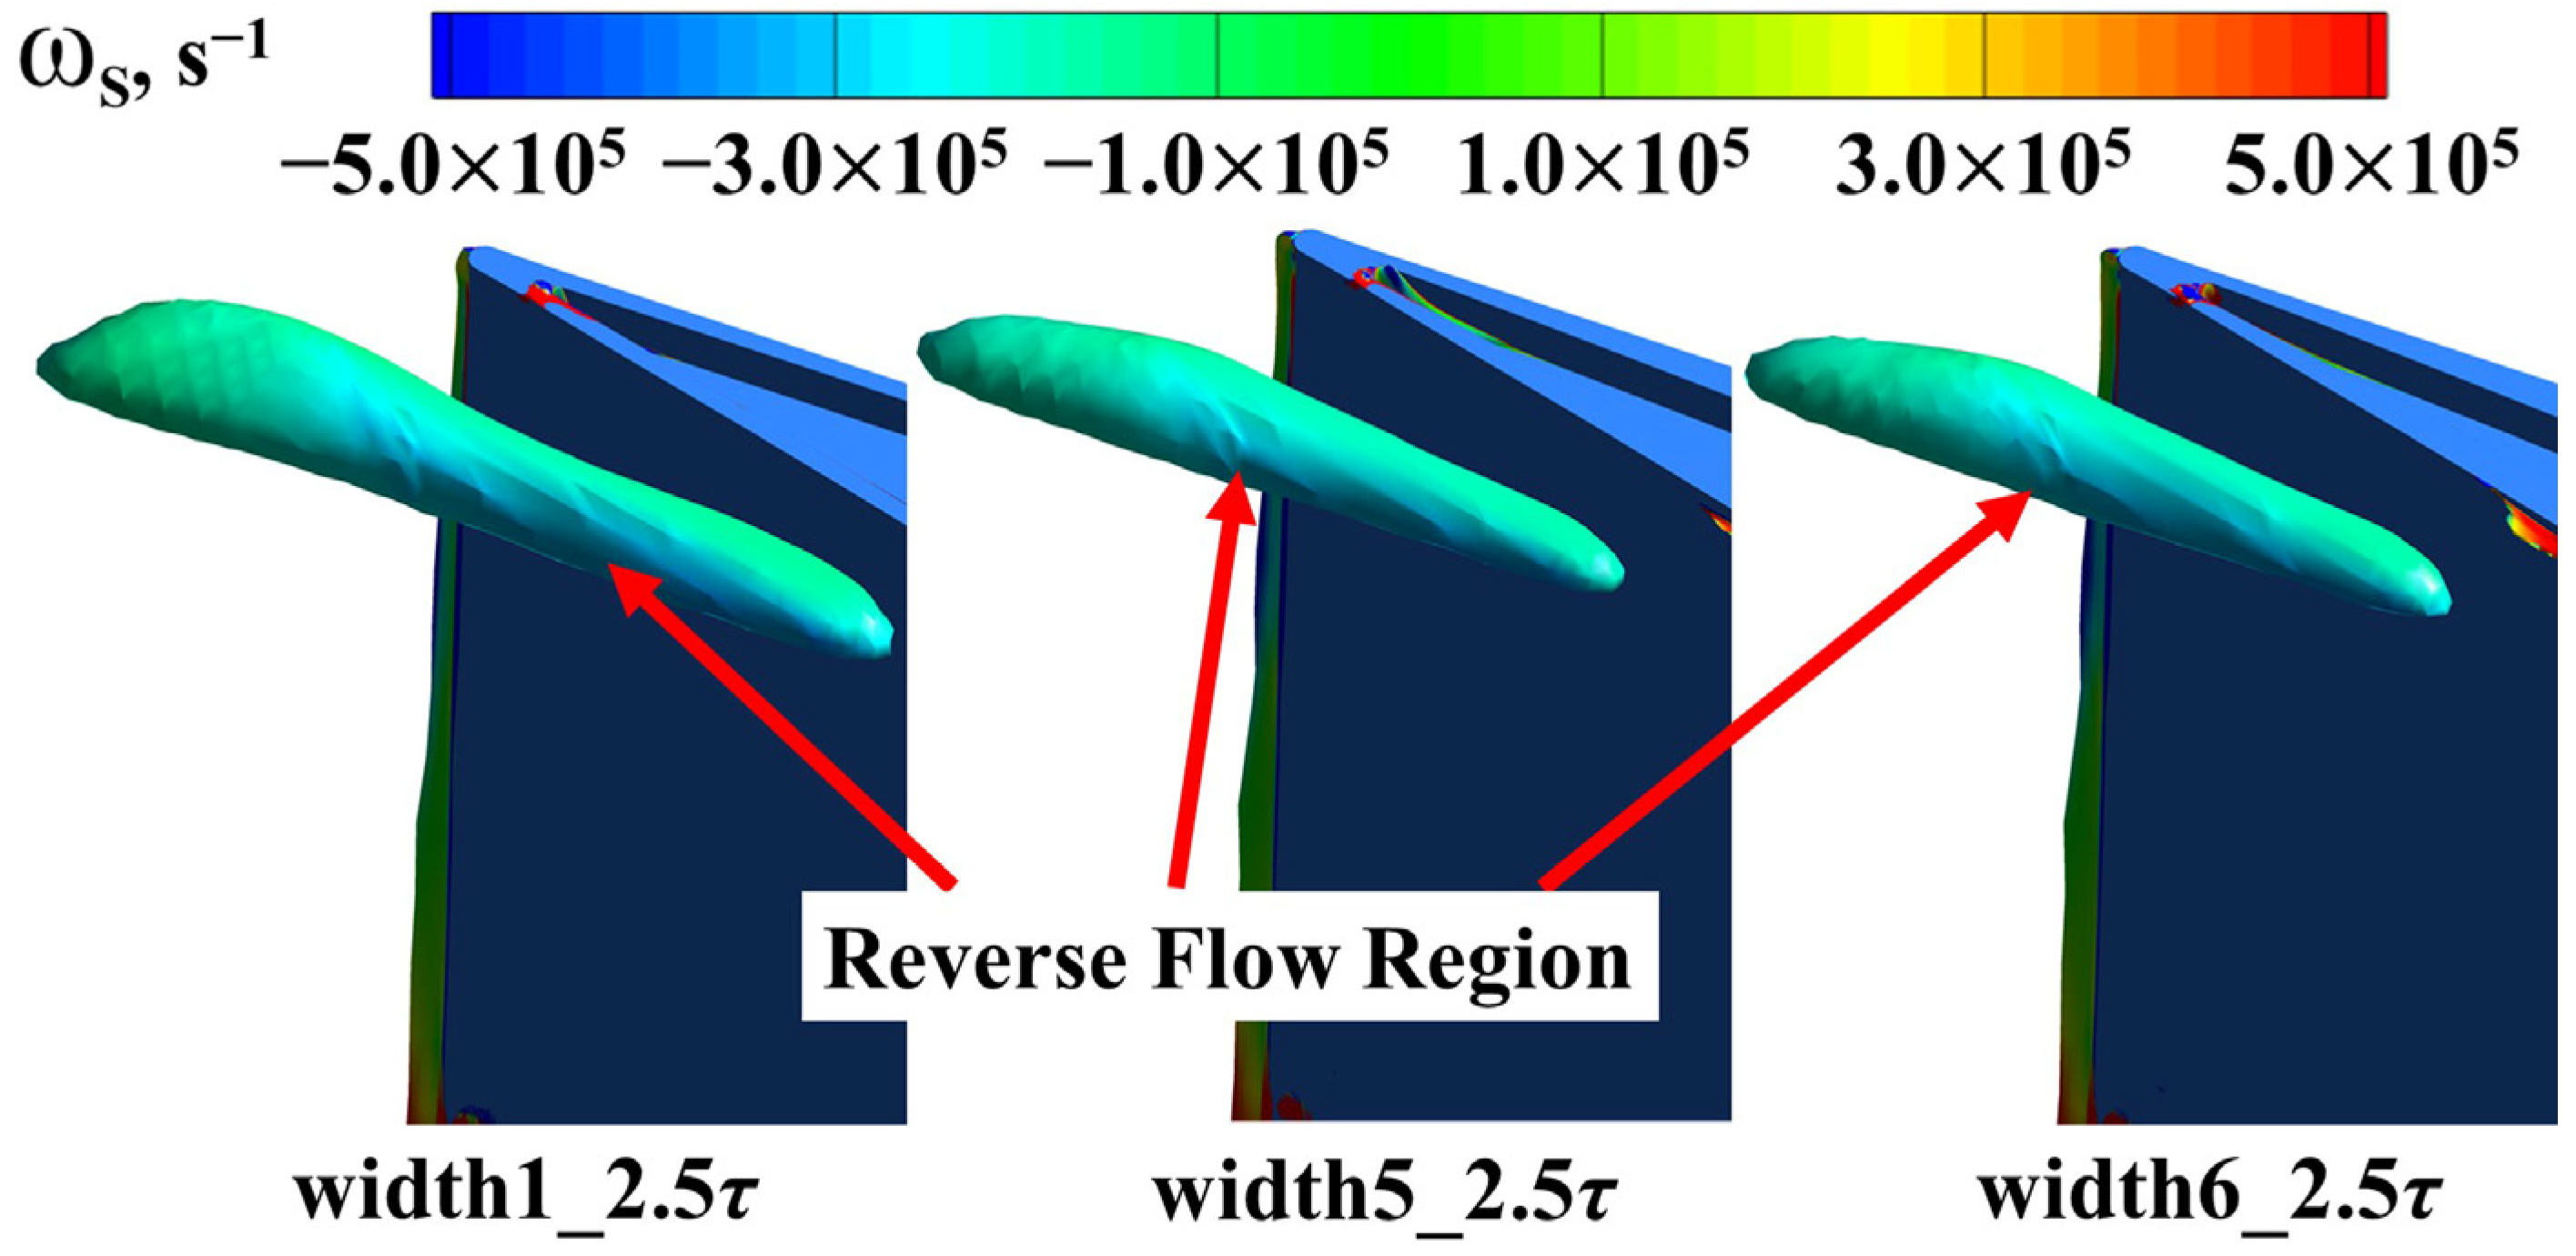
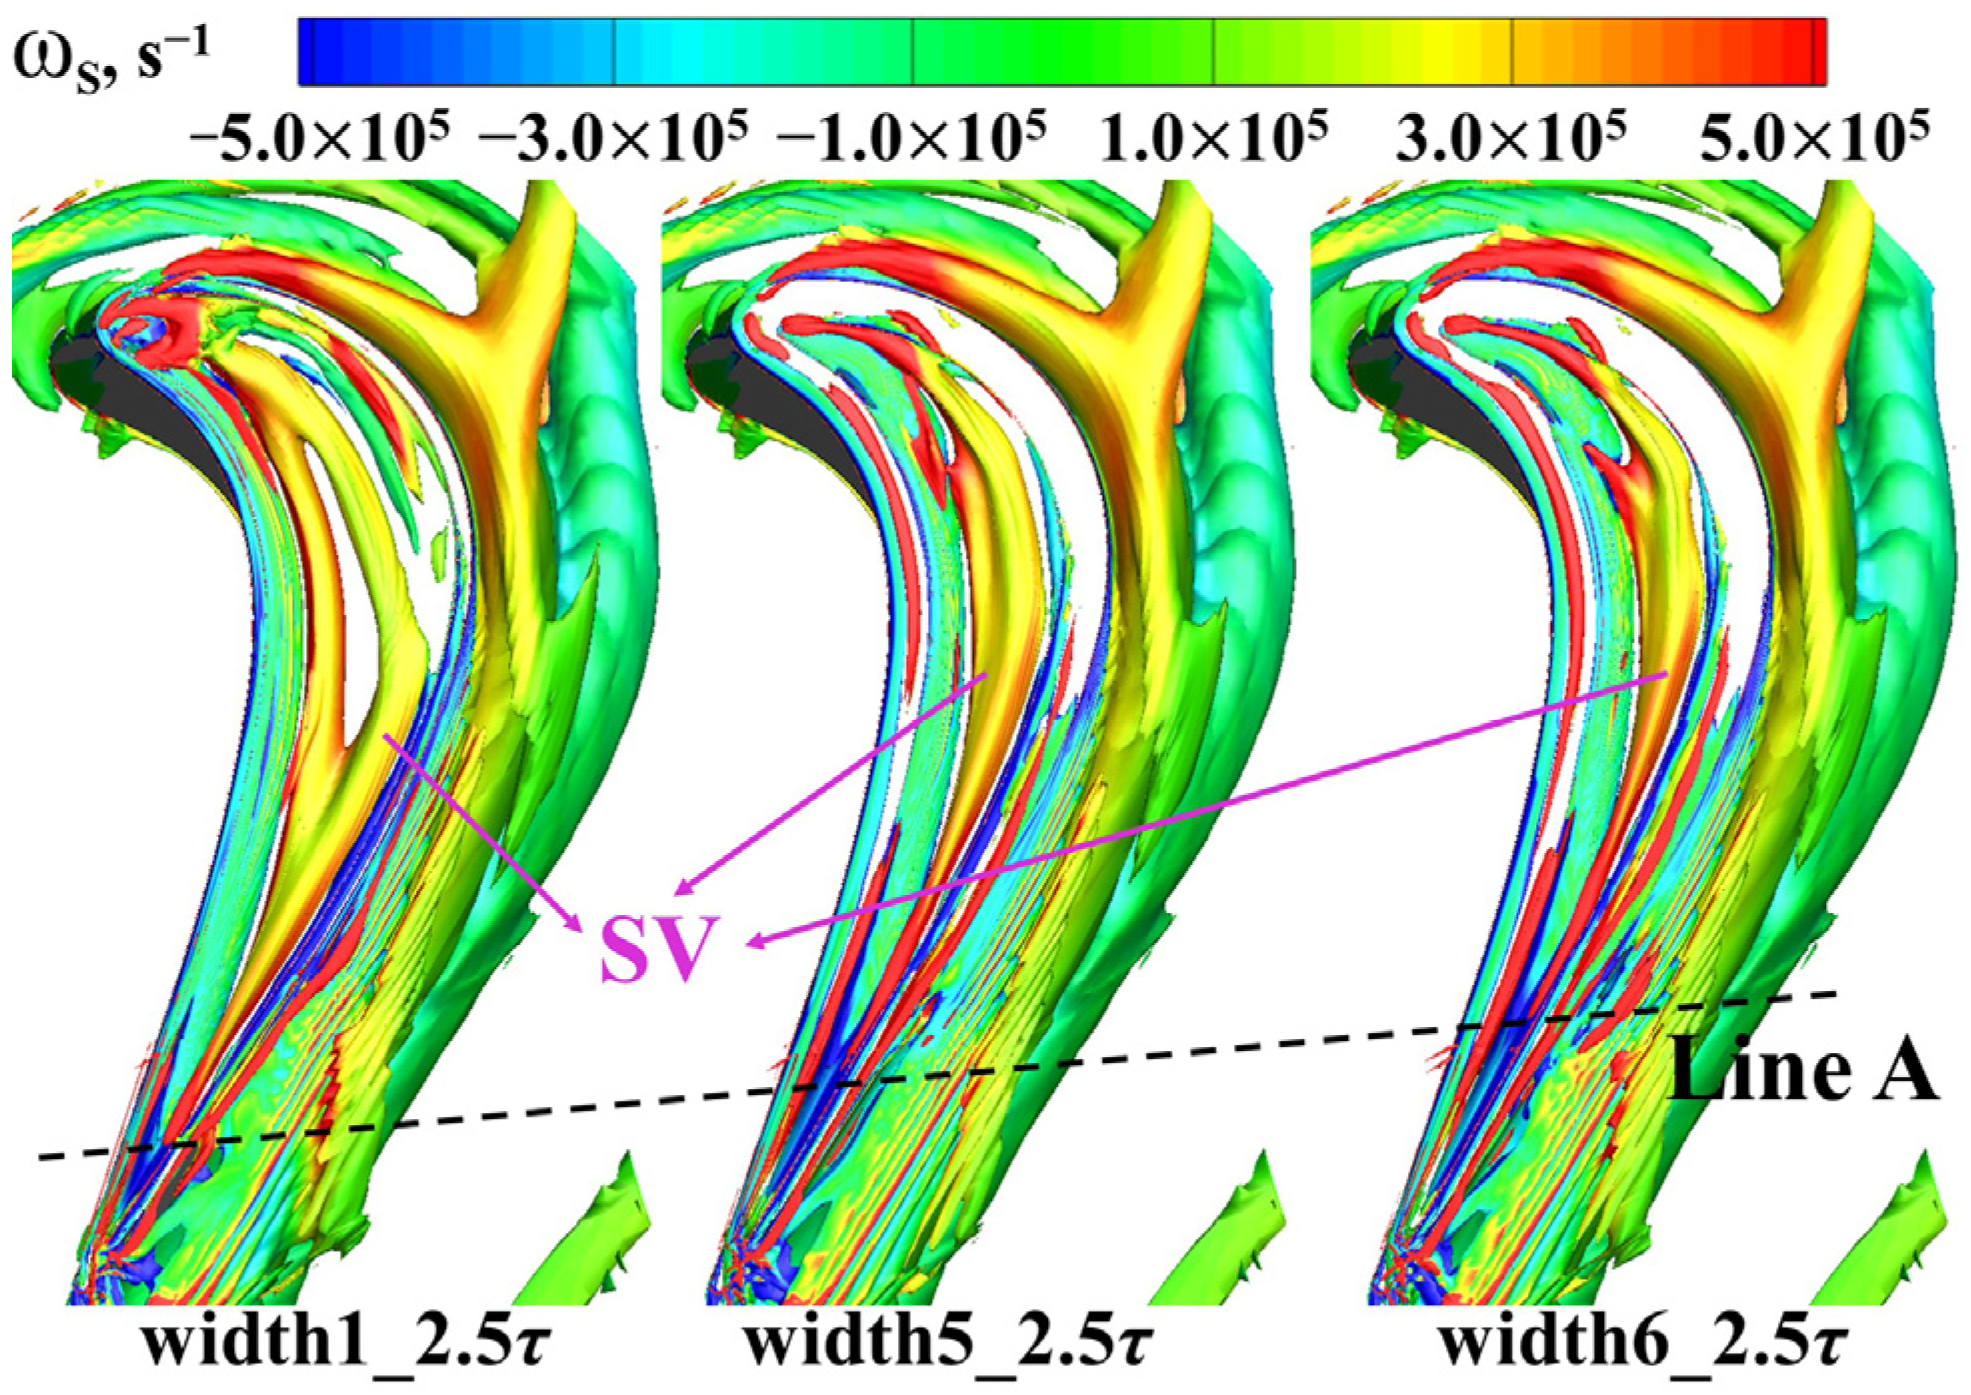
3.2.3. Analysis of Tip Leakage Flow Characteristics

According to the above analysis, it could be sure that the reduction of loss at the position of 1.0–1.5 Cax in Figure 7b is caused by the variation in TLV breakdown. However, the mechanism of loss increase at the position of 0.5–1.0 Cax, and the effects of cavity width on TLF is not clear. Hence, it is necessary to further analyze the vortex structures and loss distribution characteristics in the channel and clearance.
There are complex vortex structures in the tip region, which could affect the tip leakage loss significantly. To get further insight into the TLF and its loss, it is necessary to obtain a more accurate distribution of vortex structures by adopting the Liutex method [36,37]. The Liutex method can eliminate the contamination caused by strong shear near the boundary layer [38].
The vortex structures inside the cavity are shown in Figure 11. Here, vortices are identified by the Liutex method and visualized using Liutex iso-surface (Liutex = 4 × 10⁴). The iso-surface is colored by streamwise vorticity (ωS) to reflect the strength of shear visually. The SV could form an aero-labyrinth like a sealing effect on the TLF and is the most noteworthy vortex structure in the cavity [15]. With smaller cavity width, the distance between the SV and the suction side rim in the front part of the cavity decreases obviously. The blocking effect of SV on TLF is essentially caused by the interlocked labyrinth seal structure formed by SV, suction side rim and pressure side rim. As an aero-labyrinth tooth, the SV is close to the suction side rim, which is equivalent to the reduction of the spacing between labyrinth teeth, blocking the TLF better. Therefore, with smaller cavity width, the blocking effect of cavity on the TLF in the front part of the cavity could be enhanced.
As mentioned in previous study [38], vorticity reflects vortex strength and part of the shear strength. So, the relative intensity of vorticity on the same Liutex iso-surface reflects the relative strength of shear at different positions. It is worth noting that the streamwise vorticity of SV increases gradually with the decrease in cavity width, which indicates stronger shear and greater loss in case of ‘width 6’.
In addition, ‘Line A’ in the figure is the connecting line of the position where the SV disappears in the cavity. Obviously, with the decrease in the cavity width, the chord-wise length of the SV shortens significantly. The blocking effect of the region without the SV on the TLF will decrease sharply.
Figure 12 shows the distributions of leakage rate and normal momentum of the TLF at the clearance outlet along the streamwise direction. The definitions of clearance inlet and outlet surface are shown in Figure 13.
The corresponding positions of the three troughs (black dash line) of leakage rate per unit area (mpa) in the figure are exactly the positions where the SVs disappear. Before the SV disappears, the distance between the SV and the suction side rim will decrease gradually, enhancing the blocking effect on the TLF and diminishing the leakage rate. After the SV has disappeared, the sealing effect decreased sharply and the leakage rate increased rapidly. It can be found that at the upstream of 60% streamwise position, the leakage rate decreases with the decrease in cavity width. Figure 12b shows the distribution of normal momentum (mVn) of TLF along the streamwise direction. The distribution characteristics of normal momentum are affected by the SV inside the cavity and similar to that of leakage rate. Therefore, it is proved that the decrease in the cavity width could improve the blocking effect on the TLF in the front section of the cavity.
Combined with the above analysis, theoretically, the mixing loss caused by TLF should decrease with the decrease in cavity width, while the loss distribution at the position of 0.5–0.75 Cax in Figure 7b shows that this is not the truth. In the further analysis, the loss inside and outside the clearance is distinguished and presented in Figure 14. Thereinto, the local loss inside the clearance is calculated by integrating the dissipation function Φ over the region inside clearance shown in Figure 13. Moreover, the loss outside the clearance is another part of the loss in the area above 80% span except the loss inside the clearance. The mixing loss outside the clearance decreases with the decrease in cavity width, while the mixing loss inside the clearance increases significantly, leading to the increase in the total loss in the channel at this axial region.
To sum up, smaller cavity width could enhance the blocking effect in the effective region where there is an SV, but can reduce the chordwise span of the effective region. From the perspective of controlling the TLF, the small cavity width is not conducive to restraining the leakage rate, and could cause the increase in the loss. From the perspective of the development of TLV, the small cavity width is conducive to restraining the breakdown of TLV and reducing the extra loss caused by it. Therefore, on the whole, there is an optimal value for cavity width, as mentioned in the last section. For the turbine studied in this paper, the optimal cavity width is about 10–10.5 τ.

3.3. Effect of Cavity Height

Three cases with cavity width of ‘width 5’ and cavity height of 1.0 τ, 3.0 τ, and 3.5 τ are selected to reveal the control mechanism of cavity height on TLF and loss. Figure 15 illustrates the distribution of local loss over 80% blade span along the axial direction. With larger cavity height, the loss in the range of 0.3–0.95 Cax has been decreasing. This indicates that the development of TLV in the channel is restrained and the corresponding loss is reduced. In the range of 1.0–1.5 Cax, when the cavity height is over the optimal value, the loss could increase with the increase in cavity height. The loss in this region is primarily caused by the dissipation of the TLV downstream of the trailing edge of rotor blade. The increase in the loss indicates that the TLV would be enhanced near the trailing edge after the cavity height exceeds the optimal value.
The formation and development of the TLV in the early stage are mainly affected by the SV. The distribution of the SV in the cavity is presented in Figure 16. With larger cavity height, the size of the PSCV increases significantly, forcing the SV closer to the suction side rim, and the position where the SV disappears inside the cavity moves upstream. Obviously, the effect of cavity height on the SV is similar to that of cavity width. In essence, both the increase in the cavity height and the decrease in the cavity width could lead to the decrease in the spacing between aero-labyrinth teeth, and improve the blocking effect on the TLF. The difference is that the increase in the cavity height could reduce the streamwise vorticity of SV, which indicates weaker mixing between SV and TLF or PSCV. Thus, it could be inferred that the loss inside the clearance could be reduced with the increase in cavity height.
To demonstrate this inference, Figure 17 shows the axial distribution of the loss inside and outside the clearance at conditions with different cavity heights. Larger cavity height can significantly reduce the loss inside the clearance, which is contrary to the influence of small cavity width on the loss inside the clearance. The size of the SV decreases with the increase in the cavity height, resulting in the decrease in loss inside the clearance caused by viscous dissipation. In addition, the mixing loss outside the clearance does decrease slightly, which indicates that the blocking effect on the TLF is enhanced.
The above conclusion seems to be in contradiction with the conclusion inferred from the loss distribution downstream of the trailing edge of rotor blade. To clarify this issue, Figure 18 shows the distribution of normal momentum of the TLF at the clearance outlet, which reflects the strength of the tip leakage jet and the development trend of the TLV to a certain extent.
Downstream of 65% streamwise position (red dash line in the figure), the momentum increases significantly with the increase in cavity height, which is the reason for the variation of loss in the range of 1.2–1.5 Cax. Combined with the distribution of SV in Figure 16, the area without SV in the rear part of cavity expands with the increase in cavity height. Thus, the blocking effect in the rear part of the cavity becomes weaker and weaker. Upstream of 65% streamwise position, the momentum of the case with larger cavity height decreases, leading to the reduction of mixing loss, as mentioned above.
In summary, similar to the small cavity height, the large cavity height could enhance the blocking effect of the effective region and reduce the mixing loss in the channel by reducing the distance between SV and the suction side rim. In addition, large cavity height will reduce the chordwise span of the effective area and increase the loss in the region downstream of the trailing edge. However, different from the small cavity width, the large cavity height could reduce the vorticity of SV, and reduce the loss inside the clearance.

4. Conclusions

In this paper, a transonic high-pressure turbine is investigated numerically to reveal the influences of cavity width and height on TLF and its loss. In the numerical simulations, six kinds of cavity widths and five kinds of cavity heights are considered. Aerodynamic performances, vortex structures, and the characteristics of TLF in typical cases with different cavity widths and heights are exhibited and discussed in detail. Based on the discussions, some conclusions are summarized as follows:
  • There are aerodynamic optimal values for both height and width of cavity. The optimal value of cavity height is 2.5–3.0 τ. The optimal value of cavity width is affected by the cavity height and is about 10.0–10.5 τ when the cavity height is about its optimal value. The aerodynamic optimal values of cavity width and height could provide an important reference for the design of turbine cavity tip in practical engineering.
  • The small cavity width could delay the occurrence of APG and restrain the breakdown of TLV, which is beneficial to reducing the tip leakage loss. The effect of cavity width on the breakdown of TLV could provide a different perspective for the study of TLF in turbines.
  • The decrease in cavity width could improve the blocking effect of SV on TLF, which is conducive to inhibit the development of TLV and reducing the tip leakage loss. However, the small cavity width could inhibit the chordwise length of SV, which is bad for controlling the loss caused by TLV near the trailing edge.
  • The effect of large cavity height on the development of SV is similar to that of small cavity width. The difference is that large cavity height could reduce the vorticity of SV and loss inside the clearance, while small cavity width could not.

Author Contributions

Conceptualization, Y.W. and W.Z.; methodology, Y.W., S.J. and Y.C.; validation, D.H., S.J. and Y.C.; investigation, Y.W. and D.H.; data curation, W.Z.; writing—original draft preparation, Y.W.; writing—review and editing, Y.W., W.Z. and D.H.; visualization, Y.W.; supervision, W.Z.; project administration, W.Z.; funding acquisition, W.Z. All authors have read and agreed to the published version of the manuscript.

Funding

This research was funded by the National Natural Science Foundation of China, grant number 52176033 and the National Science and Technology Major Project, grant number J2019-II-0019-040.

Institutional Review Board Statement

Not applicable.

Informed Consent Statement

Not applicable.

Data Availability Statement

The data presented in this study are available on request from the corresponding author.

Conflicts of Interest

The authors declare no conflict of interest.

Nomenclature

Caxaxial chord length
h*total enthalpy
Hcavity height
Llocal loss
mleakagenormalized tip leakage flow rate
mpaleakage rate per unit area
mVnnormal momentum
MaMach number
pstatic pressure
p*stagnation pressure
ReReynolds number
uithe components of velocity, u, v, w
Vvelocity
Wcavity width
xithe components of coordinate, x, y, z
γthe ratio of specific heat
Δvariation
ηturbine stage efficiency
θthe velocity flow angle of main-flow
μeffeffective viscosity
πtotal-to-total pressure ratio
τclearance height
Φthe dissipation function
ωvorticity
Subscript
0the inlet of stator domain
2the outlet of rotor domain
aaxial direction
ccircumferential direction
isisentropic
rrelative
sstreamwise
Abbreviations
APGadverse pressure gradient
PSpressure surface of blade
PSCVpressure side squealer corner vortex
RANSReynolds Averaged Navier–Stokes
SSsuction surface of blade
SSCVsuction side squealer corner vortex
SSTshear stress transport
SVscraping vortex
TLVtip leakage vortex
TLFtip leakage flow
UPVupper passage vortex

References

  1. Denton, J.D. Loss mechanisms in turbomachines. J. Turbomach. 1993, 115, 621–656. [Google Scholar] [CrossRef]
  2. Bindon, J.P. The measurement and formation of tip clearance loss. J. Turbomach. 1989, 111, 257–263. [Google Scholar] [CrossRef]
  3. Dishart, P.T.; Moore, J. Tip leakage losses in a linear turbine cascade. J. Turbomach. 1990, 112, 599–608. [Google Scholar] [CrossRef]
  4. Yaras, M.I.; Sjolander, S.A. Prediction of tip-leakage losses in axial turbine. J. Turbomach. 1992, 114, 204–210. [Google Scholar] [CrossRef]
  5. Yang, H.; Zhang, W.; Zou, Z.; Zhang, S.; Zeng, F.; Xu, W. The development and applications of a loading distribution based tip leakage loss model for unshrouded gas turbines. J. Turbomach. 2020, 142, 071005. [Google Scholar] [CrossRef]
  6. Jung, J.; Kim, I.; Joo, J.S.; Lee, S.W. Experimental study on aerodynamic loss and heat transfer for various squealer tips. J. Turbomach. 2021, 143, 051002. [Google Scholar] [CrossRef]
  7. Zhou, C.; Zhong, F. A novel suction-side winglet design philosophy for high-pressure turbine rotor tips. J. Turbomach. 2017, 139, 111002. [Google Scholar] [CrossRef]
  8. Wang, Y.; Song, Y.; Yu, J.; Chen, F. Effect of cooling injection on the leakage flow of a turbine cascade with honeycomb tip. Appl. Therm. Eng. 2018, 133, 690–703. [Google Scholar] [CrossRef]
  9. Yu, J.; Yu, J.; Chen, F.; Wang, C. Numerical study of tip leakage flow control in turbine cascades using the DBD plasma model improved by the parameter identification method. Aerosp. Sci. Technol. 2019, 84, 856–864. [Google Scholar] [CrossRef]
  10. Bunker, R.S. Axial turbine blade tips: Function, design, and durability. J. Propul. Power 2006, 22, 271–285. [Google Scholar] [CrossRef]
  11. Mischo, B.; Behr, T.; Abhari, R.S. Flow physics and profiling of recessed blade tips: Impact on performance and heat load. J. Turbomach. 2008, 130, 021008. [Google Scholar] [CrossRef]
  12. Zhou, C. Effects of endwall motion on thermal performance of cavity tips with different squealer width and height. Int. J. Heat Mass Transf. 2015, 91, 1248–1258. [Google Scholar] [CrossRef]
  13. Virdi, A.S.; Zhang, Q.; He, L.; Li, H.D.; Hunsley, R. Aerothermal performance of shroudless turbine blade tips with relative casing movement effects. J. Propul. Power 2015, 31, 527–536. [Google Scholar] [CrossRef] [Green Version]
  14. Wang, X.; Wang, J.; He, F.; Zhang, H. Effect of relative movement between the shroud and blade on tip leakage flow characteristics. Energies 2017, 10, 1600. [Google Scholar] [CrossRef] [Green Version]
  15. Zou, Z.; Shao, F.; Li, Y.; Zhang, W.; Berglund, A. Dominant flow structure in the squealer tip gap and its impact on turbine aerodynamic performance. Energy 2017, 138, 167–184. [Google Scholar] [CrossRef]
  16. Błoński, D.; Strzelecka, K.; Kudela, H. Vortex Trapping Cavity on Airfoil: High-Order Penalized Vortex Method Numerical Simulation and Water Tunnel Experimental Investigation. Energies 2021, 14, 8402. [Google Scholar] [CrossRef]
  17. Zeng, F.; Zhang, W.; Wang, Y.; Cao, X.; Zou, Z. Effects of squealer geometry of turbine blade tip on the tip-leakage flow and loss. J. Therm. Sci. 2021, 30, 1376–1387. [Google Scholar] [CrossRef]
  18. Li, C.; Xiang, J.; Song, L.; Li, J. An aerothermal analysis of the effects of tip gap height and cavity depth of a gas turbine blade. Int. J. Therm. Sci. 2020, 158, 106521. [Google Scholar] [CrossRef]
  19. Lu, S.; Ma, H.; Zhang, Q.; Teng, J. Cutback squealer tip trailing edge cooling performance. Int. J. Heat Mass Transf. 2020, 154, 119632. [Google Scholar] [CrossRef]
  20. Prakash, C.; Lee, C.P.; Cherry, D.G.; Wadia, A.R. Analysis of some improved blade tip concepts. J. Turbomach. 2006, 128, 639–642. [Google Scholar] [CrossRef]
  21. Senel, C.B.; Maral, H.; Kavurmacioglu, L.A.; Camci, C. An aerothermal study of the influence of squealer width and height near a HP turbine blade. Int. J. Heat Mass Transf. 2018, 120, 18–32. [Google Scholar] [CrossRef]
  22. Su, X.; Ren, X.; Li, X.; Gu, C. Unsteadiness of tip leakage flow in the detached-eddy simulation on a transonic rotor with vortex breakdown phenomenon. Energies 2019, 12, 954. [Google Scholar] [CrossRef] [Green Version]
  23. Huang, A.C.; Greitzer, E.M.; Tan, C.S.; Clemens, E.F.; Gegg, S.G.; Turner, E.R. Blade loading effects on axial turbine tip leakage vortex dynamics and loss. J. Turbomach. 2013, 135, 051012. [Google Scholar] [CrossRef] [Green Version]
  24. Gao, J.; Zheng, Q.; Xu, T.; Dong, P. Inlet conditions effect on tip leakage vortex breakdown in unshrouded axial turbines. Energy 2015, 91, 255–263. [Google Scholar] [CrossRef]
  25. Gao, J.; Zheng, Q.; Liu, Y.; Dong, P. Effects of blade rotation on axial turbine tip leakage vortex breakdown and loss. Proc. Inst. Mech. Eng. Part G 2017, 231, 1634–1649. [Google Scholar] [CrossRef]
  26. Zhou, K.; Zhou, C. Effects of upstream Rankine vortex on tip leakage vortex breakdown in a subsonic turbine. Aerosp. Sci. Technol. 2020, 99, 105776. [Google Scholar] [CrossRef]
  27. Menter, F.R.; Galpin, P.F.; Esch, T.; Kuntz, M.; Berner, C. CFD simulations of aerodynamic flows with a pressure-based method. In Proceedings of the 24th International Congress of the Aeronautical Sciences, Yokohama, Japan, 29 August–3 September 2004. [Google Scholar]
  28. Zou, Z.; Wang, S.; Liu, H.; Zhang, W. Axial Turbine Aerodynamics for Aero-Engines: Flow Analysis and Aerodynamic Design; Shanghai Jiao Tong University Press: Shanghai, China, 2018. [Google Scholar]
  29. Qi, L.; Zou, Z.; Liu, H.; Li, W. Upstream wake–secondary flow interactions in the endwall region of high-loaded turbines. Comput. Fluids 2010, 39, 1575–1584. [Google Scholar]
  30. Lei, Q. Investigations of Unsteady Interaction Mechanism and Flow Control in the Turbine Endwall Regions. Ph.D. Thesis, Beihang University, Beijing, China, 2010. [Google Scholar]
  31. Gardner, W.B. Energy Efficient Engine: High Pressure Turbine Uncooled Rig Technology Report; No. NASA-CR-165149; NASA: Cleveland, OH, USA, 1979.
  32. Kudela, H.; Malecha, Z.M. Investigation of unsteady vorticity layer eruption induced by vortex patch using vortex particles method. J. Theor. Appl. Mech. 2007, 45, 785–800. [Google Scholar]
  33. Kudela, H.; Malecha, Z.M. Eruption of a boundary layer induced by a 2D vortex patch. Fluid Dyn. Res. 2009, 41, 055502. [Google Scholar] [CrossRef]
  34. Ghorani, M.M.; Sotoude Haghighi, M.H.; Maleki, A.; Riasi, A. A numerical study on mechanisms of energy dissipation in a pump as turbine (PAT) using entropy generation theory. Renew. Energy 2020, 162, 1036–1053. [Google Scholar] [CrossRef]
  35. Hall, M.G. Vortex breakdown. Annu. Rev. Fluid Mech. 1972, 4, 195–218. [Google Scholar] [CrossRef]
  36. Liu, C.; Gao, Y.; Tian, S.; Dong, X. Rortex—A new vortex vector definition and vorticity tensor and vector decompositions. Phys. Fluids 2018, 30, 035103. [Google Scholar] [CrossRef] [Green Version]
  37. Xu, W.; Gao, Y.; Deng, Y.; Liu, J.; Liu, C. An explicit expression for the calculation of the Rortex vector. Phys. Fluids 2019, 31, 095102. [Google Scholar] [CrossRef]
  38. Wang, Y.; Zhang, W.; Cao, X.; Yang, H. The applicability of vortex identification methods for complex vortex structures in axial turbine rotor passages. J. Hydrodyn. 2019, 31, 700–707. [Google Scholar] [CrossRef]
Figure 1. Sketches for (a) geometric parameters of cavity squealer tip; (b) Blade tip profile and cavity profiles. (PS: pressure surface of blade; SS: suction surface of blade).
Energies 15 01018 g001
Figure 2. Computational domain and mesh.
Energies 15 01018 g002
Figure 3. Aerodynamic parameters of cases with different grid numbers: (a) Variation in turbine stage efficiency; (b) Normalized tip leakage flow rate.
Energies 15 01018 g003
Figure 4. Comparison of pressure distribution at blade tip section.
Energies 15 01018 g004
Figure 5. The effects of cavity width and height on turbine stage efficiency: (a) Cavity height; (b) Cavity width.
Energies 15 01018 g005
Figure 6. Schematic diagram of (a) axial sections in the rotor domain and (b) distribution of Φ in the passage outlet over 50% span. (TLV: tip leakage flow; UPV: upper passage vortex).
Energies 15 01018 g006
Figure 7. Distribution of local loss along the axial direction in the range of (a) 50–80% span and (b) 80–100% span. (Cax: axial chord length).
Energies 15 01018 g007
Figure 8. Distributions of streamlines in the tip region and Ma on different sections.
Energies 15 01018 g008
Figure 9. Reverse flow regions in the TLV core varies with the change of cavity width (ωS: streamwise vorticity).
Energies 15 01018 g009
Figure 10. Distribution of isentropic Mach number at 95% span.
Energies 15 01018 g010
Figure 11. Vortex structures of three cases with different cavity width, identified by Liutex method. (SV: scraping vortex; Line A: the connecting line of the position of SV flowing out of the clearance in the three cases).
Energies 15 01018 g011
Figure 12. Distribution of aerodynamic parameters of tip leakage flow (TLF) along the streamwise direction at the clearance outlet: (a) Leakage per unit area; (b) Normal momentum.
Energies 15 01018 g012
Figure 13. Sketch of clearance inlet and outlet.
Energies 15 01018 g013
Figure 14. Distribution of loss inside and outside the clearance along the axial direction.
Energies 15 01018 g014
Figure 15. Distribution of local loss along the axial direction in the range of 80–100% span.
Energies 15 01018 g015
Figure 16. Effects of cavity height on the vortex structures inside the cavity. (PSCV: pressure side squealer corner vortex).
Energies 15 01018 g016
Figure 17. Distribution of loss inside and outside the clearance along the axial direction.
Energies 15 01018 g017
Figure 18. Distribution of normal momentum of the TLF along the streamwise direction.
Energies 15 01018 g018
Table 1. Parameters of turbine rotor.
ParametersAspect RatioClearance Height τ (%Span)Total-to-Total Pressure Ratio πMar,2Rer,2
Value1.151.16%4.081.111.12 × 106
Table 2. Distributions of meshes in different directions of rotor domain.
Streamwise × Pitchwise × Spanwise (Gap)Total Number (×106)
Grid 1214 × 43 × 90 (14)2.19
Grid 2214 × 43 × 96 (20)2.37
Grid 3214 × 43 × 102 (26)2.54
Grid 4214 × 43 × 108 (32)2.72
Grid 5214 × 43 × 114 (38)2.89
Grid 6214 × 43 × 120 (44)3.07
Table 3. Location information of reverse flow regions.
Reverse Flow RegionStarting Location/CaxEnding Location/CaxAxial Length/Cax
width 10.871.280.41
width 50.911.250.34
width 60.911.240.33
Publisher’s Note: MDPI stays neutral with regard to jurisdictional claims in published maps and institutional affiliations.

