1. Introduction
While onshore mineral reserves have become significantly reduced, the role of offshore production has increased over the past decades. According to [
1], offshore oil and gas complexes account for about 30% of global oil and gas production [
1].
Offshore platforms require large power inputs that range from 10 to 100 MW [
2], depending on the climatic conditions and production volumes. The main source of electric power on platforms are diesel generator units (DGU).
Millions of tons of diesel fuel are burned to provide the necessary consumption of offshore platforms, leading to huge emissions of CO
2 [
3]. Moreover, to serve the high-quality power requirements on the platforms and to ensure the reliability of electrical power supply, several DGU are used simultaneously. In some cases, this can lead to under-loading, a subsequent decrease in efficiency and further increases in CO
2 emissions.
Sustainable development of offshore wind and wave industries requires a prudent and responsible use of natural resources and optimizing their exploitation [
4]. Thereby, in addition to the common objectives of both industries to reduce costs, the possibility of integrating these energies has arisen [
5].
Regarding the synergy effects, the analysis of the literature has shown [
6,
7] that any system combining wave and wind technologies provides important benefits: it minimizes the percentage of zero production time, reduces peak demands and thus smooths the power output charts and maintains the average production.
Articles [
8,
9] evaluate the failure modes and research progress of wind turbine reliability. The failure modes, failure causes and detection methods of some key components in wind turbines are summarized. In addition, the frequently used methods of reliability analysis and research status of wind turbine reliability are analyzed.
In [
10,
11,
12,
13], publicly available reliability data for both onshore and offshore wind turbines were used to investigate the impacts of reliability on the cost of energy.
Due to the lack of operational experience, specific reliability measures have not been established for the wave energy sector. Numerous methodologies have been proposed to update generic failure rate data for the use in reliability calculations including quantification of specific failure modes [
14] and the Bayesian statistical framework [
15]. However, a limited number of computational models and research tools aimed at supporting the decision-making process for wave energy converters or combined wind/wave technologies exist in literature [
16,
17,
18].
This paper investigates the operation of a combined system of co-located wind and wave technologies. It is expected that co-production provides more stable operation of the entire system than wind and wave technologies operating separately.
In recent years, the idea of combining marine renewable energy sources has attracted a lot of interest, and the number of projects combining wind and wave installations is increasing [
19]. However, there is no real deployment that combines the two resources, and advances in this area are based on theoretical studies. Three projects are currently evaluating the relationship between wind and waves and the benefits of using them together to improve reliability and reduce variability in power production [
20,
21,
22]. The European project Marina Platform is also studying this topic [
23].
Thus, the combination of different renewable energy sources would increase the total production of electricity and thus reduce the need for storage and the use of DGUs. Therefore, the combined use of these units would create a more balanced and reliable power system [
24], which would lead to a significant reduction in the cost of power generation. These devices in the future can become a worthy replacement of diesel units and can be used as the main source of energy on oil and gas offshore platforms.
The purpose of this article is to study the advantages of combining wave converters and offshore wind turbines into a unified power system. Among such advantages is the increase in power system reliability. Because of the works of other authors, considering the reliability of the wave and wind converter separately, the complexity and novelty of this work is to justify and prove the impact on the reliability of the combined system, taking into account the mutual arrangement of converters in the system and the shadow effect.
This work is structured as follows:
Section 2 gives a mathematical description of wave loads.
Section 3 presents different variants of the combined systems and gives a description of the shadow effect.
Section 4 discusses the failure rates of offshore wind turbines and wave converters, presents a reliability block diagram for combined systems, and performs calculations through a software package. Finally,
Section 5 draws conclusions.
2. Wave Loads on Structures
To study the reliability of the combined system, taking into account wave loads, we use the Morison formula [
25], which is designed to calculate the wave loads on vertical columns:
where
ρ is water density;
and
are coefficients of velocity and inertial resistance;
and
are horizontal velocity and acceleration of water particles, caused by the wave, and
D is the diameter of the structure.
The values of the coefficients of velocity and inertial drag depend on dimensionless parameters related in turn to the maximum velocity of water particles
b and the wave period
T:
where
ρ and
μ denote the density and kinematic viscosity coefficient of the fluid. The first of these parameters, called the Reynolds number, characterizes the effect of fluid viscosity. The second parameter, the Cullaghan–Carpenter number, characterizes the effect associated with the periodicity of the wave. Unfortunately, the amount of experimental data establishing the dependence of drag coefficients on the above dimensionless numbers are very limited, and therefore in engineering practice, both coefficients are assumed constant for the simplicity of calculations. The value of the coefficient of velocity resistance
is taken in the range of 0.6–1.0, and the value of inertial resistance coefficient
in the range of 1.5–2.0.
Equivalent wave load acting on the column at the section from the bottom (
y = 0) to some level
y is equal to:
Similarly, the moment of this load relative to the bottom of the column (
y = 0) is:
The shoulder of the equilibrium with respect to the bottom of the column is calculated by b = M/F.
The wave loads on the structures, depending on the wavelength and the depth of propagation of waves, can be calculated by several methods, such as: the calculation of loads from Erie waves, from Stokes waves and knoidal waves. In this paper, the Stokes calculation is used.
Stokes wave loading. When considering finite-amplitude Stokes waves, the calculation of the wave load using the expression becomes more complicated, since the wave surface is described as a superposition of waves of different profiles.
The horizontal components of velocity and acceleration of fluid particles are calculated by:
By substituting Equations (5) and (6) into the Morison equations, we obtain at
x = 0, (assuming that this section coincides with the column):
where the coefficients
and
are determined by the formulas:
The double summation is performed so that the products
at
m + n > 5 are not taken into account in accordance with the accuracy that the fifth-order Stokes theory can provide. Substituting the obtained expression into
, we find the wave load
F(y) on the column at the level
y from the bottom:
where
Introducing the notation
and using the coefficient of the velocity component determined by:
To simplify the calculations, we can use the approximate numerical method, that is, if we divide the column along its length into N sections, then using Equation (10), we can calculate the wave load at each section for the moment when it reaches the maximum value, and then, assuming that loads are evenly distributed within each individual section, sum up the moments of these loads relative to the base of the column.
To find the maximum moment from the wave load on the column, we must obviously choose the point in time at which the wave load reaches its maximum (
Figure 1).
Using of the Stokes calculation method will allow us to obtain results of the maximum wave load and the corresponding moment for offshore wind generators, installed offshore together with the wave units at depths of 50–200 m with and without the shadow effect.
Since it was previously shown that when offshore wind turbines and wave installations are placed together, the wave height drops by up to 27%, the load is correspondingly reduced, which affects the reliability of the system. The purpose of this work is to show and prove that the choice of topology of the converters’ location of converters determines the reliability of the whole system, as well as its individual elements. By reducing the loads, we thereby increase the vitality of the system, which will consequently allow for more electricity to be generated. Weather windows are also created for repair crews, as it creates favorable weather conditions inside the system, allowing them to come closer for repairs.
Using the formulas presented above, we derive the ratio of maximum wave loads:
This relationship can be used in software packages to obtain more accurate results on the reliability of combined systems.
3. Combined Systems and Shadow Effect
Combined systems means the combination of wind and wave converters into a single system based on the use of the same sea area, common infrastructure of electrical networks, common logistics for operation and maintenance, and the use of basement and foundation systems.
Depending on the location in the offshore area, the converters are divided into independent and combined (
Figure 2 and
Figure 3).
In [
26], different configurations of the location of wave and wind installations, which use the same marine area, were considered in detail.
In this article, we considered the scheme, in which the wave transducers are located on the perimeter (
Figure 4). This is due primarily to the shadow effect they create, which is used for further calculations. It takes into account not only the prevailing wave direction for the wave transducers, but also the distance between the transducers, for offshore wind transducers, 7 times the rotor diameter, and for wave transducers 2.2, installation diameters [
27].
Combined offshore installations have a number of positive effects. From a literature review [
28,
29,
30], it can be seen that the combined use of waves and offshore wind increases energy generation per unit area and thus contributes to a more sustainable use of renewable energy sources. A real example of combined operation is shown in
Figure 5.
The results of the study in [
30,
32] show that for day-ahead forecasts, waves are 23% more predictable than wind, and wave power output is 35% more predictable than wind turbines. Moreover, incorporating wave power into a wind-only system reduces the cost of a balanced power supply by up to 35%.
From the above, it can be concluded that waves are more predictable than winds, they are less variable, and the peak wave potential lags several hours behind the peak wind potential for the same weather conditions in the marine environment [
33]. Therefore, a more accurate prediction of power generation is possible [
34], which will avoid a shortage of power supply to the grid due to unpredictable fluctuations in wind resources [
35].
In addition, the works [
26,
27] carefully consider the shadow effects of wave energy converters. The energy extraction produced for an array of wave energy converters changes the local wave climate by reducing the average wave height, creating a shadow or wave effect (as shown in
Figure 6). Combining wave units and offshore wind farms in the same location, in an array where the wave converters are located along the perimeter, will result in a milder wave climate in the interior of the wind farm, which promotes long weather windows and therefore reduces the operation and maintenance costs.
To analyze the shadow effect in the inner part of the jointly located truss, a new impact indicator was developed [
36]. An index of significant wave height reduction along the
j-th wind turbine column (
) evaluates the effect of the shadow effect on different wind turbine columns as the distance from them in relation to the wave truss increases. The
index is calculated by:
where index
i denotes the typical turbine of the
j-th wind farm column, n is the total number of turbines in the corresponding
j-th column,
HSi is the significant incident wave height at the
i-th turbine in the baseline scenario (without wave converters), and
HsWECi is the significant incident wave height at the
i-th turbine with placed wave converters.
It was found that the configuration of the models as in
Figure 4 creates a barrier for the incoming waves, and the smaller the distance between the wave transducers, the greater the shadow effect on the interior of the jointly placed truss, and at the same time, this reduction is maintained further inside the park, reaching a wave reduction of up to 27.42% in the first row of the jointly placed park [
36].
Overall, greater wave reduction was obtained for the smallest distance between the wave transducers and for a configuration where the first row of wave transducers was deployed parallel to the first row of offshore wind turbines.
Although new concepts of combined wave–wind turbines have been proposed in previous years, none of them have reached a commercial stage. The main reason for this is the nascent nature of the wave power industry compared to wind power, where many production and installation costs are already kept to a minimum.
The wave energy industry has not yet reached the necessary level of technological readiness to attract major investors [
35]. However, over the past few years, some of the most advanced wave energy concepts (e.g., Pelamis, Oyster, Wavestar and Wave Dragon) have dramatically narrowed this gap, reaching a level of technological readiness suitable for synergistic industrial development.
The efficiency of combined units is evaluated by the following reliability indicators: probability of failure-free operation, availability factor, and average maintenance time, taking into account the shadow effect.
4. Reliability of the Combined System
Determining and understanding the failure rates of offshore wind turbines and wave converters and the need for repair resources is vital to model and reduce the operations and maintenance costs and, in turn, reduce energy costs. However, the limited amount of data on failures of offshore energy systems and the lack of study of this issue pose a global challenge to the industry. Solving this issue will not only improve the system’s life cycle, but also increases the energy production, makes it investment attractive and reduces the payback period, which provides an opportunity for large-scale application and development of offshore combined systems.
This chapter presents the reliability of the combined system, which will be divided into two phases. The first phase examines system reliability for wave industry and offshore wind turbines. Existing methods for determining the reliability of these plants are reviewed and the available data and the possibility of applying them to special programs for calculating reliability are analyzed.
The second phase will focus on combining existing methodologies for wave and wind turbines into a single system, and examines the reliability of jointly operating offshore installations. Reliability and safety modeling of complex structures, due to the complexity and strong interconnectedness of parameters, should in the future be conducted only through computer or neural network models. Meanwhile, the software for the analysis must include the whole set of methods of both static and dynamic models; the complex algorithms of forecasting fail-safety, serviceability, analysis of types and consequences of failures must be implemented.
The huge influence of human factor, the high variability of actions and consequences, and limitation of statistical data do not allow one to estimate the reliability of systems with sufficient accuracy and reliability [
37].
Let us analyze the automated complexes of modeling and calculation of reliability of systems.
Currently, the following types of software complexes are used: “Risk Spectrum” program complex of probabilistic analysis of reliability and safety of systems, firm Relcon; “BUNKER” program complex of simulation and calculation of reliability and performance of technical systems with drives; “RAY” program complex of logical and probabilistic simulation and calculation of reliability and safety of systems; “Rizikon-Reliability” program complex of determination of probability of appearance and development of accidents; program complex of automated structural and logical analysis of reliability of systems.
These software complexes are made on the basis of a logical and probabilistic method of system analysis (LPA). It can be explained by the fact that when using LPA, it is possible to present the object of research in a form convenient for mathematical and computer modeling.
In most of the above software packages, the structures under study are represented in the form of event trees, fault trees or connectivity graphs. However, such representation of events has a number of drawbacks:
- -
the representation of structural schemes in the form of event trees makes it possible to correctly represent only monotonous processes of systems functioning, which does not take into account the possible complexity of the designed objects in the models;
- -
the construction of failure trees requires taking into account all possible variants of events, sequences and combinations, which can present difficulties when considering complex, cumbersome, interconnected systems.
Such disadvantages are eliminated in the general logical and probabilistic method (GLPM) and the program complex of automated structural and logical modeling of systems (PC Arbitr) developed on its basis. In this method, functional integrity schemes (SFC) are used as an initial structural scheme. SFC is a graphical way to represent the investigated properties of system objects to build structural schemes for reliability indicator computations.
To carry out the necessary calculations of the reliability of combined systems, we will use the software complex of automated structural and logical modeling of systems (PC Arbitr) [
38]
https://szma.com/arbitr (accessed on 21 September 2022).
4.1. Reliability of Wave Power Plants
As wave power develops, reliability becomes important because the consequences of failures in many cases require costly and complex interventions that must be carried out under inherently harsh conditions, even at the prototype stage [
39,
40].
The lack of data is primarily due to the fact that it is a competitive advantage for offshore plant developers; therefore, many of them do not share the available data.
Since the development of wave propulsion systems began not so long ago, in addition to the lack of data, very rough and approximate data have to be used to calculate the system’s reliability, which in the end greatly affects the results.
The development of reliability analysis for marine systems is a challenging and important task because the consequences of failures will require costly repairs in the marine environment. Therefore, the prediction of failure rates and plant performance should be made as accurate as possible, with the possibility of further improvements and upgrades [
41].
4.1.1. Data Selection and Adjustment
Due to the huge variety of waveform technologies available, many companies are striving to use technologies that have a high duty cycle, low maintenance cost, and require a small investment of money. With these requirements in mind, finding optimal solutions for calculating system reliability is a fundamental challenge [
42]. Solving them will require a number of adjustments and corrections due to limited data.
In this case, adjustments can be made by comparing the same components in the new environment and the environment in which the data were collected. In our case, this is the application of components that were used on land, with a transition to an aggressive marine environment.
While there may be some logic behind these methods, they are far from accurate. The effect, resulting from changing the environment, on a given failure rate is not easy to estimate. It will increase the uncertainty in the overall reliability assessment because the boundaries of the failure rate distribution shift, a little or a lot, depending on the fit of the data to the application [
43]. For this reason, it is important to have some means of obtaining useful reliability data.
4.1.2. Case Study
The lack of complete data on equipment failures and load distribution is a major limitation for reliability assessment [
44]. An approach based on the assumption of a constant failure rate and coarse corrections to the data, combined with sensitivity analysis, appears to be the best currently available way for determining reliability and identifying critical elements of waveform installations. At later stages, environmental, operating and maintenance conditions can be reviewed to assess their impact on degradation processes, failure rates and repair/replacement times.
The reliability analysis is not intended to derive actual reliability figures for any particular device and only serves to illustrate the reliability prediction problem for wave plants.
Unlike other renewable energy systems, wave energy converters operate in harsh environments and involve costly offshore operations. Therefore, the design of marine renewable energy systems presents additional challenges. Hence, there is a need to develop flexible tools to evaluate different technologies on various aspects. Among them, assessments of reliability, availability and maintainability are fundamental because they help to reduce the significant costs associated with the deployment of marine renewable energy systems, not only in the early stages of design, but also during maintenance and operational planning [
45].
4.2. Wind Turbines
Determining and understanding offshore wind turbine failure rates and repair resource requirements is vital for modeling and reducing operation and maintenance costs and, in turn, reducing energy costs [
46]. While little data have been published in the past on the failure rate of offshore wind turbines, even fewer details on repair resource requirements exist in the public domain [
47].
The reliability of an offshore wind turbine and the resources required to maintain it can account for about 30% of the total energy cost [
48]. Generally, higher failure rates and greater need for repair resources (i.e., material costs and labor) result in higher energy costs [
49]. Consequently, wind farm developers try to choose wind turbines with low failure rates and those that require the least amount of resources for maintenance. Because of affordability issues, turbine reliability becomes even more important as offshore wind energy production increases [
50,
51]. This paper presents the results of an analysis determining the failure rates and resource requirements for repair of today’s multi-megawatt offshore wind turbines and their assemblies.
4.2.1. Failure Rates and Failure Rate Categories
There is no standardized way of defining failure in wind power. In this analysis, failure is defined as a visit to a turbine outside of scheduled operation in which material is consumed; this is consistent with reference data [
52]. Material is defined as anything used or replaced in a turbine; this includes everything from consumables (such as carbon brushes) to replacement parts such as complete IGBT units and complete generators.
This paper presents the following failure rate formula in the format as shown in [
52,
53,
54]. It is used to determine the failure rates per turbine per year:
where:
λ = failure rate per turbine per year;
I = number of intervals for which data are collected;
K = the number of subassemblies;
ni,k = the number of failures;
Ni = the number of turbines;
Ti = the total time in hours.
The numerator is the sum of the number of failures in all periods per turbine. The denominator, ∑Ti = 8760, is the sum of all periods in hours divided by the number of hours per year.
There are more reliability analyses for onshore plants in the public domain than for offshore plants. These analyses cover the onshore turbine as a whole as well as its components. However, as stated in [
52], the analyses are repeatedly based on the same wind turbine examples and failure rate databases due to the scarcity of reliability databases in the public domains [
55].
4.2.2. Failure Rates of Nodes/Components and Pareto Diagram of Failure Categories
The failure cost categories are grouped in three ways. These groups are based on the Reliawind categories from [
56], which classify failures as minor repairs, major repairs, or major replacements.
Figure 7 shows the breakdown of failure rates by wind turbine nodes/components and by failure cost categories.
From the data presented, the average failure rate for an offshore wind turbine is 8.3 failures per turbine per year. This includes 6.2 minor repairs, 1.1 major repairs, and 0.3 major replacements. In total, 0.7 failures per turbine per year have no cost data and thus cannot be assigned to a particular category [
47].
4.3. Combined Array
There are several tools used to predict reliability and lifetime management to optimize equipment performance, and one of them is briefly described below.
4.3.1. Reliability Calculation
The next step is to determine the appropriate reliability values for the combined system depending on the configuration of the system, with and without the shadow effect. Based on the reliability theory, the formulas mentioned in
Table 1 are applied [
43].
4.3.2. Reliability Block Diagrams and Reliability Assessment
Reliability block diagrams provide a representation of the reliability performance of a system. Each block has a corresponding probabilistic failure rate based on the location of the equipment it represents (considering aspects such as single point failures, redundancy, etc.) [
43]. By combining all the blocks, a stochastic representation of the failure probability of the system over a given time can be obtained.
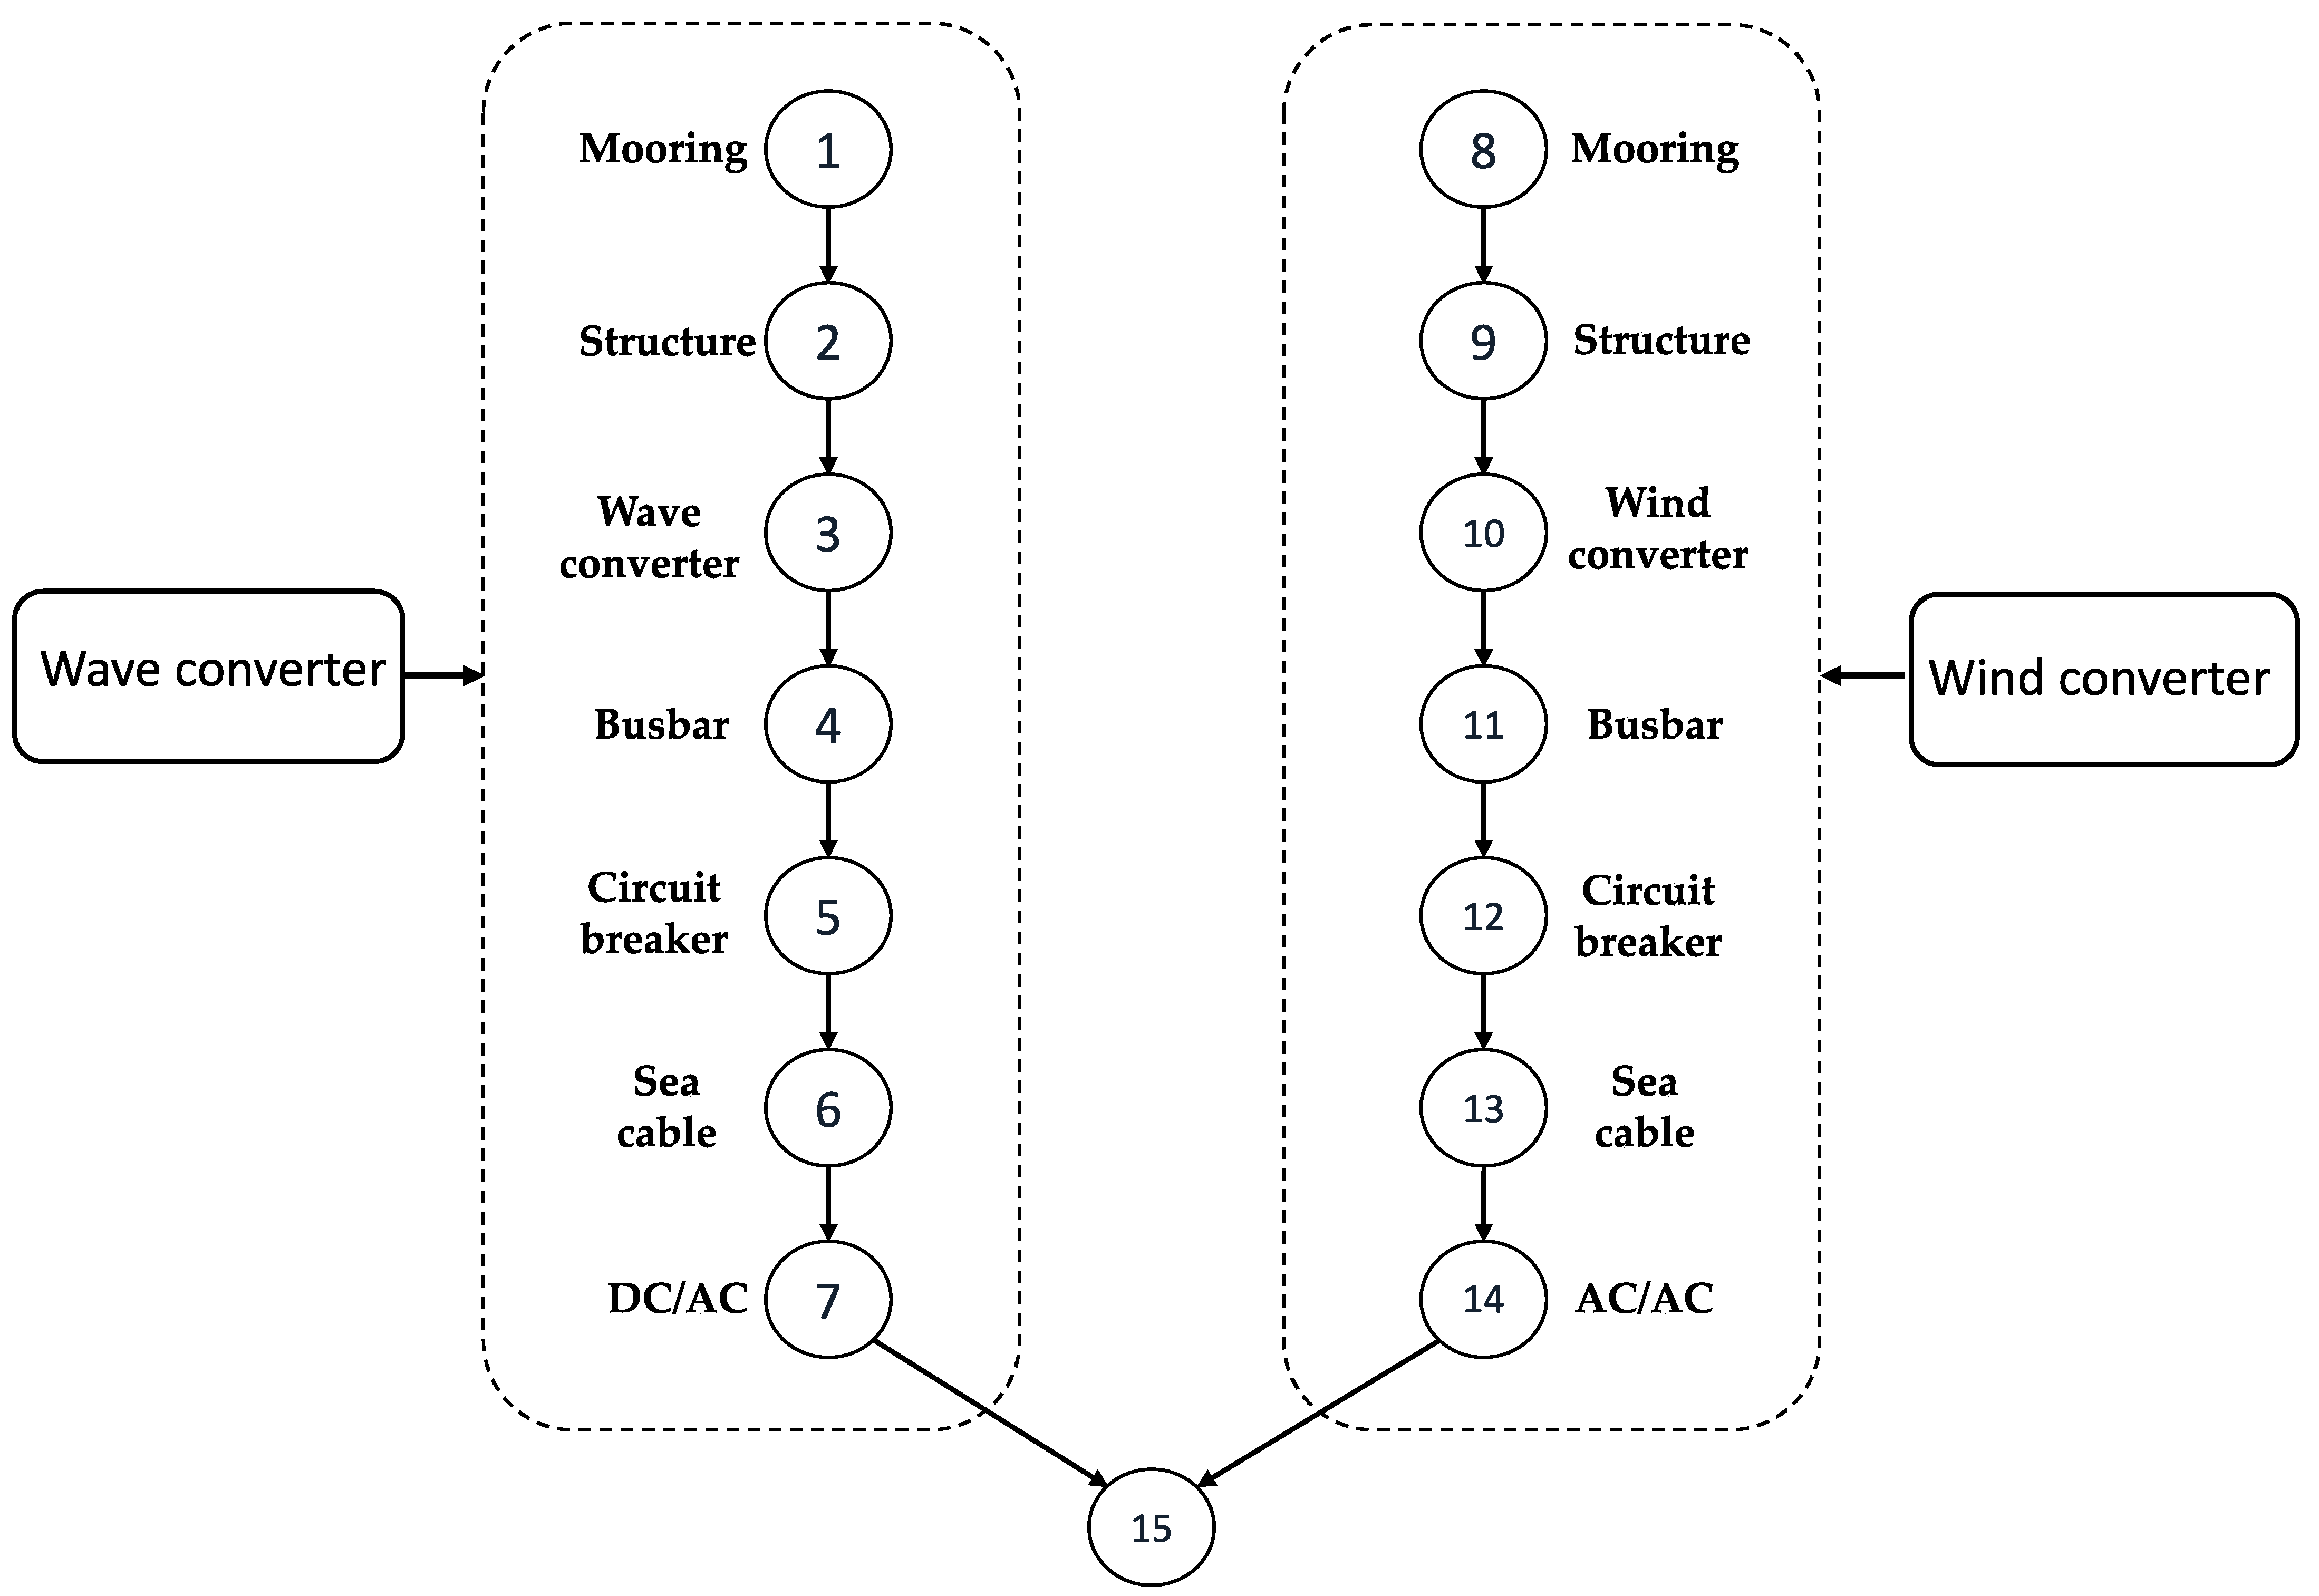
Figure 8 shows a block diagram of the combined wave–wind system.
Table 2 contains data on the failure rate of the elements of wave transducers and wind generators.
Next, it is necessary to perform a reliability assessment, which involves six basic steps [
43]:
Development of the system unit model;
Collecting data on the number of component failures from the reliability database;
Adjusting the failure rates according to expected application/environmental exposure;
Data entry into the system model and reliability calculation;
Data variation;
Results analysis.
In addition to the assumption of a constant failure rate, it is assumed that the system is not repaired for 12 months. One year is generally considered as the shortest practical maintenance interval for most devices [
57], allowing for access during large weather windows in the summer. Thus, the measure of overall system reliability is the 12-month period.
This paper presents a general framework of a combined system that can be used to evaluate marine renewable energy systems with the aim of identifying limitations and possible areas of improvement for specific devices or facilities (
Figure 9).
Let us perform an assessment of the reliability indicators of a separate wind power unit with the help of the “PC-Arbitr” program.
Figure 10 and
Figure 11 show diagrams of the positive contributions of a separate wind-powered unit operating in conjunction with a wave installation, without taking into account the shadow effect resulting from the wave installation (
Figure 10), and by taking into account the shadow effect (
Figure 11).
The contribution of each element to the possible increase in the probability of system uptime is Δ. It is equal to the change in the uptime probability of the system when the uptime probability of each element uptime changes from the current value to 1.
Without taking into account the shadow effect, the reliability indicators of a separate wind turbine, working as part of a wave turbine, are the following: availability factor of wind turbine Af = 0.988, average recovery time Tv = 63.0 h, the operating time to failure 0.56 years, probability of failure-free operation p = 0.167.
The shadow effect is taken into account by reducing the wave load on the anchor system, as well as by reducing the maintenance time by increasing the number of year days, when it will be possible to access the wind turbines because of the permissible wave height.
When taking into account the shadow effect, the reliability indicators of a separate wind power plant, working together with the wave plant, are the following: availability factor of the wind power plant Af = 0.993, average restoration time Tv = 37.0 h, operating time to failure 0.59 years, probability of failure-free operation p = 0.184.
We can see that the operation of the wave unit through the shadow effect has the following influence on the operation of the wind power plant: the availability factor of the wind power plant increased by 0.5%, the average restoration time decreased by 70%, the operating time before failure increased by 5%, and the probability of no-failure operation increased by 10%.
Let us evaluate the reliability indicators of the combined system (
Figure 9) at parallel operation of two installations: wind and wave.
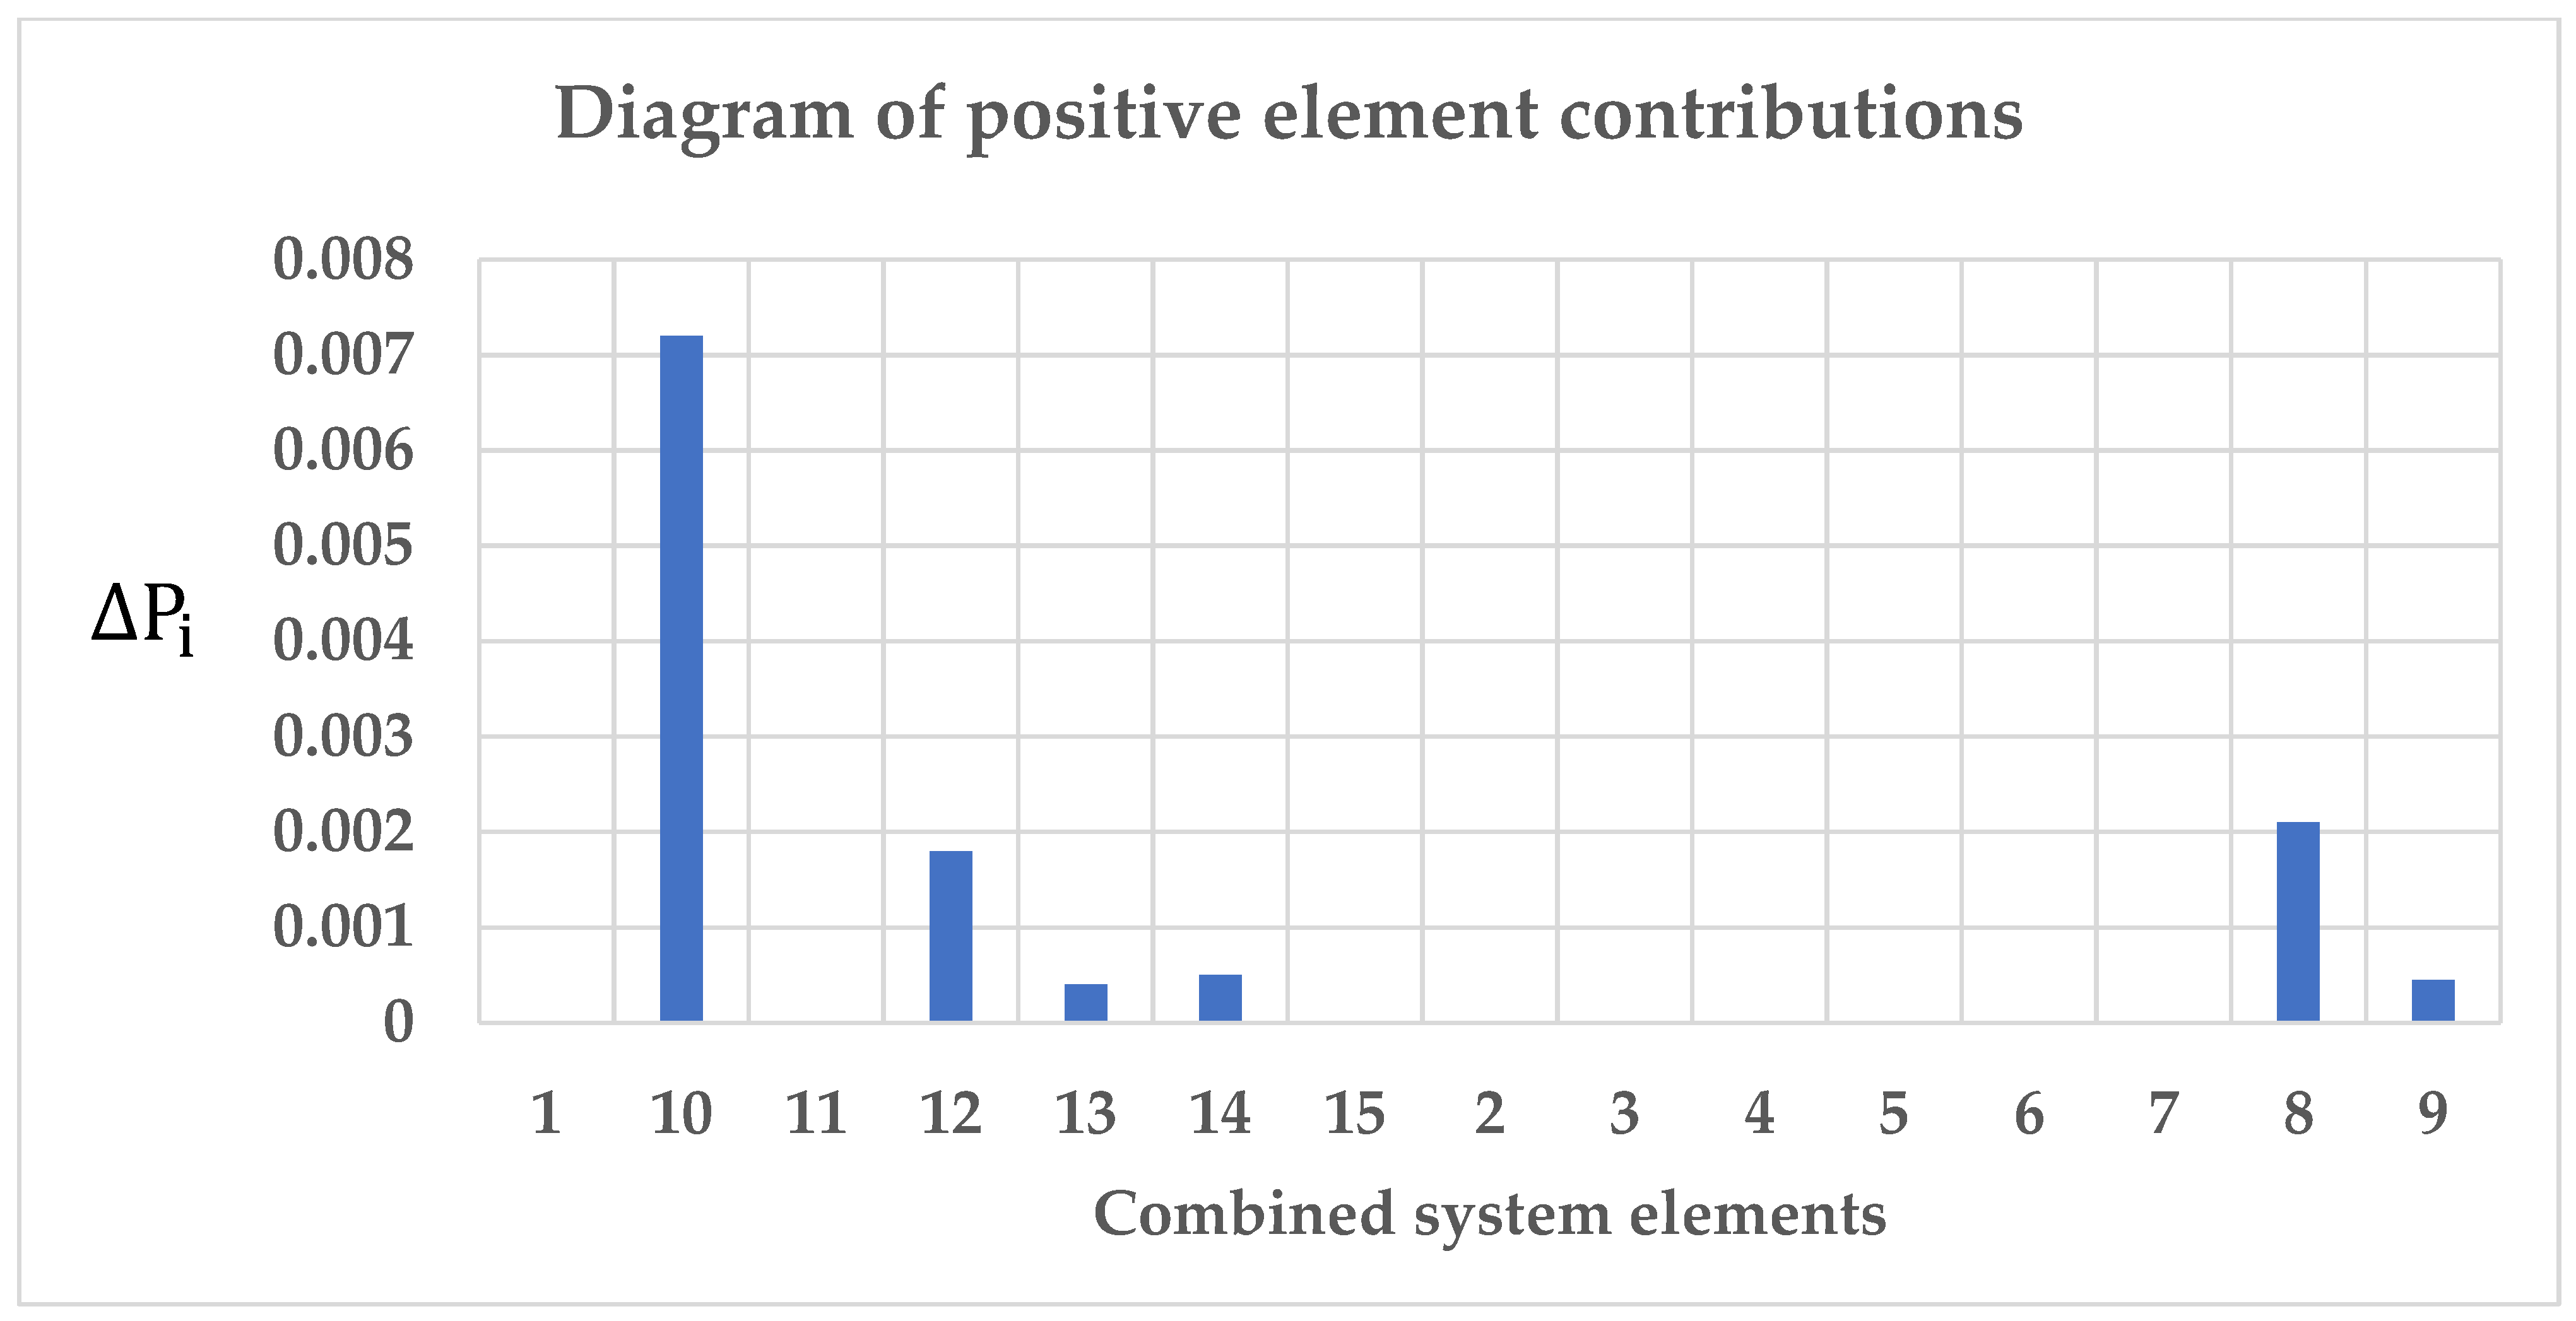
Figure 12 and
Figure 13 show the diagrams of the positive contributions of the wind–wave plant without and with the shadow effect taken into account.
The availability factor of wind turbines Kg = 0.9995, the average recovery time Tv = 38.9 h, the time to failure 10.03 years, and the probability of no-failure operation p = 0.905.
The coefficient of readiness of wind turbines Kg = 0.9998, the average recovery time Tv = 25.05 h, the MTBF 14.48 years, probability of no-failure operation p = 0.933.
It can be seen that the operation of the wave plant by means of the shadow effect has the following influence on their joint operation with the wind power plant: the availability factor of the wind power plant increased by 0.3%, the average restoration time decreased by 55%, the operating time before failure increased by 44%, and the probability of no-failure operation increased by 3%.
Due to the fact that the reliability indicators are determined in parallel operation of wind and wave plants, the values of availability factor, the average recovery time, the MTBF and the probability of no-failure operation are quite high.
From the presented results, we can see that the shadow effect of the wave plant application improves the availability factor, the average recovery time, the MTBF and the probability of no-failure operation. However, the significant improvement in reliability indicators occurs in the average recovery time and in the MTBF, where the values increase around 1.5 times.
5. Conclusions
This paper considers various aspects concerning the co-location of wave and offshore wind farms and, in particular, analyzes the shadow effect created by wave plants when co-located with conventional offshore wind farms. As a first step, synergistic effects and technology development issues were considered. The second step was to describe the methodology for investigating the shadow effect of co-locating wave plants and wind farms. Finally, the results obtained in the course of this work were presented.
The key performance indicators of the combined system were identified and analyzed. The results show how various factors affect the predicted reliability of the system and thus the performance of the project. In a collaborative environment, the shadow effect of wave plant effects is examined to quantify the effectiveness of the combined fleet given the specific location and technology chosen.
Overall, this paper presents compelling evidence to support the co-location of wave and offshore wind farms, and in particular the so-called “shadow effect”, which takes advantage of wave installations to create a lower wave height area within the offshore wind farm to increase weather windows for wind turbine operation and maintenance. In addition, the wave load on the structure and anchor system is reduced, which increases the reliability of the system.
In this study, a methodology was developed to determine the reliability of a combined offshore plant system by considering indicators such as values of availability factor, average recovery time, MTBF, and probability of failure. The results were obtained in the PC-Arbitr program.
Due to the limited data on failure rates and operating experience, especially for wave units, many failure rates of unit components are approximate and require further adjustments, which undoubtedly affect the final result. The initial data obtained will expand the information base on the reliability of the combined system, thereby increasing the interest in the application of this method of calculation. It will ultimately allow for designing high-quality power supply systems.
The results of this work can contribute to the prediction of the costs of operation and maintenance of installations, as well as contribute to more effective solutions for troubleshooting, damage and accidents.


