Article

Decision on Mixed Trading between Medium- and Long-Term Markets and Spot Markets for Electricity Sales Companies under New Electricity Reform Policies

College of Economics and Management, Shanghai University of Electric Power, Shanghai 200090, China
*
Author to whom correspondence should be addressed.
Energies 2022, 15(24), 9568; https://doi.org/10.3390/en15249568
Submission received: 9 November 2022 / Revised: 9 December 2022 / Accepted: 14 December 2022 / Published: 16 December 2022

Abstract

:
The introduction of the new round of electricity reform policies has made the electricity sales companies’ trading environment increasingly complex. In the medium- and long-term market and spot market, following the new policy-oriented optimization of trading decisions is the focus of electricity sales companies. The main objective of this study is to consider the impact of the latest policies of China’s current electricity reform on each subject of electricity trading and to propose a method for electricity sales companies to make optimal decisions on renewable energy source (RES) power and conventional energy source (CES) power mixed with power trading in the medium- and long-term and spot markets to improve the efficiency of electricity market trading, promoting the consumption of renewable energy and helping the synergistic development of the electricity market and the tradable green certificate (TGC) market. This paper first discusses the impact of the new electricity reform policies on the transactions of various subjects in the electricity market and constructs the model of the consumer utility function, the profit model of an electricity sales company, and the profit model of power generators with energy storage. Considering the complex power supply and demand relationship among the various subjects of the electricity market, a game model is established for the decision on mixed trading between the medium- and long-term market, the spot market, and the tradable green certificate market to minimize the comprehensive power purchase cost of an electricity sales company. To reduce the decision-making risk caused by the uncertainty of spot price, the prophet model is used to predict the spot price; finally, through the analysis of the decision-making model of the electricity sales companies, the optimal transaction decisions of the electricity sales companies in different trading periods and different scenarios are solved. The test results show that the proposed model can significantly improve the profitability of the electricity sales companies and provide a decision-making reference for electricity sales companies to participate in the medium- and long-term market and spot market.

1. Introduction

To implement the “double carbon” goal, meet the requirements of building a new electricity system, and construct a high-standard market system, China has launched a series of new electricity market reform policies from the supply and demand sides based on the main contradictions of the current electricity market construction. The introduced policies have expanded the varieties of electricity purchased and sold by electricity sales companies and affected the purchase and sale prices of electricity sales companies. At the same time, the system that connects China’s medium- and long-term and spot markets is becoming increasingly sophisticated. It places higher demands on the effectiveness of trading decisions under the medium- and long-term and spot markets for electricity sales companies. In the face of new opportunities and challenges, electricity sales companies urgently need to accelerate the response to policy by optimizing trading decisions to meet market demand and enhance market competitiveness.

1.1. Important Policies for China’s New Round of Electricity Reform

In March 2015, the Central Committee of the Communist Party of China and the State Council issued the “Opinions on Further Deepening the Reform of Electricity System” (Zhongfa (2015) No. 9), which launched a new round of electricity system reforms and proposed to carry out effective competition on the power generation and the electricity sales sides in accordance with the institutional structure of “managing the middle and liberalizing the two ends:” the electricity distribution and sales business and to liberalize to social capital [1]. After the introduction of the new electricity reform plan, the competition in the electricity sales market has become quite fierce with various types of electricity sales companies registered and established in various regions of China.
On 10 May 2019, the National Development and Reform Commission (NDRC) proposed to establish a renewable energy power consumption guarantee mechanism, set the renewable energy power consumption responsibility weights, and clarify the subjects responsible for the consumption in the document (2019) No. 807 [2]. The introduction of the renewable energy consumption weighting notice further promoted the large-scale development of RES power, and the high electricity price subsidy is not applicable to the construction direction of the future electricity market.
On 7 June 2021, NDRC No. 833 [3] stipulated the revision of the new energy feed-in tariff policy. However, the rapid development of renewable energy power cannot fully solve the current problem of an imbalance between the power supply and demand in China that is caused by the shortage of fossil energy. The NDRC issued No. 1439 on 12 October [4] to promote all industrial and commercial users entering the power market, cancel the industrial and commercial catalog tariff, and issued NO.809 [5] on 25 October to set a price of 1.5 times for power purchased by grid agents, aiming to alleviate the contradiction between supply and demand and deepen electricity price reform. The abovementioned series of new electricity reform policies cover all aspects of the electricity supply chain and will have an important impact on the production and operation costs, electricity transaction prices, trading volumes, and operating profits of the various entities in the electricity market.

1.2. Research on the Trading Model of Each Subject in the Electricity Market

Most previous studies have focused on the 2015 electricity system reform [6,7,8]. The implementation of the Renewable Portfolio Standards (RPS) and its accompanying TGC system quickly attracted the research interest of experts, and the policy has had a great impact on the trading decisions of various actors in the electricity market. In the literature [9], a quota allocation model based on the minimum cost of renewable energy generation was developed to determine the RPS targets for 30 Chinese provinces. The authors of [10,11] studied the power system dispatch model under RPS. In [12], policy network analysis theory was used to study the interactive relationship between the different levels and multiple actors in the RPS. In the literature [13], two types of corrective regulations—taxation and quotas on REC importing—were proposed to pursue the equity-efficient trade-off. The authors of [14,15] investigated how to coordinate the development of China’s carbon emission rights market and renewable energy green certificate market. In [16], the efficiency of the TGC market in China was analyzed. Scholars have studied the impact of the RPS on the behavior of market players and the overall performance of the electricity and TGC markets, and they attempted to promote renewable energy consumption by designing relevant electricity market mechanisms. The authors of [17,18] explored the mechanism design of the RPS, and those of [19,20,21] studied the impact of the RPS on the generation side, the sales side, and the retail market, respectively. In [22], an electricity market system adapted to the RPS was designed; in [23], the interplay between the green certificate trading market and the wholesale electricity trading market was analyzed; in [24,25,26], renewable energy investment strategies were studied; in [27,28,29], the relationship between renewable energy development and electricity prices was studied; and in [30], the impact of renewable energy policies on the Italian electricity market was assessed. The authors of [31,32] used a system dynamics approach to analyze the impact of RPS on the RES generation industry and the retail electricity market.
With renewable energy’s extensive large-scale connection to the grid and the development of energy storage technology, the diversified power purchase paths for making electricity sales companies’ trading decisions have attracted widespread attention. The reasonable allocation of the power purchase ratio to pursue profit maximization is the key to the power purchase and sales decisions of electricity sales companies. The authors of [33] analyzed long-term investment decisions in the electricity market using online machine learning, and those of [34] provided a more systematic overview of the current status of research on power purchase and sales strategies of power sales companies from three aspects: prediction of uncertainty parameters in the power sales market, power purchase decisions of power sales companies, and pricing strategies of power sales companies. In the paper [35], the real-time dynamic combination of virtual power plants was incorporated into the optimal dispatching, and the dispatching method of a power sales company considering the dynamic combination strategy of virtual power plants was proposed with the goal of an operating economy of the power sales company. The authors of [36,37,38] considered various power purchase paths, such as renewable energy, energy storage, and distributed power sources, and proposed a variety of pricing schemes for electricity sales companies’ tariff contracts.
However, no matter which power purchase route the electricity sales company adopts, generators and customers will react to it, and in a dynamic market environment, a game will certainly be played among the three. The authors of [39] proposed a long-term power trading model based on game theory predicated on the context of Japanese electricity reform. In [40], the game between electricity sales companies and customers in the retail market is discussed, and the conditional value at risk (CVaR) model to quantify the decision risk was used. While in [41], the authors developed and solved a price game model between generators, electricity sellers, and customers.
Due to the obvious peak and valley characteristics of customers’ electricity consumption, the above game may not be able to utilize electricity efficiently, even if the Nash equilibrium is reached. The demand-side response is a better choice for the power seller to promote the rational use of electricity and gain additional revenue [42,43,44]. The authors of [45] reviewed the current optimal decision-making techniques applied in energy markets and proposed a market model based on the demand response of producers and sellers. Another study [46] aimed to determine the impact of a demand response on spot price fluctuations and provide price signals for electricity sales companies. The authors of [47] improved the revenue of electricity sales companies by implementing a differentiated demand response.
There are also many scholars who consider both uncertainty factors and demand response to study the optimal decision of power sales companies. In the literature [48], an optimization model of the power purchase and sales decisions of power sellers considering the contribution of users was established to solve the power purchase and sales scheme considering the contribution of users. In another paper [49], a multi-timescale source–load–storage cooperative optimization integrated decision model for incremental power distribution and sales companies was proposed. The authors of [50], the establishment of an electricity–gas–heat multi-energy day-ahead market was proposed from the market perspective, and the basic transaction mechanism for load aggregators to participate in the multi-energy day-ahead market was elaborated. In this market model, a comprehensive demand response model was developed, and the optimal combined electricity–gas–heat trading strategy based on the comprehensive demand response was studied with the optimization objective of maximizing the profit of the load aggregators. In [51], an agent-based modeling and simulation approach was used to explore the impact of symmetric market mechanisms and the demand response on the electricity market. Multiple uncertainty factors create decision risks for electricity sales companies, and necessary risk management is an important guarantee for maximizing profits [52]. In [53], both the CVaR and volumetric deviation risk were considered, and a numerical study using data from the Nordic electricity market to investigate the impact of risk factors on retailers’ profits, risk levels, average spot prices and total consumption was conducted. The results show that retailers can benefit from demand-side elasticities in some cases. The authors of [54] used futures contracts, dynamic retail tariffs, and multi-agent services to achieve risk management for electricity sellers.

1.3. Research on Multi-Market Power Trading Decisions of Electricity Sales Companies

While most of the aforementioned literature studied the trading decisions of electricity sales companies participating in a single market, with the full-scale promotion of the spot market in China, and the “medium- and long-term + spot” multi-market allocation of power to increase revenue is a hot topic nowadays. In the literature [55], a two-level trading model with medium- and long-term power markets and a day-ahead market was proposed to optimize the profit on the generation side, and in [56], the impact of with and without medium- and long-term trading restrictions on the decisions of electricity sales companies in the spot context was studied. The authors of [57] developed a multi-stage stochastic optimal power purchase decision model for electricity sales companies to participate in the day-ahead and real-time markets, which explored the impact of market price and demand differences on the power purchase strategies of electricity sales companies. In fact, due to the continuous change in electricity reform policies, the power purchase and sale decisions of power sales companies become extremely complex. It is of great practical importance to develop optimal trading decisions in the context of multiple uncertainties, multiple time scales, and multiple market synergies.
In summary, this paper first discusses the impact of the new electricity reform policy on the trading decisions of each main body of electricity trading and introduces the influencing factors of the new electricity reform policy into the model. It constructs an optimal decision model for customers, electricity sales companies, CES generators, and RES generators. Considering the uncertainty of the spot electricity price, the prophet algorithm was used to forecast the spot electricity price. In the parallel system of the “medium- and long-term + spot” market and the TGC market, the trading period was divided, and an innovative power purchase strategy of the electricity sales company under the mixed decision of medium- and long-term and spot markets was proposed. The cost of green certificates to the electricity sales company in the mixed decision of medium- and long-term and spot markets, the cost of RES, and the profit of each entity were analyzed by comparing with the mixed decision of medium- and long-term and spot market purchase power and the profit of each subject. Finally, we analyzed the impact of the key parameters on the profit of electricity sales companies.

2. Materials and Methods

2.1. Methodology

The purpose of this study was to optimize the trading strategies of electricity sales companies under the medium- and long-term and spot markets. To improve the usefulness of the model, the impact of the new electricity reform policy on each subject of power trading was considered to provide a reference for the economic operation of electricity sales companies. This paper first analyzed the impact of the new electricity reform policy on each subject of electricity trading and then established a game model for customers, power generators, and electricity sales companies sales companies. Based on the maximization of users’ utility, the optimal power purchase price was obtained by making the first-order derivative of users’ utility function zero. By simplifying the model, the optimal decision model of electricity sales companies was transformed into a cost minimization model, and the optimality condition was applied to subdivide the different power price scenarios and obtain the optimal power purchase amount and power purchase combination of electricity sales companies when they take different power purchase routes. In the analysis of the arithmetic cases, the medium- and long-term transaction tariffs of generators and electricity sales companies, generator output forecasts and customer load forecasts are used in the dataset, and the model spot tariffs are forecasted using prophet. The research design is shown in Figure 1.

2.2. The Influence of the New Electricity Reform Policies on the Transactions of the Electricity Market

In 2021, the cumulative installed capacity of renewable energy generation in China reached a new high. The large-scale grid connection of RES power makes high-priced subsidies no longer applicable to current market development. NDRC No. 833 stipulates that the on-grid price of new wind power and photovoltaic projects will no longer be subsidized. The on-grid price will be at the parity price. The on-grid price will be implemented according to the local benchmark price of coal-fired power generation. The implementation of this policy makes it impossible for RES power generators to quote low prices in market transactions to obtain price advantages through price subsidies. This directly affects the transaction prices, volume, and profits of RES power generators.
With the development of energy storage technology, the stability of the RES power supply is further guaranteed. On 15 July 2021, NDRC and the National Energy Agency issued “Guidance on Accelerating the Development of New Energy Storage (Energy Regulation No. 1051 for Development and Reform).” At present, many provinces have responded to the policy requirements for energy storage on the power generation side. The configuration of energy storage will effectively reduce the rate of curtailment of wind and solar power and will increase the on-grid power of RES power generators. It will effectively avoid unbalanced power penalties. At the same time, the cost of energy storage will also become an important factor affecting the economic operation of RES power generators.
In terms of promoting RES power consumption, the RPS and its supporting TGC continue to play an important role. The quota assessment adds additional TGC costs for both electricity sales companies and customers, while also enriching the power purchase options for electricity sales companies, who can meet their own power needs and quota requirements through bundled RES power, unbundled RES power and green certificates, and CES power and green certificates for purchase. On the other hand, RES power generators can not only enjoy guaranteed power acquisition policies but also earn green certificate revenues in the TGC market, increasing RES generators’ profits and, thus, influencing their trading strategies. In addition, the increasing environmental awareness of customers, the significant changes in demand, and the increasing proportion of RES power consumption have significantly influenced the trading strategies of electricity sales companies and the generation plans of power plants by their dynamic consumption behavior.
In the second half of 2021, coal prices continued to rise, and the domestic power supply exceeded demand. To alleviate the contradiction between power supply and demand, the NDRC issued No. 1439 on 12 October. The coal-fired on-grid power generation price moved up and down to expand the floating ratio to 20%. After the notice was issued, the provinces with coal-fired power generation on-grid prices almost all reached the maximum float. At the same time, the abolition of industrial and commercial tariffs caused the prices to fluctuate “up and down”. Under a market environment of short supply, the cost of industrial and commercial power purchases has increased. In addition, No. 1439 also proposed the participation of industrial and commercial users to participate in the electricity market transaction; doubling the number of users will bring more profit opportunities to electricity sales companies. To implement No. 1439, the NDRC issued No. 809 on October 25, which stipulates that grid companies must purchase electricity at 1.5 times the price; it clarifies the rules of purchase. Even if users purchase electricity according to the power grid agency, they will also face market price fluctuations.
The implementation of a series of new electricity reform policies, such as RPS, new energy parity, energy storage technology development, time-of-use electricity price, abolition of industrial and commercial tariffs, and market-oriented pricing of coal-fired power generation, has an important impact on the electricity market. Upstream power generation enterprises in the power supply chain are affected by various new policies and the cost of energy storage, and they are constantly adjusting their trading price and trading volume to obtain optimal profit. Downstream power users, under the influence of the dual carbon policy and the marketization of commercial and industrial users, also gradually change the type and quantity of power consumption demand to obtain the maximum consumption utility. The upstream power generation companies’ trading strategy and the downstream power consumers’ consumption demand change, and through the price transmission mechanism, the electricity sales companies are bound to develop the optimal upstream power purchase strategy and the optimal downstream electricity sales strategy in the medium- and long-term power market and spot market in order to meet the requirements of various new policies and the power consumers’ demand while achieving the optimal profit and gaining the competitive advantage in the market. As shown in Figure 2, the electricity market players influence each other to make mixed and optimal trading decisions to achieve market equilibrium in the context of the new electricity reform policy.

2.3. Building Model

The NDRC’s “Notice on Further Perfecting the Time-of-Use Electricity Price 1093” puts forward further requirements for the time-of-use electricity price. Therefore, this paper optimizes the power trading in different periods and realizes the optimal trading strategy per period to achieve optimal decision-making throughout the trading period. In the spot market environment, medium- and long-term contracts must be traded with time-scale curves to better balance the power system and, thus, improve the overall efficiency of the power system. Therefore, this paper divides the trading time into T periods, takes the electricity in each period as the subject of trading, organizes the electricity trading between the generation side and the customer side in T periods, and optimizes the trading strategy of the electricity selling companies in each single period t to achieve the optimal decision for the whole trading period.

2.3.1. Consumer Utility Function

In the context of the “double carbon” goal, with the influence of policies and the improvement of users’ environmental awareness, the types and quantities of electricity purchased by users will change. In this paper, the types of power purchased by users were divided into RES power and CES power. To describe users’ power purchasing behavior, the concept of utility was introduced to represent the satisfaction of rational users with their power purchasing behavior. By referring to the literature [58], the user’s utility function was set as follows:
u ( p i , t , q i , t ) = t = 1 T i = 1 2 α i q i . t β i 2 q i , t 2 p i , t q i , t
i = 1 2 q i , t = q t M q 1 , t = λ q t M
where p 1 , t and q 1 , t are the users’ price and quantity of bundled RES power, respectively; p 2 , t and q 2 , t are the users’ price and quantity of CES power, respectively; λ is the quota ratio; q t M is the user real-time load; and α i and β i are the given parameters, respectively.

2.3.2. The Profit Function of Electricity Sales Companies

Electricity sales companies participate in the electricity market according to the needs of users in the wholesale market, who buy electricity sales for end users. The core issue of its decision is how to optimize power purchase in the medium- and long-term market, spot market, and TGC market according to the needs of customers and control the overall power purchase cost and maximize their revenue while meeting the renewable energy consumption target. The profit function of an electricity sales company is given by:
π s = t = 1 T ( i n p i , t q i , t C t E C t G )
C t E = p 1 , t F q 1 , t F + p 2 , t F q 2 , t F + p t R q t R
C t G = ( θ q 1 , t F q t M ) p t G q t M , θ > q 1 , t F q t M 0 ,   θ q 1 , t F q t M
q 1 , t F + q 2 , t F + q t R = q t M
where C t E and C t G are the cost functions of an electricity sales company in the electricity market and TGC market, respectively; p 1 , t F and p 2 , t F are medium- and long-term contract prices for bundled RES power and CES power, respectively; p t R is the spot price; q t R is a green certificate price; q 1 , t F and q 2 , t F are the medium- and long-term contract quantities of bundled RES power and CES power, respectively; q t R is the electricity sales companies’ purchase of electricity in the spot market; and θ is the quota ratio that the electricity sales companies should bear.

2.3.3. RES Power Generator Profit Function

Renewable energy source power generation has strong randomness and volatility, which results in “abandoning wind, photovoltaic and so on”. According to No. 1051 of the NDRC requirements, RES power generators need to configure energy storage equipment. RES power generators can obtain revenue and recover investment costs through markets, such as the electric energy market, TGC market, capacity market, and ancillary services market. Because the construction of the capacity market and ancillary service market is not mature at present, this paper focused on the participation of RES generators in the electricity market and TGC market. The RES power generator’s profit function is given by:
π W = t = 1 T ( R W 1 + R W 2 + R G C W )
where R W 1 , R W 2 , and R G are the income functions of RES power generators in the medium- and long-term markets, the spot market, and the TGC market, respectively; C W is the cost function of the RES power generator.
  • No. 833 stipulates the on-grid price of the new RES project. Therefore, the on-grid price of the RES power will be restricted by the local coal-fired power generation standard price. Since China launched the green power trading pilot last year, the introduction of relevant policies and rules has promoted the rapid development of green power trading. This paper believes that RES power generators participate in medium- and long-term market transactions in the form of the integration of green certificates and power, where medium- and long-term traded electricity is bundled with the corresponding green certificates and sold to customers at the price of p 1 , t F . The profit function of the RES power generator in the medium- and the long-term market is:
R W 1 = t = 1 T p 1 , t F q 1 , t F
p 1 , t F ¯ p 1 , t F p 1 , t F ¯ 0 q 1 , t F q 1 , t max
where p 1 , t F ¯ and p 1 , t F ¯ are the upper and lower limits of the on-grid electricity price of the RES power generator, and q 1 , t max is the maximum power generation of the RES generator unit.
2.
The profit function of the RES power generator in the spot market is:
R W 2 = t = 1 T K t w p t R q t R
where K t w is the bid-winning coefficient of the spot market of the RES power generator; if the bid is won, K t w will be 1, otherwise, K t w will be 0.
3.
If the RES power generator wins the bid in the spot market, the green certificate corresponding to the winning power will be available for sale in the TGC market. The revenue of the TGC corresponding to the spot trading of electricity by RES generators are as follows:
R G = t = 1 T K t w p t G q t R
4.
The cost function for RES generators is referenced from the literature [59] and consists mainly of the operation and maintenance costs of RES generation and energy storage:
C W = t = 1 T ( k W P W ( t ) + k S B P S B ( t ) ) t
P S B ( t ) = | q 1 , t F + K t w q t R P W T ( t ) |
0 P S B ( t ) P S B . max
where k W and k S B are the operation and maintenance cost coefficients of energy storage and power generation, respectively; P W ( t ) and P S B ( t ) are the RES power output and energy storage charging and discharging power, respectively; t is the duration of the energy storage charging and discharging power; and P S B . max is the maximum capacity of the energy storage charge and discharge.

2.3.4. CES Power Generator Profit Function

No. 1439 expands the upper and lower floating ratios of the on-grid price of coal-fired power generation to 20%, and the CES power generators will greatly adjust their trading decisions accordingly. The profit function of the CES power generator is:
π F = t = 1 T ( R F 1 + R F 2 C F )
where R F 1 and R F 2 are the income of the CES power generator in the medium- and long-term and spot markets, respectively; C F is the cost of the CES power generator.
  • The medium- and long-term market income function of the CES power generator is:
R F 1 = t = 1 T p 2 , t F q 2 , t F
p 2 , t F ¯ p 2 , t F p 2 , t F ¯ 0 q 2 , t F q 2 , t max
where p 2 , t F ¯ and p 2 , t F ¯ are the upper and lower limits of the on-grid price of the CES power generator, respectively; q 2 , t max is the maximum generation capacity of the CES generators.
2.
The spot market income function of the CES power generator is:
R F 2 = t = 1 T K t f p t R q t R
where the value and meaning are similar to that of K t w .
3.
The cost function of the CES power generator is referenced from the literature [60]:
C F = t = 1 T 0 . 05 a q 2 , t F 2 + b q 2 , t F + c + K t f ( 0.05 a q t R 2 + b q t R + c )
where a and b are the cost coefficient of the CES power generator greater than 0; c is the fixed cost.

2.4. The Trading Decision of Electricity Sales Companies under the Influence of New Electricity Reform Policies

At any time, the transaction power and price of each subject of electricity trading are uncertain. In this section, under the premise of providing the medium- and long-term contract price of electricity sales companies and the user load curve, the contract power limitation between the electricity sales companies and power generators was considered. The electricity purchasing strategy of electricity sales companies was analyzed. Because electricity sales companies are user oriented, based on user utility maximization, the optimal user’s purchasing power price was obtained by the quantity–price constraint relationship in Reference [58]. The optimal decision model of an electricity sales company was transformed into the solving cost minimization. The model is as follows:
min ( C t E + C t G )

2.4.1. Non-Mixed Decision-Making between Medium- and Long-Term and Spot Markets for an Electricity Sales Company

In the medium- and long-term and spot markets, for non-mixed decision-making, based on bundled RES power and “CES power + TGC” prices, electricity sales companies choose different power generators to sign a medium- and long-term contract, and while the medium- and long-term market purchases insufficient electricity, electricity sales companies will participate in spot market transactions to meet user demand. To simplify in writing, the following analysis omits the subscript t, and the electricity sales company’s purchase strategy is as follows:
  • Electricity purchase in medium- and long-term markets:
If p 1 F p 2 F + p G :
q 1 F = q M , q 2 F = 0       q 1 , max F q M q 1 F = q 1 , max F ,   q 2 F = q M q 1 , max F ,   q M q 2 , max F q 1 , max F < q M q 1 F = q 1 , max F ,   q 2 F = q 2 , max F q 2 , max F < q M q 1 , max F
If p 1 F > p 2 F + p t G :
q 1 F = 0 , q 2 F = q M     q 2 , max F q M q 1 F = q M q 2 , max F , q 2 F = q 2 , max F ,   q M q 1 , max F q 2 , max F < q M q 1 F = q 1 , max F , q 2 F = q 2 , max F q 1 , max F < q M q 2 , max F
2.
Electricity purchase in the spot market:
q R = q M q 1 F q 2 F , q M > q 1 F + q 2 F 0 ,       q M q 1 F + q 2 F

2.4.2. Mixed Decision-Making between Medium- and Long-Term and Spot Markets for an Electricity Sales Company

With the development of the market system linking the medium- and long-term and spot markets, electricity sales companies can make mixed trading decisions. When the spot price is low, the planned purchase of electricity in the spot market reduces the cost of purchasing electricity. The decision to mix all of the electricity in the spot transaction with the electricity in the medium- and the long-term transaction is likely to cause great uncertainty. Therefore, a part of the electricity, q 1 R , in the spot transaction is mixed with all of the electricity in the medium- and long-term transactions. The other part of the electricity, q 2 R , in the spot transaction is used for the mixed transaction decision and balancing the deviation of the electricity purchase and user load for mixed transaction decisions in the medium- and long-term and spot markets.
Before the transaction was carried out, the electricity sales companies forecast the user load, medium- and long-term electricity prices, and spot electricity prices for every single period, and presets the ratio of the medium- and long-term and spot traded electricity in period t. It flexibly selects the purchase mix based on the relationship between the high and low prices of bundled RES power, CES power, unbundled RES electricity, and green certificates and determines the decomposition of the medium- and long-term contracts for CES power and bundled RES power, spot market electricity, and the purchase of green certificates in period t.
The electricity sales company used the above strategy to develop medium- and long-term trading, spot trading for bundled RES and CES power, and green certificate trading curves in T. Accordingly, it entered into medium- and long-term contracts with generators for bundled RES and CES power, and the purchase electricity of q 1 R in the spot market. q 2 R can be adjusted according to the actual transaction situation. Under this strategy, the green certificate trading volume was also broken down by period, and the electricity sales company could sum the green certificate volume for all periods and complete the green certificate purchase within the RPS performance time.
Therefore, this section divides the electricity sales companies’ purchase of electricity in the spot market into the decision-making part of the electricity purchase, q 1 R , and the deviation part of the electricity purchase, q 2 R . When the electricity retail company made mixed decision-making in the medium- and long-term and spot markets, the cost function of the electricity retail company was as follows:
C E + C G = p 1 F q 1 F + p 2 F q 2 F + p R q 1 R + p R q 2 R + η ( θ q 1 F q M ) p G q M
where η = 1 and η = 0 denote the purchase or non-purchase of green certificates by the electricity sales companies, respectively. Obviously, because of the uncertainty of the ratio, green certificate price, spot price, and user load, the cost function is a stochastic programming problem with multiple random variables. The function is transformed into the following function by the system power constraint:
C E + C G = ( p 1 F p R η p G ) q 1 F + ( p 2 F p t R ) q 2 F + p R q M + η θ p G q M
At this point, the objective function contains two decision variables: q 1 F and q 2 F . At any time, if the power purchase cost is minimized, it is equivalent to the problem of finding the minimum value on the rectangular closed area:
min ( C E + C G )
s . t 0 q 1 F q 1 , max F 0 q 2 F q 2 , max F
Let γ = p 1 F p R η p G and ν = p 2 F p R , because the price relations of bundled RES power, “CES power + TGC” price, and “spot + TGC” price are also uncertain. That is, γ and ν are random variables. To simplify the calculation, the quota ratio and green certificate price are given, and the spot price and user load are predicted. Then, the optimal purchasing strategy of the electricity sales companies is obtained through the optimality conditions as follows:
  • Medium- and long-term and spot market decision-making partial purchase of electricity:
(1) If p 1 F = min ( p 1 F , p 2 F + p G , p R + p G ) :
If p 1 F < p 2 F < p R :
q 1 F = q M , q 2 F = 0 , q 1 R = 0       q 1 , max F q t M q 1 F = q 1 , max F , q 2 F = q M q 1 , max F , q 1 R = 0 q M q 1 , max F < q 2 , max F < q M q 1 F = q 1 , t , max F , q 2 F = q 2 , max F , q 1 R = q M q 1 , max F q 2 , max F q M q 1 , max F q 2 , max F
If p 1 F < p 2 F < p R :
q 1 F = q M , q 2 F = 0 , q 1 R = 0       q 1 , max F q M q 1 R q 1 F = q 1 , max F , q 2 F = q M q 1 , max F q 1 R , q 1 R = q 1 , max R   q M q 2 , max F q 1 R q 1 , max F < q M q 2 , max F q 1 F = q 1 , max F , q 2 F = q 2 , max F q 1 , max F < q M q 2 , max F q 1 R
If p 1 F < p 2 F < p R :
q 1 F = q M q t 1 ,   q 2 F = 0 , q 1 R = 0   q 1 , max F q M q 1 R q 1 F = q 1 , max F , q 2 F = q M q 1 , max F q 1 R , q 1 R = q 1 , max R q M q 2 , max F q 1 R q 1 , max F < q M q 1 R q 1 F = q 1 , max F   , q 2 F = q 2 , max F ,   q 1 R = 0   q 1 , max F < q M q 2 , max F q 1 R
If p 1 F < p 2 F < p R :
q 1 F = 0 , q 2 F = q M , q 1 R = 0 q 2 , max F q M q 1 F = q t M q 2 , max F , q 2 F = q 2 , max F ,   q 1 R = 0 q M q 1 , max F q 2 , max F < q M q 1 F = q 1 , max F ,   q 2 F = q 2 , max F ,   q 1 R = q M q 1 , max F q 2 , max F q 2 , max F < q M q 1 , max F
(2) If p 2 F + p G p 1 F p R + p G :
q 1 F = 0 , q 2 F = q M , q 1 R = 0     q 2 , max F q M q 1 F = q t M q 2 , max F , q 2 F = q 2 , max F   ,   q 1 R = 0     q t M q 1 , max F q 2 , max F < q M q 1 F = q 1 , max F , q 2 F = q 2 , max F , q 1 R = q M q 1 , max F q 2 , max F q 2 , max F < q M q 1 , max F
(3) If p 2 F + p G p R + p G p 1 F :
q 1 F = 0 , q 2 F = q M , q 1 R = 0 q 2 , max F q M q 1 F = q M q 2 , max F q 1 R , q 2 F = q 2 , max F , q 1 R = 0 q M q 1 , max F q 1 R q 2 , max F q M q 1 , max F q 1 F = q 1 , max F , q 2 F = q 2 , max F , q 1 R = q 1 , max R       q 2 , max F < q M q 1 , max F q 1 R
(4) If p R + p G p 1 F p 2 F + p G :
q 1 F = q M q 1 R , q 2 F = 0 , q 1 R = 0       q 1 , max F q M q 1 R   q 1 F = q 1 , max F , q 2 F = q t M q 1 , max F q t 1 , q 1 R = 0 q M q 1 R q 2 , max F q 1 , max F < q M q 1 F = q 1 , max F , q 2 F = q 2 , max F , q 1 R = q 1 , max R       q 1 , max F < q M q 2 , max F q 1 R q 1 R
(5) If p R + p G p 2 F + p G p 1 F :
q 1 F = 0 , q 2 F = q M q 1 R , q 1 R = 0       q 2 , max F q M q 1 R q 1 F = q M q 2 , max F q 1 R , q 2 F = q 2 , max F , q 1 R = 0 q M q 1 , max F q 1 R q 2 , max F < q M q 1 R   q 1 F = q 1 , max R , q 2 F = q 2 , max F , q 1 R = q 1 , max R       q 2 , max F < q M q 1 , max R q 1 R
2.
The spot market deviation part of purchased electricity:
q 2 R = q M q 1 F q 2 F q 1 R   , q M > q 1 F + q 2 F + q 2 F 0 , q M q 1 F + q 2 F + q 2 F  

3. Results

3.1. Example Hypothesis and Parameter Settings

In recent years, China’s power system reform has been vigorously promoted and has achieved phased results; however, in the case of tighter power supply, the power spot market price is still relatively stable and has a large gap with the price ceiling, and the role of the spot market to discover the price of scarce power is limited. In addition, China’s green certificate trading volume is low, and the real price of green certificates also needs to be further explored. Considering that the Pennsylvania–New Jersey–Maryland (PJM) market in the United States is currently a more mature international electricity market, and the current construction of the electricity market in Guangdong, Zhejiang and other provinces in China has also referred to the PJM market to some extent, this paper adopted the data of a typical region in the PJM market and took 7 × 24 periods of the next 7 trading days as an example to conducted a simulation of the electricity trading decisions of electricity sales companies, CES generators, and RES generators and perform an analysis.
This paper assumed that in the electricity market, an electricity sales company signs a medium- and long-term contract with a CES power generator and an RES power generator. The power generation of the CES and RES power generators can all participate in medium- and long-term market transactions. It was assumed that the electricity sales companies and the user should bear the same quota ratio; the electricity sales companies’ spot transaction electricity accounted for 10% and q 1 R accounted for 5%. The medium- and long-term contract price of CES was based on the PJM market node marginal price. According to No. 833, the medium- and long-term contract price of bundled RES power was set as the sum of the medium- and long-term contract prices of CES and the TGC price. The basic parameters involved were as follows: the installed capacity of RES power generation was 645 MW; the energy storage capacity was 64.5 MW/h; the operation and maintenance cost coefficient of the RES power generator was 0.0013 USD/(kW/h); and the energy storage cost coefficient was 0.0019 USD/kW hr. The maximum output per hour of the CES power generator was 1200 MW, and the cost coefficient a was 0.011 USD·((MW)2·hr.)−1; b was 25.265 USD·(MW·hr.)−1; c was USD 0; α 1 was 115; α 2 was 100; β 1 was 0.0541; and β 2 was 0.0642. The quota ratio was 0.3, and the TGC price was USD 20 each.

3.2. Data Prediction

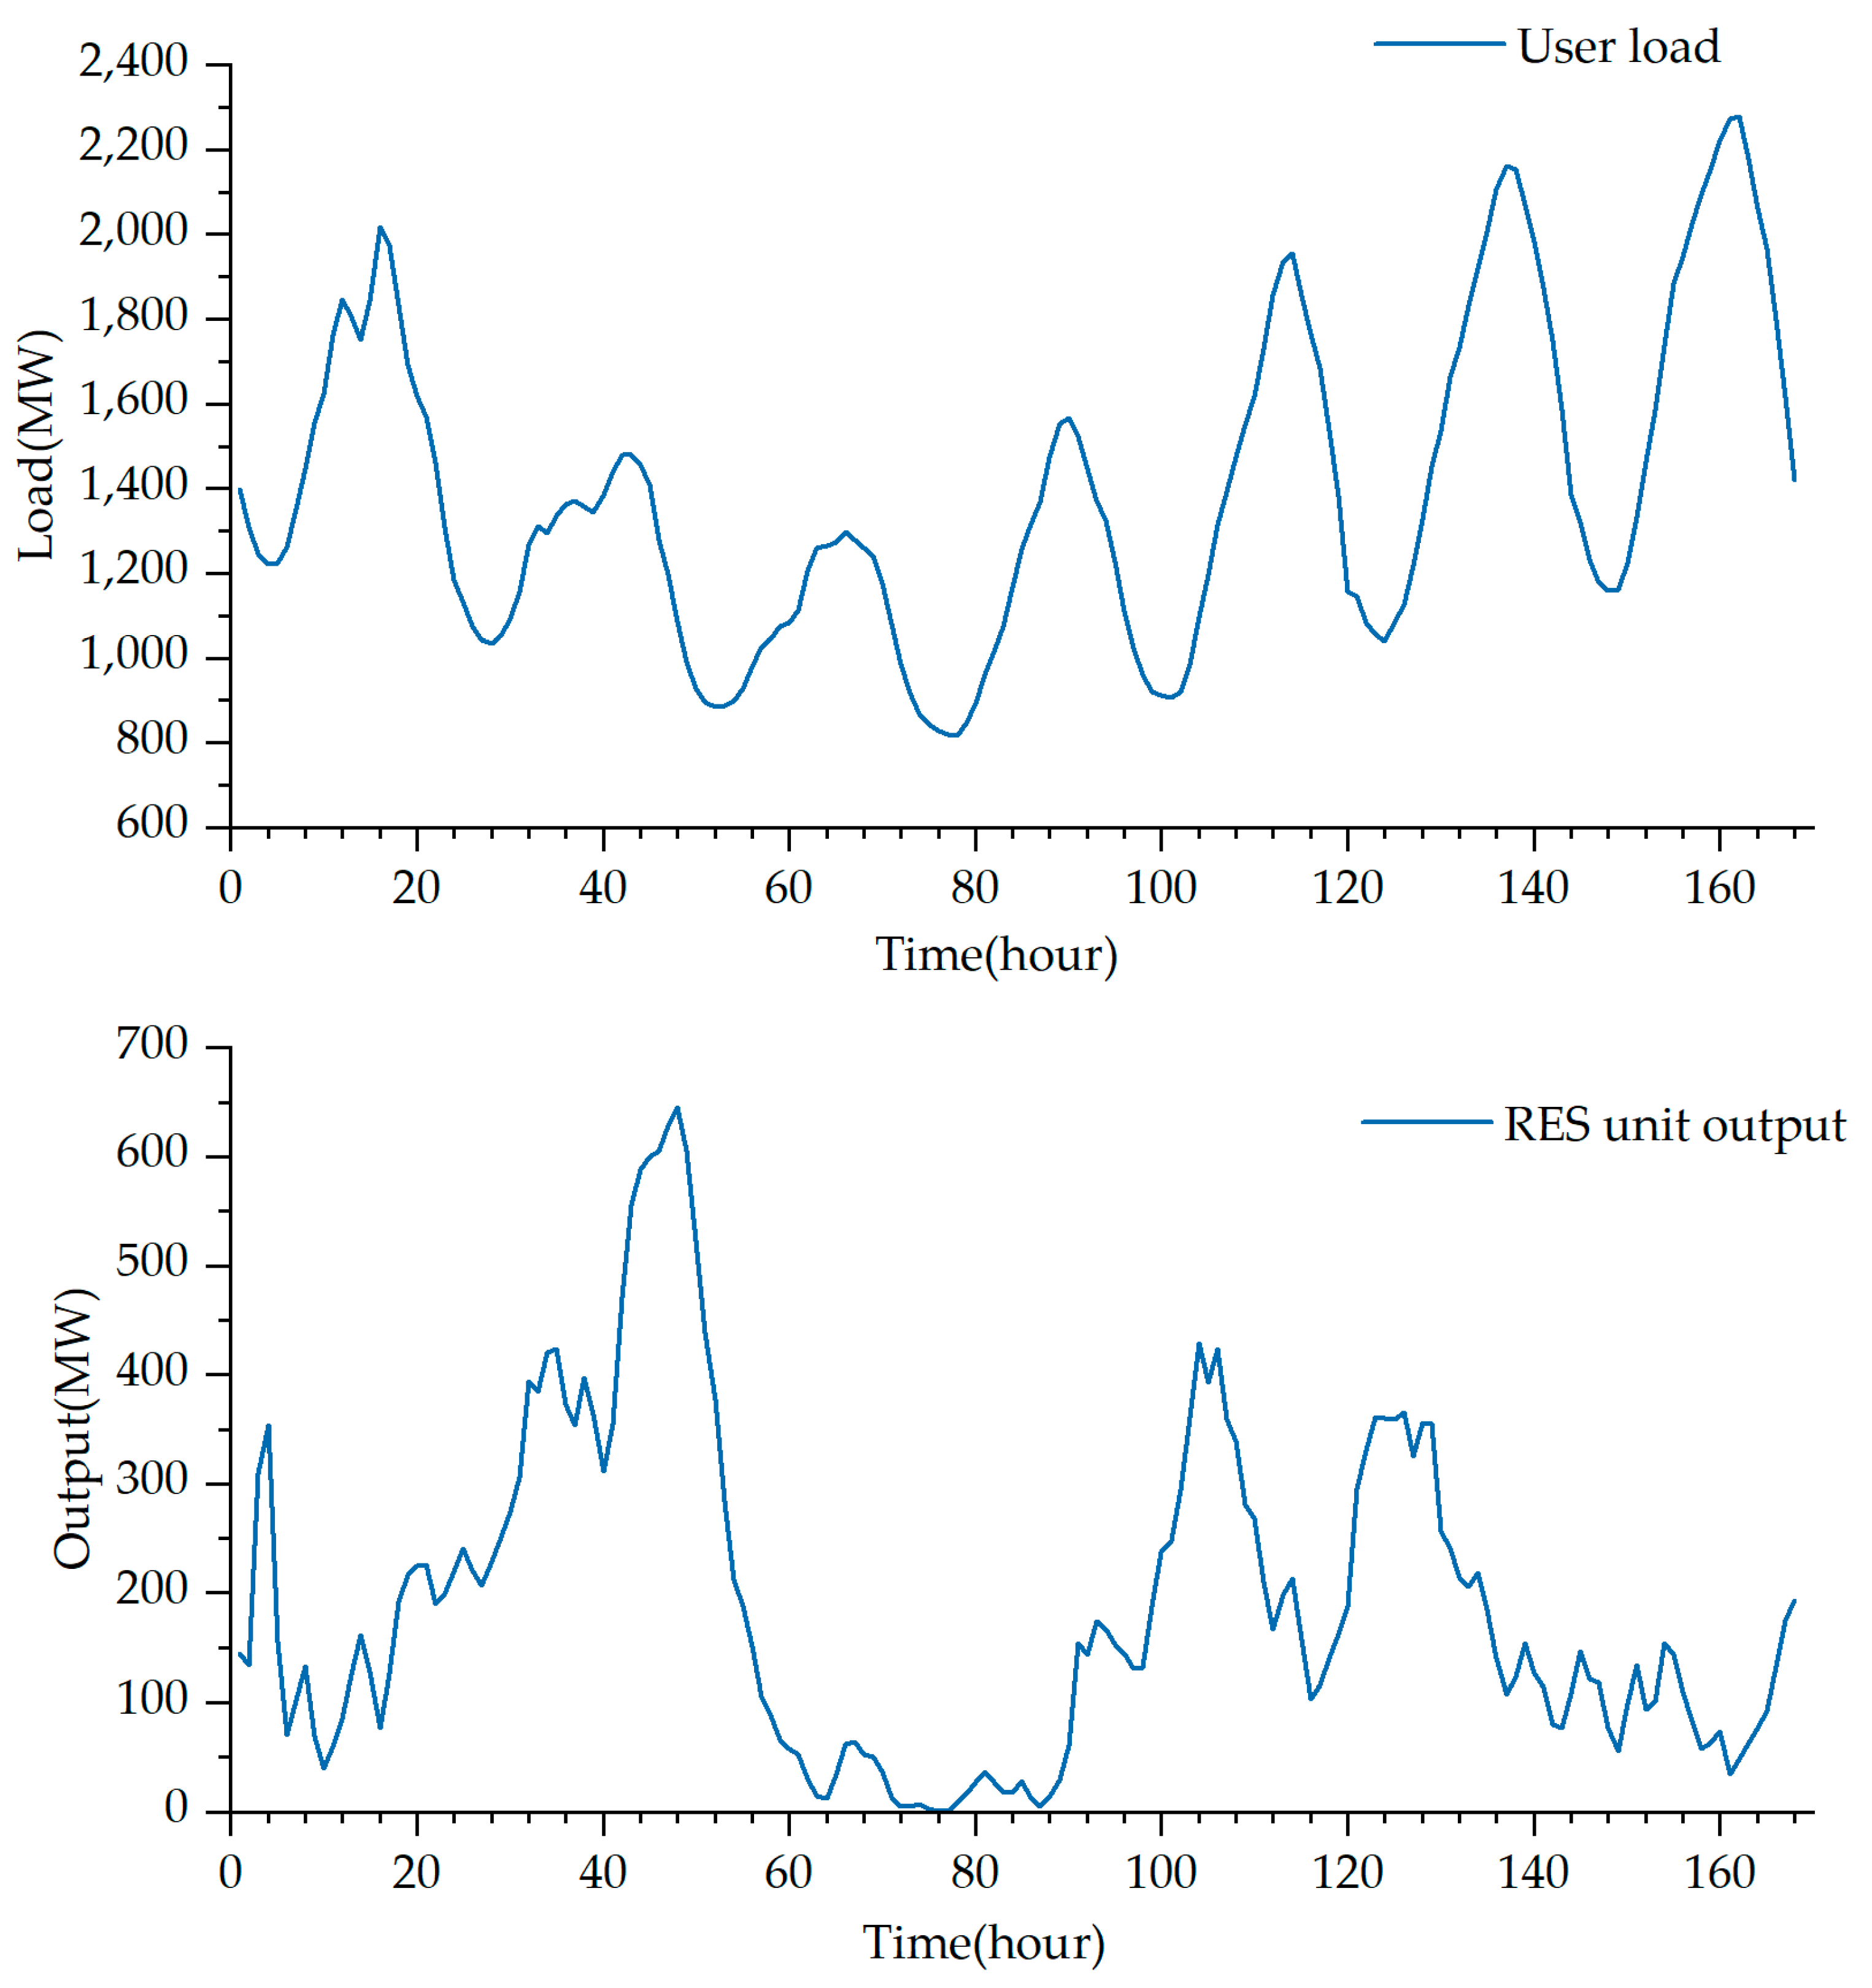
The user load and RES unit output are important factors in the trading decisions of electricity sales companies. In this paper, the user load and RES unit output were predicted by 168 h from 1 to 7 July 2021, as shown in Figure 3.
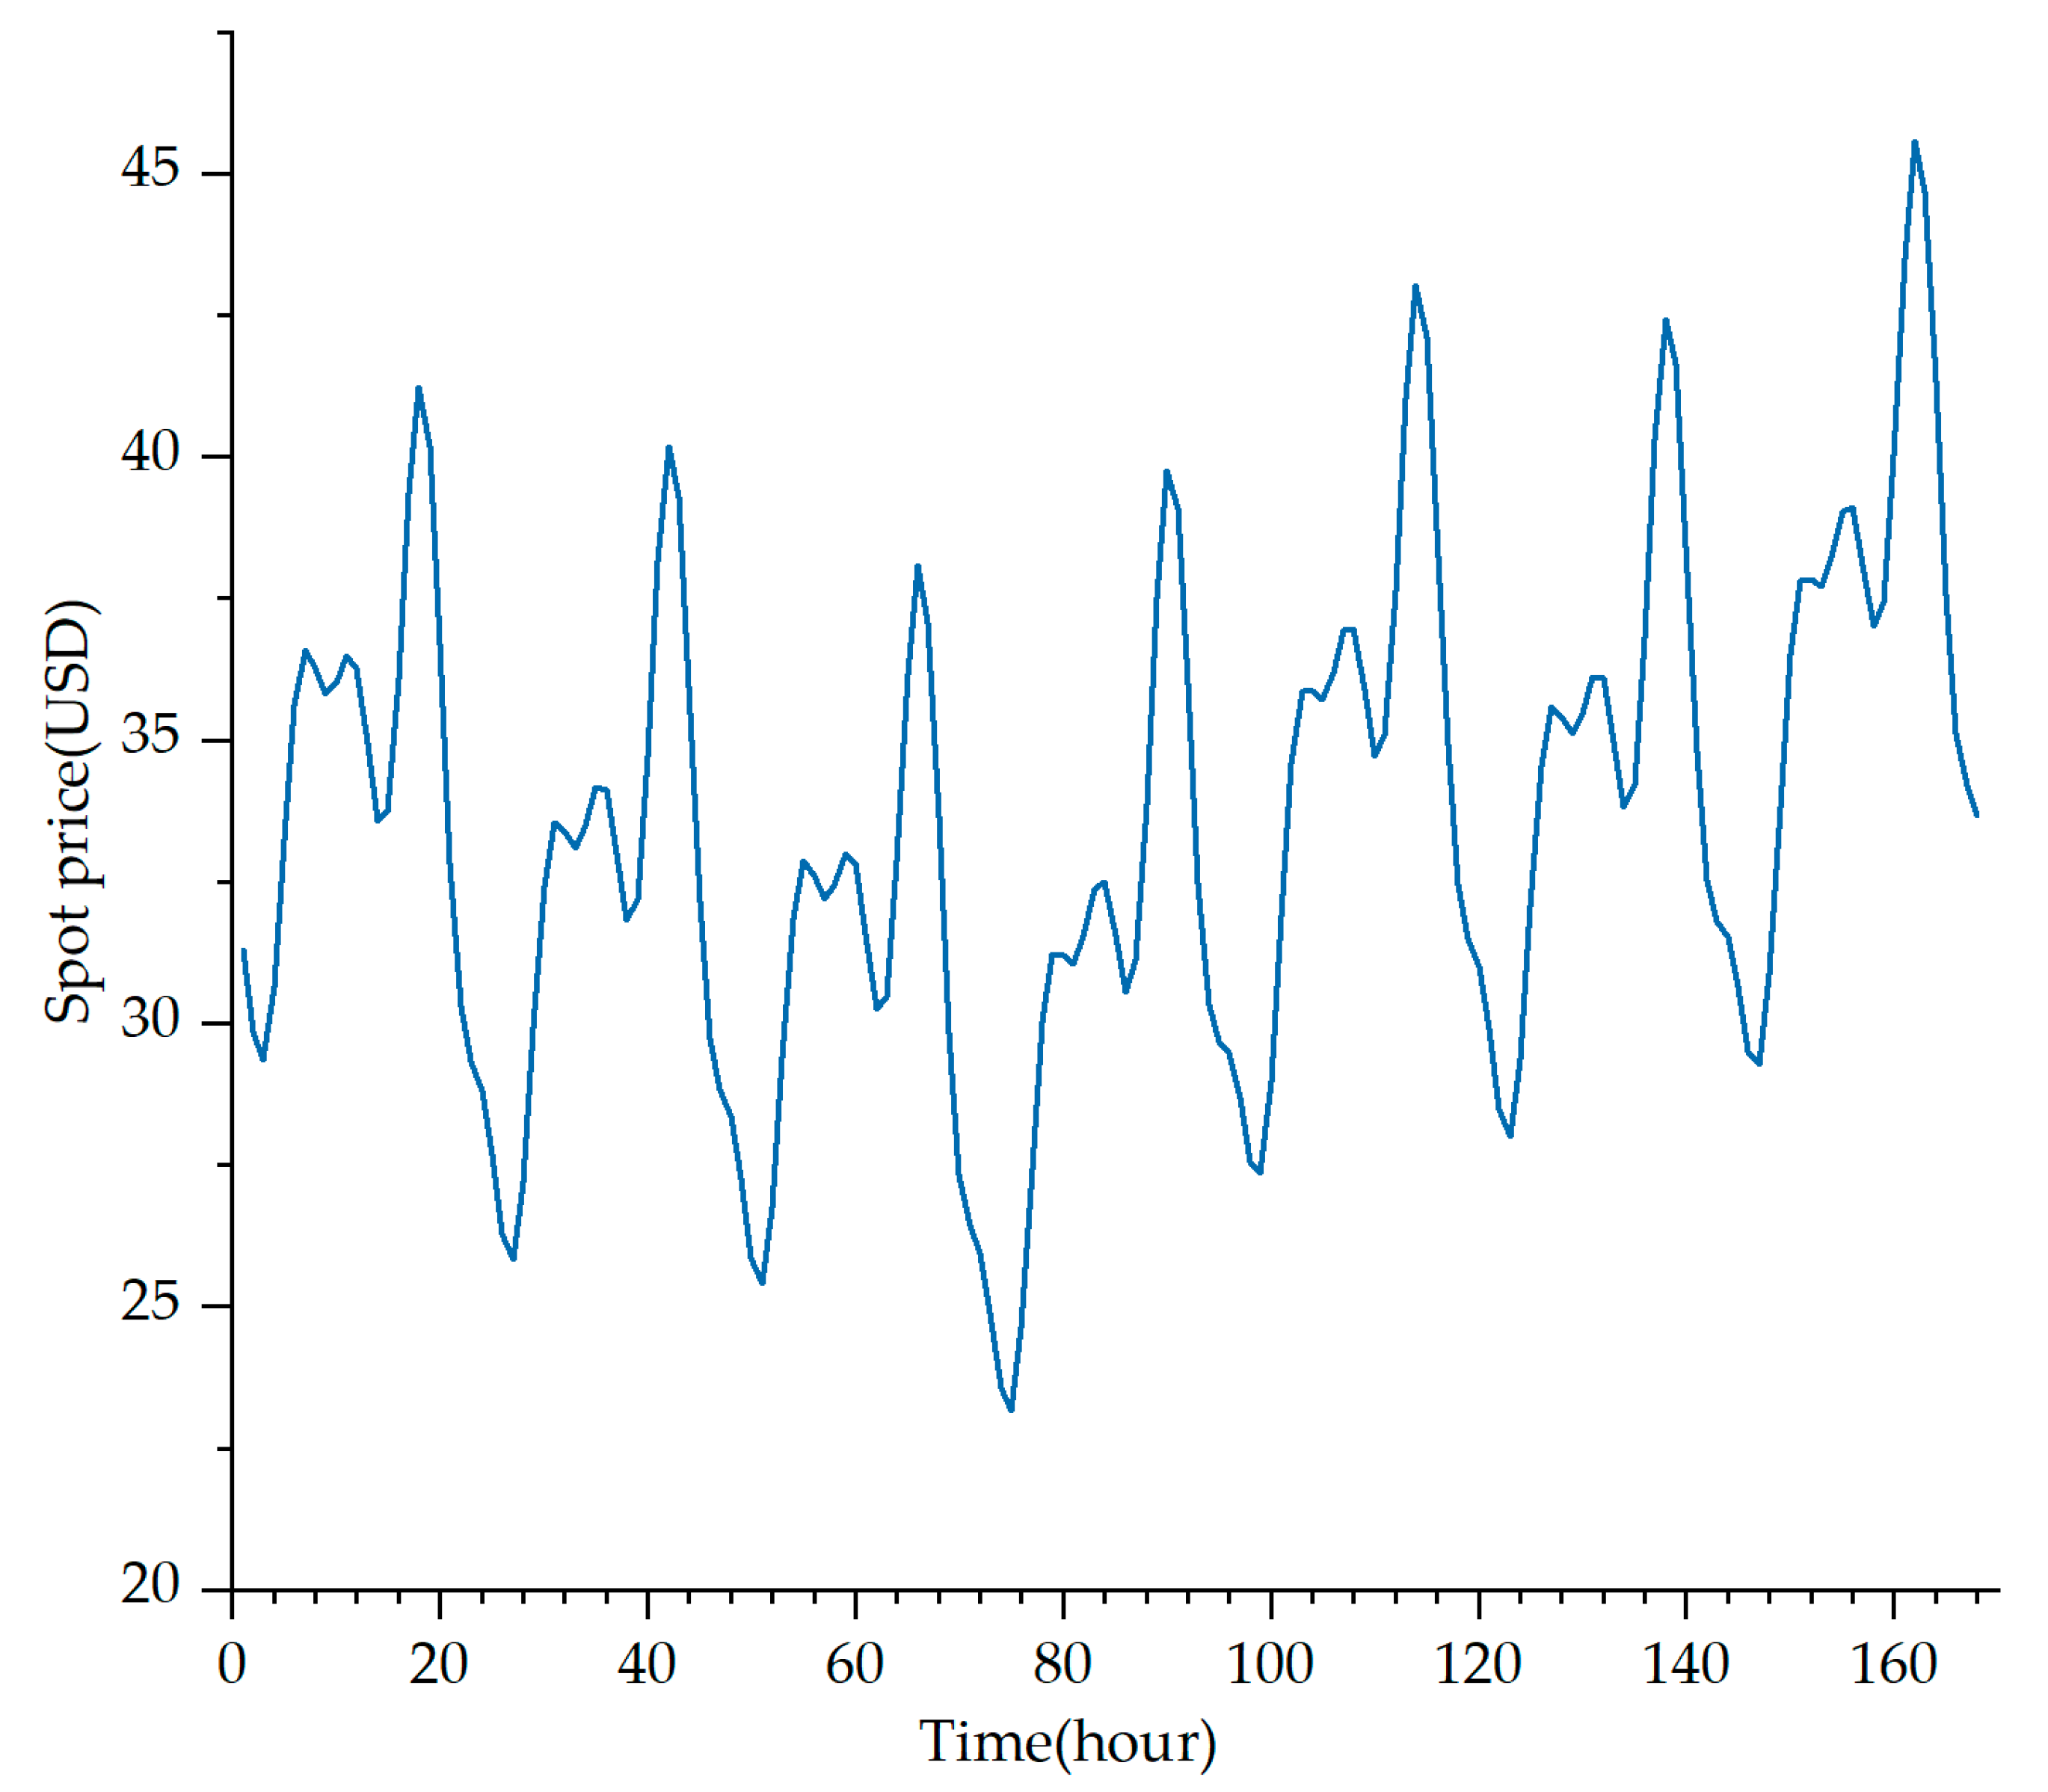
Electricity spot prices are highly volatile due to supply and demand. Electricity sales companies must predict the spot price to determine the purchase strategy. Since there were some power outages in the United States last year that led to extreme electricity prices at certain moments, the prophet model usually handled outliers well and made it easier to complete learning from a small amount of data. Therefore, the prophet model was used to forecast the spot price for the next 168 h. The spot price data are based on the node marginal price of the PJM market in the first six months of 2021. The growth function selected the logistic regression function, and the frequency of the time series was set to be small. The other parameters were default values. The spot price is predicted in Figure 4.

3.3. Analysis of the Trading Results under Different Decisions of the Electricity Sales Companies

Based on the above parameter settings and data prediction, the green certificate cost, RES electricity power purchases, and the profits of each trading subject in the electricity market can be calculated under the mixed decision-making and non-mixed decision-making of the medium- and long-term market and spot market of an electricity sales company.
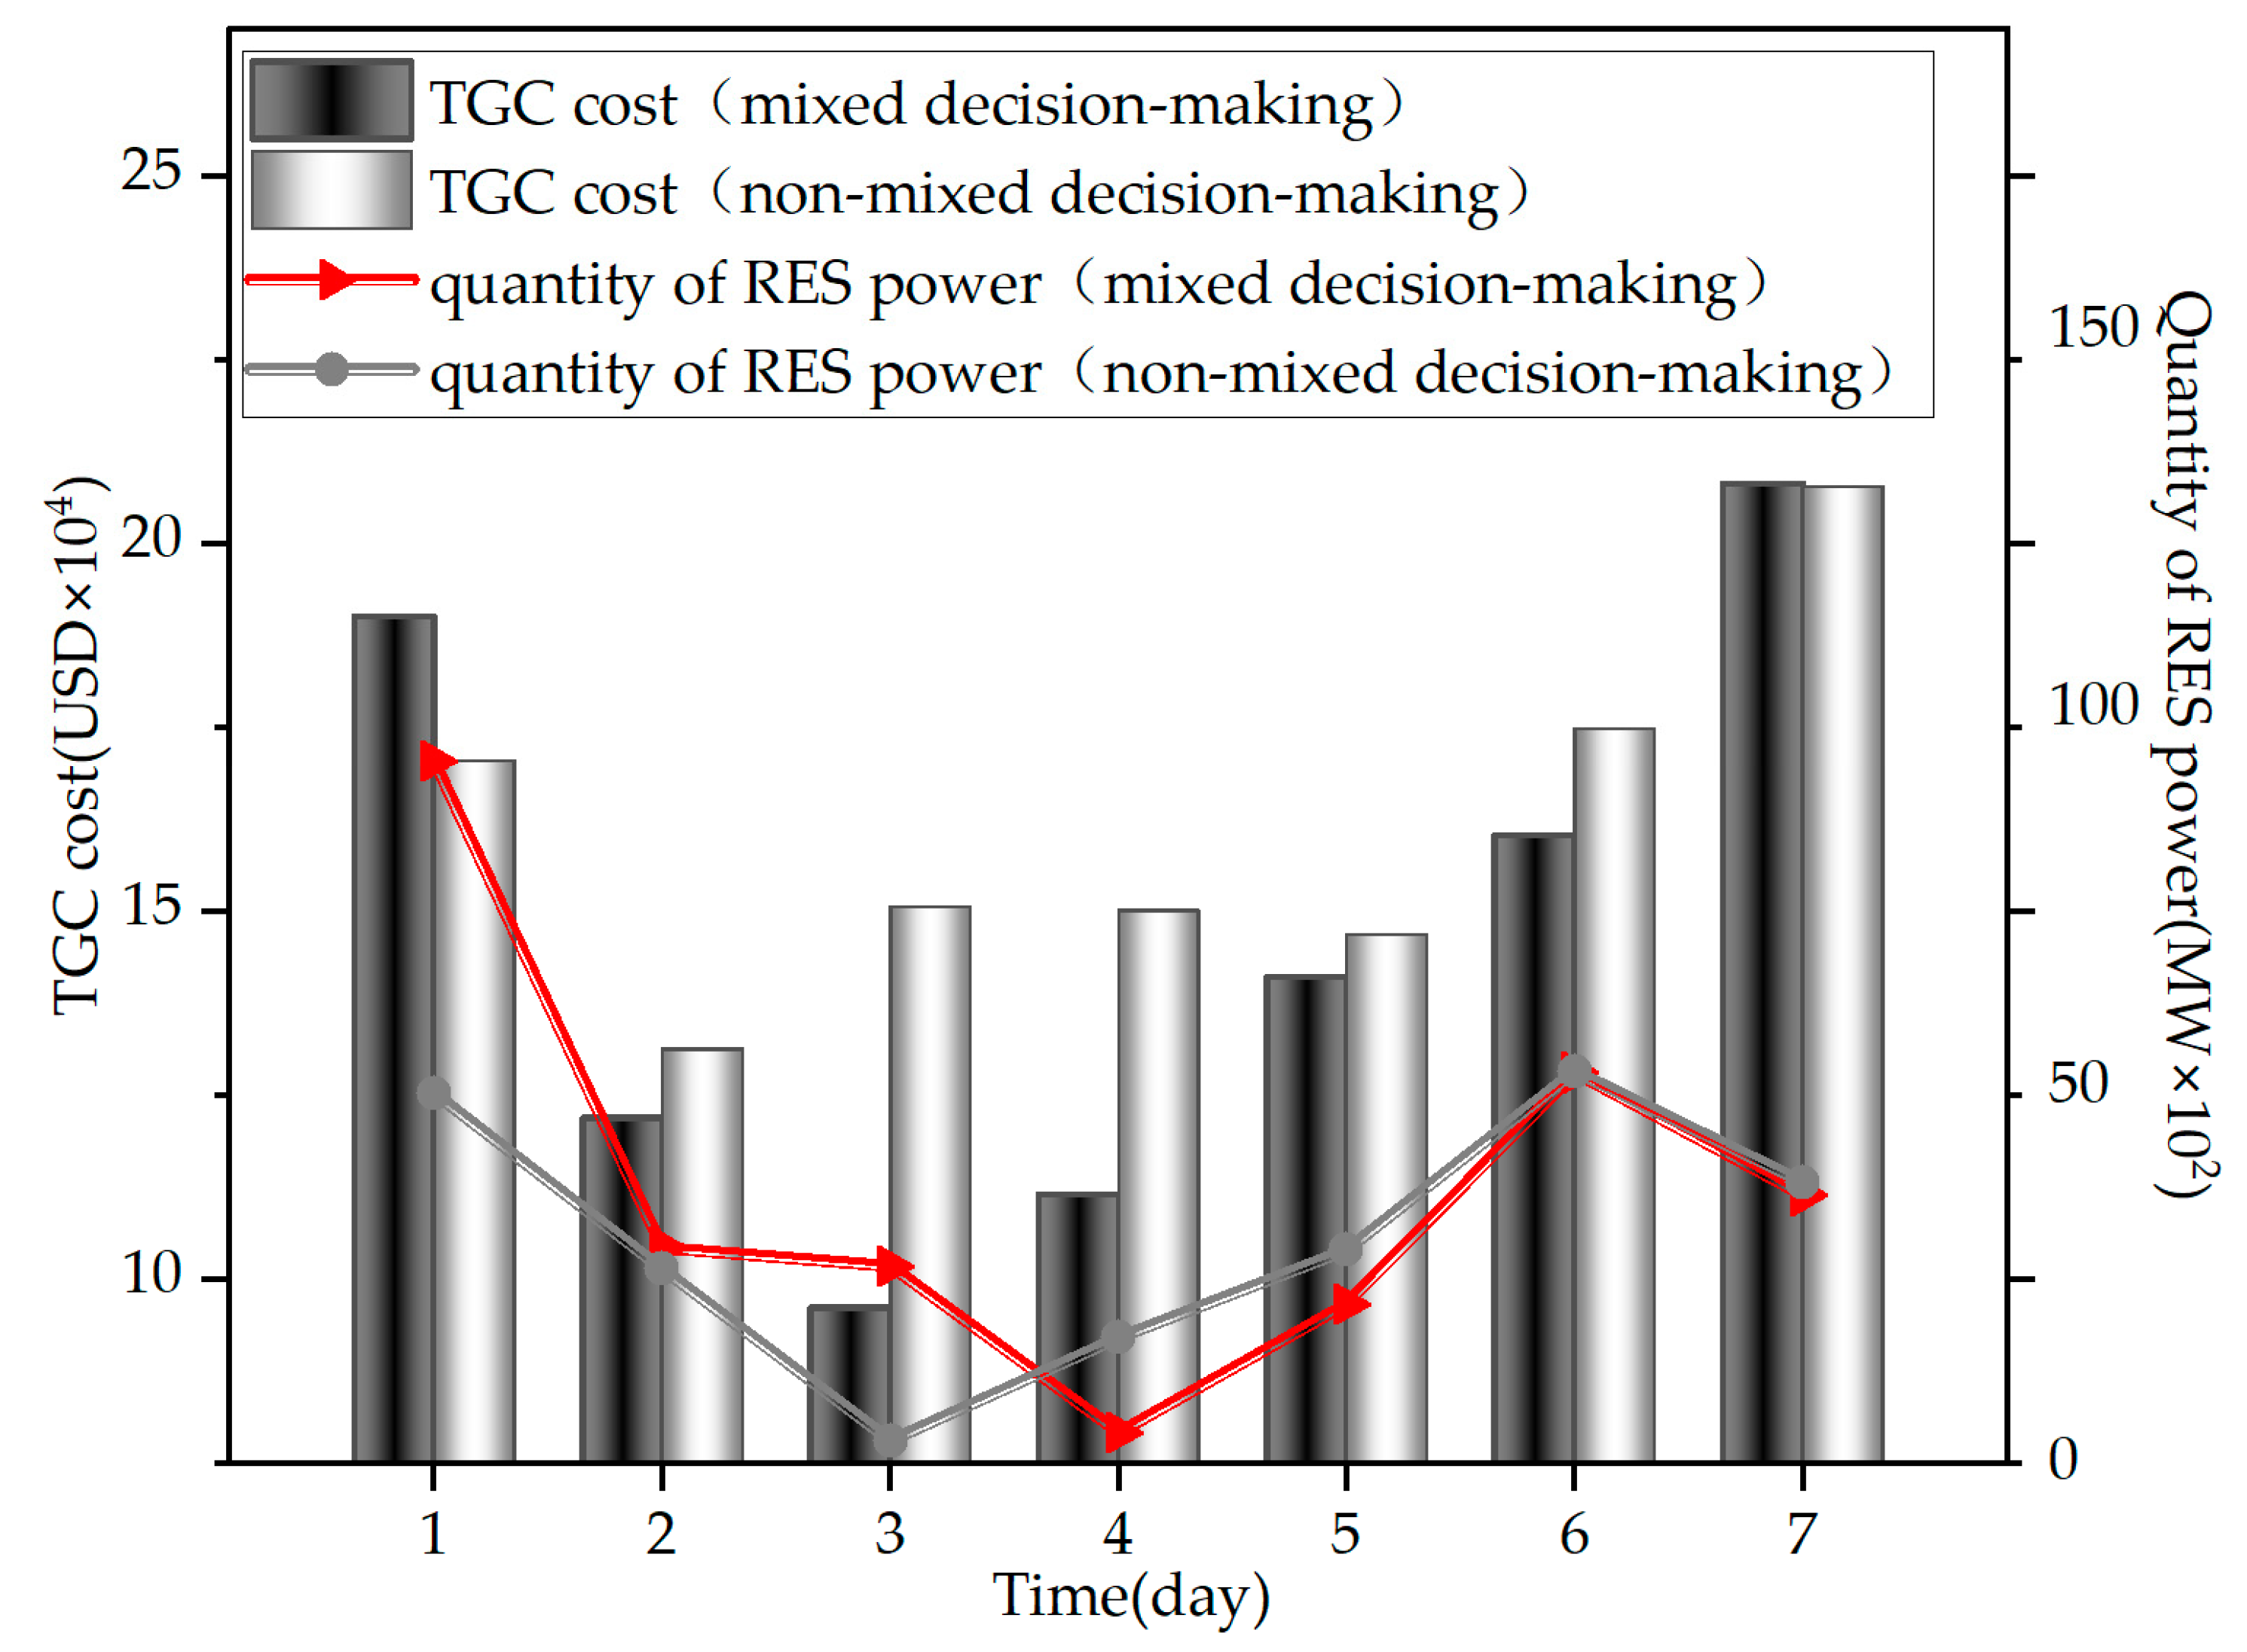
Figure 5 shows the green certificate costs and RES power purchases of electricity selling companies under the mixed and non-mixed decisions in the medium- and long-term and spot markets. When the electricity selling company adopted a mixed decision, the RES electricity purchase volume was higher than that of the non-mixed decision on the first three trading days, and the opposite was true on the fourth and fifth trading days. The RES power purchase volume in the period was 4837.37 MW more than that of the nonhybrid decision, while the green certificate cost was higher than that of the nonhybrid decision for only two trading days, and the green certificate cost was significantly lower on other trading days. This suggests that, in the long run, the hybrid decision will increase RES power purchases and reduce green certificate costs for electricity sellers.
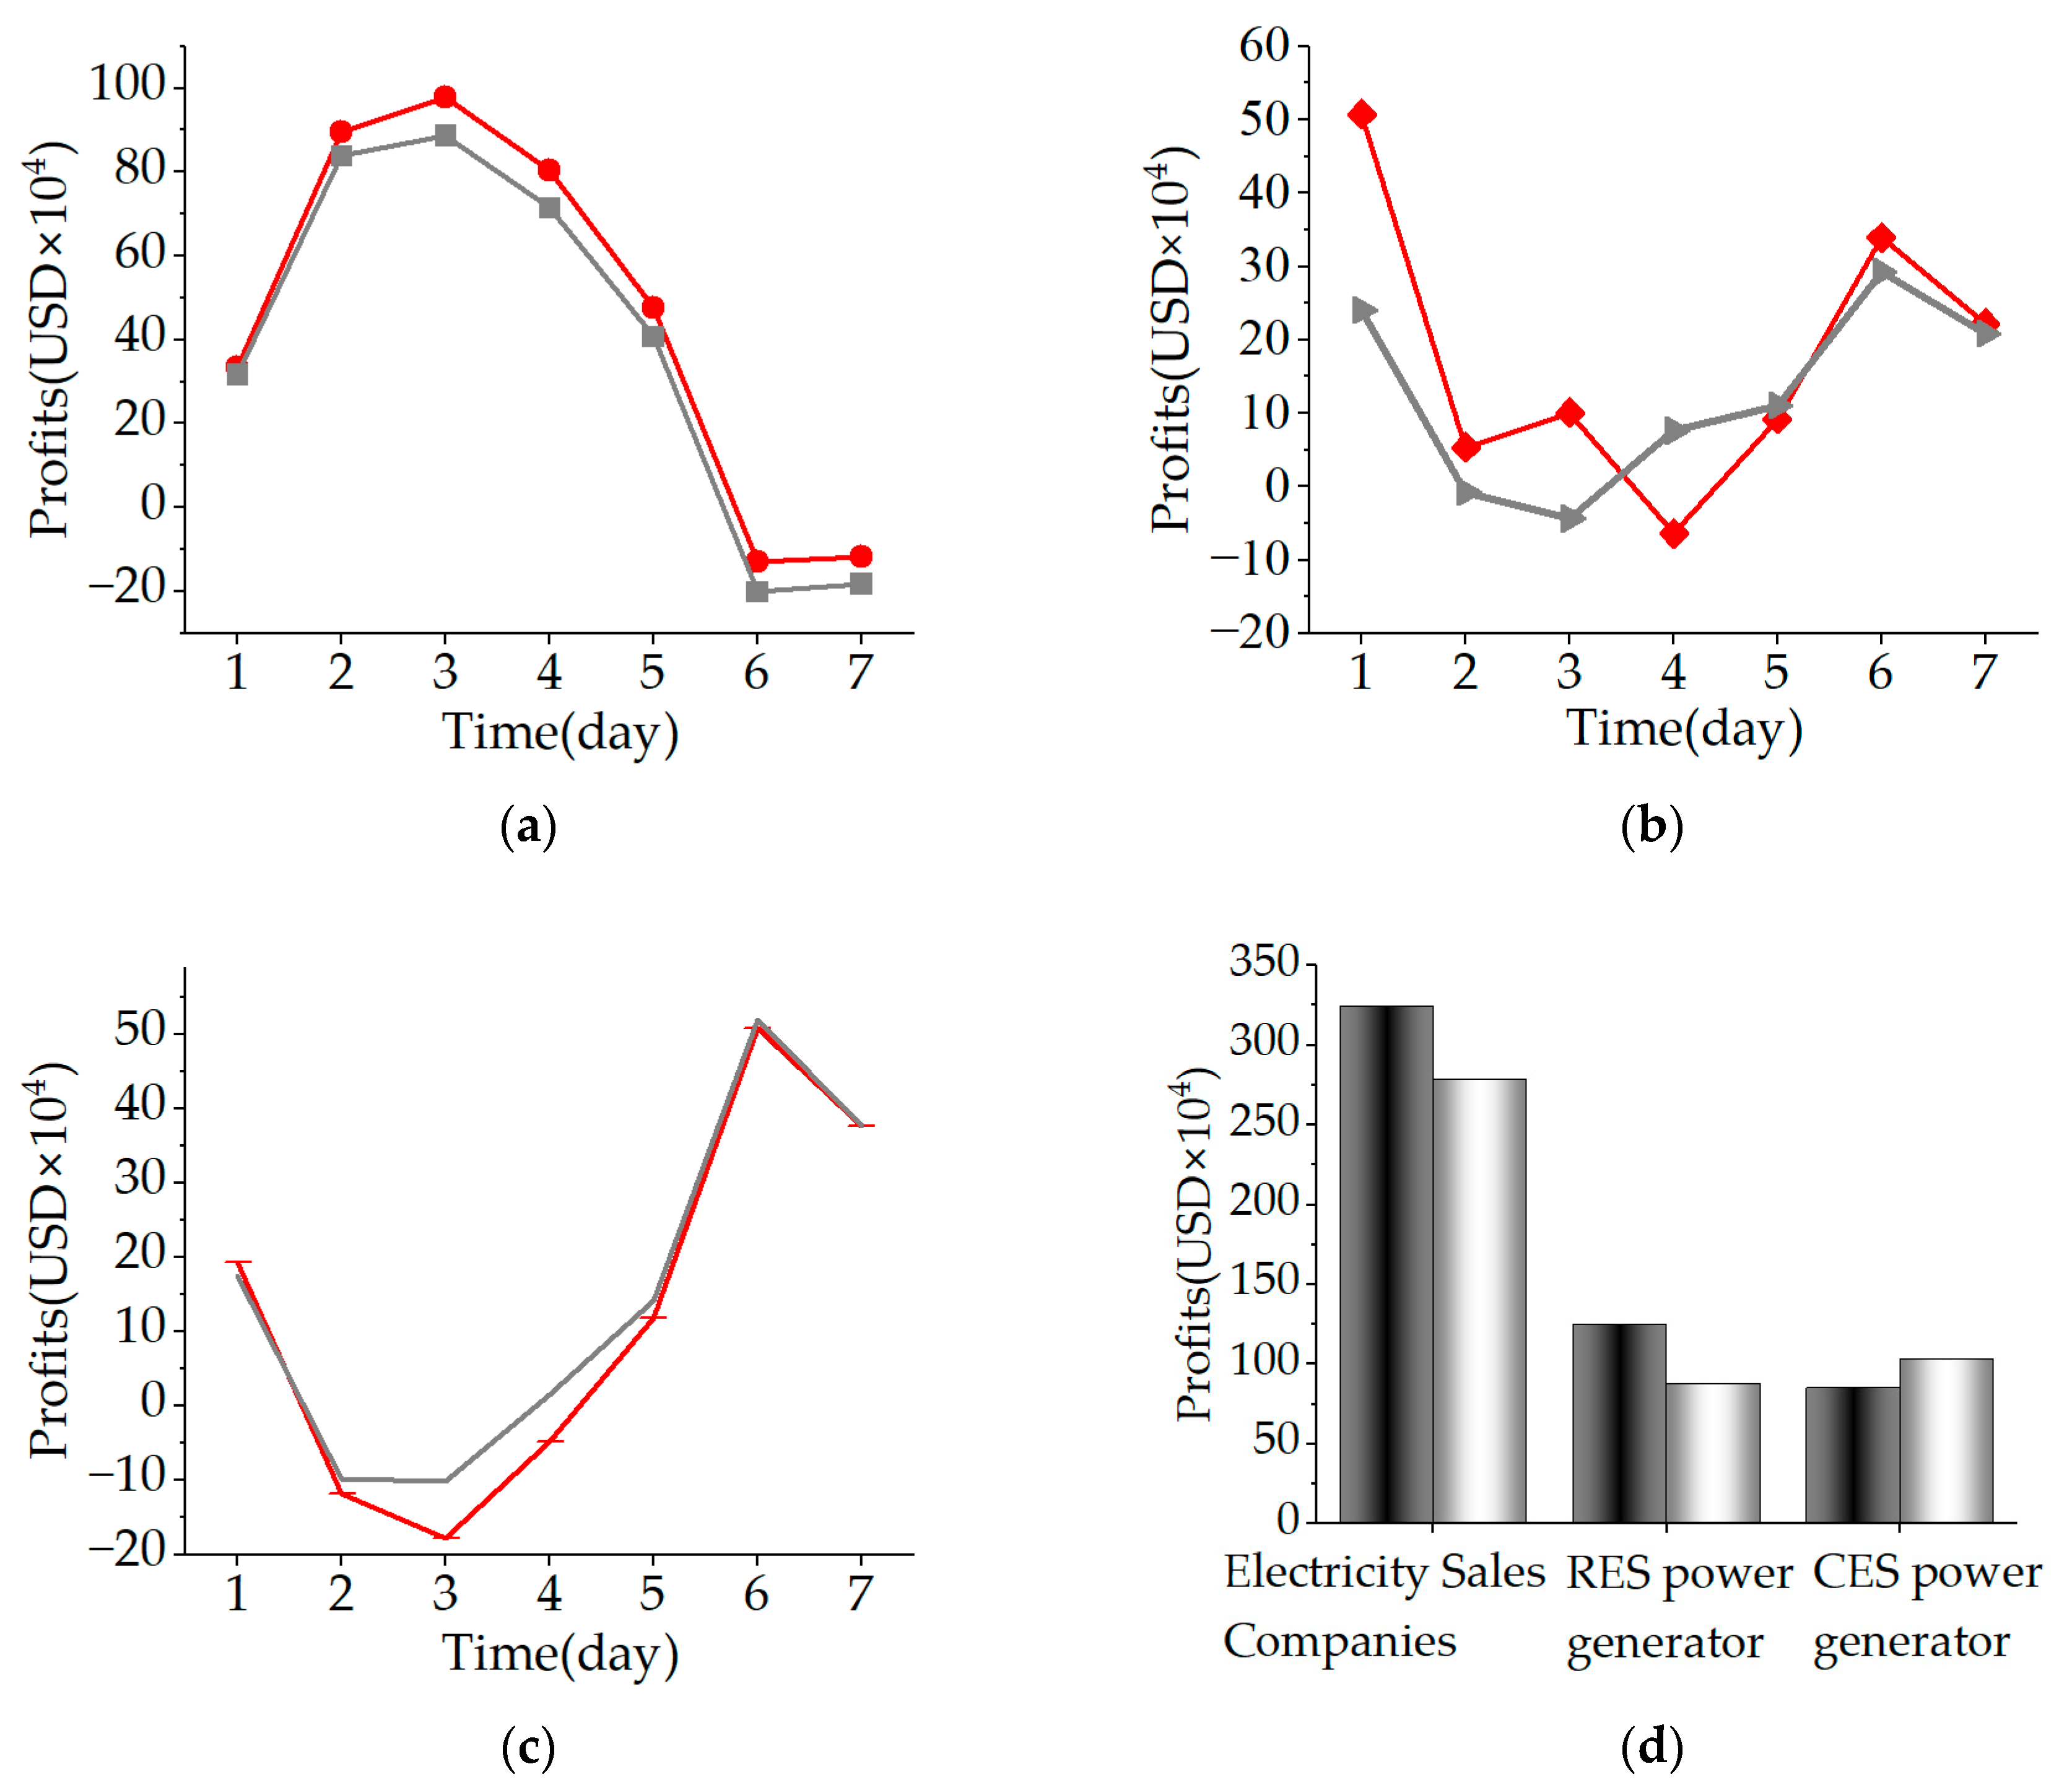
Figure 6 shows the profit and total profit for each subject of the mixed and non-mixed decision trading in the medium- and long-term with the spot market on the trading day. The results of the mixed and non-mixed decisions are shown by the red and gray lines, respectively. It can be seen from Figure 6a that the profit of the electricity sales company was higher than that of the non-mixed decision in the next seven trading days when the electricity sales company adopted the mixed decision of the medium- and long-term and spot market. The profit difference on the first day was the smallest. The profit of the mixed decision was USD 333,889.70, and the profit of the non-mixed decision was USD 316,800.26, which increased by 5.39%. The profit difference on the third day was the largest, and the profits of the two decisions were USD 980,030.40 and USD 888,316.93, respectively, increasing by 10.03%. The reason for the above changes was that when the electricity sales company adopted mixed decision-making, it transferred part of the medium- and long-term electricity consumption in the non-mixed decision-making to the spot market, which reduced the medium- and long-term market profits of the RES power generator and the CES power generator, and the profits of the two in the spot market were affected by the scalar in the spot market. Therefore, the profits of the RES power generator and the CES power generator fluctuated one after another in Figure 6b,c on each trading day. However, it can be seen from Figure 6d that the total profit of the electricity sales company and the RES power generator increased significantly when the electricity sales company adopted mixed decision-making in the next seven trading days, which indicated that mixed decision-making between the medium- and long-term market and spot market for the electricity sales company was not only beneficial to the economic operation of electricity sales company but will also promote the RES power generators to obtain greater profits.

3.4. Profit of the Power Transaction Subjects under Different Indicators

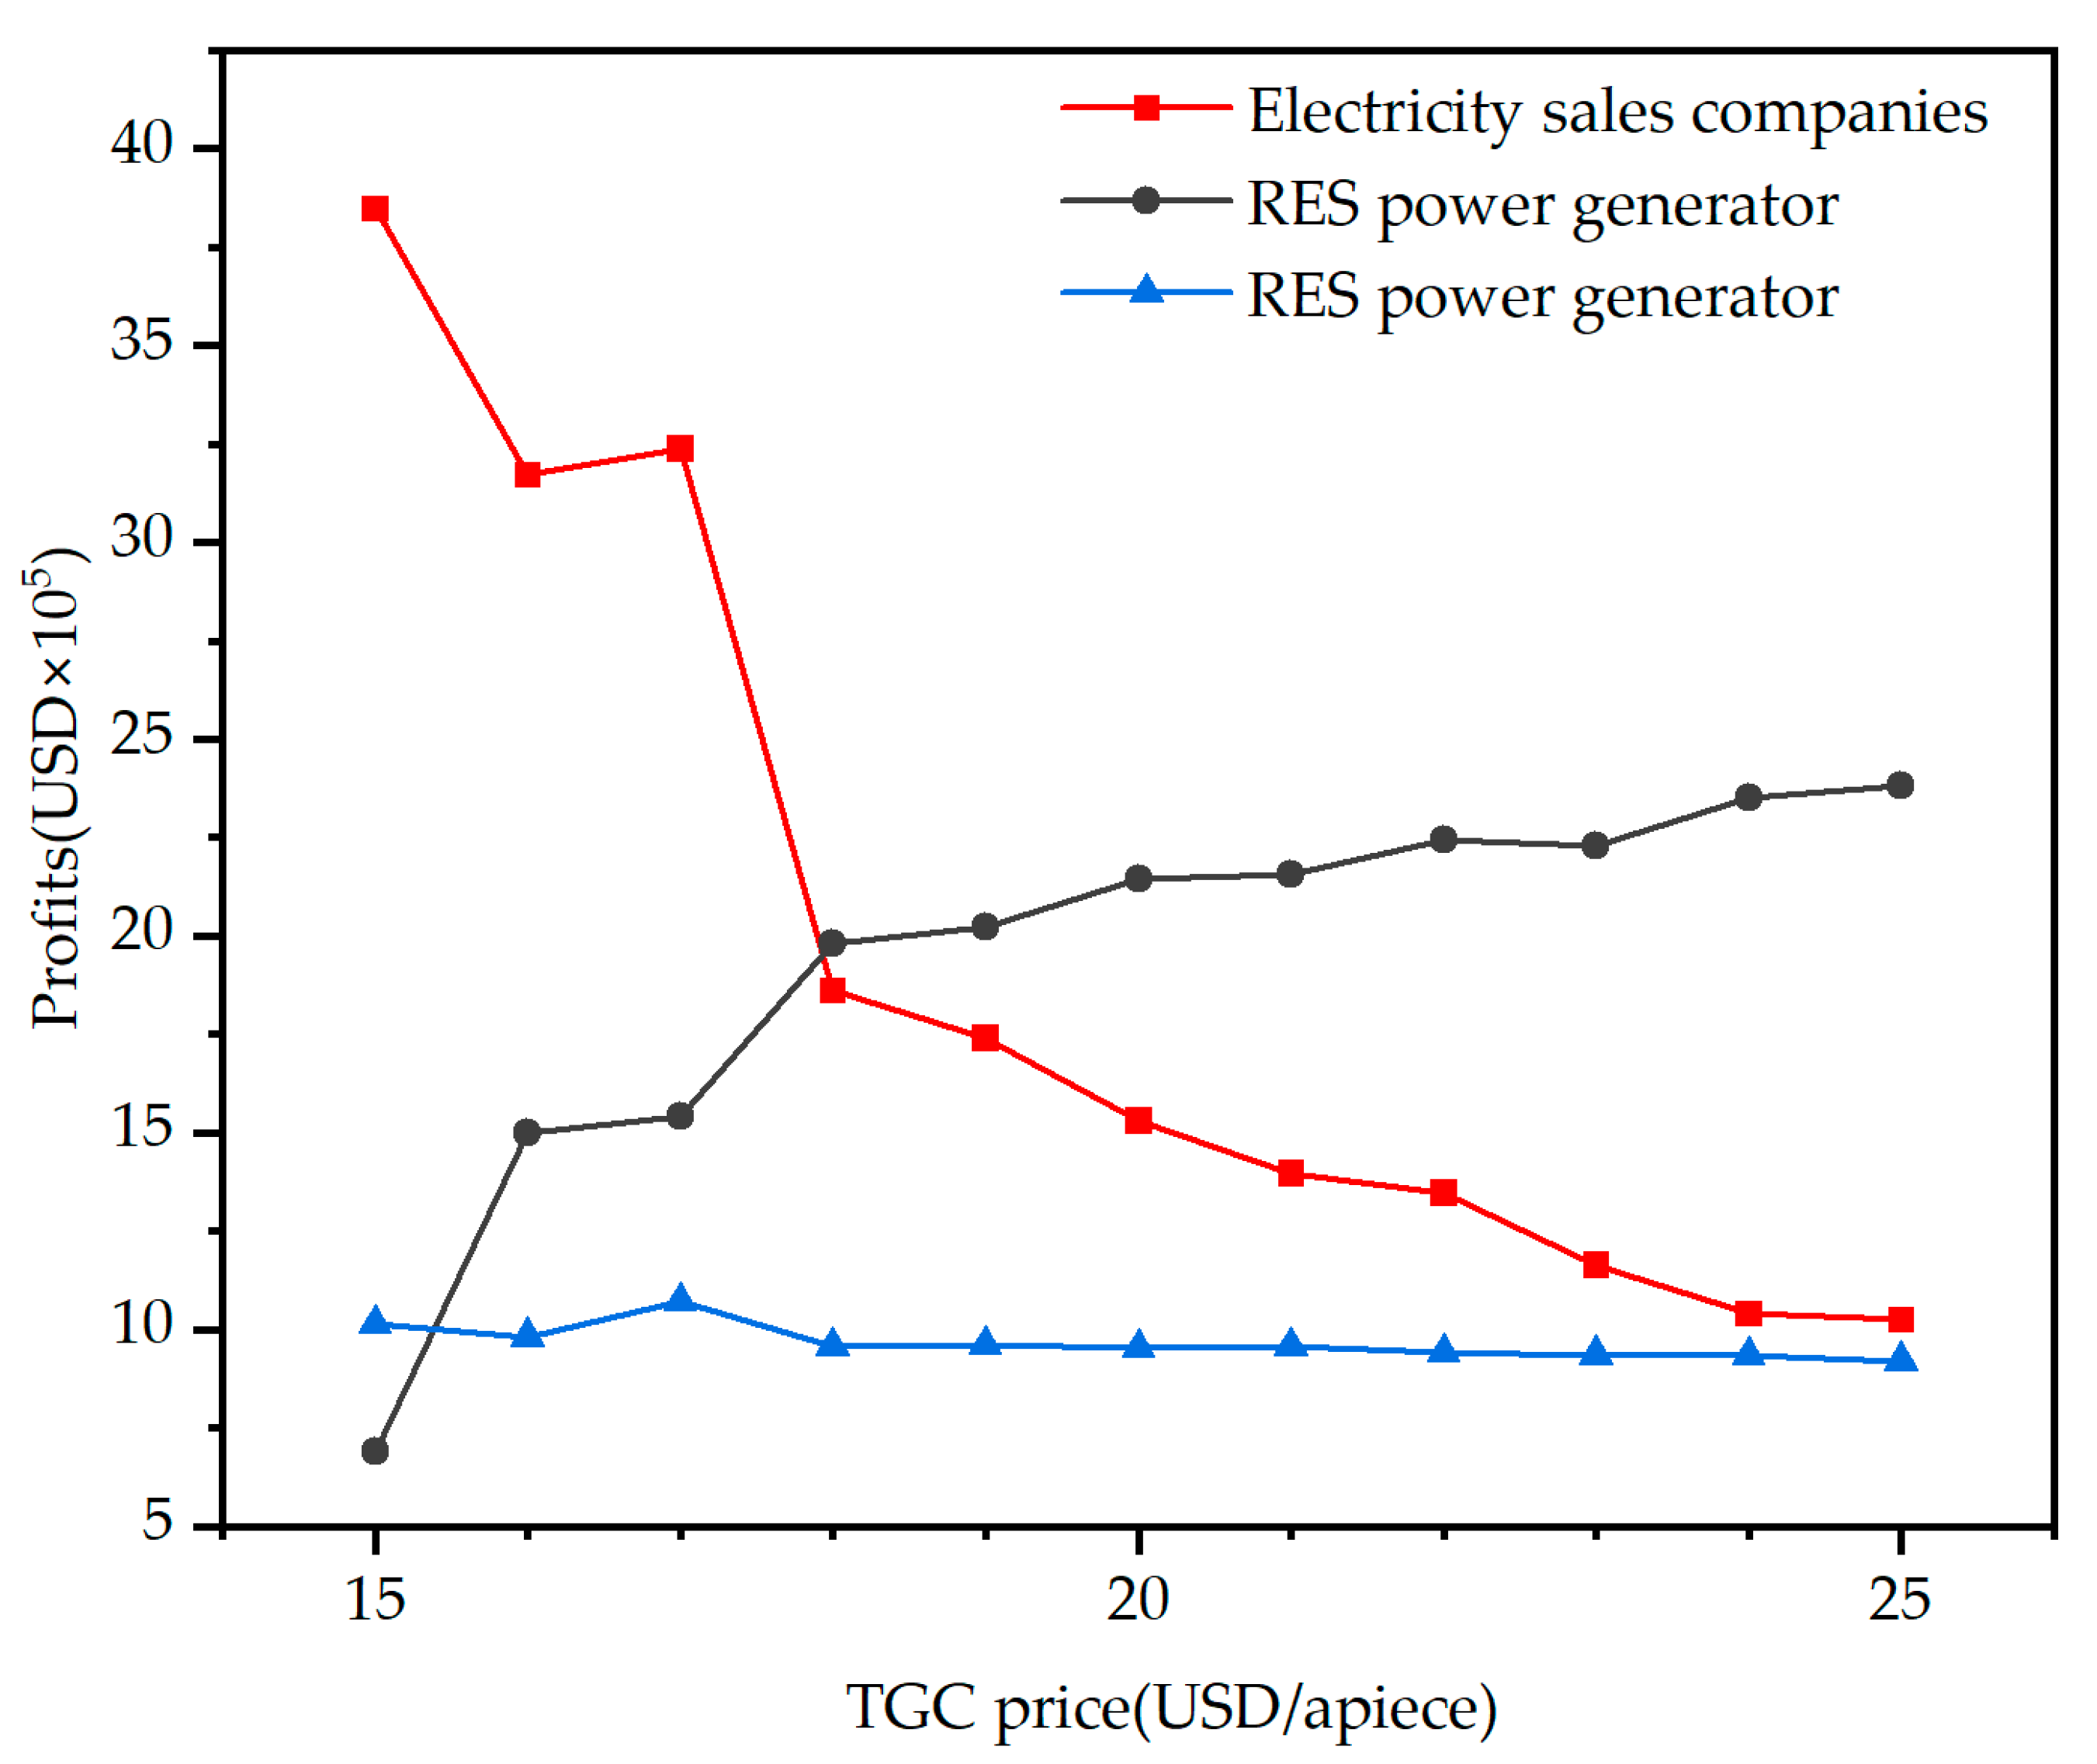
Figure 7 shows the changes in the profits of each subject of electricity trading under different green certificate prices. With the increase in green certificate prices, the profit changes of each subject in the supply chain were different. Among them, the profits of the electricity sales companies gradually decreased; the profits of the RES power generator increased; and the profit of the CES power generator first increased and then decreased. The reason is that the increase in the TGC price will directly cause an increase in the TGC cost of the electricity sales companies and will also increase the income of the RES power generators in the TGC market. When the TGC price is within a certain range, the price of the “CES power + TGC” was lower than that of the bundled RES power. The electricity sales companies will adopt the “CES power + TGC” to meet their power requirements. The CES power generators will then obtain more winning electricity. When the TGC price exceeds this range, the bundled RES power will be favored by the electricity sales companies. This paper set the CES power generators’ cost as a quadratic function. As a result, CES power generators’ profits first increased and then decreased.
Figure 8 shows the profit changes of the mixed and non-mixed decision-making for the electricity sales companies under different quota ratios. The results of the mixed and non-mixed decisions are shown by the red and gray lines, respectively. It can be seen from Figure 7 that under the different quota ratios, the profit change trend of the mixed decision-making and non-mixed decision-making of the electricity sales companies was the same. The profit made by the electricity sales companies adopting mixed decision-making was significantly higher than that of the non-mixed decision-making. When the quota ratio changed from 0.2 to 0.8, the profit of the electricity sales companies first increased and then decreased. When the quota ratio was 0.4, it reached the extreme value, and when the quota ratio was 0.8, the profit of the electricity sales companies appeared to be negative, mainly because the change in the quota ratio affected the revenue and cost of the electricity sales companies at the same time. When the quota ratio was lower than 0.4, the pressure on the quota of the electricity sales companies was small, and the TGC cost was not high. With the increase in the quota ratio, the electricity sales companies could sell more green electricity to power users to obtain greater revenue. When the quota ratio was higher than 0.4, the electricity sales companies’ profits began to decrease; when the quota ratio reached 0.8, the high cost of green certificates made it impossible for the electricity sales companies to make ends meet and profits went into negative territory.

4. Discussion

This paper proposes a mixed medium- and long-term and spot market trading strategy for electricity sales companies based on the background of the latest policy of China’s electricity reform and to achieve economic operation of electricity sales companies, and through the analysis of the model’s calculations, the following conclusions were drawn.
1. The adoption of the mixed medium- and long-term market and spot market decisions by the electricity sales company proposed in this paper resulted in a 16.76% increase in the total profit of the electricity sales companies in 7 trading days compared to the non-mixed decisions, even when the quota requirement changed. Currently, electricity sales companies in several regions of China are in a loss-making situation, and this trading strategy can improve the operating profit of electricity sales companies.
2. When the electricity sales company adopted mixed decision-making, the purchase volume of the bundled RES power increased, and the renewable energy consumption was promoted scientifically and rationally in a market-based way. The electricity sales company’s green certificate purchase volume was reduced to avoid the operational risk caused by the increase in the TGC price.
3. The implementation of the RPS and the accompanying TGC is an important factor affecting the profitability of electricity sales companies. Increasing the price of the TGC and quota ratios will guide RES generators to participate in the market; however, excessive TGC prices and quota requirements make the profits of electricity sales companies shrink significantly and also adversely affect the utility of electricity for customers. Therefore, reasonable quota ratios and green card prices set by government departments can help optimize the market interest structure, mobilize the enthusiasm of power trading entities to participate in the market, and ensure the smooth operation of the whole power market.
4. Under the current market system of “medium- and long-term + spot”, commercial and industrial catalog tariffs have been abolished and electricity prices have been “both up and down”, optimizing power trading decisions of electricity sales companies can help discover the real electricity prices, promote the synergistic development of the electricity market and the TGC market, and promote the construction of a fair, open, and effective competitive market. This will promote the development of a fair, open, and competitive energy market system.
The electricity price data in this paper are historical data and forecast data. With the change in the market supply and demand, the electricity price will be decided by the subjects of electricity trading through the game and the change in the electricity demand due to the improvement of customers’ environmental awareness. In our future research work, we will use the dynamic repeated game approach to study the decision-making behavior of each subject and introduce demand response into the trading decision model of electricity sales companies to help electricity sales companies face a more complex competitive environment in the electricity market.

Author Contributions

Conceptualization, H.W., C.W. and W.Z.; methodology, H.W. and C.W.; software, C.W.; validation, H.W., C.W. and W.Z.; formal analysis, H.W. and C.W.; writing—original draft preparation, C.W.; writing—review and editing, H.W. and C.W.; supervision, H.W. and W.Z.; project administration, H.W.; funding acquisition, H.W. All authors have read and agreed to the published version of the manuscript.

Funding

This work was supported by Project of Philosophy and Social Science Foundation of Shanghai, China (Grant No. 2020BGL011).

Data Availability Statement

The data presented in this study are available upon request from the corresponding author. The data are not publicly available due to the fact of privacy or ethical reasons.

Acknowledgments

The Authors are grateful to Yidi Shen for the insightful discussion. We also thank Haocheng Xu for his comments on the content and to all anonymous reviewers for their contributions to improve this paper.

Conflicts of Interest

The authors declare no conflict of interest.

Abbreviations

aThe cost coefficient of the CES power generator (USD·((MW)2·h)−1)
bThe cost coefficient of the CES power generator (USD·(MW·h)−1)
cThe fixed cost of the CES power generator (USD)
C t E The cost functions of an electricity sales company in the electricity market
C t G The cost functions of an electricity sales company in the TGC market
C F The cost of the CES power generator
C W The cost function of the RES power generator
CVaRConditional value at risk
K t f The bid-winning coefficient of the spot market of the CES power generator
K t w The bid-winning coefficient of the spot market of the CES power generator
NDRCNational Development and Reform Commission
p 1 , t The users’ price of bundled RES power (USD·(MW·h)−1)
p 1 , t F Medium- and long-term contract prices for bundled RES power (USD·(MW·h)−1)
p 2 , t F Medium- and long-term contract prices for CES power (USD·(MW·h)−1)
p 1 , t F ¯ The upper limits of the on-grid electricity price of the RES power generator (USD·(MW·h)−1)
p 1 , t F ¯ The lower limits of the on-grid electricity price of the RES power generator (USD·(MW·h)−1)
p 2 , t F ¯ The upper limits of the on-grid price of the CES power generator (USD·(MW·h)−1)
p 2 , t F ¯ The lower limits of the on-grid price of the CES power generator (USD·(MW·h)−1)
p t G The price per green certificate (USD·(per)−1)
p t R The spot price (USD·(MW·h)−1)
P S B Energy storage charging and discharging power (MW)
P S B . max The maximum capacity of the energy storage charge and discharge (MW)
P W RES power output (MW)
PJMThe Pennsylvania–New Jersey–Maryland
q 1 , t The users’ quantity of bundled RES power
q 2 , t The users’ quantity of CES power
q 1 , t F The medium- and long-term contract quantities of bundled RES power (MW·h)
q 1 , max F The maximum amount of electricity that can be contracted between the electricity sales companies and the RES generators in the medium- and long-term market (MW·h)
q 2 , max F The maximum amount of electricity that can be contracted between the electricity sales companies and the CES generators in the medium- and long-term market (MW·h)
q 1 , t max The maximum power generation of the RES generator unit (MW)
q 2 , t F The medium- and long-term contract quantities of CES power (MW·h)
q 1 R The spot market decision-making partial purchase of electricity (MW·h)
q 2 R The spot market deviation part of purchased electricity (MW·h)
q t M The user real-time load (MW)
q 2 , t max The maximum generation capacity of CES generators (MW)
q t R The electricity sales companies’ purchase of electricity in the spot market (MW·h)
RESRenewable energy source
RPSRenewable Portfolio Standards
R G The income functions of RES power generators in the TGC market (USD)
R W 1 The income functions of RES power generators in the medium- and long-term markets (USD)
R W 2 The income functions of RES power generators in the spot market (USD)
tSingle trading period
TTotal trading period
u The user utility function
α i The coefficient of user utility function
β i The coefficient of user utility function
γ Random variable
t The duration of energy storage charging and discharging power
η The purchase or non-purchase of green certificates by the electricity sales companies
θ The quota ratio that the electricity sales companies should bear.
λ The quota ratio that the users should bear
ν Random variable
π F The profit function of the CES power generator
π s The profit function of an electricity sales company
π W The RES power generator’s profit function

References

  1. The State Council of the Central Committee of the Communist Party of China. A Number of Views on Further Deepening the Reform of the Power System. 2015. Available online: https://news.ncepu.edu.cn/xxyd/llxx/52826.htm (accessed on 25 September 2022).
  2. National Development and Reform Commission. Notice on the Establishment of a Sound Renewable Energy Power Consumption Guarantee Mechanism. 2019. Available online: http://www.gov.cn/zhengce/zhengceku/2019-09/25/content_5432993.htm (accessed on 23 September 2022).
  3. National Development and Reform Commission. Notice on Matters Related to the New Energy Feed-in Tariff Policy in 2021. 2021. Available online: http://www.gov.cn/zhengce/zhengceku/2021-06/11/content_5617297.htm (accessed on 27 September 2022).
  4. National Development and Reform Commission. Notice on Further Deepening the Market Reform of the Feed-in Tariff for Coal-Fired Power Generation. 2021. Available online: http://www.gov.cn/zhengce/zhengceku/2021-10/12/content_5642159.htm (accessed on 25 September 2022).
  5. General Office of National Development and Reform Commission. Notice of the General Office of the National Development and Reform Commission on Organizing and Carrying out Power Purchasing Work of Power Grid Enterprises as Agents. 2021. Available online: http://www.gov.cn/zhengce/zhengceku/2021-10/27/content_5645848.htm (accessed on 15 September 2022).
  6. Guo, H.; Davidson, M.R.; Chen, Q.; Zhang, D.; Jiang, N.; Xia, Q.; Kang, C.; Zhang, X. Power market reform in China: Motivations, progress, and recommendations. Energy Policy 2020, 145, 111717. [Google Scholar] [CrossRef]
  7. Lin, J.; Kahrl, F.; Yuan, J.; Liu, X.; Zhang, W. Challenges and strategies for electricity market transition in China. Energy Policy 2019, 133, 110899. [Google Scholar] [CrossRef]
  8. Abhyankar, N.; Lin, J.; Liu, X.; Sifuentes, F. Economic and environmental benefits of market-based power-system reform in China: A case study of the southern grid system. Resour. Conserv. Recycl. 2020, 153, 104558. [Google Scholar] [CrossRef]
  9. Xu, J.; Lv, T.; Hou, X.; Deng, X.; Liu, F. Provincial allocation of renewable portfolio standard in China based on efficiency and fairness principles. Renew. Energy 2020, 179, 1233–1245. [Google Scholar] [CrossRef]
  10. Zhang, N.; Yan, Z.; Song, Y.; Han, D. Short-term generation scheduling model considering renewable portfolio standard. East China Electr. Power 2014, 42, 293–297. [Google Scholar] [CrossRef]
  11. Liang, J.; Zuo, Y.; Zhang, Y.; Zhao, X. Energy-saving and economic dispatch of power system containing wind power integration under renewable portfolio standard. Power Syst. Technol. 2019, 43, 2528–2534. [Google Scholar]
  12. Li, Y.; Zhang, F.; Yuan, J. Research on China’s renewable portfolio standards from the perspective of policy networks. J. Clean. Prod. 2019, 222, 986–997. [Google Scholar] [CrossRef]
  13. Wang, G.; Zhang, Q.; Li, Y.; Mclellan, B.C.; Pan, X. Corrective regulations on renewable energy certificates trading: Pursuing an equity-efficiency trade-off. Energy Econ. 2019, 80, 970–982. [Google Scholar] [CrossRef]
  14. Wang, G.; Zhang, Q.; Su, B.; Shen, B.; Li, Y.; Li, Z. Coordination of tradable carbon emission permits market and renewable electricity certificates market in China. Energy Econ. 2021, 93, 105038. [Google Scholar] [CrossRef]
  15. Yu, X.; Dong, Z.; Zhou, D. Integration of tradable green certificates trading and carbon emissions trading: How will Chinese power industry do? J. Clean. Prod. 2021, 279, 123485. [Google Scholar] [CrossRef]
  16. Song, X.; Han, J.; Shan, Y.; Zhao, C.; Liu, J.; Kou, Y. Efficiency of tradable green certificate markets in China. J. Clean. Prod. 2020, 264, 121518. [Google Scholar] [CrossRef]
  17. Jiang, Y.C.; Cao, H.X.; Yang, L. Mechanism design and impact analysis of renewable portfolio standard. Autom. Electr. Power Syst. 2020, 44, 187–199. [Google Scholar]
  18. Dong, F.G.; Shi, L. Design and simulation of renewable energy quota system and green certificate trading mechanism. Autom. Electr. Power Syst. 2019, 43, 113–121. [Google Scholar]
  19. Zhao, X.G.; Ren, L.Z.; Wan, G. Renewable energy quota system, strategic behavior and evolution of power producers. Chin. J. Manag. Sci. 2019, 27, 168–179. [Google Scholar]
  20. Feng, Y.; Li, Q.H.; Liu, Y. Design and exploration of renewable energy quota system in China. Autom. Electr. Power Syst. 2017, 41, 137–141+158. [Google Scholar]
  21. Zhu, C.; Fan, R.; Lin, J. The impact of renewable portfolio standard on retail electricity market: A system dynamics model of tripartite evolutionary game. Energy Policy 2020, 136, 111072. [Google Scholar] [CrossRef]
  22. Zhang, X.; Chen, Z.; Ma, Z.M. Research on electricity market trading system adapting to renewable energy quota system. Power Grid Technol. 2019, 43, 2682–2690. [Google Scholar]
  23. An, X.N.; Zhang, S.H.; Li, X. Equilibrium analysis of oligopoly electricity markets considering tradable grenn certificates. Autom. Electr. Power Syst. 2017, 41, 84–89. [Google Scholar]
  24. Liu, X.; Ronn, E.I. Using the binomial model for the valuation of real options in computing optimal subsidies for Chinese renewable energy investments. Energy Econ. 2020, 87, 104692. [Google Scholar] [CrossRef] [Green Version]
  25. Yu, S.; Lu, T.; Hu, X.; Liu, L. Determinants of overcapacity in China’s renewable energy industry: Evidence from wind, photovoltaic, and biomass energy enterprises. Energy Econ. 2021, 97, 105056. [Google Scholar] [CrossRef]
  26. Zhu, L.; Li, L.; Su, B. The price-bidding strategy for investors in a renewable auction: An option games–based study. Energy Econ. 2021, 100, 105331. [Google Scholar] [CrossRef]
  27. Lin, B.; Chen, Y. Does electricity price matter for innovation in renewable energy technologies in China? Energy Econ. 2019, 78, 259–266. [Google Scholar] [CrossRef]
  28. Du, Y.; Takeuchi, K.; Wan, G. Does a small difference make a difference? Impact of feed-in tariff on renewable power generation in China. Energy Econ. 2020, 87, 104710. [Google Scholar] [CrossRef] [Green Version]
  29. Zhang, Y.; Zhao, X.; Ren, L.; Zuo, Y. The development of the renewable energy power industry under feed-in tariff and renewable portfolio standard: A case study of China’s wind power industry. J. Clean. Prod. 2017, 168, 1262–1276. [Google Scholar] [CrossRef]
  30. Cieplinski, A.; D’Alessandro, S.; Marghella, F. Assessing the renewable energy policy paradox: A scenario analysis for the Italian electricity market. Renew. Sustain. Energy Rev. 2021, 142, 110838. [Google Scholar] [CrossRef]
  31. Dai, S.L.; Zhang, L.; Liu, N.N. Analysis of power purchase decision of electricity selling companies considering the consumption responsibility of renewable energy. China Electr. Power 2021, 54, 156–164. [Google Scholar]
  32. He, Q. Optimization of Power Purchase Decisions by Power Sales Companies under Renewable Energy Quota System. Ph.D. Thesis, North China Electric Power University, Beijing, China, 2020. (In Chinese). [Google Scholar]
  33. Kell, A.J.; McGough, A.S.; Forshaw, M. The impact of online machine-learning methods on long-term investment decisions and generator utilization in electricity markets. Sustain. Comput. Inform. Syst. 2021, 30, 100532. [Google Scholar] [CrossRef]
  34. Song, Y.H.; Wang, G.; Cai, H. A review on purchasing and selling decision of electric power company. Power Demand Side Manag. 2020, 22, 85–89. [Google Scholar]
  35. Dou, X.; Wang, J.; Ye, F. Power sales companies that consider the virtual power plant portfolio strategy optimize scheduling and purchase and sale decisions. Power Syst. Technol. 2020, 44, 2078–2086. [Google Scholar]
  36. Wu, D.; Ma, X.; Balducci, P.; Bhatnagar, D. An economic assessment of behind-the-meter photovoltaics paired with batteries on the Hawaiian Islands. Appl. Energy 2021, 286, 116550. [Google Scholar] [CrossRef]
  37. Nojavan, S.; Zare, K.; Mohammadi-Ivatloo, B. Application of fuel cell and electrolyzer as hydrogen energy storage system in energy management of electricity energy retailer in the presence of the renewable energy sources and plug-in electric vehicles. Energy Convers. Manag. 2017, 136, 404–417. [Google Scholar] [CrossRef]
  38. Kharrati, S.; Kazemi, M.; Ehsan, M. Equilibria in the competitive retail electricity market considering uncertainty and risk management. Energy 2016, 106, 315–328. [Google Scholar] [CrossRef]
  39. Kurihara, G.I.; Asano, H.; Okada, K.; Yokoyama, R. Long-term power trade model in electricity market based on game theory. In Proceedings of the IEEE/PES Transmission and Distribution Conference and Exhibition, Yokohama, Japan, 6–10 October 2002. [Google Scholar]
  40. Moghimi, F.H.; Barforoushi, T. A short-term decision-making model for a price-maker distribution company in wholesale and retail electricity markets considering demand response and real-time pricing. Int. J. Electr. Power Energy Syst. 2020, 117, 105701. [Google Scholar] [CrossRef]
  41. Zugno, M.; Morales, J.M.; Pinson, P.; Madsen, H. A bilevel model for electricity retailers’ participation in a demand response market environment. Energy Econ. 2013, 36, 182–197. [Google Scholar] [CrossRef]
  42. Mazidi, M.; Monsef, H.; Siano, P. Incorporating price-responsive customers in day-ahead scheduling of smart distribution networks. Energy Convers. Manag. 2016, 115, 103–116. [Google Scholar] [CrossRef]
  43. Silva, W.N.; Henrique, L.F.; Silva, A.D.C.; Dias, B.H.; Soares, T.A. Market models and optimization techniques to support the decision-making on demand response for prosumers. Electr. Power Syst. Res. 2022, 210, 108059. [Google Scholar] [CrossRef]
  44. Dagoumas, A.S.; Polemis, M.L. An integrated model for assessing electricity retailer’s profitability with demand response. Appl. Energy 2017, 198, 49–64. [Google Scholar] [CrossRef]
  45. Ju, L.; Wu, J.; Lin, H.; Tan, Q.; Li, G.; Tan, Z.; Li, J. Robust purchase and sale transactions optimization strategy for electricity retailers with energy storage system considering two-stage demand response. Appl. Energy 2020, 271, 115155. [Google Scholar] [CrossRef]
  46. Yang, S.; Tan, Z.; Liu, Z.; Lin, H.; Ju, L.; Zhou, F.; Li, J. A multi-objective stochastic optimization model for electricity retailers with energy storage system considering uncertainty and demand response. J. Clean. Prod. 2020, 277, 124017. [Google Scholar] [CrossRef]
  47. Wang, K.; Zhu, Z.; Guo, Z. Optimal Day-Ahead Decision-Making Scheduling of Multiple Interruptible Load Schemes for Retailer With Price Uncertainties. IEEE Access 2021, 9, 102251–102263. [Google Scholar] [CrossRef]
  48. Dou, X.; Wang, J.; Shao, P. The purchasing and selling strategy of e-commerce considering customer contribution. Power Syst. Technol. 2019, 43, 2752–2760. [Google Scholar]
  49. Li, Y.T.; Zhang, Z.; Yang, L. Decision Model of incremental power distribution company considering co-optimization of source, charge and storage. Autom. Electr. Power Syst. 2021, 45, 125–132. [Google Scholar]
  50. Liu, P.Y.; Ding, T.; He, Y.K. Optimal market trading strategy of load aggregator based on comprehensive demand response. Electr. Power Autom. Equip. 2019, 39, 224–231. [Google Scholar]
  51. Jiang, Z.; Ai, Q. Agent-based simulation for symmetric electricity market considering price-based demand response. J. Mod. Power Syst. Clean Energy 2017, 5, 810–819. [Google Scholar] [CrossRef] [Green Version]
  52. Yang, J.; Zhao, J.; Wen, F.; Dong, Z.Y. A framework of customizing electricity retail prices. IEEE Trans. Power Syst. 2017, 33, 2415–2428. [Google Scholar] [CrossRef]
  53. Song, M.; Amelin, M. Price-maker bidding in day-ahead electricity market for a retailer with flexible demands. IEEE Trans. Power Syst. 2017, 33, 1948–1958. [Google Scholar] [CrossRef]
  54. Li, T.; Gao, C.; Chen, T.; Jiang, Y.; Feng, Y. Medium and long-term electricity market trading strategy considering renewable portfolio standard in the transitional period of electricity market reform in Jiangsu, China. Energy Econ. 2022, 107, 105860. [Google Scholar] [CrossRef]
  55. Fan, W.; Huang, L.; Cong, B.; Tan, Z.; Xing, T. Research on an optimization model for wind power and thermal power participating in two-level power market transactions. Int. J. Electr. Power Energy Syst. 2022, 134, 107423. [Google Scholar] [CrossRef]
  56. Xu, Y. Spot market in consideration of medium-and long-term trading restrictions of electricity sales company decision. Energy Policy 2021, 54, 79–85. [Google Scholar]
  57. Do Prado, J.C.; Qiao, W. A stochastic bilevel model for an electricity retailer in a liberalized distributed renewable energy market. IEEE Trans. Sustain. Energy 2020, 11, 2803–2812. [Google Scholar] [CrossRef]
  58. Wang, H.; Chen, B.B.; Zhao, W.H. Optimal decision of cross-provincial power transaction subject under renewable energy quota system. Energy Policy 2019, 43, 1987–1995. [Google Scholar]
  59. De, G.G.; Tan, Z.F.; Li, M.L. Bidding Strategy of Wind-storage Power Plant Participation in Electricity Spot Market Considering Uncertainty. Power Syst. Technol. 2019, 43, 2799–2807. [Google Scholar]
  60. Zeng, J.Z.; Zhao, X.F.; Li, J. Game among multiple entitiesin electricity market with liberalization of power demand side market. Autom. Electr. Power Syst. 2017, 41, 129–136. [Google Scholar]
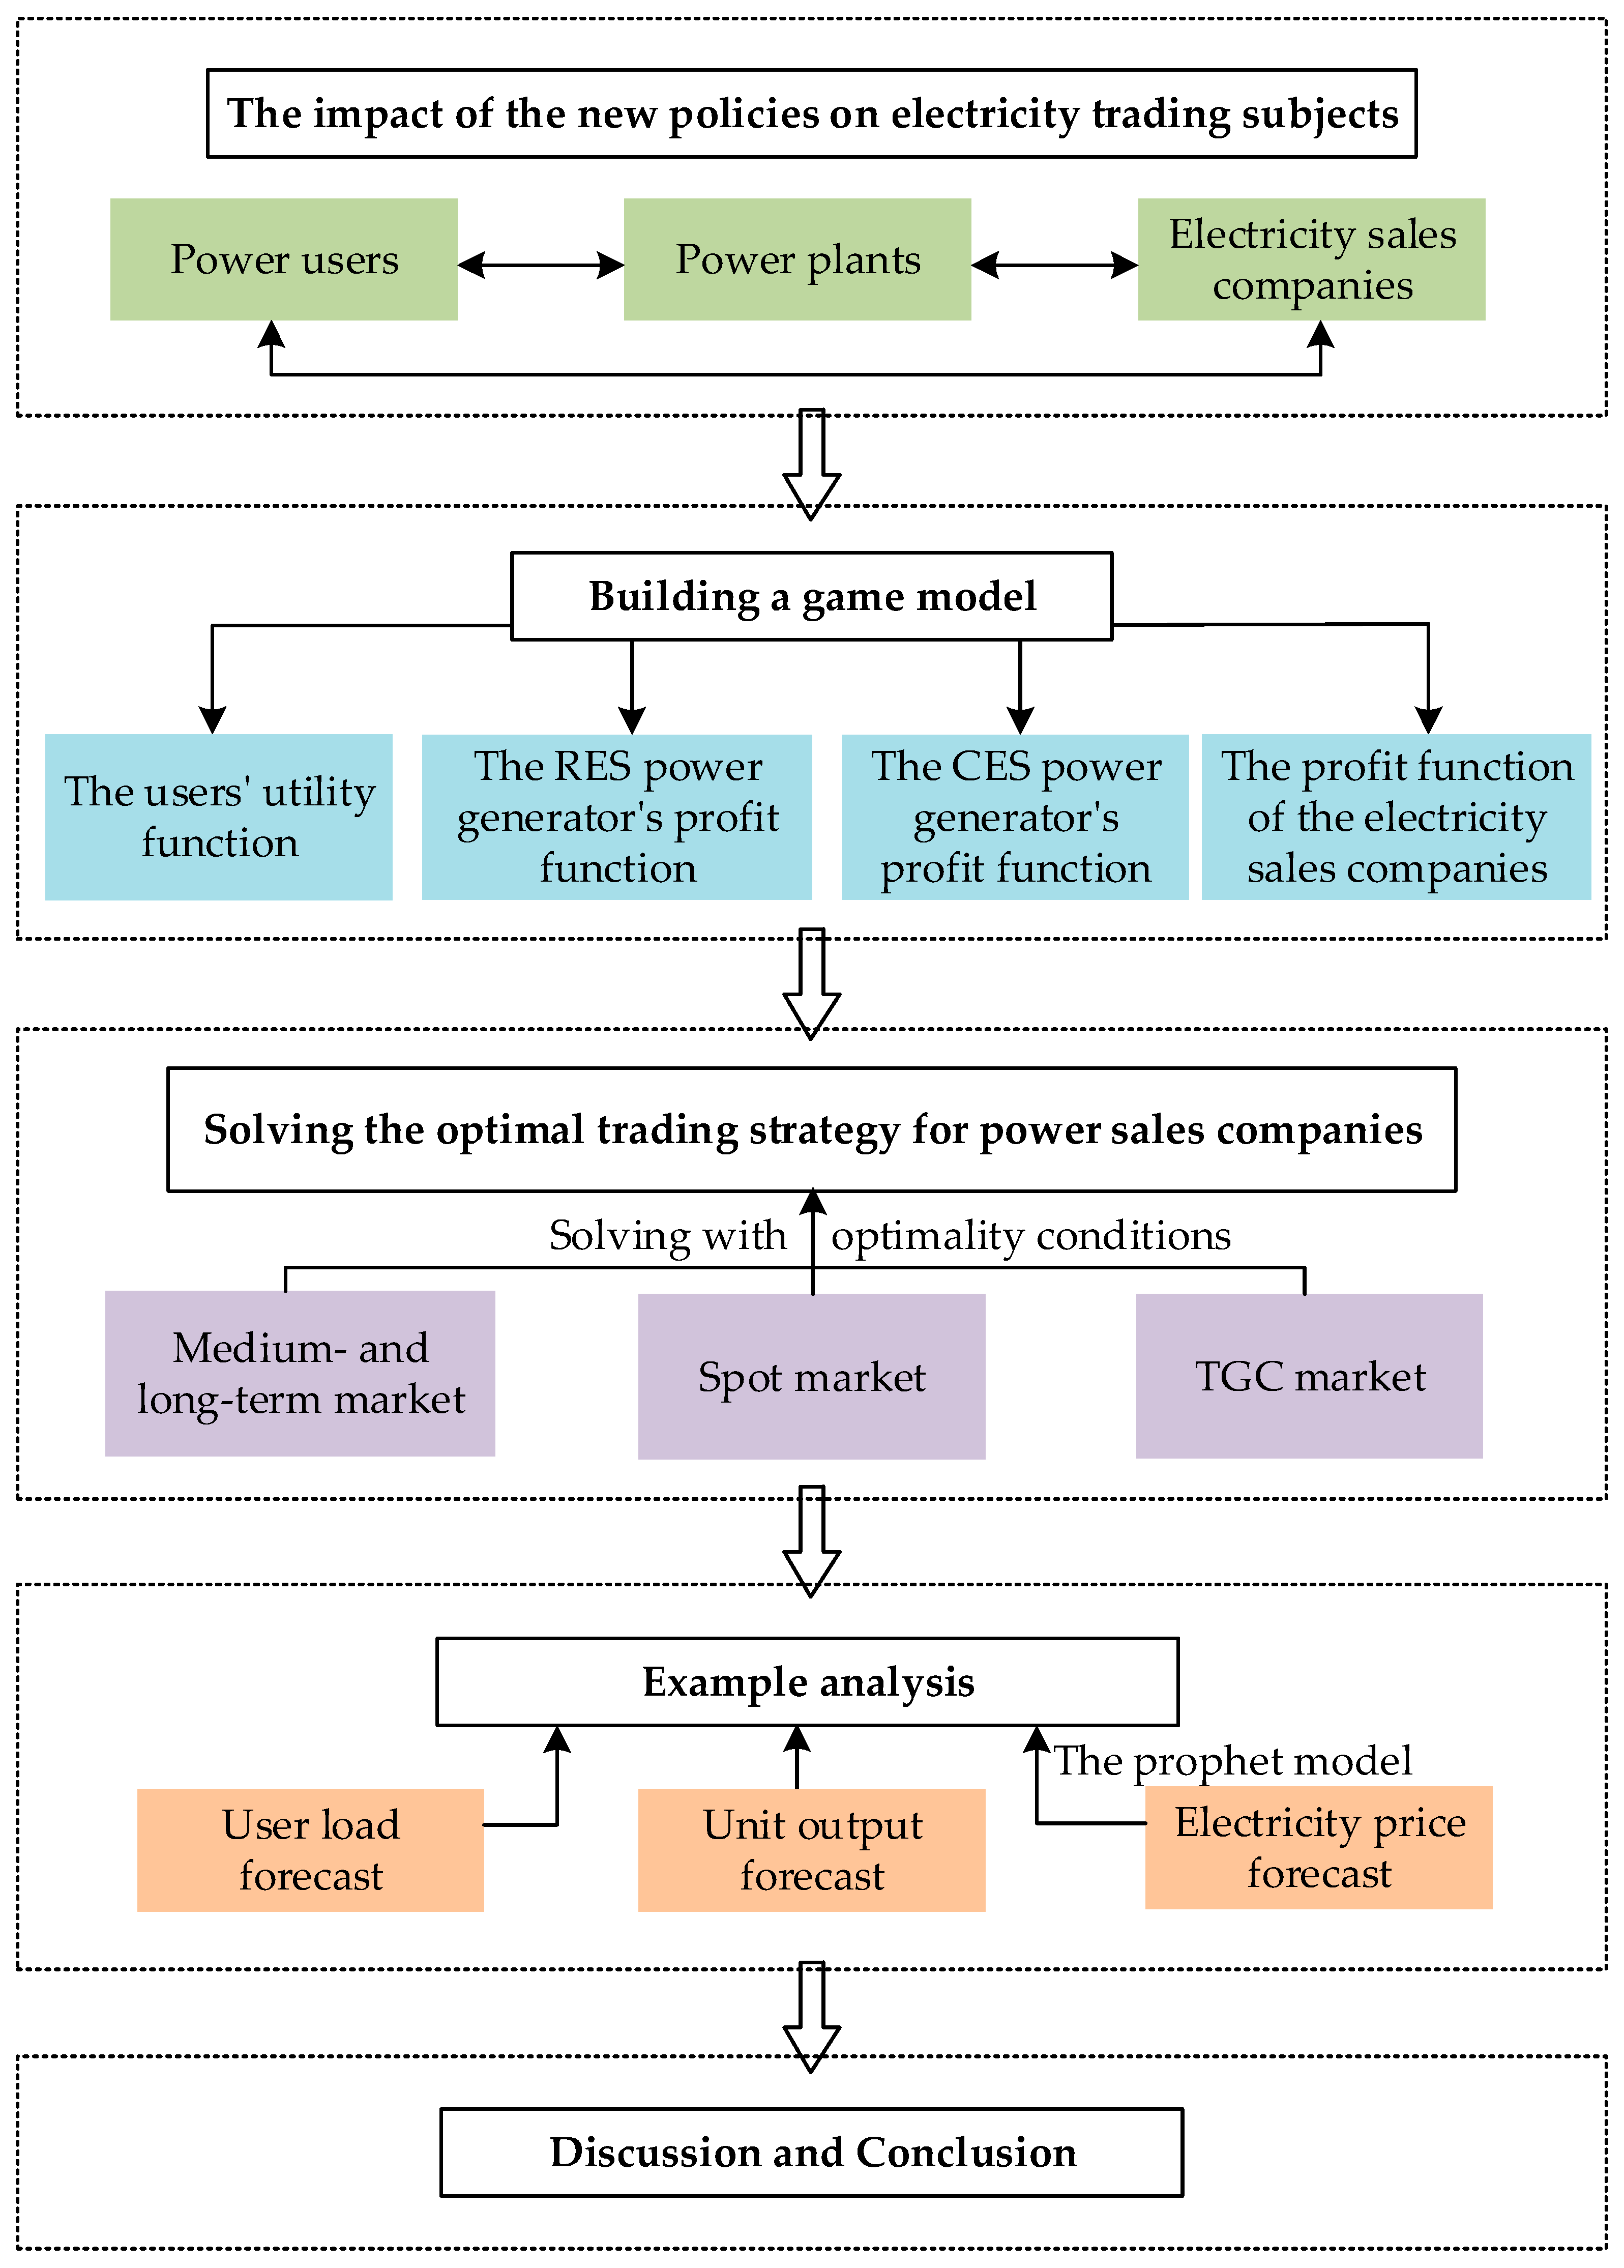
Figure 1. The research design.
Energies 15 09568 g001
Figure 2. The impact of the new policies on electricity trading subjects.
Energies 15 09568 g002
Figure 3. User load forecast and the output forecast of the renewable energy generator.
Energies 15 09568 g003
Figure 4. The spot price forecast.
Energies 15 09568 g004
Figure 5. The cost of TGCs for the electricity sales company and the electricity purchase of RES.
Energies 15 09568 g005
Figure 6. The profit of each subject of power trading: (a) electricity sales company; (b) RES power generator; (c) CES power generator; (d) the total profit of each subject of power trading in seven trading days.
Energies 15 09568 g006
Figure 7. Profits of each transaction subject to electricity trading under different TGC prices.
Energies 15 09568 g007
Figure 8. Different quota ratios under the mixed and non-mixed decision-making profits of electricity sales companies.
Energies 15 09568 g008
Publisher’s Note: MDPI stays neutral with regard to jurisdictional claims in published maps and institutional affiliations.