Article

Influence of the Three-Dimensional Effect of Pile-Soil System on the Vertical Dynamic Response of Large-Diameter Piles in Low-Strain Integrity Testing

1
Faculty of Engineering, Zhejiang Institute, China University of Geosciences, Wuhan 430074, China
2
School of Engineering, Design and Built Environment, University of Western Sydney, Locked Bag 1797, Penrith, NSW 2751, Australia
3
China Railway 16th Bureau Group No.3 Engineering Co., Ltd., Huzhou 313000, China
*
Authors to whom correspondence should be addressed.
Energies 2022, 15(24), 9548; https://doi.org/10.3390/en15249548
Submission received: 13 October 2022 / Revised: 2 December 2022 / Accepted: 9 December 2022 / Published: 16 December 2022
(This article belongs to the Special Issue Geotechnic and Geostructural Problems in Energy Engineering)

Abstract

:
The low-strain integrity testing of large-diameter piles has attracted more and more attention because of its wide application in offshore engineering, such as for wind turbines, etc. Body and Rayleigh waves generate on the top surface of large-diameter piles after the excitation load. The multi-reflections of these waves from the pile side result in the obvious three-dimensional effect at the pile top. Therefore, one-dimensional wave theory is no longer suitable for interpreting the wave propagation in the pile body under vertical excitation. In this paper, based on the “pile in pile” conception, both the pile and soil were simulated using a three-dimensional continuum model, considering the vertical displacement, to investigate the influence of the three-dimensional effect of the pile-soil system on the vertical dynamic response of large-diameter piles in low-strain integrity testing. The axisymmetric solution to the three-dimensional pile-soil system was obtained, and the rationality of the proposed solution was verified by comparing it with the results of the finite element method and the results of other existing solutions. Arithmetic examples were used to describe the influence of the three-dimensional effect of the pile-soil system on the vertical dynamic response of large-diameter piles.

1. Introduction

With the increasing demand for ultra-high buildings [1,2,3], transportation structures [4], large-scale bridge projects [5,6,7], and offshore wind turbines [8,9,10,11,12,13,14], large-diameter piles are widely used in the practice of engineering. It is key to confirm the pile integrity in the field to ensure the normal and long-term service of superstructures [15,16]. Low-strain reflected-wave testing is one of the most widely utilized methods to verify the integrity and determine the as-built length of piles due to its advantages of easy operation and low cost [17,18,19]. Traditional low-strain integrity testing is based on the one-dimensional (1D) wave theory, which assumes that the pile is a 1D rod and only considers the wave propagation along the pile body. However, the 1D wave theory can be approximately satisfied only when the ratio of hammer radius to pile radius, the ratio of wave length to pile radius, and the ratio of pile length to pile radius are large enough [20]. According to the St. Venant principle (1975), for large-diameter piles, the excitation load in low-strain integrity testing could result in the generation of the compressional (P-wave), shear (S-wave), and Rayleigh (R-wave) waves. The P-wave and S-wave propagate outward as a sphere, while the R-wave propagates outward as a column surface. Therefore, these stress waves propagate in the pile body not only in the vertical direction but also in the radial direction, which is a three-dimensional (3D) problem. Steinbach & Vey [21] first identified the presence of the 3D effect in the form of surface waves through laboratory experiments and field tests.
The solution to the rigorous 3D wave equations corresponding to the low-strain integrity testing problem of pile foundations is difficult to obtain [22,23]. Therefore, the reliable finite element method (FEM) has attracted much attention from researchers and has become the main tool used in the literature to investigate stress wave propagation in three dimensions. Fukuhara et al. [24] focused on studying the low-strain integrity testing of piles by virtue of the 3D FEM. Chen et al. [25] analyzed the generation mechanism of the high-frequency interference in the low-strain testing results and verified it with FEM. They proposed that the high-frequency interference in the low-strain testing results was caused by the multiple reflections of the S-wave and R-wave along the radial surface of the pile. Chow et al. [26] compared the results of FEM with 1D theory results; they found that the 3D effect was more obvious for large-diameter piles. Further, it was also captured from the velocity-time history curves that there was a large negative wave crest after the first positive peak. However, this phenomenon only exists at the point near the impact load for large-diameter piles. Further, they presented that it is caused by the 3D effect of large-diameter piles.
In recent years, large-diameter piles have been widely used due to their high bearing capacity in practical engineering applications, such as wind turbines, transmission towers, and energy pile systems [27,28]. Therefore, more and more simplified theoretical methods have been put forward to investigate the 3D effect of large-diameter piles. Zheng et al. [29] presented a 3D axisymmetric analytical solution for the dynamic response of a large-diameter pile to study the 3D effect in low-strain integrity testing. Then the corresponding non-axisymmetric 3D analytical solution for large-diameter pile dynamics was obtained [30]. In order to get a more rigorous 3D pile model, Zheng et al. [31] introduced a new three-dimensional conception for large-diameter piles, in which the pile was divided into two parts according to the radius of the hammer. Only the vertical displacement was considered in part one (impacting area part).
Additionally, both the vertical and radial displacements were taken into consideration in part two (outside the impacting area). However, the above theoretical studies on the 3D wave propagation effect were all based on the plane strain model for pile surrounding soil, in which only the propagation of the stress waves along the radial direction was considered. Liu et al. [32] investigated the axisymmetric 3D dynamics of large-diameter piles by considering the vertical and radial displacement of the pile and the pile surrounding soil, in which both the 3D effect of the pile and the pile surrounding soil were considered. However, the excitation load is evenly distributed on the whole pile top in this model, which cannot accurately reflect the large size difference between the large-diameter pile and the excitation hammer in low-strain integrity testing.
Chen et al. [25] also reported that the vertical displacement and velocity of particles at the pile top surface are mainly caused by the propagation of an R-wave and S-wave, but the propagation of a P-wave mainly results in the radial displacement and velocity of particles at the pile top surface. The R-wave occupies most of the excitation energy, followed by the S-wave, and the P-wave occupies the least energy. Based on the above theory, there is no doubt that ignoring the radial displacement of the pile restricts the radial propagation of the P-wave on the pile top surface. This has little influence on the vertical displacement and velocity of each test point at the surface of the pile top and the apparent wave velocity of the stress waves propagating along the radial direction on the pile top surface [33]. Thus, it is suitable to ignore the radial displacement of the pile-soil system to investigate the influence of the 3D effect of the pile-soil system on the vertical dynamic response of the large-diameter pile top under a vertical excitation force. In this paper, in order to investigate the influence of the 3D effect of the pile-soil system on the vertical dynamic response of large-diameter piles, both the pile and surrounding soil are simulated using a 3D continuum model considering the vertical displacement. Meanwhile, the “pile in pile” conception is introduced to consider that the radius of the impact hammer is much smaller than that of the large-diameter pile. Based on the above assumptions, the axisymmetric solution to the presented 3D pile-soil system is derived.

2. Mathematical Model and Assumptions

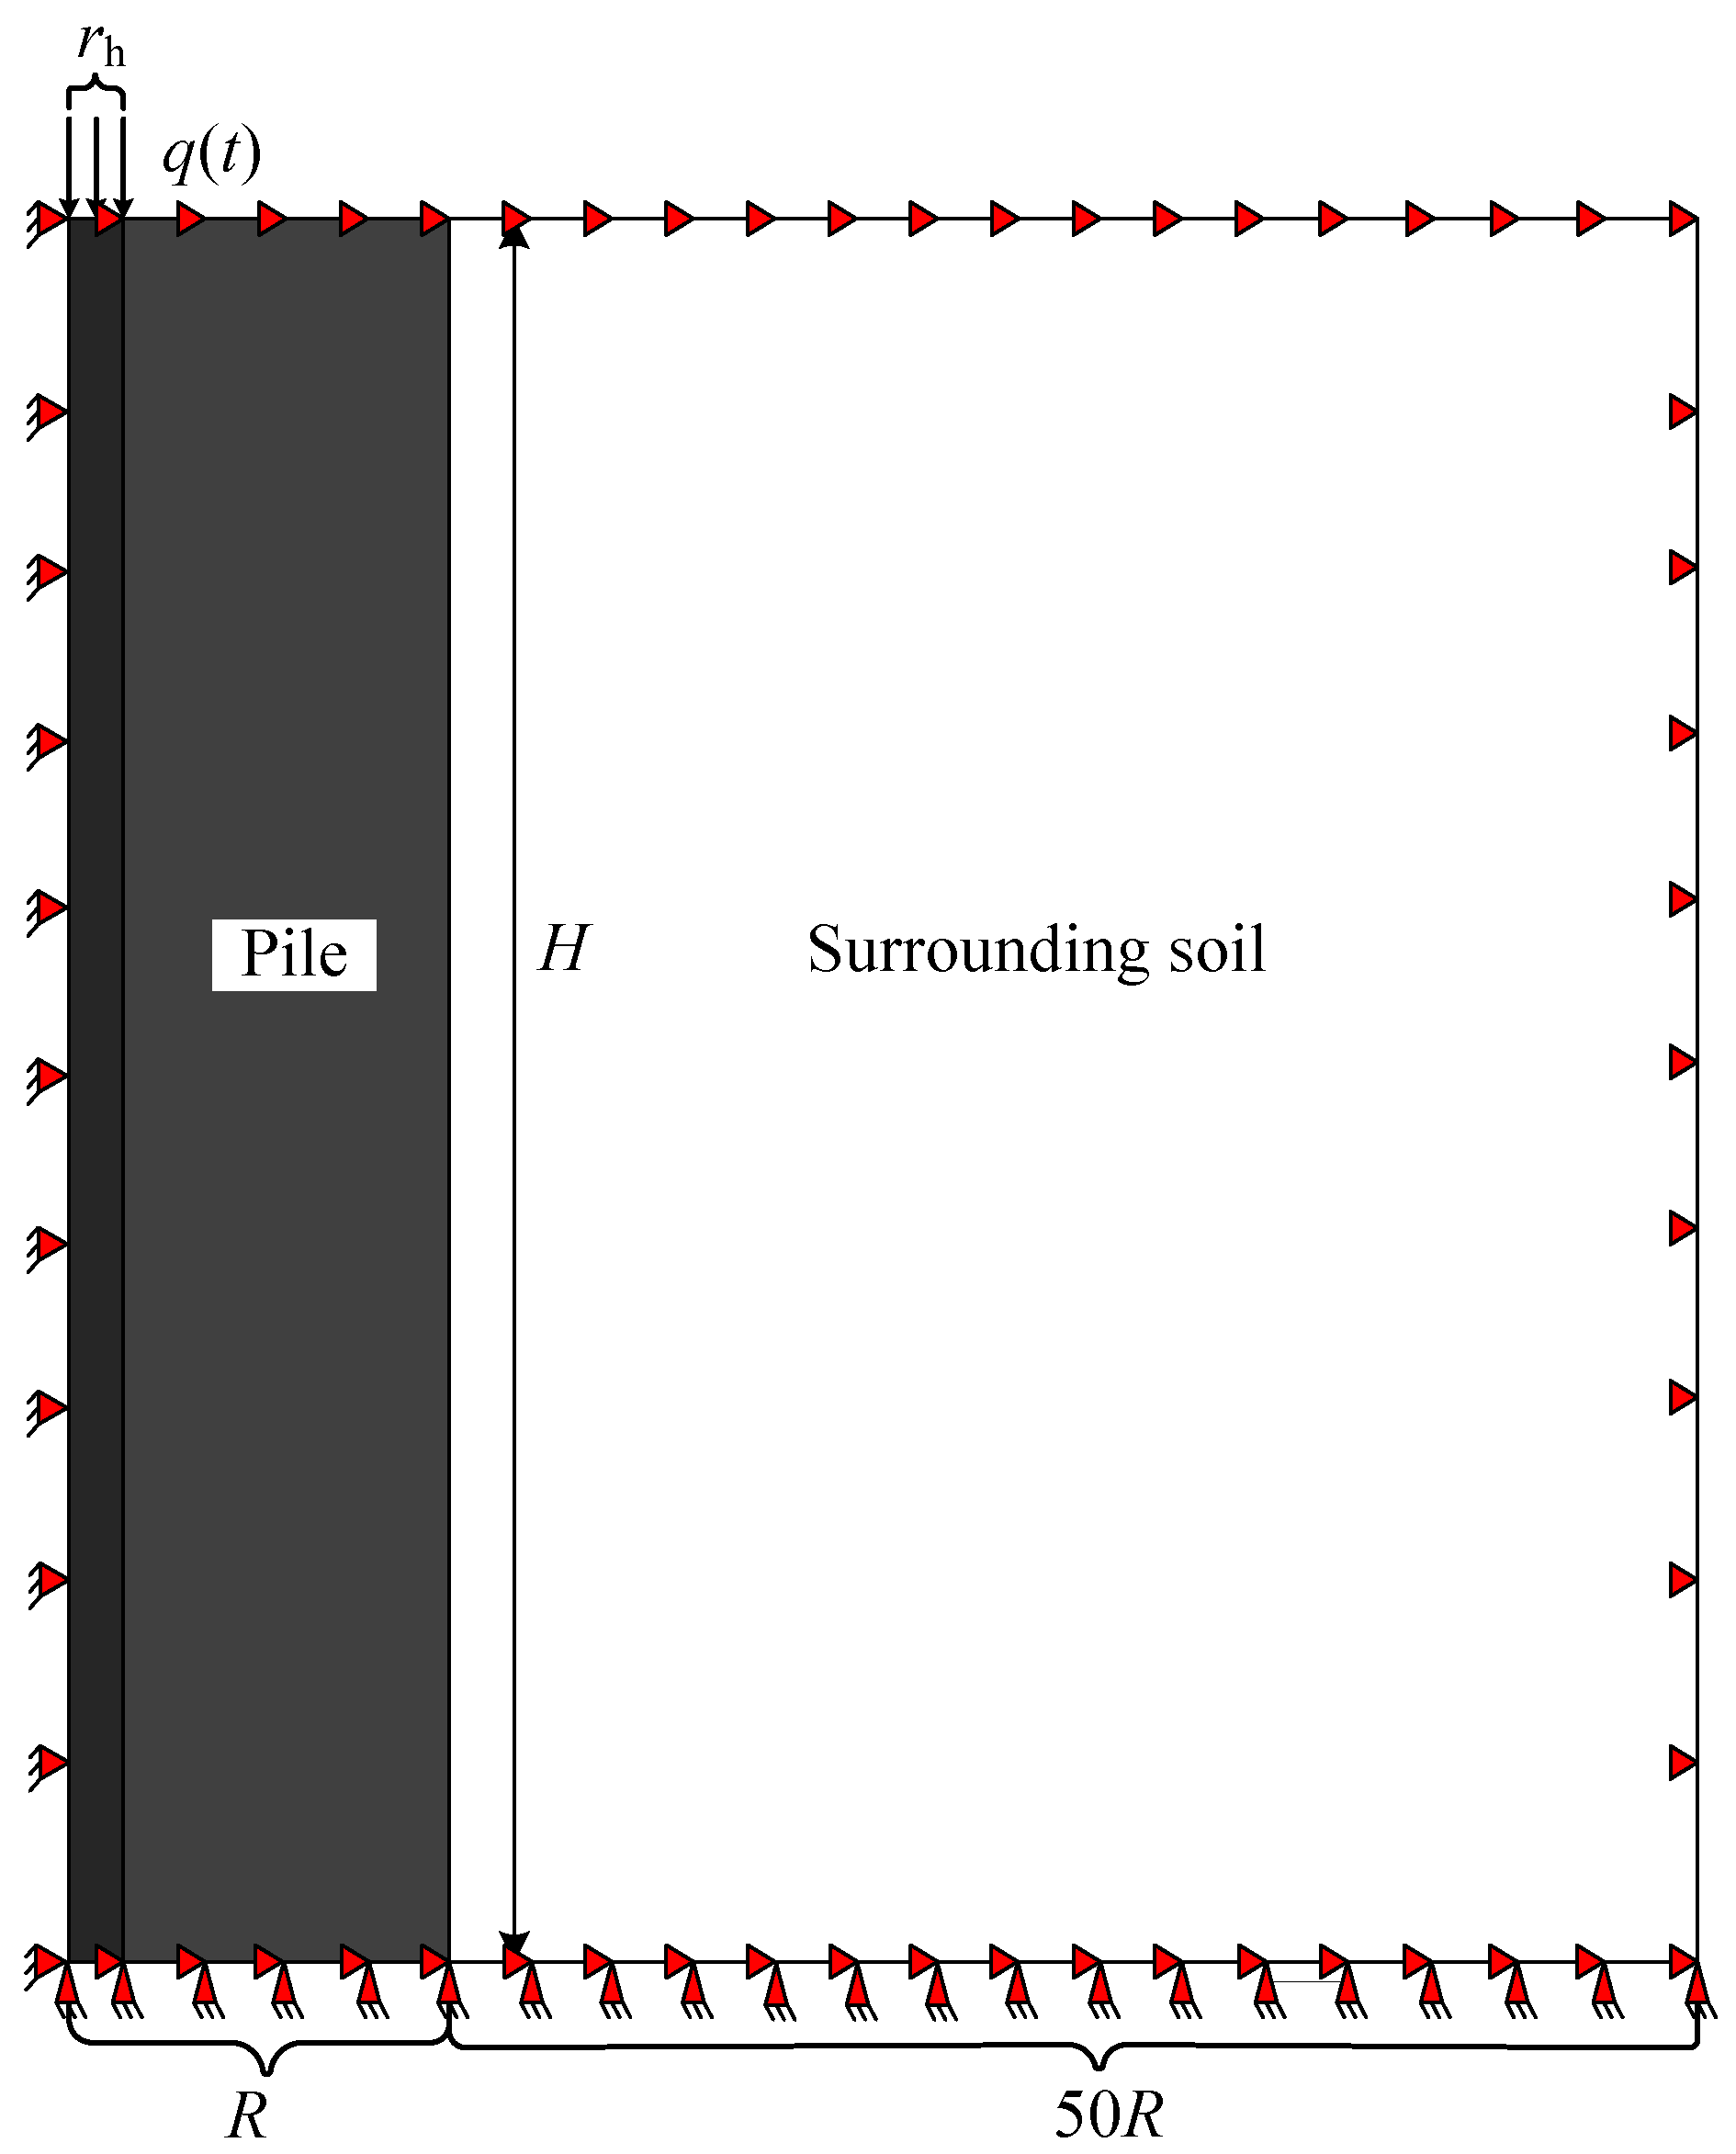
The 3D dynamic interaction model of the hammer-pile-soil system is established in the axisymmetric cylindrical coordinate system based on the conception of Zheng et al. [31]. The pile is divided into two parts marked as pile I and pile II, respectively, as shown in Figure 1a. The radius and length of the pile are represented as R and H, respectively. The uniformly distributed force p(t) acts on the cross-sectional area of the pile I top and is a half-sine pulse expressed as Equation (1). The radius of pile I is equal to the radius of hammer rh.
p ( t ) = Q π ( r h ) 2 sin ( π T t ) 0 t T 0 t > T
where Q is the amplitude of the excitation force, and T is the duration of the excitation force.
In order to solve the above problem, the computational model of the hammer-pile-soil system should satisfy the following assumptions:
(1)
The pile surrounding the soil is homogenous, and its top surface is free. Meanwhile, the pile surrounding the soil is infinite in the radial direction, and the displacement and stress of the soil at infinity are zero.
(2)
During the vibration, only the vertical displacement of the hammer-pile-soil system is taken into account, and the radial displacement is ignored. Both the vertical and radial differentials of the vertical displacement are considered in this paper.
(3)
There is no big deformation in the hammer-pile-soil system; thus, the stress and displacement at the interface between the pile and the surrounding soil are equal. Obviously, pile I also remains in perfect contact with pile II. The hammer-pile-soil system is located on rigid rock.
(4)
The hammer-pile-soil system is static at the beginning.

3. Vibration Equations and Their Solutions

In this section, the governing functions of the pile-soil system are established based on the above mathematical model, and the boundary and initial conditions of the pile-soil system are expressed according to the above basic assumptions. Then, the time-domain velocity of the pile-soil system is obtained.

3.1. Vertical Vibration Equation of Pile Surrounding Soil and Its Solution

Based on the elastic wave theory and ignoring the radial displacement of the pile surrounding soil, the vertical vibration equation of the pile surrounding soil can be established in the axisymmetric cylindrical coordinate system as follow:
( λ s + 2 G s ) 2 w s ( z , r , t ) z 2 + G s ( 2 r 2 + r r ) w s ( z , r , t ) = ρ s 2 w s ( z , r , t ) t 2
where w s ( z , r , t ) , λ s , G s , and ρ s denote the vertical displacement, Lame constant, shear modulus, and mass density of the pile surrounding soil, respectively. λ s and G s can be obtained using the following equation:
λ s = υ s E s ( 1   +   υ s ) ( 1     2 υ s ) G s = E s 2 ( 1   +   υ s )
Based on the above mathematical model and assumptions, the following boundary conditions of the pile surrounding soil can be obtained:
(1)
The stress at the surface of the pile surrounding the soil top is zero:
( λ s + 2 G s ) w s ( z , r , s ) z z = 0 = 0
(2)
The vertical displacement of the pile surrounding soil at the top of the rigid rock is zero:
w s ( z , r , t ) z = H = 0
(3)
The stress and displacement of the pile surrounding soil are zero at infinity:
w s ( z , , t ) = 0 ,   ( λ s + 2 G s ) w s ( z , , t ) z = 0
(4)
The stress and displacement of the pile surrounding the soil are zero at the beginning:
w s ( z , r , 0 ) = 0 ,   ( λ s + 2 G s ) w s ( z , r , 0 ) z = 0
Performing the Laplace transform on Equation (2) gives:
( λ s + 2 G s ) 2 W s ( z , r , s ) z 2 + G s ( 2 r 2 + r r ) W s ( z , r , s ) = ρ s s 2 W s ( z , r , s )
Utilizing the separation of variables method and incorporating the boundary conditions of the pile surrounding soil, the solution to Equation (8) can be obtained as:
W s ( z , r , s ) = n = 1 A s n K 0 ( β s n r ) cos ( α s n z )
where α s n = ( 2 n 1 ) π / 2 H , n = 1, 2, 3···; β s n = ρ s s 2 + ( λ s + 2 G s ) ( α s n ) 2 / G s ; K 0 ( ) is the first kind of modified Bessel function of order zero and A s n is an undetermined constant that can be determined by the boundary conditions.

3.2. Vertical Vibration Equations of the Pile

Similarly, the governing equations for the vertical vibration of the pile can be established as:
( λ i p + 2 G i p ) 2 u i p ( z , r , t ) z 2 + G i p ( 2 r 2 + r r ) u i p ( z , r , t ) = ρ i p 2 u i p ( z , r , t ) t 2
where i = 1, 2; u i p ( z , r , t ) , λ i p , G i p , and ρ i p represent the displacement, Lame constant, shear modulus, and mass density of pile I and pile II, respectively.
The boundary conditions and initial conditions of pile I and II are as follows:
(1)
The boundary condition of the pile top:
( λ i p + 2 G i p ) u i p ( z , r , t ) z z = 0 = p ( t )                       i = 1 = 0                                       i = 2
(2)
The pile bottom is fixed:
u i p ( z , r , t ) z = H = 0
(3)
The interface between the pile and the surrounding soil is continuous:
w s ( z , R , t ) = u 2 p ( z , R , t ) G s w s ( z , r , t ) r r = R = G 2 p u 2 p ( z , r , t ) r r = R
(4)
The interface between Pile I and Pile II is continuous:
u 1 p ( z , r , t ) r = r h = u 2 p ( z , r , t ) r = r h G 1 p u 1 p ( z , r , t ) r r = r h = G 2 p u 2 p ( z , r , t ) r r = r h
(5)
The pile is static at the beginning:
u i p ( z , r , 0 ) = 0 ,   ( λ i p + 2 G i p ) u i p ( z , r , 0 ) z = 0

3.3. The Solution for Pile I

Given i = 1, the problem of pile I consists of Equations (8)–(10), which is a nonhomogeneous boundary problem. To eliminate the nonhomogeneous boundary, given u 1 p ( z , r , t ) = v 1 p ( z , r , t ) + u 1 p * ( z , t ) , then the problem of pile I can be divided into the following two problems:
( λ 1 p + 2 G 1 p ) 2 v 1 p ( z , r , t ) z 2 + G 1 p ( 2 r 2 + r r ) v 1 p ( z , r , t ) = ρ 1 p 2 v 1 p ( z , r , t ) t 2 ( λ 1 p + 2 G 1 p ) v 1 p ( z , r , t ) z z = 0 = 0 v 1 p ( z , r , t ) z = H = 0
( λ 1 p + 2 G 1 p ) 2 u 1 p * ( z , t ) z 2 = ρ 1 p 2 u 1 p * ( z , t ) t 2 ( λ 1 p + 2 G 1 p ) u 1 p * ( z , t ) z z = 0 = p ( t ) A 1 u 1 p * ( z , t ) z = H = 0
Employing the Laplace transform technique and the separation of variables method, the general solution to Equation (16) in the Laplace domain can be obtained as:
V 1 p ( z , r , s ) = n = 1 A 1 n K 0 ( β 1 n r ) + B 1 n I 0 ( β 1 n r ) cos ( α 1 n z )
where α 1 n = ( 2 n 1 ) π / 2 H , n = 1, 2, 3···; β 1 n = ρ 1 p s 2 + ( λ 1 p + 2 G 1 p ) α 1 n 2 / G 1 p ; I 0 ( ) is the second kind of modified Bessel function of order zero; A 1 n and B 1 n are undetermined constants that can be determined by the boundary conditions.
Allowing that the vertical displacement of pile center (r = 0) is bounded, thus, A 1 n = 0 , Equation (18) can be rewritten as:
V 1 p ( z , r , s ) = n = 1 B 1 n I 0 ( β 1 n r ) cos ( α 1 n z )
Applying Laplace transform to Equation (17), the general solution to Equation (17) in the Laplace domain can be deduced as:
U 1 p * ( z , r , s ) = E 1 cos ( γ 1 z ) + F 1 sin ( γ 1 z )
where γ 1 = ρ 1 p s 2 / ( λ 1 p + 2 G 1 p + η 1 p s ) ; E 1 and F 1 are undetermined constants that can be determined by the boundary conditions.
According to the boundary conditions in Equation (17), the expressions for E 1 and F 1 can be obtained as:
E 1 = tan ( γ 1 H ) P ( s ) ( λ 1 p + 2 G 1 p ) γ 1 ,   F 1 = P ( s ) ( λ 1 p + 2 G 1 p ) γ 1
where P ( s ) is the Laplace transform of p ( t ) .
Substituting Equation (21) into Equation (20) and combining it with Equation (19), the vertical displacement of pile I in the Laplace domain can be expressed as:
U 1 p ( z , r , s ) = n = 1 B 1 n I 0 ( β 1 n r ) cos ( α 1 n z ) P ( s ) ( λ 1 p + 2 G 1 p ) γ 1 ξ cos ( γ 1 z ) + sin ( γ 1 z )
where ξ = tan ( γ 1 H ) .

3.4. The Solution for Pile II

When i = 2, Equation (10) is the governing equation of pile II. Applying Laplace transform to Equation (10) yields:
( λ 2 p + 2 G 2 p ) 2 U 2 p ( z , r , s ) z 2 + G 2 p ( 2 r 2 + r r ) U 2 p ( z , r , s ) = ρ 2 p s 2 U 2 p ( z , r , s )
Combining with the boundary condition of pile top and end, the general solution to Equation (23) can be deduced by the separation of variables:
U 2 p ( z , r , s ) = n A 2 n K 0 ( β 2 n r ) + B 2 n I 0 ( β 2 n r ) cos ( α 2 n z )
where α n = α s n = α 2 n = α 1 n = ( 2 n 1 ) π / 2 H ; β 2 n = ρ 2 p s 2 + ( λ 2 p + 2 G 2 p ) α 2 n 2 / G 2 p ; n = 1, 2, 3···; A 2 n and B 2 n are unknown constants.
Employing Laplace transform on Equation (13) and substituting Equation (9) and Equation (24) into Equation (13) gives:
A 2 n = δ n B 2 n
where δ n = G 2 p β 2 n K 0 ( β s n R ) I 1 ( β 2 n R )   +   G s β s n K 1 ( β s n R ) I 0 ( β 2 n R ) G 2 p β 2 n K 0 ( β s n R ) K 1 ( β 2 n R )     G s β s n K 1 ( β s n R ) K 0 ( β 2 n R ) , K 1 ( ) and I 1 ( ) are the first and second kinds of modified Bessel functions of the first order, respectively.
Then, according to Equation (14), B 1 n and B 2 n can be obtained as:
B 1 n = P ( s ) A 1 ( λ 1 p   +   2 G 1 p ) γ 1 F n H I 0 ( β 1 n r 1 ) + G 1 p β 1 n I 1 ( β 1 n r 1 ) ζ n K 0 ( β 2 n r 1 )   +   I 0 ( β 2 n r 1 ) G 2 p β 2 n ζ n K 1 ( β 2 n r 1 )     I 1 ( β 2 n r 1 )
B 2 n = G 1 p β 1 n I 1 ( β 1 n r 1 ) G 2 p β 2 n ζ n K 1 ( β 2 n r 1 ) I 1 ( β 2 n r 1 ) B 1 n
in which F n is expressed as:
F n = ξ sin ( ( γ 1 α 2 n ) H ) γ 1 α 2 n + sin ( ( γ 1 + α 2 n ) H ) γ 1 + α 2 n + 1 cos ( ( γ 1 α 2 n ) H ) γ 1 α 2 n + 1 cos ( ( γ 1 + α 2 n ) H ) γ 1 + α 2 n
Finally, by substituting Equation (27) into Equation (25) A 2 n can be obtained. Then, according to Equation (13), the expression of A s n can also be obtained.
Based on the inverse Laplace transform, the semi-analytical solution for vertical velocity in the time domain of the pile and surrounding soil can be expressed as:
v i p ( z , r , s ) = 1 2 π s U i p ( z , r , s ) e i ω t d ω v s ( z , r , s ) = 1 2 π s W s ( z , r , s ) e i ω t d ω
where s = i ω , ω is the circular frequency.

4. Comparison

4.1. Comparison with Finite Element Model

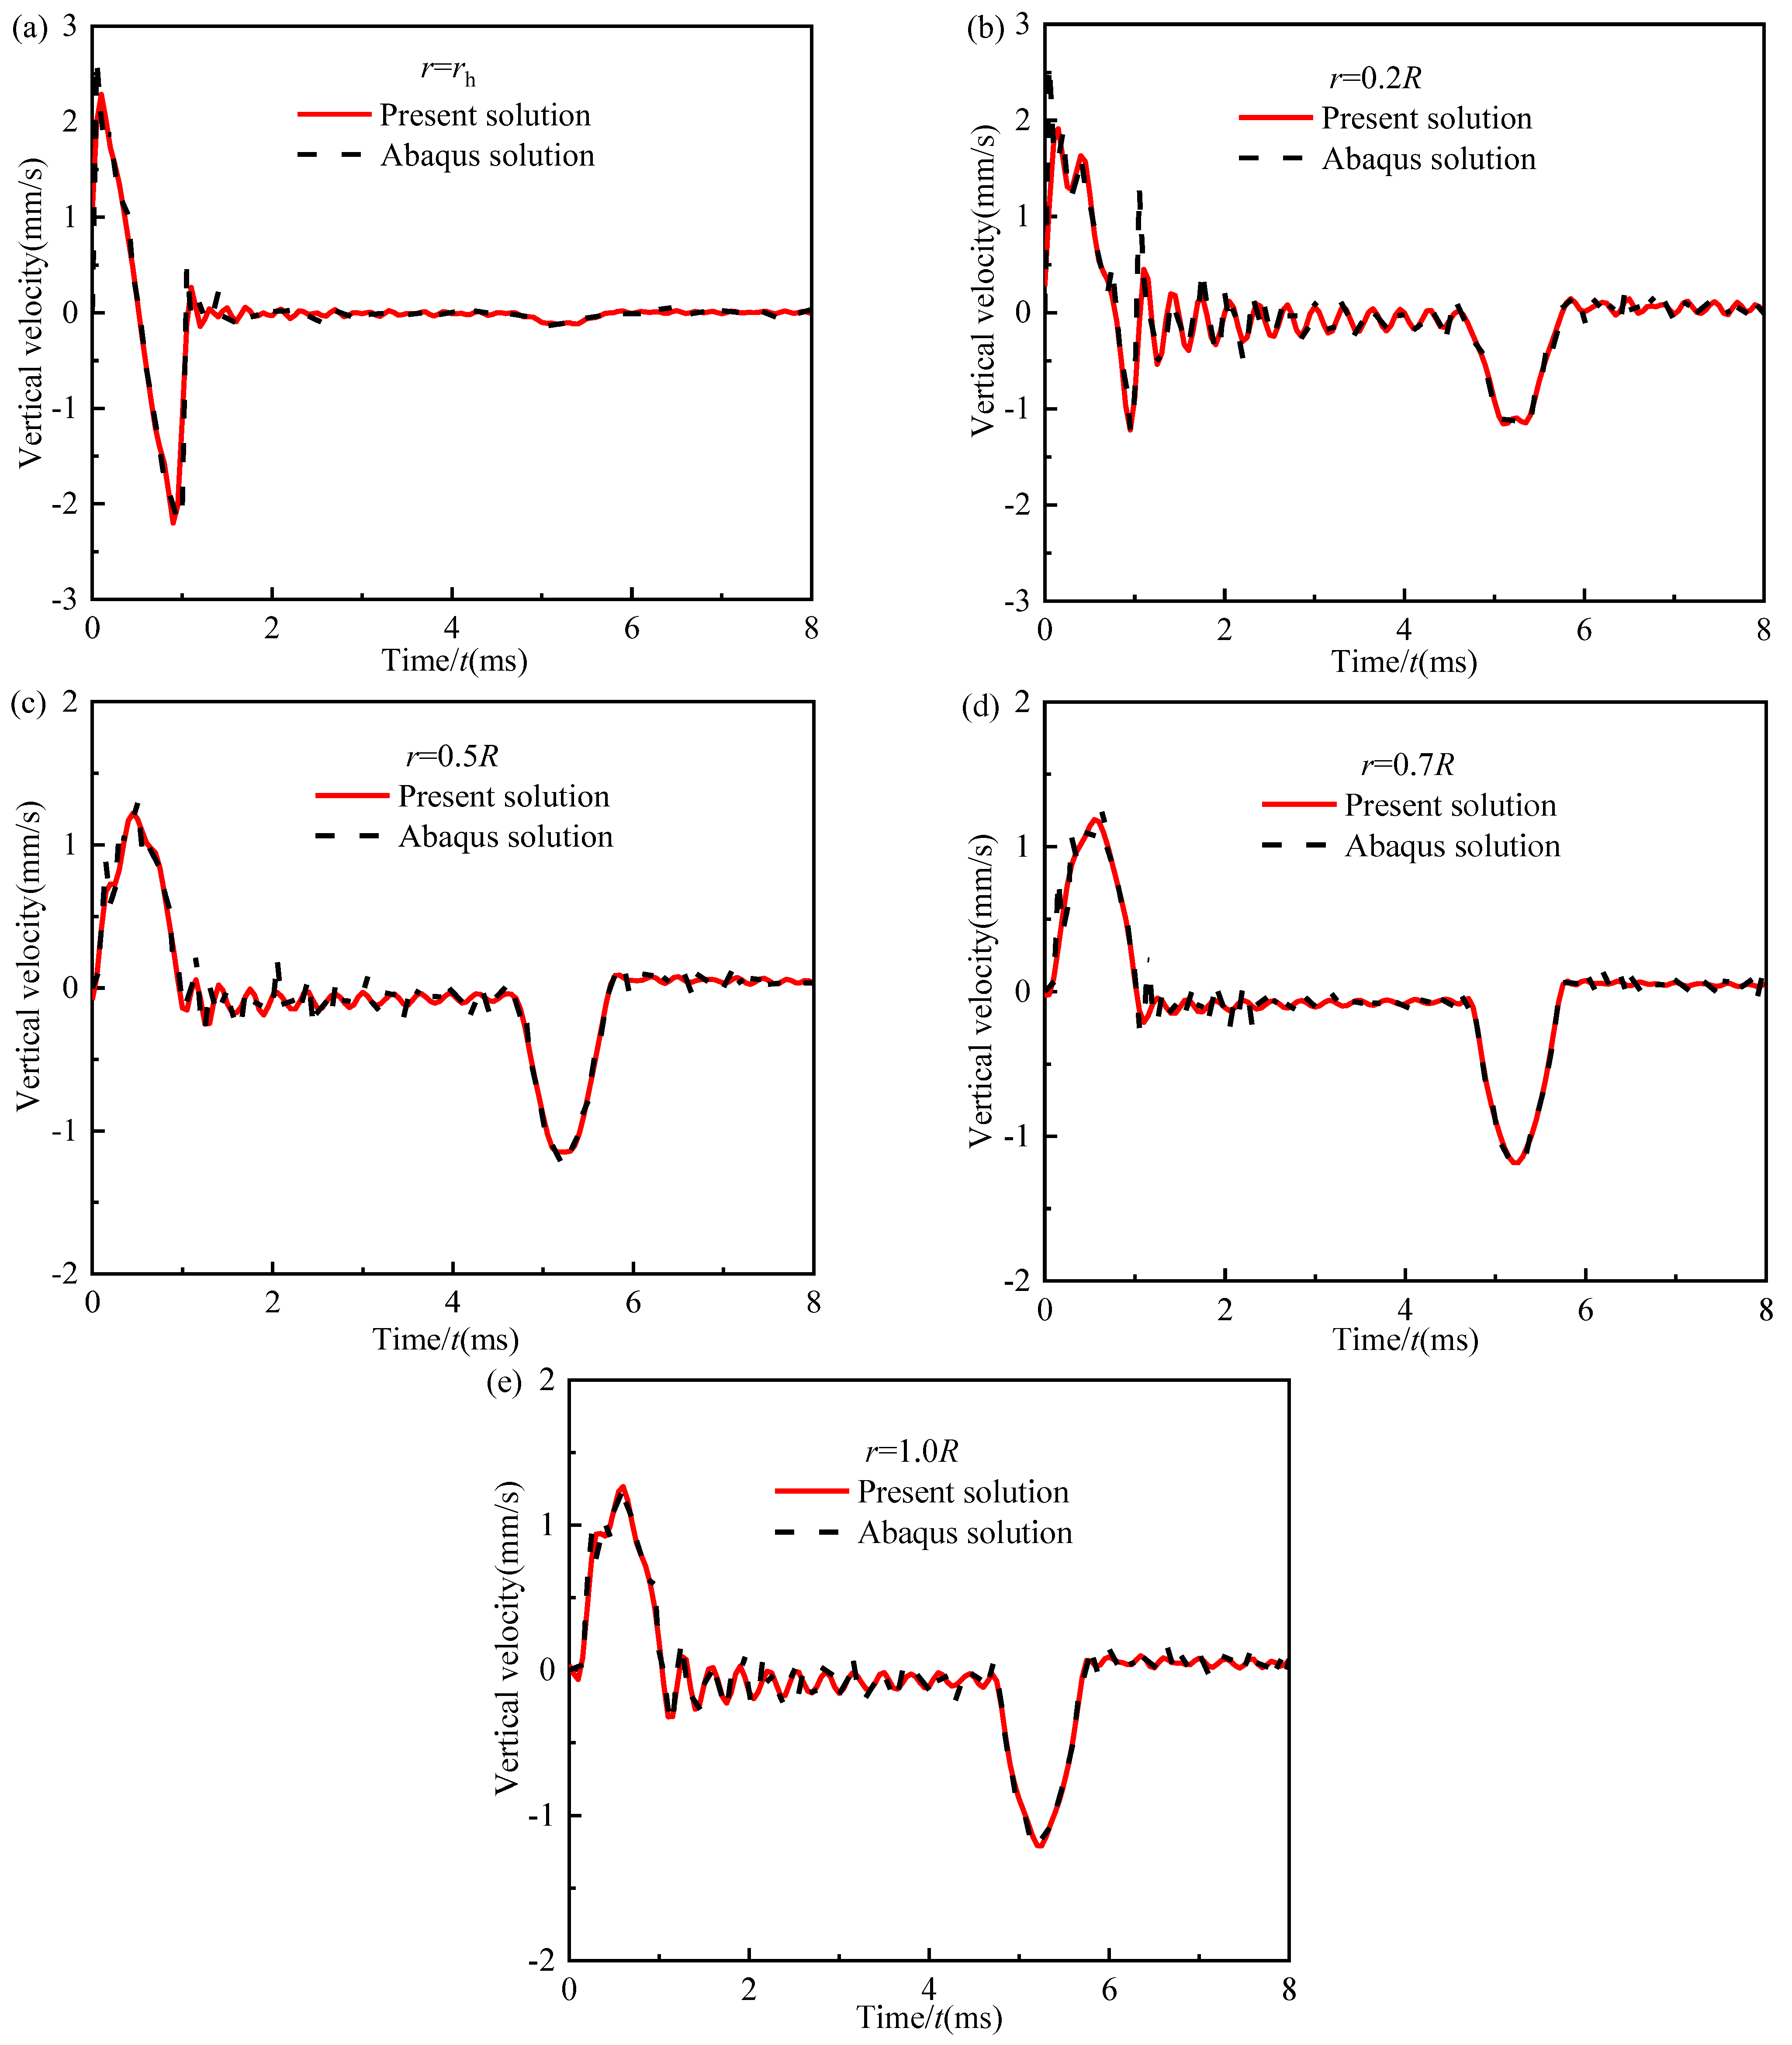
In this section, the 3D finite element model of the pile-soil system is established using Abaqus software with a Standard/Explicit model according to Figure 1a, as shown in Figure 2, in which the pile and soil are elastic materials and are meshed with the element of type CAX4R, the radial displacement of the pile-soil system is constrained, and the interaction between the pile and the pile surrounding soil is simulated using a tie constraint. For the finite element model and the present model, the parameters of the pile-soil system are set with reference to Table 1. The radius of the pile is set as R = 0.5 m, the duration of the excitation load is set as T = 1 ms, the amplitude of the excitation load is set as Q = 10 kN, and the radius of the hammer is set as rh = 0.01 m. Figure 3a–e show the velocity curves in the time domain of different test points along the radius of the large-diameter pile top of the present solution and the calculated results using Abaqus. It is observed that the present solution can match very well with the Abaqus solution at different test points. The phenomena indicate that the present solution can accurately reflect the 3D effect of the axisymmetric large-diameter pile-soil system. Meanwhile, it also proves the correctness of the derivation process of the present solution.

4.2. Comparison with Other Existing Solutions

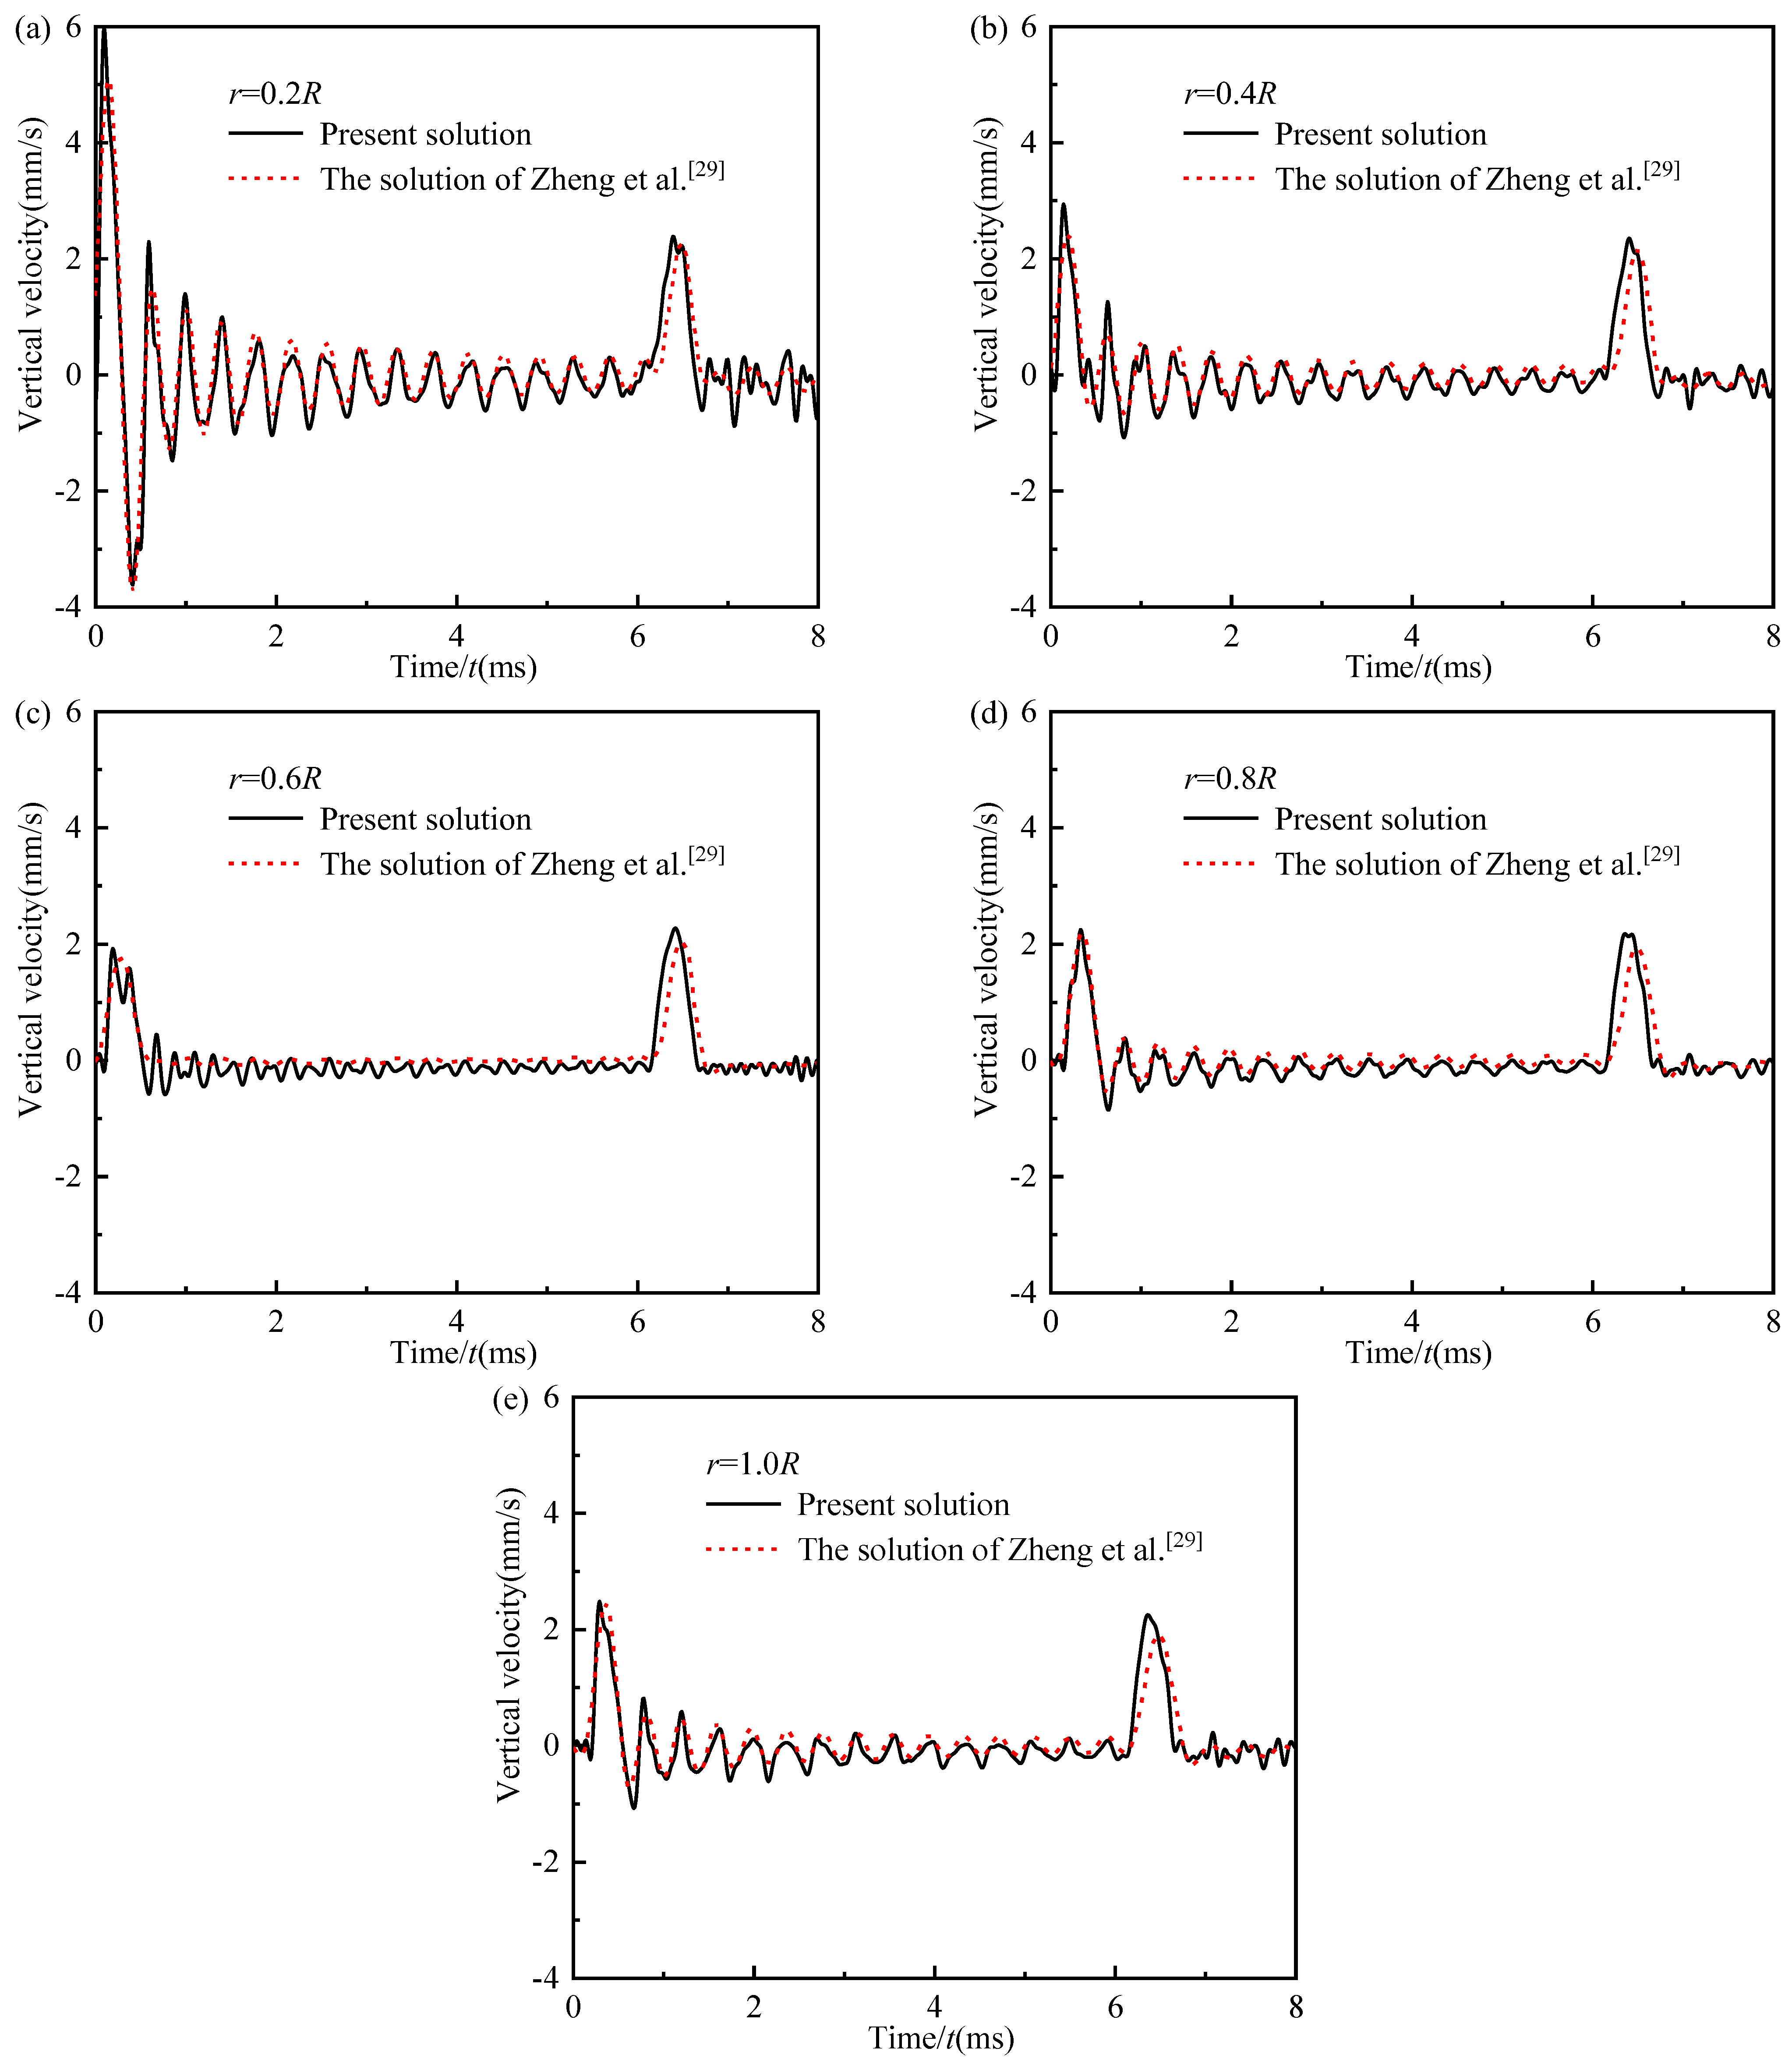
In this section, the present solution is compared with the solution of Zheng et al. [29]. As shown in Table 2, the parameters of the present model in this paper are consistent with those of Zheng et al. [29]. In the paper of Zheng et al. [29], the radius of the pile is set as R = 0.5 m, and the parameters of the excitation load are set as Q = 10 kN, T = 0.5 ms, and rh = 0.02 m. In the model of Zheng et al. [29], the 3D continuum model is adopted for the pile body, which can reflect the 3D effect of the pile body. However, the plane strain model is used to simulate the pile surrounding soil, which cannot reflect the 3D effect of the pile surrounding soil. Meanwhile, in the process of Zheng et al.’s solution [29], only the displacement continuity at the pile center between the interface of each pile segment is considered, which cannot reflect the displacement continuity at any point between the interface of each pile segment. However, in the present model, the 3D continuum model is used to simulate the pile body and the pile surrounding soil; therefore, the present model can reflect the 3D effect of the pile-soil system, which is more rigorous. Figure 4a–e display the velocity curves in the time domain of different test points along the radius of the large-diameter pile top of the present solution and the solution of Zheng et al. [29]. It is captured that the trend of the velocity curves in the time domain of the present solution can match well with those of Zheng et al. [29]. However, compared with the solution of Zheng et al. [29], the present solution at different test points exhibits more obvious high-frequency interference characteristics, the velocity curves in the time domain of different test points are more irregular and less smooth, and the incident wave signal and the first reflected wave signal are also significantly affected by the high-frequency interference.
Meanwhile, it is seen from Figure 4 that the arrival time of the first reflected wave signal of the present solution is basically consistent with that of Zheng et al. [29], but the peak arrival time of the first reflected wave signal of the present solution is significantly earlier than that of Zheng et al. [29]. The phenomenon may be due to the fact that the present solution considers the 3D effect of the pile and the surrounding soil at the same time, which results in the more obvious high-frequency interference in the present solution. The more obvious high-frequency interference in the present solution has an effect on the first reflected wave, which makes the peak arrival time of the present solution earlier than the solution of Zheng et al. [29]. The above agreements verify the accuracy of the present solution, and the above differences indicate that the present solution is more accurate in evaluating the 3D effect of the large-diameter pile-soil system in low-strain integrity testing. Meanwhile, the above differences also indicate that the existence of the 3D effect will lead to the misjudgment of pile length in the low-strain integrity testing of the pile.

5. Parametric Study

The present model is proven to be accurate for evaluating the 3D effect of the axisymmetric large-diameter pile-soil system. In this section, several examples under different working conditions are examined to investigate the influence of the 3D effect of the pile-soil system on the vertical dynamic response of the large-diameter pile top. Unless otherwise specified, the parameters of the hammer-pile-soil system are the same as those in Section 4.1 in the following analyses. Four piles with different radii are selected to evaluate the influence of the 3D effect of the pile-soil system so as to make the obtained results more convincing and reliable. The radii of piles are set as R = 0.25 m, 0.5 m, 0.75 m, and 1.0 m, respectively.

5.1. The Influence of the 3D Effect of the Pile-Soil System

5.1.1. Within the Excitation Region

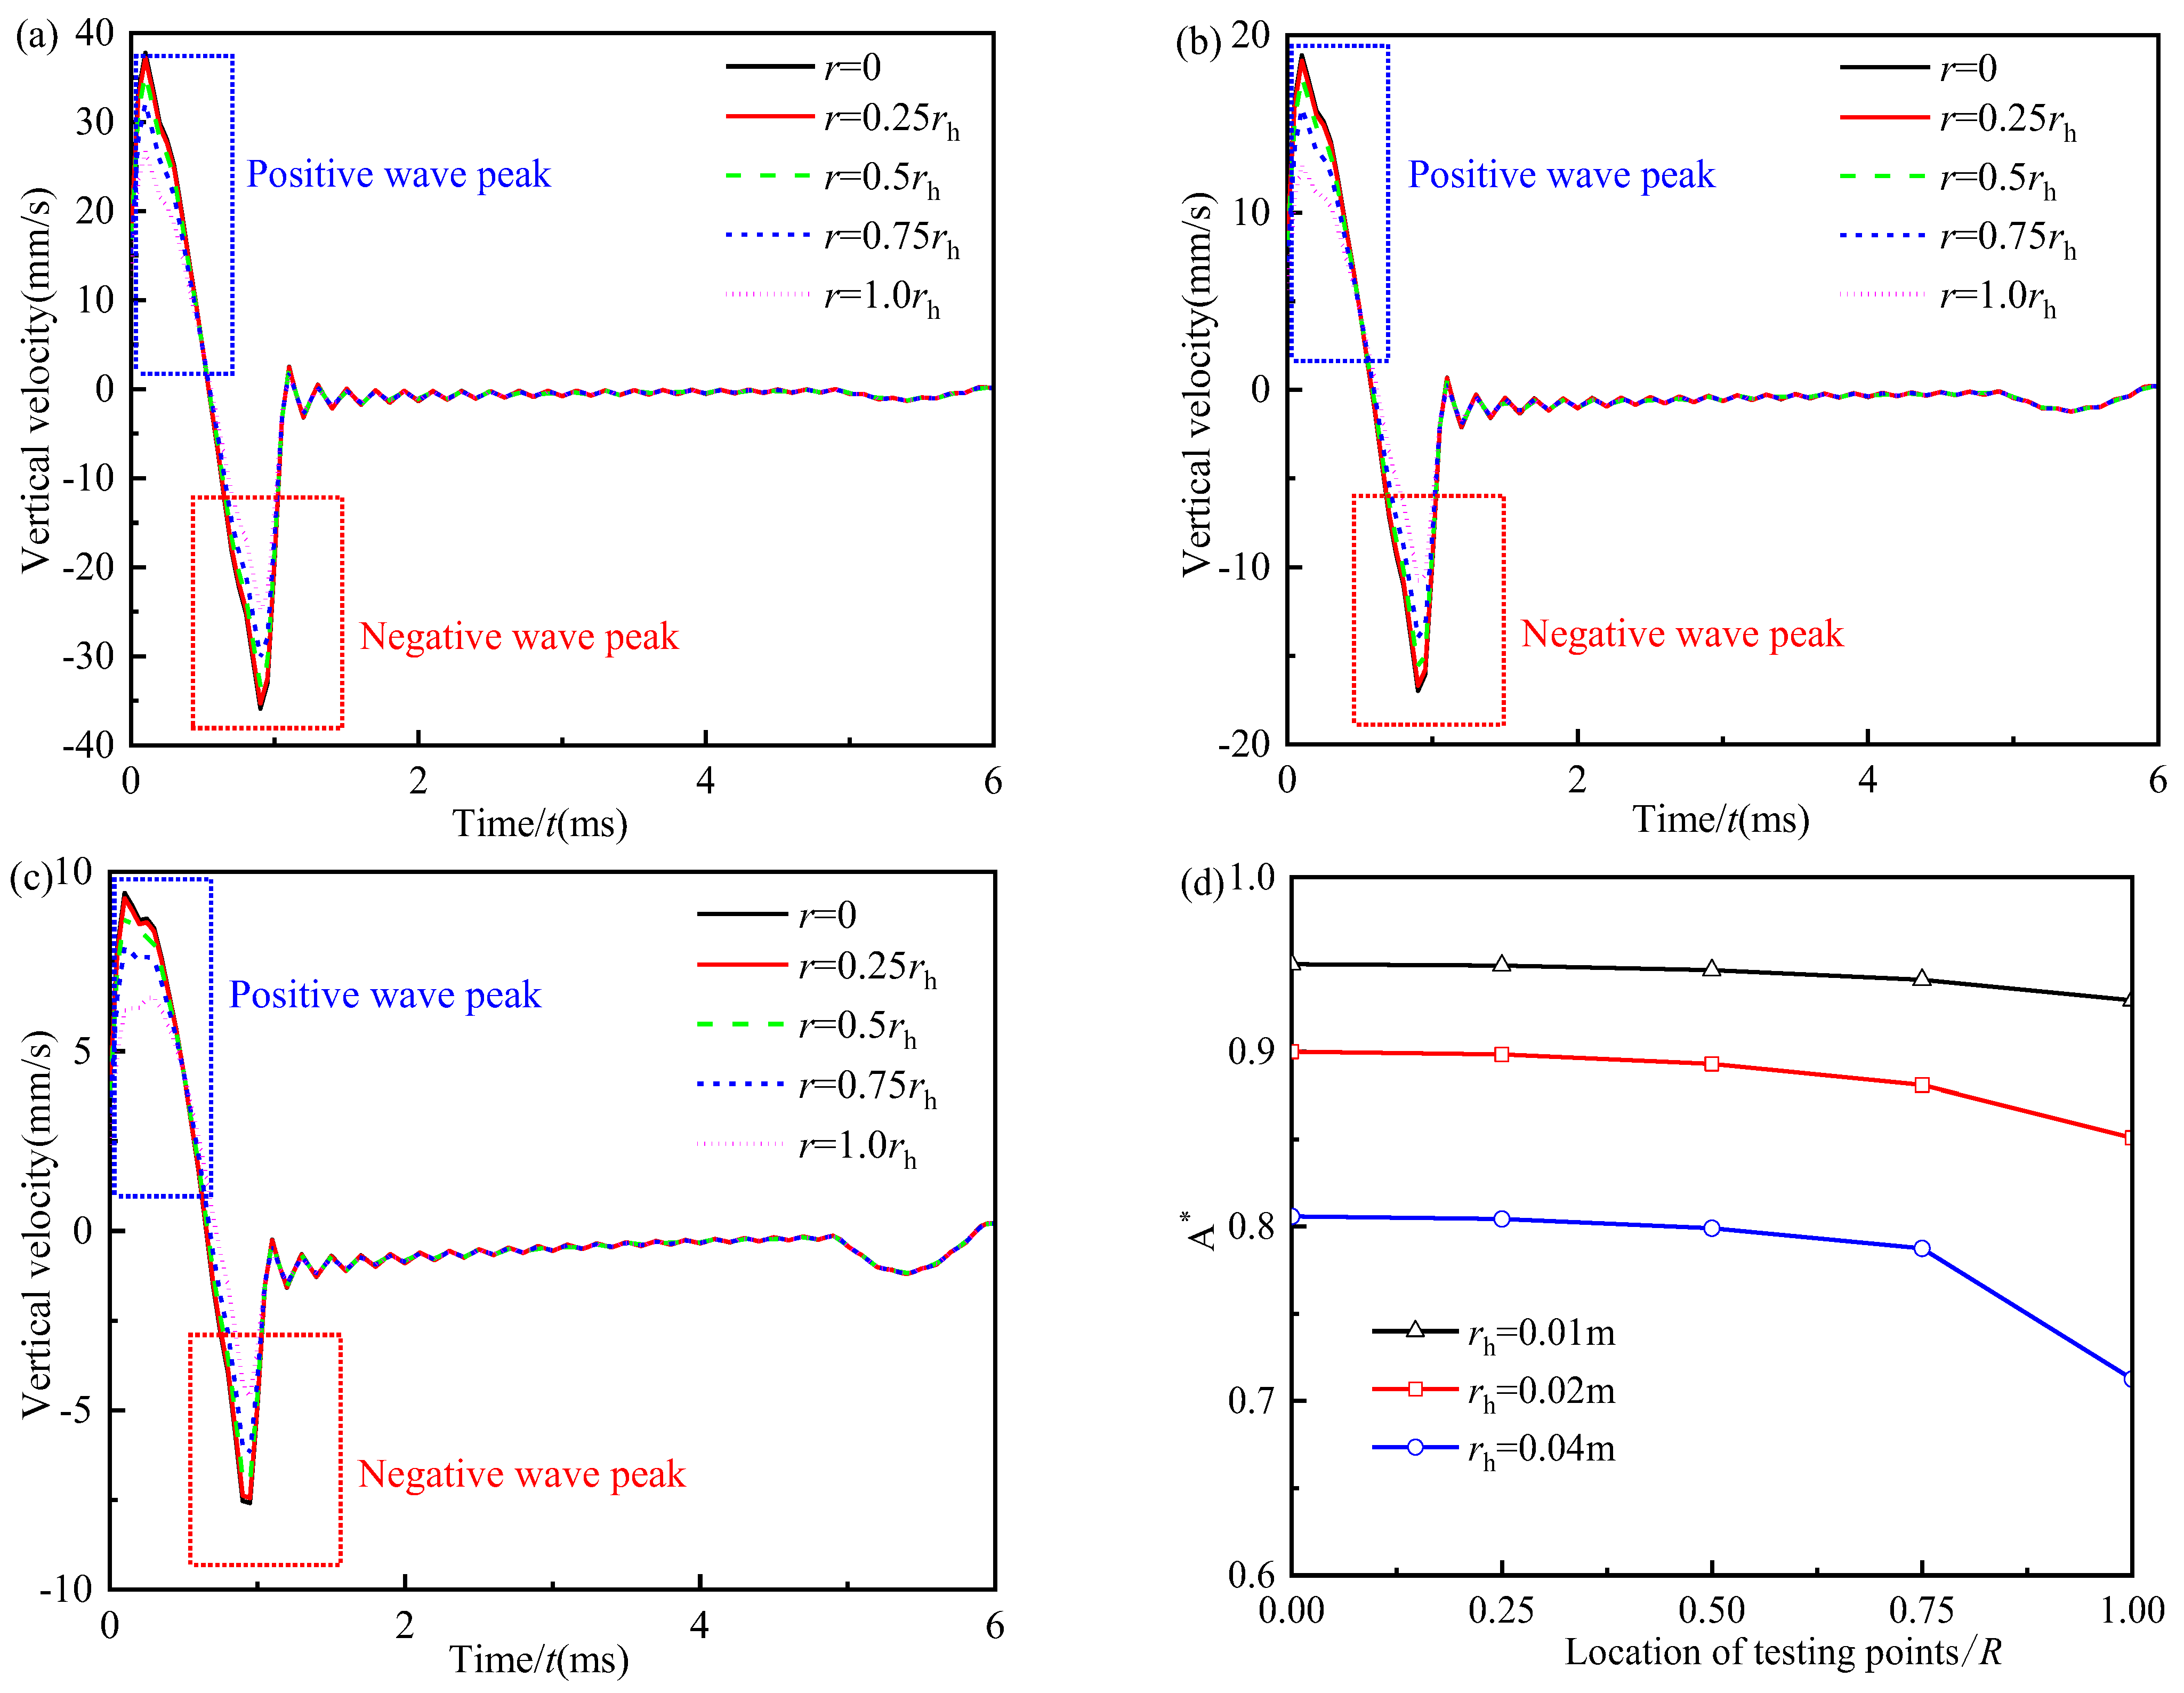
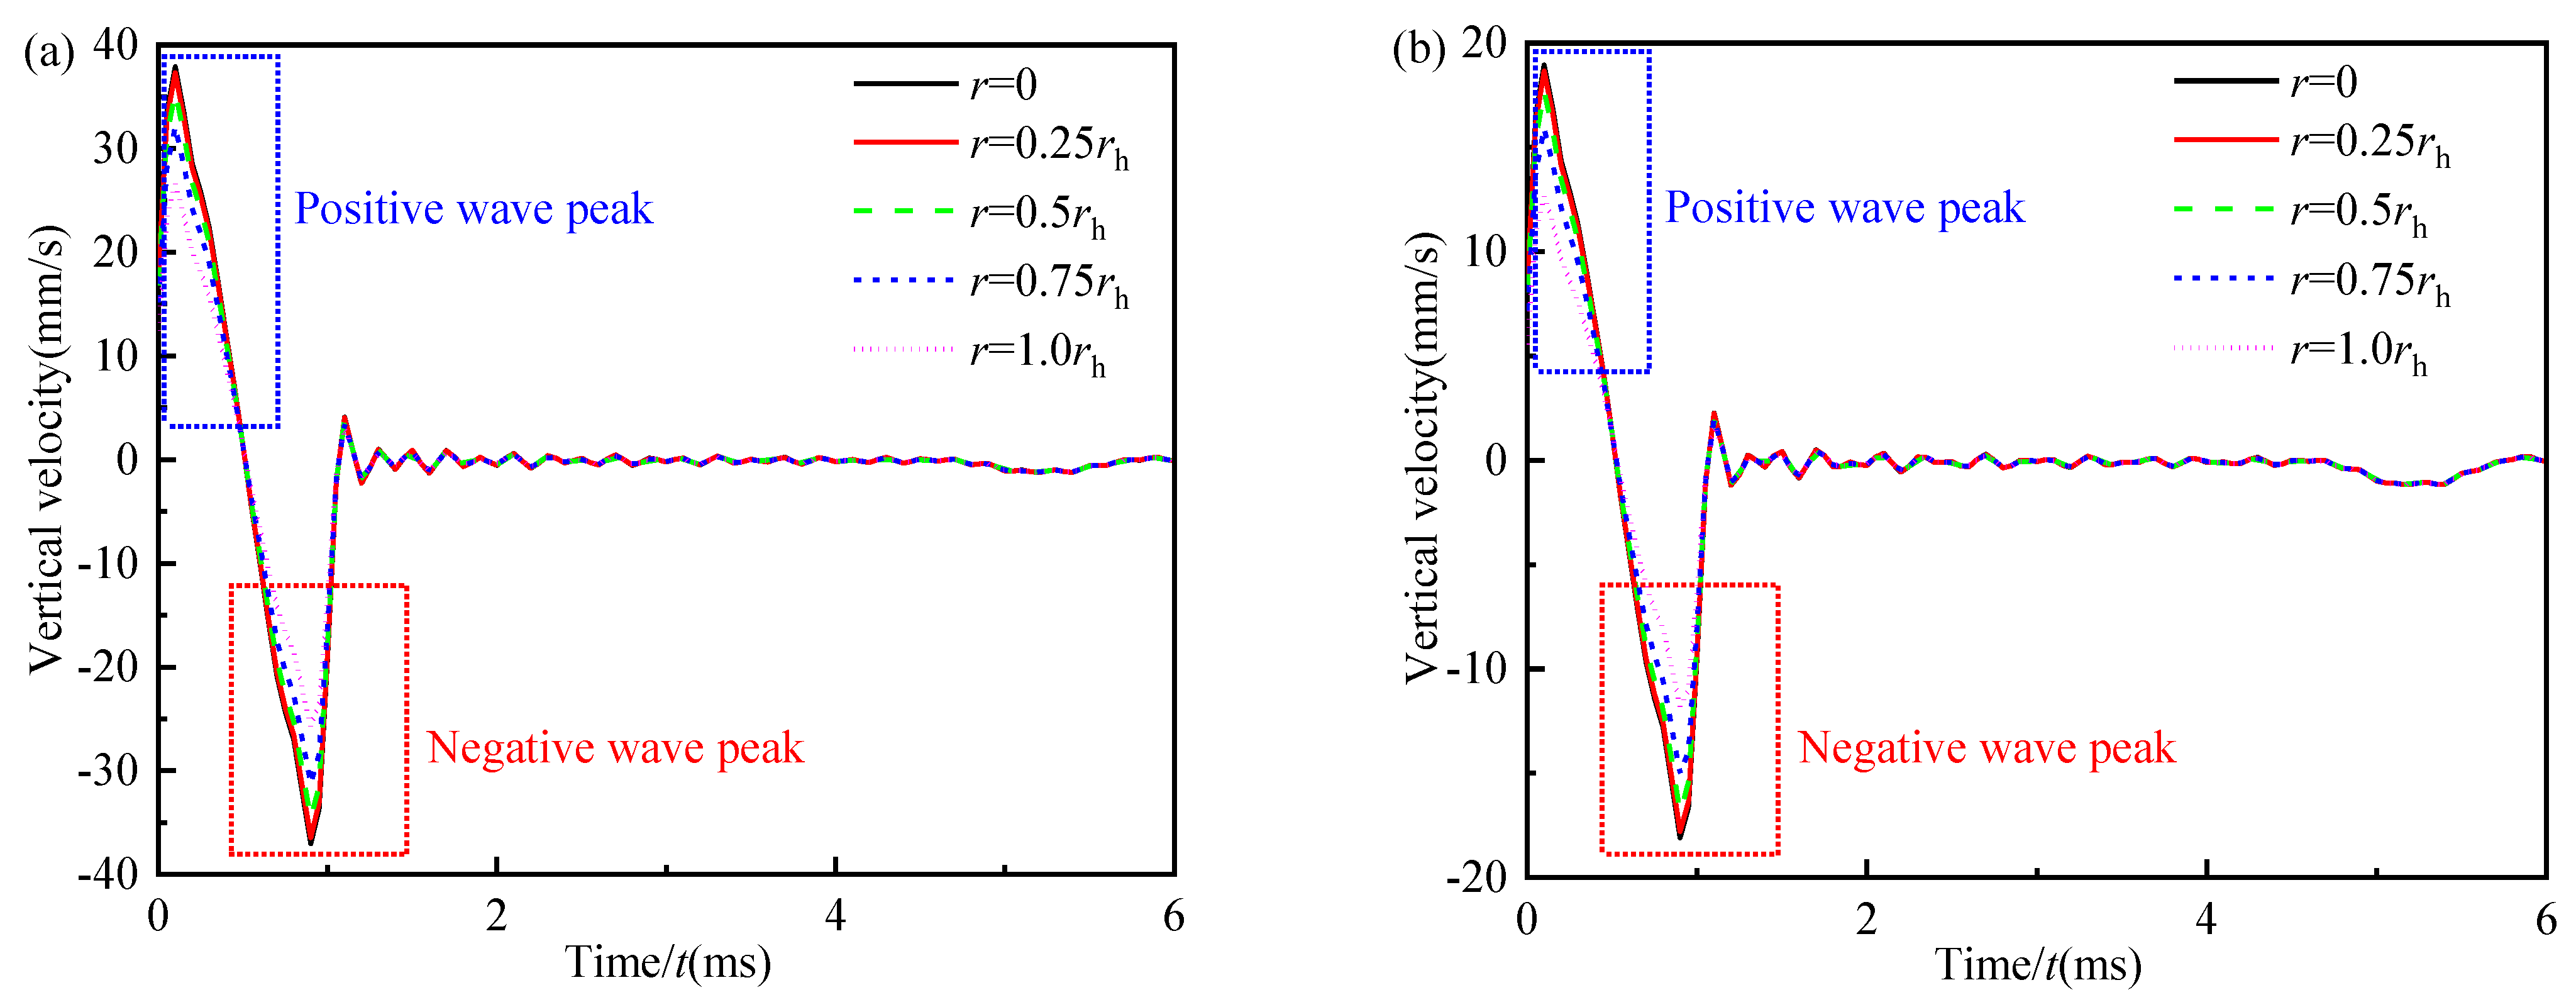
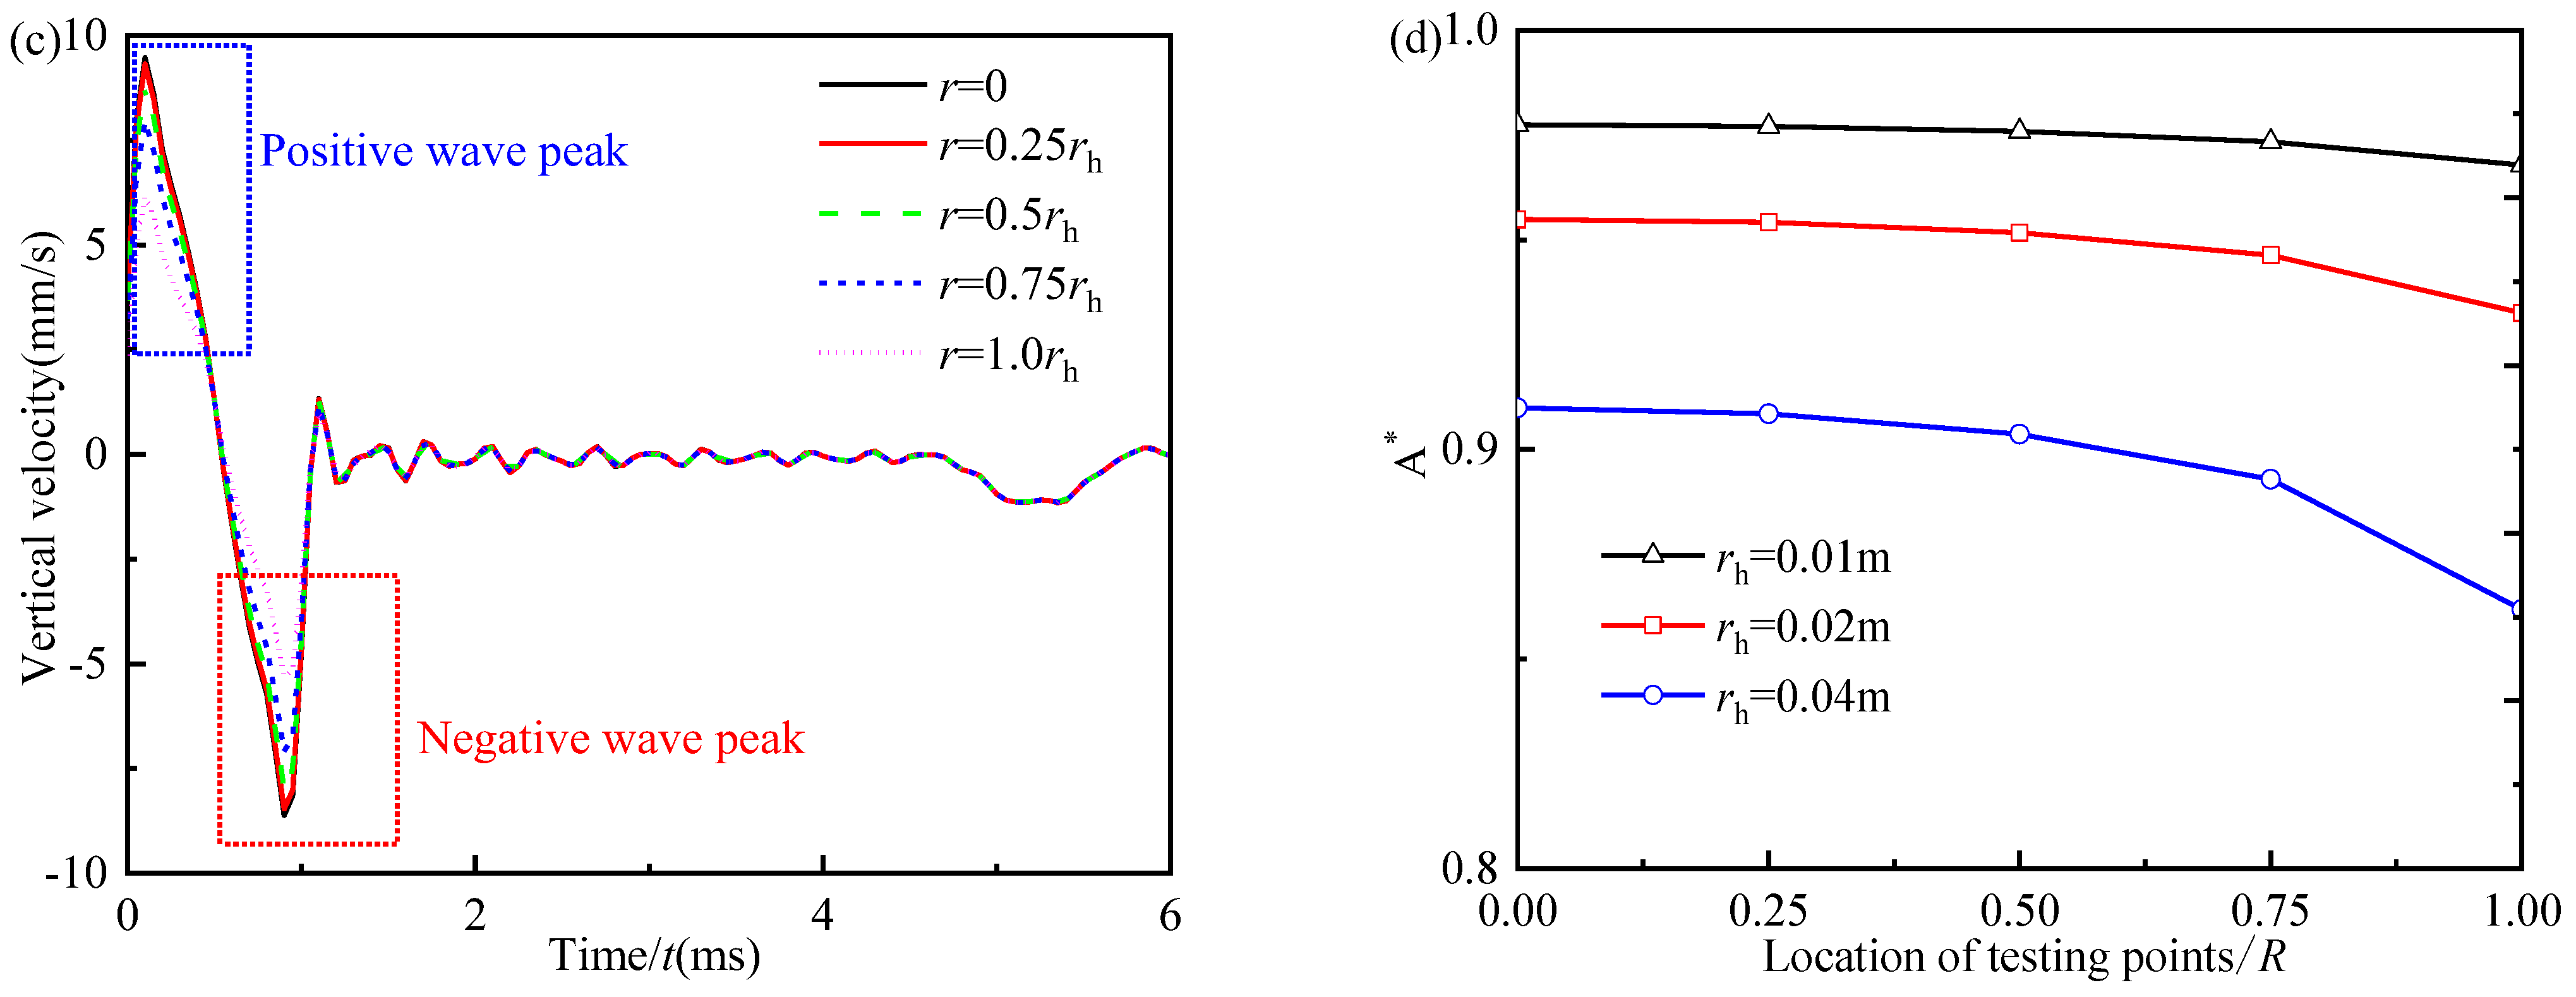
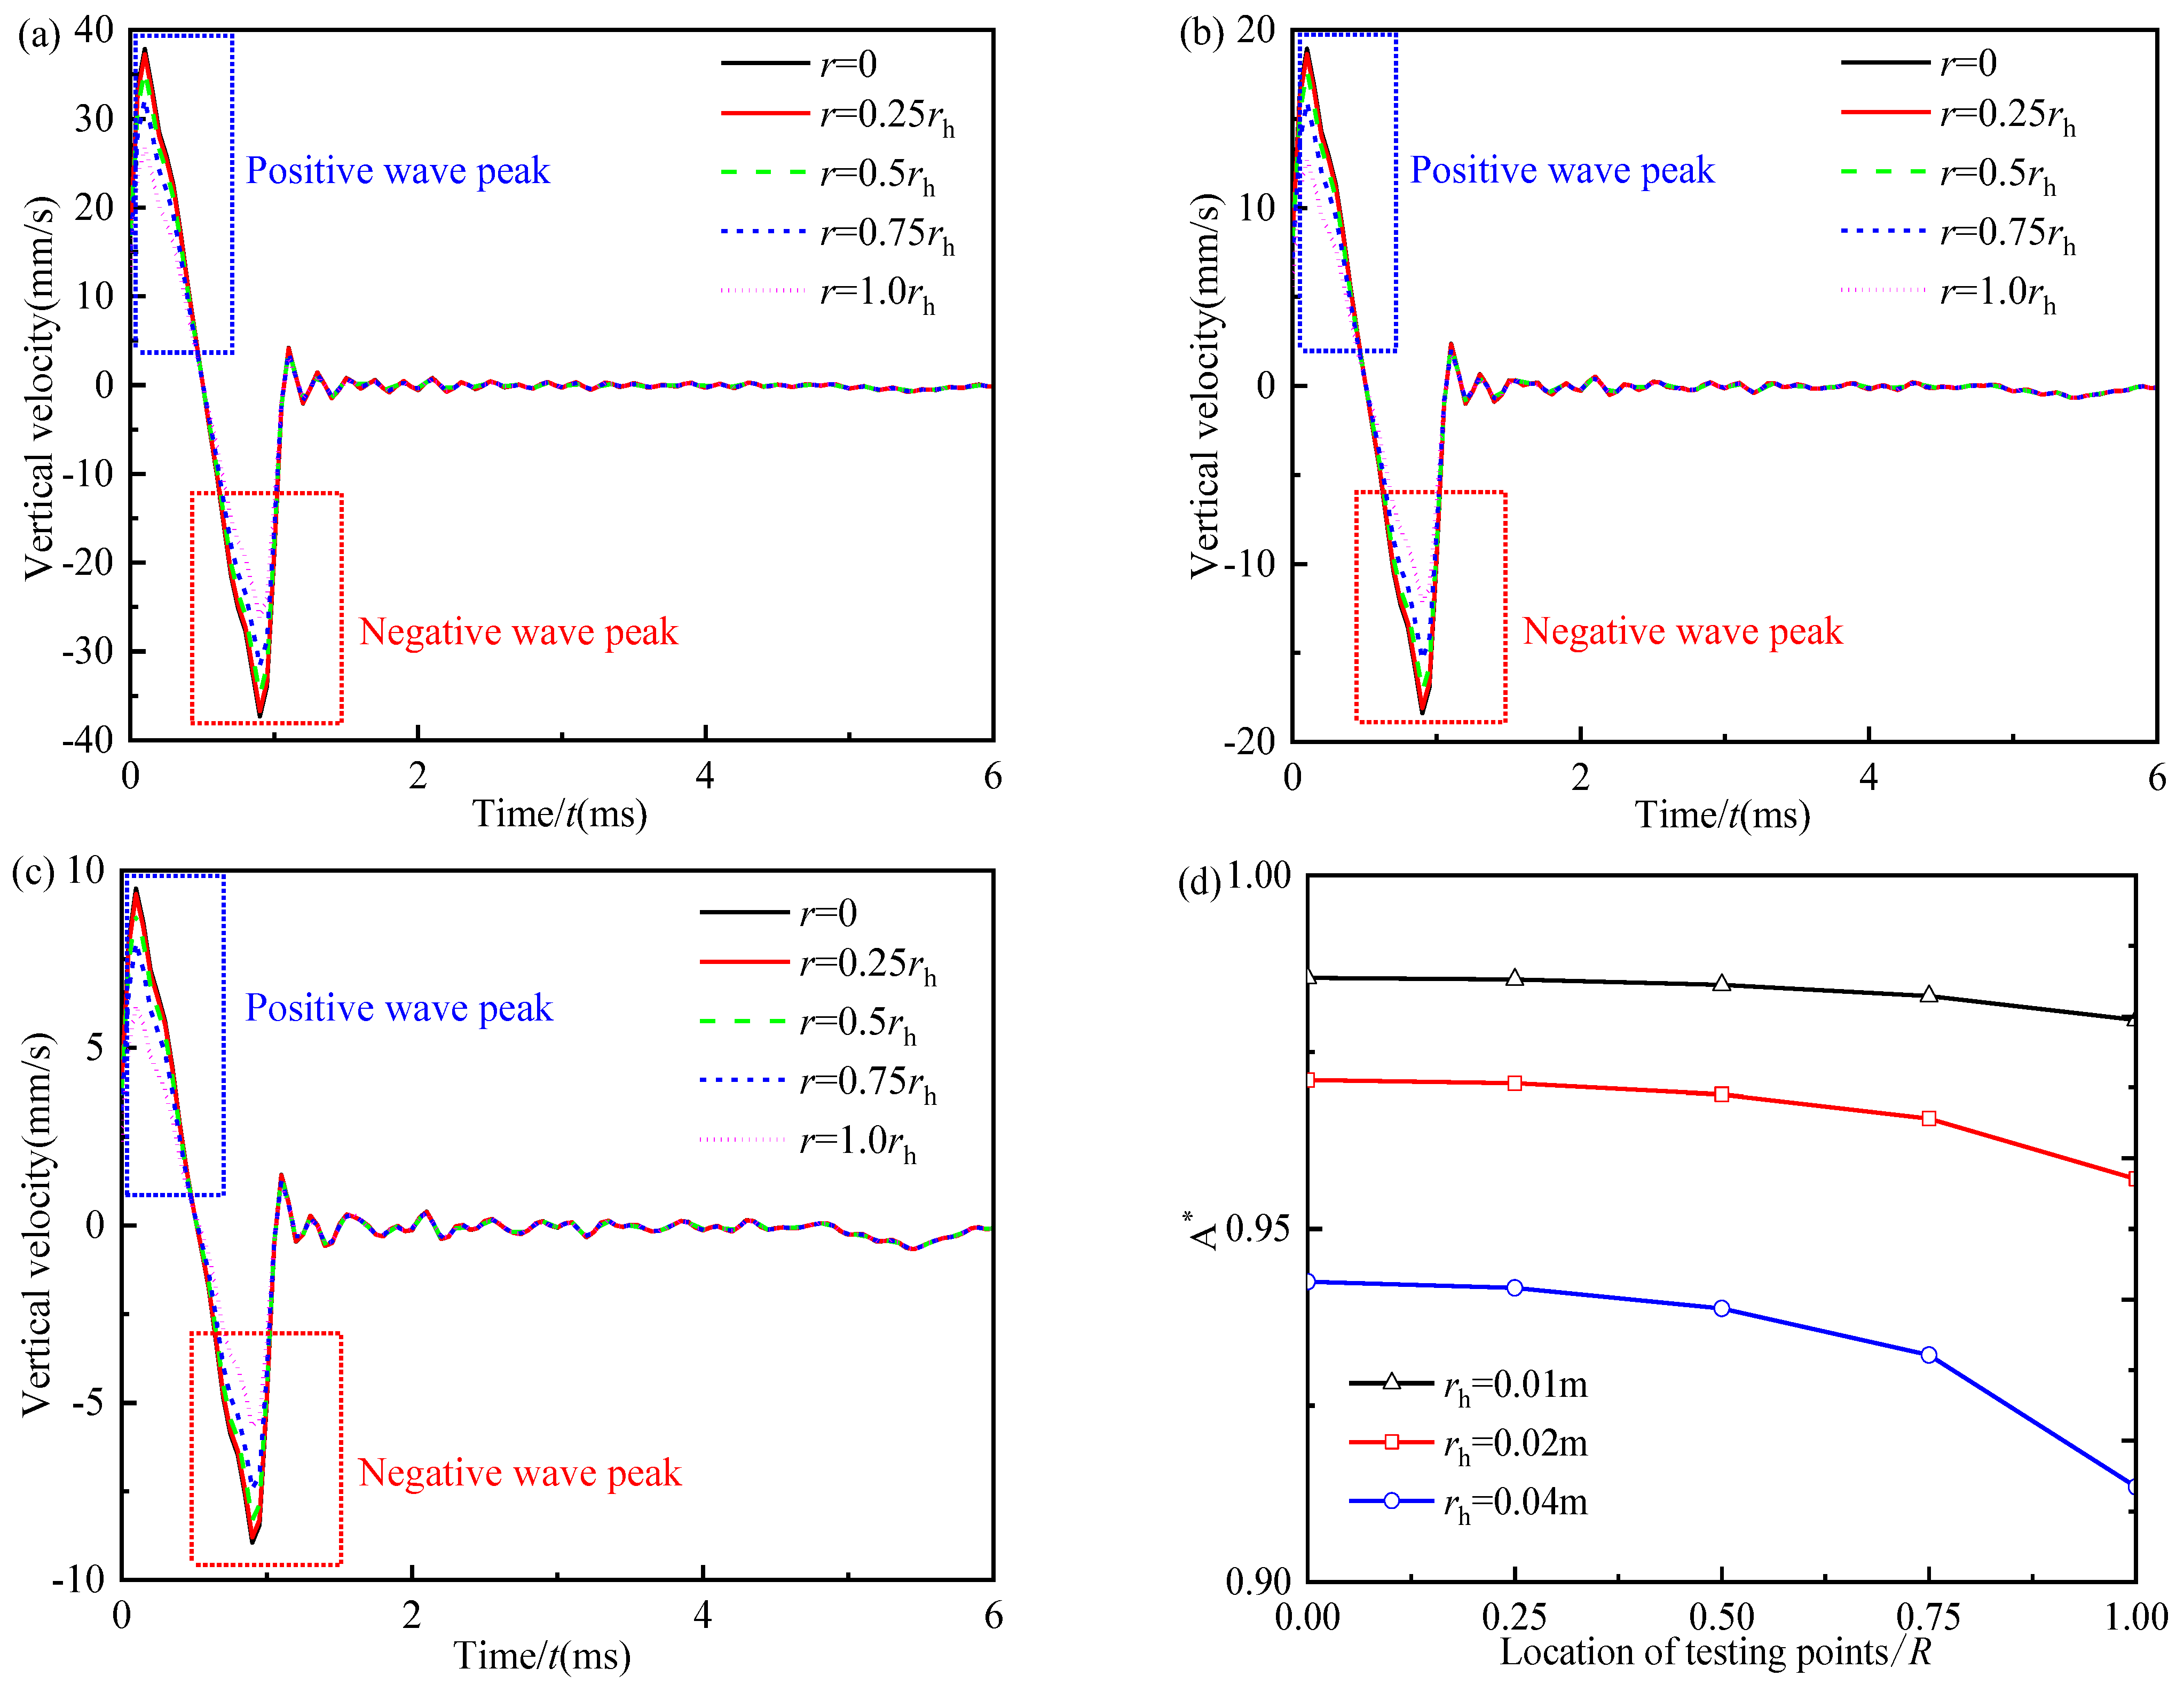
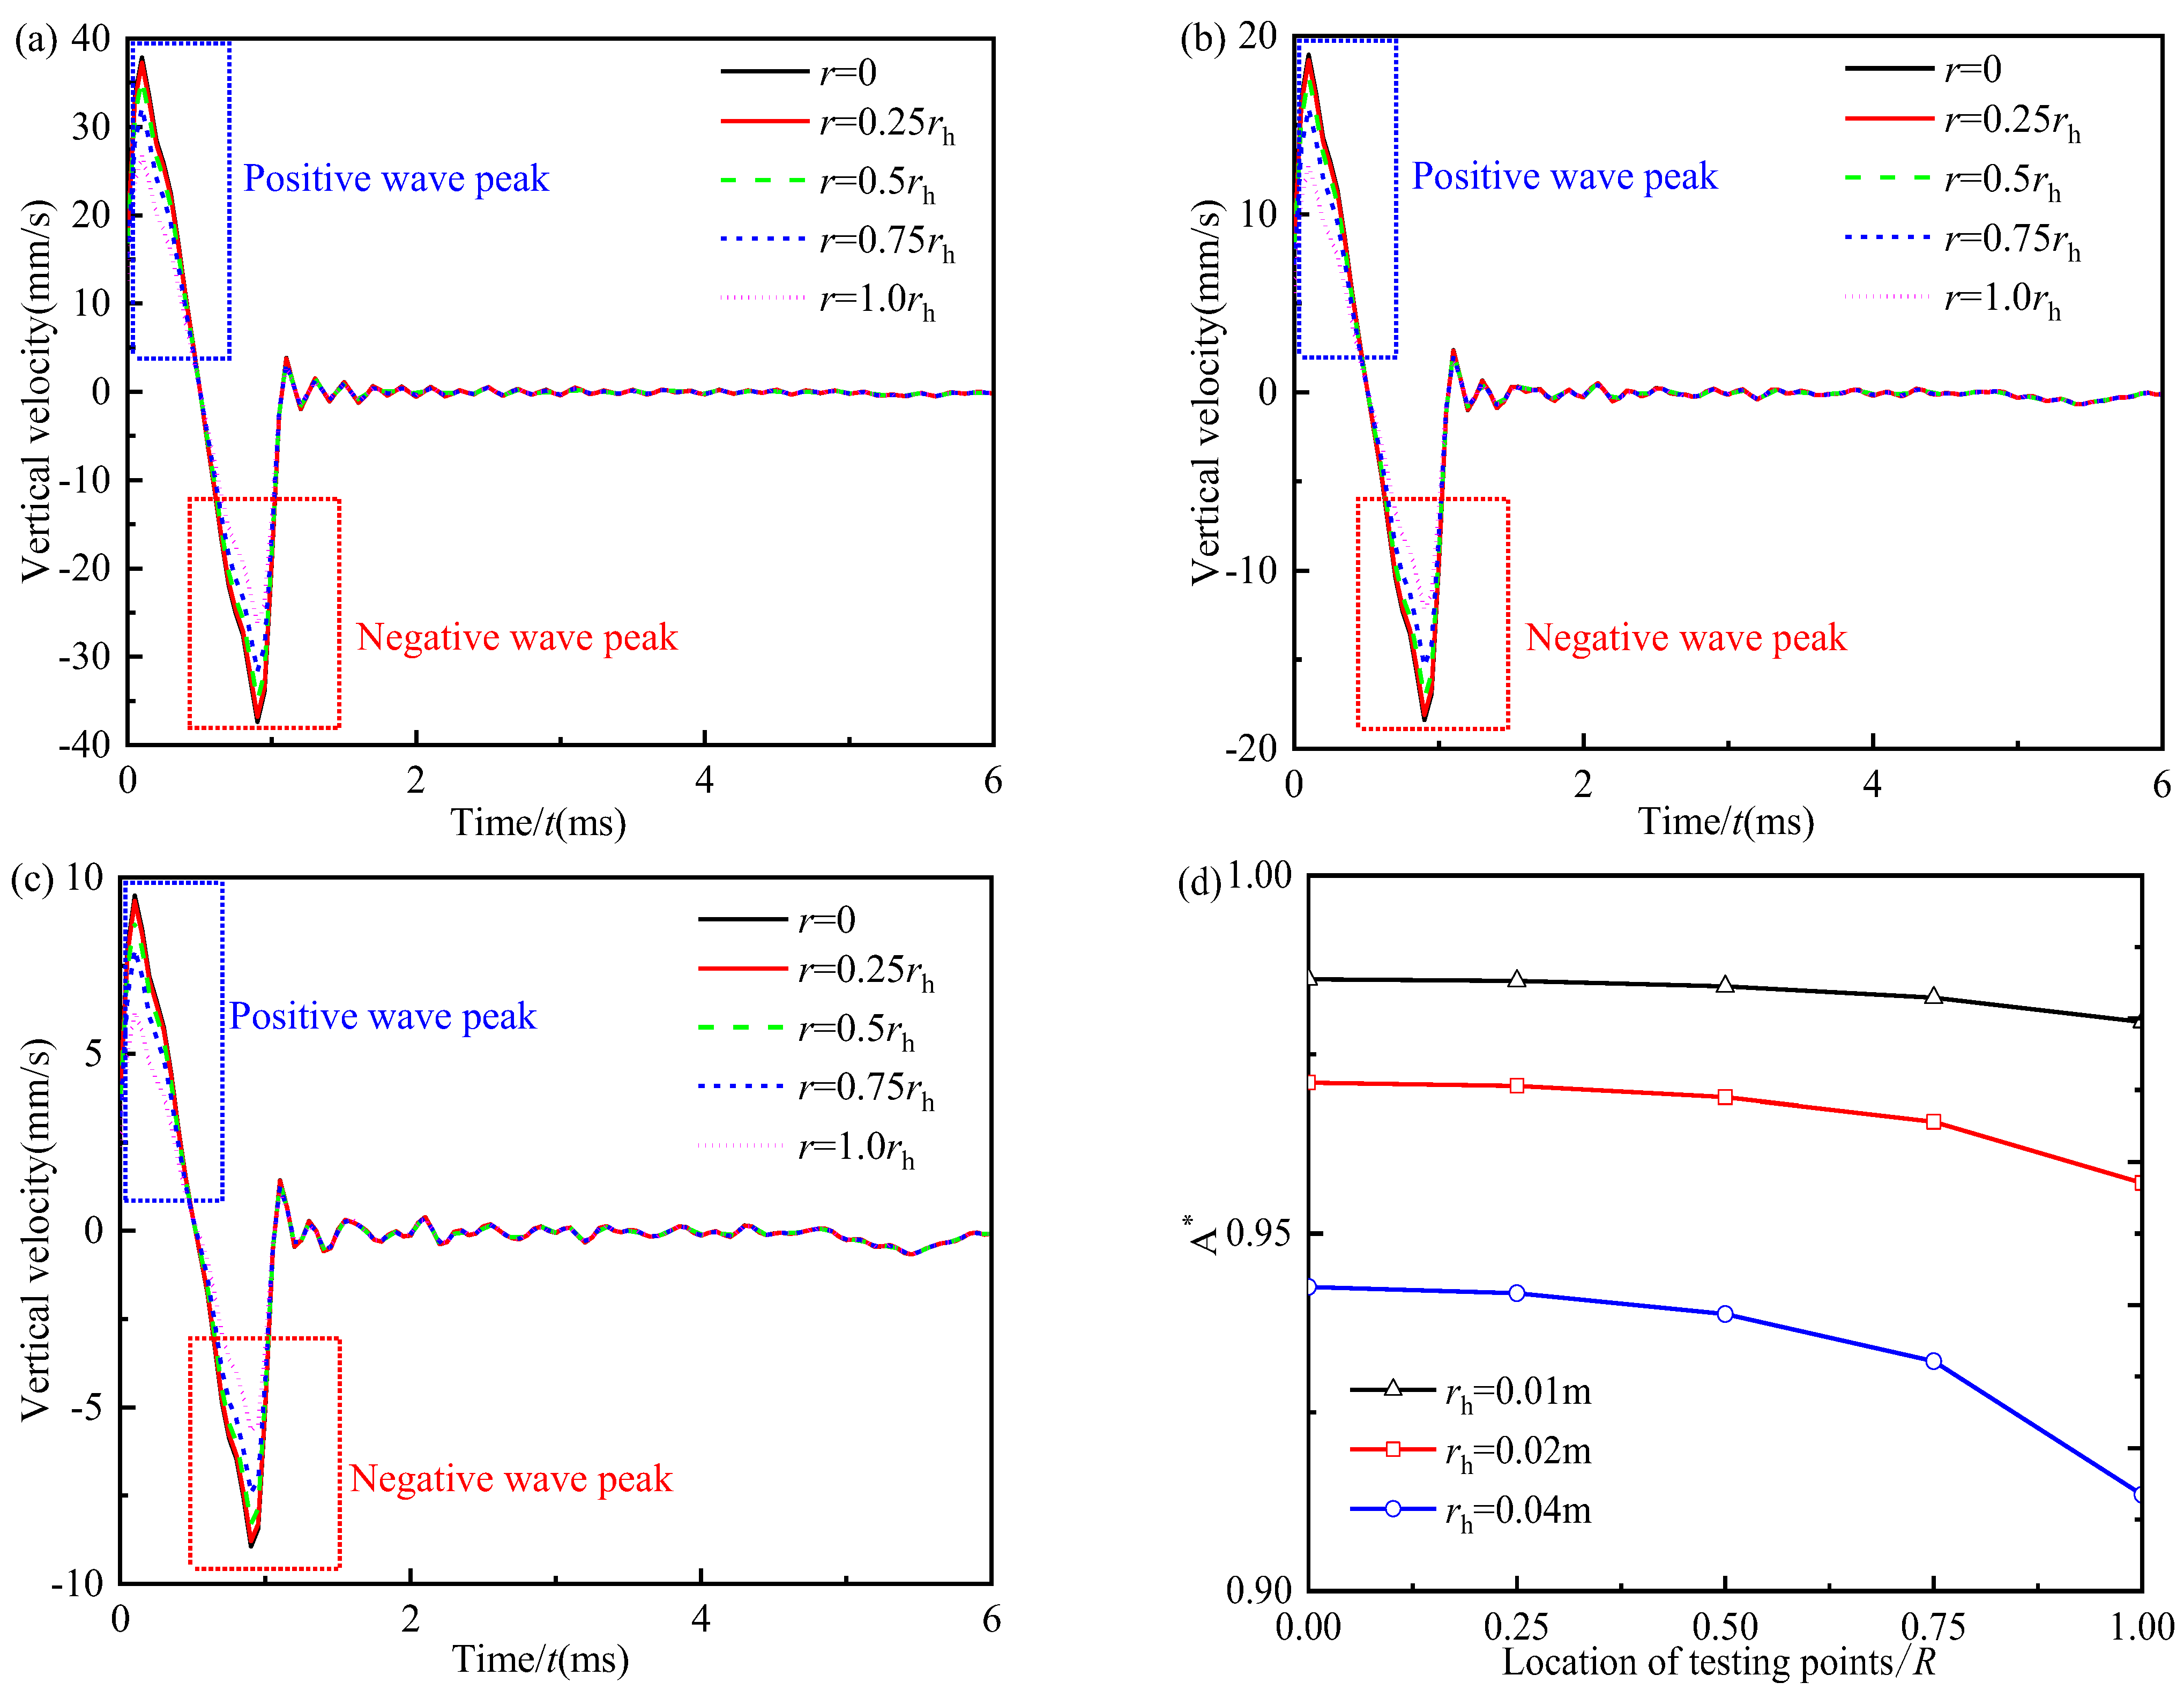
In this section, the influence of the 3D effect of the pile-soil system on the vertical dynamic response of the large-diameter pile top in the excitation region is investigated with different sizes of the excitation hammer. The radius of pile I is equal to the radius of the hammer and is set as rh = 0.01 m, 0.02 m, and 0.04 m. The location of the test point is set as r = 0, 0.25rh, 0.5rh, 0.75rh, and 1.0rh. Figure 5, Figure 6, Figure 7 and Figure 8 illustrate the vertical velocity response in the time domain of different test points within the excitation region for different pile radii. As shown in Figure 5, Figure 6, Figure 7 and Figure 8, the incident wave signal of different test points in the excitation region is composed of the positive wave signal and the evidently negative wave signal after the positive wave signal. In the FEM study of Chow et al. [26], the significantly negative wave signal after the positive wave signal was also observed at the edge of the excitation region, a result which was considered to be the influence of the 3D effect of the pile body on the vertical dynamic response of the pile top. This phenomenon proves again that the present solution in this paper is reasonable for evaluating the 3D effect of the pile-soil system.
In Figure 5, Figure 6, Figure 7 and Figure 8, as the test point gradually moves away from the pile center, only the peak values of the positive and negative wave signals decrease, and that decrement increases gradually. Meanwhile, the widths of both the positive and negative wave signals remain unchanged as the test point gradually moves away from the pile center. These phenomena show that in the low-strain integrity testing of the pile, the shape of the velocity curve in the time domain remains unchanged for different test points in the excitation region. Therefore, it is reasonable to assume pile I as a 1D rod in the research of the low-strain integrity testing of large-diameter piles, which makes the theoretical research results simpler and easier to apply to the engineering.
For a small diameter pile (R = 0.25 m), as can be seen from Figure 5a–c, with the increase in the radius of the excitation hammer, the width of the positive wave signal in the incident wave signal increases, while the width of the negative wave signal in the incident wave signal decreases. However, for large-diameter piles (R = 0.5 m, 0.75 m, and 1.0 m), as shown in Figure 6a–c, Figure 7a–c, and Figure 8a–c, with the increase in the radius of the excitation hammer, the widths of the positive and negative wave signals nearly remained unchanged. The above phenomena indicate that for a small diameter pile (R = 0.25 m), the smaller the hammer radius is, the more obvious the negative wave signal in the incident wave signal is. However, for large-diameter piles (R = 0.5 m, 0.75 m, and 1.0 m), that phenomenon is too small to be noticed.
For the convenience of the following analyses in this section, the ratio of the peak value of the negative wave signal to the peak value of the positive wave signal in the incident wave signal is defined as a negative-positive-ratio and is expressed by A*, i.e., A* = (Peak of the negative wave signal)/(Peak of the positive wave signal). As displayed in Figure 5d, Figure 6d, Figure 7d, and Figure 8d, A* reduces slightly as the test point moves away from the pile center. However, for rh = 0.04 m, A* sharply decreases when the test point is close to the edge of the excitation region. Meanwhile, comparing Figure 5d, Figure 6d, Figure 7d, and Figure 8d, it is noted that A* increases gradually with the decrease in the radius of the excitation hammer and the increase in the pile radius. The increase in A* indicates that the negative wave signal in the incident wave signal becomes more and more obvious. Thus, the above results prove that the larger radius of the pile and the smaller radius of the hammer lead to the more obvious negative wave signal in the incident wave signal.

5.1.2. At the Edge of the Excitation Region

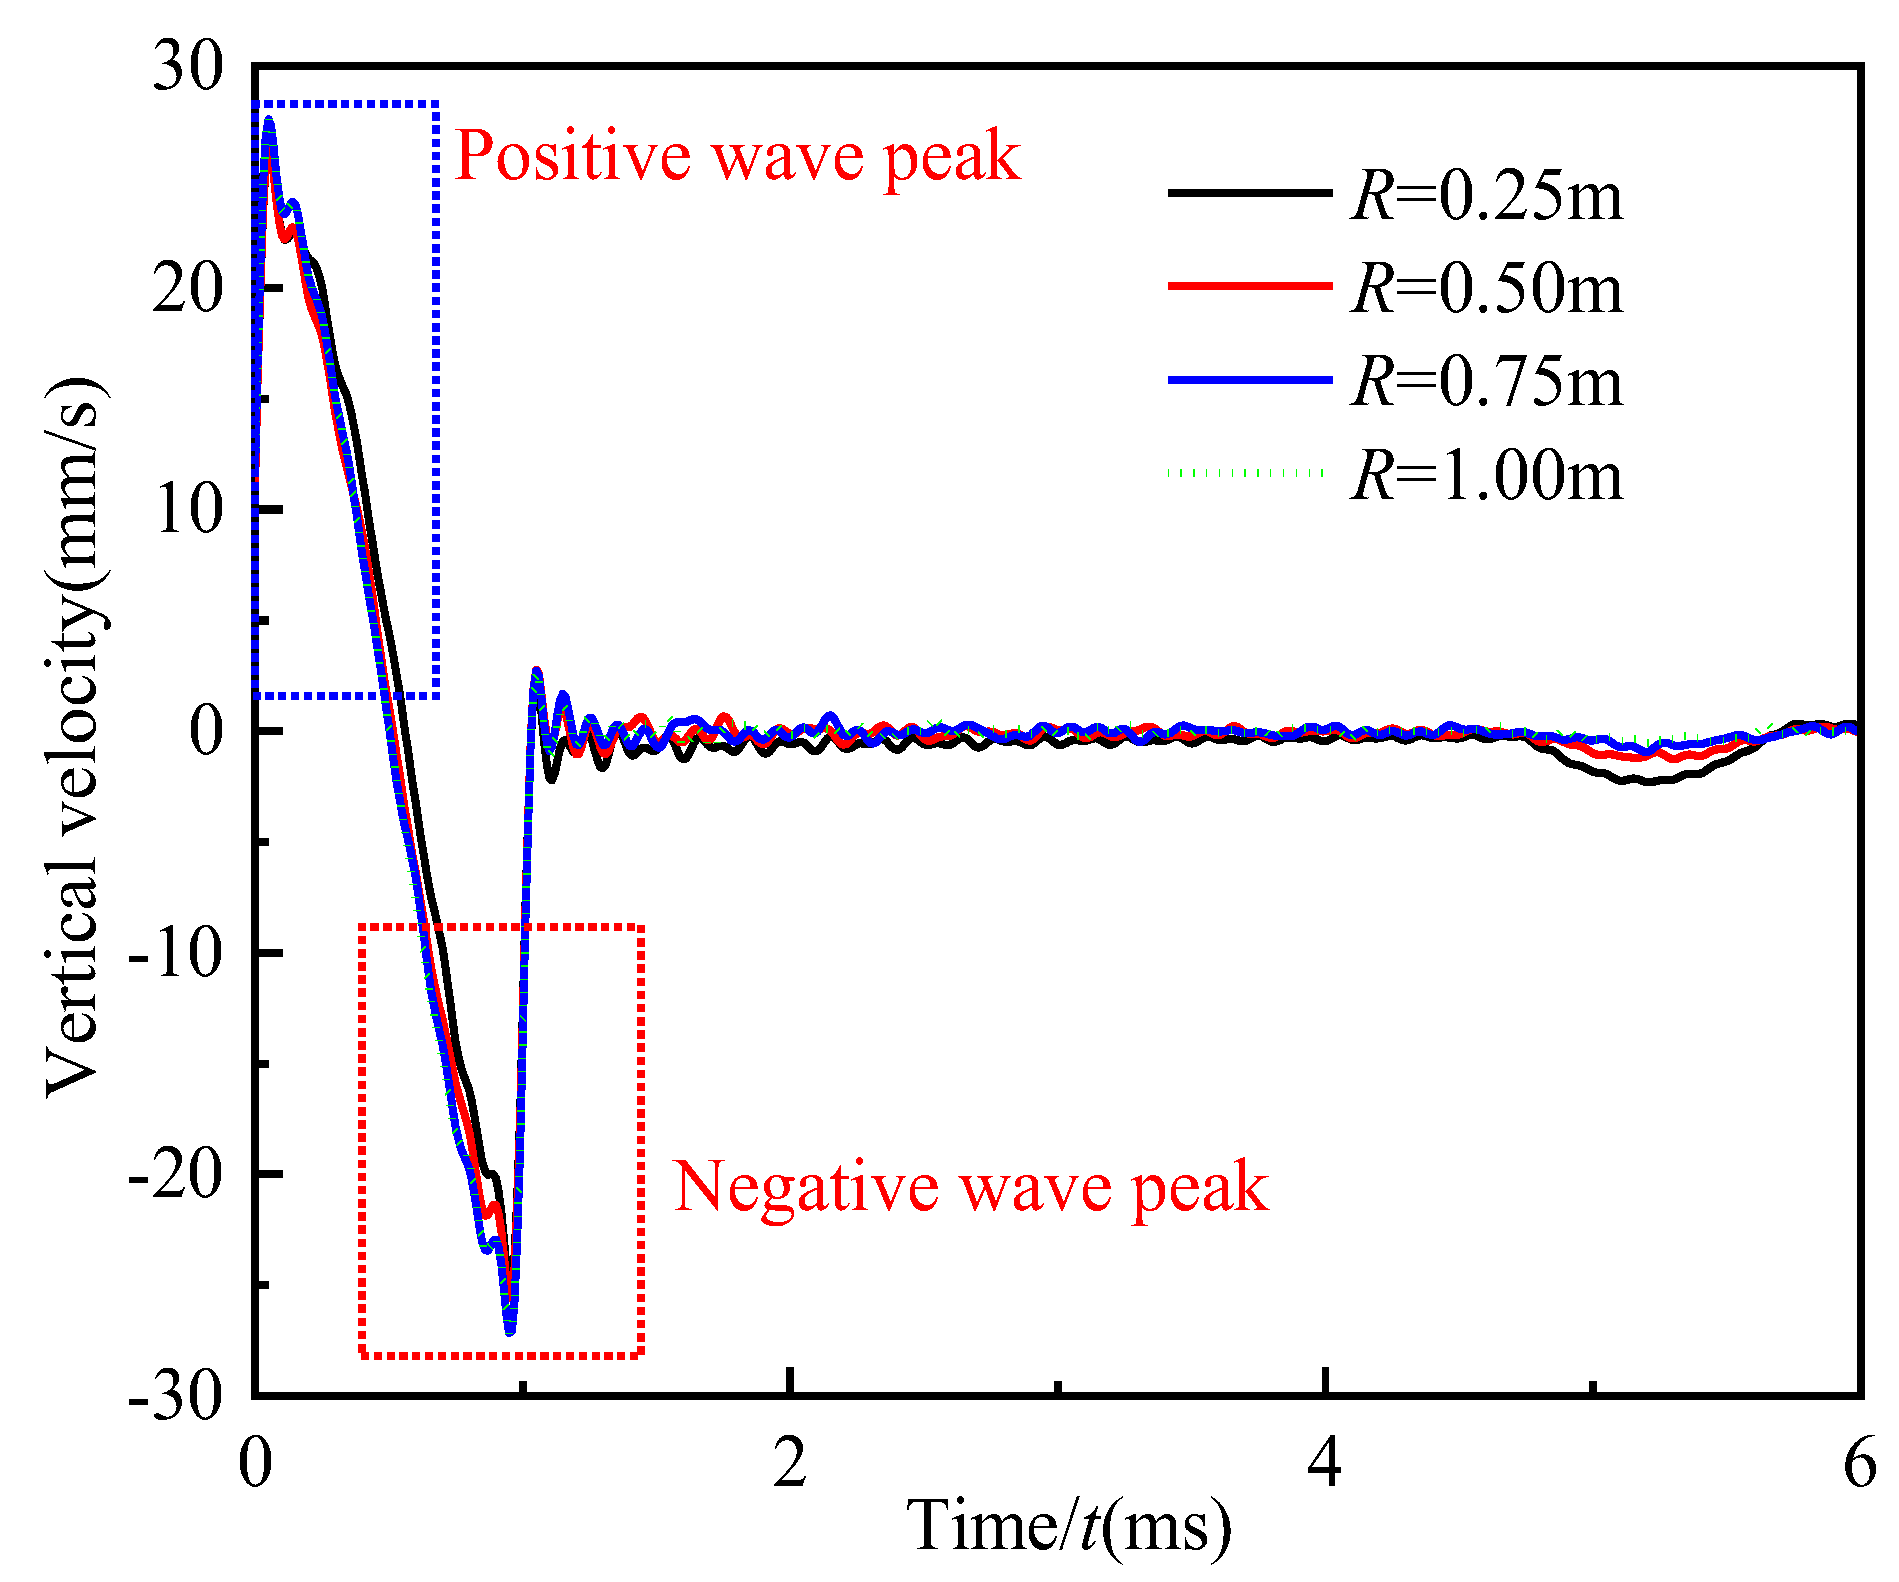
Figure 9 displays the vertical velocity time histories at the edge of the excitation region for different pile radii (R = 0.25 m, 0.5 m, 0.75 m, and 1.0 m). It is observed in Figure 9 that as the radius of the pile increases, the incident wave signal is almost unchanged; only the amplitude of the first reflected wave signal reduces visibly. This result indicates that the radius of the pile has little influence on the incident wave signal of the test point at the edge of the excitation region. Meanwhile, it can also be inferred that the negative wave signal after the positive wave signal in the time-domain velocity curve of the test point at the edge of the excitation region is not caused by the multi-reflections of the R-wave and S-wave on the pile top surface [25].

5.1.3. Outside the Excitation Region

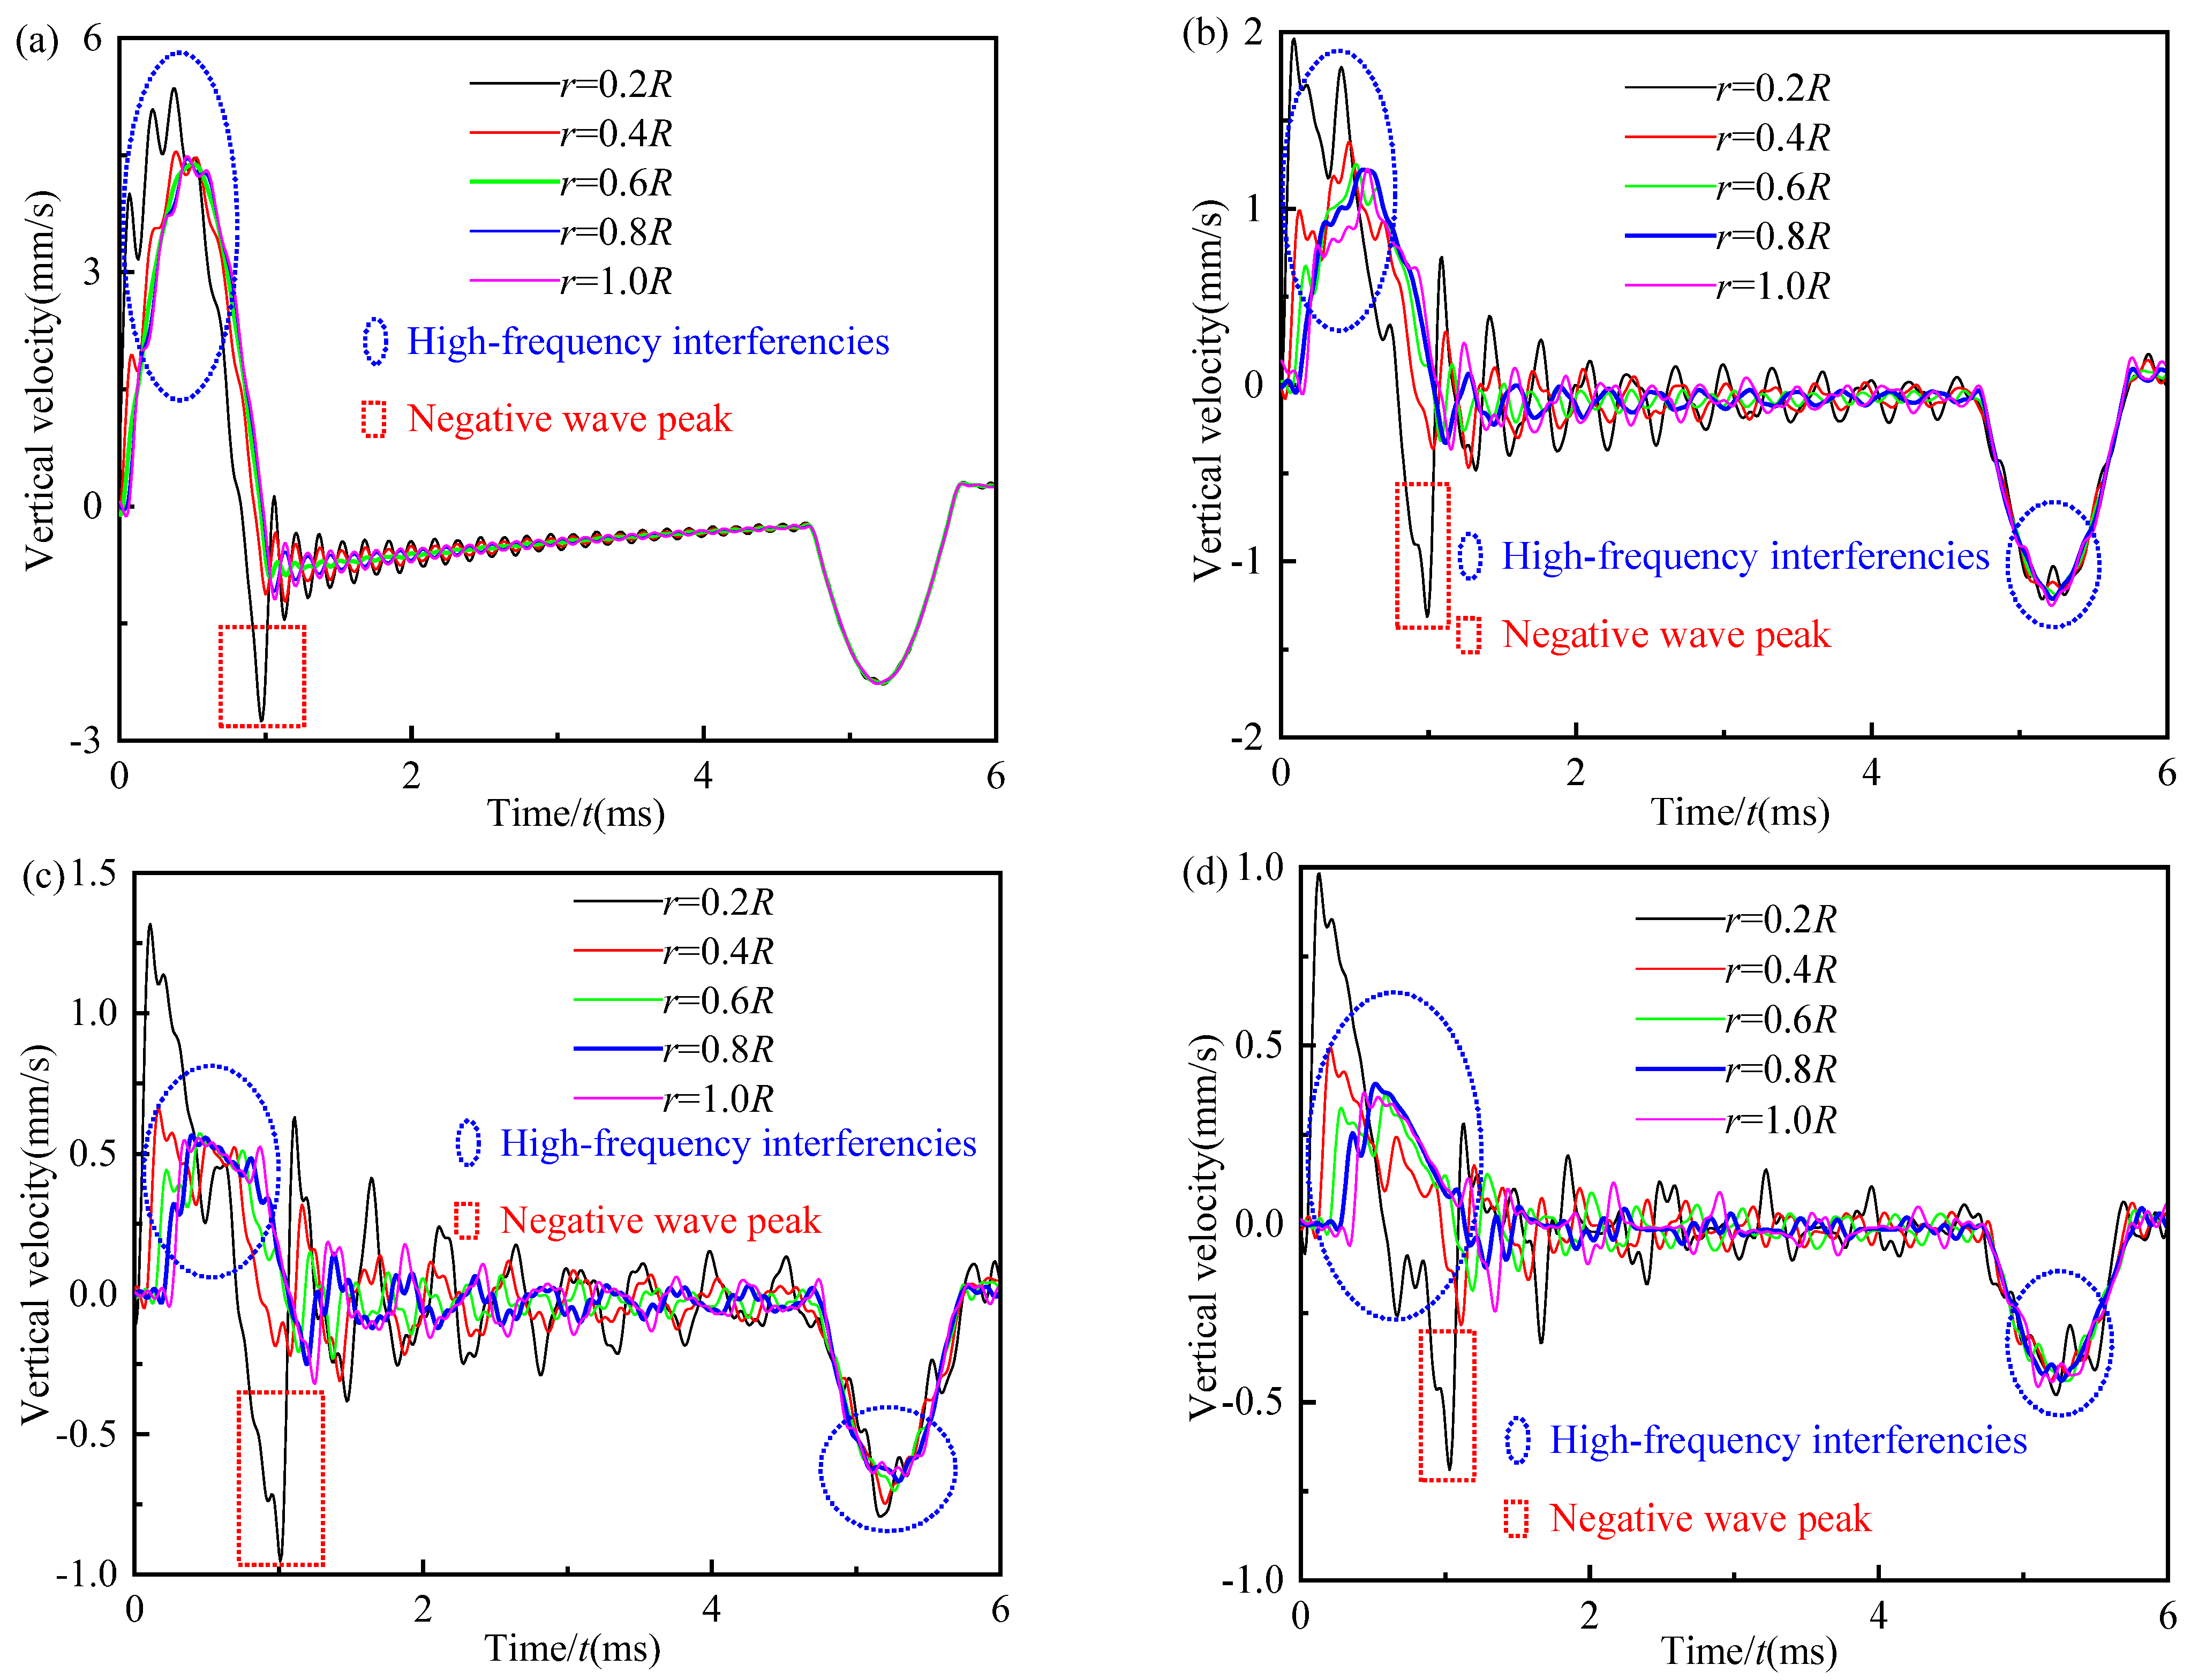
In this section, test points of the pile top are located at r = 0.2R, 0.4R, 0.6R, 0.8R, and 1.0R. As shown in Figure 10a–d, for different pile radii, when the test point is close to the excitation region (r = 0.2R), the influence of high-frequency interference on its velocity curve in the time domain is obvious and greater than that of other test points outside the excitation region. Due to the high-frequency interference, the incident wave signal is composed mainly of the positive wave signal and the obviously negative wave signal after the positive wave signal at r = 0.2R. Meanwhile, when r = 0.2R, the amplitudes of the positive and negative wave signals in the incident wave signal are also significantly greater than that of other test points outside the excitation region. The above phenomena indicate that the influence of the 3D effect of the pile-soil system is the most obvious when the test point is close to the excitation region. The existence of the negative wave signal makes the incident wave signal have no unique peak point, which will lead to the misjudgment of pile length in low-strain integrity testing.
For a small diameter pile with R = 0.25 m, as shown in Figure 10a, the incident wave signal is influenced by high-frequency interference, but the first reflected wave signal is smooth. As the test point moves away from the excitation region, the high-frequency interference has little effect on its velocity curves in the time domain at different test points; it is easy to pick up the peaks of the incident and first reflected wave signals for low-strain integrity testing. Obviously, the velocity curve in the time domain at r = 0.6R is the smoothest. For large-diameter piles with R = 0.5 m, 0.75 m, and 1.0 m, as depicted in Figure 10b–d, both the incident wave signal and the first reflected wave signal are affected by high-frequency interference. The influence of high-frequency interference on the first reflected wave signal increases as the radius of the pile increases. The high-frequency interference has a big influence on its velocity curves in the time domain at different test points; however, this influence is the least when r = 0.8R. These results indicate that the test point would be better set at 0.6R–0.8R in low-strain integrity testing of the pile.

5.2. The Mechanism of the Negative Wave Signal in the Incident Wave Signal during Low-Strain Integrity Testing

5.2.1. Influence of the Ratio of Pile Radius to the Radius of Hammer

Chow et al. [26] reported that the negative wave signal in the incident wave signal is caused by the 3D effect of the pile body. However, they did not present the specific cause of the negative wave signal in the incident wave signal. The purpose of this section is to analyze the specific cause of the negative wave signal. Based on the analyses of Section 5.1.1, the influence of the 3D effect of the pile-soil system in the excitation region is affected by the radius of the pile and the radius of the excitation hammer. Hence, first, the ratio of the pile radius to the radius of the exaction hammer is defined as the pile-hammer-ratio (r* = R/rh) to make the following analyses more convenient.
Figure 11a–d illustrate the influence of the pile-hammer-ratio on the velocity response in the time domain of the pile top at the edge of the excitation region for different pile radii with R = 0.25 m, 0.5 m, 0.75 m, and 1.0 m. The pile-hammer-ratio is set as r* = 20, 10, 5, 3, 2, and 1.5. As presented in Figure 11a–d, when the pile-hammer-ratio changes within a range of 20–3 in the velocity curves in the time domain of the pile top at the edge of the excitation region, the negative wave signal in the incident wave signal is obvious. Meanwhile, as the pile-hammer-ratio varies from 20 to 3, the amplitudes of both the positive and negative wave signals in the incident wave signal decrease rapidly, and the width of the negative wave signal also decreases gradually. When the pile-hammer-ratio is less than 3, that is, r* = 2 and 1.5, in the time-domain velocity curves of the pile top at the edge of the excitation region, the negative wave signal in the incident wave signal disappears completely. In these cases, the positive wave signal is the incident wave signal. These phenomena show that the larger pile-hammer-ratio leads to a significantly negative wave signal in the incident wave signal at the edge of the excitation region of the pile top. In this paper, there is a critical value for the pile-hammer-ratio, namely, r* = 3. When r* is greater than 3, as r* increases, the negative wave signal in the incident wave signal becomes more and more obvious. When r* is smaller than 3, there is no negative wave signal in the incident wave signal.
For a small diameter pile (R = 0.25 m), when r* is smaller than 3, as shown in Figure 11a, the velocity curves in the time domain are smooth, and the velocity curve in the time domain remains unchanged as r* decreases. These results indicate that the small diameter pile under a uniform excitation load can be regarded as a 1D rod in practical engineering. For large-diameter piles (R = 0.5 m, 0.75 m, and 1.0 m), when r* is smaller than 3, as exhibited in Figure 11b–d, there is no negative wave signal in the incident wave signal. However, there is still high-frequency interference between the incident wave signal and the first reflected wave signal, and the incident wave signal is affected by the high-frequency interference. These results indicate that the influence of the 3D effect of the pile-soil system still exists at the large-diameter pile top under the uniform excitation load; in this case, the large-diameter pile cannot be assumed to be a 1D rod.

5.2.2. From the Perspective of Wave Propagation

The research works of Chai et al. [34,35,36] reported that in low-strain integrity testing, when the test point was close to the excitation region, the sequence of the stress wave generated by the excitation force reaching the test point was the direct P-wave, S-wave, and R-wave. The R-wave has most of the excitation energy, followed by the S-wave, and P-wave has the least energy; hence, the direct R-wave plays a major role on the pile top surface. In this paper, the radial displacement of the pile is neglected; that is, the radial propagation of the P-wave with the minimum energy on the top surface of the pile is constrained. Therefore, the incident wave signal in the time-domain velocity curve of the test point in or near the excitation region is mainly caused by the direct S-wave and R-wave.
It Is obtained from Section 5.1 that the negative wave signal in the incident wave signal only appears in the time-domain velocity curves of the test points within and near the excitation region. Meanwhile, the peaks of the positive and negative wave signals in the incident wave signal of the test points of the pile top within and near the excitation region are far greater than those of the test points of the pile top far away from the excitation region.
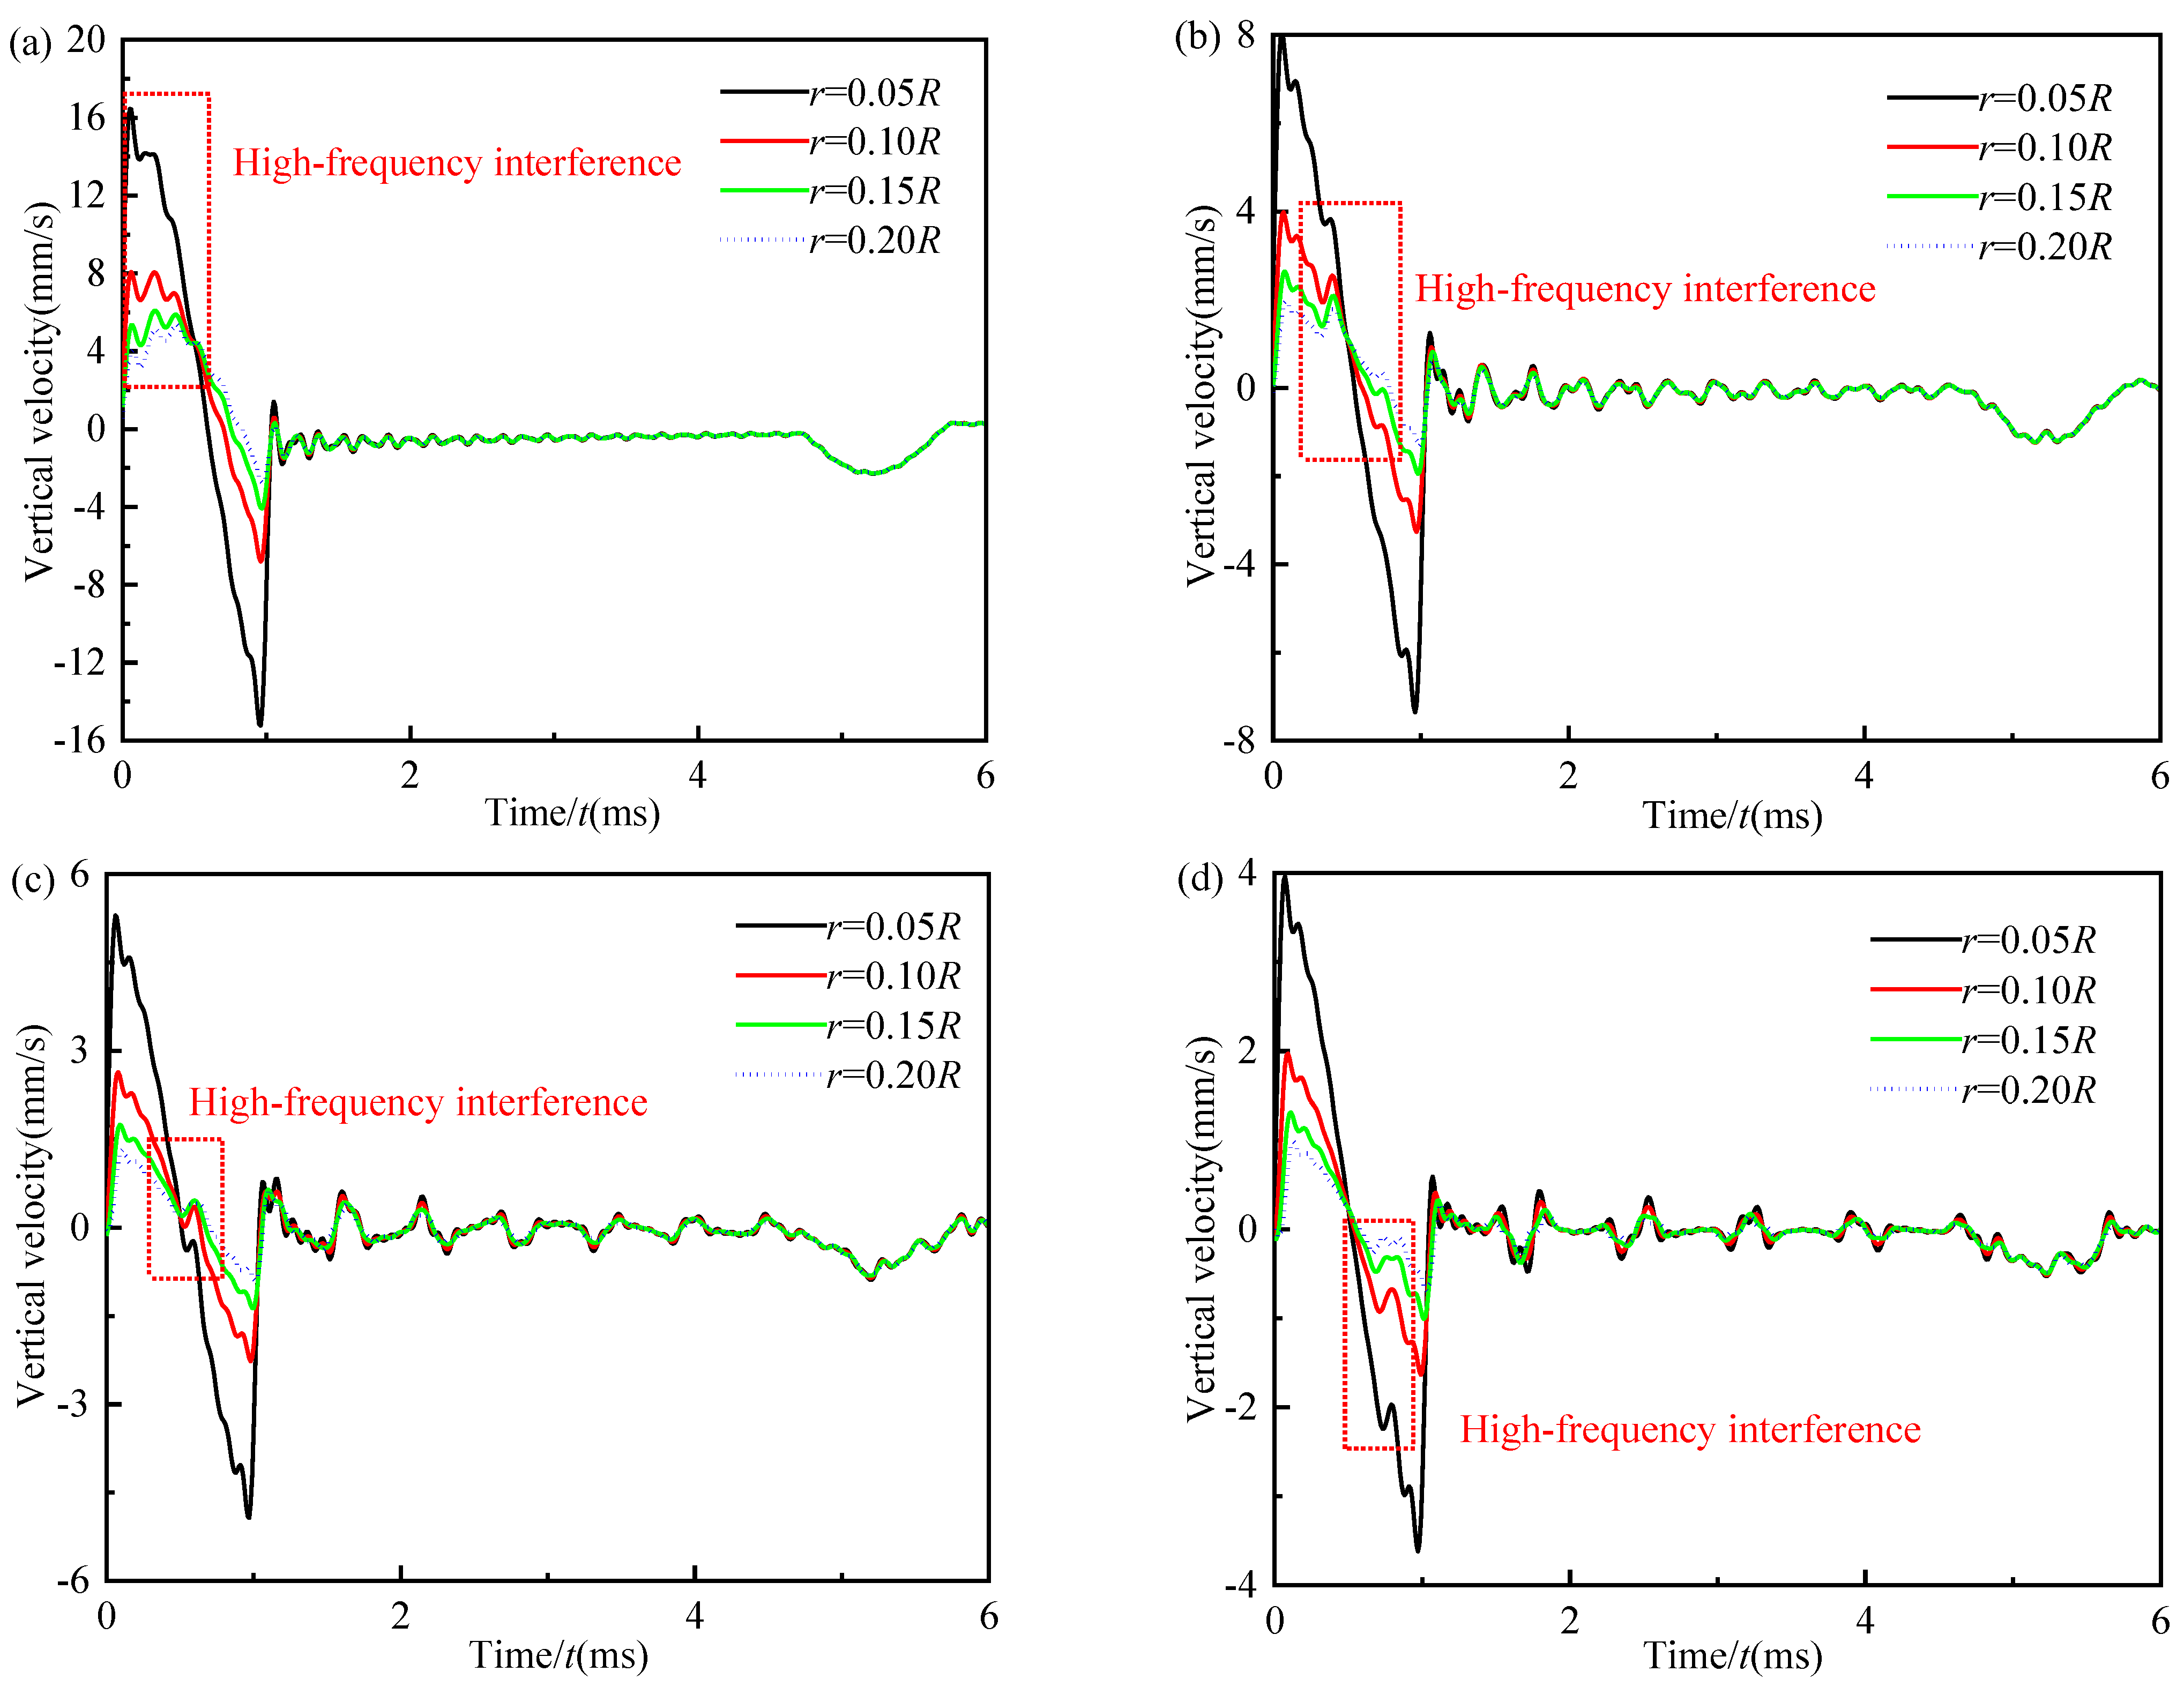
In order to further study the causes of the negative wave signal in the incident wave signal, the velocity response of the different test points near the excitation region is analyzed in detail, and the location of the test points is set as r = 0.05R, 0.1R, 0.15R, and 0.2R. Figure 12a–b exhibit the vertical velocity time histories of the test points near the excitation region on the pile top for different pile radii (R = 0.25 m, 0.5 m, 0.75 m, and 1.0 m). When the test point moves away from the excitation region, both the amplitudes of the positive and negative wave signals in the incident wave signal decrease, and that decrement reduces gradually. Meanwhile, as the distance between the test point and the center of the pile increases, the width of the positive wave signal in the incident wave signal increases, and the width of the negative wave signal in the incident wave signal decreases.
From the perspective of wave propagation, the results of Section 5.1 and this section can be explained as follows. In the excitation region, when the incident wave signal arrives, the direct S-wave and R-wave are not separated and are completely superimposed on each other [34]. Thus, at this point, the peaks of the positive and negative wave signals in the incident wave signal are mainly caused by the superposition of the direct R-wave and S-wave. When the test point is outside the excitation, as the test point gradually moves away from the excitation region due to the fact that the velocity of the S-wave is bigger than that of the R-wave, the incident wave signal arrives with the direct S-wave. The R-wave gradually separates, which indicates that the superimposed part of the S-wave and R-wave in the incident wave signal decreases gradually. Therefore, the peak of the positive wave signal in the incident wave signal gradually decreases, but its width gradually increases. Meanwhile, the width and amplitude of the negative wave signal in the incident wave signal reduce gradually. When the distance between the test point and the center of the pile reaches a certain value, the direct R-wave and S-wave are completely separated, and the incident wave signal is completely caused by the direct S-wave, and the negative wave signal in the incident wave signal disappears completely. Therefore, the peaks of the positive and negative wave signals in the incident wave signal of the test point of the pile top within and near the excitation region are much larger than those of the test points of the pile top far away from the excitation region. The above explanation also indicates that the negative wave signal in the incident wave signal of the test point inside and near the excitation region at the top of the pile is caused by the superposition of the direct R-wave on the direct S-wave, which can lead to the misjudgment of the peak arrival time of the incident wave signal. Therefore, in the low-strain integrity testing of the pile, the test point should be far away from the excitation region to avoid the generation of the negative wave signal in the incident wave signal.
It is also noted from Figure 12a–b that when the test point is near the excitation region within 0.2R, the incident wave signal is less affected by high-frequency interference. The high-frequency interference becomes more and more obvious as the test point moves away from the excitation region. Meanwhile, it is seen that the arrival time of the high-frequency interference gradually shifts back as the radius of the pile increases. When the pile diameter is small (R = 0.25 m and 0.5 m), the high-frequency interference leads to multiple fluctuation signals in the incident wave signal. When the pile diameter is large (R = 0.75 m and 1.0 m), the high-frequency interference leads to only one fluctuation signal in the incident wave signal. These phenomena may be due to the fact that in the range of 0.2R near the excitation region when the test point is close to the excitation region, it is far from the pile-soil interface, and the high-frequency interference in the incident wave signal is only caused by the interfacial reflection of the S-wave with a higher propagation speed. As the test point is gradually moved away from the excitation region, it is closer to the pile-soil interface, and the high-frequency interference in the incident wave signal is caused by the interfacial reflection of the S-wave and the R-wave. When the pile diameter is small (R = 0.25 m and 0.5 m), it takes less time for the stress wave to reflect back from the pile-soil interface, and the high-frequency interference in the incident wave signal may be caused by the multiple interfacial reflections of the S-wave and R-wave. When the pile radius is larger (R = 0.75 m and 1.0 m), the time required for the stress wave to reflect back from the pile-soil interface is longer, resulting in the delay of high-frequency interference. The high-frequency interference in the incident wave signal may be caused by the first interfacial reflection of the S-wave and R-wave.

5.2.3. The Vertical Velocity Response in Time Domain along the Depth of the Pile

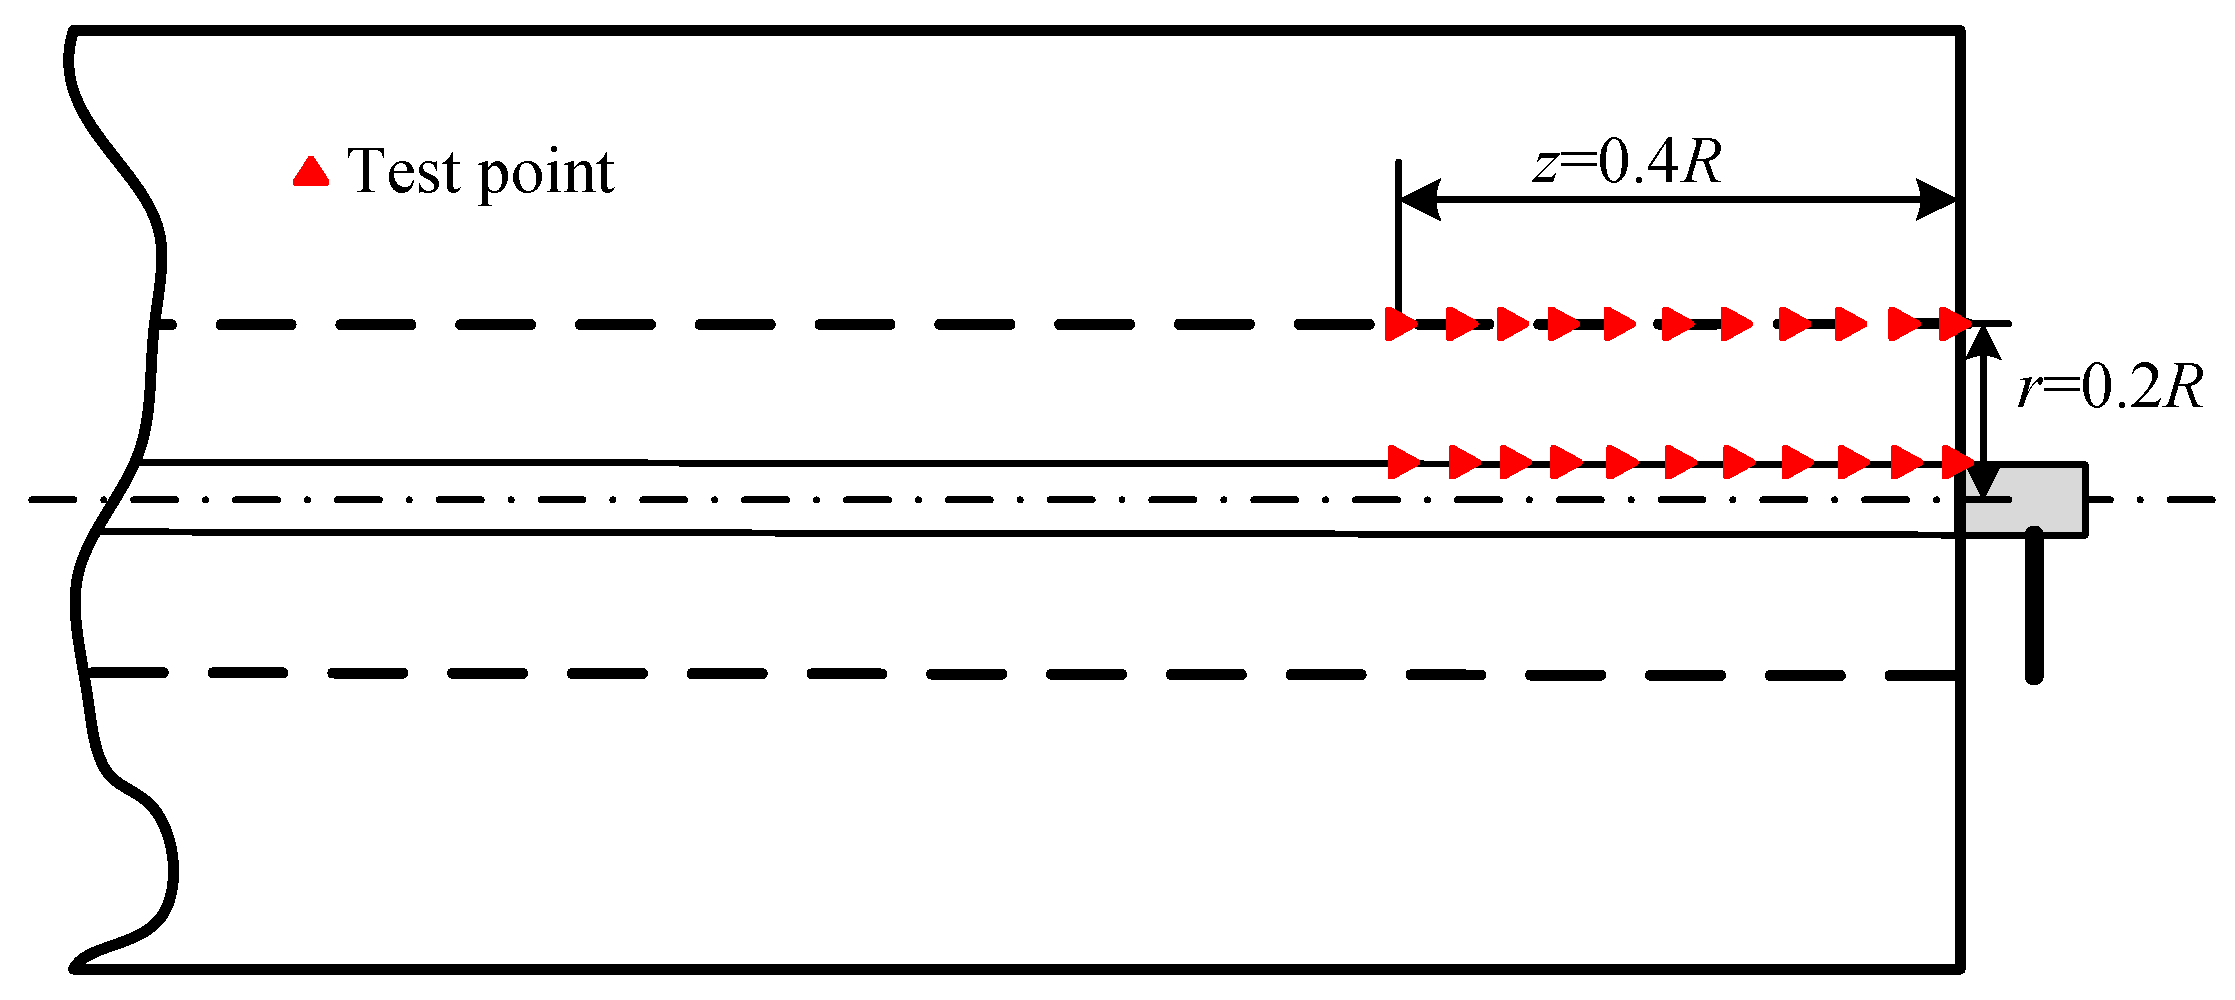
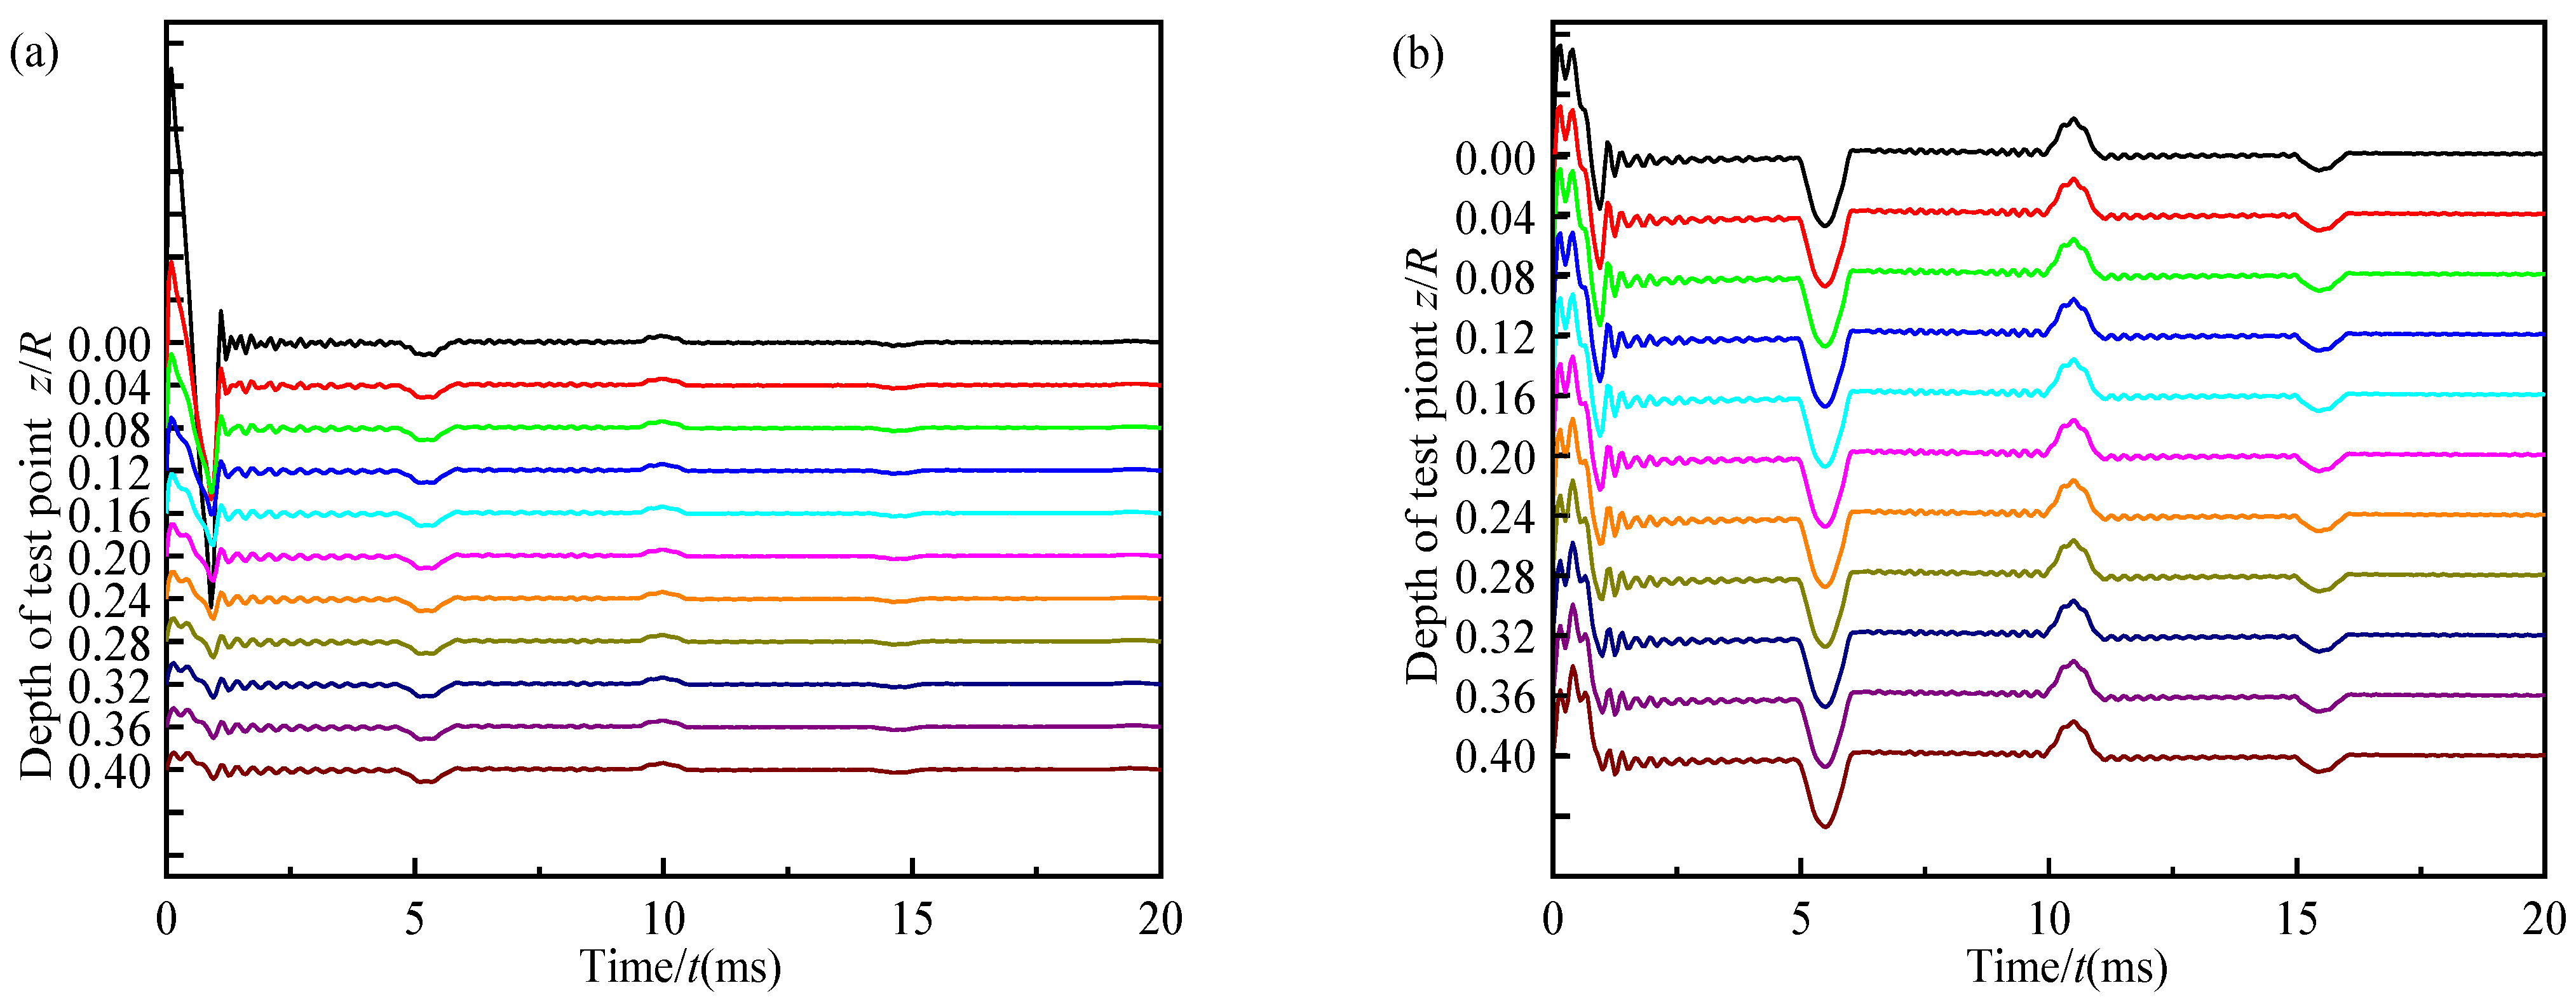
In order to further confirm that when the test point is inside and near the excitation region, the negative wave signal in the incident wave signal is caused by the superposition of the direct R-wave on the direct S-wave. In the following analysis, the vertical velocity response in the time domain along the depth of the pile is investigated, and the test points are selected, as shown in Figure 13. The depths of the selected points are set as z = 0, 0.04R, 0.08R, 0.12R, 0.16R, 0.2R, 0.24R, 0.28R, 0.32R, 0.36R, and 0.4R. The radius of the pile is set as R = 0.5 m. The test points on the pile top are located at r = rh and r = 0.2R.
Figure 14a shows the velocity curves in the time domain of different test points along the depth of the pile with r = rh. Figure 14b depicts the velocity curves in the time domain of different test points along the depth of the pile with r = 0.2R. From Figure 14a,b, the amplitude of the negative wave signal in the time-domain velocity curve of each test point gradually decreases with the increase of depth. However, the negative wave signal in the incident wave signal of each test point basically disappears when the depth reaches z = 0.24R, i.e., z = 0.12 m.
This phenomenon indicates that the negative wave signal in the incident wave signal will decay rapidly along the depth of the pile and disappear at z = 0.24R. This phenomenon is similar to the character of an R-wave decaying faster along the vertical propagation [37]. Therefore, it is verified that the negative wave signal in the incident wave signal of the test point inside and near the excitation region of the pile top is mainly caused by the superposition of the direct R-wave on the direct S-wave.

6. Conclusions

In the axisymmetric coordinate system, a new three-dimensional model of the pile-soil system is established, considering the vertical displacement to describe the 3D effect of the pile-soil system. Based on the present model, the influence of the 3D effect of the pile-soil system on the vertical dynamic response of large-diameter piles is studied, and the mechanism of the negative wave signal in the incident wave signal during low-strain integrity testing is explored. Some useful conclusions are summarized as follows:
  • The rationality of the present solution is verified by comparing it with the FEM results obtained using Abaqus software. Meanwhile, the reasonableness and advantages of the present solution in evaluating the 3D effect of the pile-soil system are verified by comparing it with the other existing solutions.
  • It is reasonable to assume pile I (impacting area) as a 1D rod in the research of the low-strain integrity testing of large-diameter piles.
  • In the time-domain velocity curves of different test points at the pile top along the radial direction, the negative wave signal in the incident wave signal only occurs at the test point inside and near the excitation region. Meanwhile, the negative wave signal at the edge of the excitation region is almost unaffected by the variation in the radius of the general engineering pile.
  • During the low-strain integrity testing, the test point should be located near 0.6R–0.8R, which can reduce the high-frequency interference of the large-diameter pile top.
  • In the time-domain velocity curves of the test points inside and near the excitation region, the negative wave signal in the incident wave signal is influenced by the pile-hammer-ratio and is caused by the larger pile-hammer-ratio. There is a critical value of the pile-hammer-ratio: when the pile-hammer-ratio is smaller than 3, that negative wave signal will totally vanish.
  • From the perspective of wave propagation, in the time-domain velocity curves of the test points inside and near the excitation region, the negative wave signal in the incident wave signal is caused by the superposition of the direct R-wave on the direct S-wave. It is suggested to filter the R wave signal in the detection signal to eliminate the negative wave peak by adding a device to filter the R wave signal.

Author Contributions

Conceptualization, W.G. and W.W.; methodology, W.G. and Z.W.; software, W.G. and M.Z.; validation, W.G. and M.Z.; formal analysis, W.G. and X.G.; investigation, W.G., C.J.L. and X.G.; resources, W.G. and W.W.; data curation, W.G.; writing—original draft preparation, W.G., G.J. and W.W.; writing—review and editing, W.G., C.J.L. and E.A.; visualization, W.G., S.C. and W.L.; supervision, G.J., C.J.L. and W.W.; project administration, Z.W., G.J. and W.L.; funding acquisition, G.J., Z.W. and W.W. All authors have read and agreed to the published version of the manuscript.

Funding

This research is supported by the Outstanding Youth Project of the Natural Science Foundation of Zhejiang Province (Grant No. LR21E080005), the National Natural Science Foundation of China (Grant Nos. 52178371, 51878634). The Fundamental Research Funds for the National University, China University of Geosciences (Wuhan) (Grant Nos. CUGGC09), the Exploring Youth Project of Zhejiang Natural Science Foundation (Grant No. LQ22E080010), the Science and Technology Project of Zhejiang Provincial Communication Department (Grant No. 202305-2), and the Construction Research Founds of Department of Housing and Urban-Rural Development of Zhejiang Province (Grant No. 2021K256) are also acknowledged.

Data Availability Statement

All the data used in this research can be easily accessible by downloading the various documents appropriately cited in the paper.

Conflicts of Interest

The authors declare no conflict of interest.

References

  1. Wu, W.B.; Liu, H.; Yang, X.Y.; Jiang, G.S.; El Naggar, M.H.; Mei, G.X.; Liang, R.Z. New method to calculate apparent phase velocity of open-ended pipe pile. Can. Geotech. J. 2020, 57, 127–138. [Google Scholar] [CrossRef]
  2. Yang, X.Y.; Wang, L.X.; Wu, W.B.; Liu, H.; Jiang, G.S.; Wang, K.H.; Mei, G.X. Vertical dynamic impedance of a viscoelastic pile in arbitrarily layered soil based on the fictitious soil pile model. Energies 2022, 15, 2087. [Google Scholar] [CrossRef]
  3. Zhang, Y.P.; Jiang, G.S.; Wu, W.B.; El Naggar, M.H.; Liu, H.; Wen, M.J.; Wang, K.H. Analytical solution for distributed torsional low strain integrity test for pipe pile. Int. J. Numer. Anal. Meth. Geomech. 2022, 46, 47–67. [Google Scholar] [CrossRef]
  4. Song, Y.; Zhang, M.J.; Øiseth, O.; Rønnquist, A. Wind deflection analysis of railway catenary under crosswind based on nonlinear finite element model and wind tunnel test. Mech. Mach. Theory 2022, 168, 104608. [Google Scholar] [CrossRef]
  5. Yang, X.Y.; Jiang, G.S.; Liu, H.; Wu, W.B.; Mei, G.X.; Yang, Z.J. Horizontal vibration characteristics of a tapered pile in arbitrarily layered soil. Energies 2022, 15, 3193. [Google Scholar] [CrossRef]
  6. Yang, Z.J.; Wu, W.B.; Liu, H.; Zhang, Y.P.; Liang, R.Z. Flexible support of a pile embedded in unsaturated soil under Rayleigh waves. Earthq. Eng. Struct. Dyn. 2022, 52, 226–247. [Google Scholar] [CrossRef]
  7. Wu, J.T.; El Naggar, M.H.; Wang, K.H.; Wu, W.B. Lateral vibration characteristics of an extended pile shaft under low-strain integrity test. Soil Dyn. Earthq. Eng. 2019, 126, 105812. [Google Scholar] [CrossRef]
  8. Meng, K.; Cui, C.Y.; Liang, Z.M.; Li, H.J.; Pei, H.F. A new approach for longitudinal vibration of a large-diameter floating pipe pile in visco-elastic soil considering the three-dimensional wave effects. Comput. Geotech. 2020, 128, 103840. [Google Scholar] [CrossRef]
  9. Wu, W.B.; Wang, Z.Q.; Zhang, Y.P.; El Naggar, M.H.; Wu, T.; Wen, M.J. Semi-analytical solution for negative skin friction development on deep foundations in coastal reclamation areas. Int. J. Mech. Sci. 2022, 241, 107981. [Google Scholar] [CrossRef]
  10. Liu, H.; Li, J.X.; Yang, X.Y.; Chen, L.B.; Wu, W.B.; Wen, M.J.; Jiang, M.J.; Guo, C.J. Lateral dynamic response of offshore pipe piles considering effect of superstructure. Energies 2022, 15, 6759. [Google Scholar] [CrossRef]
  11. Zhang, J.; Yuan, G.K.; Zhu, S.Y.; Gu, Q.; Ke, S.T.; Lin, J.H. Seismic analysis of 10 MW offshore wind turbine with large-diameter monopile in consideration of seabed liquefaction. Energies 2022, 15, 2539. [Google Scholar] [CrossRef]
  12. Chen, L.B.; Li, J.X.; Wu, W.B.; Liu, H.; Yao, Y.; Zhang, P. New method to calculate the kinematic response of offshore pipe piles under seismic S-waves. Soil Dyn. Earthq. Eng. 2023, 165, 107651. [Google Scholar] [CrossRef]
  13. Zhang, Y.P.; El Naggar, M.H.; Wu, W.B.; Wang, Z.Q.; Yang, X.Y.; Jiang, G.S. Dynamic torsional impedance of large-diameter pipe pile for offshore engineering: 3D analytical solution. Appl. Math. Model. 2022, 111, 664–680. [Google Scholar] [CrossRef]
  14. Cui, C.Y.; Meng, K.; Xu, C.S.; Wang, B.L.; Xin, Y. Vertical vibration of a floating pile considering the incomplete bonding effect of the pile-soil interface. Comput. Geotech. 2022, 150, 104894. [Google Scholar] [CrossRef]
  15. Pasqual, R.P.S.; Kormann, A.C.M. Low strain integrity tests in piles –1-D and 3-D numerical modeling and comparisons with results obtained in the field. Multi-Sci. J. 2020, 2, 1–8. [Google Scholar] [CrossRef] [Green Version]
  16. Ding, W.; Chai, H.Y.; Liu, S.H.; Chen, C.; Nie, T.; Hu, Z. Analysis of influence of source and pile-soil interaction in low strain pile integrity testing. J. Civil Environ. Eng. 2020, 42, 73–79. [Google Scholar]
  17. Smith, E.A.L. Pile driving analysis by the wave equation. J. Soil Mech. Found. Div. 1960, 86, 35–64. [Google Scholar] [CrossRef]
  18. Ni, S.H.; Lehmann, L.; Charng, J.J.; Lo, K.F. Low-strain integrity testing of drilled piles with high slenderness ratio. Comput. Geotech. 2006, 33, 283–293. [Google Scholar] [CrossRef]
  19. Wang, K.H.; Wu, W.B.; Zhang, Z.Q.; Leo, C.J. Vertical dynamic response of an inhomogeneous viscoelastic pile. Comput. Geotech. 2010, 37, 536–544. [Google Scholar] [CrossRef]
  20. Wang, X.F.; Chen, P.; Huang, Y.H.; Gan, Y. Analysis of 3D effect of dynamic test along pile tip. Chin. J. Rock Mech. Eng. 2007, 26, 3209–3214. [Google Scholar]
  21. Steinbach, J.; Vey, E. Caisson evaluation by stress wave propagation method. J. Geotech. Geoenviron. Eng. Div. 1975, 101, 361–368. [Google Scholar] [CrossRef]
  22. Wu, W.B.; Wang, K.H.; Zhang, Z.Q.; Leo, C.J. Soil-pile interaction in the pile vertical vibration considering true three-dimensional wave effect of soil. Int. J. Num. Anal. Meth. Geomech. 2013, 37, 2860–2876. [Google Scholar] [CrossRef]
  23. Zhang, Y.P.; Wang, Z.Q.; El Naggar, M.H.; Wu, W.B.; Wang, L.X.; Jiang, G.S. Three-dimensional wave propagation in a solid pile during torsional low strain integrity test. Int. J. Num. Anal. Meth. Geomech. 2022, 46, 2398–2411. [Google Scholar] [CrossRef]
  24. Fukuhara, T.; Kakurai, M.; Sugimoto, M. Analytical evaluation of defective piles. In Application of Stress-Wave Theory to Piles; Barends, Frans, B.J., Eds.; Routledge: London, UK, 1992; pp. 563–569. [Google Scholar]
  25. Chen, F.; Wang, R.J. Dimension effect on low strain integrity testing of piles. Chin. J. Geotech. Eng. 1998, 20, 92–96. [Google Scholar]
  26. Chow, Y.K.; Phoon, K.K.; Chow, W.F.; Wong, K.Y. Low strain integrity testing of piles: Three-dimensional effects. J. Geotech. Geoenviron. Eng. 2003, 129, 1057–1062. [Google Scholar] [CrossRef]
  27. Li, L.C.; Liu, X.; Liu, H.; Wu, W.B.; Lehane, B.M.; Jiang, G.S.; Xu, M.J. Experimental and numerical study on the static lateral performance of monopile and hybrid pile foundation. Ocean Eng. 2022, 255, 111461. [Google Scholar] [CrossRef]
  28. Wu, W.B.; Yang, Z.J.; Liu, X.; Zhang, Y.P.; Liu, H.; El Naggar, M.H.; Xu, M.J.; Mei, G.X. Horizontal dynamic response of pile in unsaturated soil considering its construction disturbance effect. Ocean Eng. 2022, 245, 110483. [Google Scholar] [CrossRef]
  29. Zheng, C.J.; Kouretzis, G.P.; Ding, X.M.; Liu, H.L.; Poulos, H.G. Three-dimensional effects in low-strain integrity testing of piles: Analytical solution. Can. Geotech. J. 2016, 53, 225–235. [Google Scholar] [CrossRef] [Green Version]
  30. Zheng, C.J.; Liu, H.L.; Ding, X.M.; Kouretzis, G.P.; Sloan, S.W.; Poulos, H.G. Non-axisymmetric response of piles in low-strain integrity testing. Geotechnique 2017, 67, 181–186. [Google Scholar] [CrossRef]
  31. Zheng, C.J.; Ding, X.M.; Kouretzis, G.P.; Liu, H.L.; Sun, Y. Three-dimensional propagation of waves in piles during low-strain integrity tests. Geotechnique 2018, 68, 358–363. [Google Scholar] [CrossRef]
  32. Liu, X.; El Naggar, M.H.; Wang, K.H.; Wu, J.T. Three-dimensional axisymmetric analysis of pile vertical vibration. J. Sound Vib. 2021, 494, 115881. [Google Scholar] [CrossRef]
  33. Zhang, Y.P.; Di, T.Y.; El Naggar, M.H.; Wu, W.B.; Liu, H.; Jiang, G.S. Modified Rayleigh-Love rod model for 3D dynamic analysis of large-diameter thin-walled pipe pile embedded in multilayered soils. Comput. Geotech. 2022, 149, 104853. [Google Scholar] [CrossRef]
  34. Chai, H.Y.; Liu, M.G.; Li, Q.; Chen, X.Y. Propagation of stress waves in a plate-pile system: Experimental studies. Rock Soil Mechan. 2002, 23, 459–464. [Google Scholar]
  35. Chai, H.Y.; Liu, M.G.; Bai, S.W.; Li, Q. Numerical analysis of wave propagation in platform-pile system. Chin. J. Geotech. Eng. 2003, 25, 624–628. [Google Scholar]
  36. Chai, H.Y.; Phoon, K.K.; Zhang, D.J. Effects of the Source on Wave Propagation in Pile Integrity Testing. J. Geotech. Geoenviron. Eng. 2010, 136, 1200–1208. [Google Scholar] [CrossRef]
  37. Chai, H.Y.; Li, Q.; Liu, M.G.; He, H.J. Analysis of wave propagation on pile top. In Proceedings of the Second National Geotechnical and Engineering Academic Conference, Wuhan, China, 28 October–November 2006. [Google Scholar]
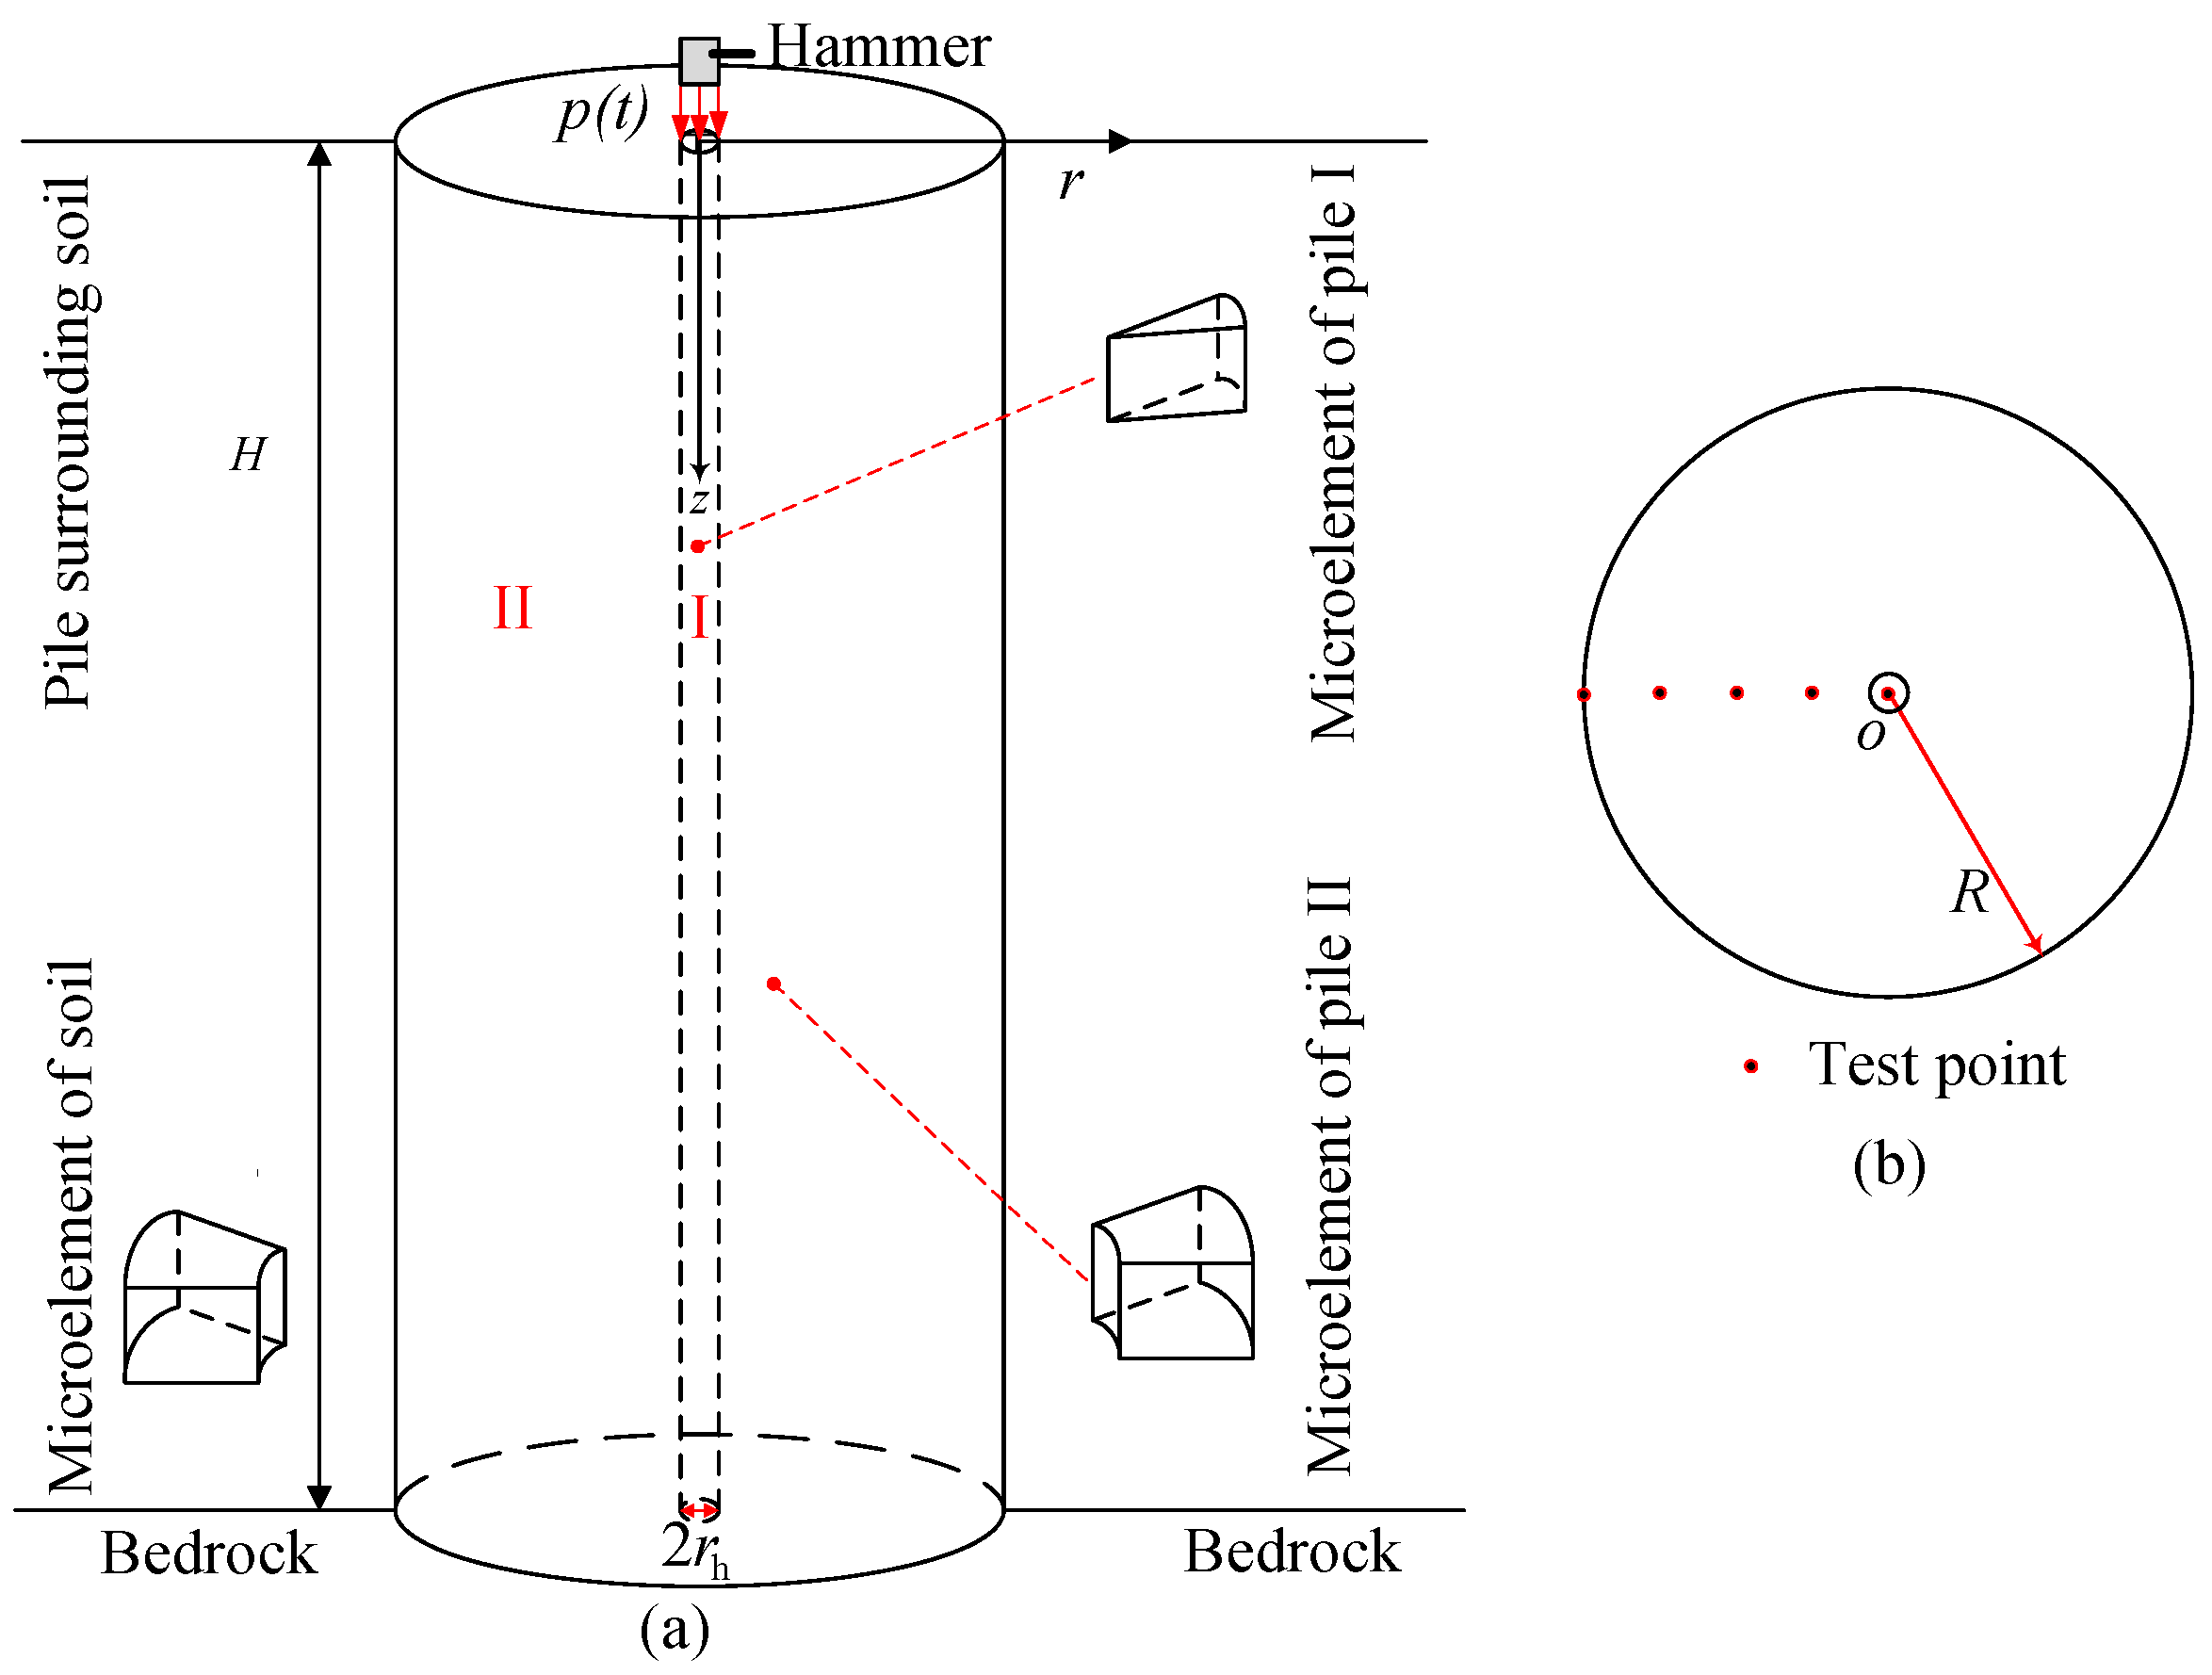
Figure 1. Computational model of the hammer-pile-soil system: (a) Three-dimensional model; (b) Top view of the pile.
Energies 15 09548 g001
Figure 2. Finite element model of the pile-soil system.
Energies 15 09548 g002
Figure 3. Comparison of the present solution and Abaqus solution at different testing points along the radius of the large-diameter pile top: (a) r = rh; (b) r = 0.2R; (c) r = 0.5R; (d) r = 0.7R; (e) r = 1.0R.
Energies 15 09548 g003
Figure 4. Comparison of the present solution and the solution of Zheng et al. [29] at different testing points along the radius of the large-diameter pile top: (a) r = 0.2R; (b) r = 0.4R; (c) r = 0.6R; (d) r = 0.8R; (e) r = 1.0R.
Energies 15 09548 g004
Figure 5. Velocity response in time domain of different test points along the radial direction within the excitation region for pile with R = 0.25 m: (a) rh = 0.01 m; (b) rh = 0.02 m; (c) rh = 0.04 m; (d) Variation of the negative-positive-ratio.
Energies 15 09548 g005
Figure 6. Velocity response in time domain of different test points along the radial direction within the excitation region for pile with R = 0.5 m: (a) rh = 0.01 m; (b) rh = 0.02 m; (c) rh = 0.04 m; (d) Variation of the negative-positive-ratio.
Energies 15 09548 g006aEnergies 15 09548 g006b
Figure 7. Velocity response in time domain of different test points along the radial direction within the excitation region for pile with R = 0.75 m: (a) rh = 0.01 m; (b) rh = 0.02 m; (c) rh = 0.04 m; (d) Variation of the negative-positive-ratio.
Energies 15 09548 g007
Figure 8. Velocity response in time domain of different test points along the radial direction within the excitation region for pile with R = 1.0 m: (a) rh = 0.01 m; (b) rh = 0.02 m; (c) rh = 0.04 m; (d) Variation of the negative-positive-ratio.
Energies 15 09548 g008
Figure 9. Vertical velocity time histories at the edge of the excitation region for different pile radii.
Energies 15 09548 g009
Figure 10. Vertical velocity time histories of the different test points at pile top along the radial direction outside the excitation region: (a) R = 0.25 m; (b) R = 0.5 m; (c) R = 0.75 m; (d) R = 1.0 m.
Energies 15 09548 g010
Figure 11. Vertical velocity time histories at the edge of the excitation region with different pile-hammer-ratios: (a) R = 0.25 m; (b) R = 0.5 m; (c) R = 0.75 m; (d) R = 1.0 m.
Energies 15 09548 g011
Figure 12. Vertical velocity time histories of different test points near the excitation region on the pile top: (a) R = 0.25 m; (b) R = 0.5 m; (c) R = 0.75 m; (d) R = 1.0 m.
Energies 15 09548 g012
Figure 13. Location of the test points in the vertical direction.
Energies 15 09548 g013
Figure 14. Vertical velocity time domain curves at different test points along the depth of pile: (a) r = rh; (b) r = 0.2R.
Energies 15 09548 g014
Table 1. The parameters of the pile-soil system in this paper.
Pile (I, II) G i p (GPa) ρ i p (kg/m3) υ p H (m)
4025000.210
Surrounding soilEs (Mpa) ρ s (kg/m3) υ s
5418000.35
Table 2. The parameters of the pile-soil system of Zheng et al. [29].
Pile (I, II) G i p (GPa) ρ i p (kg/m3) υ p H (m)
2525000.1510
Surrounding soilEs (MPa) ρ s (kg/m3) υ s
618000.35
Publisher’s Note: MDPI stays neutral with regard to jurisdictional claims in published maps and institutional affiliations.