
Experimental Study on the Optimal-Based Vibration Control of a Wind Turbine Tower Using a Small-Scale Electric Drive with MR Damper Support


Abstract
1. Introduction
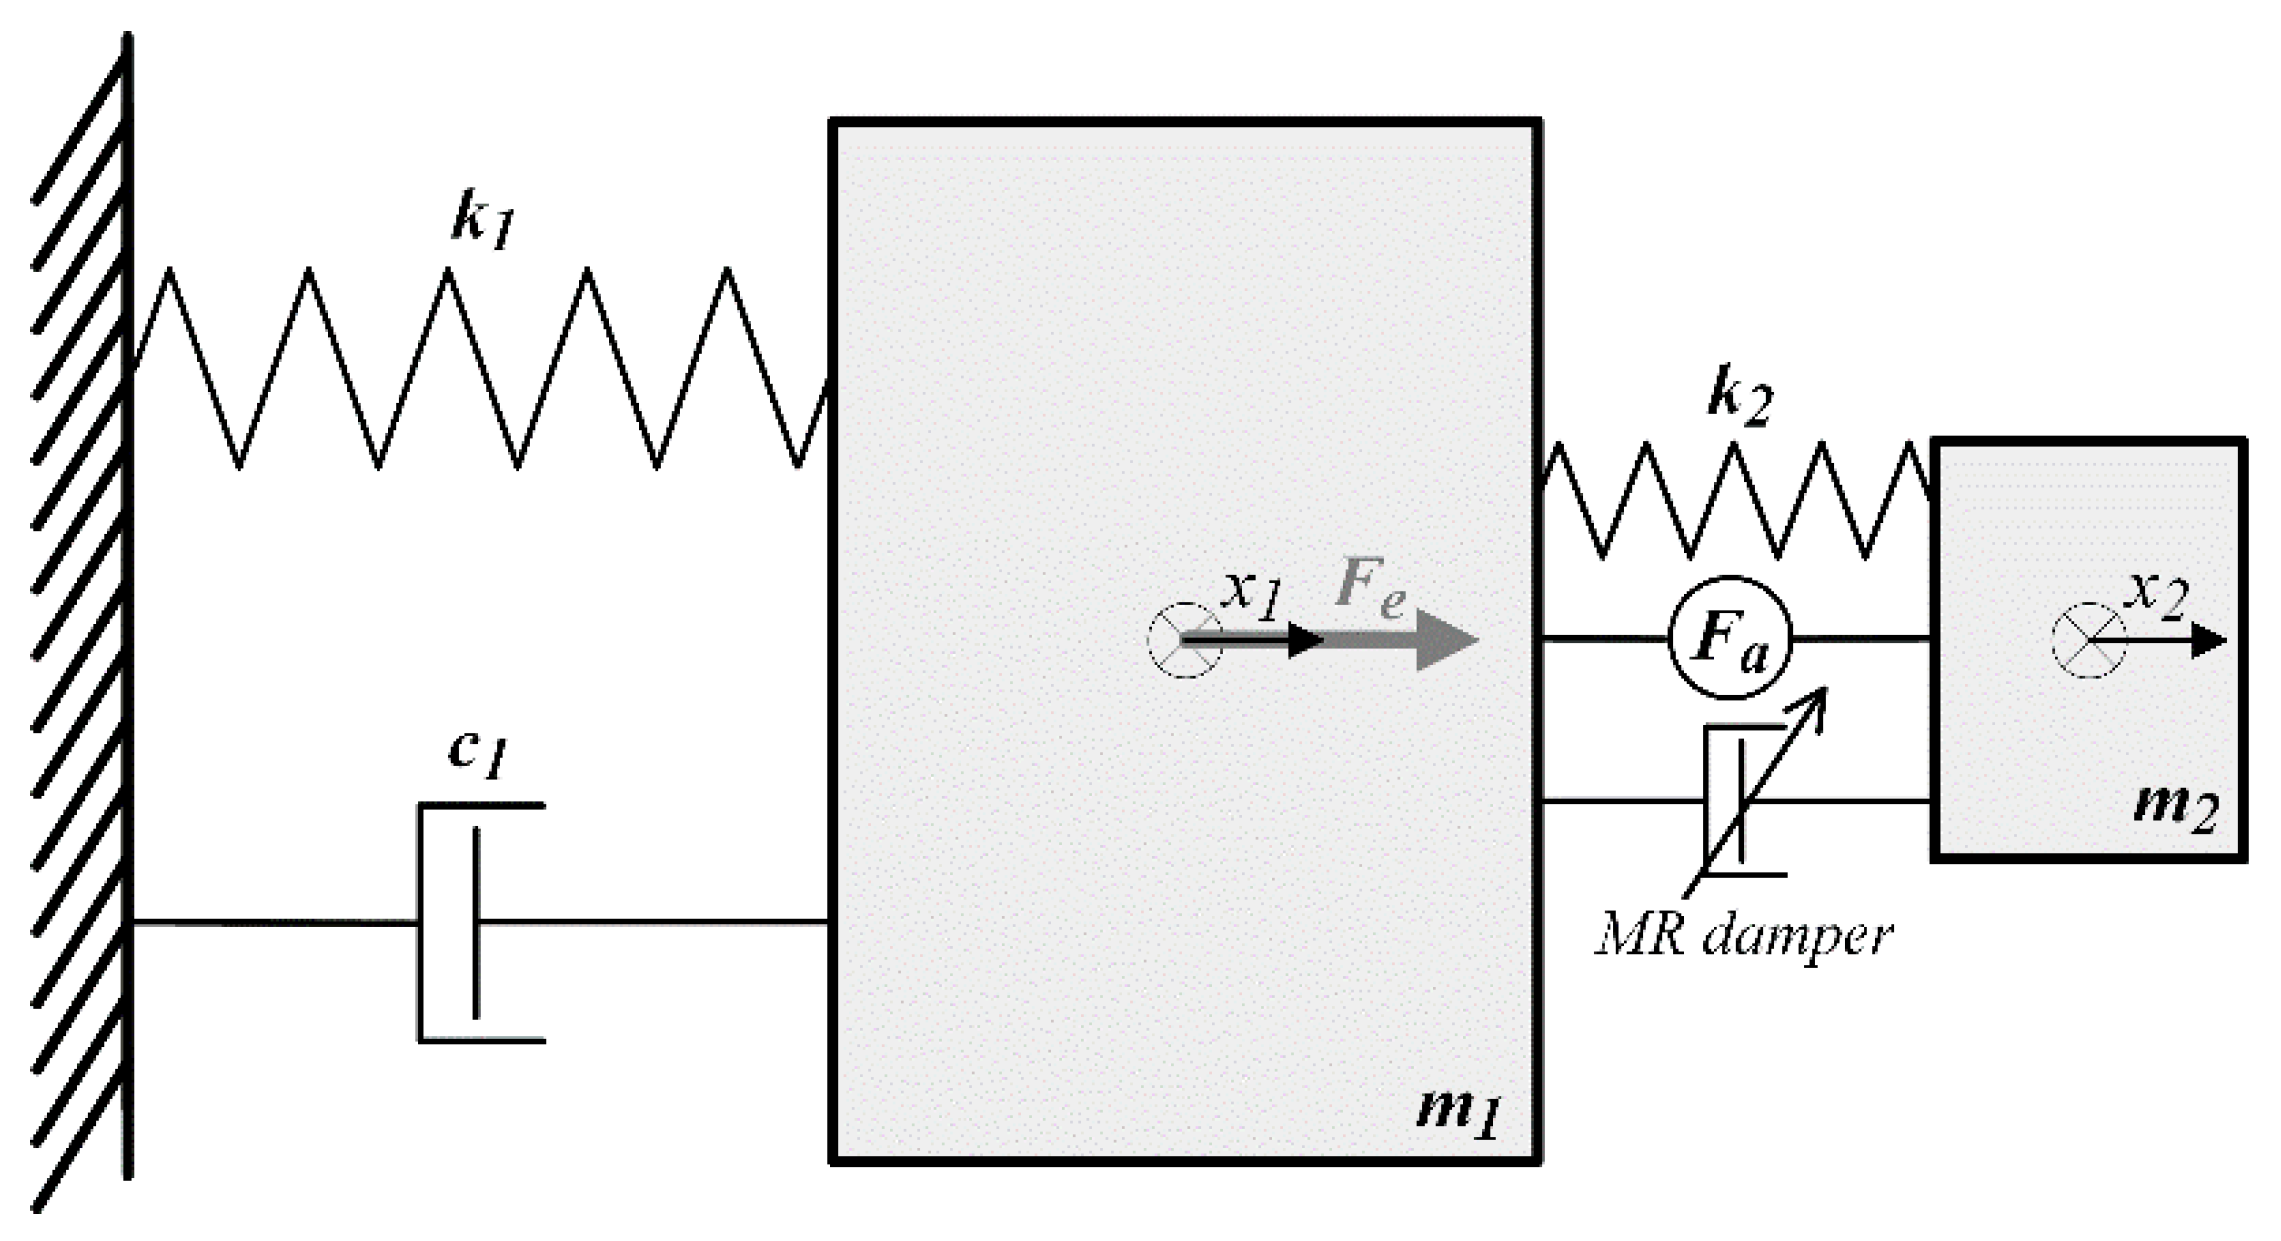
2. A Regarded System
3. Control Problem Formulation and Solution
Remark
- (1)
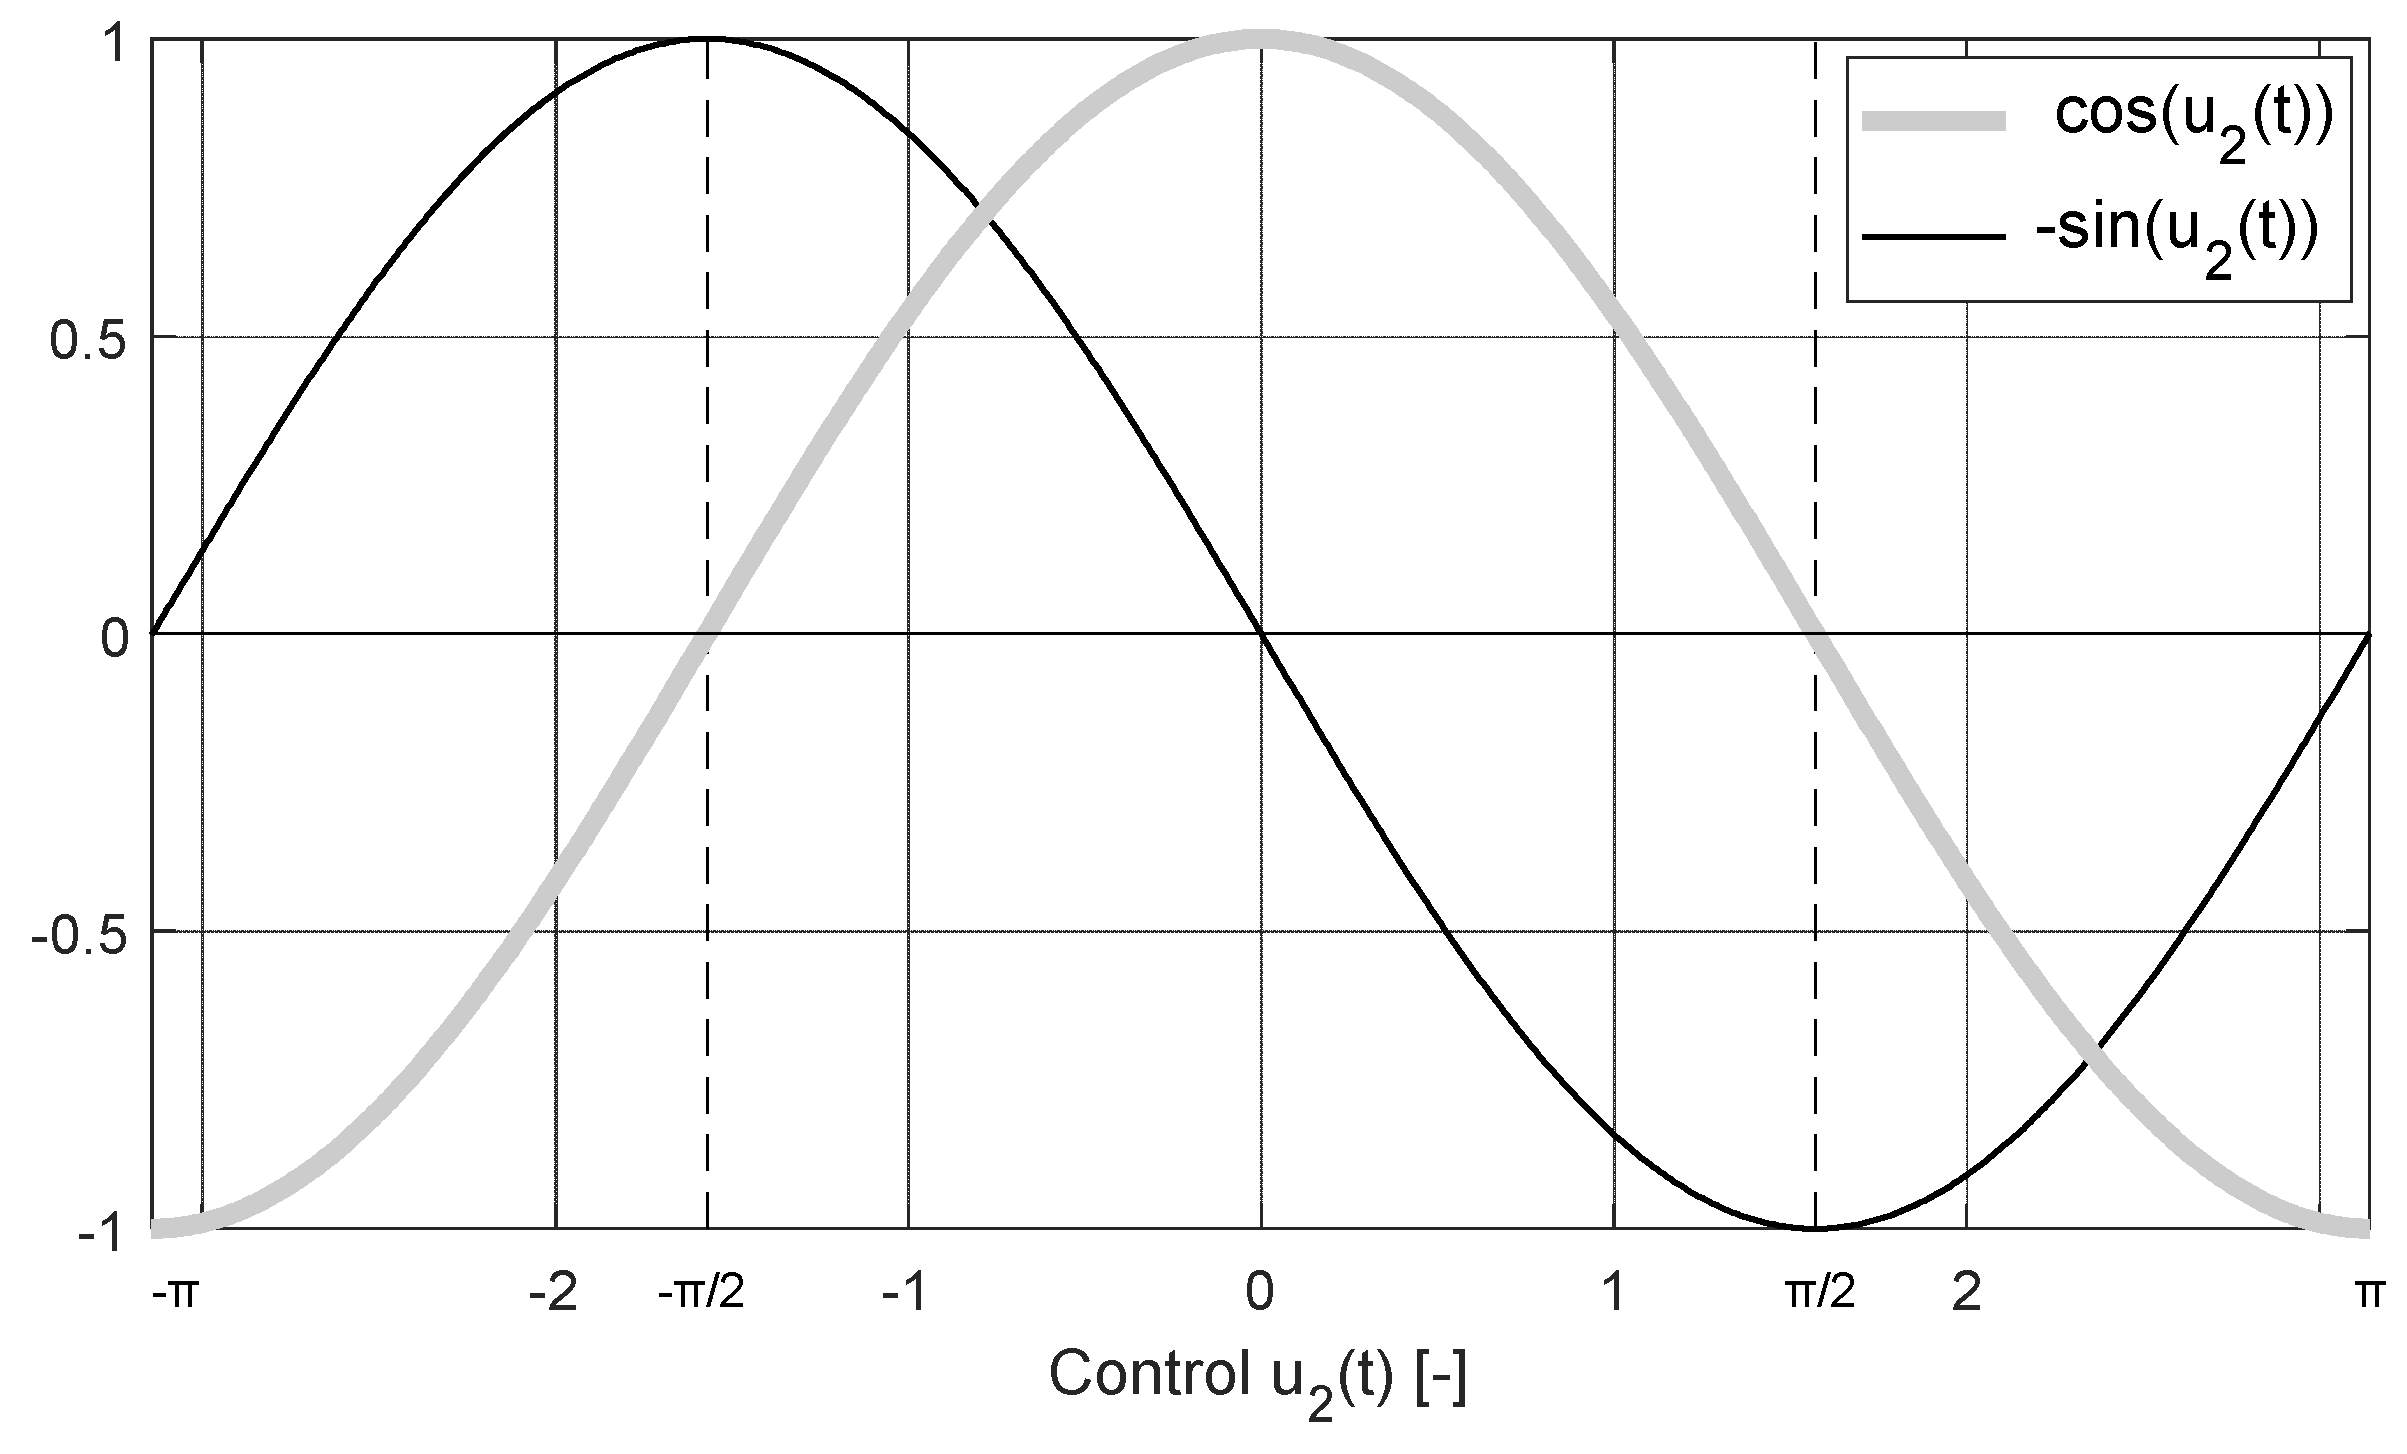
- (21) is fulfilled and exhibits sign change (Hamiltonian maximisation) for: only (see Figure 3); thus:
- (2)
- (21) is fulfilled and exhibits sign change (Hamiltonian maximisation) for: only (see Figure 3); thus:
- (3)
- (21) is fulfilled and exhibits sign change (Hamiltonian maximisation) for: only (see Figure 3); thus:
4. Control Implementation
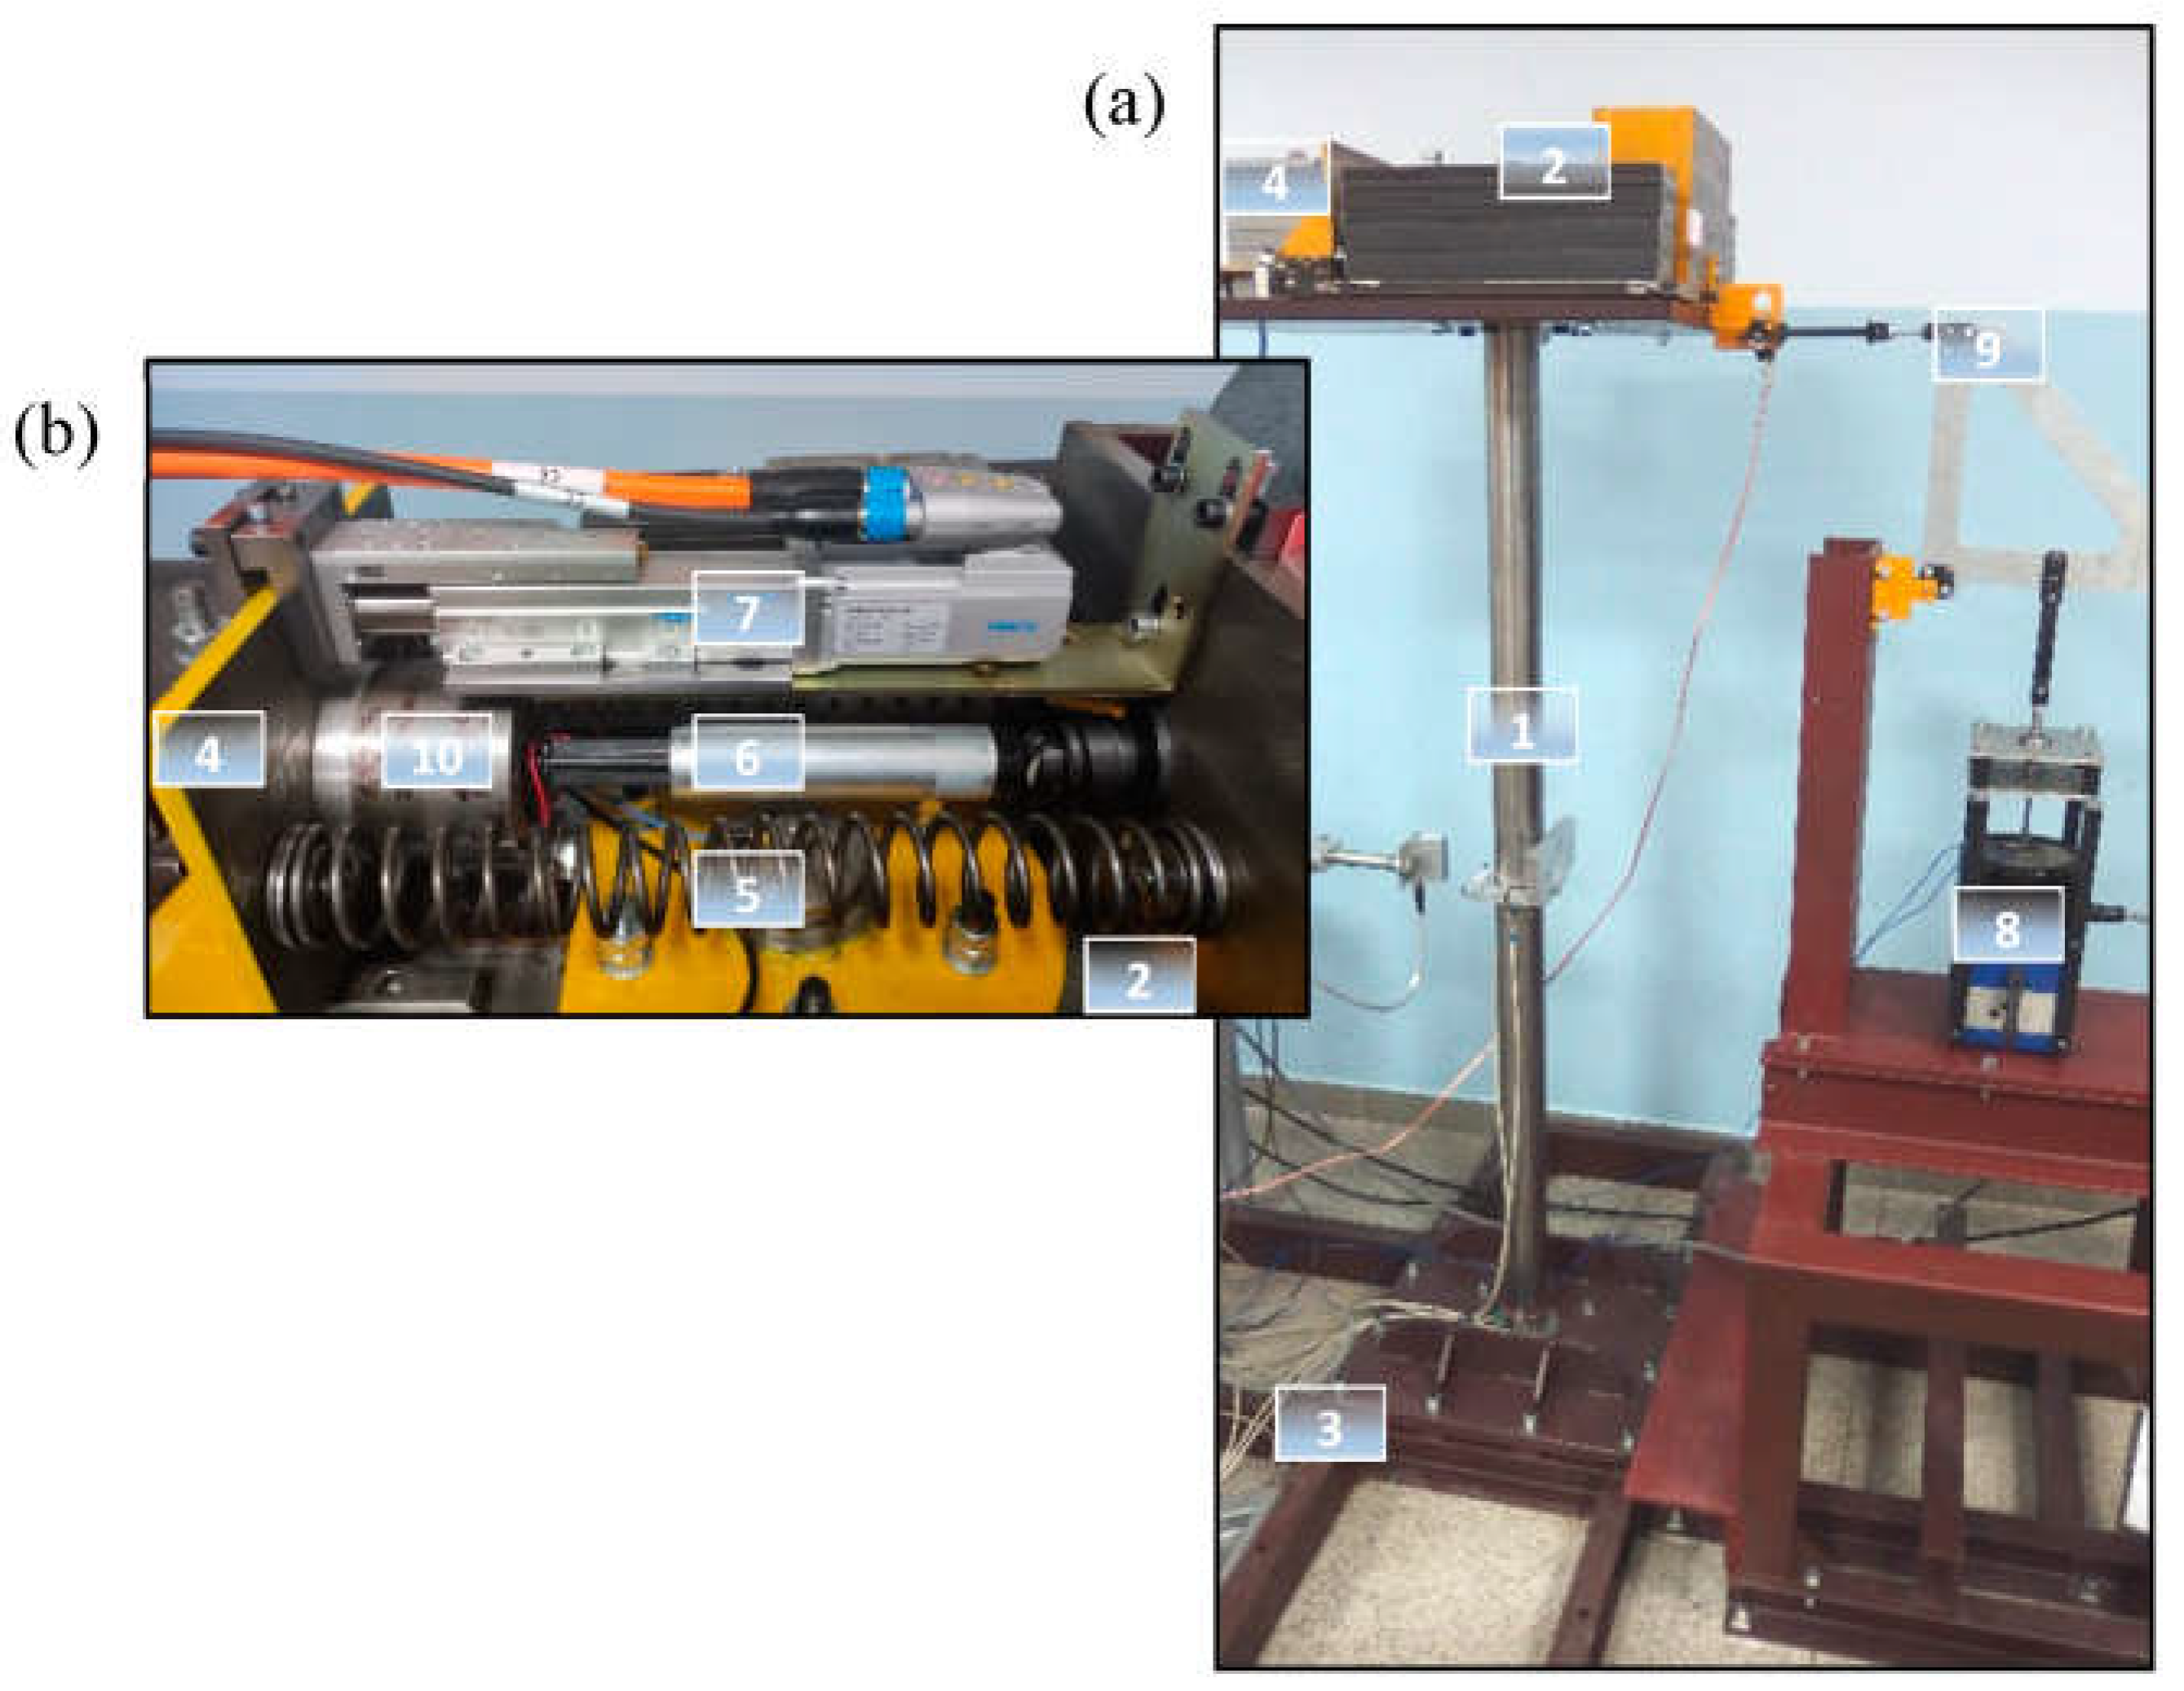
5. The Experimental Setup
6. The Test Conditions
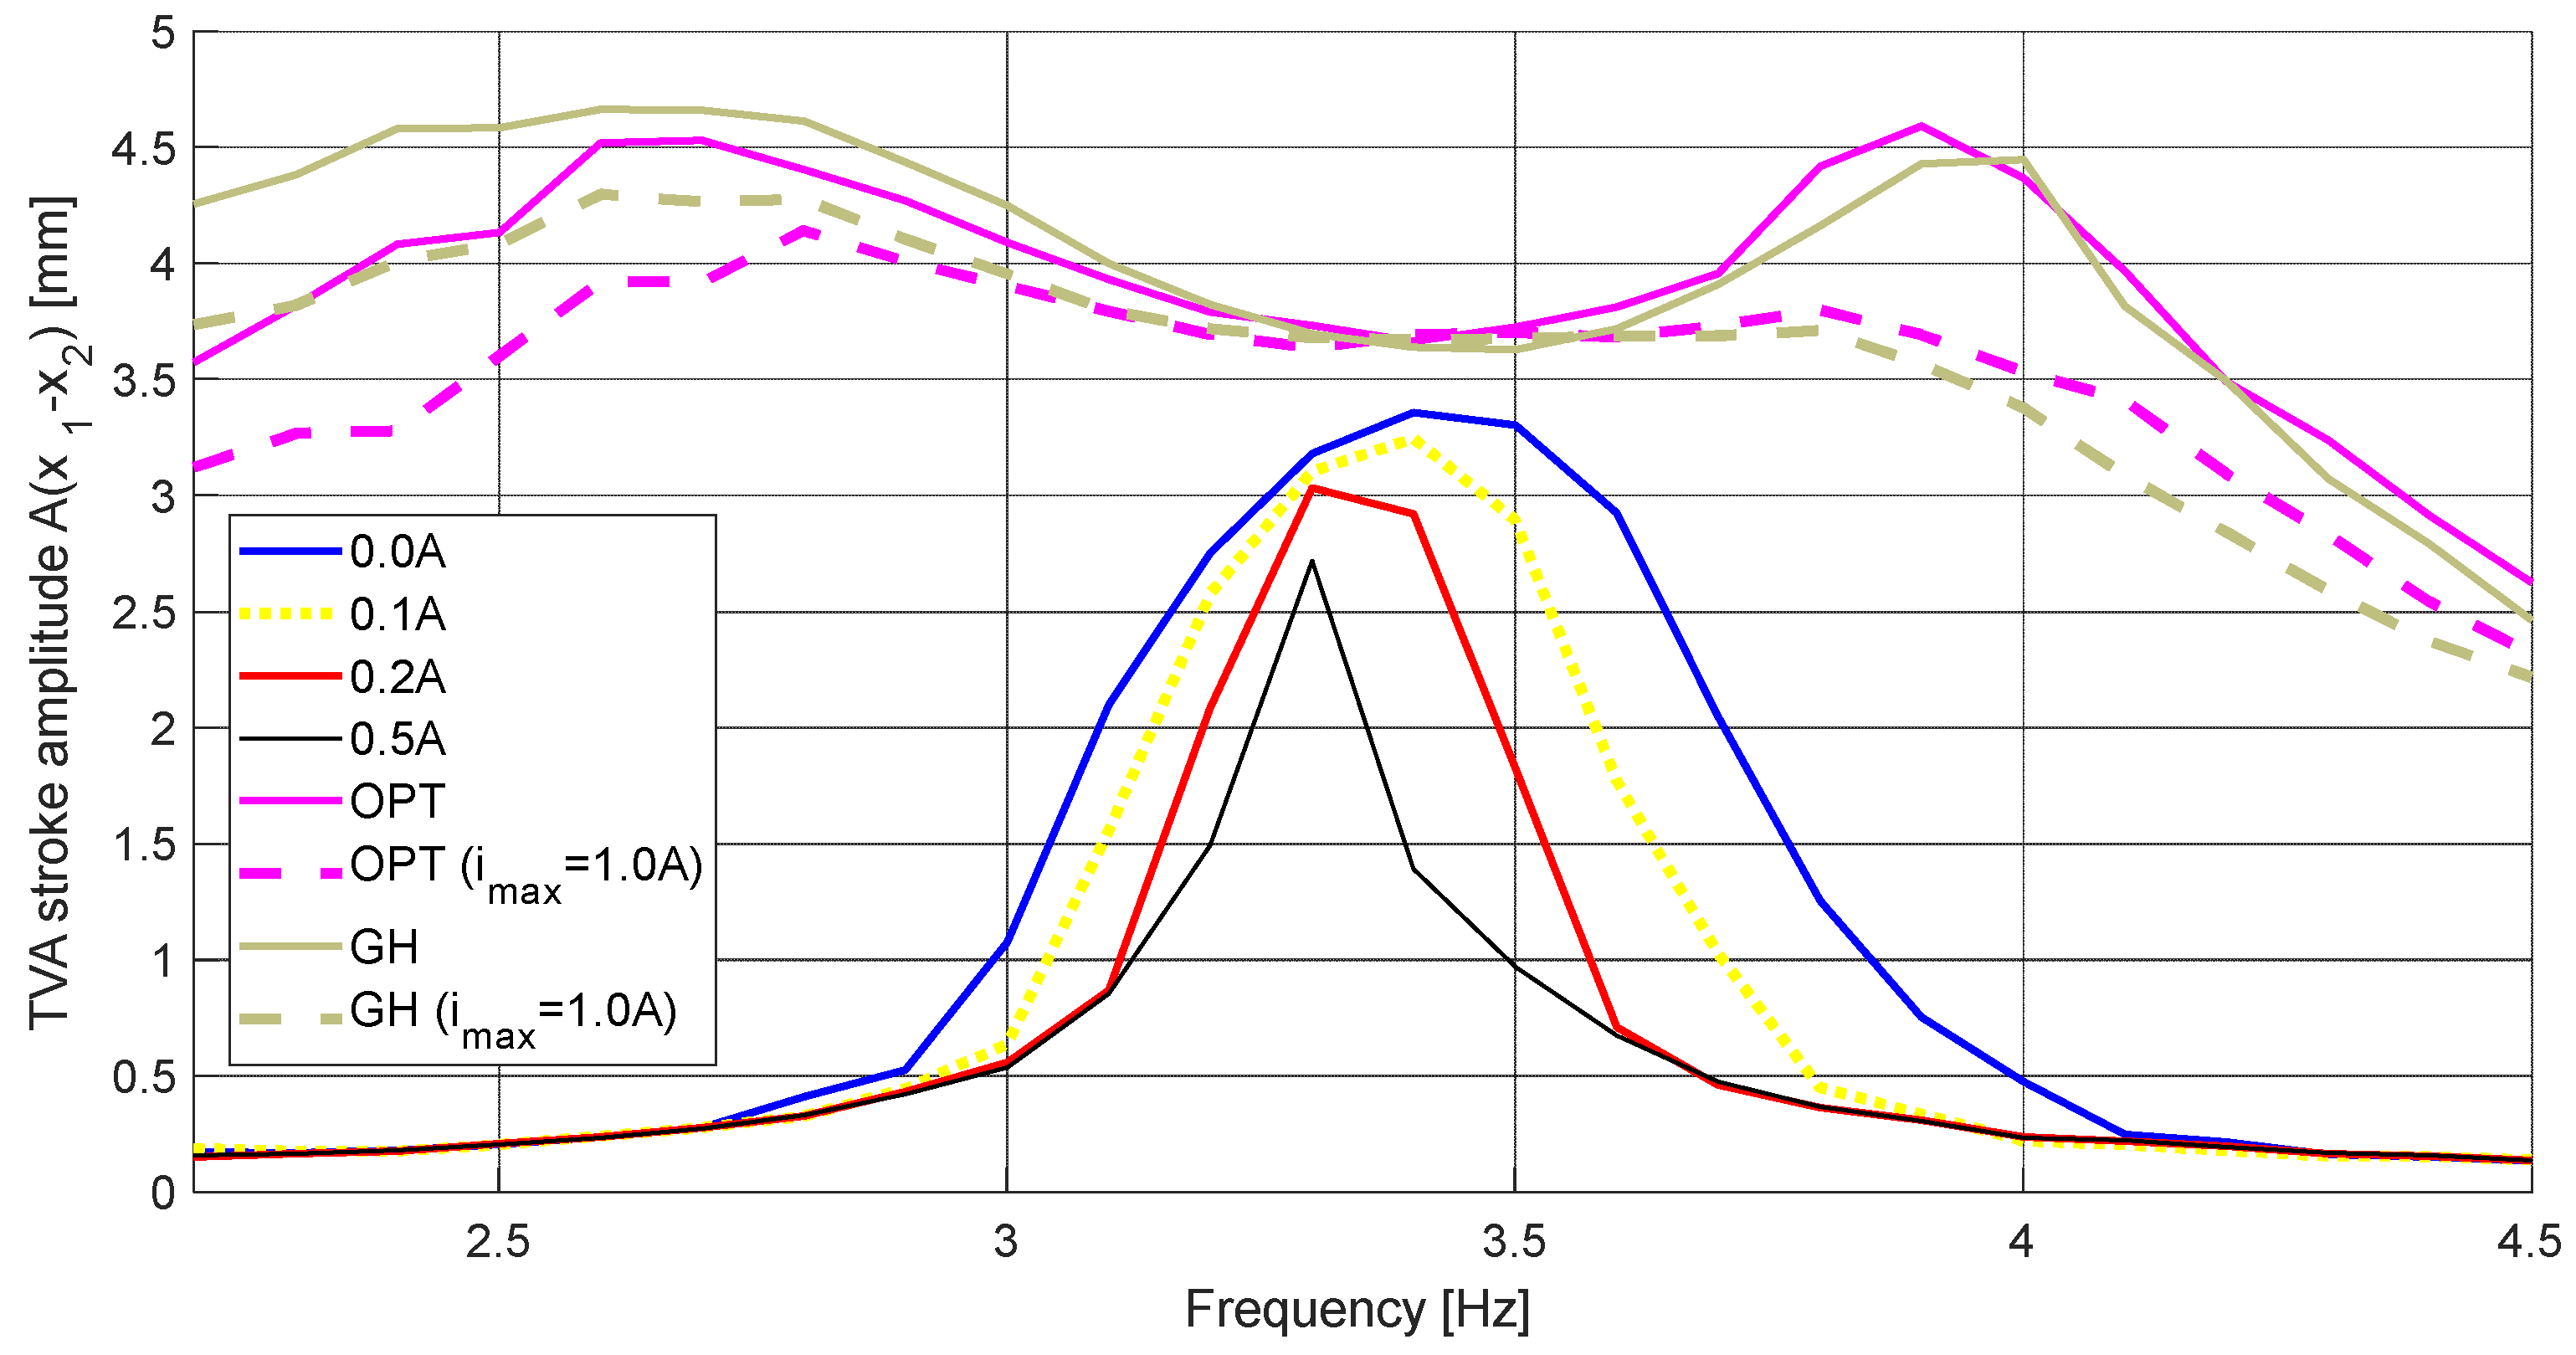
- minimise the primary structure deflection (nacelle-assembly displacement) amplitude as the primary objective while considering TVA stroke amplitude limitation (these were the two basic objectives for cases II and III as well);
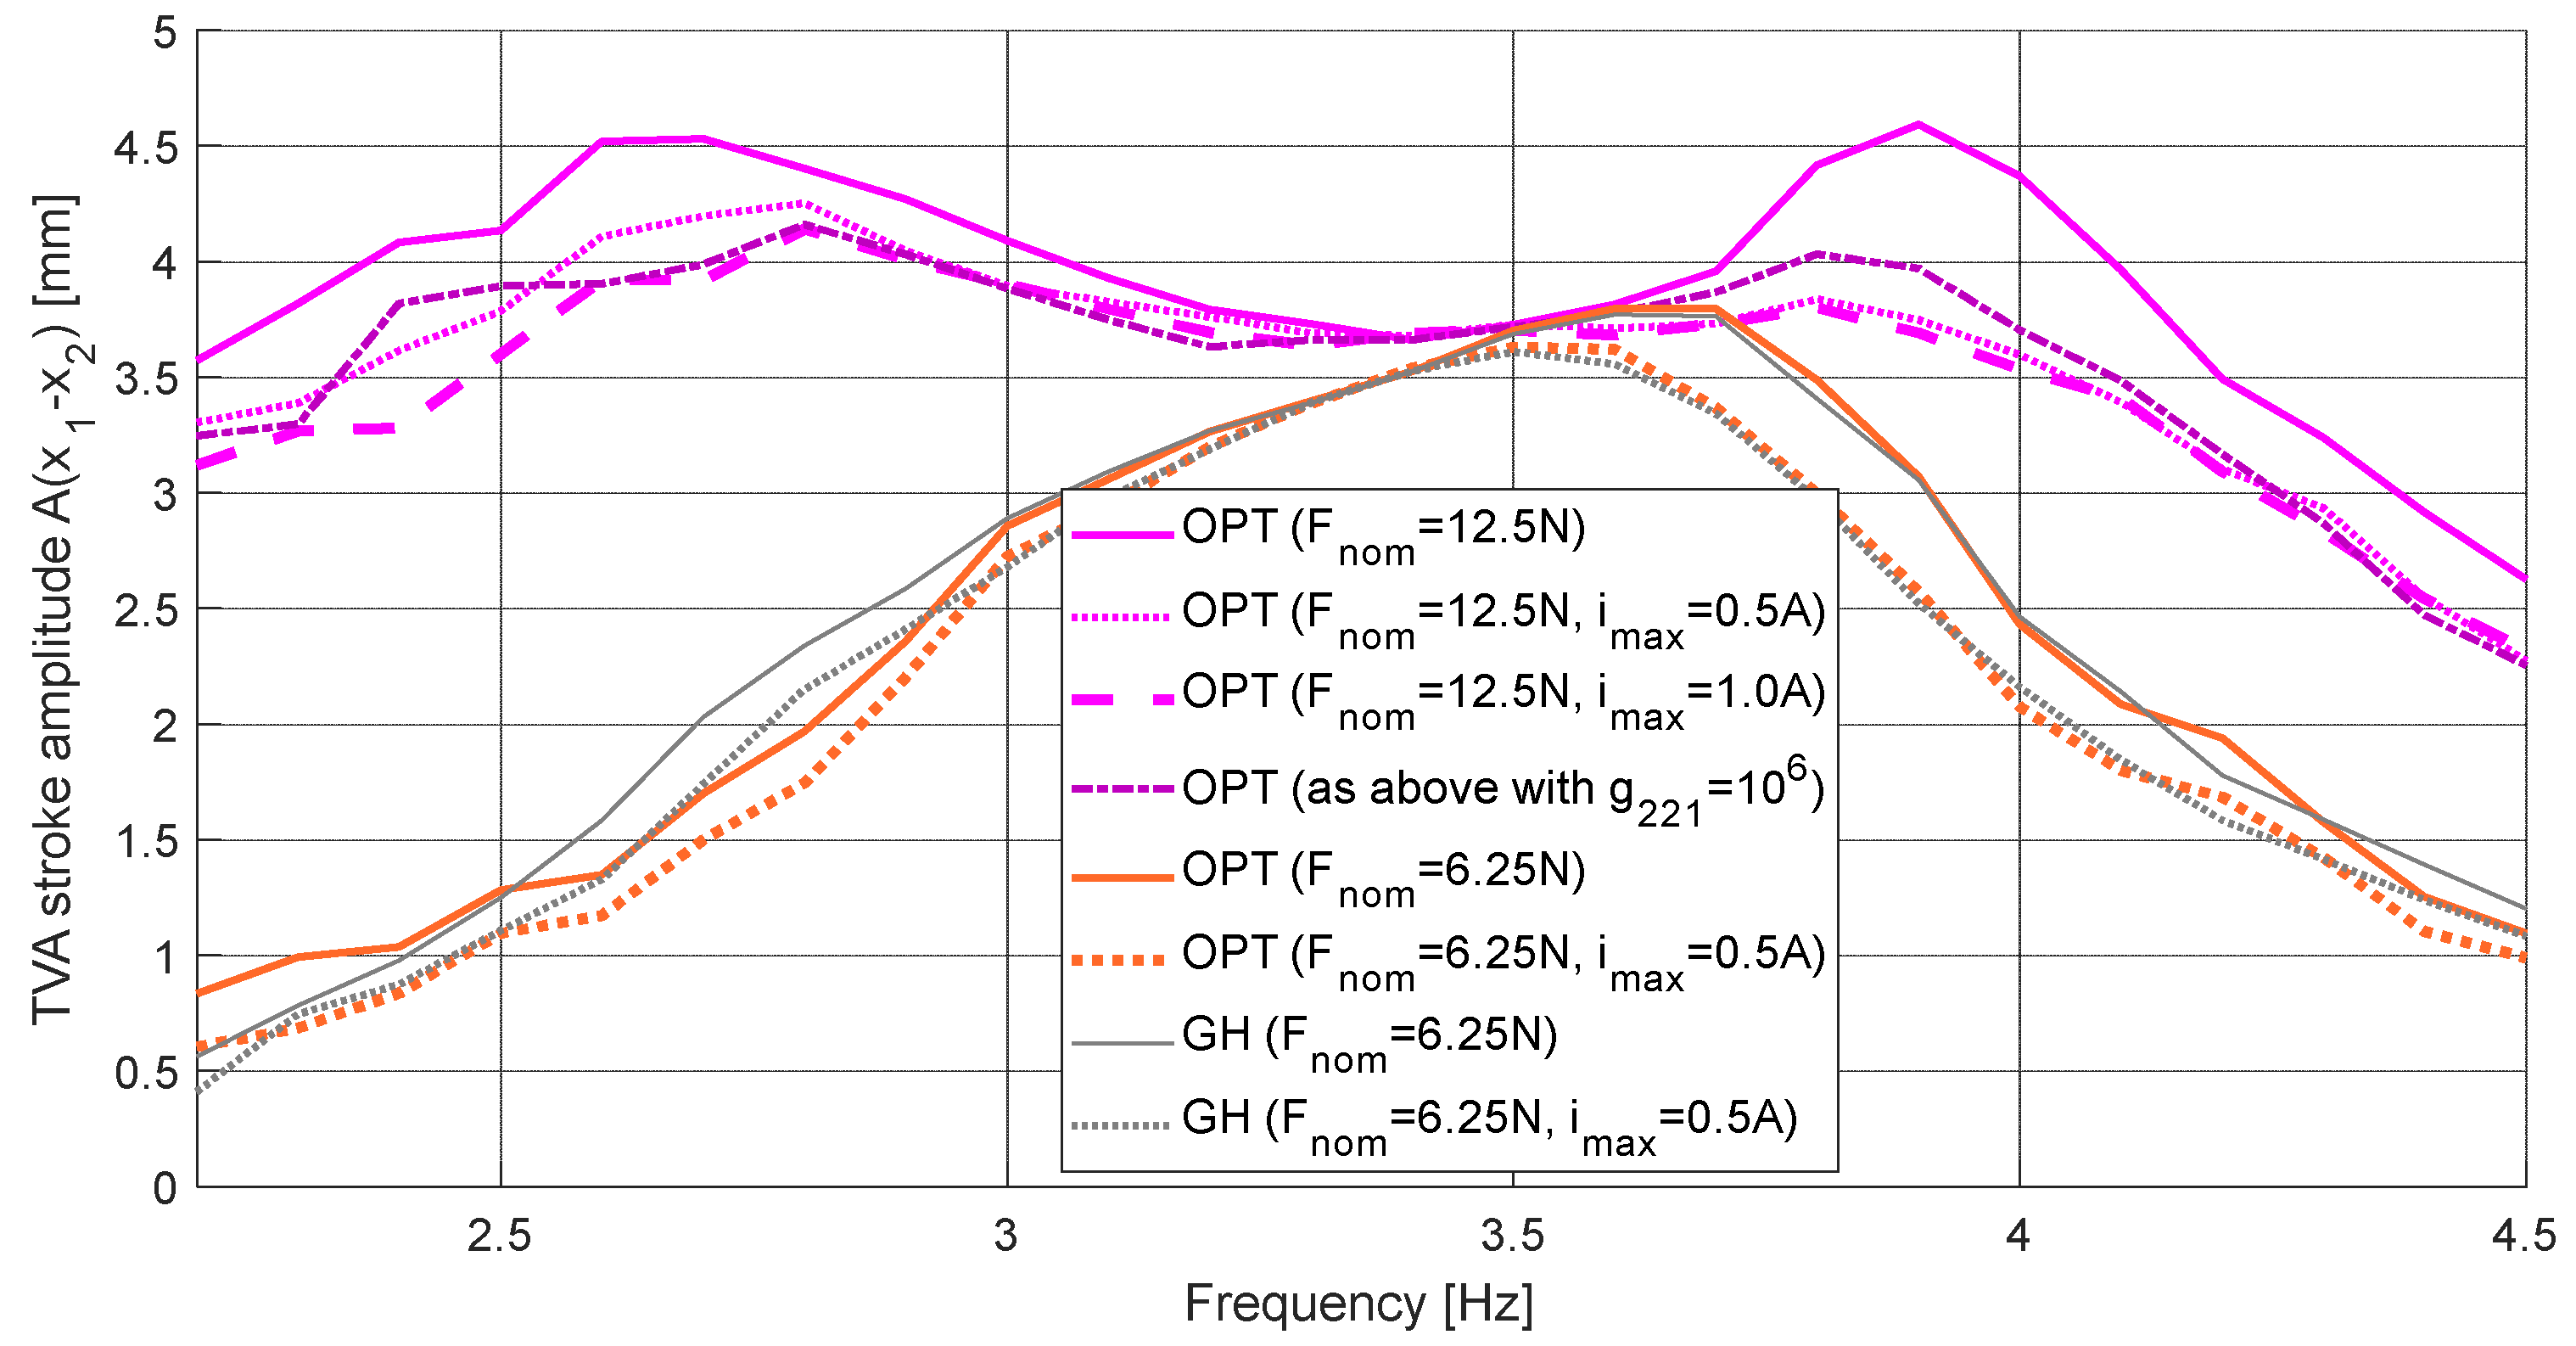
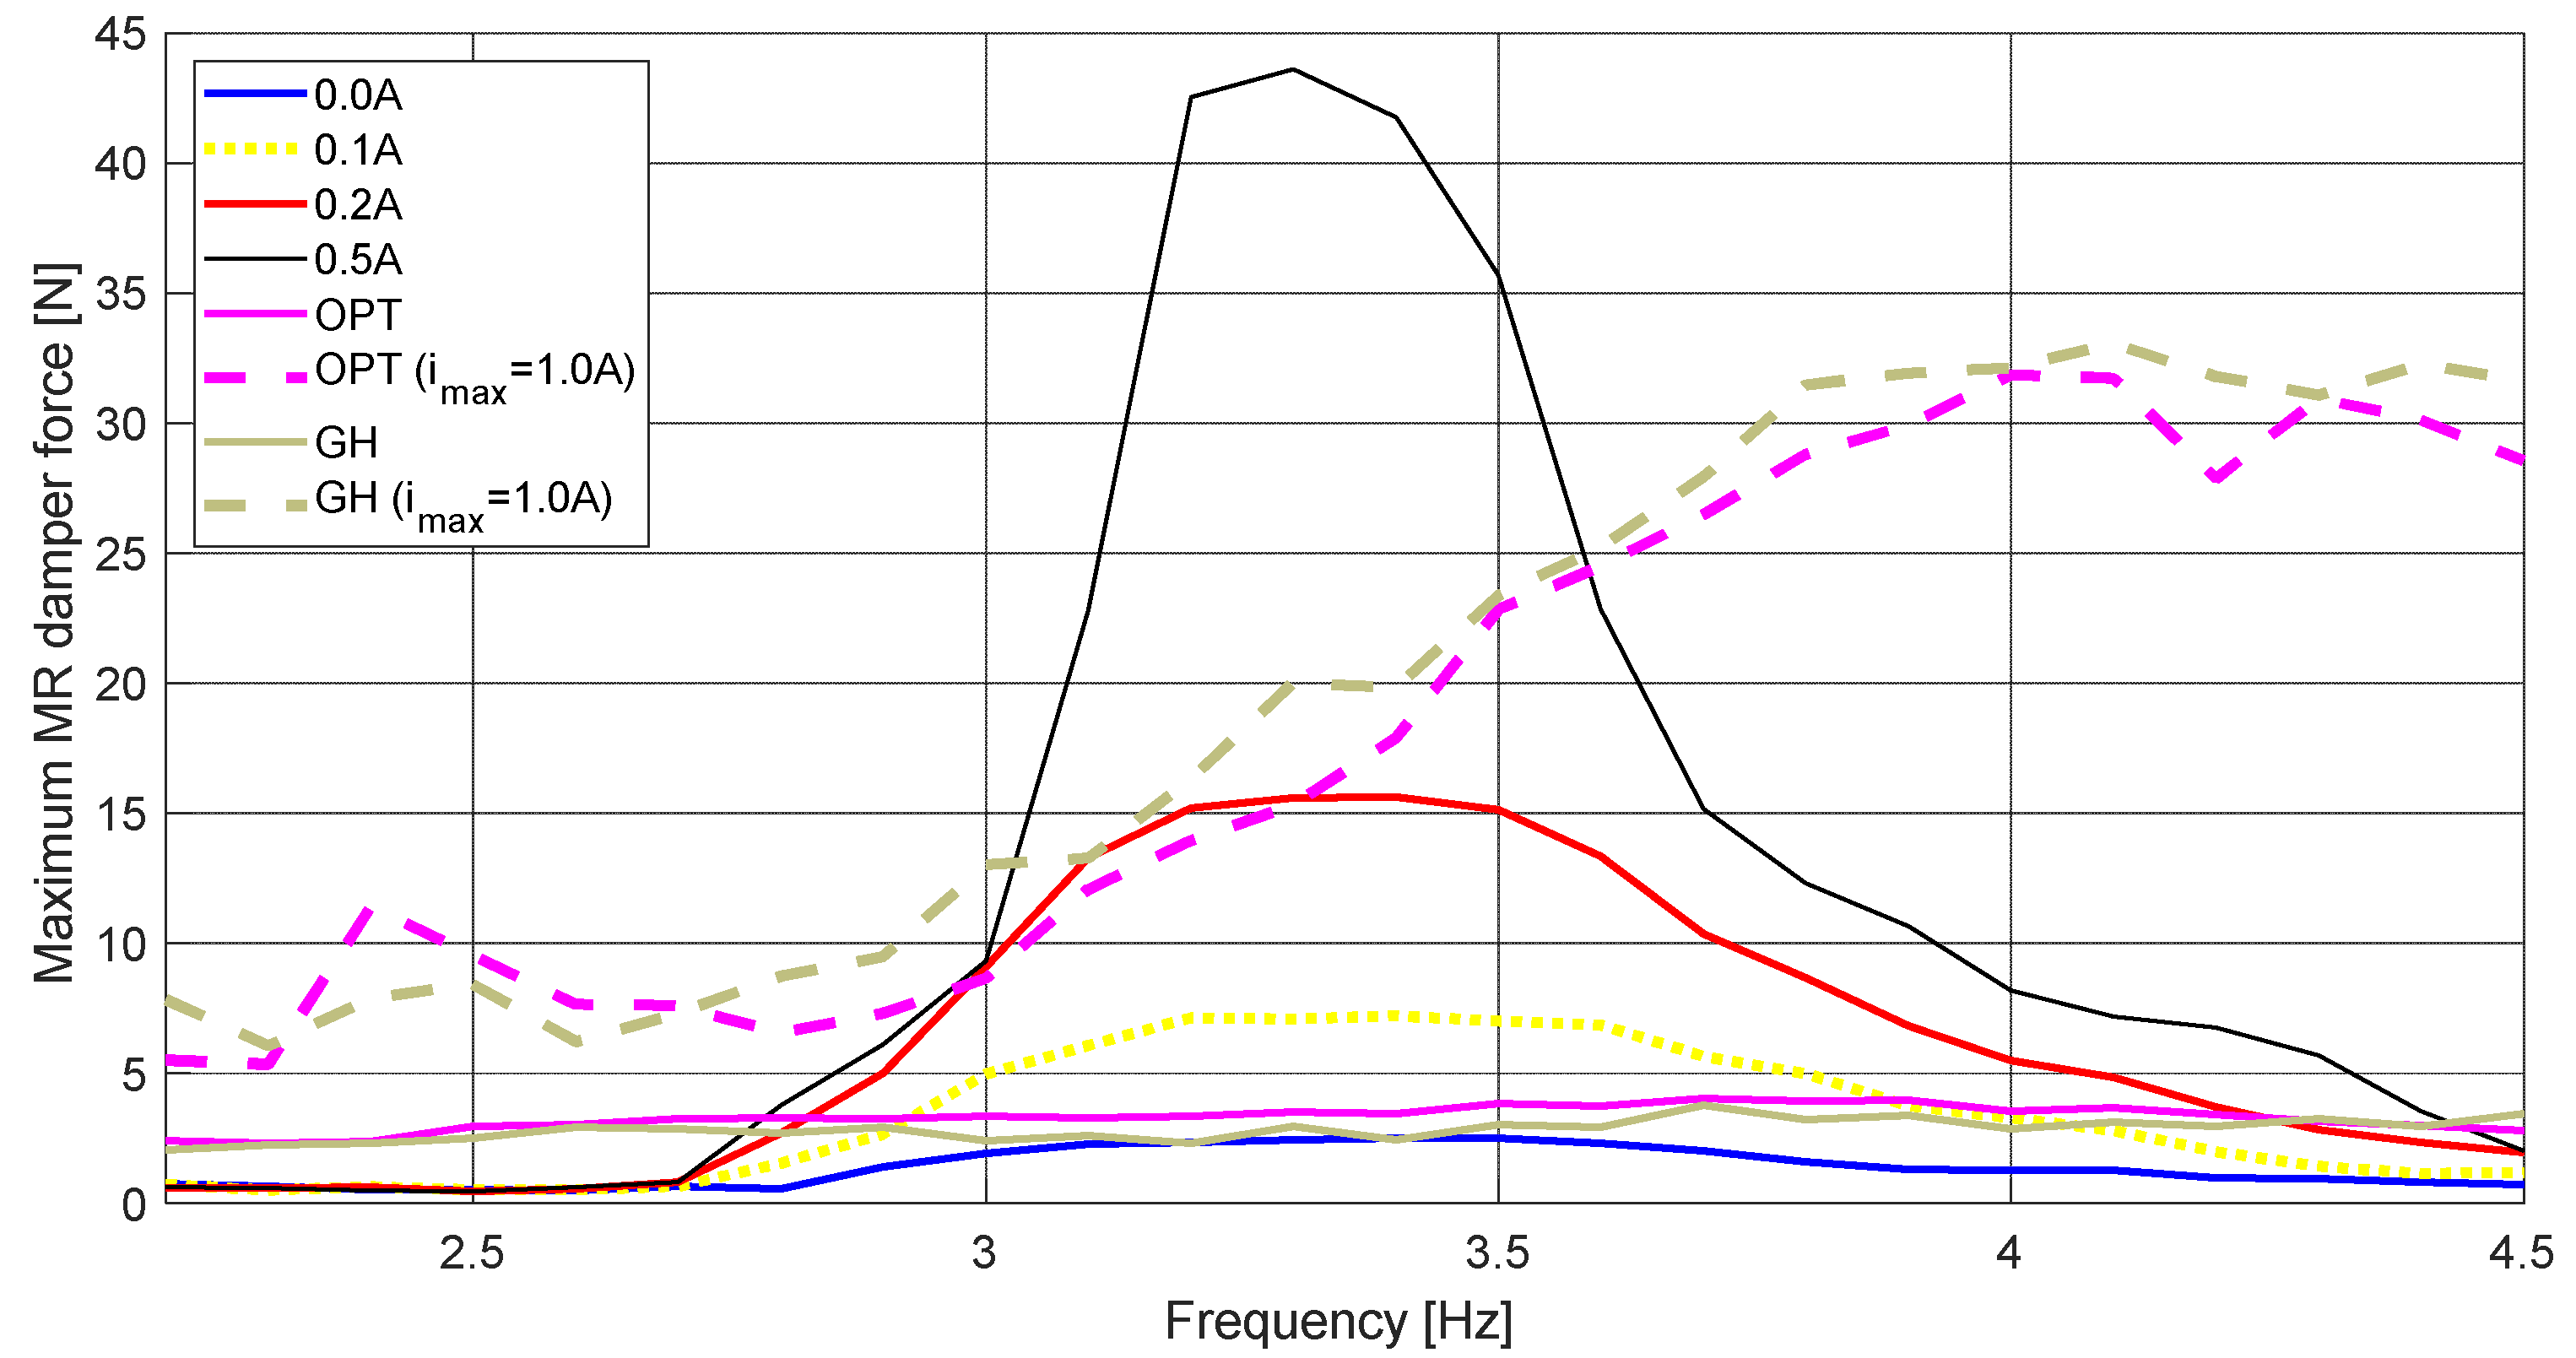
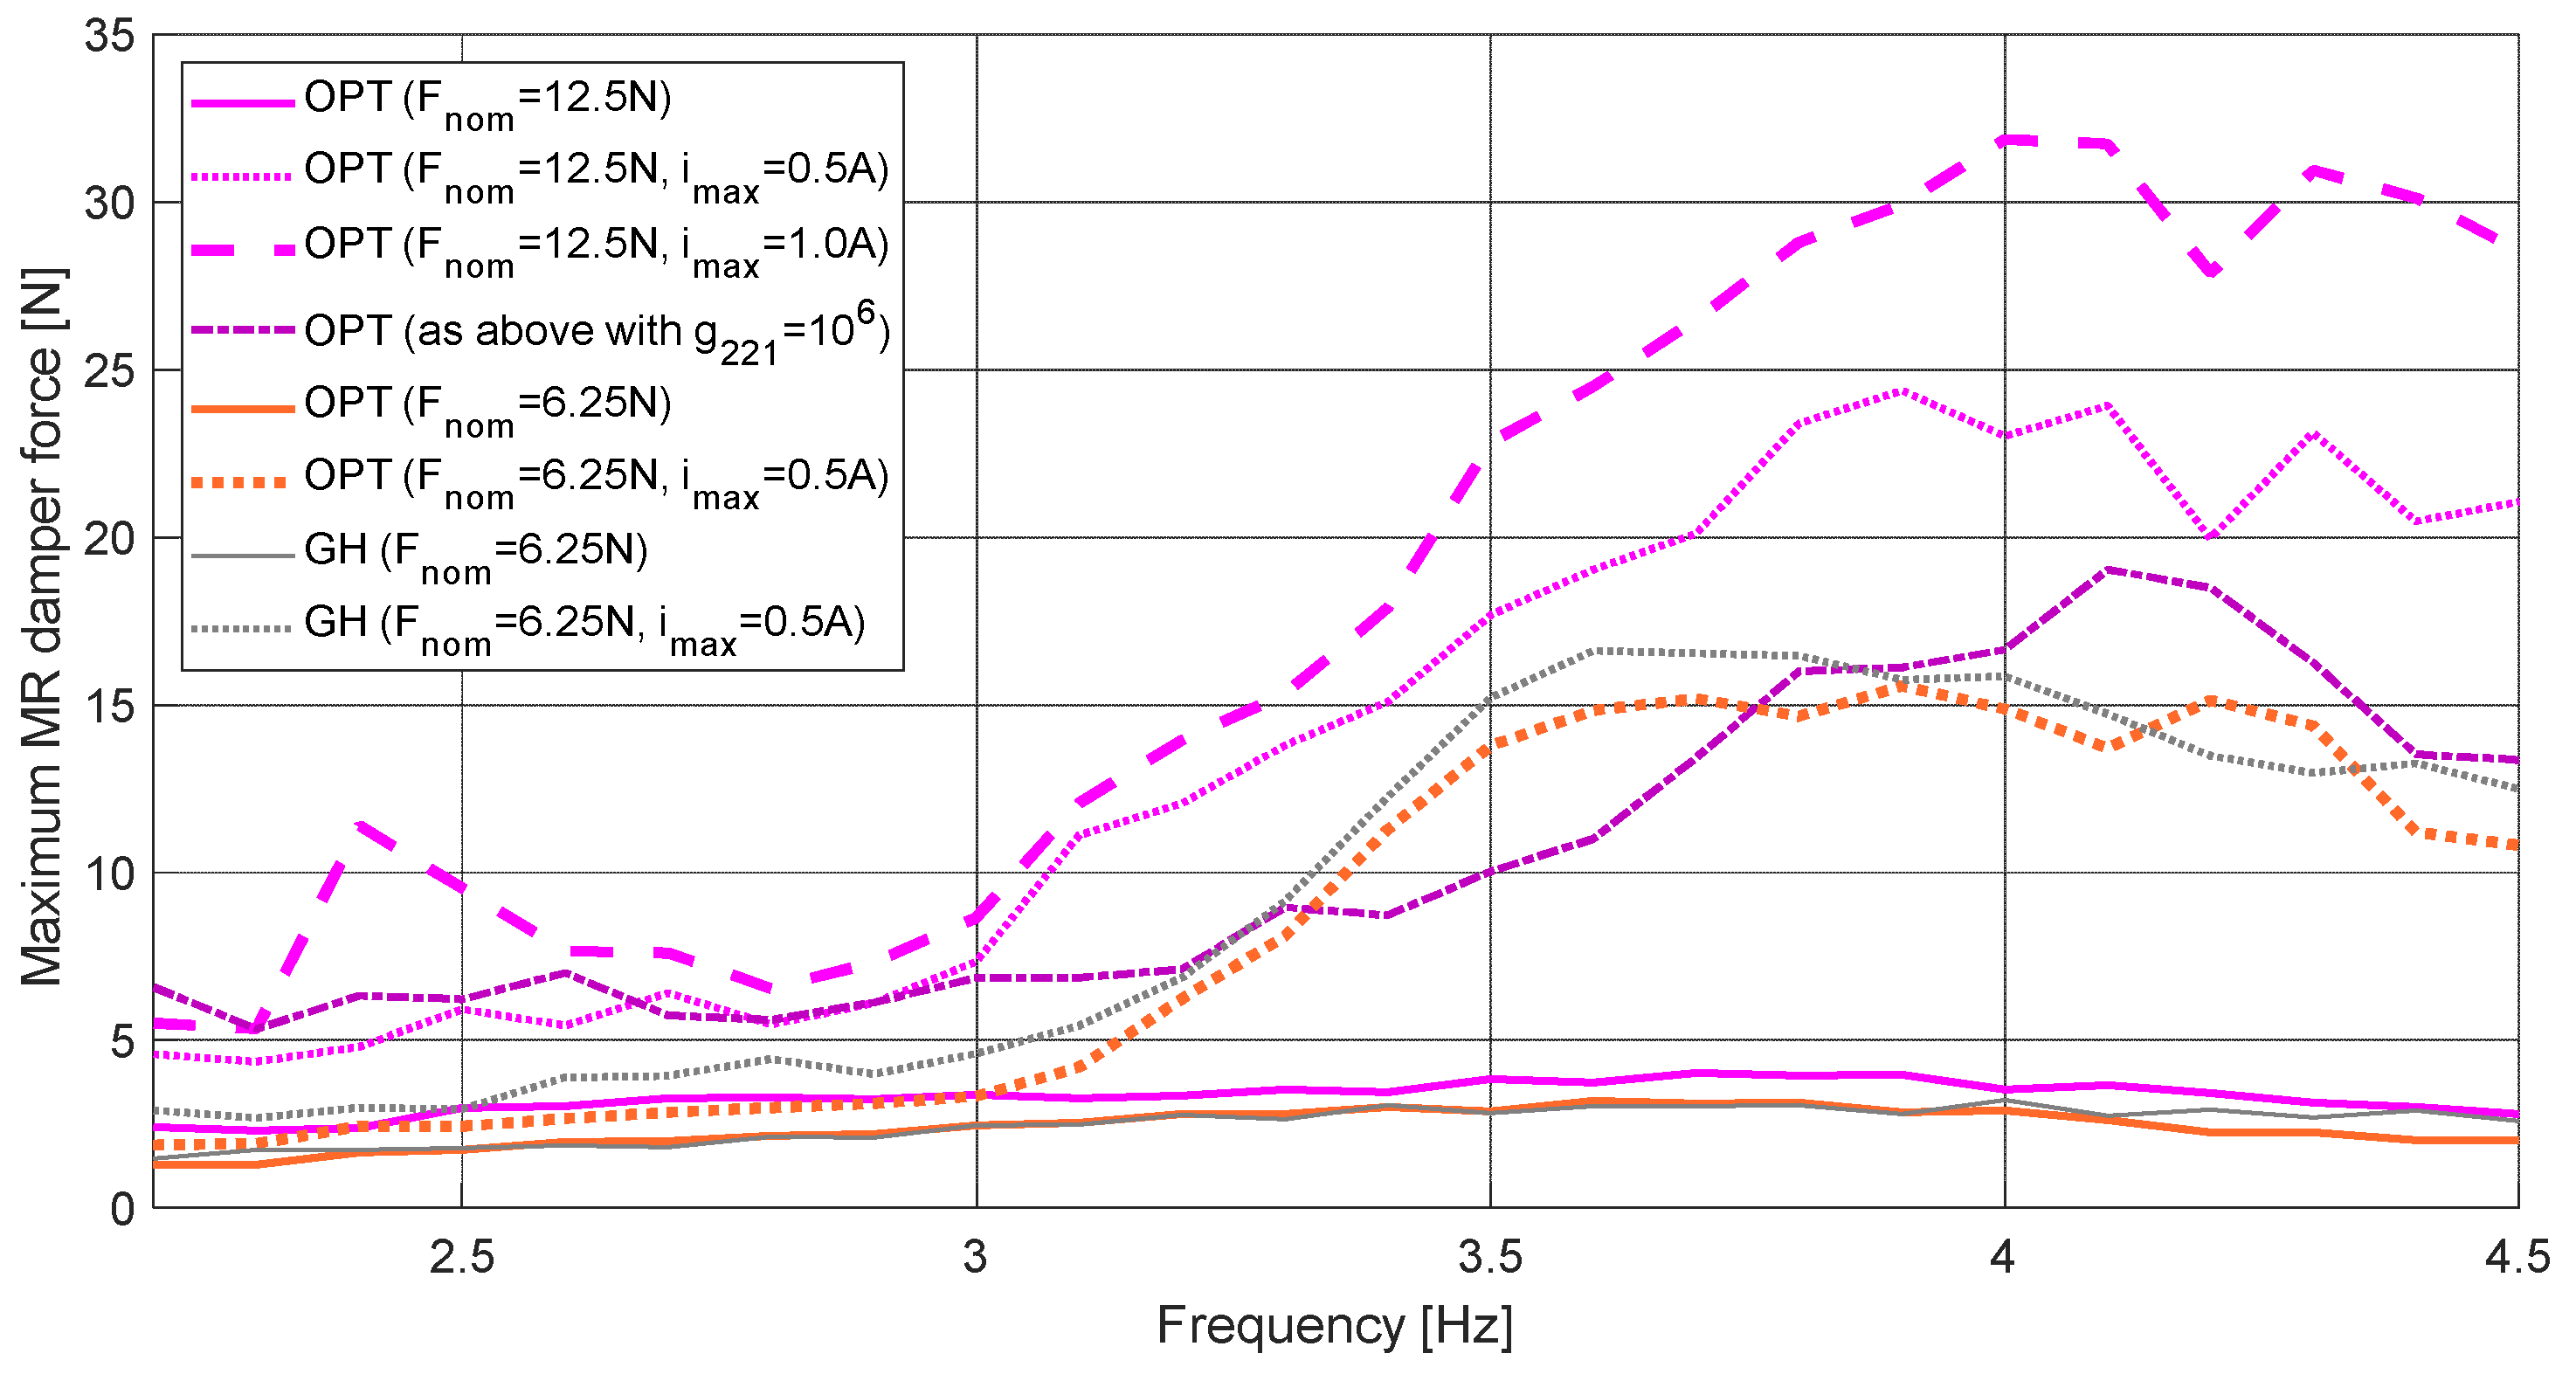
- minimise the MR damper force in addition to the case I objectives (to account for the MR damper’s possible force limit and thermal constraints);
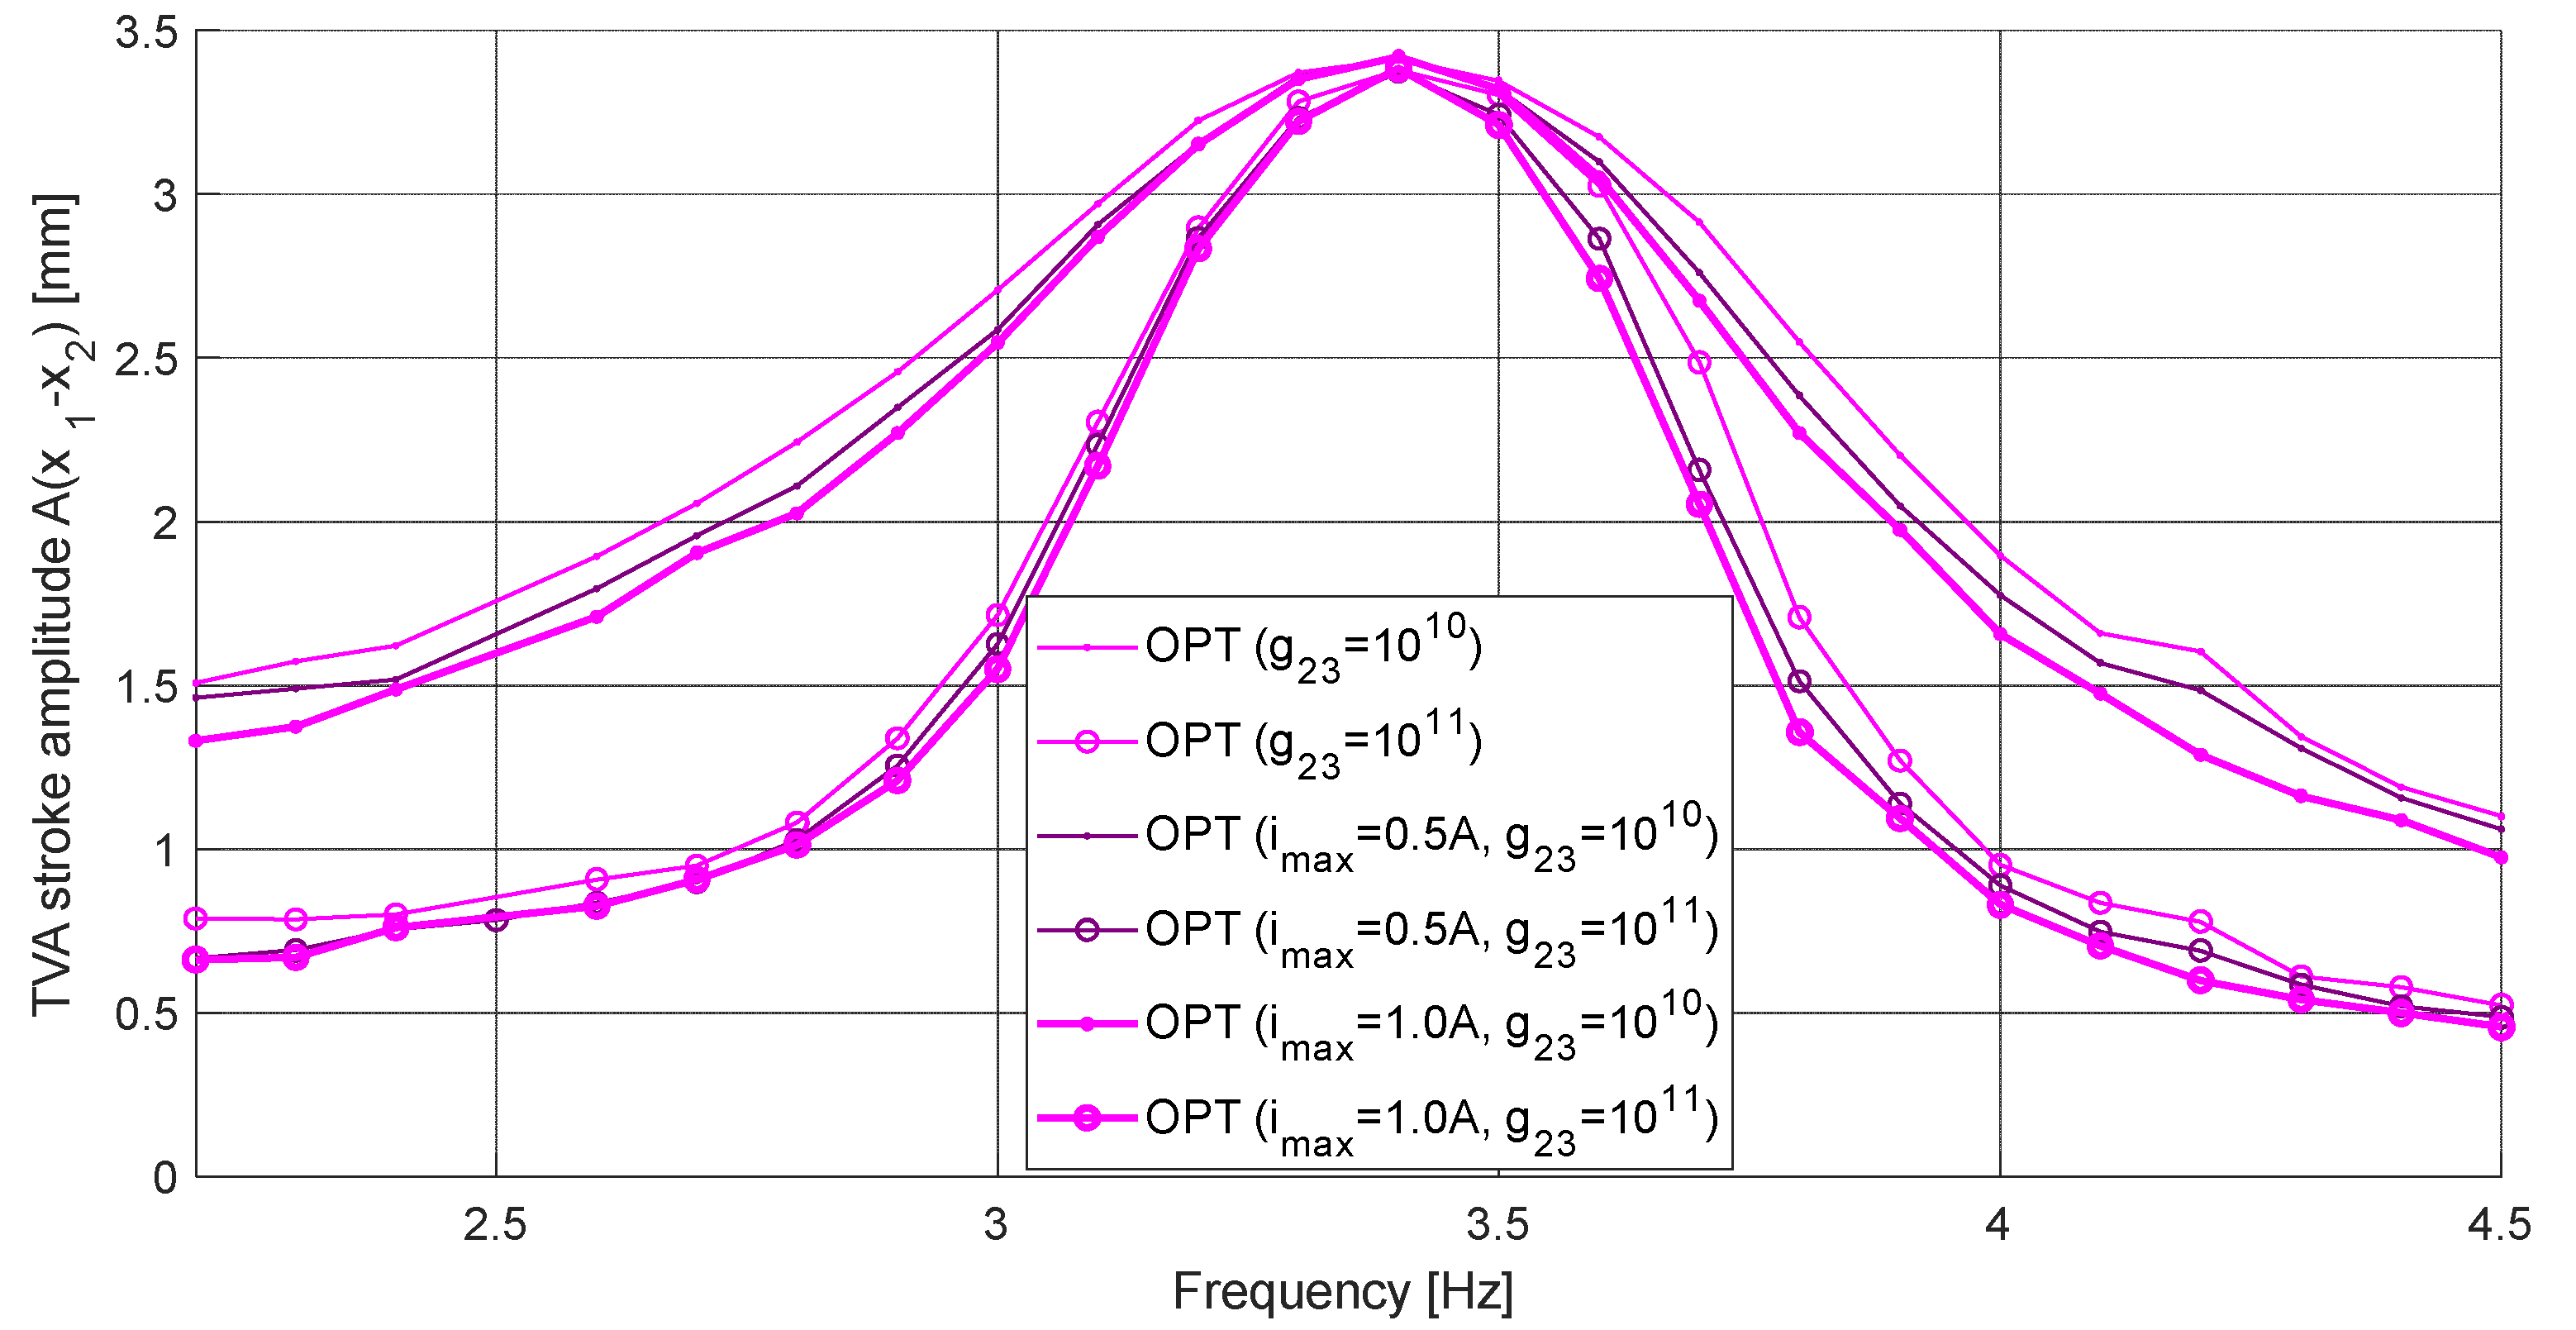
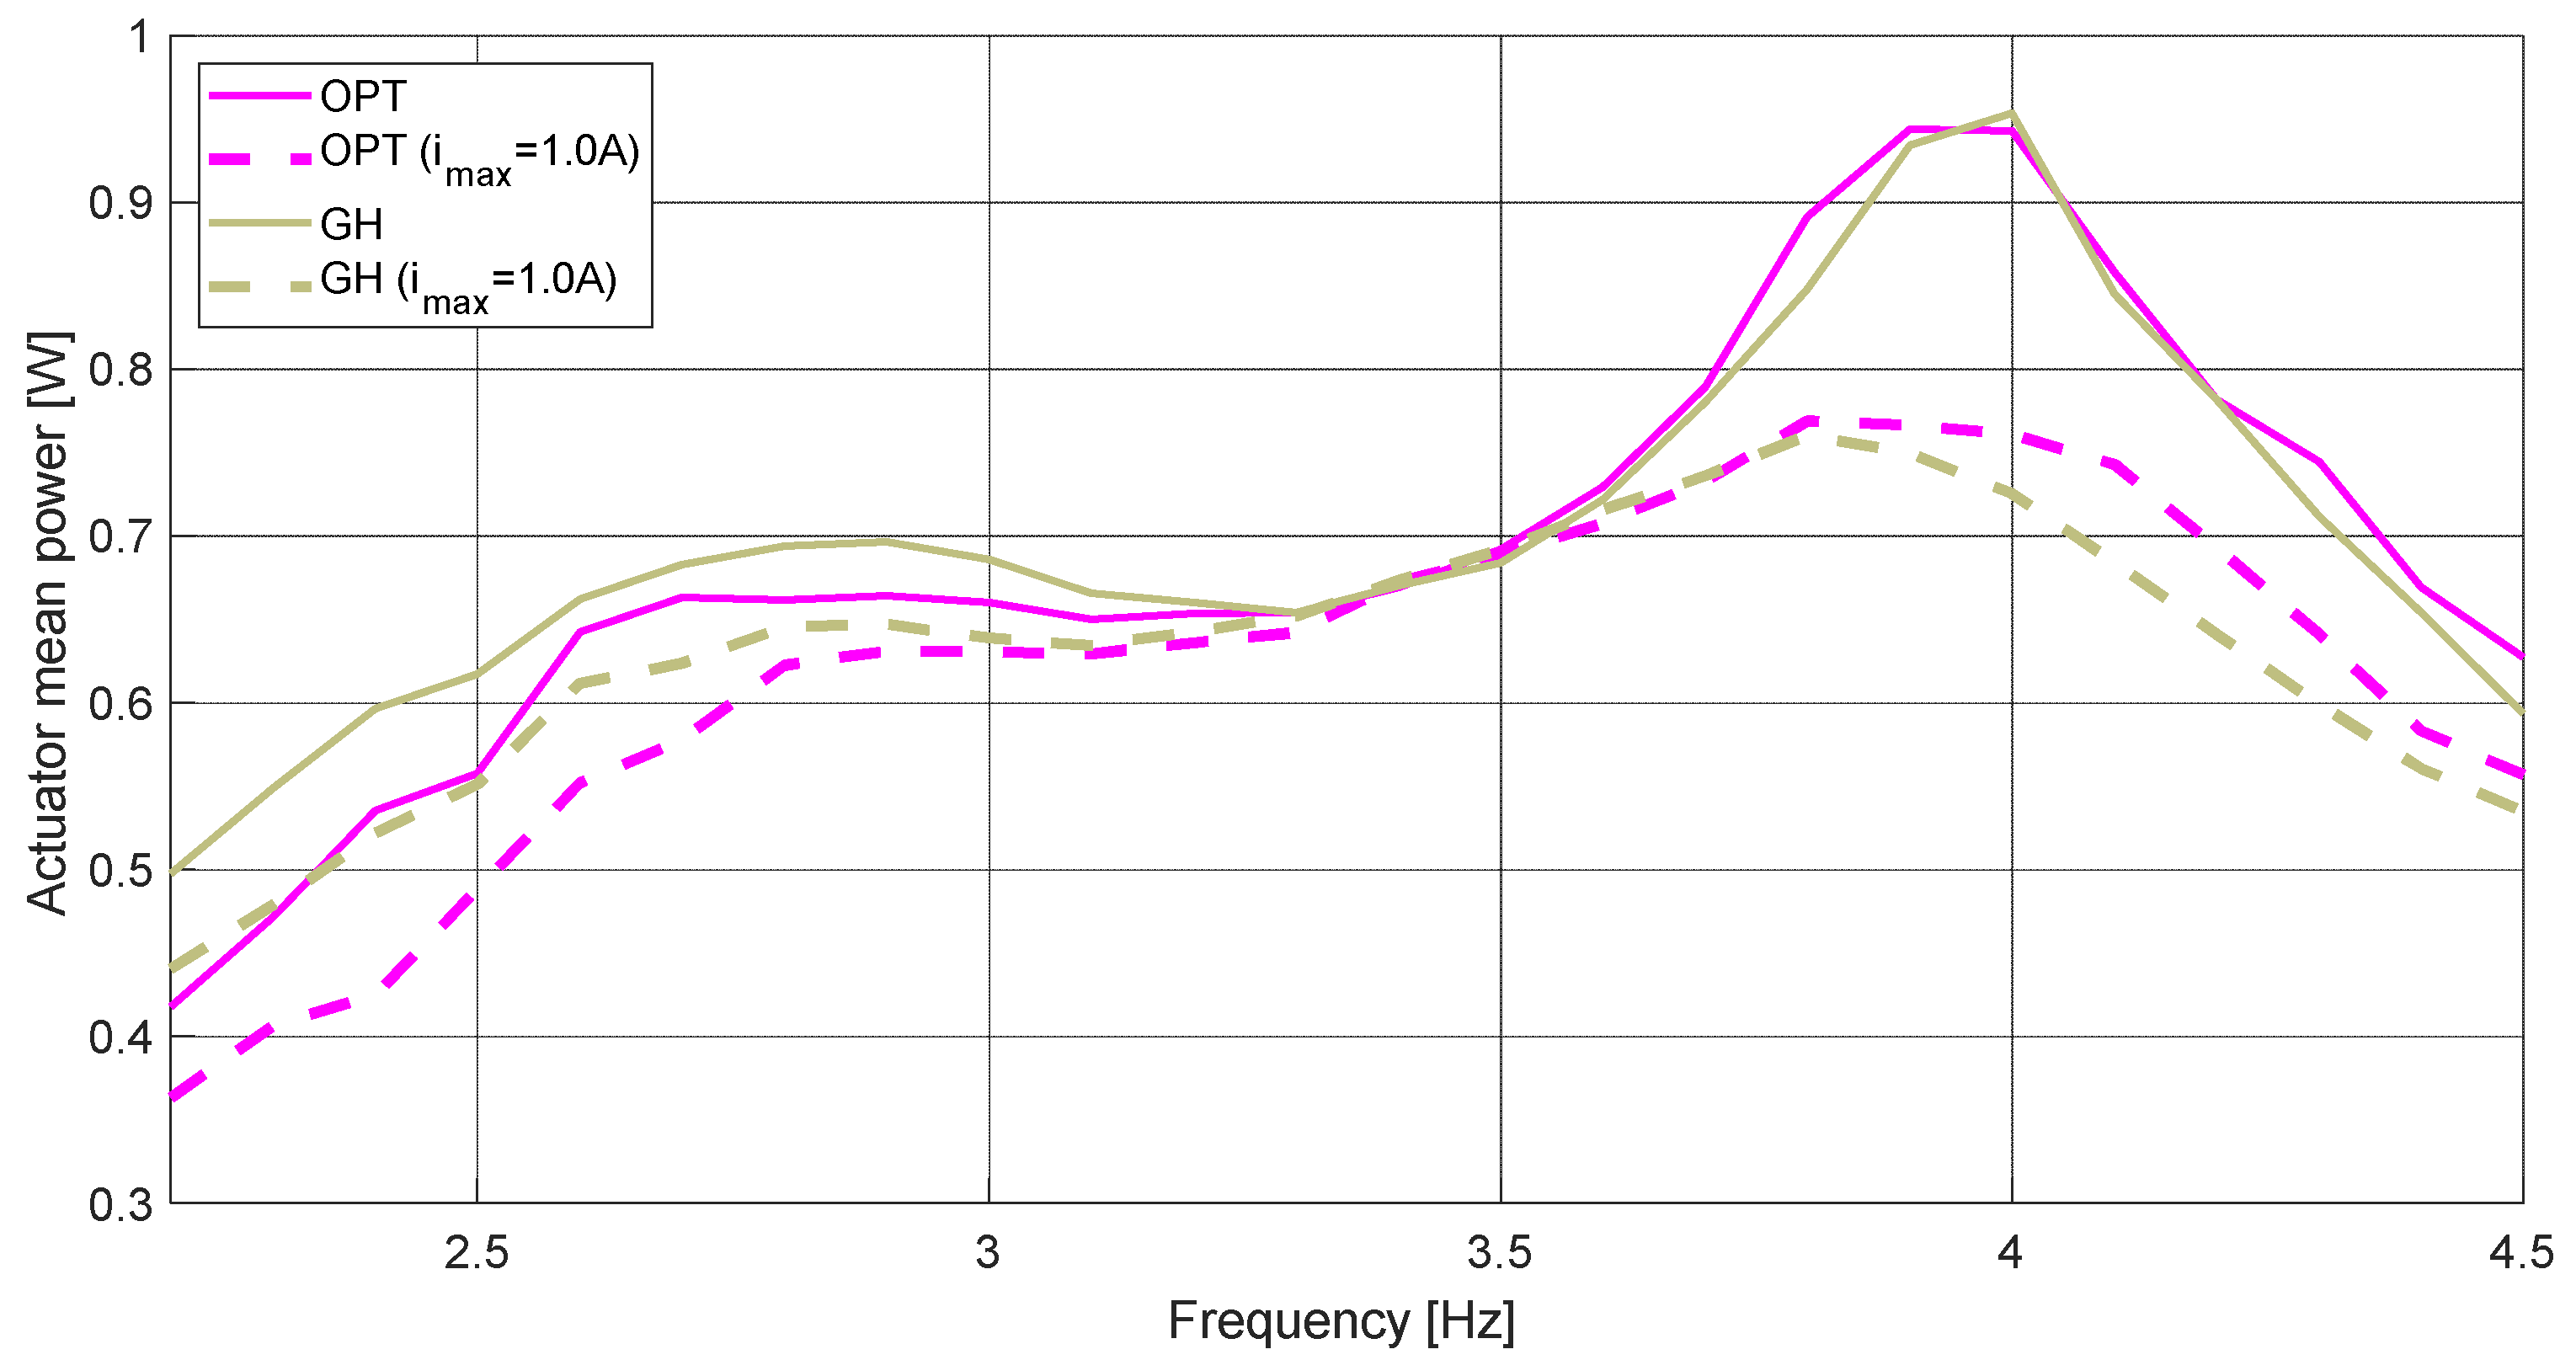
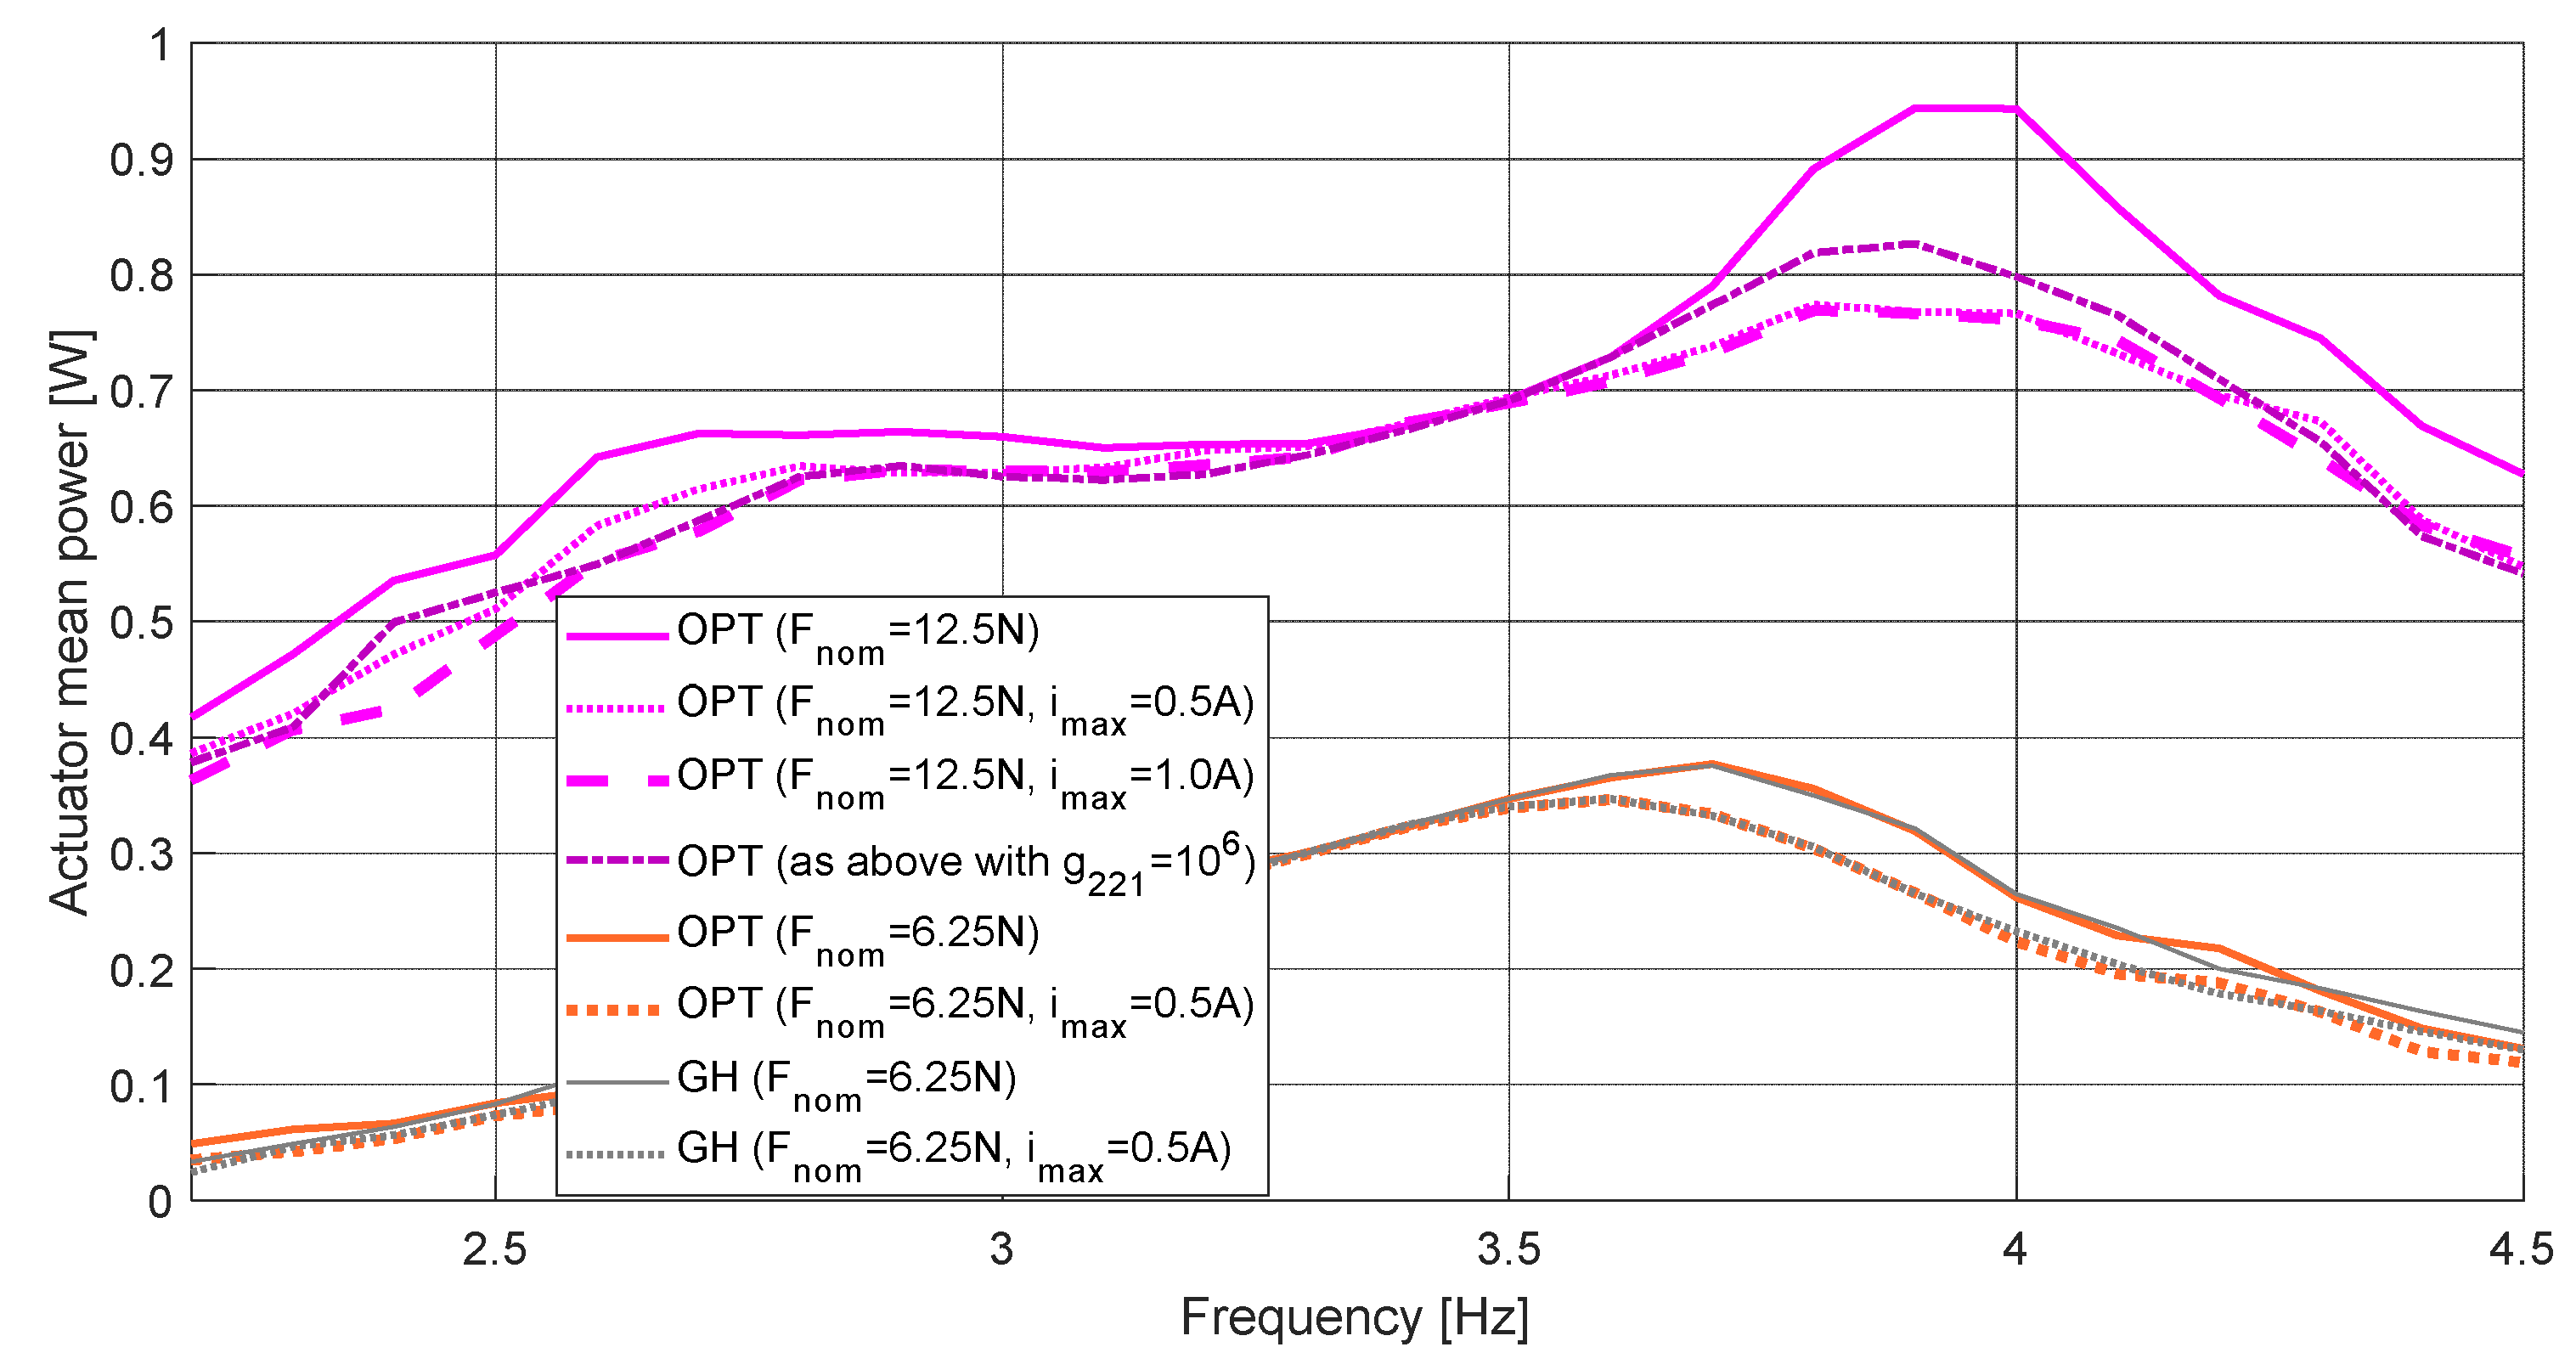
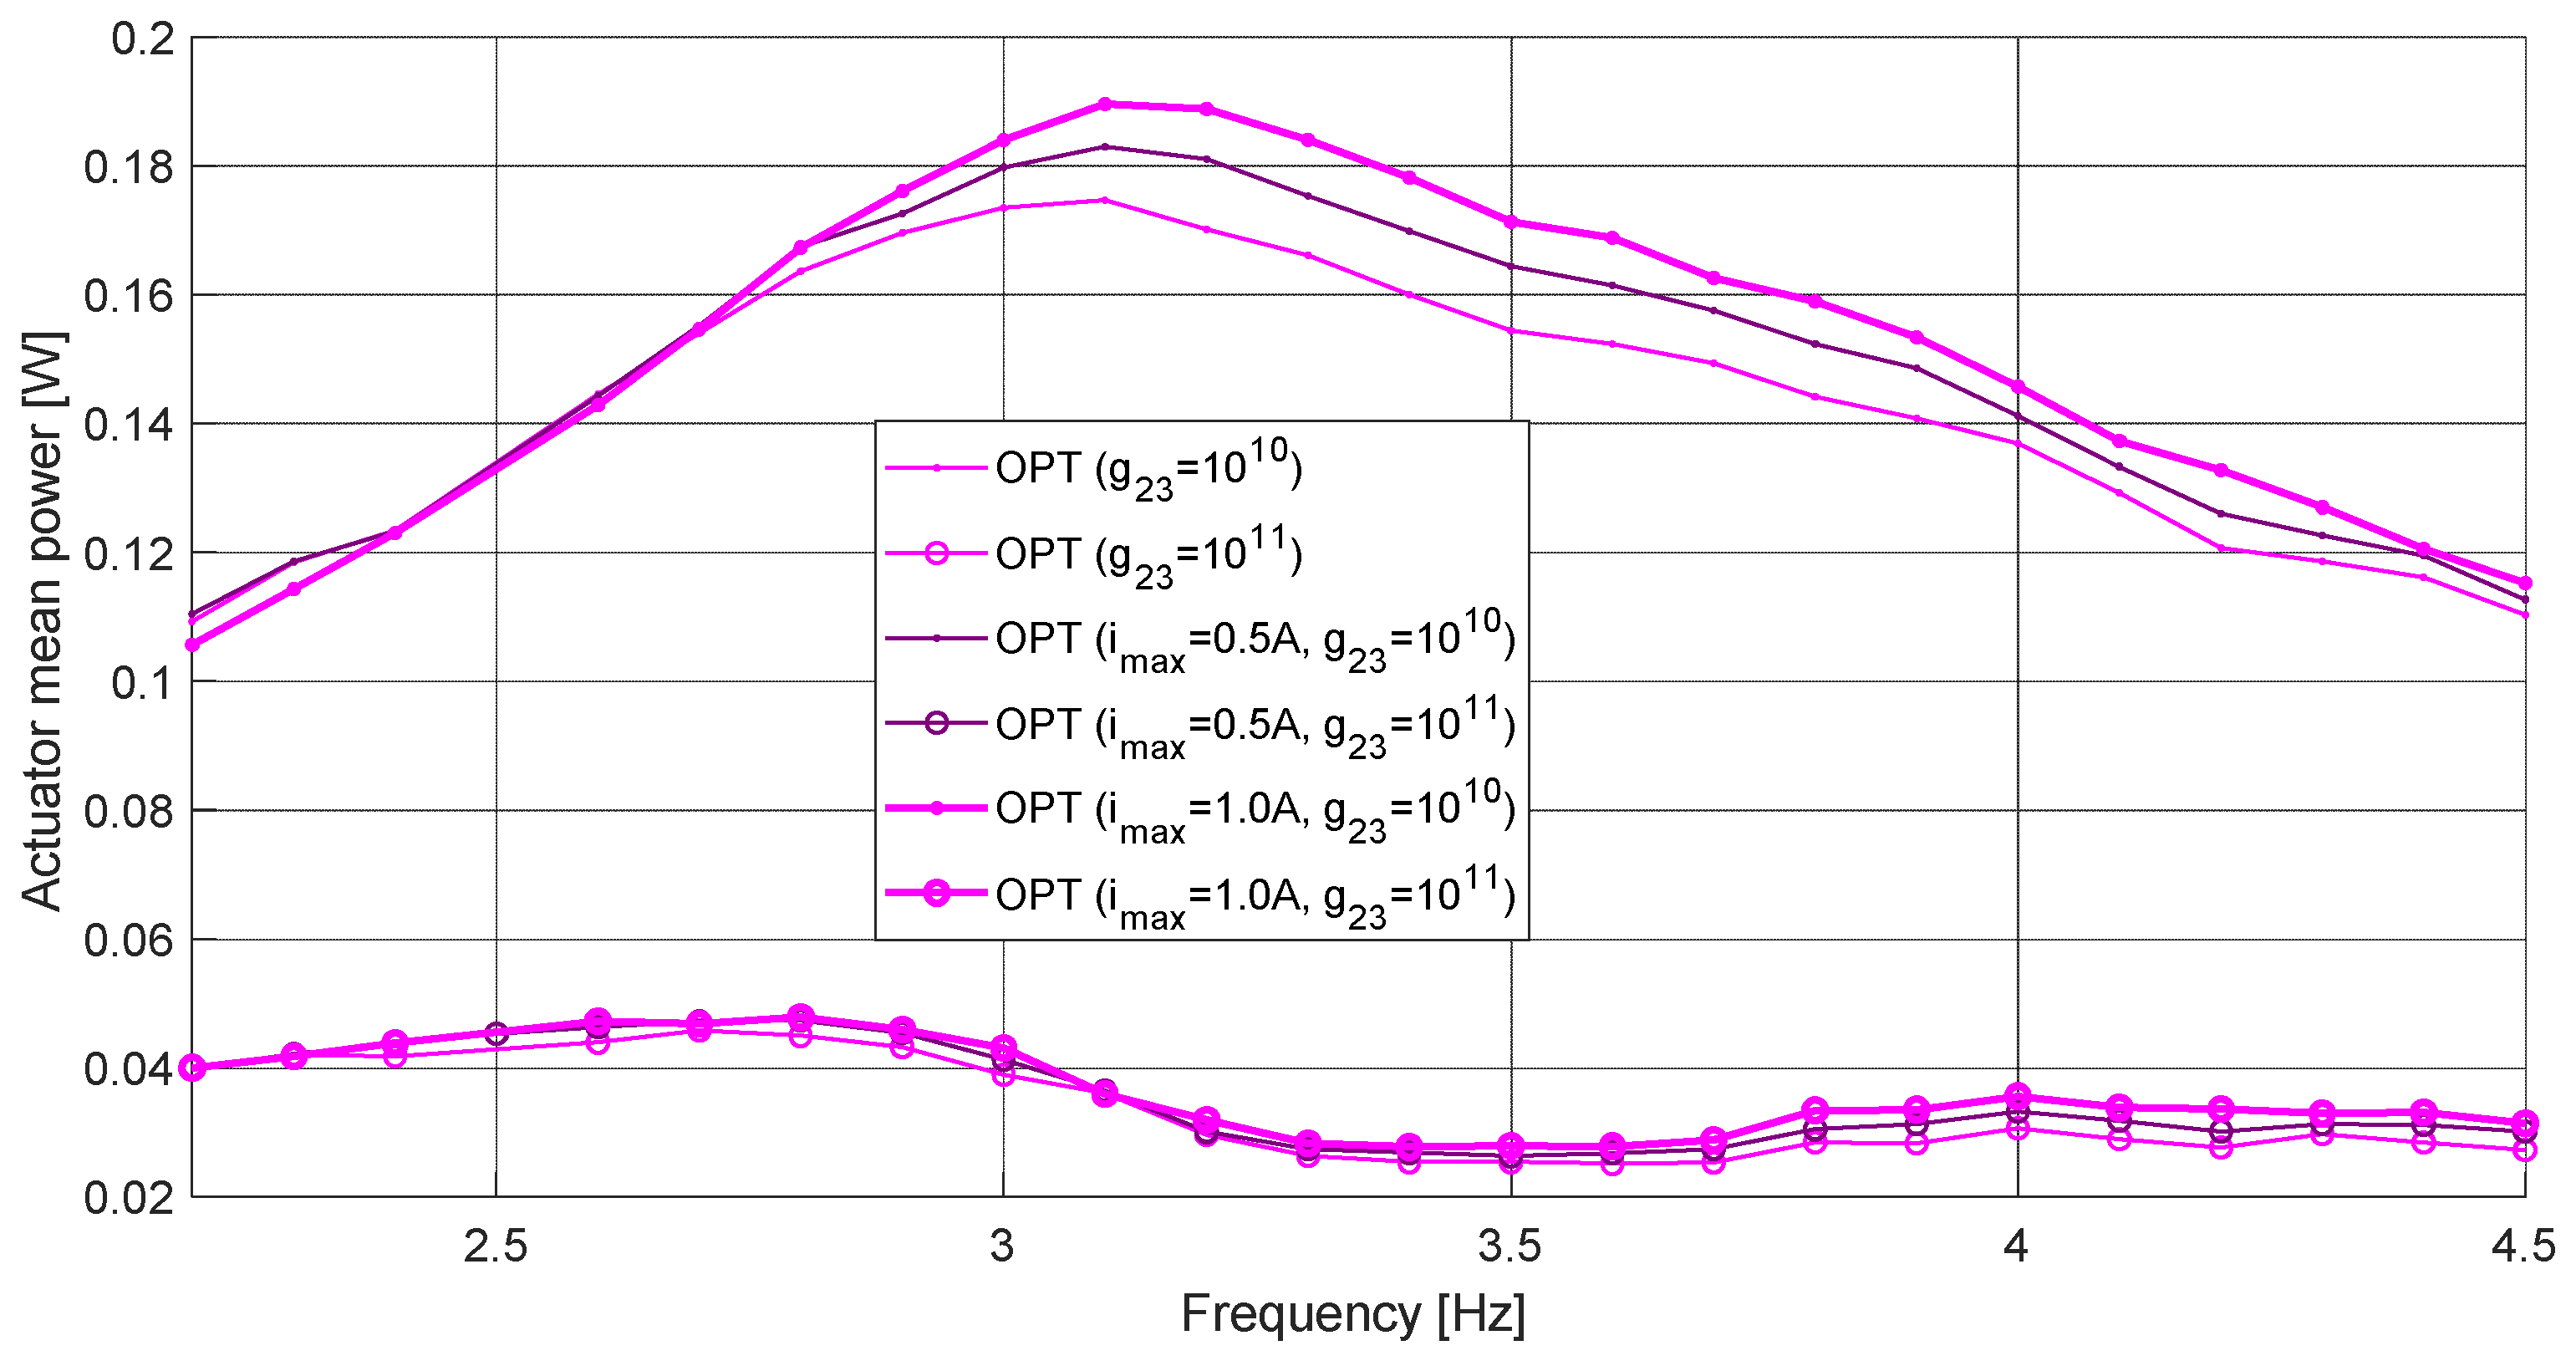
- minimise the actuator power in addition to the case I objectives (to account for the actuator’s energy constraints).
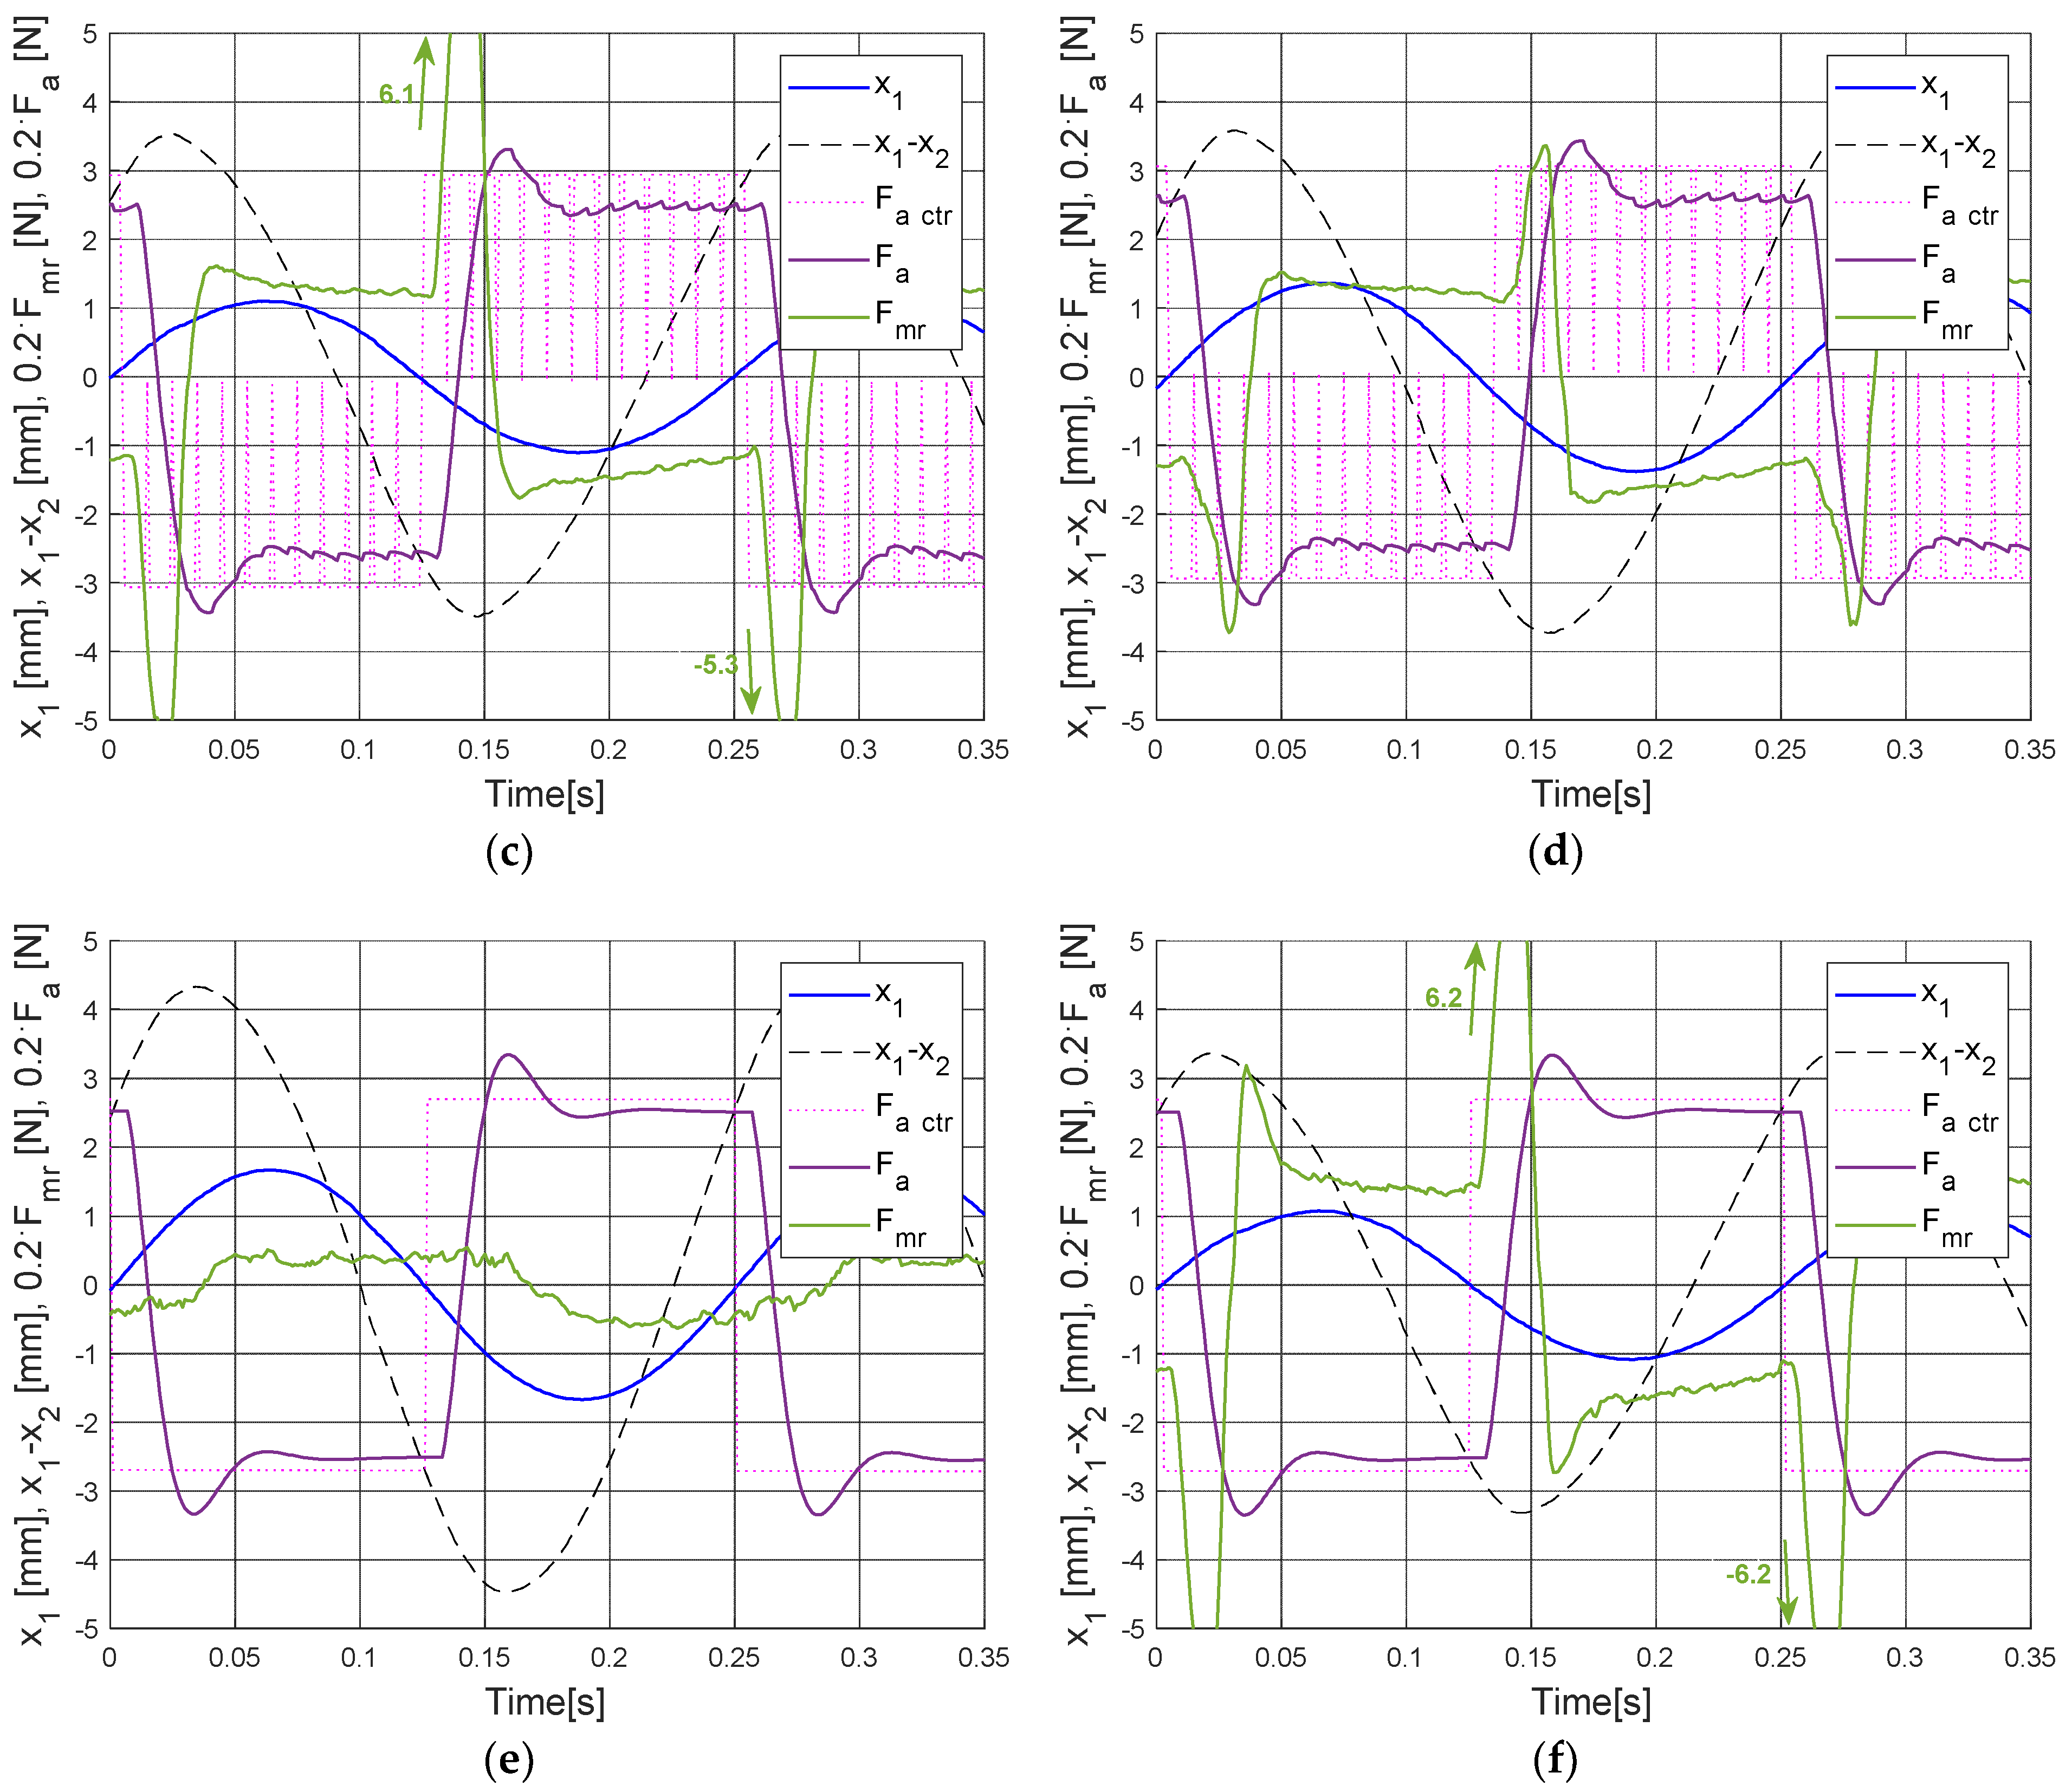
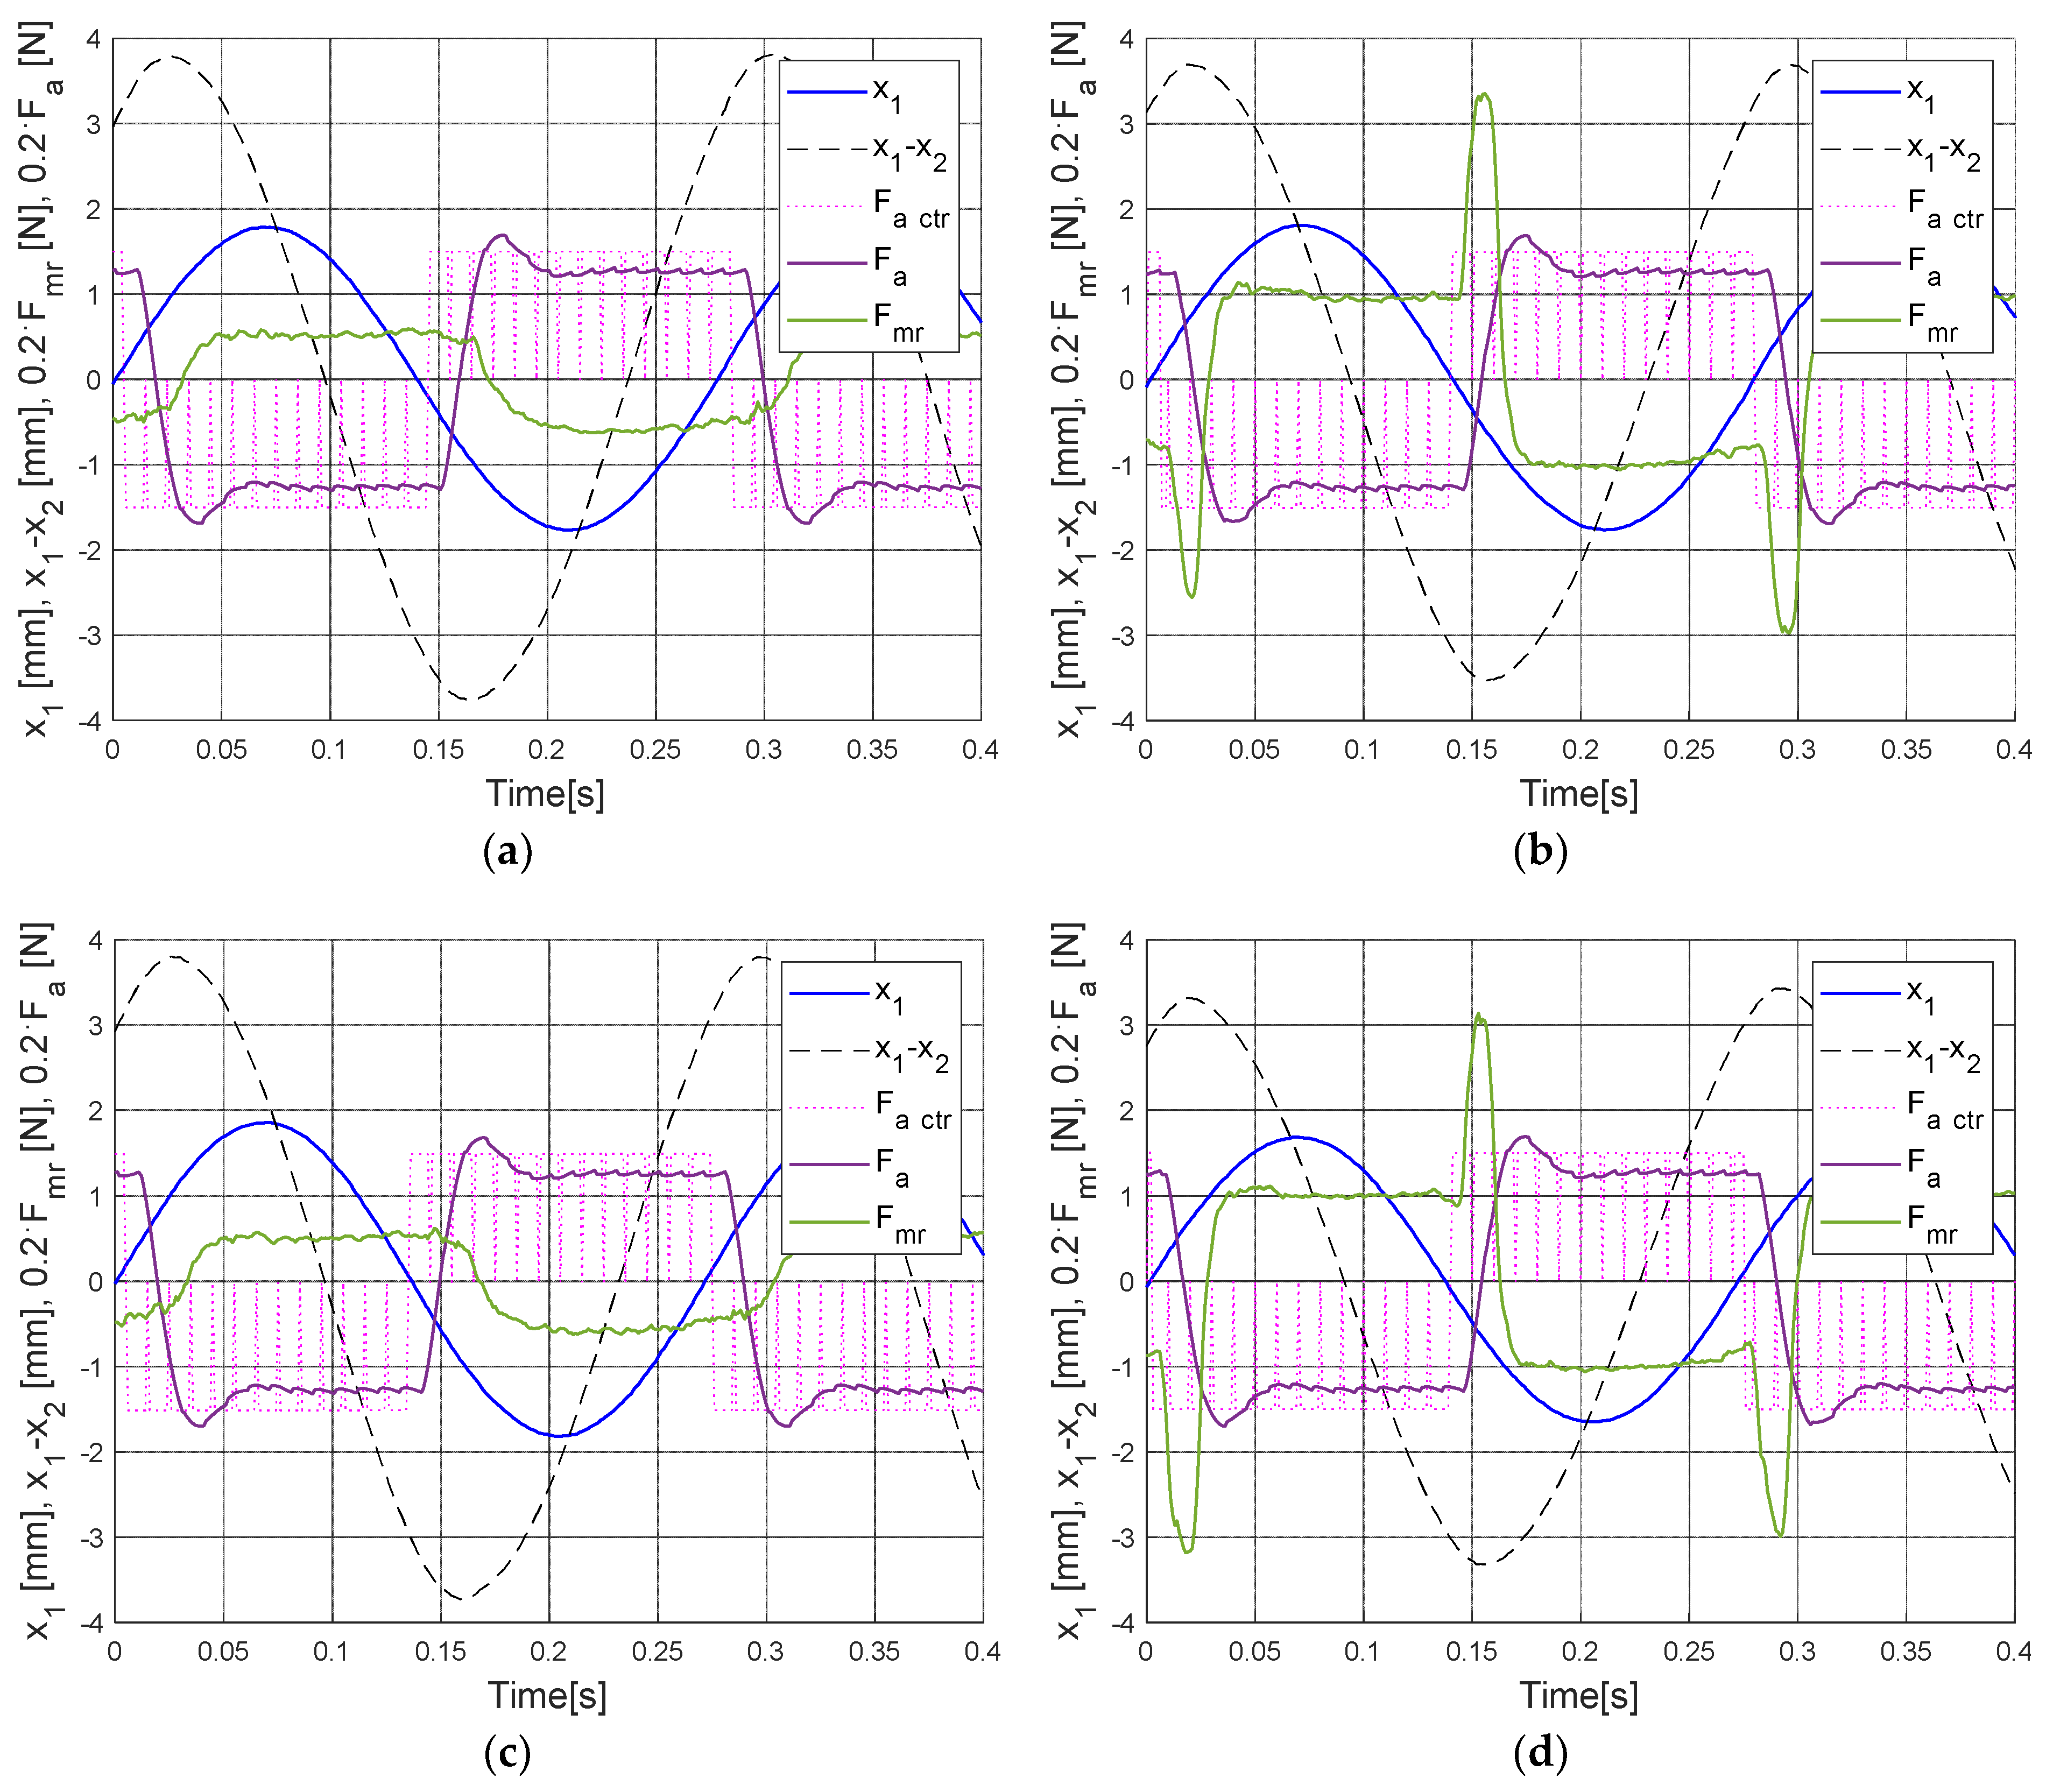
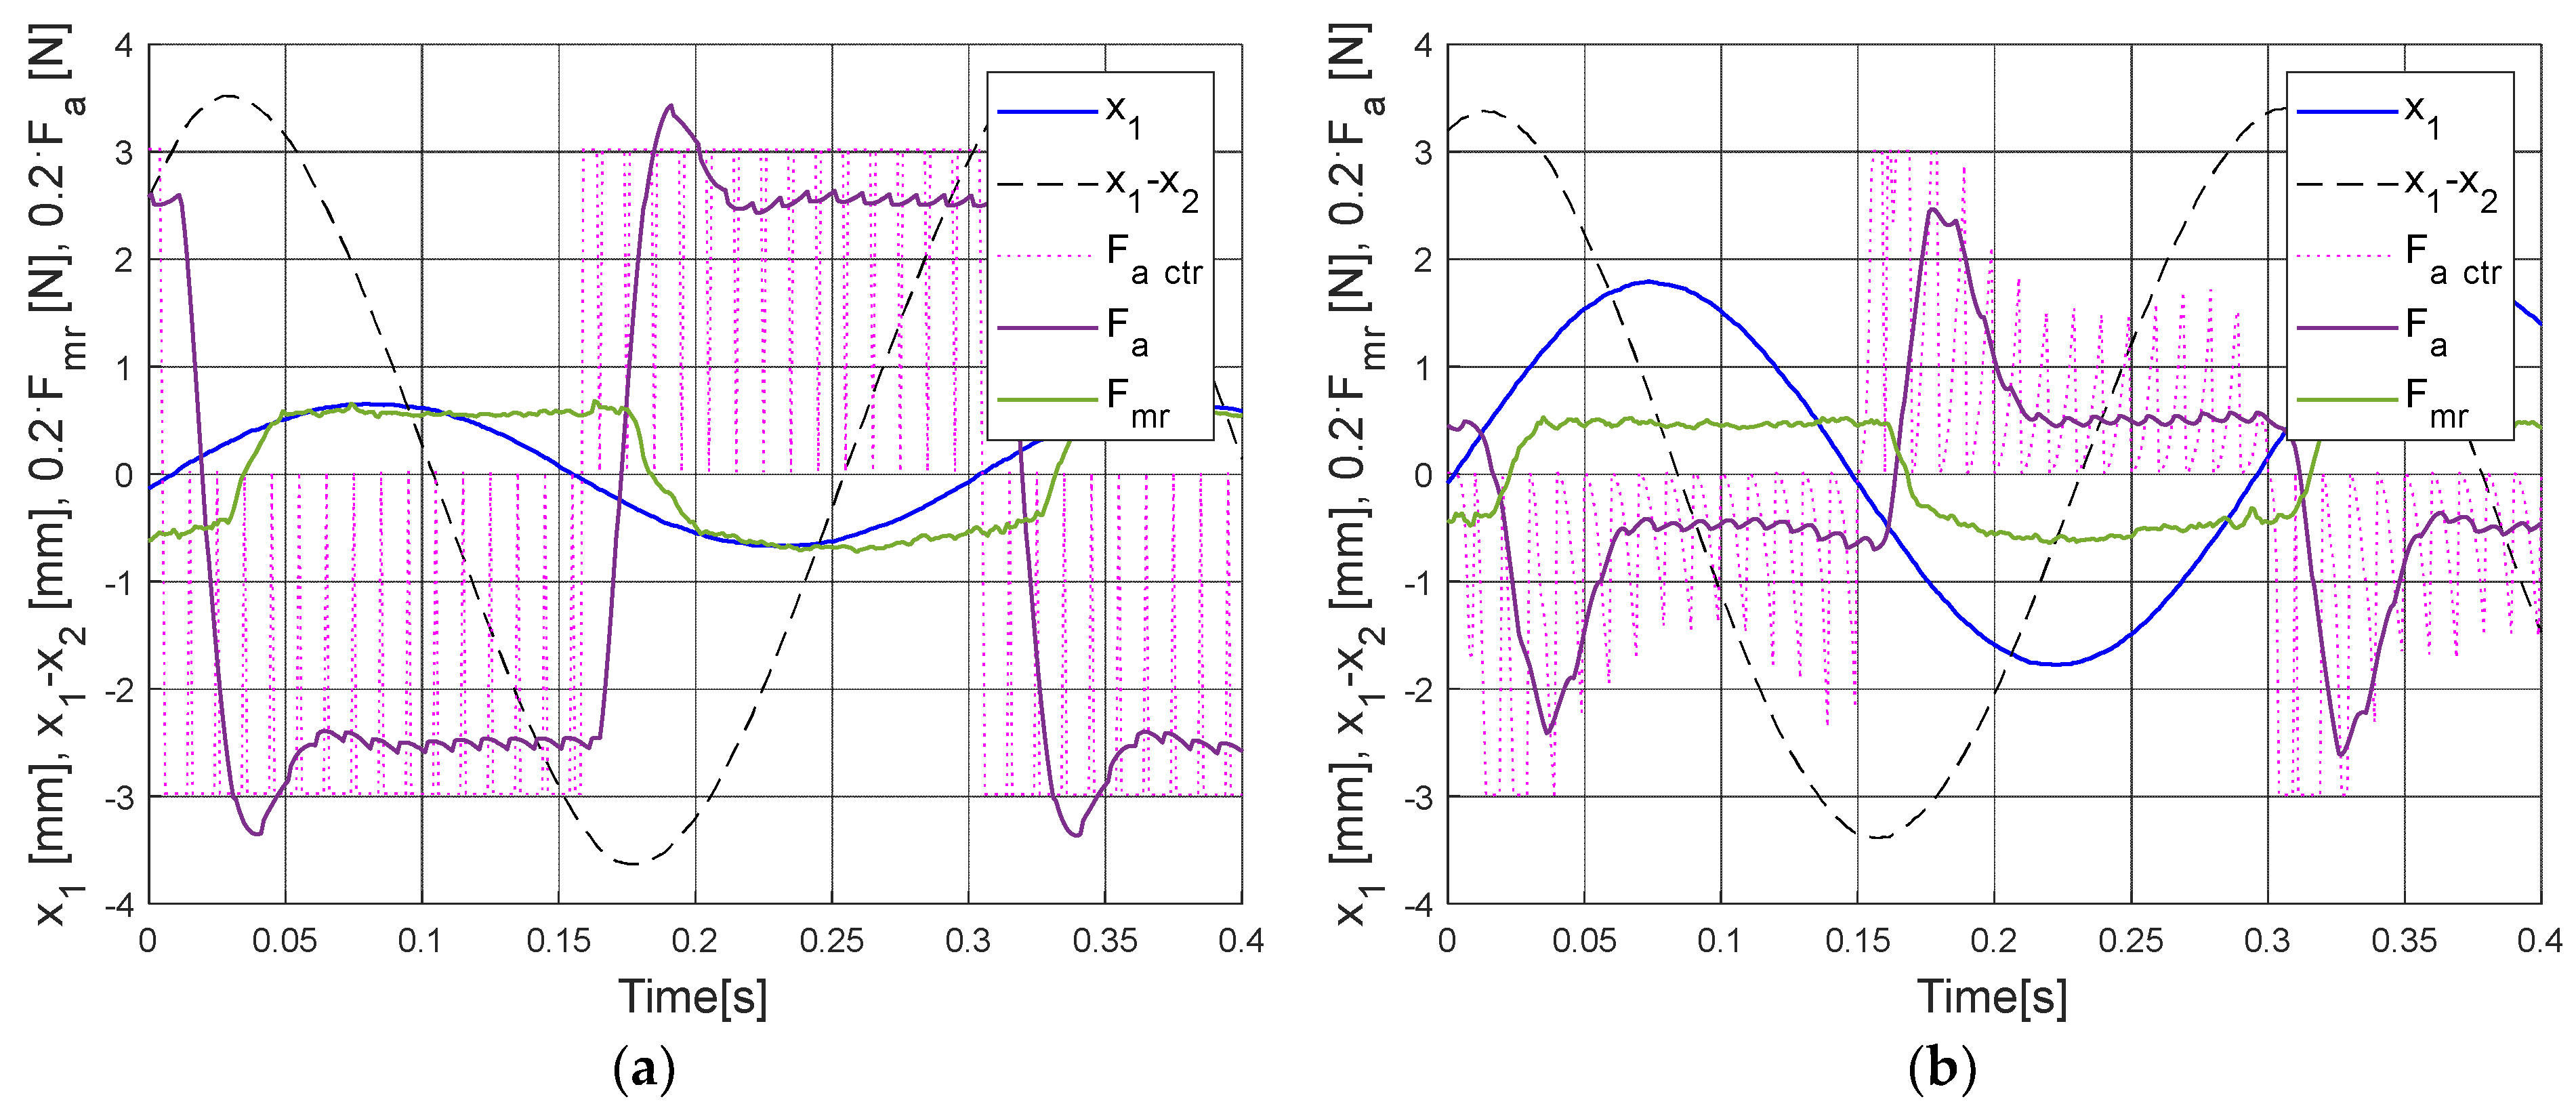
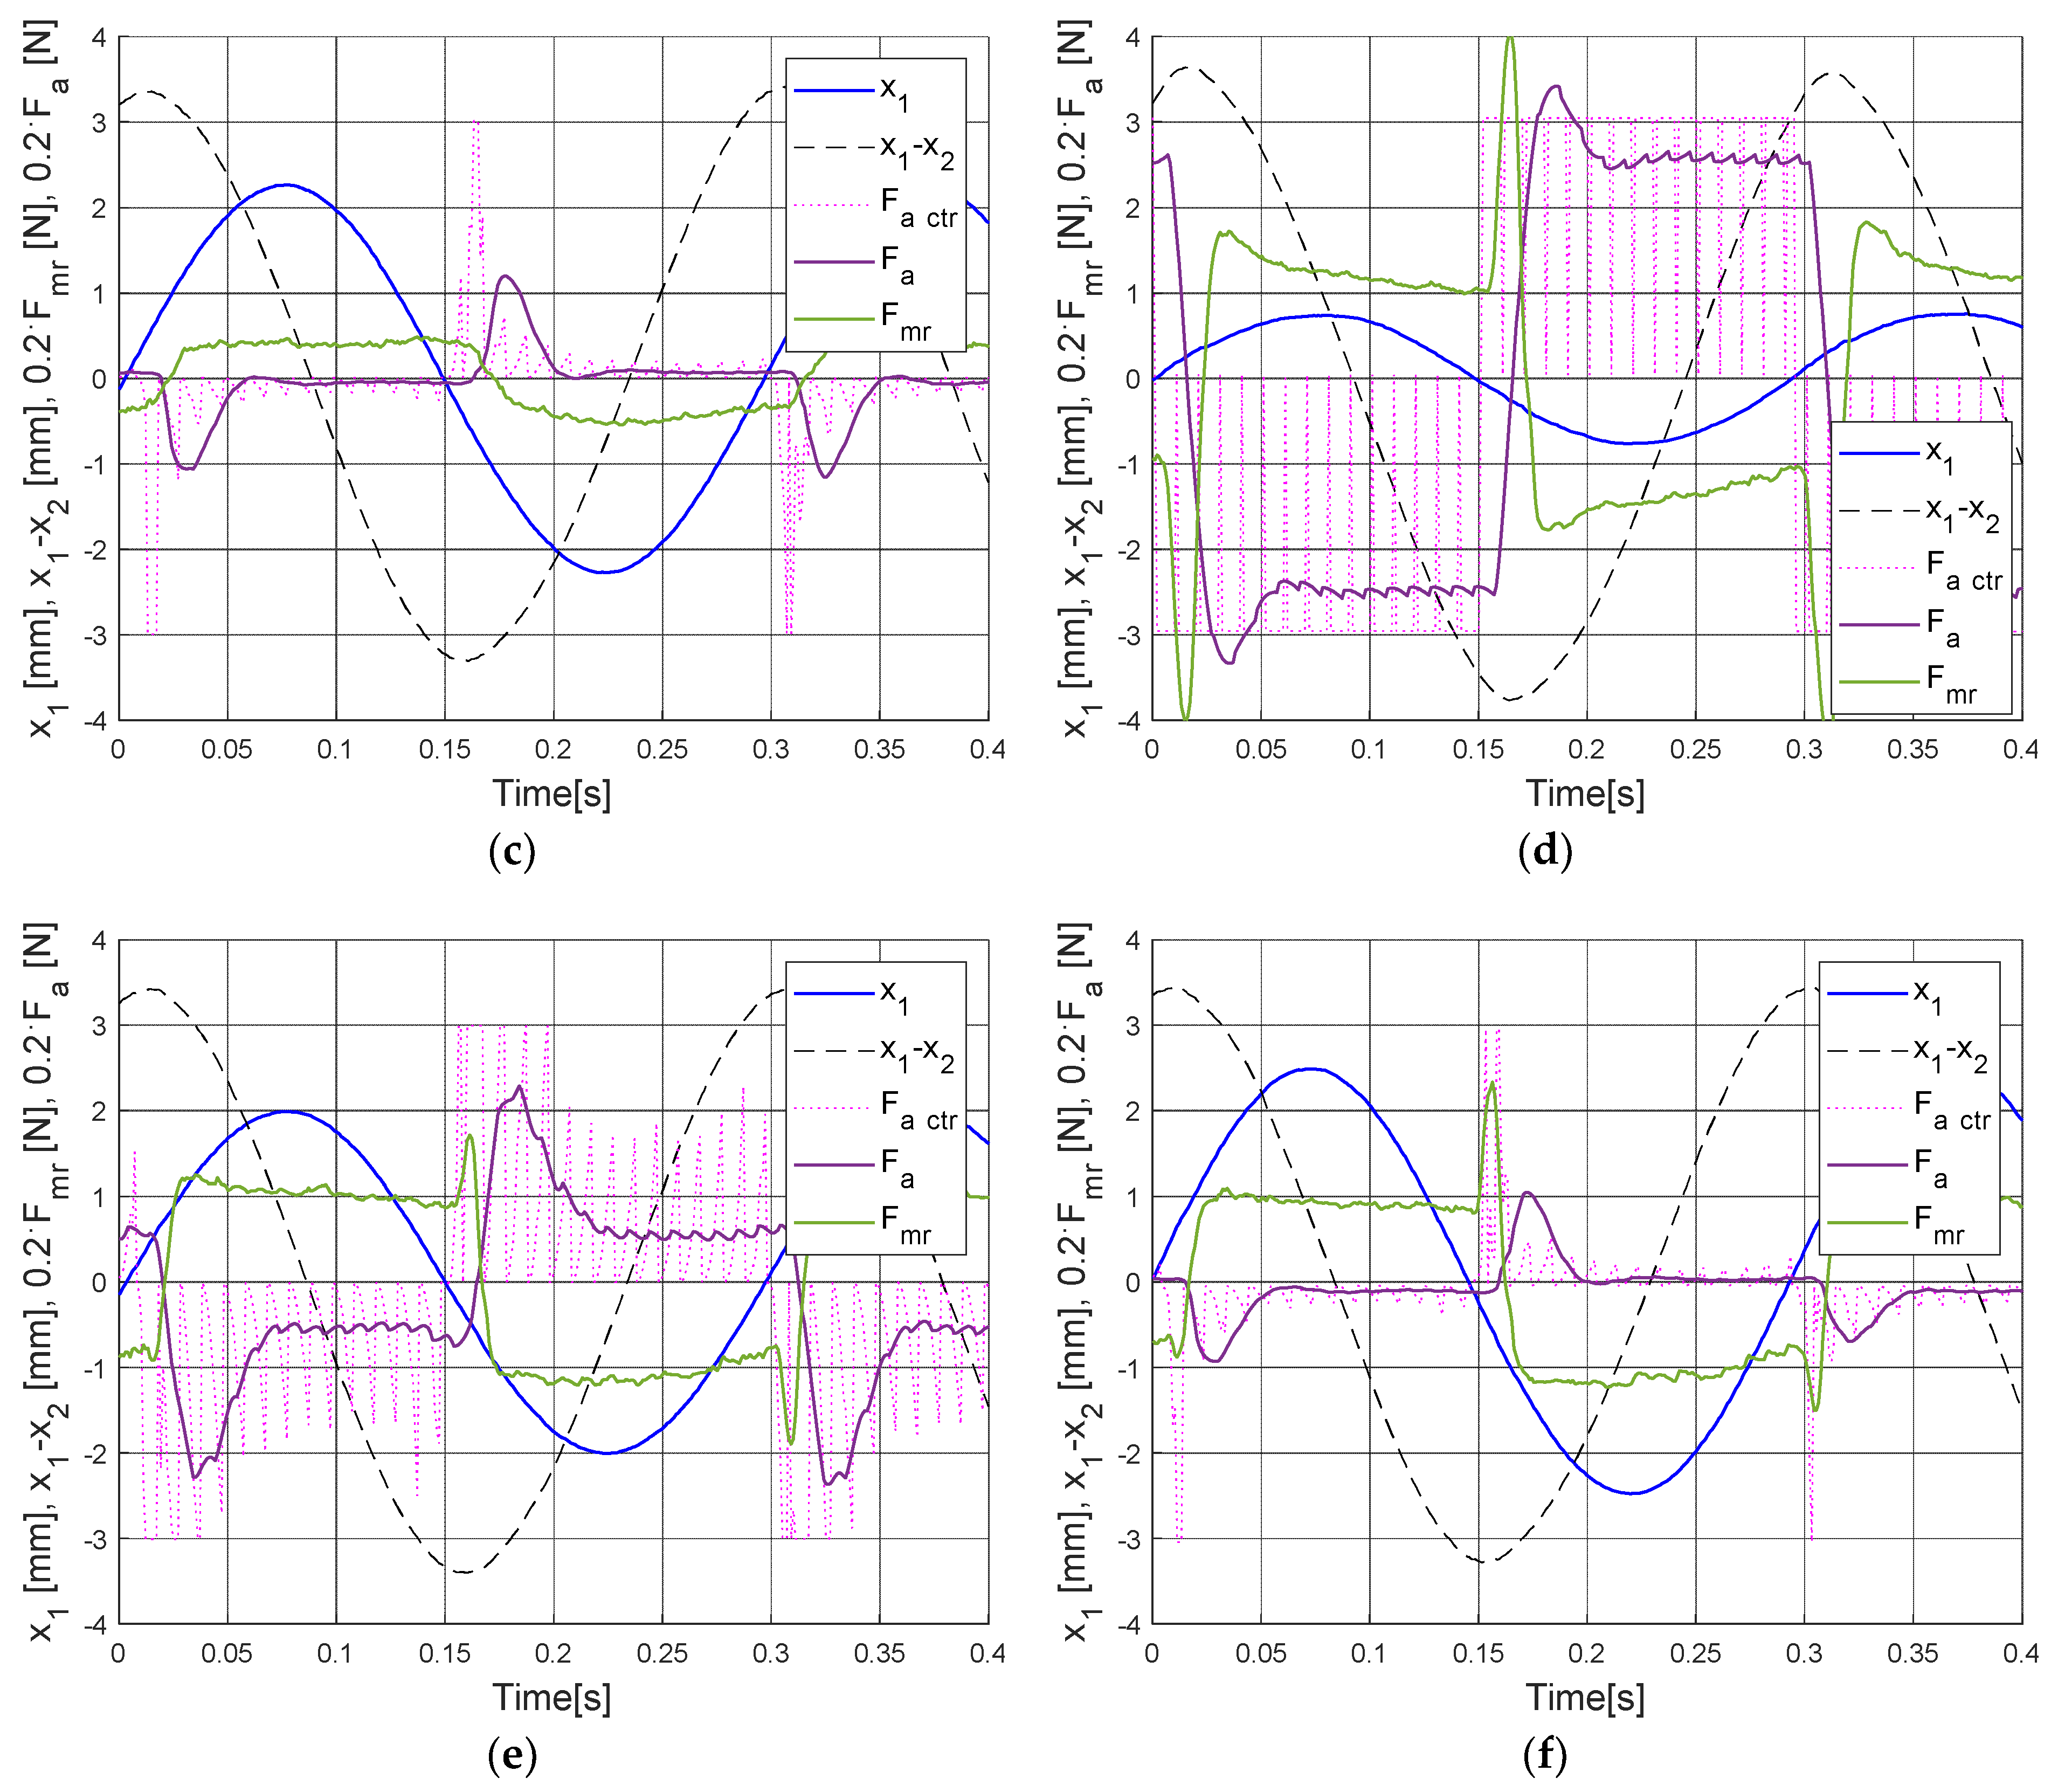
7. Real-Time Control Results
- (1)
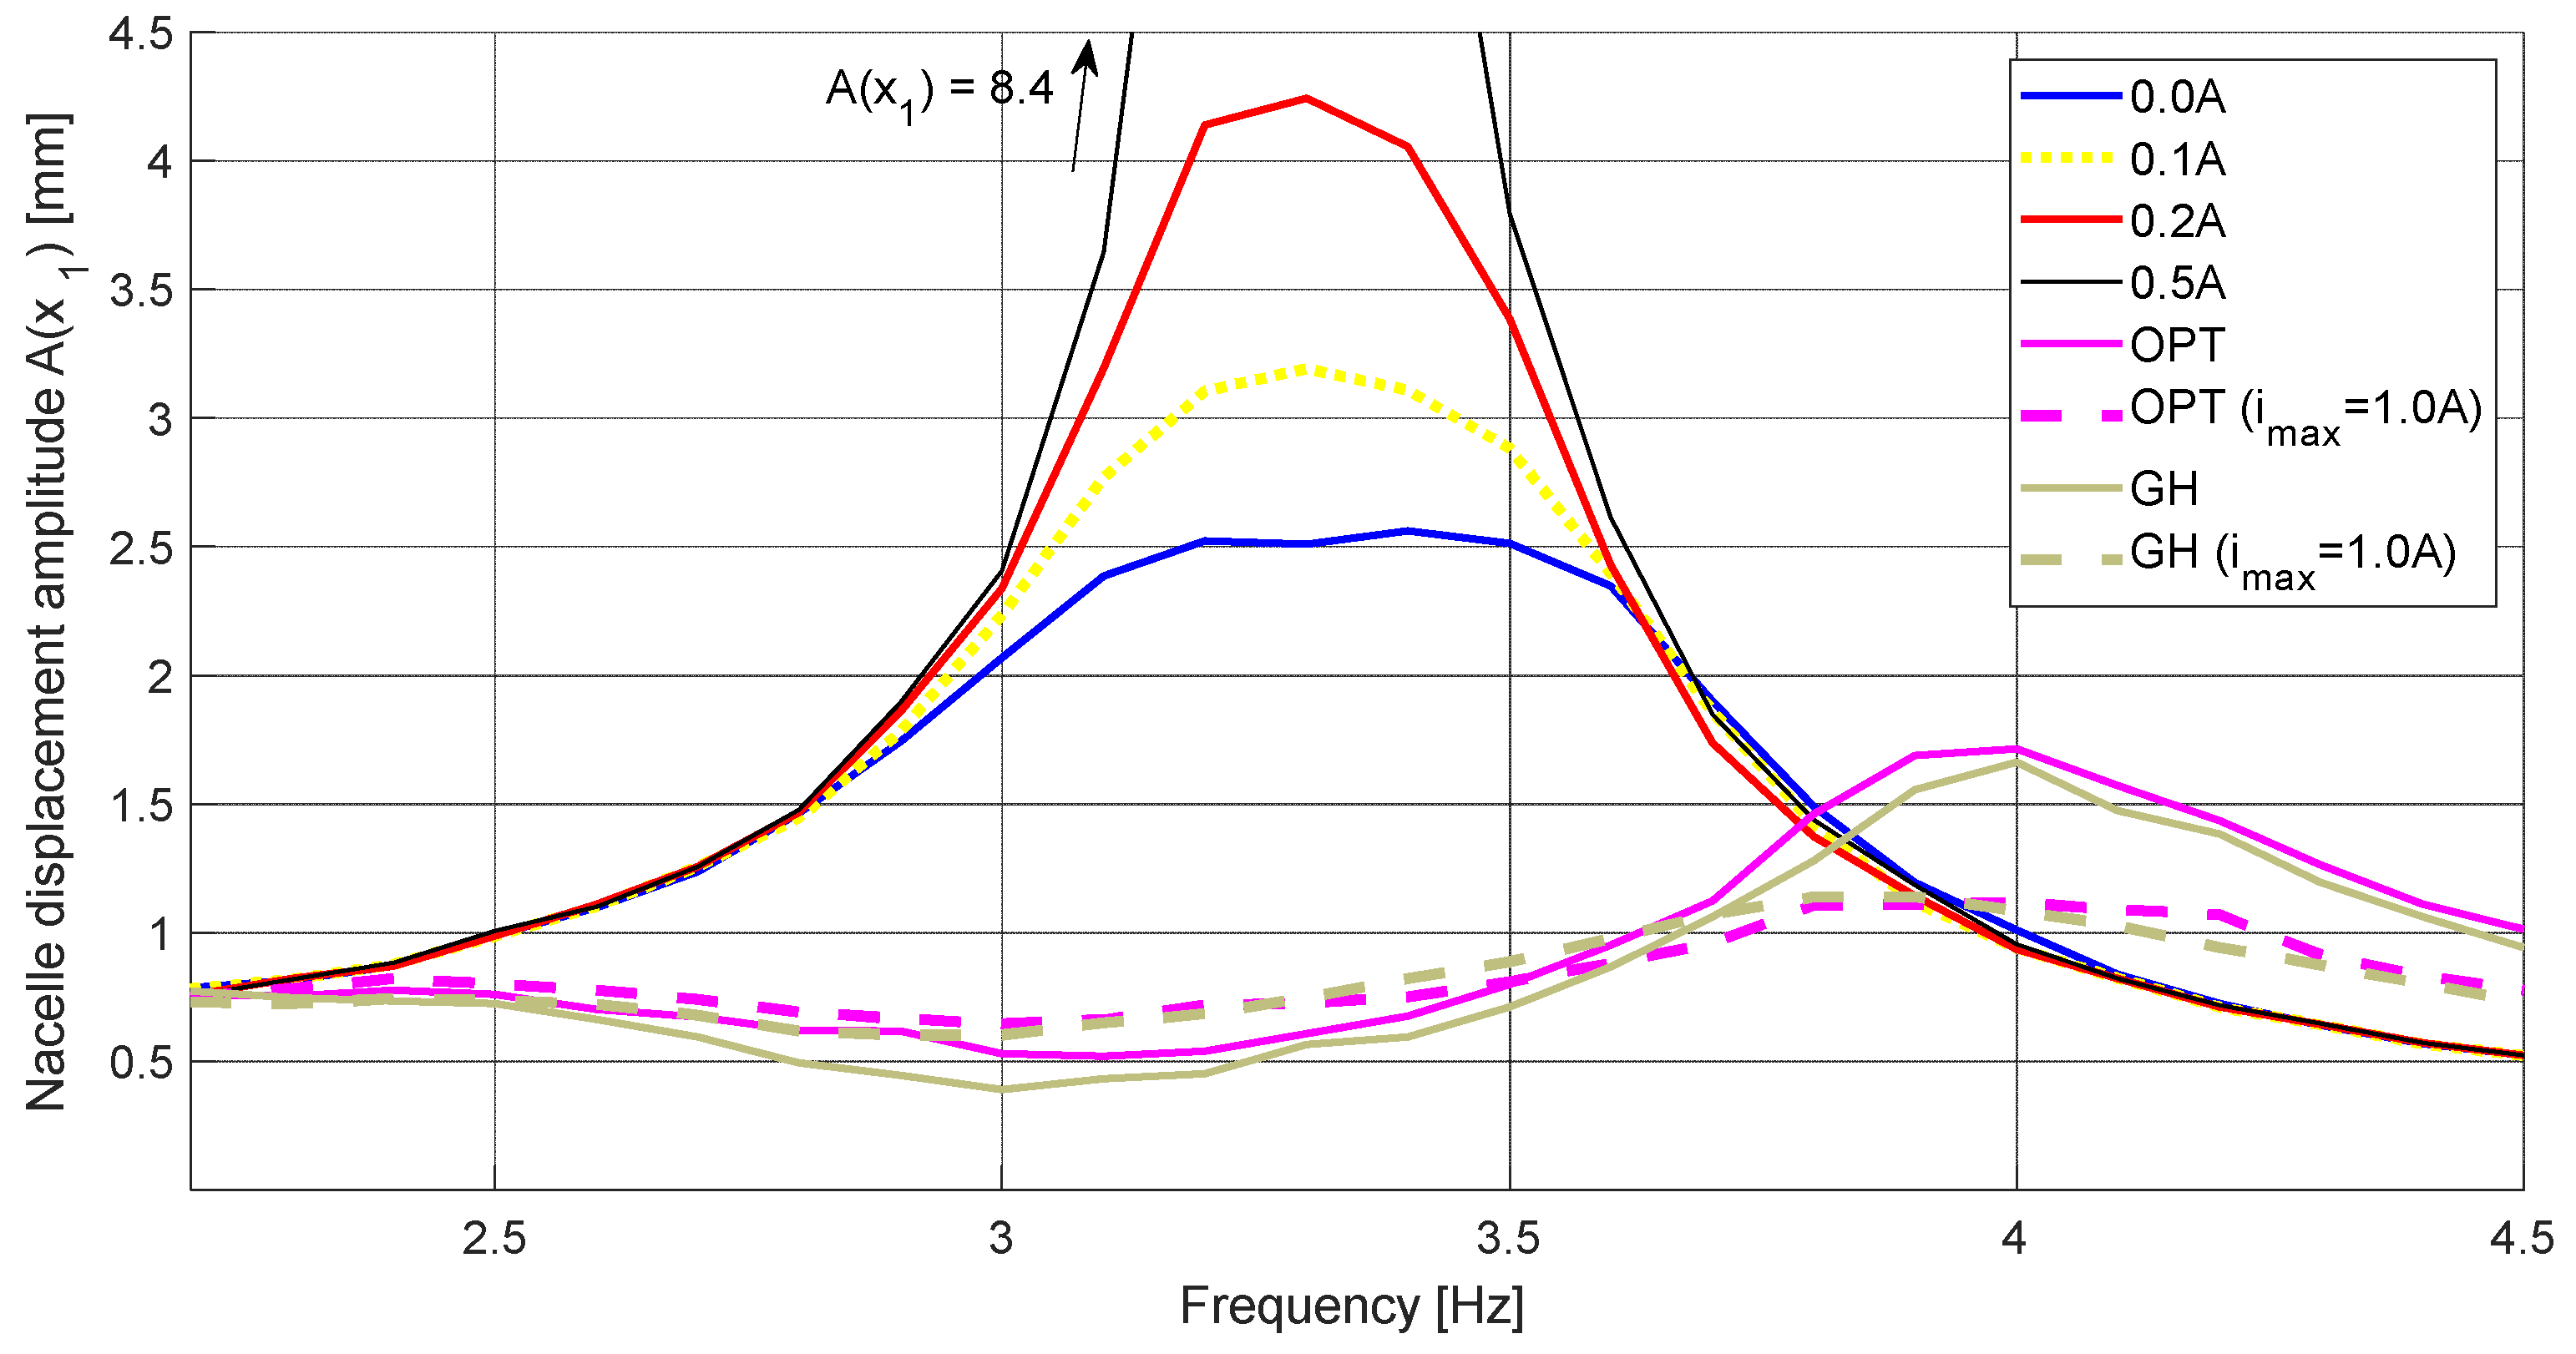
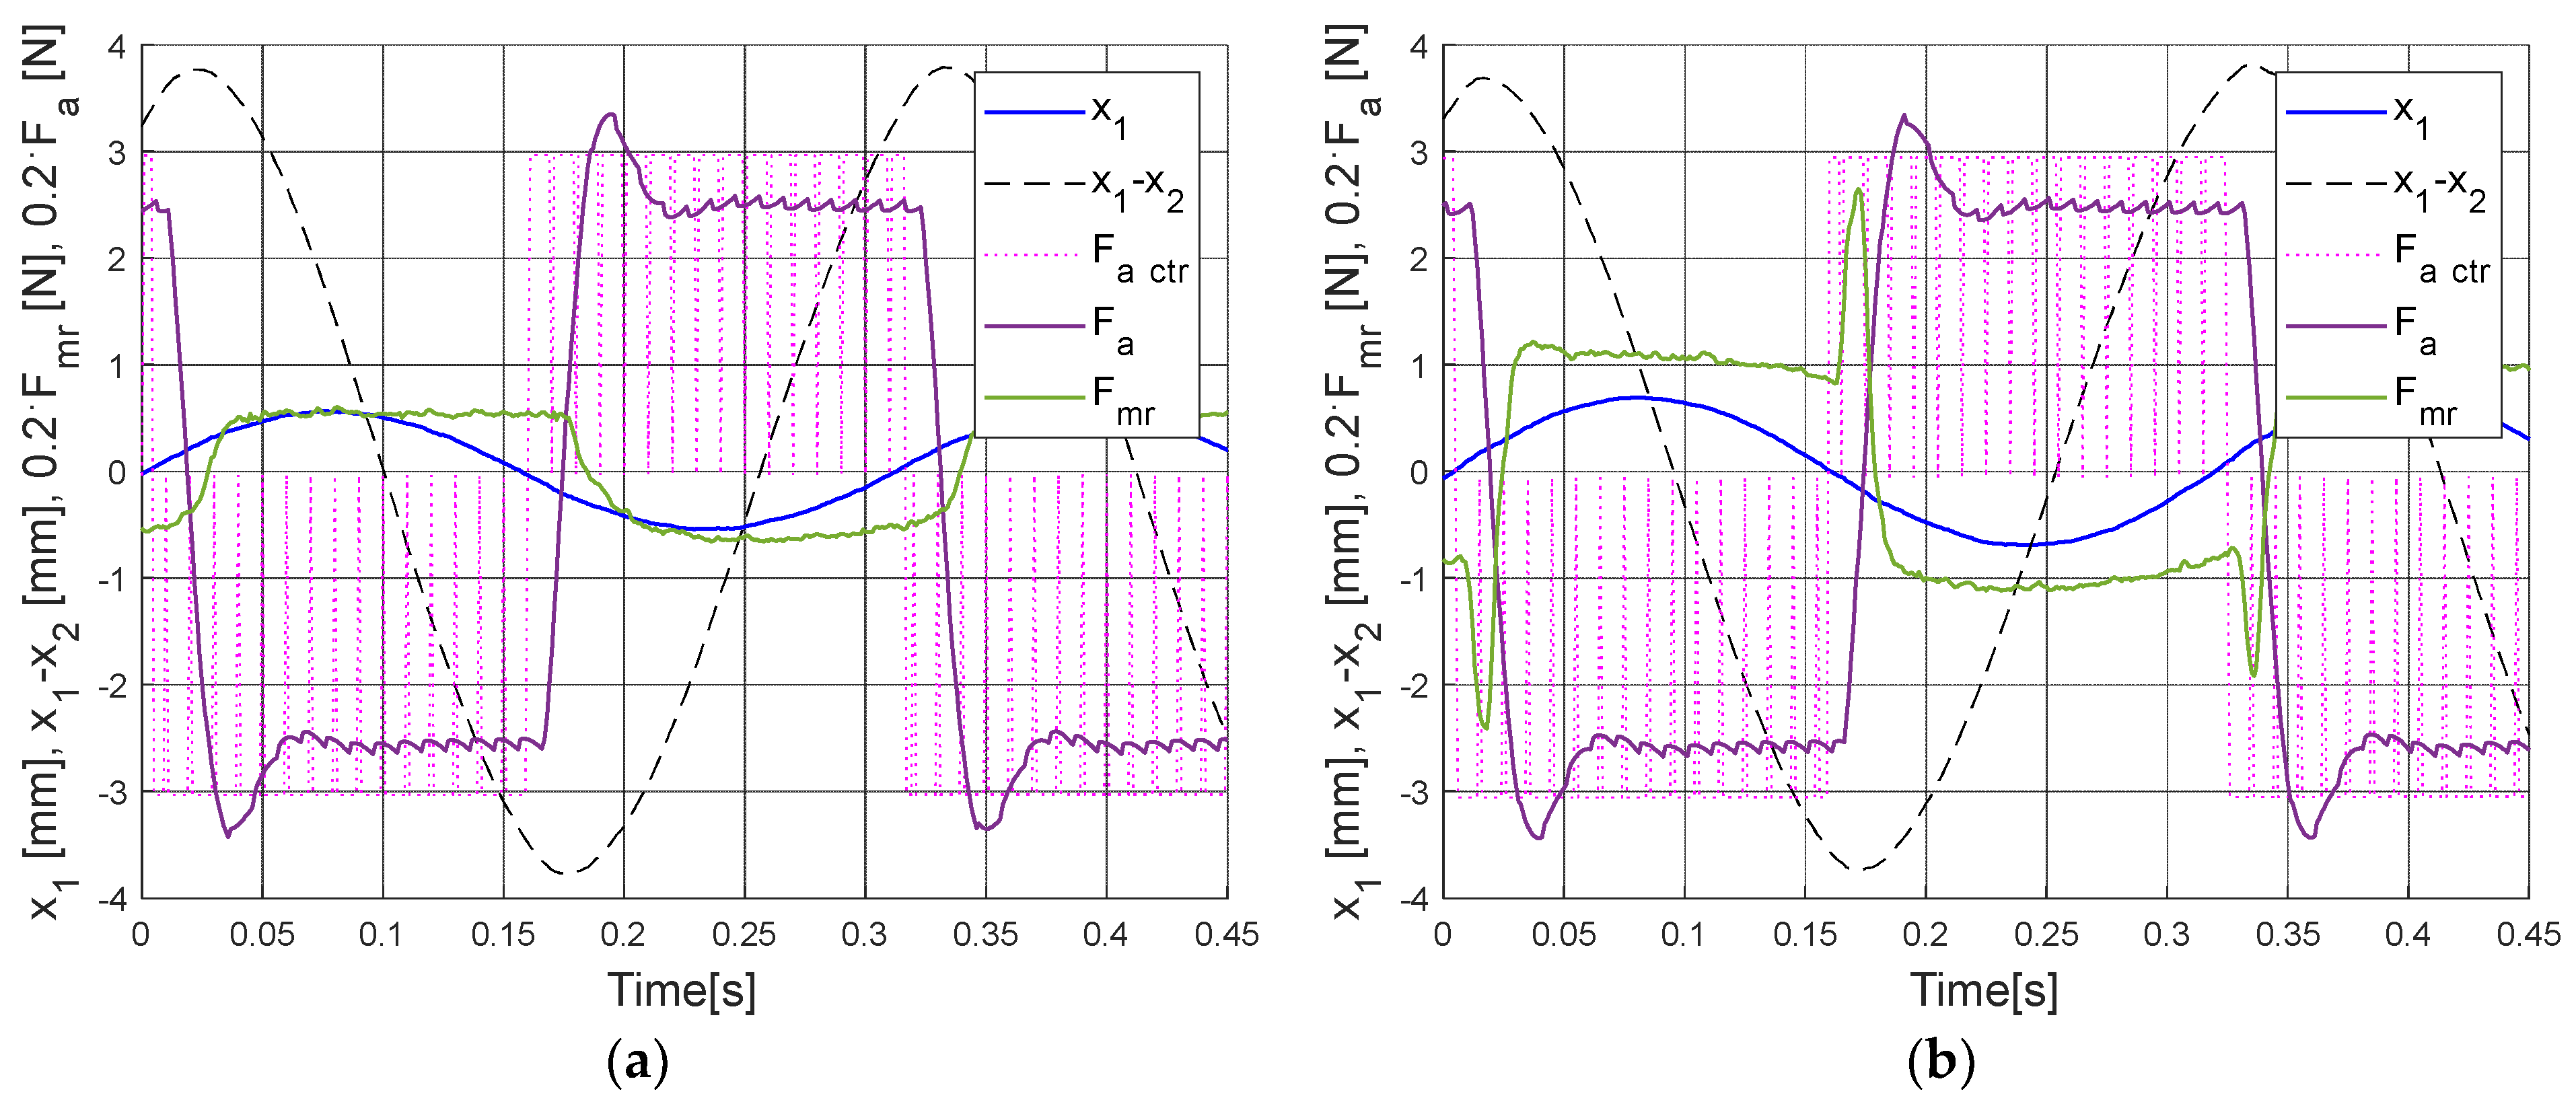
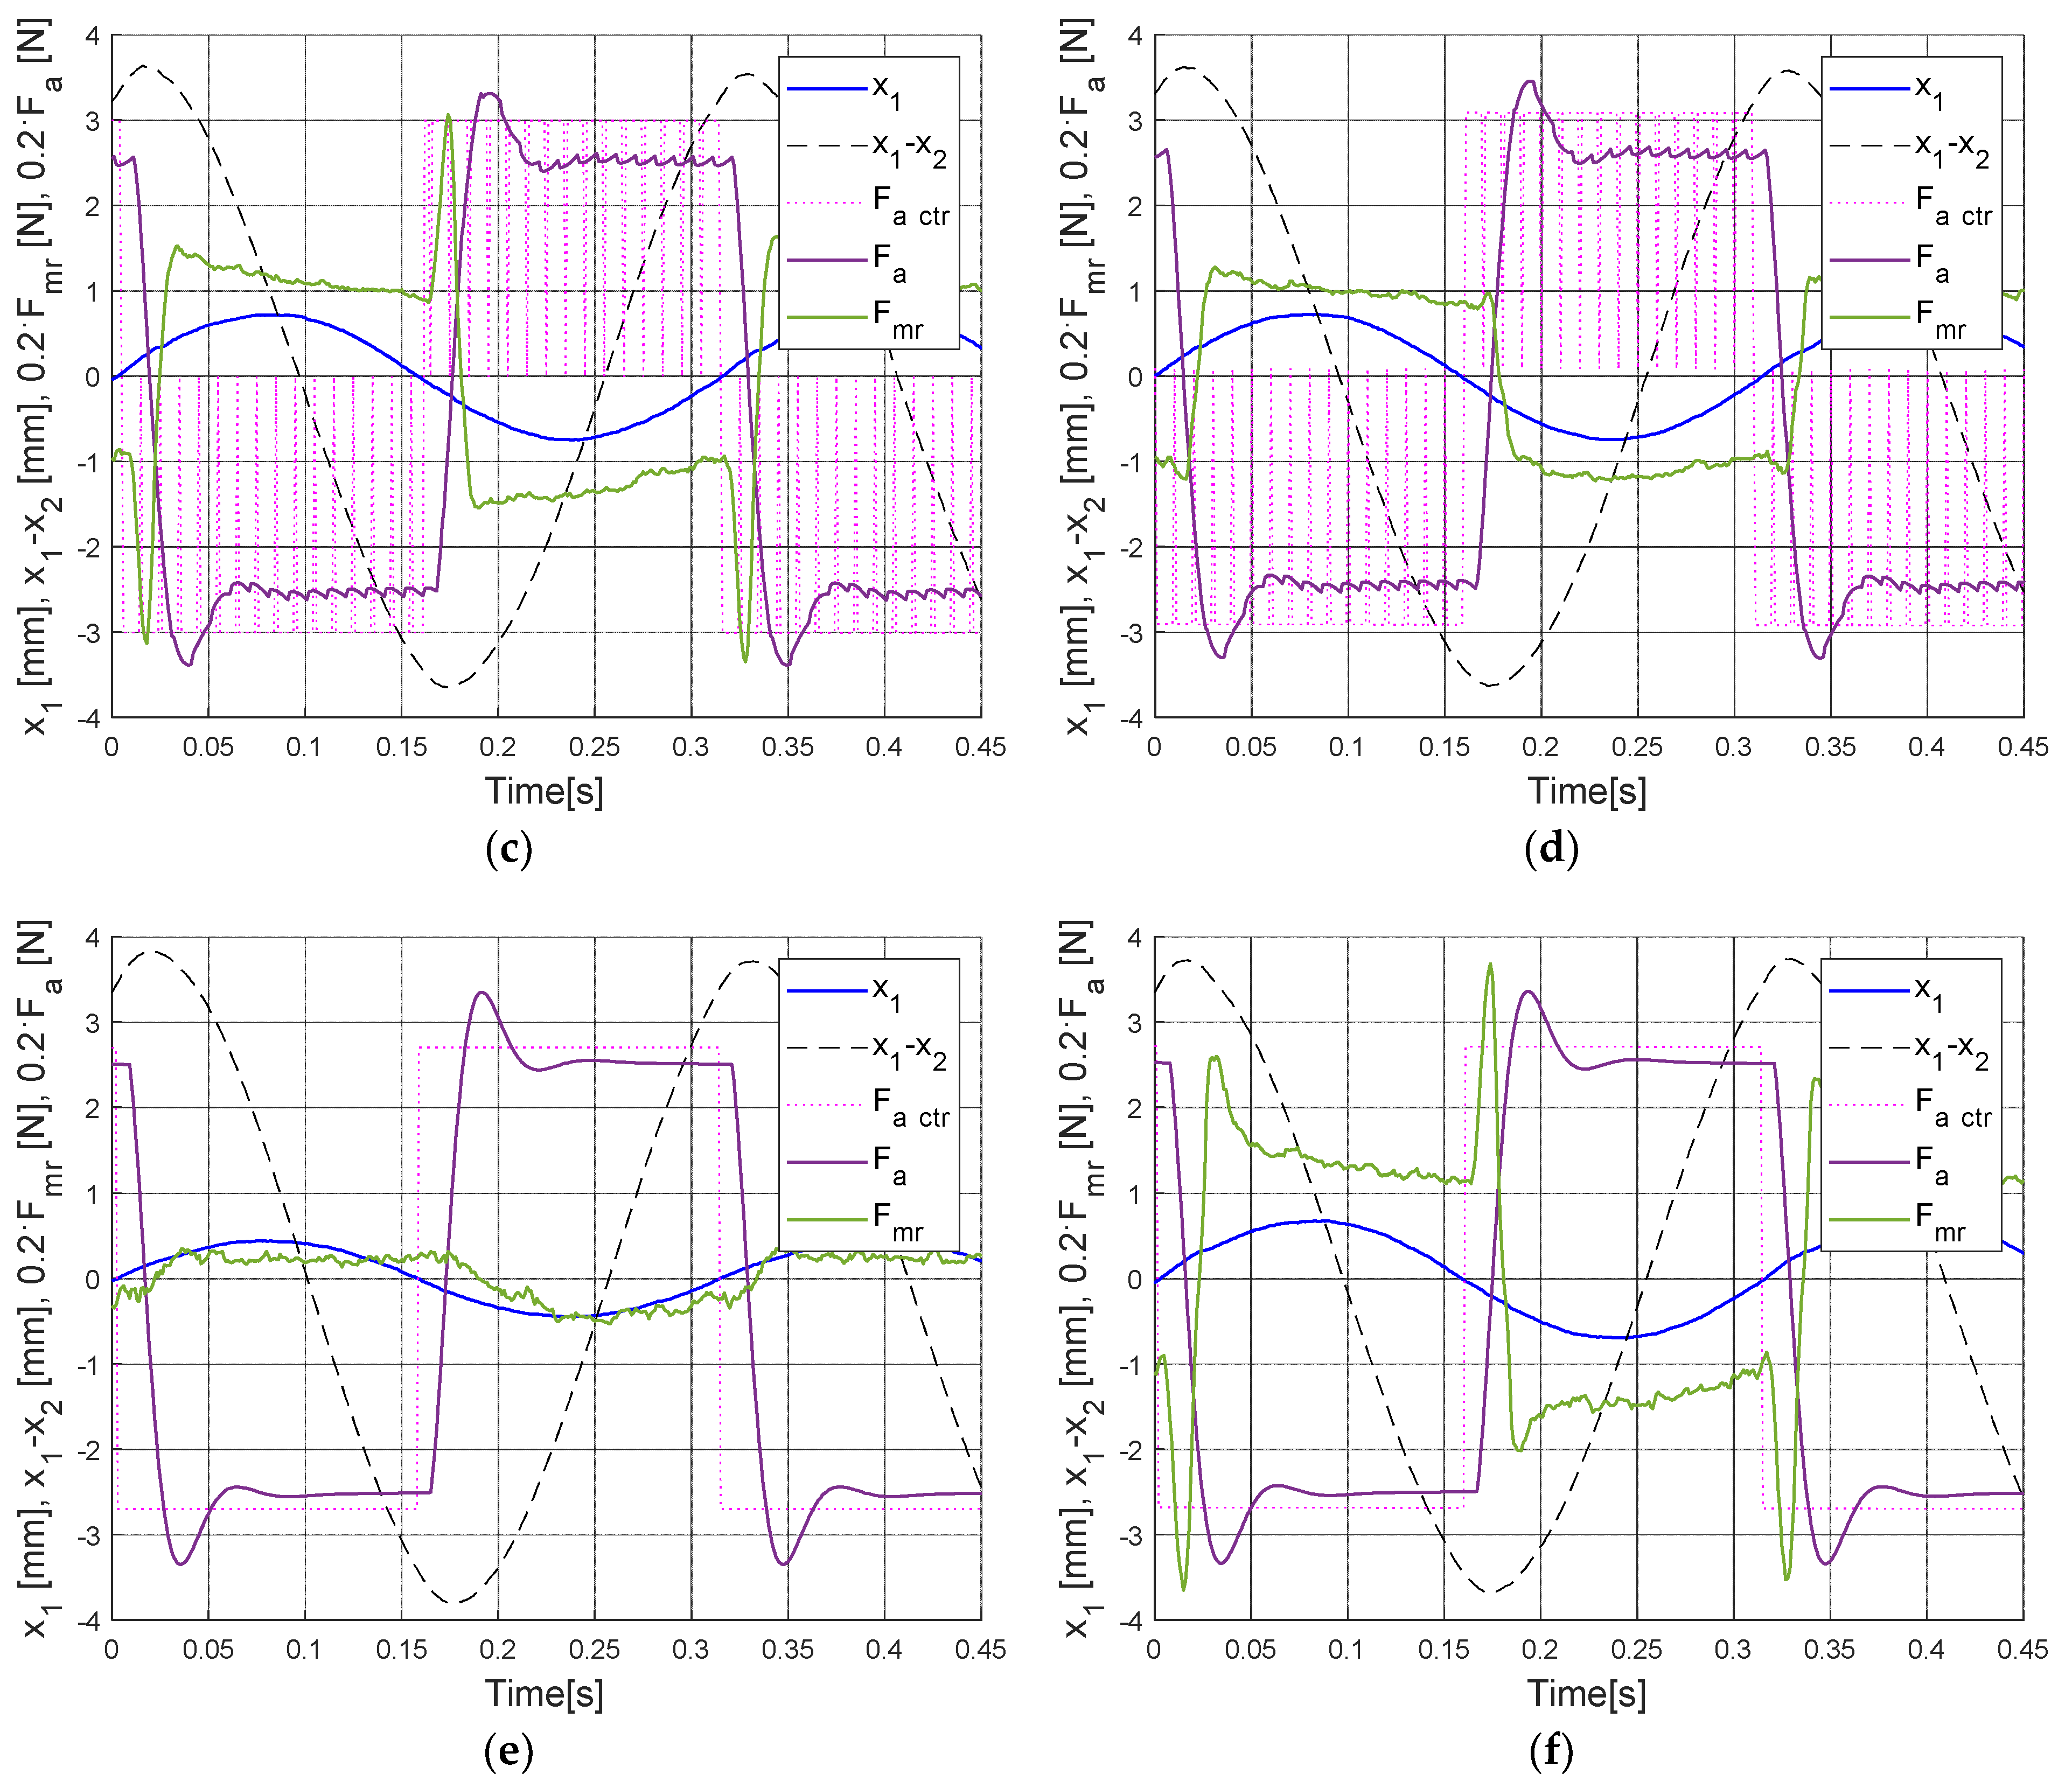
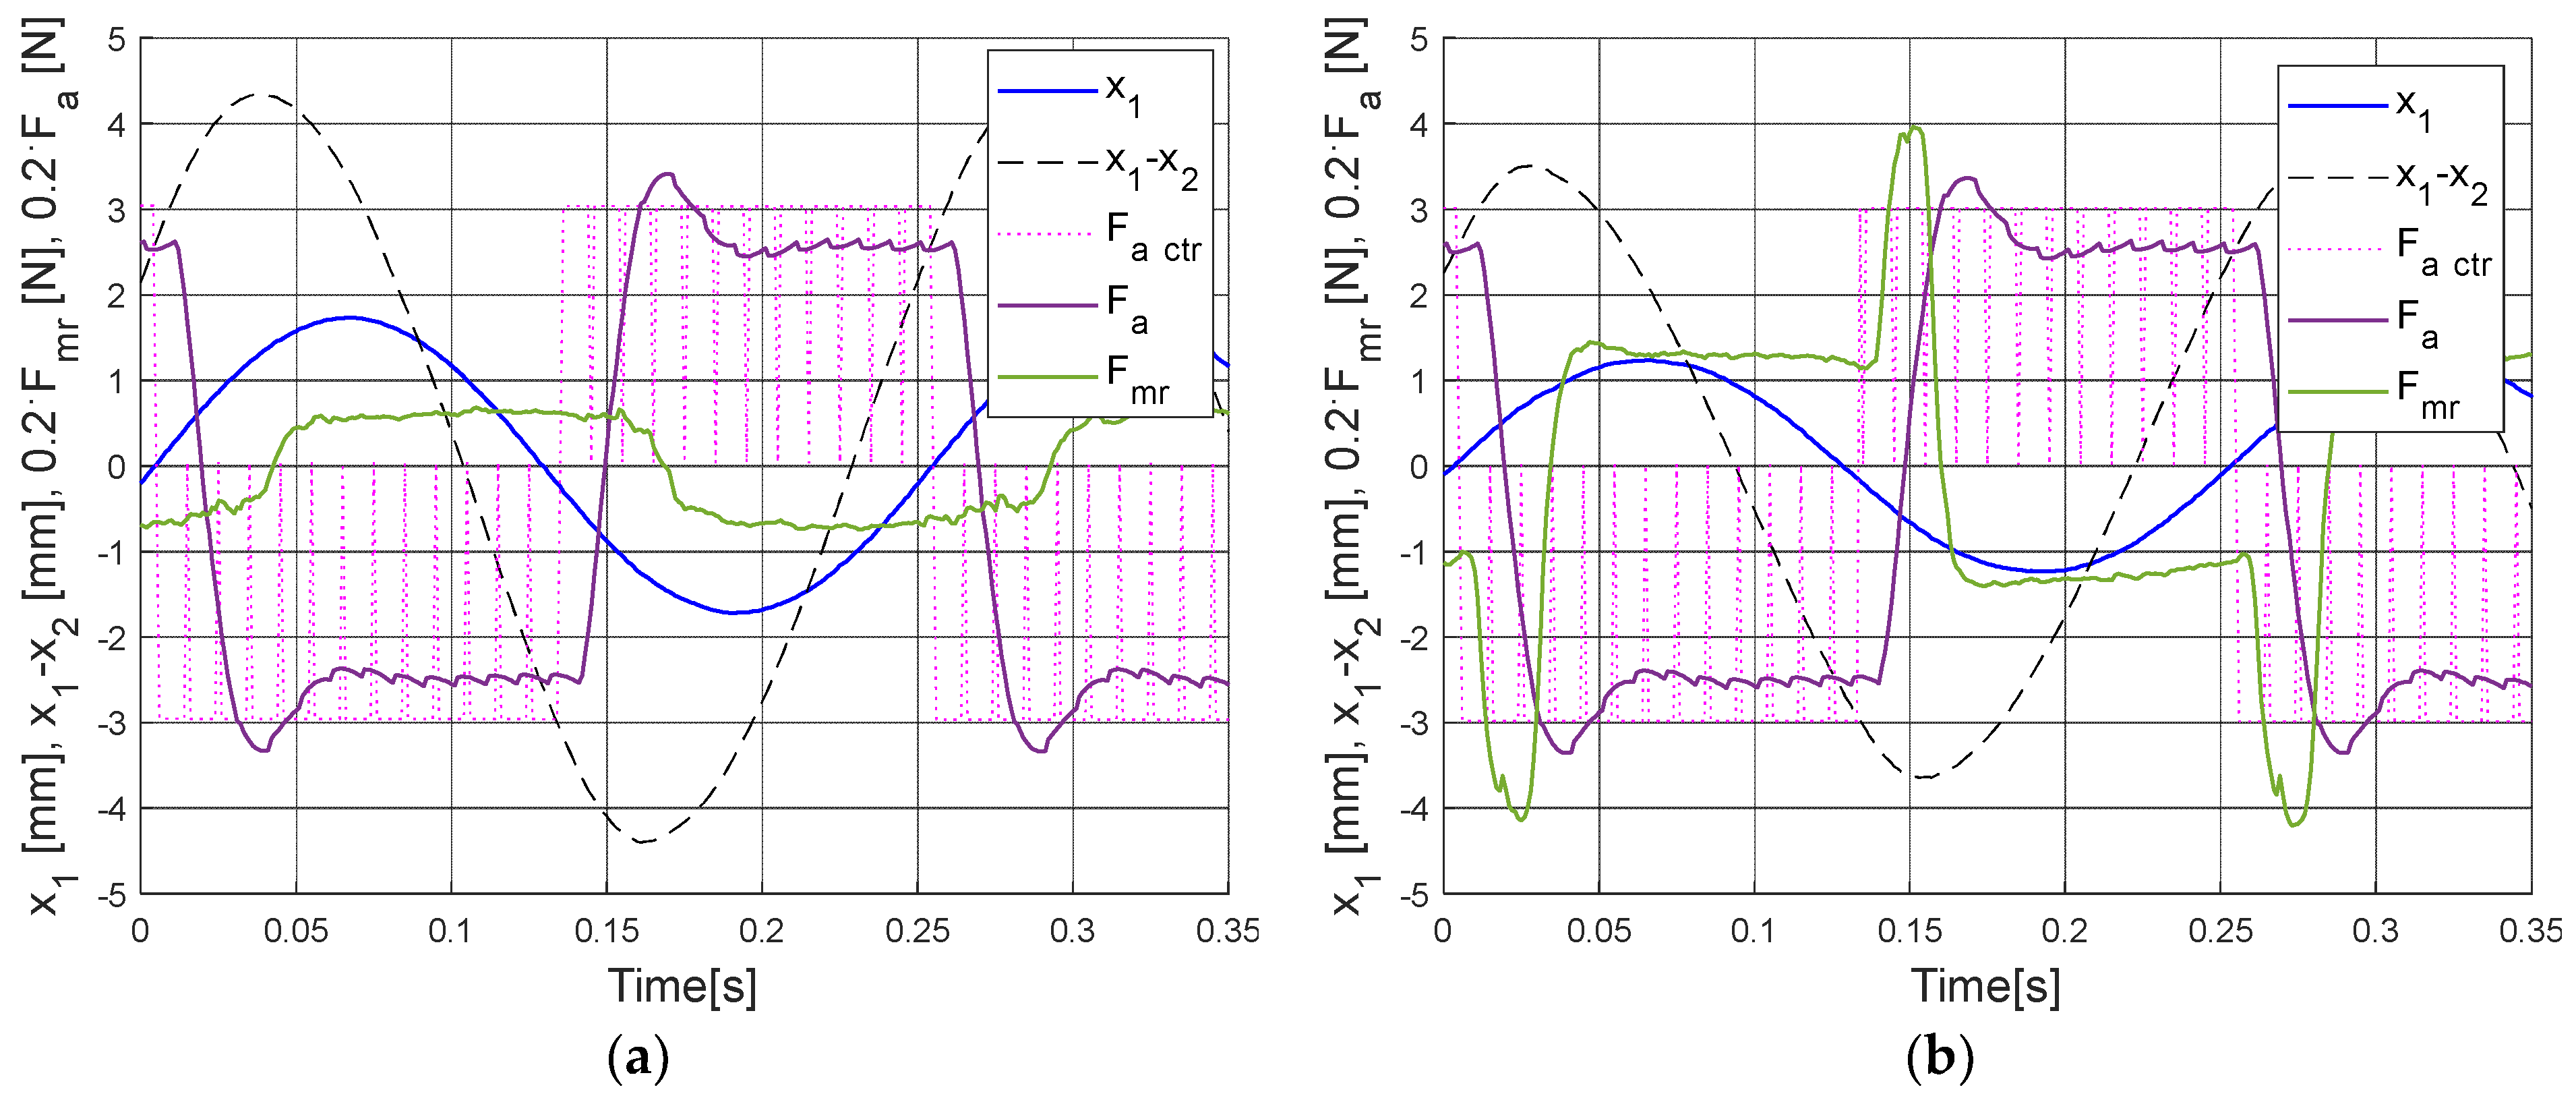
- H-MR-TVA system with OPT control case I/GH baseline configuration, characterised by the 57% maximum structure deflection reduction (regarding the passive configuration), ca. 0.76 W nominal actuator power, and ca. 32 N maximum MR damper force;
- (2)
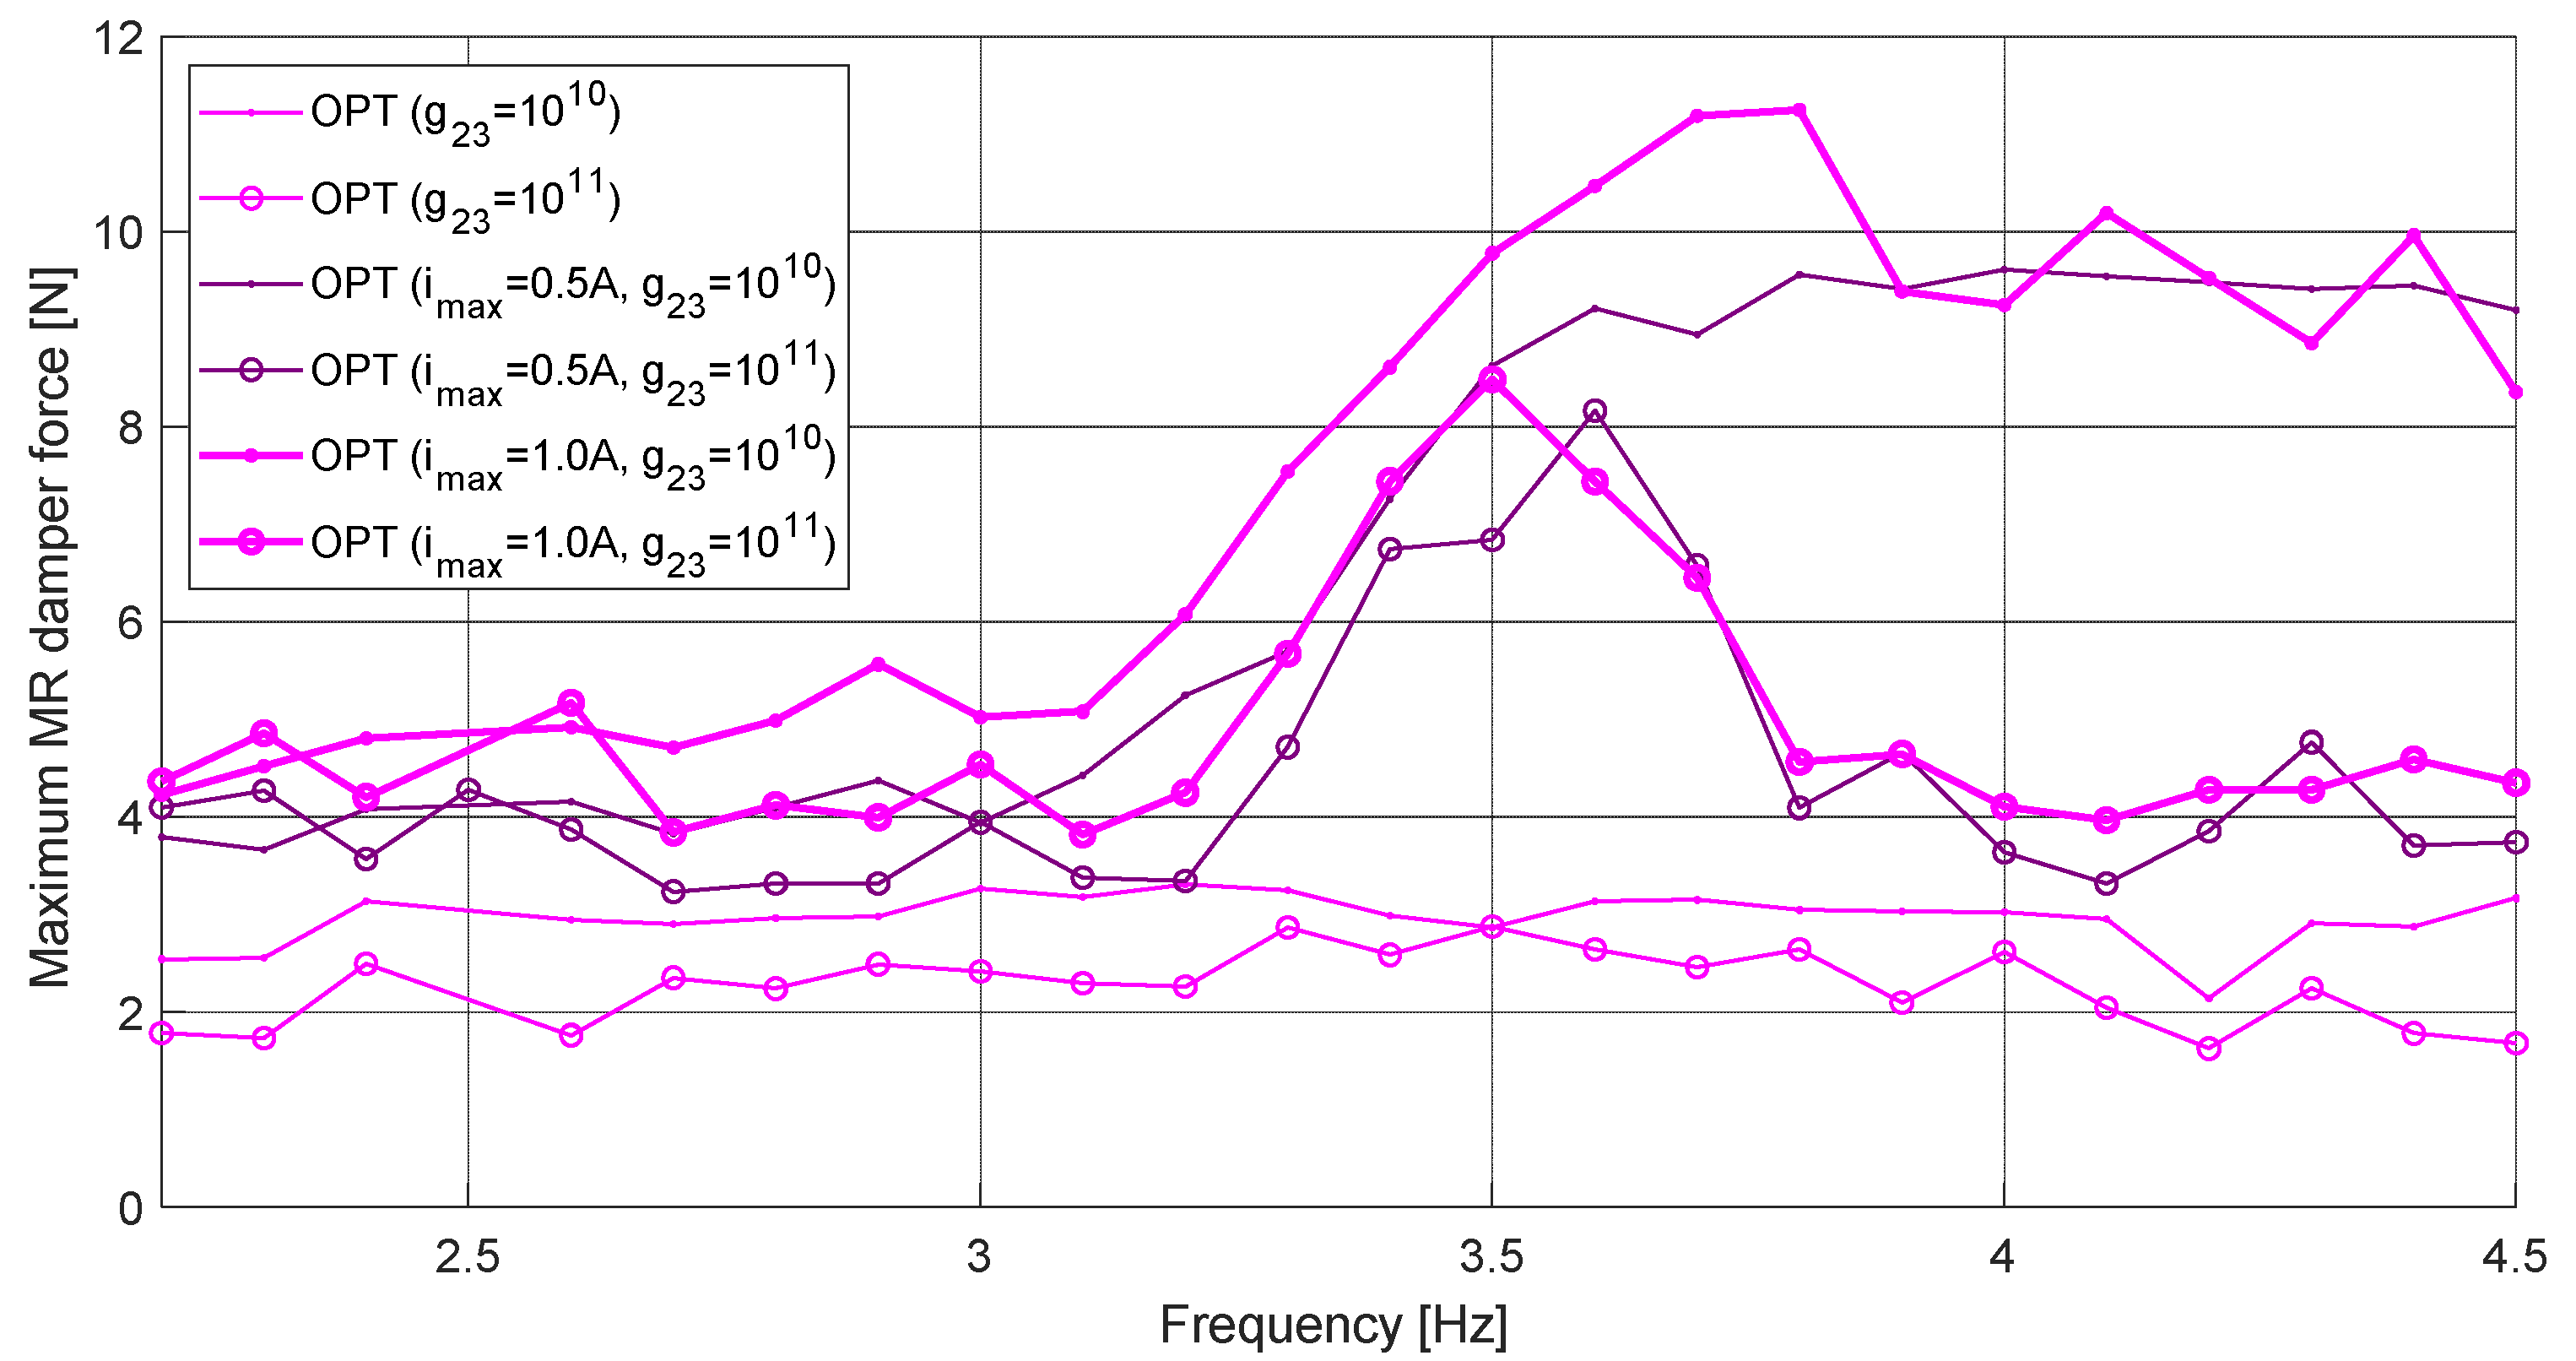
- H-TVA system with OPT control case III baseline configuration and , characterised by the 30% maximum structure deflection attenuation (regarding the passive configuration), 0.17 W nominal actuator power, and 3.3 N maximum (passive) damper force.
8. Conclusions
Funding
Data Availability Statement
Conflicts of Interest
References
- Wang, X.; Gordaninejad, F. Lyapunov-Based Control of A Bridge Using Magneto-rheological Fluid Dampers. J. Intell. Mater. Syst. Struct. 2002, 13, 30–36. [Google Scholar] [CrossRef]
- Weber, F.; Maślanka, M. Precise stiffness and damping emulation with MR dampers and its application to semi-active tuned mass dampers of Wolgograd Bridge. Smart Mater. Struct. 2014, 23, 015019. [Google Scholar]
- Ali, S.F.; Ramaswamy, A. Hybrid Structural Control using magnetorheological dampers for base isolated structures. Smart Mater. Struct. 2009, 18, 055011. [Google Scholar] [CrossRef]
- Esteki, K.; Bagchi, A.; Sedaghati, R. Semi-Active Tuned Mass Damper for Seismic Applications. In Proceedings of the Smart Materials, Structures & NDT in Aerospace, Montreal, Canada, 2–4 November 2011. [Google Scholar]
- Kavyashree, B.G.; Patil, S.; Rao, V.S. Review on vibration control in tall buildings: From the perspective of devices and applications. Int. J. Dynam. Control 2020, 9, 1316–1331. [Google Scholar] [CrossRef]
- Caterino, N. Semi-active control of a wind turbine via magnetorheological dampers. J. Sound Vib. 2015, 345, 1–17. [Google Scholar] [CrossRef]
- Enevoldsen, I.; Mork, K.J. Effects of Vibration Mass Damper in a Wind Turbine Tower. Mech. Struct. Mach. 1996, 24, 155–187. [Google Scholar] [CrossRef]
- Kirkegaard, P.H.; Nielsen, S.R.K.; Poulsen, B.L.; Andersen, J.R.; Pedersen, L.H.; Pedersen, B. Semiactive vibration control of a wind turbine tower using an MR damper. In Structural Dynamics-EURODYN; Grundmann, H., Schueller, G.I., Eds.; Swets & Zeitlinger: Lisse, The Netherlands, 2002. [Google Scholar]
- Kucuk, I.; Yildirim, K.; Sadek, I.; Adali, S. Optimal control of a beam with Kelvin-Voigt damping subject to forced vibrations using a piezoelectric patch actuator. J. Vib. Control 2015, 21, 701–713. [Google Scholar] [CrossRef]
- Xu, Z.D.; Zhu, J.T.; Wang, D.X. Analysis and Optimisation of Wind-Induced Vibration Control for High-Rise Chimney Structures. Int. J. Acoust. Vib. 2014, 19, 42–51. [Google Scholar] [CrossRef]
- Bakhtiari-Nejad, F.; Meidan-Sharafi, M. Vibration Optimal Control of a Smart Plate with Input Voltage Constraint of Piezoelectric Actuators. J. Vib. Control 2004, 10, 1749–1774. [Google Scholar] [CrossRef]
- Oates, W.S.; Smith, R.C. Nonlinear Optimal Control Techniques for Vibration Attenuation Using Magnetostrictive Actuators. J. Intell. Mater. Syst. Struct. 2008, 19, 193–209. [Google Scholar] [CrossRef]
- Rotea, M.A.; Lackner, M.A.; Saheba, R. Active Structural Control of Offshore Wind turbines. In Proceedings of the 48th AIAA Aerospace Sciences Meeting Including the New Horizons Forum and Aerospace Exposition, Orlando, FL, USA, 4–7 January 2010. [Google Scholar]
- Tsouroukdissian, A.; Carcangiu, C.E.; Pineda, A.I.; Martin, M. Wind Turbine Tower Load Reduction using Passive and Semiactive Dampers. In Proceedings of the European Wind Energy Association Annual Event, Brussels, Belgium, 14–17 March 2011. [Google Scholar]
- Spencer, B.F., Jr.; Soong, T.T. New Applications and Development of Active, Semi-Active and Hybrid Control Techniques for Seismic and Non-Seismic Vibration in the USA. In Proceedings of the International Post-SMiRT Conference Seminar on Seismic Isolation, Passive Energy Dissipation and Active Control of Vibration of Structures, Cheju, Republic of Korea, 23–25 August 1999. [Google Scholar]
- Zhang, Z.; Staino, A.; Basu, B.; Nielsen, S.R.K. Performance evaluation of full-scale tuned liquid dampers (TLDs) for vibration control of large wind turbines using real-time hybrid testing. Eng. Struct. 2016, 126, 417–431. [Google Scholar] [CrossRef]
- Mensah, A.F.; Dueñas-Osorio, L. Improved reliability of wind turbine towers with tuned liquid column dampers (TLCDs). Struct. Safety 2014, 47, 78–86. [Google Scholar] [CrossRef]
- Zhang, J.; Roschke, P.N. Active control of a tall structure excited by wind. J. Wind. Eng. Ind. Aerodyn. 1999, 83, 209–223. [Google Scholar] [CrossRef]
- Den Hartog, J.P. Mechanical Vibrations; Dover Publications: Mineola, NY, USA, 1985. [Google Scholar]
- Preumont, A.; Alaluf, D.; Bastaits, R. Hybrid Mass Damper: A Tutorial Example. In Active and Passive Vibration Control of Structures; Hagedorn, P., Spelsberg-Korspeter, G., Eds.; CISM International Centre for Mechanical Sciences; Springer: Vienna, Austria, 2014. [Google Scholar] [CrossRef]
- Demetriou, D.; Nikitas, N. A Novel Hybrid Semi-Active Mass Damper Configuration for Structural Applications. Appl. Sci. 2016, 6, 397. [Google Scholar] [CrossRef]
- Nakamura, Y.; Tanaka, K.; Nakayama, M.; Fujita, T. Hybrid mass dampers using two types of electric servomotors: AC servomotors and linear-induction servomotors. Earthq. Eng. Struct. Dyn. 2001, 30, 1719–1743. [Google Scholar] [CrossRef]
- Nishimura, I.; Kobori, T.; Sakamoto, M.; Koshika, N.; Sasaki, K.; Ohrui, S. Active tuned mass damper. Smart Mater. Struct. 1992, 1, 306–311. [Google Scholar] [CrossRef]
- Di Paolo, M.; Nuzzo, I.; Caterino, N.; Georgakis, C.T. A friction-based passive control technique to mitigate wind induced structural demand to wind turbines. Eng. Struct. 2021, 232, 111744. [Google Scholar] [CrossRef]
- Shen, Y.J.; Wang, L.; Yang, S.P.; Gao, G.S. Nonlinear dynamical analysis and parameters optimization of four semi-active on-off dynamic vibration absorbers. J. Vib. Control 2013, 19, 143–160. [Google Scholar] [CrossRef]
- Martynowicz, P. Vibration control of wind turbine tower-nacelle model with magnetorheological tuned vibration absorber. J. Vib. Control 2017, 23, 3468–3489. [Google Scholar] [CrossRef]
- Martynowicz, P. Control of an MR Tuned Vibration Absorber for Wind Turbine Application Utilising the Refined Force Tracking Algorithm. J. Low Freq. Noise Vib. Act. Control 2017, 36, 339–353. [Google Scholar] [CrossRef]
- Hu, Y.; He, E. Active structural control of a floating wind turbine with a stroke-limited hybrid mass damper. J. Sound Vib. 2017, 410, 447–472. [Google Scholar] [CrossRef]
- Kim, H.T.; Kim, C.H.; Choi, S.B.; Moon, S.J.; Song, W.G. A novel triple actuating mechanism of an active air mount for vibration control of precision manufacturing machines: Experimental work. Smart Mater. Struct. 2014, 23, 077003. [Google Scholar] [CrossRef]
- Han, C.; Choi, S.B.; Lee, Y.S.; Kim, H.T.; Kim, C.H. A new hybrid mount actuator consisting of air spring and magneto-rheological damper for vibration control of a heavy precision stage. Sens. Actuator A Phys. 2018, 284, 42–51. [Google Scholar] [CrossRef]
- Brodersen, M.L.; Ou, G.; Høgsberg, J.; Dyke, S. Analysis of hybrid viscous damper by real time hybrid simulations. Eng. Struct. 2016, 126, 675–688. [Google Scholar] [CrossRef]
- Hu, Y.; Chen, M.Z.Q.; Li, C. Active structural control for load mitigation of wind turbines via adaptive sliding-mode approach. J. Frankl. Inst. 2017, 354, 4311–4330. [Google Scholar] [CrossRef]
- Fitzgerald, B.; Basu, B. Cable connected active tuned mass dampers for control of in-plane vibrations of wind turbine blades. J. Sound Vib. 2014, 333, 5980–6004. [Google Scholar] [CrossRef]
- Martynowicz, P. Nonlinear Optimal-Based Vibration Control of a Wind Turbine Tower Using Hybrid vs. Magnetorheological Tuned Vibration Absorber. Energies 2021, 14, 5145. [Google Scholar] [CrossRef]
- Koo, J.H.; Ahmadian, M. Qualitative Analysis of Magneto-Rheological Tuned Vibration Absorbers: Experimental Approach. J. Intell. Mater. Syst. Struct. 2007, 18, 1137–1142. [Google Scholar] [CrossRef]
- Martynowicz, P. Study of vibration control using laboratory test rig of wind turbine’s tower-nacelle system with MR damper based tuned vibration absorber. Bull. Pol. Acad. Sci. Tech. Sci. 2016, 64, 347–359. [Google Scholar]
- Rosół, M.; Martynowicz, P. Implementation of LQG controller for wind turbine tower-nacelle model with MR tuned vibration absorber. J. Theor. Appl. Mech. 2016, 54, 1109–1123. [Google Scholar] [CrossRef]
- Martynowicz, P.; Santos, M. Structural vibration control of NREL 5.0 MW FOWT using optimal-based MR tuned vibration absorber. In Proceedings of the 21st IFAC World Congress, Berlin, Germany, 11–17 July 2020. [Google Scholar]
- Wang, L.; Liang, Z.; Cai, M.; Zhang, Y.; Yan, J. Adaptive Structural Control of Floating Wind Turbine with Application of MR Damper. Energy Procedia 2019, 158, 254–259. [Google Scholar] [CrossRef]
- Martynowicz, P. Nonlinear optimal-based vibration control for systems with MR tuned vibration absorbers. J. Low Freq. Noise Vib. Act. Control 2019, 38, 1607–1628. [Google Scholar] [CrossRef]
- Martynowicz, P. Real-time implementation of nonlinear optimal-based vibration control for a wind turbine model. J. Low Freq. Noise Vib. Act. Control 2019, 38, 1635–1650. [Google Scholar] [CrossRef]
- Kciuk, S.; Martynowicz, P. Special application magnetorheological valve numerical and experimental analysis. Control. Eng. Mater. Process. Diffus. Defect Data–Solid State Data Pt. B Solid State Phenom. 2011, 177, 102–115. [Google Scholar] [CrossRef]
- Laalej, H.; Lang, Z.Q.; Sapinski, B.; Martynowicz, P. MR damper based implementation of nonlinear damping for a pitch plane suspension system. Smart Mater. Struct. 2012, 21, 045006. [Google Scholar] [CrossRef]
- Neelakantan, V.A.; Washington, G.N. Vibration Control of Structural Systems using MR dampers and a ‘Modified’ Sliding Mode Control Technique. J. Intell. Mater. Syst. Struct. 2008, 19. [Google Scholar] [CrossRef]
- Lord RheoneticTM. MR Controllable Friction Damper RD-1097-01 Product Bulletin; Lord: Cary, NC, USA, 2002. [Google Scholar]
- Bryson, A.E.; Ho, Y.C. Applied Optimal Control; Taylor & Francis: London, UK, 1975. [Google Scholar]
- Itik, M. Optimal control of nonlinear systems with input constraints using linear time varying approximations. Nonlinear Anal. Model. Control. 2016, 21, 400–412. [Google Scholar] [CrossRef]
- Shukla, P.; Ghodki, D.; Manjarekar, N.S.; Singru, P.M. A Study of H infinity and H2 synthesis for Active Vibration Control. IFAC-PapersOnLine 2016, 49, 623–628. [Google Scholar] [CrossRef]
- Martynowicz, P.; Szydło, Z. Wind turbine’s tower-nacelle model with magnetorheological tuned vibration absorber: The laboratory test rig. In Proceedings of the 14th International Carpathian Control Conference (ICCC), Rytro, Poland, 26–29 May 2013. [Google Scholar]
- Martynowicz, P. Development of Laboratory Model of Wind Turbine′s Tower-Nacelle System with Magnetorheological Tuned Vibration Absorber. Solid State Phenom. 2014, 208, 40–51. [Google Scholar] [CrossRef]
- Martynowicz, P.; Rosół, M. Wind Turbine Tower-Nacelle System with MR Tuned Vibration Absorber: Modelling, Test Rig, and Identification. In Proceedings of the ICCC 2019: Proceedings of the 20th International Carpathian Control Conference, Kraków-Wieliczka, Poland, 26–29 May 2019. [Google Scholar]
- Rosół, M.; Martynowicz, P. Identification of the Wind Turbine Model with MR Damper Based Tuned Vibration Absorber. In Proceedings of the ICCC 2019: Proceedings of the 20th International Carpathian Control Conference, Kraków-Wieliczka, Poland, 26–29 May 2019. [Google Scholar]
- Snamina, J.; Martynowicz, P.; Łatas, W. Dynamic similarity of wind turbine’s tower-nacelle system and its scaled model. Solid State Phenom. 2014, 208, 29–39. [Google Scholar] [CrossRef]
- Snamina, J.; Martynowicz, P. Prediction of characteristics of wind turbine’s tower-nacelle system from investigation of its scaled model. In Proceedings of the 6WCSCM: Sixth World Conference on Structural Control and Monitoring–proceedings of the 6th edition of the World conference of the International Association for Structural Control and Monitoring (IACSM), Barcelona, Spain, 15–17 July 2014. [Google Scholar]
- Maślanka, M. Optimised semi-active tuned mass damper with acceleration and relative motion feedbacks. Mech. Syst. Signal Process. 2019, 130, 707–731. [Google Scholar] [CrossRef]
- Ioffe, A.D.; Tihomirov, V.M. Theory of Extremal Problems. Studies in Mathematics and its Applications; North-Holland Publishing Company: Amsterdam, The Netherlands, 1979. [Google Scholar]
- Pinto, S.G.; Rodriguez, S.P.; Torcal, J.I.M. On the numerical solution of stiff IVPs by Lobatto IIIA Runge-Kutta methods. J. Comput. Appl. Math. 1997, 82, 129–148. [Google Scholar] [CrossRef]
- Festo Ltd. Festo Products. 2022. Available online: https://www.festo.com/gb/en/c/products-id_pim1 (accessed on 12 October 2022).
- TMS 60 Lbf Modal Shaker; The Modal Shop Inc.: Cincinnati, OH, USA, 2010.
- InTeCo RT-DAC4/PCI Multi I/O Board. User’s Manual; InTeCo Ltd.: Krakow, Poland, 2002.
- Sahu, G.N.; Singh, S.; Singh, A.; Law, M. Static and Dynamic Characterization and Control of a High-Performance Electro-Hydraulic Actuator. Actuators 2020, 9, 46. [Google Scholar] [CrossRef]


| Parameter | Value |
|---|---|
| m1 | 170.34 kg |
| k1 | 82,554 N/m |
| c1 | 49.53 Ns/m |
| m2 | 24.01 kg (14.1% m1) |
| k2 | 8000 N/m |
| Fnom | 12.5 N/6.25 N |
| Parameter | Value |
|---|---|
| C1 | 44 |
| C2 | 1.0 |
| C3 | 225 |
| C4 | 7.0 |
| 70 |
| Control Method | OPT CASE I g221 = 0 g23 = 0 | OPT CASE II g221 =106 g23 = 0 | OPT CASE III g221 = 0 g23 = 1010 or g23 = 1011 | GH | |
|---|---|---|---|---|---|
| Configuration | |||||
| Baseline | 12.5 N/1.0 A | 12.5 N/1.0 A | 12.5 N/1.0 A | 12.5 N/1.0 A | |
| Restricted force | 6.25 N/0.5 A | 6.25 N/0.5 A | 6.25 N/0.5 A | 6.25 N/0.5 A | |
Publisher’s Note: MDPI stays neutral with regard to jurisdictional claims in published maps and institutional affiliations. |
© 2022 by the author. Licensee MDPI, Basel, Switzerland. This article is an open access article distributed under the terms and conditions of the Creative Commons Attribution (CC BY) license (https://creativecommons.org/licenses/by/4.0/).
Share and Cite
Martynowicz, P. Experimental Study on the Optimal-Based Vibration Control of a Wind Turbine Tower Using a Small-Scale Electric Drive with MR Damper Support. Energies 2022, 15, 9530. https://doi.org/10.3390/en15249530
Martynowicz P. Experimental Study on the Optimal-Based Vibration Control of a Wind Turbine Tower Using a Small-Scale Electric Drive with MR Damper Support. Energies. 2022; 15(24):9530. https://doi.org/10.3390/en15249530
Chicago/Turabian StyleMartynowicz, Paweł. 2022. "Experimental Study on the Optimal-Based Vibration Control of a Wind Turbine Tower Using a Small-Scale Electric Drive with MR Damper Support" Energies 15, no. 24: 9530. https://doi.org/10.3390/en15249530
APA StyleMartynowicz, P. (2022). Experimental Study on the Optimal-Based Vibration Control of a Wind Turbine Tower Using a Small-Scale Electric Drive with MR Damper Support. Energies, 15(24), 9530. https://doi.org/10.3390/en15249530