Article

Carbon Footprint Assessment of Hydrogen and Steel

1
Institute of Sustainability in Civil Engineering, RWTH Aachen University, 52074 Aachen, Germany
2
Thyssenkrupp Steel Europe AG, 47166 Duisburg, Germany
*
Author to whom correspondence should be addressed.
Energies 2022, 15(24), 9468; https://doi.org/10.3390/en15249468
Submission received: 3 November 2022 / Revised: 2 December 2022 / Accepted: 11 December 2022 / Published: 14 December 2022

Abstract

:
Hydrogen has the potential to decarbonize a variety of energy-intensive sectors, including steel production. Using the life cycle assessment (LCA) methodology, the state of the art is given for current hydrogen production with a focus on the hydrogen carbon footprint. Beside the state of the art, the outlook on different European scenarios up to the year 2040 is presented. A case study of the transformation of steel production from coal-based towards hydrogen- and electricity-based metallurgy is presented. Direct reduction plants with integrated electric arc furnaces enable steel production, which is almost exclusively based on hydrogen and electricity or rather on electricity alone, if hydrogen stems from electrolysis. Thus, an integrated steel site has a demand of 4.9 kWh of electric energy per kilogram of steel. The carbon footprint of steel considering a European sustainable development scenario concerning the electricity mix is 0.75 kg CO2eq/kg steel in 2040. From a novel perspective, a break-even analysis is given comparing the use of natural gas and hydrogen using different electricity mixes. The results concerning hydrogen production presented in this paper can also be transferred to application fields other than steel.

1. Introduction

In order to prevent irreversible damage, global warming has to be kept well below 2 °C, preferably below 1.5 °C [1]. Therefore, the European Commission (EC) has set an ambitious target to reduce greenhouse gas emissions by at least 55%, compared with 1990 levels, by the year 2030, and to achieve net zero emissions before the year 2050 [2]. The German Federal Constitutional Court stated that the national emission reduction targets have to be specified from the year 2031 onwards, to substantiate the path between 2031 and 2050 [3].
The energy-intensive steel industry is responsible for about 7% of the global anthropogenic carbon dioxide emissions but also accounts for almost 3.5% of global gross domestic product (GDP) and 3% of global employment within combined activities [4,5]. Nevertheless, the steel industry has to make an important contribution to achieve the ambitious climate goals. Since steel is firmly established in the human way of life and also serves as a key material to enable technological climate-neutral solutions, a European scenario without steel production is not an option to solve the problem.
Steel is produced primarily with natural iron ores and secondarily with scrap recycling. About 70% of the steel production is primarily produced, mainly using the blast furnace–basic oxygen furnace (BF-BOF) route. About 30% of steel is produced secondarily, using the scrap-based electric arc furnace (EAF) route [4]. Despite efficiency gains, global carbon dioxide emissions are still increasing due to growing steel consumption and demand [6]. The increasing demand is also the reason why even in the year 2050, only about 44% of the steel demand will be able to be covered by the scrap-based EAF recycling route [7]. In consequence, breakthrough technologies in the primary steel production route are necessary.
In order to fulfil a sustainable transformation, it has to be ensured that environmental impacts are not just shifted from one process to another but a global benefit is reached. Life cycle assessment (LCA) according to ISO 14040 [8] and 14044 [9] is an established and standardized methodology used to determine the environmental impacts of a product along its life cycle. This includes the entire process chain from raw material extraction to supply, product manufacturing, use, recycling, and the disposal of waste, otherwise known as the cradle-to-grave approach. In LCA, several environmental impact categories can be considered. If, however, the focus lies on the sole impact category of climate change, it is referred to as product carbon footprint (PCF) assessment according to ISO 14067 [10]. ISO norm 14067 is in accordance with the LCA standards. Since the focus of this paper lies on the contribution to climate change of steel, the presented results are based on the methodology of ISO 14067.
The carbon footprint of steel produced using an average German BF-BOF route is roughly 2.0 kg CO2eq/kg steel (according to GaBi database 2021.1: “DE:BF Steel billet/slab/bloom” (CML 2001-16)) (see Figure 1) [11]. This impact can be divided into individual contributions of the steel manufacturing processes, the upstream supply chain, and credits for co-products, as is shown in the carbon footprint assessment of an integrated steel site in a previous work [12]. Direct impacts of an integrated steel site include its typical processes: sinter plant, coke plant, blast furnace, BOF, steel casting, and power plant. An integrated site commonly produces co-products such as blast furnace slag, BOF slag, electricity from power plants, and co-products originating from the coke plant, which are, e.g., tar, benzene, and sulphur. These co-products replace primary production in other industries and ultimately avoid emissions. According to the principle of system expansion [9], credits are given for these co-products.
In order to reduce the greenhouse gas emissions (GHGs) of the BF-BOF route, a shift from solid primary energy sources as reducing agents is required. The BF-BOF route is based on fossil coal. Beside carbon, hydrogen is able to reduce the iron oxides. In direct reduction units, iron oxides can be reduced to direct reduced iron (DRI) by natural gas and hydrogen, respectively. Direct reduction (DR) units are technically mature and can compete with blast furnaces concerning product capacities, with the limitation that the products are different in terms of physical state and composition. The final product of a blast furnace is liquid hot metal, while the product of a DR plant is a solid reduced iron pellet that also contains some gangue. Therefore, an additional plant is required to melt DRI and to remove gangue. This can be conducted electrically in an electric arc furnace (EAF), after which liquid steel can be directly cast into slabs. If high-quality steel is required, additional processing in the so-called secondary metallurgy is necessary.
The DR technology is fully developed and commercially available [13,14,15,16]. Presently, DR plants with capacities exceeding 2.5 million tons per year are the state of the art [13,15]. Nowadays, DRI is typically reduced using gases such as natural gas or gases from coal gasification. The use of off-gases from an integrated site, such as coke oven gas or BOF off-gas, is also an alternative [17]. Using pure hydrogen, reduction in the DR plant can be completely shifted away from carbon. It has to be emphasized that for climate-neutral steel production, the production process of the hydrogen used in the DR plant, as well as the electricity used for melting, also has to be taken into account, to avoid a shift in emissions.
Nowadays, the majority of pure hydrogen is produced via steam reforming out of natural gas or gasified coal and is often referred to as grey hydrogen (the chosen colour code in this paper is based on the one of the Federal Ministry of Education and Research) [18,19]. Grey hydrogen-based steel production still requires fossil fuels. Alternatively, hydrogen can be produced through steam reforming with subsequent storage of carbon dioxide, called blue hydrogen. Another hydrogen production pathway is electrolysis. If the electricity for the electrolysis process is from renewable sources, hydrogen production does not rely on fossil fuels; therefore, it is called green hydrogen. If fossil fuels are used for the respective production of electricity, hydrogen is also defined as grey hydrogen.
Regarding the use of renewable energies, some points need to be discussed. Although all industries, as well as private consumers, require renewable electricity to achieve the overall targets, the availability of renewable energy is currently limited in Europe (EU). Additionality in the use of renewable energy has to be guaranteed, so that its use makes an impact. Additionality of a renewable energy unit can only be given if it is not receiving any offtake subsidies aimed at the power market, amongst other criteria [20]. However, as long as the share of the overall European renewable electricity mix is limited, the European targets cannot be reached. So, most of all, supply has to increase. Steel production is a continuous process, so hydrogen and electricity supply also needs to be one. For the exclusive use of renewable energy, storage capacities are required.
In a technical study by Hölling et al., CO2-free steel production on the basis of off-shore wind energy is investigated [21]. Electricity from wind energy is used for near-site hydrogen electrolysis. The DRI and steel from an EAF are either produced onsite or different transport scenarios are investigated. For CO2-free steel production, the costs for steel production under the most optimal conditions are increased by 350 EUR/t steel, which is equivalent to a carbon dioxide abatement cost of about 200 EUR/t CO2. These costs are far above the steel producer’s usual margin of profit so this transformation does not go without appropriate advancement programs [21]. The development of renewable energy, the build-up of storage capacities, and the development of a hydrogen infrastructure are challenges to be addressed by the whole society and cannot be realized by the steel industry alone. That is the reason why the focus of this paper is on considering power supply with a grid mix.
More in detail, this paper aims to assess the carbon footprint of steel produced via a direct reduction unit and an EAF, whereby direct reduction with natural gas and that with hydrogen are compared to each other. A cradle-to-gate approach is used, including the production of raw materials to the production of steel. The sensitivity of hydrogen production to the respective carbon footprint of steel is investigated. To determine the state of the art, a literature overview about today’s hydrogen carbon footprint is presented, considering grey, blue, and green hydrogen. Special attention is given to hydrogen from electrolysis, for which electricity is taken from a national or European grid mix. The carbon footprint is assessed by modelling an electricity mix in combination with the electrolysis process. Moreover, an outlook until the year 2040 is presented, considering both the development of electricity grid mixes and of the efficiency of the electrolysis process.
The results concerning hydrogen production gained from this paper can also be used for technical applications in fields other than steelmaking.

2. Hydrogen Production

2.1. State of the Art

Today, hydrogen production mainly relies on fossil fuels. Only 0.5% of the global hydrogen production is from renewable sources, the so-called green hydrogen. Around 6% of global natural gas consumption and 2% of global coal consumption are used for hydrogen production. As a consequence, hydrogen production causes about 830 million tons of CO2 emissions per year. This corresponds to 2.5% of global CO2 emissions [19]. If a hydrogen production rate of about 70 Mt per year is taken into account, this leads to about 12 kg CO2/kg H2.
A literature overview on the impact of different hydrogen production technologies on climate change is given in Table 1. Not every study listed is a comprehensive carbon footprint assessment including all environmental impacts of raw material and energy supply. Therefore, a comment on the system boundary is given by the authors of this paper. The considered time span reaches from 2011 to 2025.
Grey hydrogen from natural gas-based steam reforming causes global warming potential (GWP) values between 11 and 13 kg CO2eq/kg H2 [11,22,23,24,25,26]. This is in line with the global average hydrogen-related carbon dioxide emissions. In the presented studies, different system boundaries and assumptions are considered. Nevertheless, the direct impact of the steam reforming process is the major contributor across all listed studies. The impact of natural gas production and transport is 1.7 kg CO2eq/kg H2, based on a calculation from GaBi databases in 2021.
Grey hydrogen from coal gasification causes GWP values between 19 and 24 kg CO2eq/kg H2 in the reviewed literature [25,27,28].
The carbon footprint of grey hydrogen from electrolysis driven by a fossil-based electricity mix varies between 1.1 and 35 kg CO2eq/kg H2 [25,26,29]. In the case of low-carbon electricity mixes, with high shares of renewable or nuclear energy, the carbon footprint is relatively low, whereas for coal-, oil-, and natural gas-based electricity, the footprint is relatively high.
According to the results of the literature review, blue hydrogen from steam reforming with carbon capture and storage (CCS) of carbon dioxide causes GWP values between 0.60 and 4.7 kg CO2eq/kg H2 [24,26,29]. Here, the carbon footprint depends significantly on the electricity mix that is required for CO2 capture. Howarth and Jacobson describe the PCF of blue hydrogen to be between 11 and 22 kg CO2eq/kg H2. Their research focuses on fugitive methane emissions and presents the results of the GWP considering time frames of 20 years and 100 years [30]. Since methane is a very strong but, in comparison with CO2, not very durable GHG, the considered time frame has a significant impact on the GWP of methane. The fugitive methane emissions are assumed to be 3.5% of natural gas input. This high value explains the high carbon footprint of blue hydrogen in the study [30].
Green hydrogen from electrolysis driven by renewable electricity has a carbon footprint between 1.0 and 5.1 kg CO2eq/kg H2 [22,23,25]. The footprint mostly depends on the renewable electricity technology, as well as the efficiency of the electrolysis process.
The storage and transportation of hydrogen is challenging in a few aspects, which are summarized in a review paper by Dawood et al. (2019) [31]. Hydrogen is able to escape through materials due to its small molecular size. This can lead to hydrogen embrittlement, which can weaken the materials and lead to destruction. Once released, hydrogen generally dissipates rapidly due to its low density. However, it becomes a safety concern if the gas accumulates and builds an explosive mixture in combination with oxygen. Since the hydrogen market is experiencing a ramp-up, it is believed that hydrogen technology will become as safe as other fuels that are in use today [31,32].
The focus of this paper lies on hydrogen from electrolysis operated with a grid mix. State-of-the-art grid mixes for Poland, France, Germany, and Europe (EU-28) are modelled. Additionally, the expected grid mixes for Germany and Europe are modelled for the years 2030 and 2040. Furthermore, a forecast is provided for the efficiency of the electrolysis process. The goal is to reveal the environmental impact of hydrogen production on the related hydrogen-based steel production.

2.2. Carbon Footprint of Hydrogen from Electrolysis

In the following section, the carbon footprint assessment of hydrogen, produced via water electrolysis, is presented for different electricity grid mixes.

2.2.1. Goal and Scope

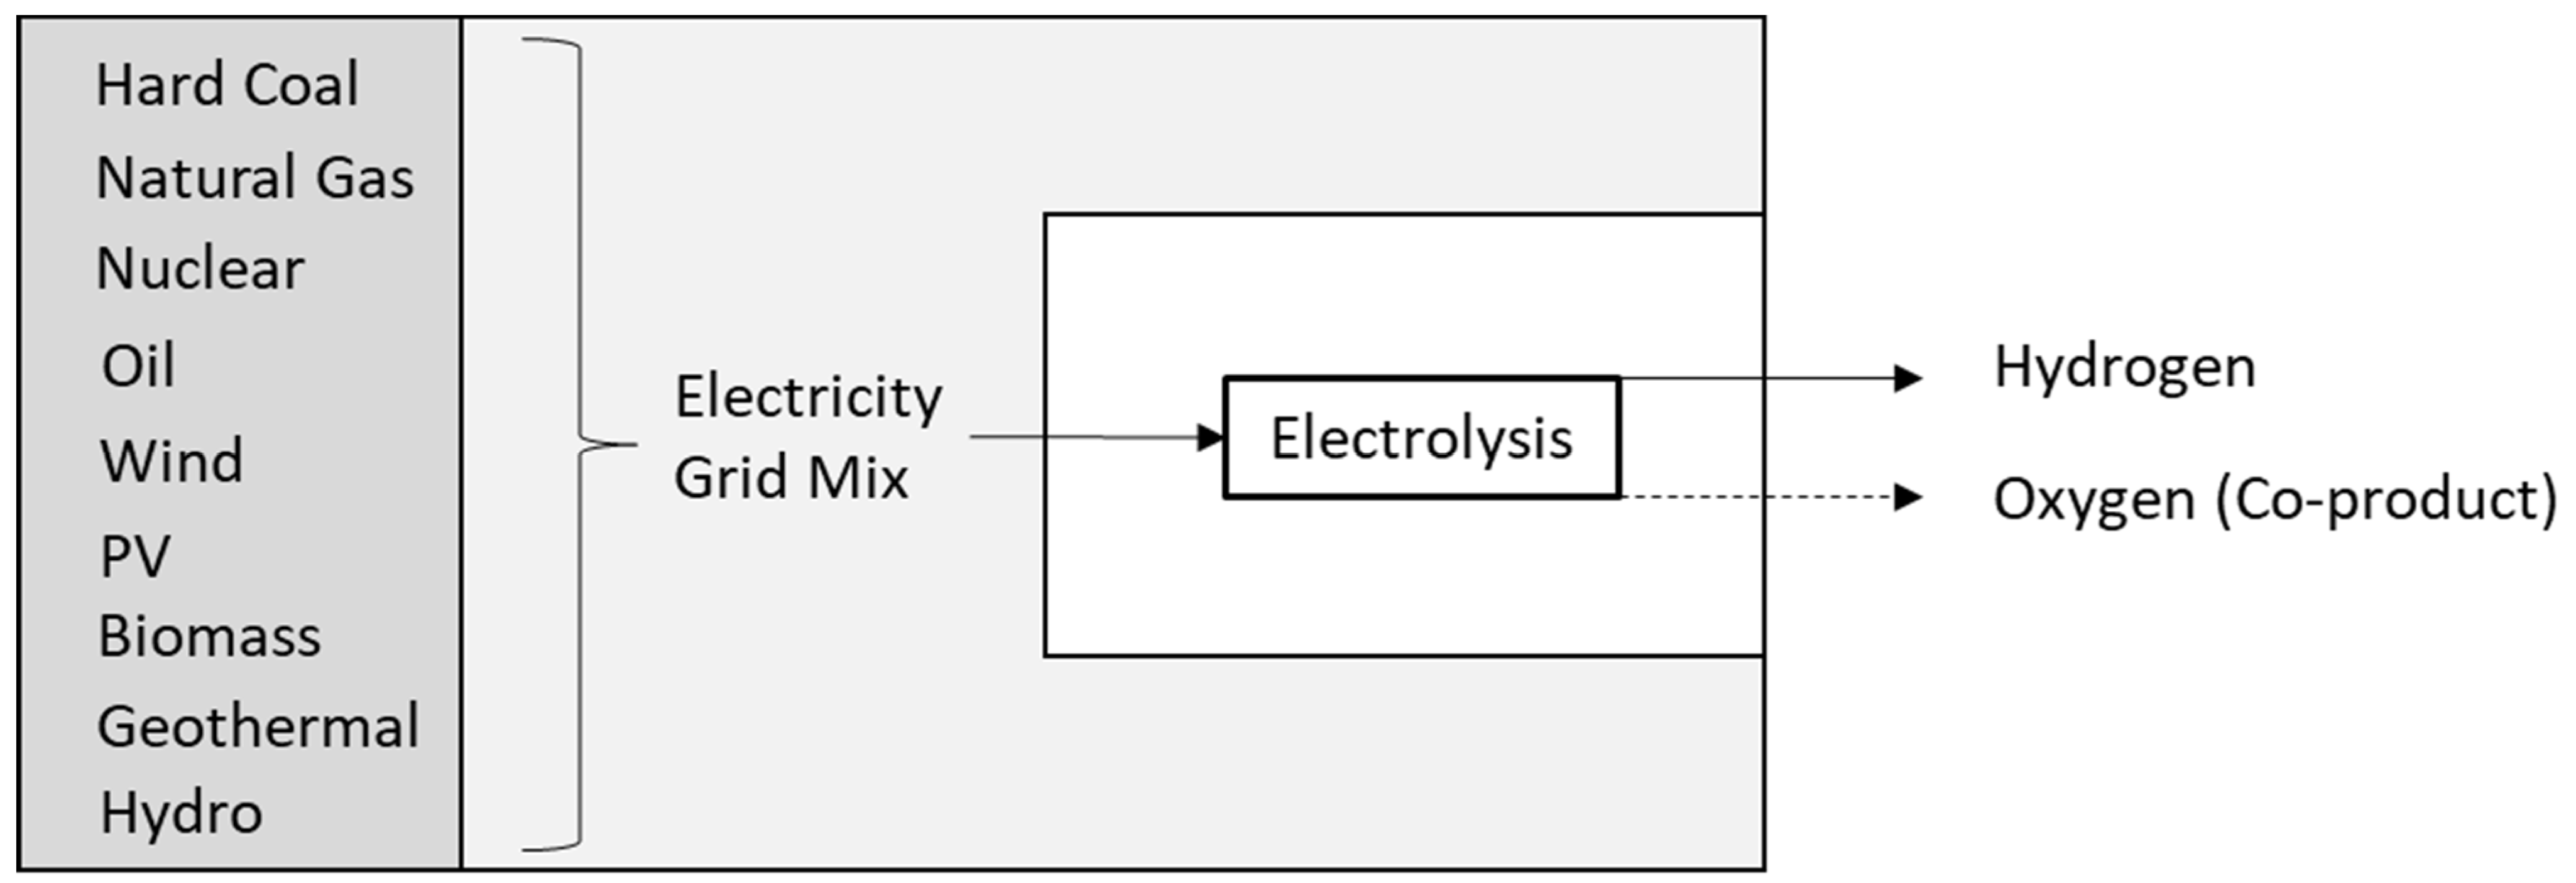
The declared unit is 1 kg of hydrogen. The related system boundaries, as well as the sources for the electricity grid mix, are highlighted in Figure 2.
This study is conducted using a cradle-to-gate approach. All impacts on climate change of raw material supply, transport, and manufacturing are considered [9].
Beside hydrogen, oxygen is produced as a co-product during the electrolysis process. Co-products can be evaluated with the methodology of system expansion, in which credits are given if they replace primary production in other industries [9]. However, in hydrogen transformation, it is not guaranteed that the co-product, oxygen, is to be used completely. Thus, the results are presented without any credit for the co-product.

2.2.2. Life Cycle Inventory

Hydrogen is modelled by combining the electrolysis process of “GLO: Hydrogen (electrolysis, decentral—for partly aggregation, open input electricity)” from GaBi database 2021.1 with different electricity mixes [11]. The life cycle inventory (LCI) value of hydrogen can be calculated by adding up the LCI value related to the required electricity grid mix to the LCI value related to the electrolysis process. For the example of carbon dioxide, the calculation is presented in Equation (1).
LCI hydrogen [ kg   CO 2 / kg   H 2 ] = LCI Electricity , Mix [ kg   CO 2 / MJ   electricity ] · LHV H 2 / η electrolysis [ MJ   electricity / kg   H 2 ] + LCI Electrolysis [ kg   CO 2 / kg   H 2 ]
where LHV H 2 refers to the lower heating value of hydrogen (120 MJ/kg) and η Electrolysis is the efficiency of the electrolysis process (MJ H2/MJ electricity).
The electricity mixes are modelled using GaBi database “EU-28: Electricity mix (energy carriers, generic)”. This database enables the creation of a generic electricity mix by varying the electricity inputs from chosen sources, such as coal, nuclear, wind, etc. The composition of the specific electricity mixes are taken from the International Energy Agency (IEA) [33] for the current national and European electricity mixes. The European forecast scenarios are taken from World Energy Outlook (2020), conducted by the IEA [34]. The German outlook scenarios are taken from Prognos et al. (2020) [35].
The data of the efficiency of the electrolysis process are taken from Prognos (2020) [36]. Beside the current efficiency, this study also provides a future outlook up to the year 2040. The average efficiency of the proton exchange membrane electrolysis (PEMEL) and the high-temperature electrolysis (HTEL) technology would increase from 60.9% (related to the lower heating value—LHV) for the year 2020 to 63.4% for the year 2040 [36] (see Table 2).
In Table 3, the GHG emissions for hydrogen produced via a German grid mix are presented for the year 2018. The emissions are calculated using Equation (1). The contribution of the listed emissions to climate change is more than 99%.
Concerning the German electricity grid mix, carbon dioxide is the most significant GHG. Methane is mainly caused by electricity generated from hard coal, as methane is emitted during the coal mining process.

2.2.3. Carbon Footprint Results

In this paper, the characterization factors related to GWP 100 are used in order to calculate the impact on climate change for a time horizon of 100 years [10]. The global warming potential of hydrogen can be calculated with the following equation, which is in line with Equation (1):
GWP hydrogen [ kg   CO 2 eq / kg   H 2 ] = GWP Electricity , Mix * LHV H 2 / η electrolysis + GWP Electrolysis  
The GWP of the electrolysis process is 0.047 kg CO2eq/kg hydrogen (according to GaBi database 2021.l: “electrolysis, decentral—for partly aggregation, open input electricity”). This value is very low compared with the impact generated by electricity.
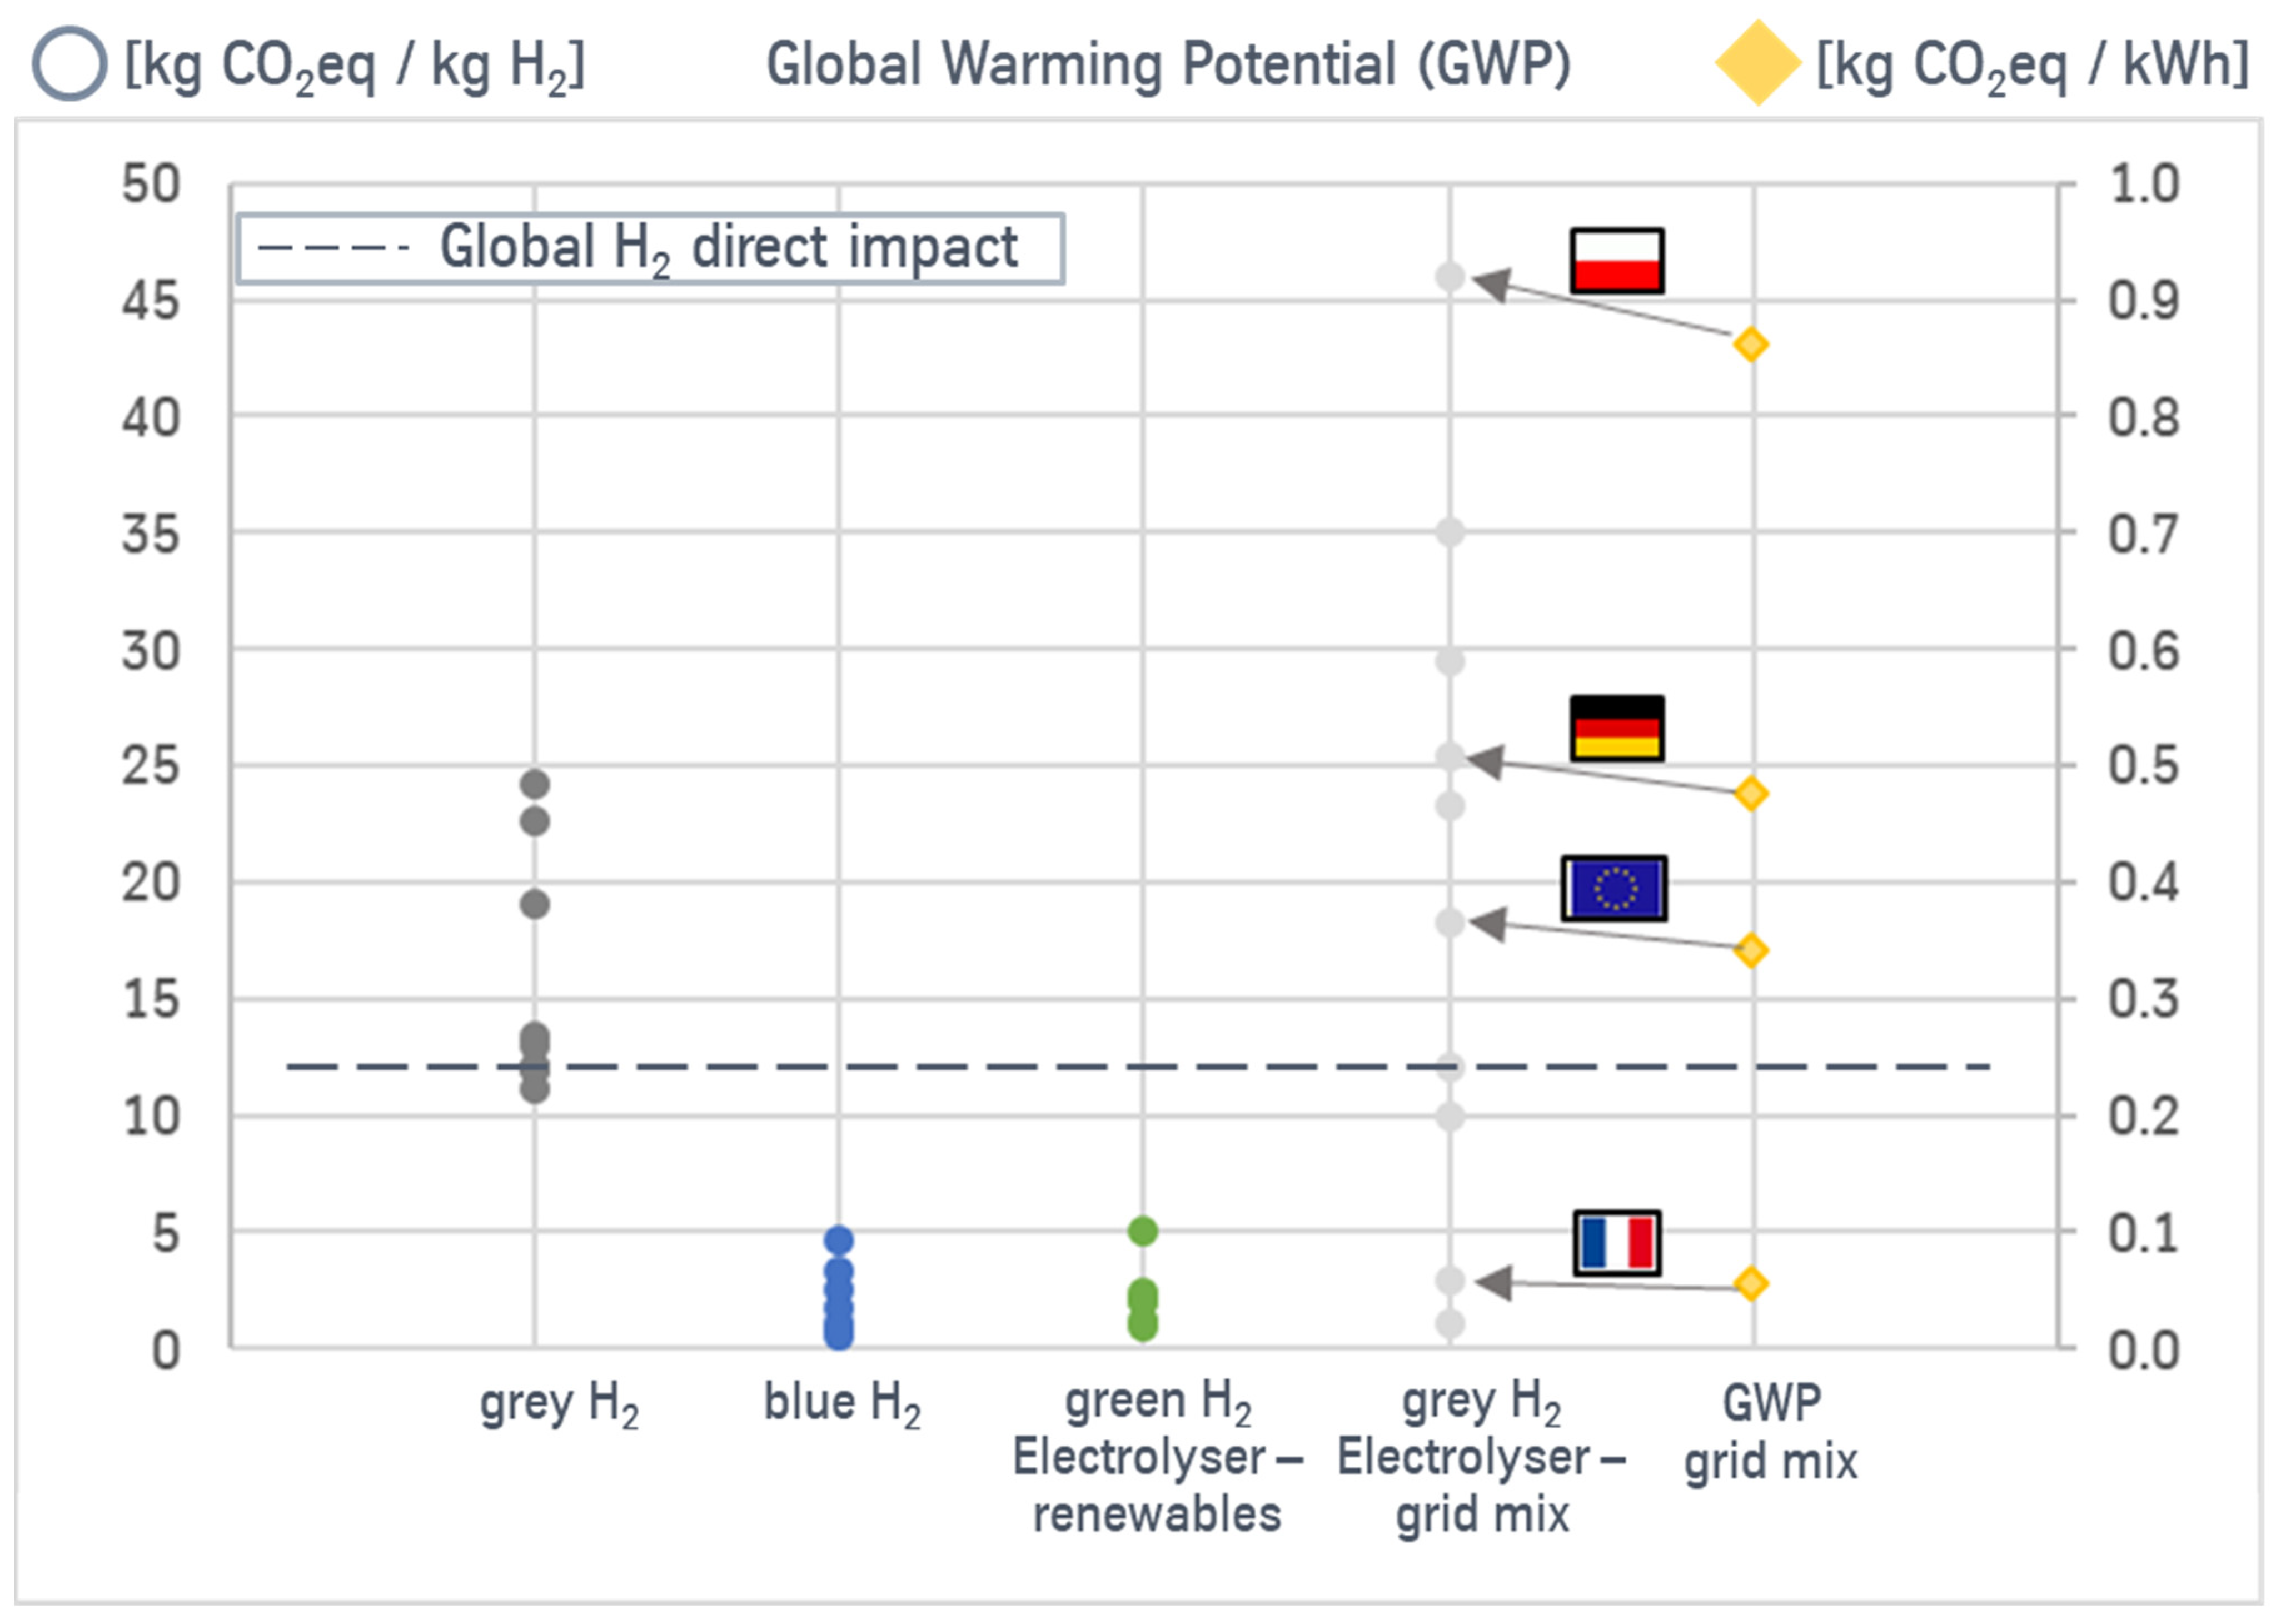
In this article, different national grid mixes as well as the European grid mix are compared with each other to visualize the impact of different grid mixes on the produced hydrogen (see Figure 3). Individual data points for grey, blue, and green hydrogen correspond to the values of the GWP listed in Table 1. The dotted grey line marks the average global direct impact of hydrogen production.
For three of the four considered electricity grid mixes, the resulting hydrogen carbon footprint is higher than the footprint of natural gas-based steam reforming hydrogen production (grey H2; the three upper points result from coal-based steam reforming) and thus ultimately less favourable from a climate change perspective than the direct use of natural gas in the processes.

2.2.4. Future Outlook (2030–2040)

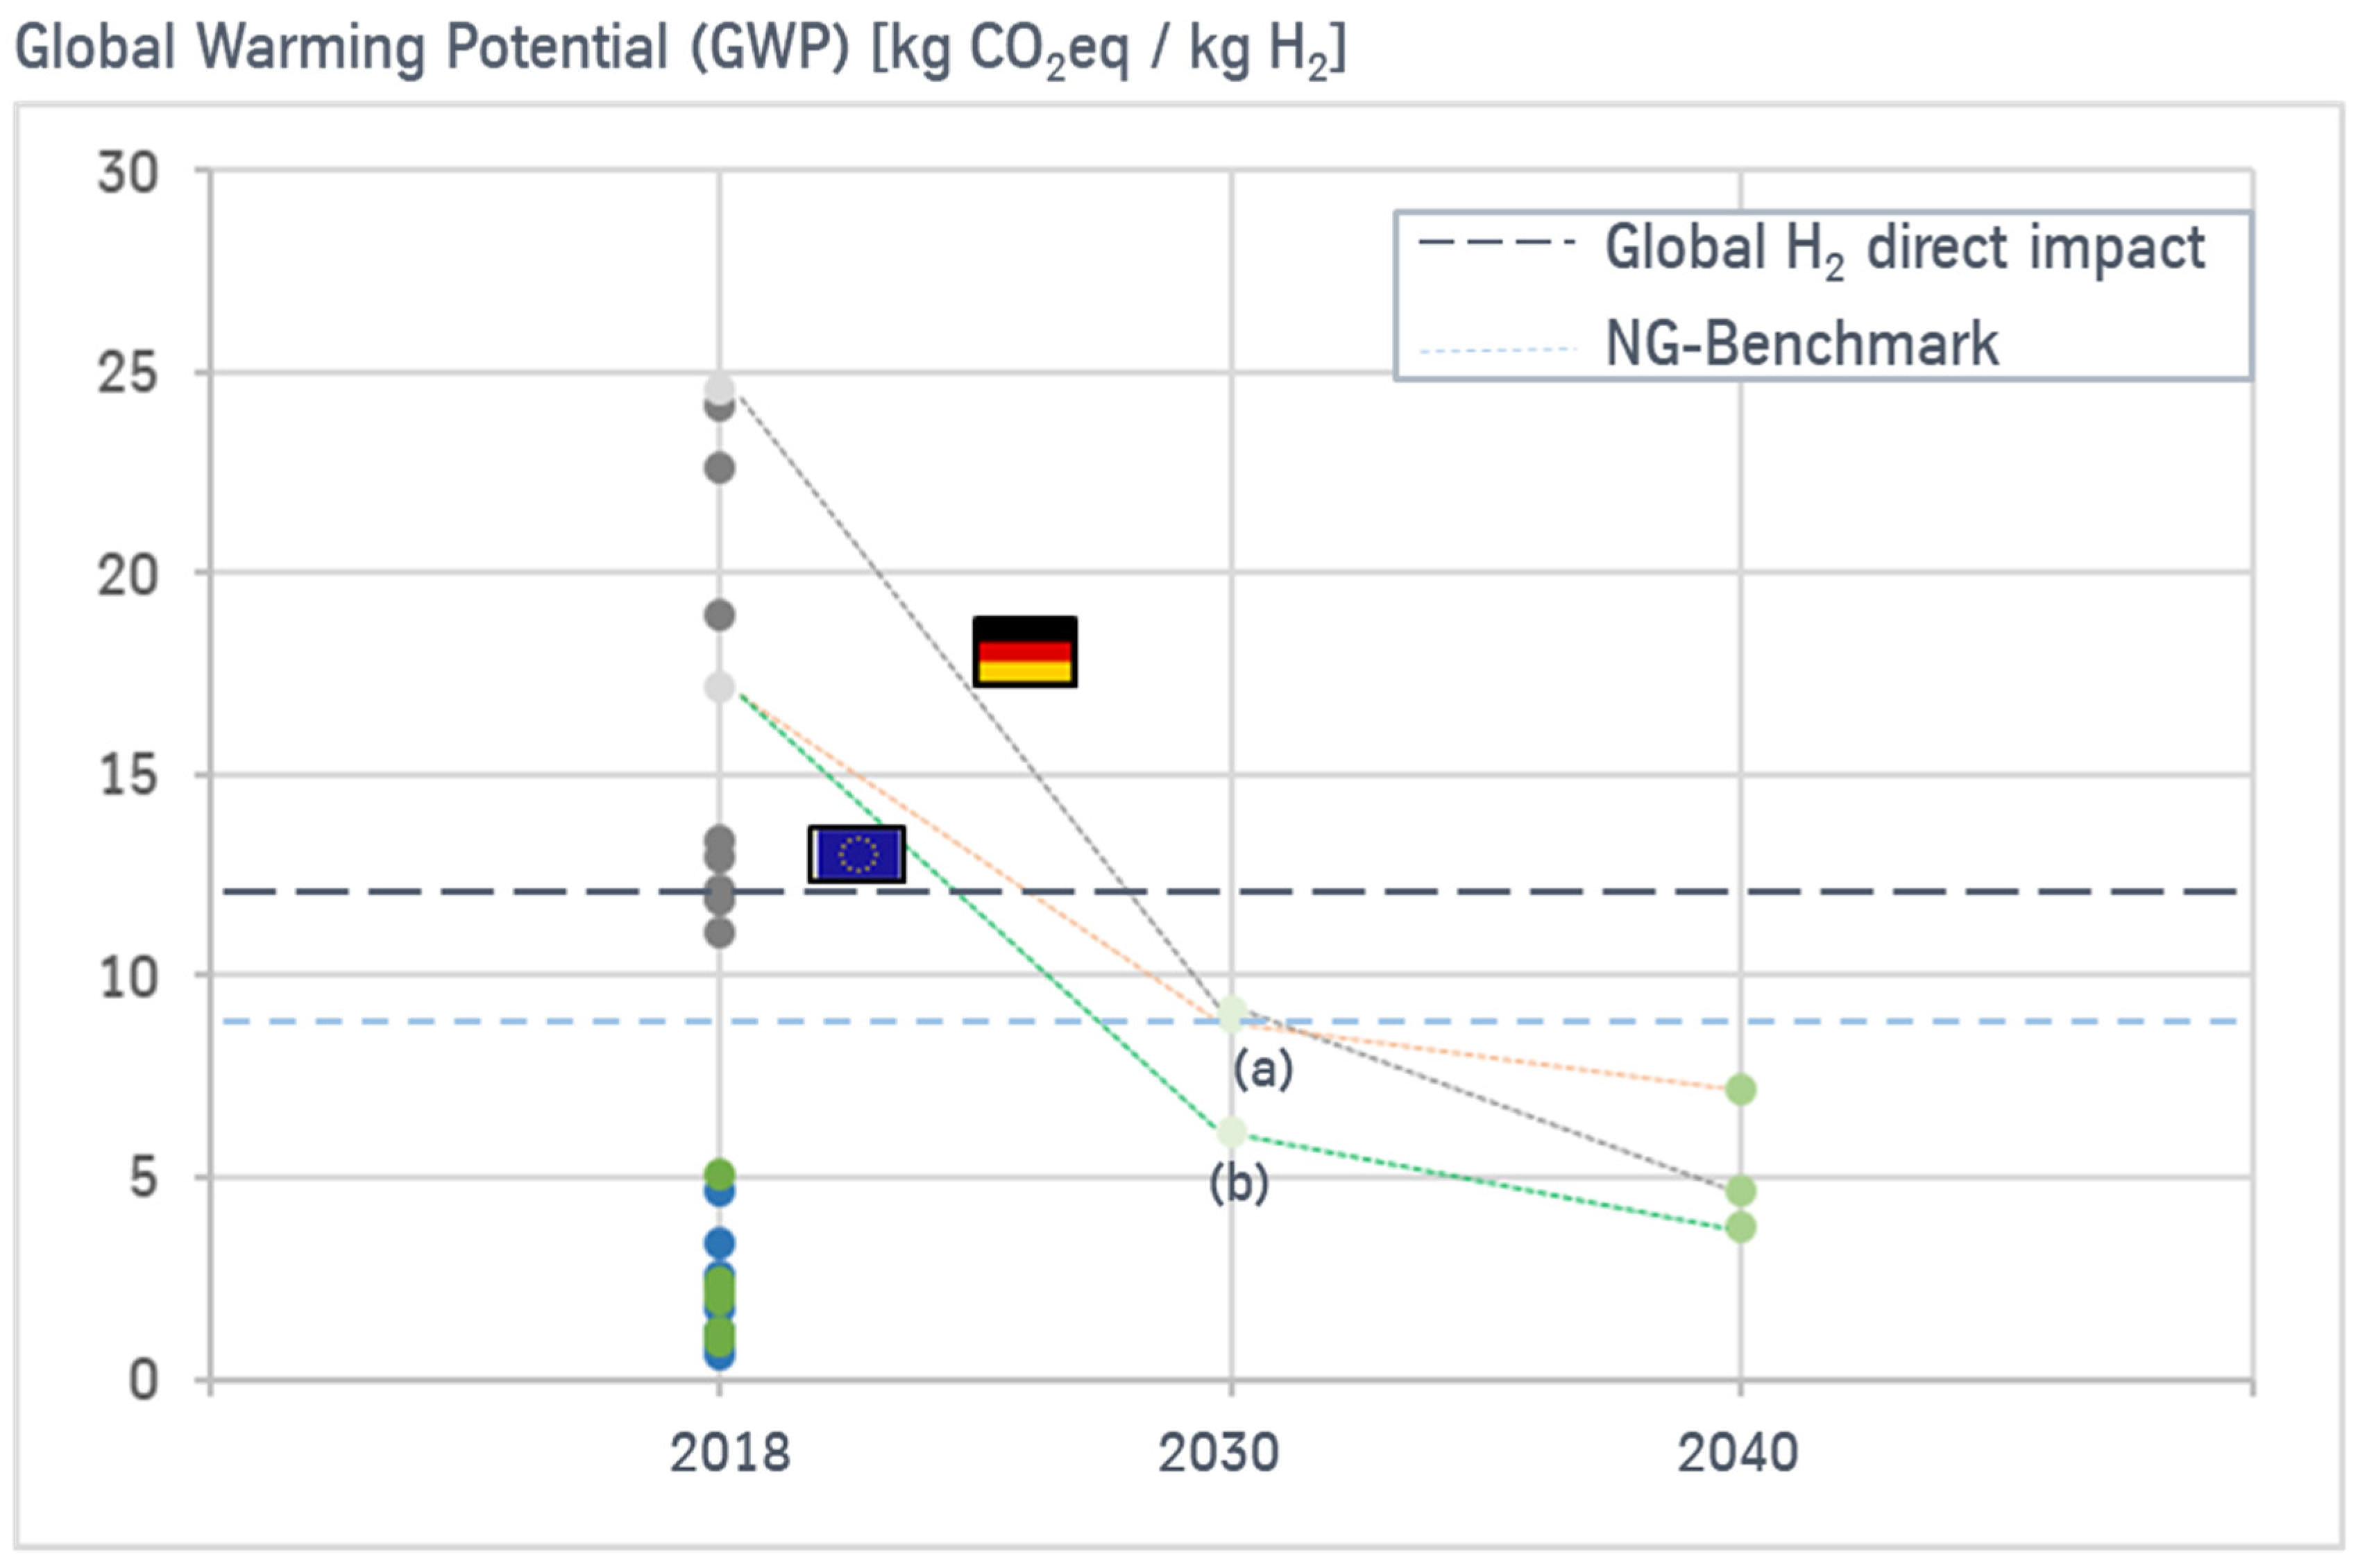
In the following paragraph, an outlook on the future for the years 2030 and 2040 is given. The development of the hydrogen carbon footprint depending on the prognosis of the electricity mix and the efficiency of the electrolysis process (Table 2) is shown in Figure 4 for Europe and Germany. The results are listed next to the carbon footprint values found in the literature (Table 1). The lower blue line highlights the benchmark of the hydrogen carbon footprint. Below this line, the same amount of energy can be obtained with hydrogen, instead of natural gas, while resulting in a lower carbon footprint. The upper grey line marks the average worldwide direct impact of hydrogen production. For the European development, a stated policy scenario (a) and a sustainable development scenario (b) are considered, based on the IEA [34]. The German development scenario is based on Prognos et al. [35].
It is shown that, by 2030, the use of hydrogen is expected to result in lower impacts to the GWP than the use of natural gas.

3. Carbon Footprint of Steel Produced Using a Natural Gas-Based Direct Reduction Plant and an Electric Arc Furnace

Steel production using direct reduction (DR) plants and electric arc furnaces (EAFs) allows a shift in production away from coal towards natural gas and hydrogen. From a climate change perspective, it is shown that the use of natural gas can be superior to the use of hydrogen, especially in the coming years (before 2030). In the following section, the carbon footprint assessment of natural gas-based steel production is presented. This serves as the benchmark for hydrogen-based steel production, which is presented afterwards.

3.1. Goal and Scope

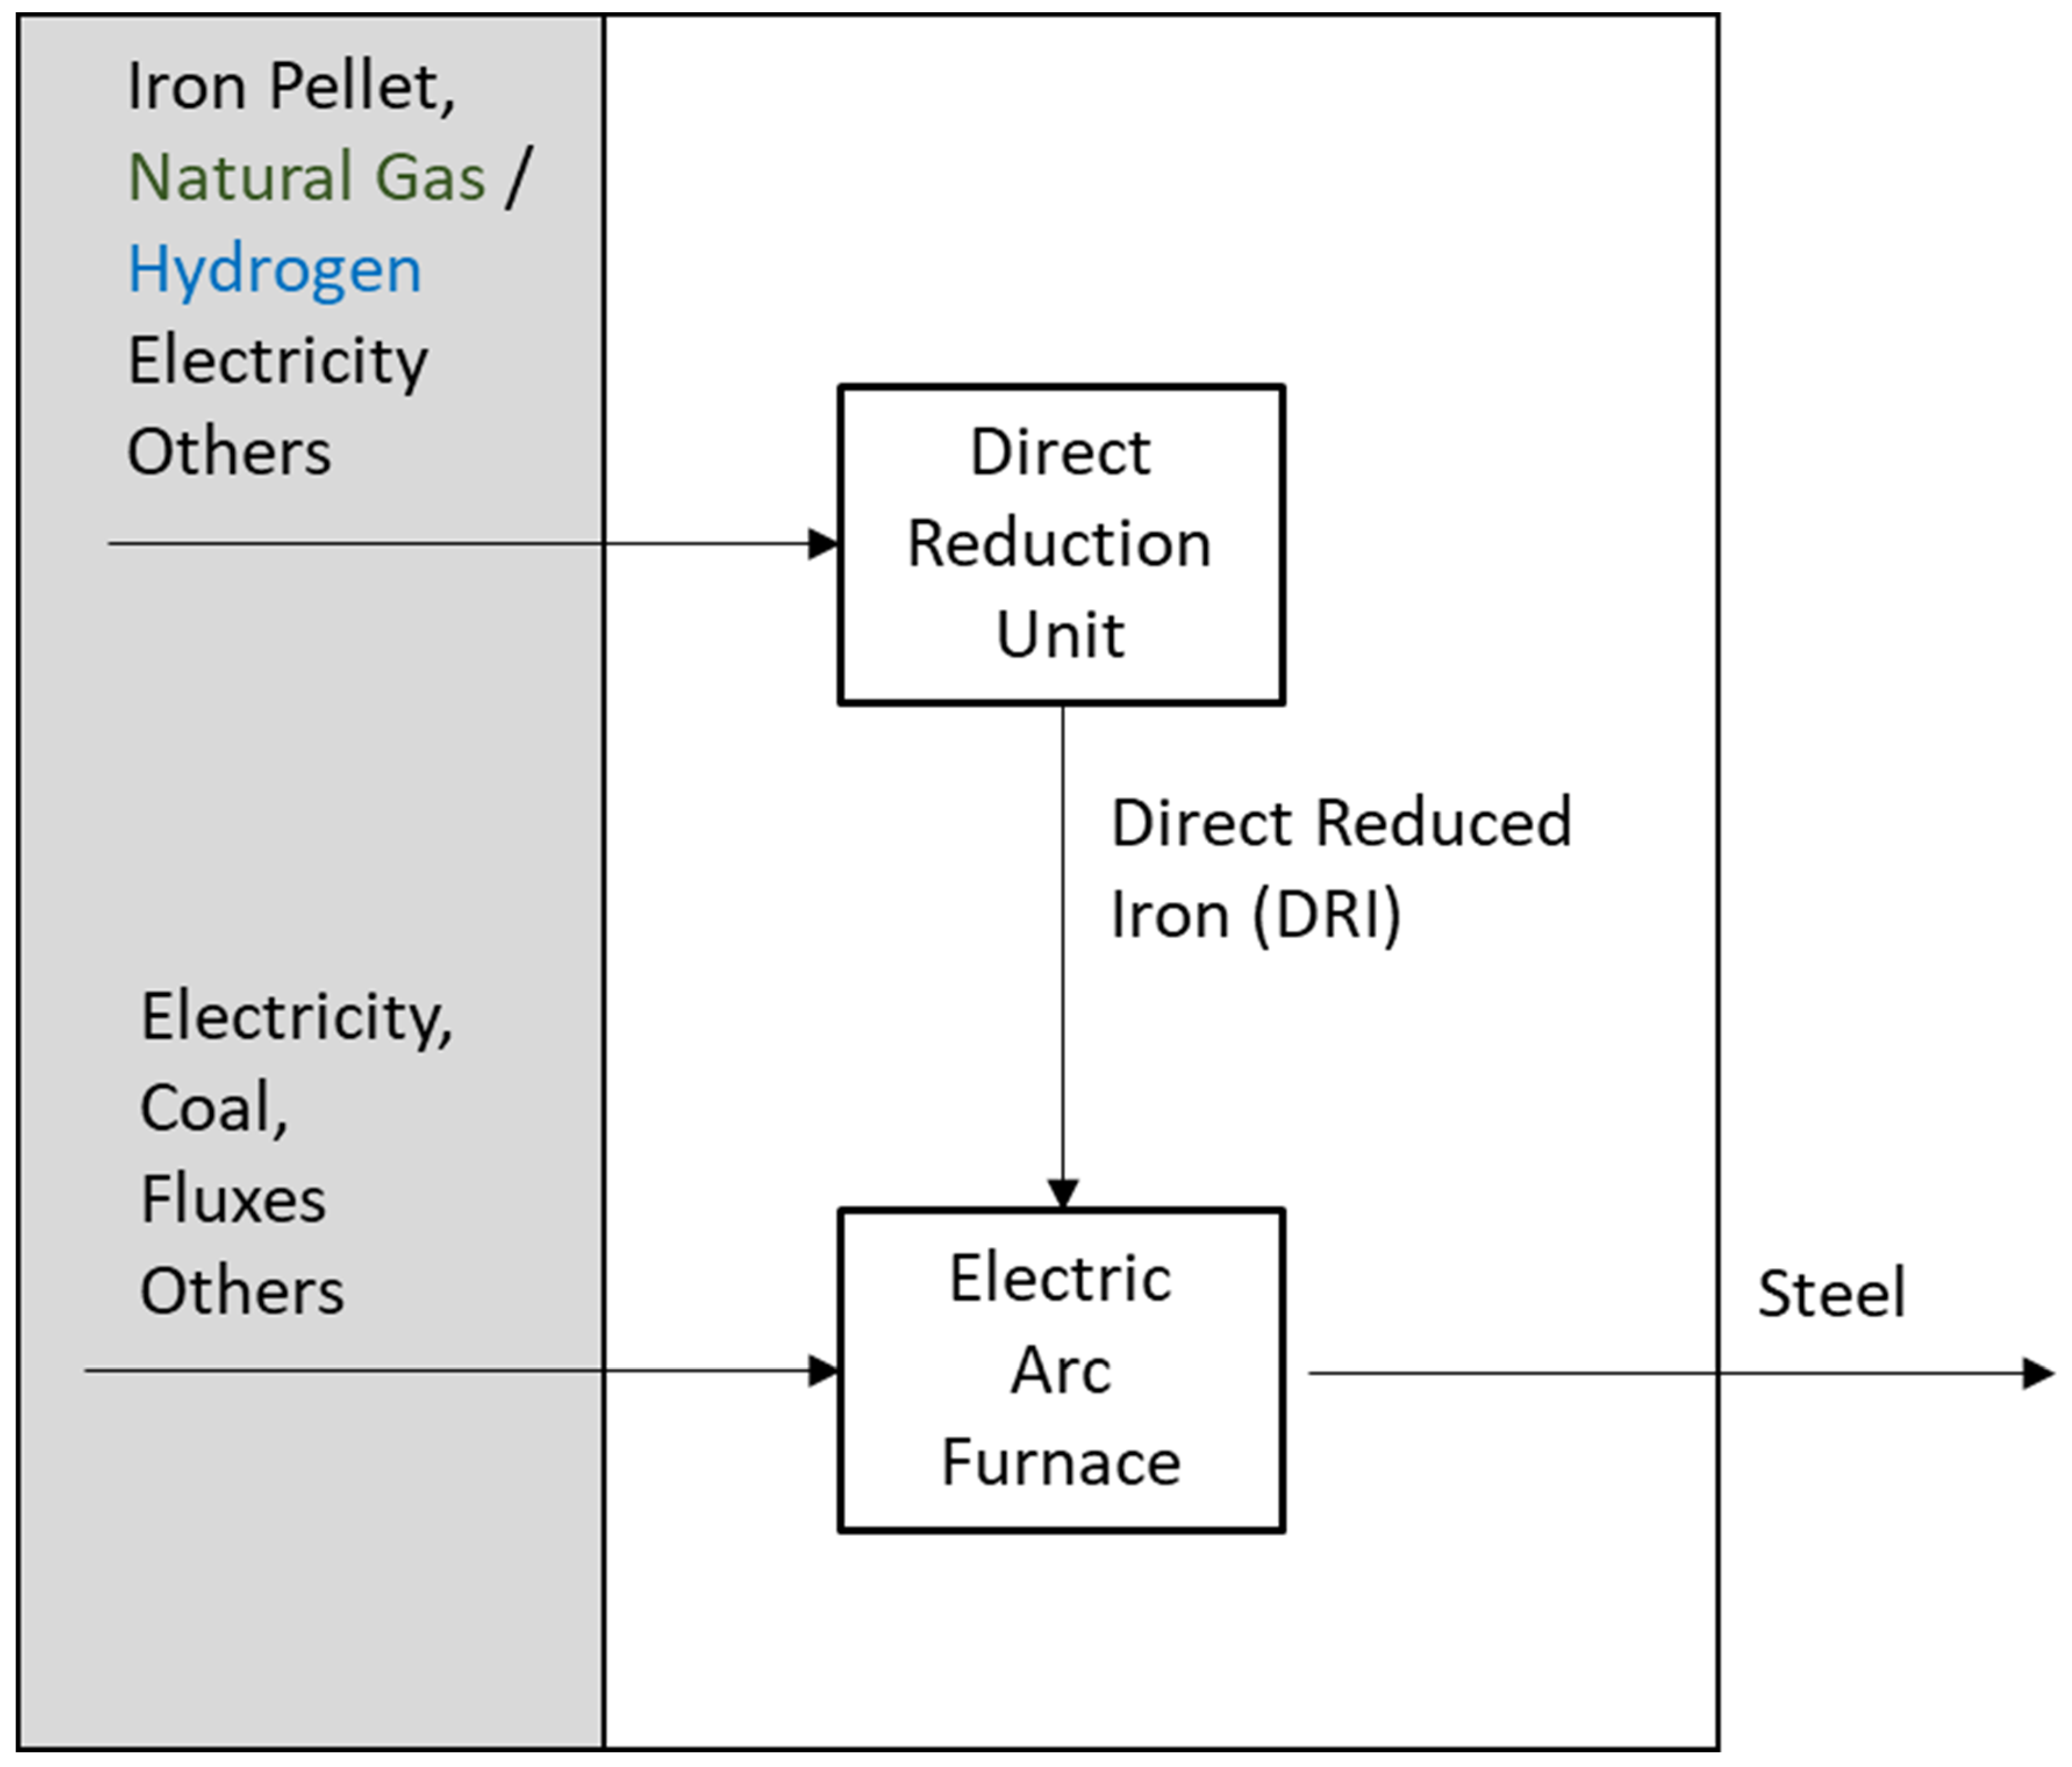
The goal is to present the carbon footprint of steel (cradle to gate) produced using natural gas-based direct reduction with subsequent melting in an electric arc furnace (EAF) (see Figure 5). The steel manufacturing processes include a DR plant and an EAF as well as steel casting (Figure 5, white area). The processes of the mining, manufacturing, and transport of the required feedstock are categorized as upstream processes (grey area). Both the manufacturing and upstream processes are considered in this study.
The direct reduction unit is modelled in this study. As a baseline, natural gas is used in the direct reduction process as the reducing agent. As an alternative reducing agent, hydrogen can replace natural gas.
For the EAF process, GaBi database “DE: EAF Steel billet/slab/bloom” is used. This process references the scrap-recycling EAF process. Consequently, all environmental impacts from raw material supply, transport, and manufacturing until the product of steel is obtained (cradle-to-gate) are included, without considering the environmental impact of the scrap. In this work, the same process is used for the DRI input. No scrap input is assumed. The results presented follow the recycled content methodology, so no credits are given for end-of-life scrap [37]. Compared with the environmental impact of the whole process chain, the differences between a scrap-based EAF operation and a DRI-based EAF operation are of minor importance, as highlighted in internal studies. In addition, the focus of this article is on comparisons between different direct reduction–EAF (DR-EAF) scenarios. Since, in all DR-EAF routes, the same assumptions are made, the sensitivity to the differences between these scenarios is hardly influenced by this uncertainty of measurement.

3.2. Life Cycle Inventory

The data for the direct reduction process are based on internal communication. The data for the natural gas-based operation are in line with the ones presented by Duarte et al. (2008) and Sarkar et al. (2017) [17,38]. The electric energy demand of the EAF depends on the charging temperature, the carbon content, and the grade of metallization of DRI, amongst others [39,40]. The electric energy demand of the EAF is estimated at 500 kWh/t steel. In this scenario, a German electricity mix of the year 2018 is assumed.
Considering the DR process, at least 99% of relevant mass, energy, and environmental input and output flows are considered. Regarding the EAF process, at least 95% of mass and energy and 98% of their environmental relevance are considered according to the GaBi database [11].
The major materials and energy feedstocks of natural gas-based steel production using a DR plant and an EAF are presented in Table 4. Other inputs, such as oxygen, nitrogen, coal, and fluxes (Figure 5), are not listed in the table but are considered in the carbon footprint assessment according to the defined cut-off criteria. The listed data are the most relevant to the comparison of the assessed scenarios.
The emissions of the life cycle inventory (LCI) are presented in Table 5. The contribution of the listed emissions to climate change is at least 99%.
The main contributor to climate change is carbon dioxide. Methane emissions are mainly caused by the natural gas supply for the DR plant. In addition, methane is emitted during coal mining, which is required for the coal-based electricity supply.

3.3. Carbon Footprint Results

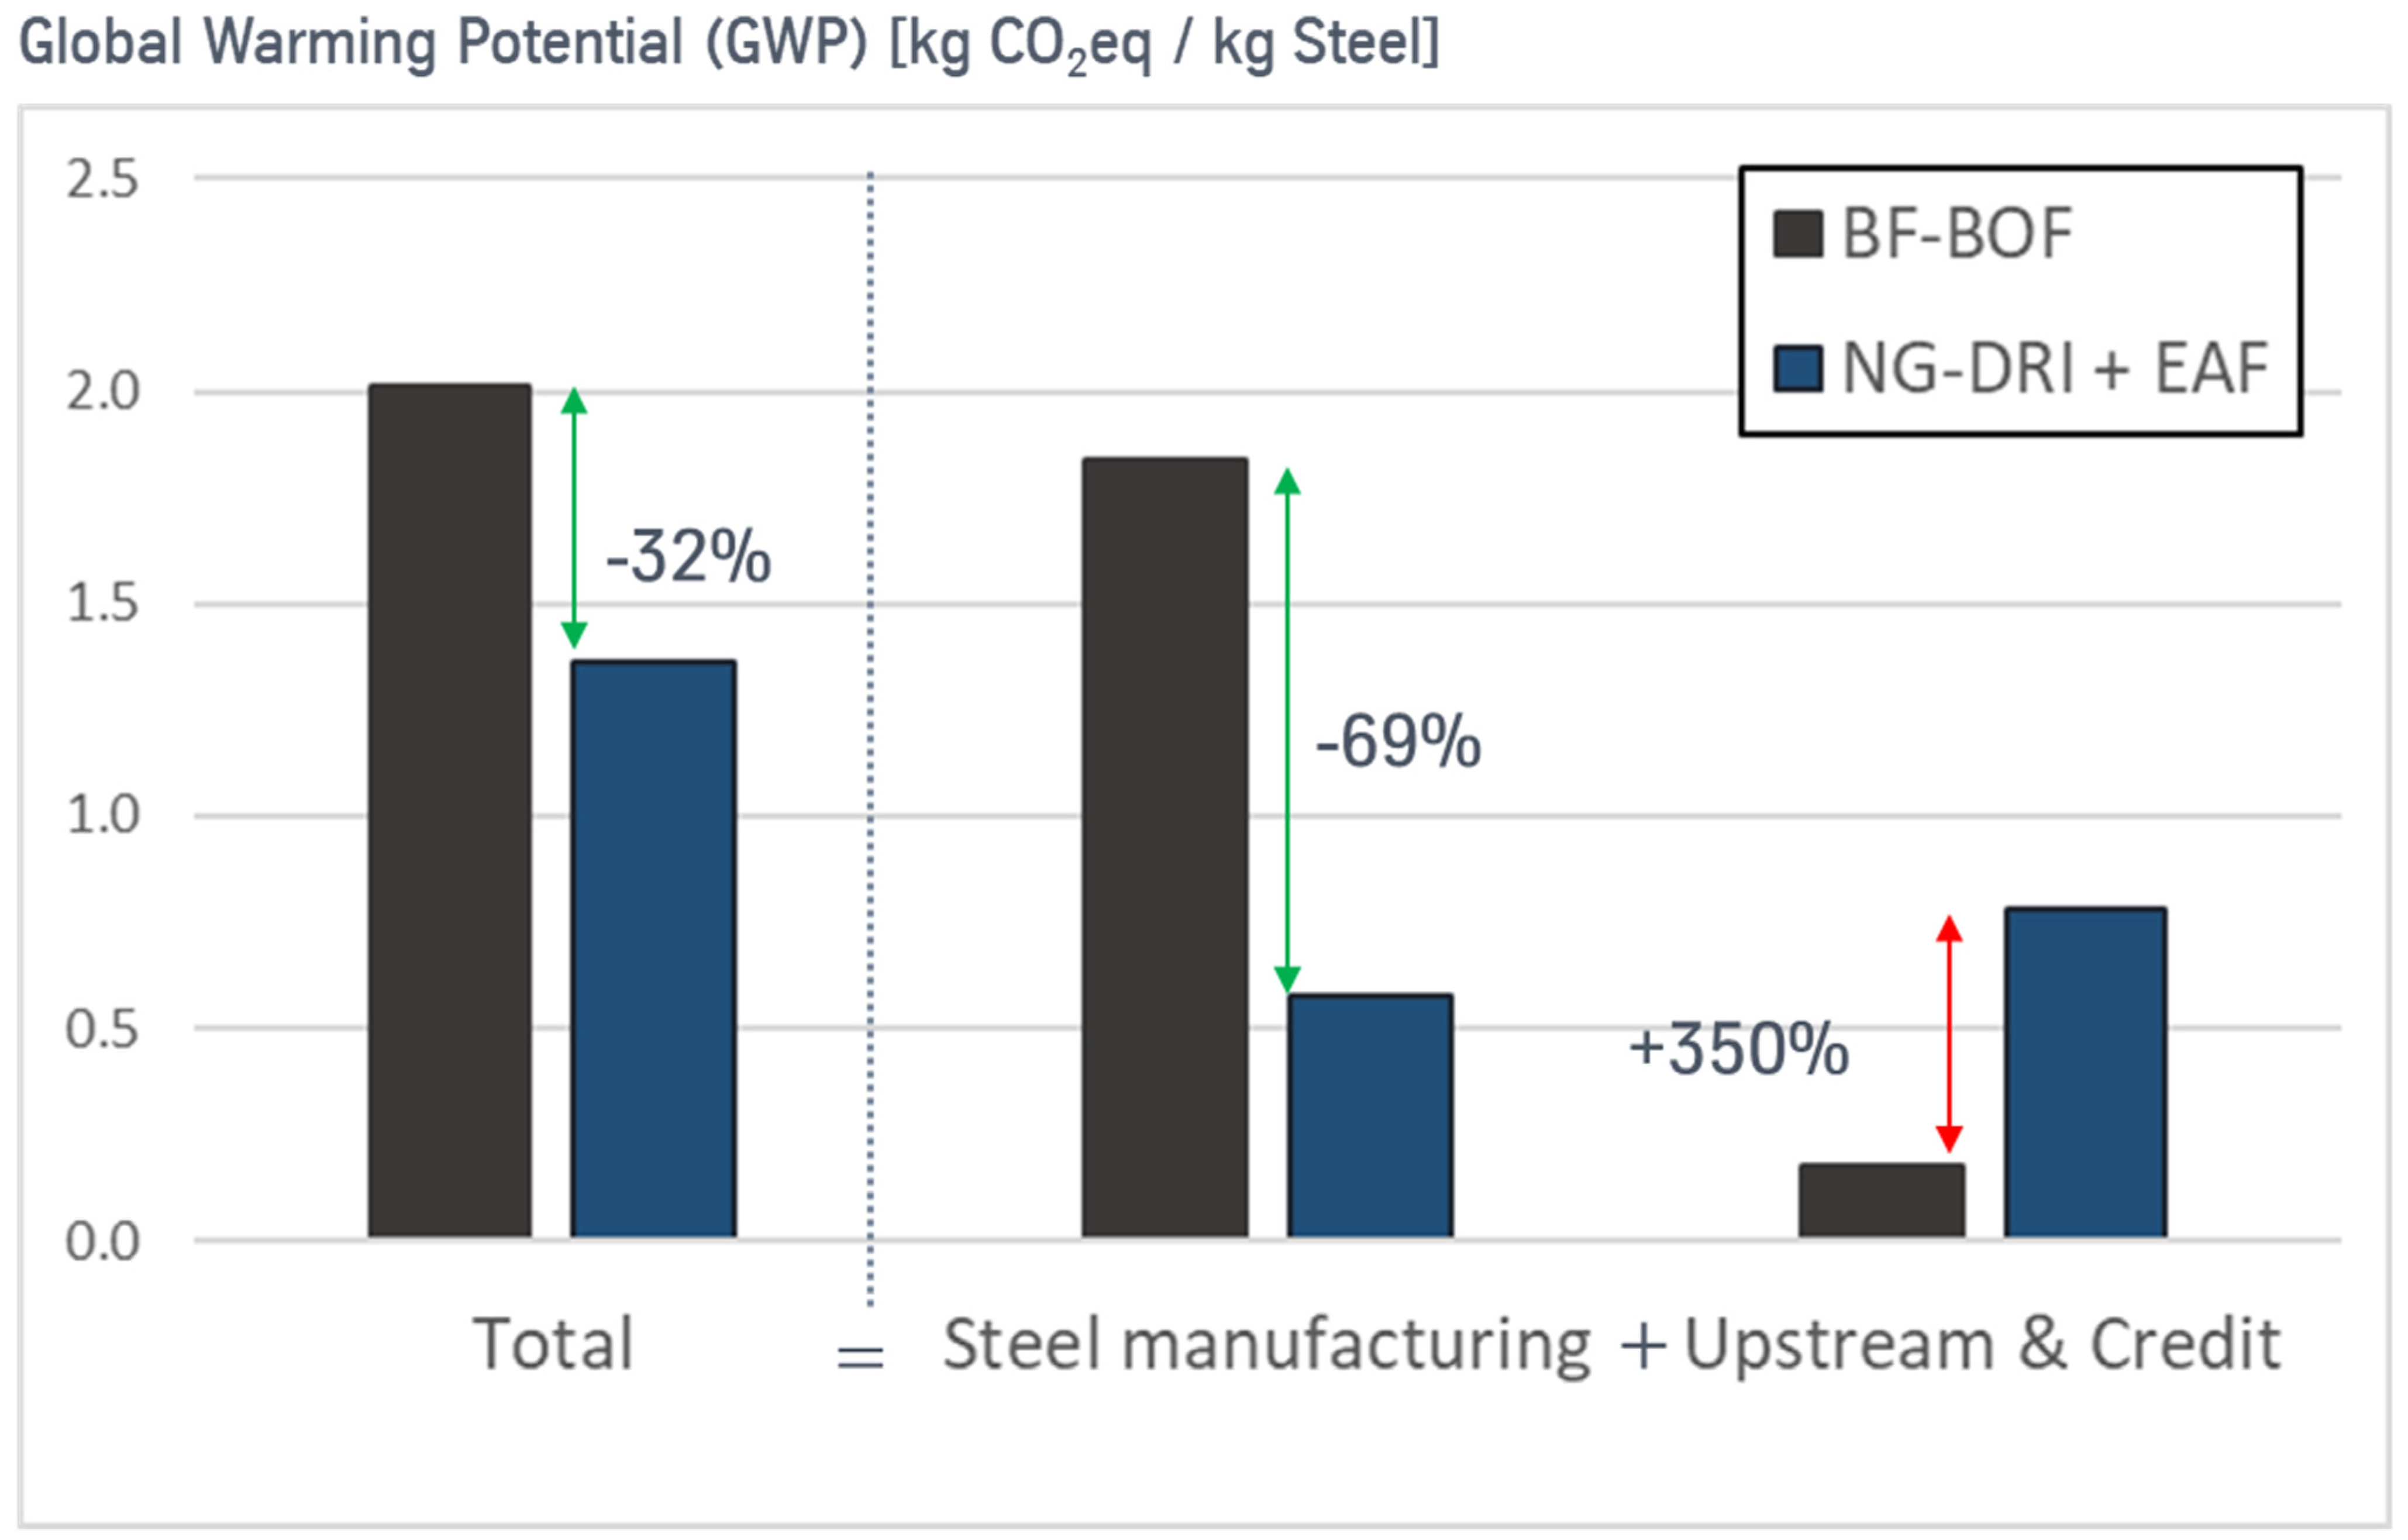
The carbon footprint of primary steel produced with natural gas-based direct reduction with subsequent use in an electric arc furnace (NG-DR-EAF route) can be reduced to 1.4 kg CO2eq/kg steel, as is highlighted in Figure 6.
Compared with the carbon footprint of primary steel produced using the conventional state-of-the-art BF-BOF route of 2.0 kg CO2eq/kg steel (Figure 1), a reduction potential of 32% can be achieved. Part of the impact on climate change is shifted from the steel manufacturing processes to upstream processes. The categorization is in line with Figure 5.
E.g., in the BF-BOF route, a surplus of electricity is generated, which can be exported into the grid mix, resulting in credits. In contrast, the DR-EAF route consumes electricity. This reduces the manufacturing impact of the DR-EAF route, but part of this impact shifts to electricity production. In addition, in the DR-EAF route, less valuable co-products are produced in comparison to the BF-BOF route. In the blast furnace process, slag is produced, which serves as a high-quality cement substitute. The slag from the EAF process does not have the same quality and has limited utilization paths. Nevertheless, the total impact of steel on climate change is significantly reduced.
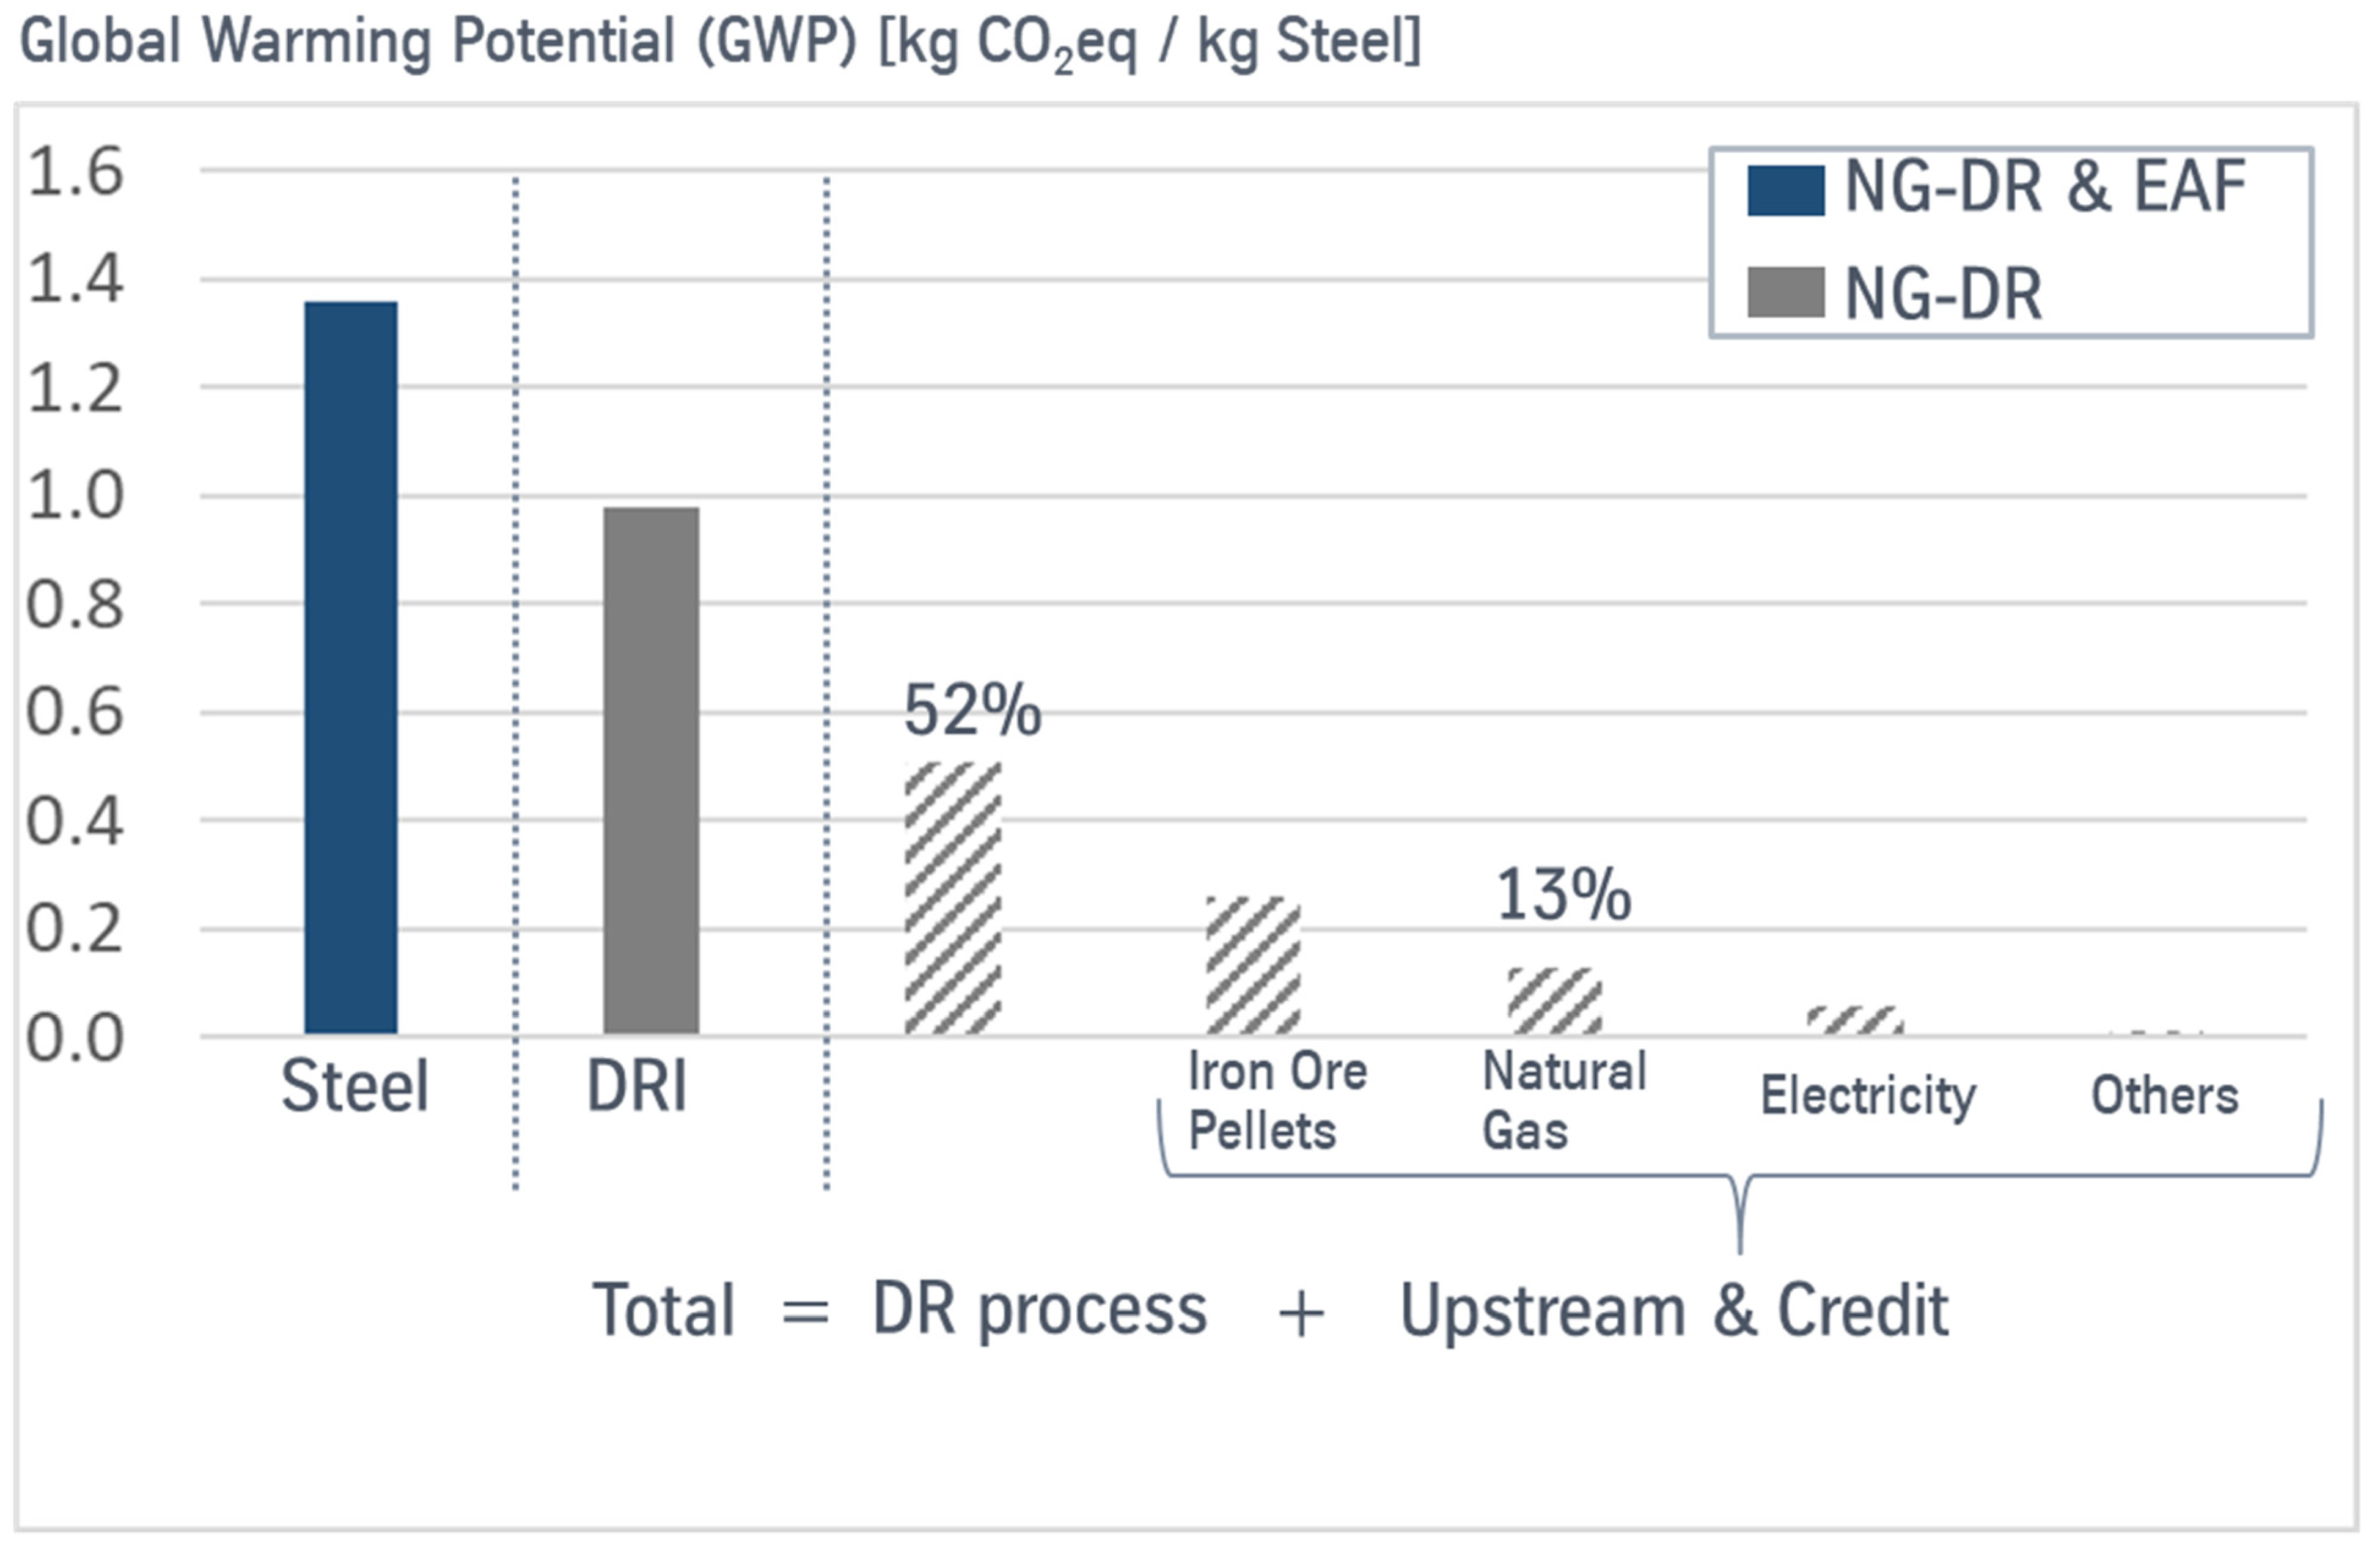
The major impact of the DR-EAF-route-produced steel carbon footprint originates from the production of DRI, which is 0.98 kg CO2eq/kg steel (see Figure 7).
The results demonstrate that the impact on climate change generated by GHG emissions of natural gas-based direct reduction and the respective upstream emissions of the natural gas supply add up to 65% of the DRI carbon footprint. Consequently, the substitution of natural gas with hydrogen from electrolysis could present a possibility to reduce the DRI carbon footprint, thus lowering the steel carbon footprint. Therefore, the following section focuses on production with hydrogen.

4. Carbon Footprint of Steel Produced Using a H2-Based Direct Reduction Plant and an Electric Arc Furnace

The next step for the decarbonization of the steel industry is a shift from natural gas towards hydrogen from electrolysis. Therefore, hydrogen production as well as the required electricity for production have to be taken into account. The impact of the electricity sources on the respective carbon footprints of DRI and steel is presented in the following paragraphs. Forecast scenarios until 2040 are presented.

4.1. Goal and Scope

The system boundary remains cradle to gate and is shown in Figure 5. The subsystem of the hydrogen production process is shown in Figure 2. The declared unit is 1 kg of steel. It is assumed that hydrogen is used as the reducing gas for the DR plant as well as for the gas preheater. No scrap input is assumed. The results presented follow the recycled content methodology, so no credits are given for end-of-life scrap [35].

4.2. Life Cycle Inventory

Concerning the DR process, more than 99% of environmentally relevant mass and energy input and output flows are considered. Regarding the electrolysis process with the respective electricity mixes and also for the EAF process, at least 95% of mass and energy input and output flows, and 98% of their environmental relevance are considered according to the GaBi database [11].
The major materials and energy feedstocks of hydrogen-based steel production using a DR plant and an EAF are presented in Table 6. Other inputs, such as nitrogen, coal, and fluxes (Figure 5), are not listed in the table but considered in the carbon footprint assessment according to the defined cut-off criteria. The listed data are the most relevant to the comparison of the assessed scenarios.
The electricity input for hydrogen electrolysis as well as for the processes of the DR plant and EAF is 17 MJ/kg steel.
Of the 17 MJ electricity input, 2.0 MJ/kg steel is required for the DR plant and the EAF process, whereas 15 MJ/kg steel of electric energy is required as input for the electrolysis process.

4.3. Carbon Footprint Results

Before presenting the results of hydrogen-based steel, the carbon footprint of the intermediate product, DRI, is presented, to separate the effects of hydrogen from those of natural gas (see Figure 8). The carbon footprint of DRI strongly depends on the respective electricity mix that is used for the electrolysis of hydrogen. The respective system boundaries are in line with Figure 2 and Figure 5, but the EAF process is cut off for reasons of comparability. The carbon footprints of the corresponding electricity mixes and hydrogen are presented in Figure 3.
The results show that in three out of four scenarios, it is better, from a climate change perspective, to operate the DR plant with natural gas instead of hydrogen. The carbon footprint of H2-based DRI in France is comparably low due to a high share of nuclear energy in the national grid mix. The carbon footprint of NG-based DRI is 0.89 kg CO2eq/kg DRI. In countries with moderate-to-high carbon intensity in electricity production, it is better to use natural gas directly in the DR plant than using hydrogen. In order to reach climate neutrality in the steel industry, national and European grid mixes have to be decarbonized.
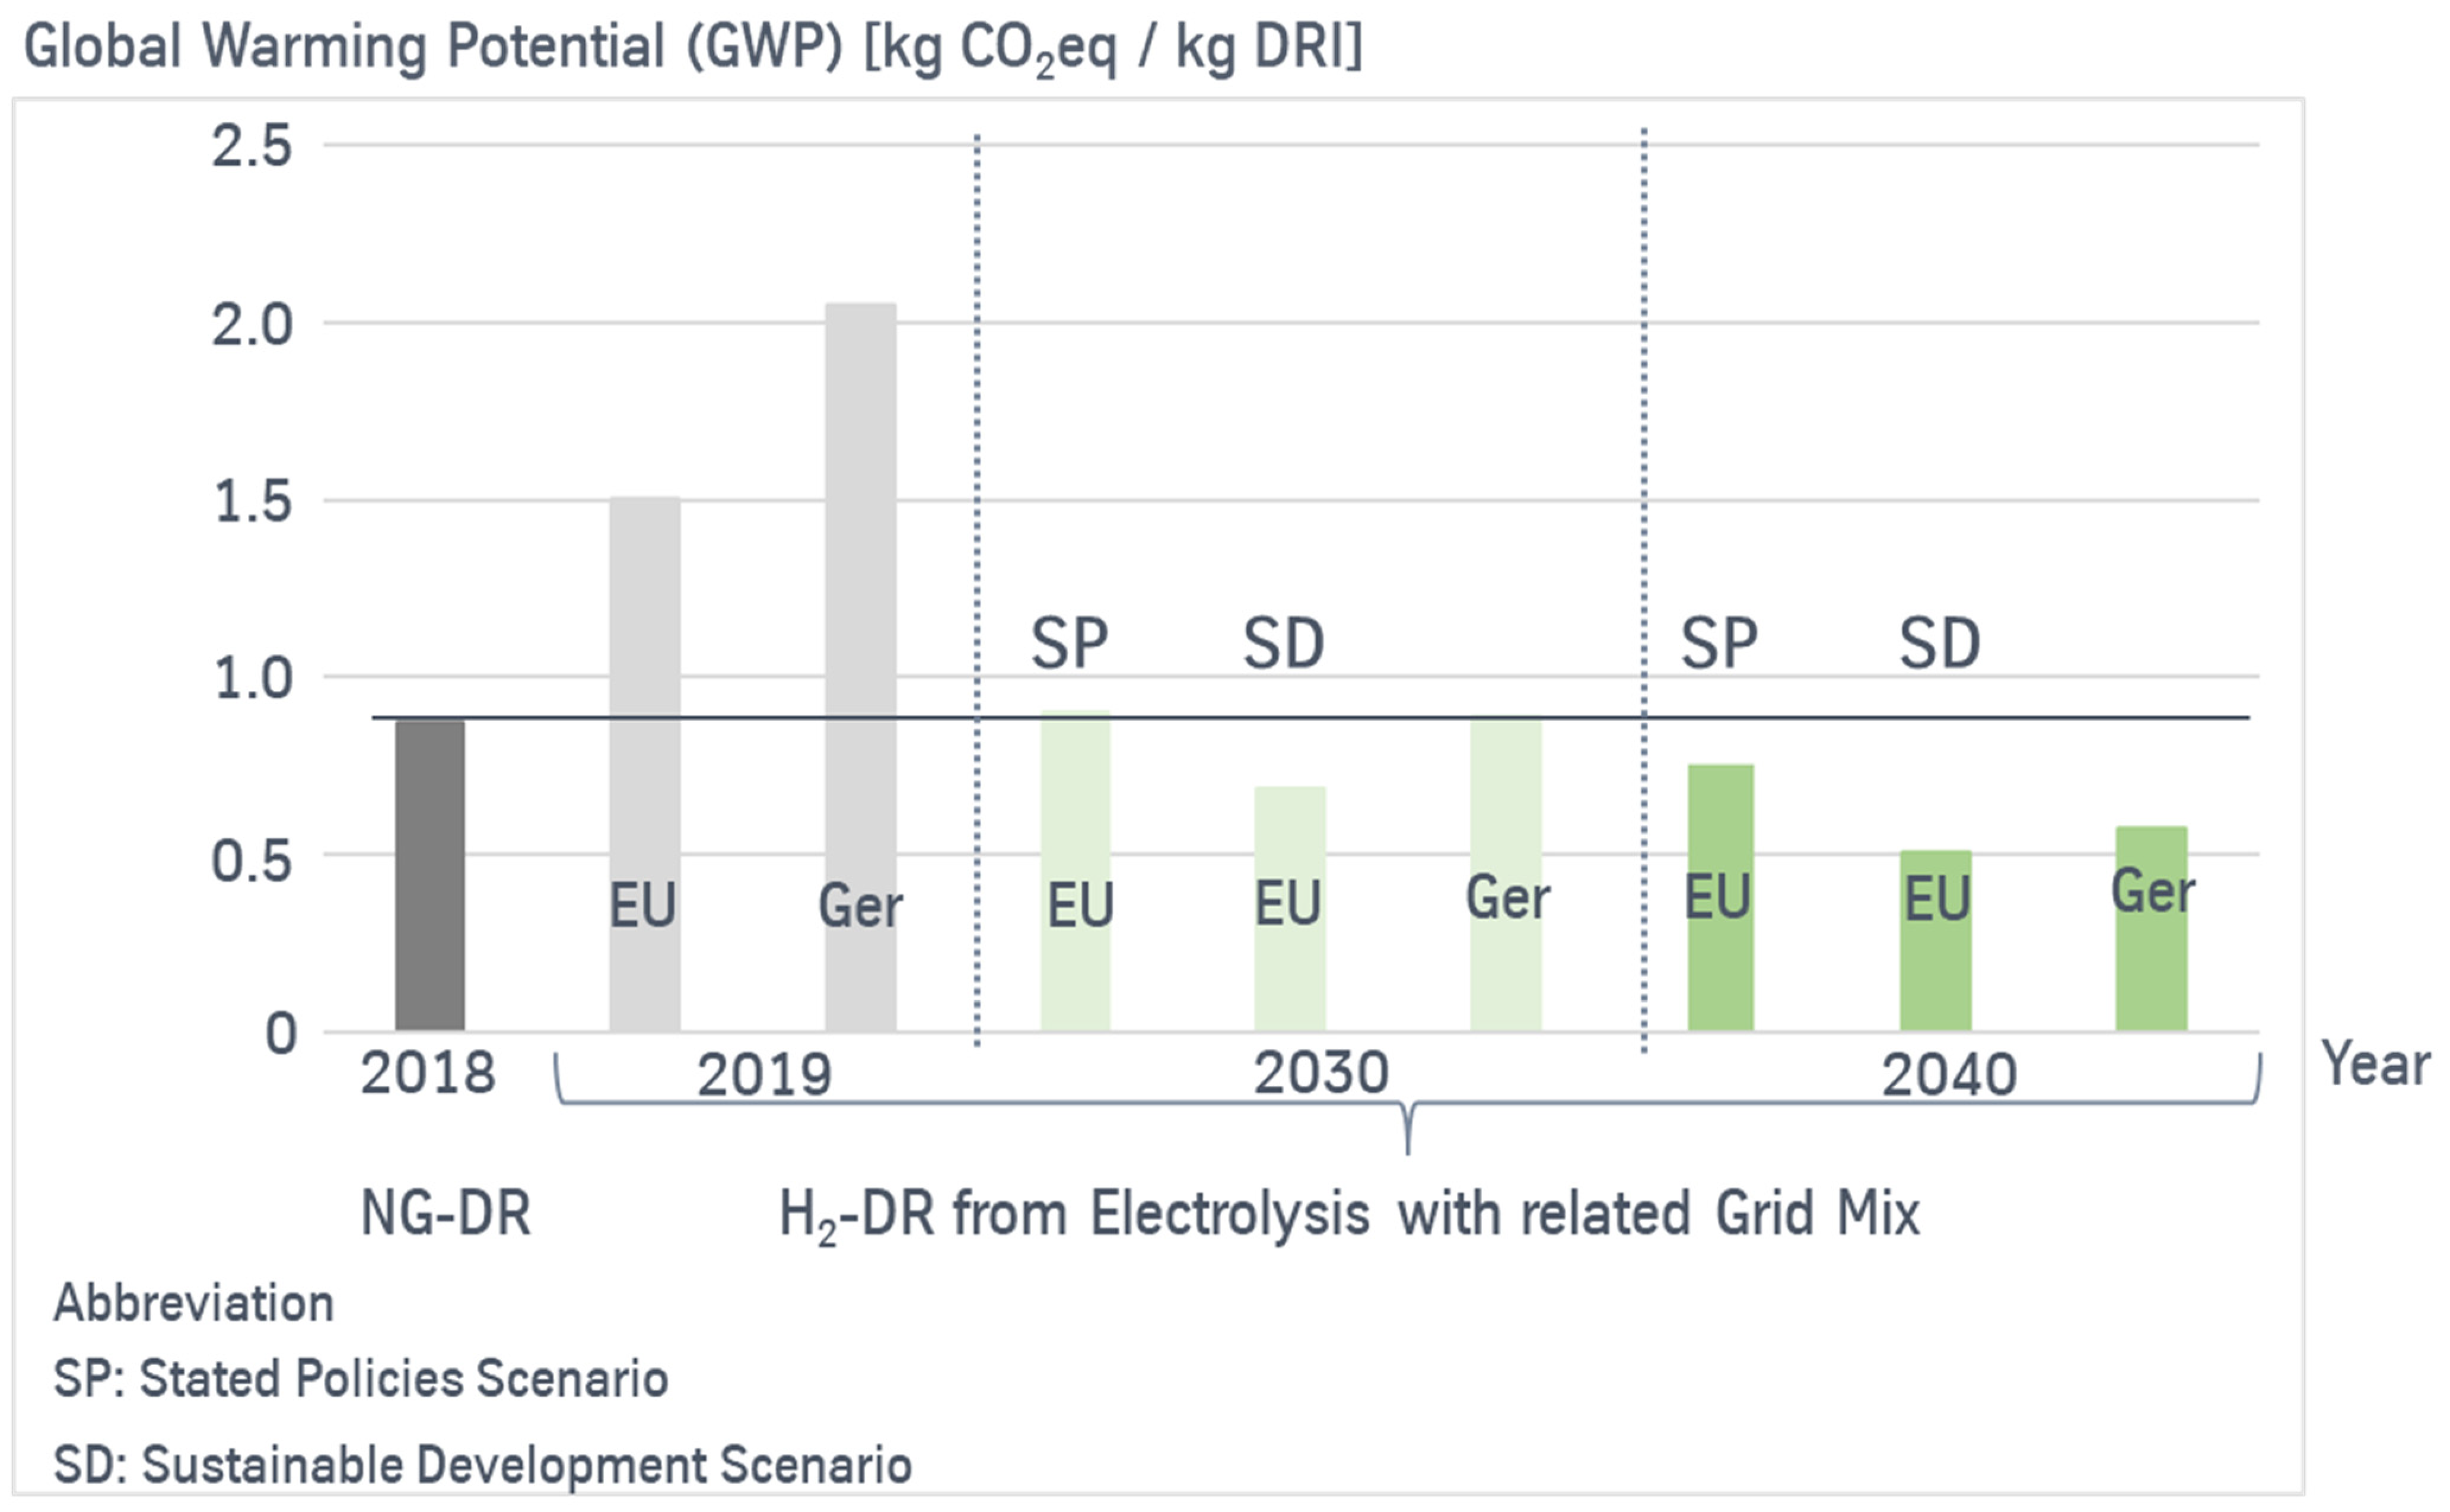
Concerning the German and European electricity grid mixes, a forecast scenario until 2040 is presented in Figure 4. Based on this forecast, the expected DRI future carbon footprint is shown in Figure 9. The respective system boundaries are in line with Figure 2 and Figure 5, but the EAF process is excluded to separate the effects of hydrogen from those of natural gas.
From 2030 onwards, it would be more preferable to use hydrogen than natural gas for DRI production.
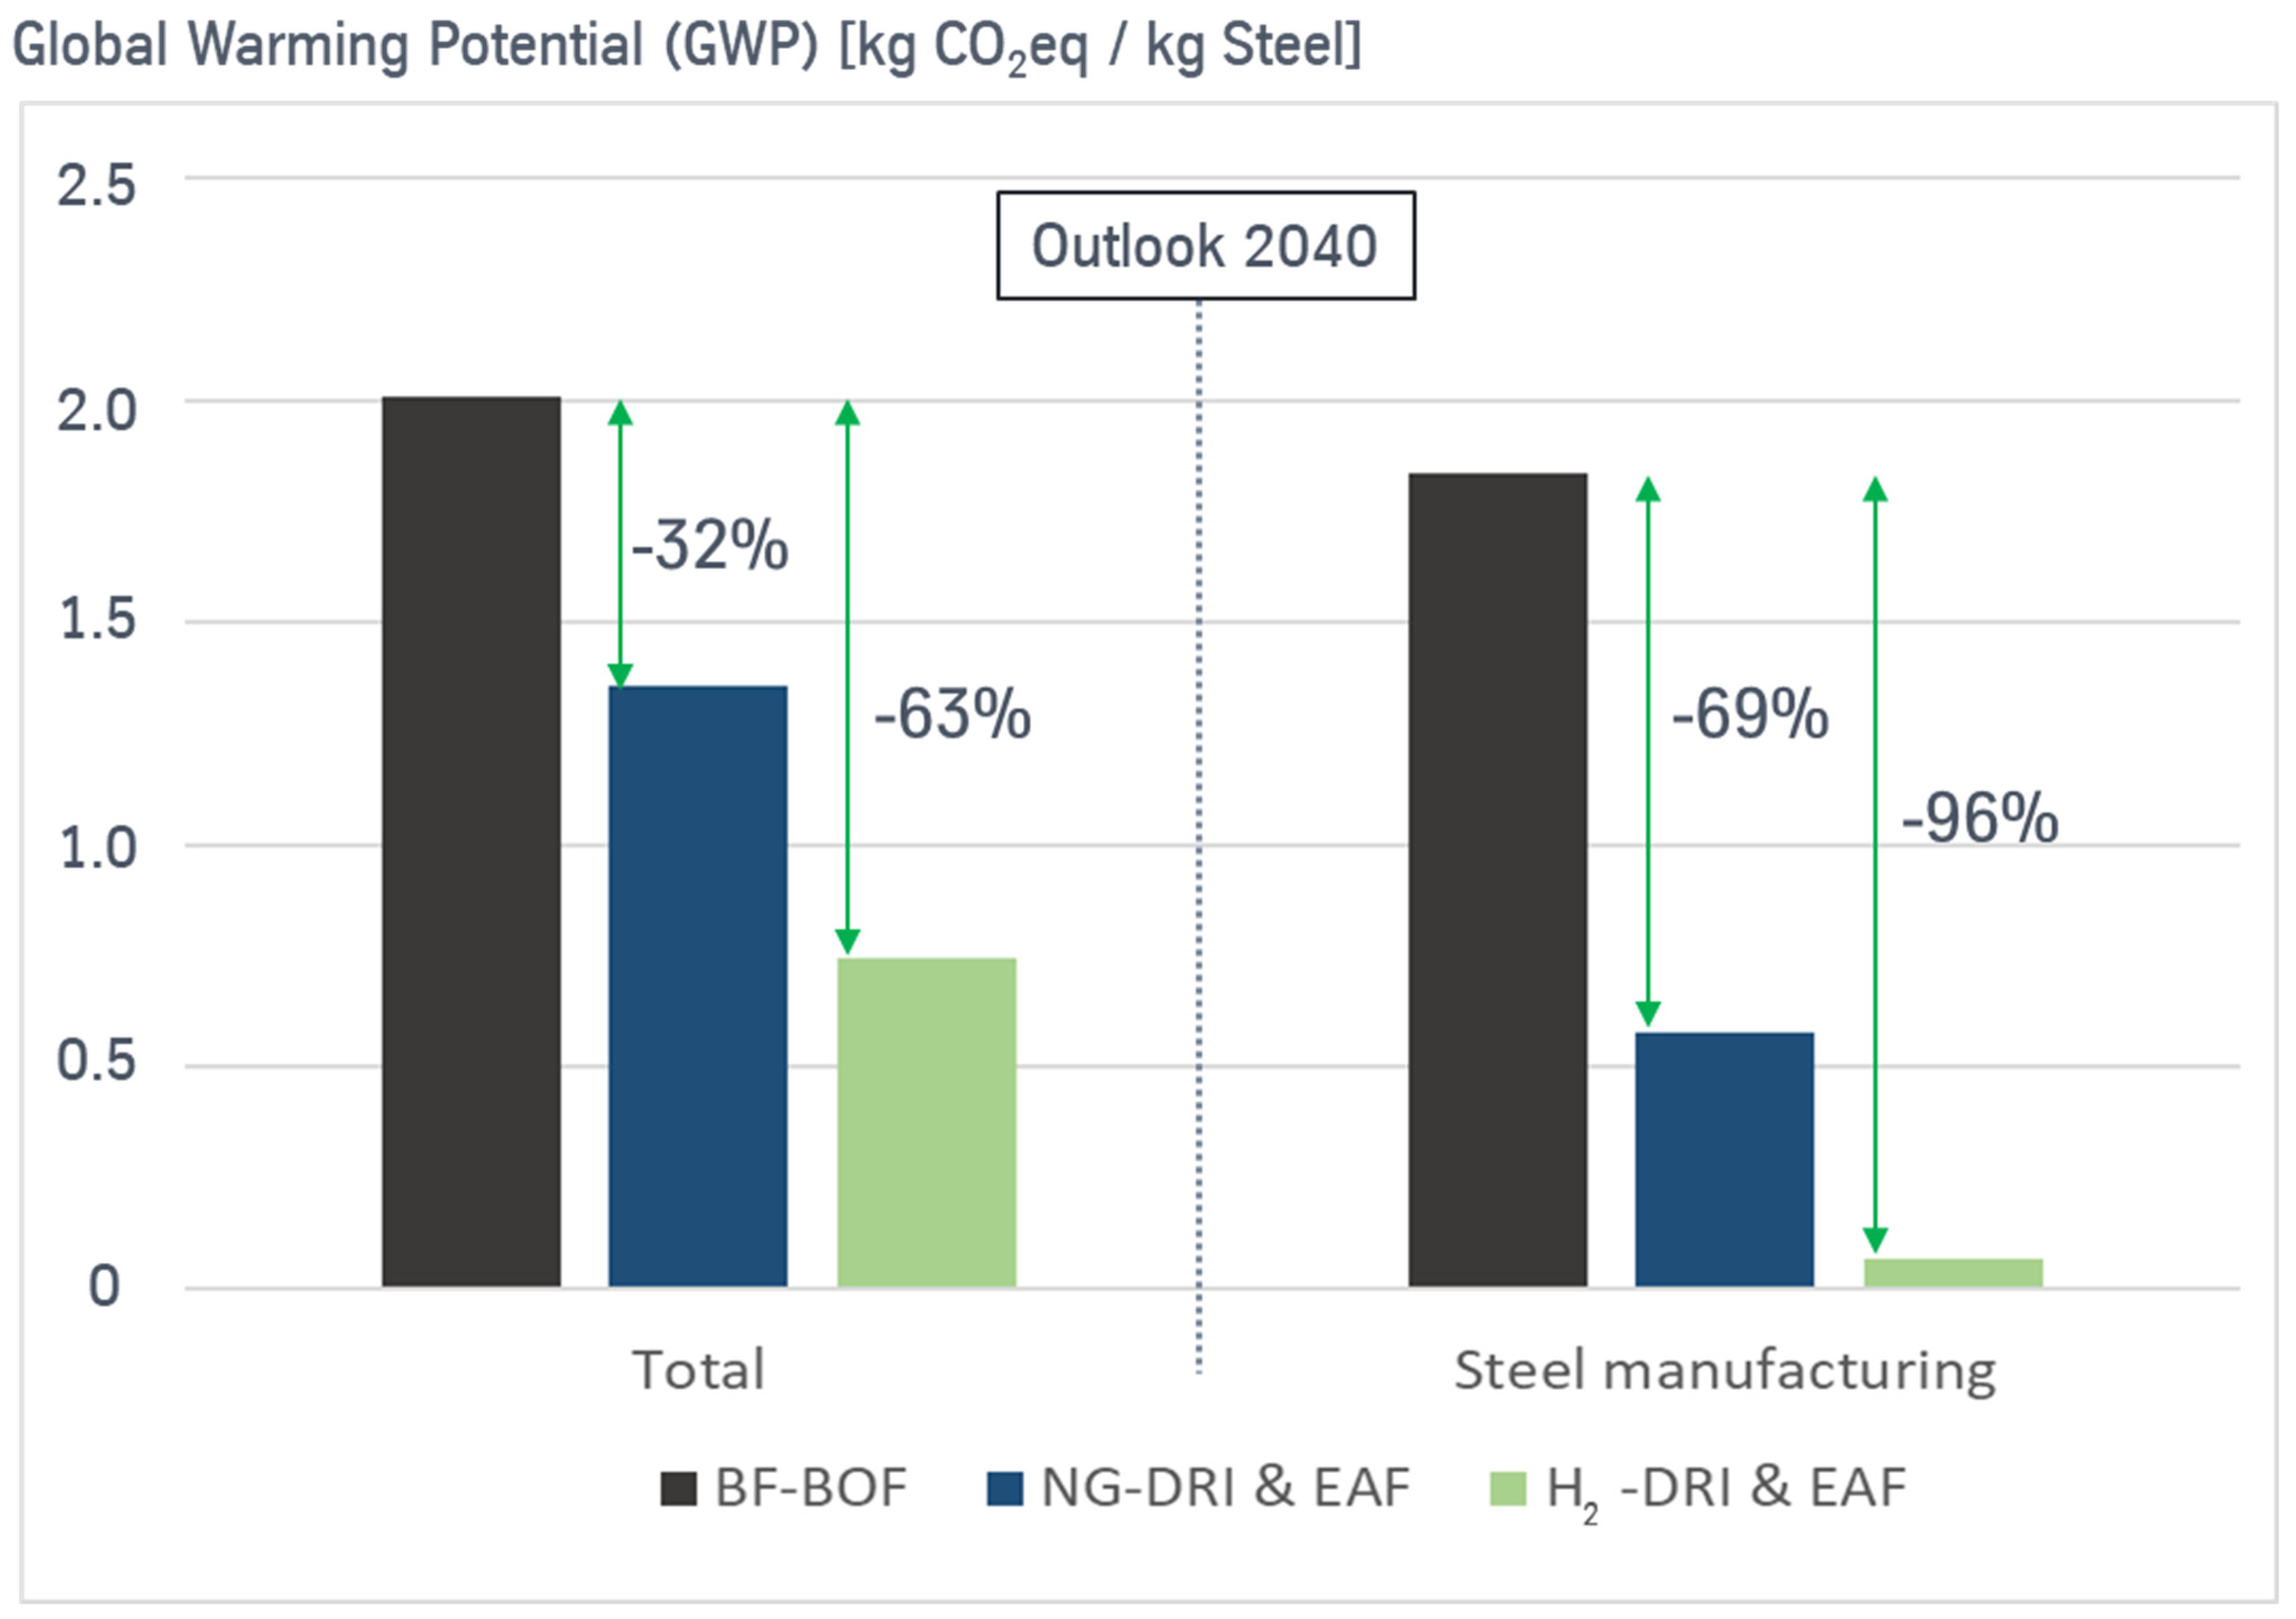
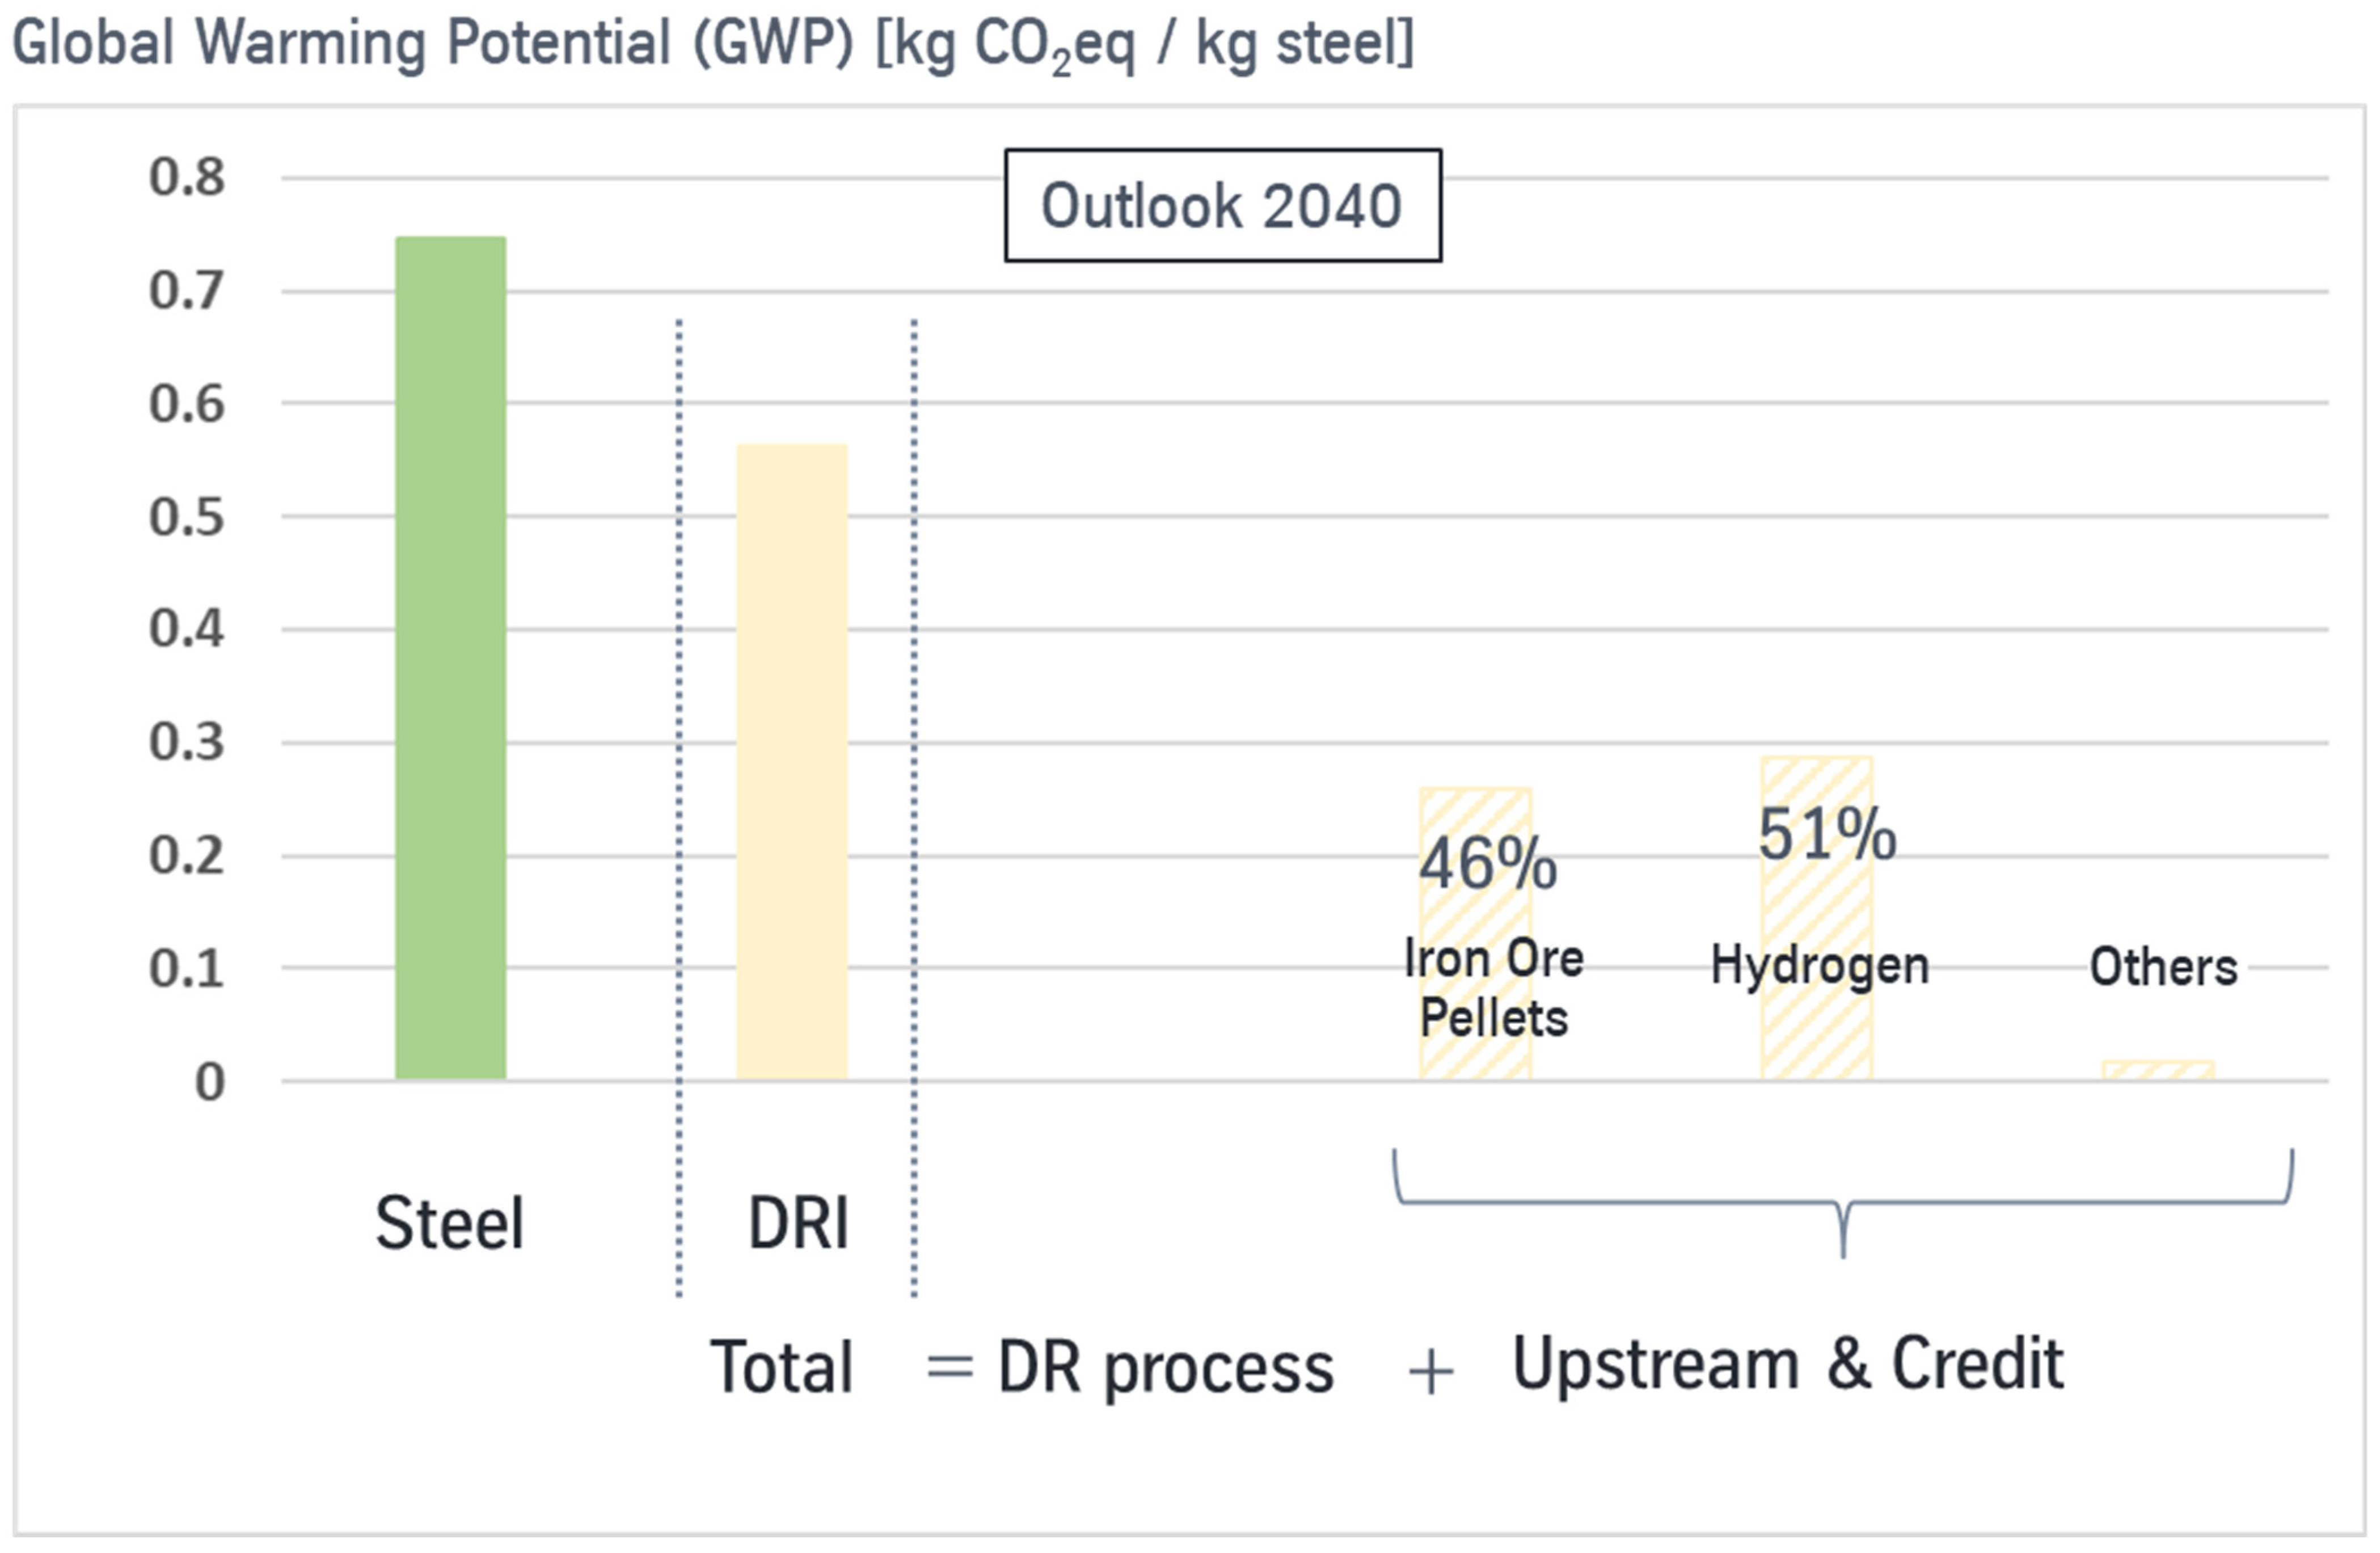
In the following section, hydrogen production with the European grid mix is assumed for the sustainable development scenario for the year 2040. The total impact of steel production on climate change could be reduced by 63% to 0.75 kg CO2eq/kg steel compared with conventional BF-BOF steel production (see Figure 10).
Whereas the impact of the steel manufacturing processes can be almost zero, there is still a significant amount of impact due to the upstream processes. The categorization is in line with Figure 5. The remaining impact of the manufacturing processes is caused by the addition of coal in the EAF to generate foaming slag. Upstream impacts are mainly caused by the process chain until the product, DRI, is obtained (see Figure 11). In total, 0.56 kg CO2eq/kg steel is attributed to DRI production. Concerning iron ore pellet production and other raw materials not listed, no incremental improvements are considered.
With 100% hydrogen-based DRI production, the direct impact of the DR process would reach zero. Yet, in order to reach climate-neutral steel production, upstream processes such as iron ore pellet and hydrogen production also have to become climate neutral. In order to further reduce the hydrogen carbon footprint, the electricity mix has to consist out of low-carbon energy. Since steel is an essential construction material for renewable energy sources, e.g., for wind turbines, an improvement of the carbon footprint of steel would ultimately lead to an improvement of the carbon footprint of renewable energy sources and is thus an important building block for other industries.
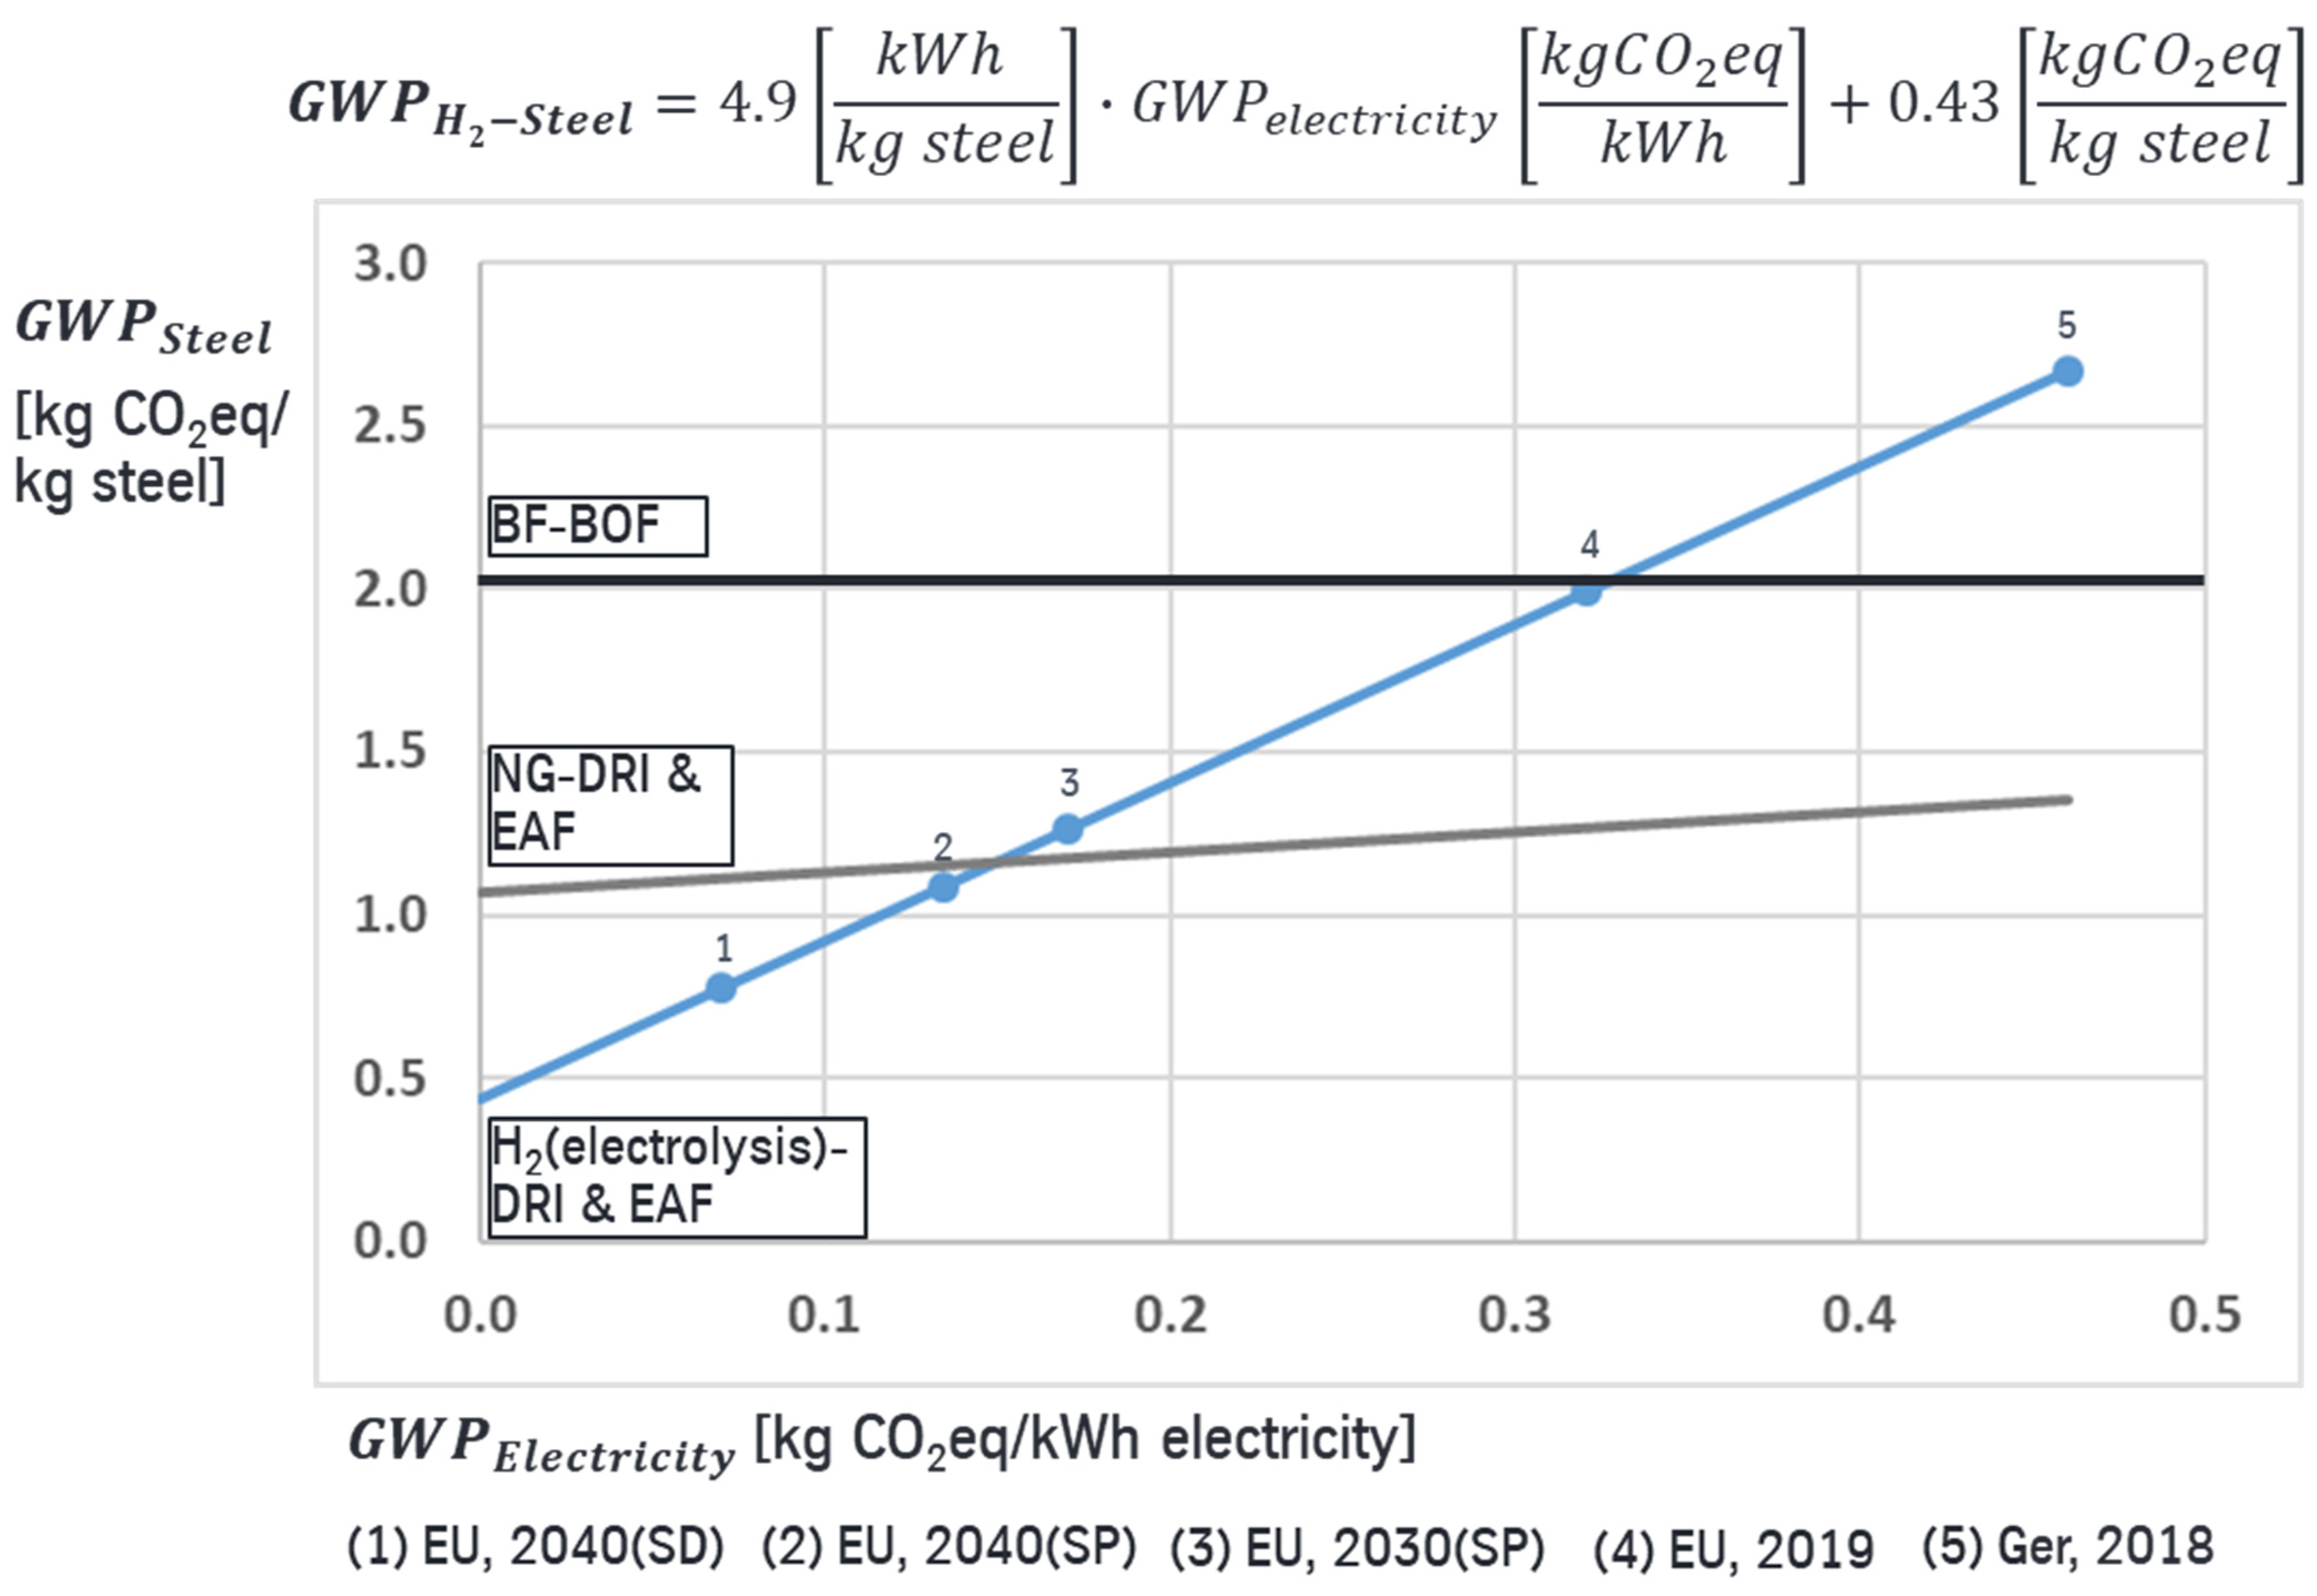
From the results presented, the carbon footprint of steel can be described in function of the respective electricity mix that is used for the electrolysis of hydrogen, the DR plant, and the EAF (see Figure 12). A constant efficiency of 60.9% (related to the LHV) of the electrolysis process is assumed (Table 2) in order to separate the effects of the electricity mix.
The break-even point of the electricity grid mix carbon footprint is 0.15 kg CO2eq/kWh. Below this break-even point, the use of hydrogen in a DR plant is superior to the use of natural gas, regarding the impact on climate change. In comparison with the blast furnace route, this break-even point is 0.32 kg CO2eq/kWh. In the blast furnace route, more electricity is produced in the integrated power plants out of the process gases than it is needed for the steel production route. Thus, excess electricity can be exported to the national grid mix. In Figure 12, no credits for this excess electricity are taken into account. Otherwise, the GWP of steel would be reduced, while the carbon footprint of the national electricity grid mix would be increased. However, the excess electric energy is below 0.2 kWh/kg steel and is of low importance in this comparison.
Steel production using a natural gas-based DR plant is also a function of the electricity grid mix, since electricity is used directly for the DR plant and for the EAF. Yet, the sensitivity is not as high as for the H-DR route, as the electrolysis process for hydrogen production is the most electricity intensive.

5. Conclusions

For the decarbonization of the steel industry, a shift from coal-based towards hydrogen-based metallurgy processes is required. Consequentially, hydrogen production pathways move into focus. Nowadays, hydrogen is mainly produced using fossils fuels; it is not, therefore, a sustainable solution for a real transformation. Hydrogen production using water electrolysis, driven by electricity, gains more importance; thus, electricity production moves into focus.
The impact of the related electricity mix on the produced hydrogen carbon footprint is investigated and is compared to the state of the art of hydrogen production in this paper. Accordingly, a literature analysis is presented, including different current scenarios of hydrogen production. For the hydrogen production using electrolysis, several national grid mixes as well as the European grid mix are considered, focusing on forecasts for the years 2030 and 2040. These results are integrated into a carbon footprint assessment of steel produced via direct reduction plants (DR plants) combined with electric arc furnaces (EAFs). However, the results concerning the hydrogen production gained in this paper can also be transferred to other industries.
The carbon footprint of steel produced using natural gas-based direct reduction combined with an integrated EAF (NG-DRI-EAF route) is 1.4 kg CO2eq/kg steel. Compared with the carbon footprint of current state-of-the-art primary steel produced using the conventional BF-BOF route of 2.0 kg CO2eq/kg steel, a significant reduction potential of 32% can be achieved. The carbon footprint of steel produced via the H2-DRI-EAF route largely depends on the carbon footprint of the consumed hydrogen.
The break-even point of the electricity grid mix carbon footprint is 0.15 kg CO2eq/kWh. Below this break-even point, the use of hydrogen from electrolysis in a DR plant is superior to the use of natural gas regarding the impact on climate change. For the German and European grid mixes, this break-even point is predicted to be reached from 2030 onwards. Before 2030, the use of natural gas is superior to hydrogen from a carbon footprint assessment perspective. The break-even point, compared with the blast furnace route, is 0.32 kg CO2eq/kWh. Below this value, hydrogen-based steel production is superior to the conventional coal-based blast furnace route.
By the year 2040, the steel produced via the H2-DR-EAF route is anticipated to have a carbon footprint of about 0.75 kg CO2eq/kg steel, following the sustainable European grid mix forecast. Therefore, the impact of the manufacturing processes of the steel industry on climate change can almost reach the value of zero. However, to achieve complete climate neutrality, the upstream impact of supply chains also needs to be decarbonized. In this context, the carbon footprint of renewable electricity is a significant measurement. Since steel is an essential construction material for renewable energy sources, e.g., for wind turbines, an improvement of the carbon footprint of steel would ultimately lead to an improvement of the carbon footprint of renewable energy sources.
Steel can play a meaningful role in the sustainable transformation of industry and society to achieve European climate targets.
The limitations of the study are that only impacts on climate change are considered. Especially with respect to nuclear-based electricity production, the consideration of other environmental impact categories could also prove to be significant. Yet, for hydrogen- and electricity-based steel production, the data are based on metallurgical models due to the lack of primary data from practical field tests. In a life cycle sustainability assessment (LCSA), the economic and social pillars of these scenarios could also be investigated.

Author Contributions

Conceptualization, J.S.; methodology, J.S.; software, J.S.; validation, J.S.; formal analysis, J.S.; investigation, J.S.; resources, J.S.; data curation, J.S.; writing—original draft preparation, J.S.; writing—review and editing, J.S.; visualization, J.S.; supervision, M.T. and N.J.; project administration, M.T. and N.J. All authors have read and agreed to the published version of the manuscript.

Funding

This research received no external funding.

Data Availability Statement

Not applicable.

Conflicts of Interest

The authors declare no conflict of interest.

References

  1. IPCC. Climate Change 2021: The Physical Science Basis. In Contribution of Working Group I to the Sixth Assessment Report of the Intergovernmental Panel on Climate Change; Masson-Delmotte, V., Zhai, P., Pirani, A., Connors, S.L., Péan, C., Berger, S., Caud, N., Chen, Y., Goldfarb, L., Gomis, M.I., Eds.; Cambridge University Press: Cambridge, UK, 2021. [Google Scholar]
  2. European Union (EU). Communicatio n from the Commission to the European Parliament, the European Council, the Council, the European Economic and Social Committee and the Committee of the Regions. The European Green Deal. 2019. Available online: https://eur-lex.europa.eu/resource.html?uri=cellar:b828d165-1c22-11ea-8c1f-01aa75ed71a1.0002.02/DOC_1&format=PDF (accessed on 21 January 2022).
  3. Federal Constitutional Court. Constitutional Complaints against the Federal Climate Change Act Partially Successful. 2021. Available online: https://www.bundesverfassungsgericht.de/SharedDocs/Pressemitteilungen/EN/2021/bvg21-031.html. (accessed on 21 January 2022).
  4. IEA. International Energy Agency: Iron and Steel Technology Roadmap—Towards More Sustainable Steelmaking. 2020, pp. 38–43. Available online: https://iea.blob.core.windows.net/assets/eb0c8ec1-3665-4959-97d0-187ceca189a8/Iron_and_Steel_Technology_Roadmap.pdf (accessed on 21 January 2022).
  5. Worldsteel Association. Setting the Course for a Healthy Steel Industry. 2020. Available online: https://www.steelforum.org/stakeholders/gfsec-march-2020-worldsteel.pdf (accessed on 11 November 2021).
  6. Wang, P.; Ryberg, M.; Yang, Y.; Feng, K.; Kara, S.; Hauschild, M.; Chen, W.-Q. Efficiency stagnation in global steel production urges joint supply- and demand-side mitigation efforts. Nat. Commun. 2021, 12, 2066. [Google Scholar] [CrossRef]
  7. Wörtler, M.; Schuler, F.; Voigt, N.; Schmidt, T.; Dahlmann, P.; Lüngen, H.B.; Ghenda, J. Steel’s Contribution to a Low-Carbon Europe 2050. Technical and Economic Analysis of the Sector’s CO2 Abatement Potential. 2013. Available online: https://www.stahl-online.de/wp-content/uploads/Schlussbericht-Studie-Low-carbon-Europe-2050_-Mai-20131.pdf (accessed on 10 December 2022).
  8. DIN EN ISO 14040:2006 + Amd 1:2020; Environmental Management—Life Cycle Assessment—Principles and Framework. ISO: Geneva, Switzerland, 2006.
  9. DIN EN ISO 14044:2006 + Amd 1:2017 + Amd 2:2020; Environmental Management—Life Cycle Assessment—Requirements and Guidelines. ISO: Geneva, Switzerland, 2006.
  10. DIN EN ISO 14067:2019-02; Greenhouse Gases—Carbon Footprint of Products—Requirements and Guidelines for Quantification. ISO: Geneva, Switzerland, 2019.
  11. ©Sphera Solutions GmbH. Gabi Database 2021.1. List of Databases. 2021. Available online: https://gabi.sphera.com/databases/gabi-data-search/ (accessed on 10 December 2022).
  12. Suer, J.; Traverso, M.; Ahrenhold, F. Carbon footprint of scenarios towards climate-neutral steel according to ISO 14067. J. Clean. Prod. 2021, 318, 128588. [Google Scholar] [CrossRef]
  13. Liu, W.; Zuo, H.; Wang, J.; Xue, Q.; Ren, B.; Yang, F. The production and application of hydrogen in steel industry. Int. J. Hydrogen Energy 2021, 46, 10548–10569. [Google Scholar] [CrossRef]
  14. Agora Energiewende. Klimaneutrale Industrie. Schlüsseltechnologien und Politikoptionen für Stahl, Chemie und Zement. Berlin. November 2019. Available online: https://www.agora-energiewende.de/veroeffentlichungen/klimaneutrale-industriehauptstudie/ (accessed on 8 March 2022).
  15. Midrex Technologies, Inc. Direct from Midrex, 2nd Quarter. 2019. Available online: http://www.midrex.com/wp-content/uploads/Midrex_2019_DFM2QTR_Final.pdf (accessed on 23 November 2022).
  16. Suer, J.; Traverso, M.; Jäger, N. Review of Life Cycle Assessments for Steel and Environmental Analysis of Future Steel Production Scenarios. Sustainability 2022, 14, 14131. [Google Scholar] [CrossRef]
  17. Duarte, P.E.; Becerra, J.; Lizcano, C.; Martinis, A. ENERGIRON direct reduction technology-economical, flexible, environmentally friendly. Acero Lat. 2008, 6, 52–58. [Google Scholar]
  18. Federal Ministry of Education and Research. Eine kleine Wasserstoff-Farbenlehre. 2021. Available online: https://www.bmbf.de/de/eine-kleine-wasserstoff-farbenlehre-10879.html (accessed on 21 January 2022).
  19. IEA. International Energy Agency: Hydrogen—Fuels & Technologies—IEA. 2021. Available online: https://www.iea.org/fuels-and-technologies/hydrogen (accessed on 21 January 2022).
  20. Dena. Deutsche Energie-Agentur GmbH (dena)—German Energy Agency. Sustainable Electricity Sources. Renewable Fuels of Non-Biological Origin in the RED II. 2020. Available online: https://www.dena.de/test/user_upload/Sustainable_Electricity_Sources_Position_Paper_2020-07.pdf (accessed on 21 January 2022).
  21. Hölling, M.; Schäfers, H.; Gellert, S.; Grasenack, M.; Jürgens, L.; Tedjosantoso, N.; Schüttler, S. WiSaNo—Windstahl aus Norddeutschland. Technical Report. 2021. Available online: https://germany.arcelormittal.com/icc/arcelor/med/f53/f53689fc-e1fa-9718-60c5-e74064a585a0,11111111-1111-1111-1111-111111111111.pdf (accessed on 10 December 2022). [CrossRef]
  22. Ozbilen, A.; Dincer, I.; Rosen, M.A. A comparative life cycle analysis of hydrogen production via thermochemical water splitting using a Cu–Cl cycle. Int. J. Hydrogen Energy 2011, 36, 11321–11327. [Google Scholar] [CrossRef]
  23. Cetinkaya, E.; Dincer, I.; Naterer, G. Life cycle assessment of various hydrogen production methods. Int. J. Hydrogen Energy 2011, 37, 2071–2080. [Google Scholar] [CrossRef]
  24. Antonini, C.; Treyer, K.; Streb, A.; van der Spek, M.; Bauer, C.; Mazzotti, M. Hydrogen production from natural gas and biomethane with carbon capture and storage—A techno-environmental analysis. Sustain. Energy Fuels 2020, 4, 2967–2986. [Google Scholar] [CrossRef] [Green Version]
  25. Mehmeti, A.; Angelis-Dimakis, A.; Arampatzis, G.; McPhail, S.J.; Ulgiati, S. Life Cycle Assessment and Water Footprint of Hydrogen Production Methods: From Conventional to Emerging Technologies. Environments 2018, 5, 24. [Google Scholar] [CrossRef] [Green Version]
  26. Bukold, S.; Huneke, F.; Claußner, M. Studie Grün oder Blau? Wege in die Wasserstoff-Wirtschaft 2020 bis 2040. 2020. Available online: https://green-planet-energy.de/fileadmin/docs/pressematerial/Gruen_oder_blau_Wege_in_die_Wasserstoffwirtschaft_final.pdf (accessed on 10 December 2022).
  27. Vickers, J. Current Central Hydrogen from Coal with CO2 Capture and Sequestration version 3.2018. 2019. Available online: https://www.nrel.gov/hydrogen/h2a-production-models.html (accessed on 21 January 2022).
  28. Bartlett, J.; Krupnick, A. Resources for the Future Report: Decarbonized Hydrogen in the US Power and Industrial Sectors: Identifying and Incentivizing Opportunities to Lower Emissions. 2020. Available online: https://www.rff.org/publications/reports/decarbonizing-hydrogen-us-power-and-industrial-sectors/ (accessed on 21 January 2022).
  29. van Cappellen, L.; Croezen, H.; Rooijers, F. Feasibility Study into Blue Hydrogen. Technical, Economic & Sustainability Analysis. CE Delft. 2018. Available online: https://cedelft.eu/wp-content/uploads/sites/2/2021/04/CE_Delft_9901_Feasibility_study_into_blue_hydrogen_DEF_bak.pdf (accessed on 21 January 2022).
  30. Howarth, R.W.; Jacobson, M.Z. How green is blue hydrogen? Energy Sci. Eng. 2021, 9, 1676–1687. [Google Scholar] [CrossRef]
  31. Dawood, F.; Anda, M.; Shafiullah, G.M. Hydrogen Production for Energy: An Overview. Int. J. Hydrog. Energy 2020, 45, 3847–3869. [Google Scholar] [CrossRef]
  32. Office of Energy Efficiency & Renewable Energy. Safe Use of Hydrogen. 2022. Available online: https://www.energy.gov/eere/fuelcells/safe-use-hydrogen (accessed on 21 November 2022).
  33. IEA. International Energy Agency: Electricity Generation by Source. 2018. Available online: https://www.iea.org/countries (accessed on 21 January 2022).
  34. IEA. International Energy Agency: World Energy Outlook (2020); OECD Publishing: Paris, France, 2020. [Google Scholar] [CrossRef]
  35. Prognos, Öko-Institut, Wuppertal-Institut. Klimaneutrales Deutschland. Studie im Auftrag von Agora Energiewende, Agora Verkehrswende und Stiftung Klimaneutralität. 2020. Available online: https://www.agora-energiewende.de/veroeffentlichungen/klimaneutrales-deutschland/ (accessed on 21 January 2022).
  36. Prognos, A.G. Kosten und Transformationspfade für strombasierte Energieträger. With assistance of Kreidelmeyer, S.; Dambeck, H.; Kirchner, A.; Wünsch, M. 2020. Available online: https://www.bmwi.de/Redaktion/DE/Downloads/Studien/transformationspfade-fuer-strombasierte-energietraeger.pdf?__blob=publicationFile (accessed on 21 January 2022).
  37. World Steel Association. Life Cycle Assessment Methodology Report; World Steel Association: Brussels, Belgium, 2011. [Google Scholar]
  38. Sarkar, S.; Bhattacharya, R.; Roy, G.G.; Sen, P.K. Modeling MIDREX Based Process Configurations for Energy and Emission Analysis. Steel Res. Int. 2017, 89. [Google Scholar] [CrossRef]
  39. Barati, M. Energy intensity and greenhouse gases footprint of metallurgical processes: A continuous steelmaking case study. Energy 2010, 35, 3731–3737. [Google Scholar] [CrossRef]
  40. Cardenas, J.G.G.; Conejo, A.N.; Gnechi, G.G. Optimization of energy consumption in electric arc furnaces operated with 100% DRI. Metal 2007, 2017, 1–7. [Google Scholar]
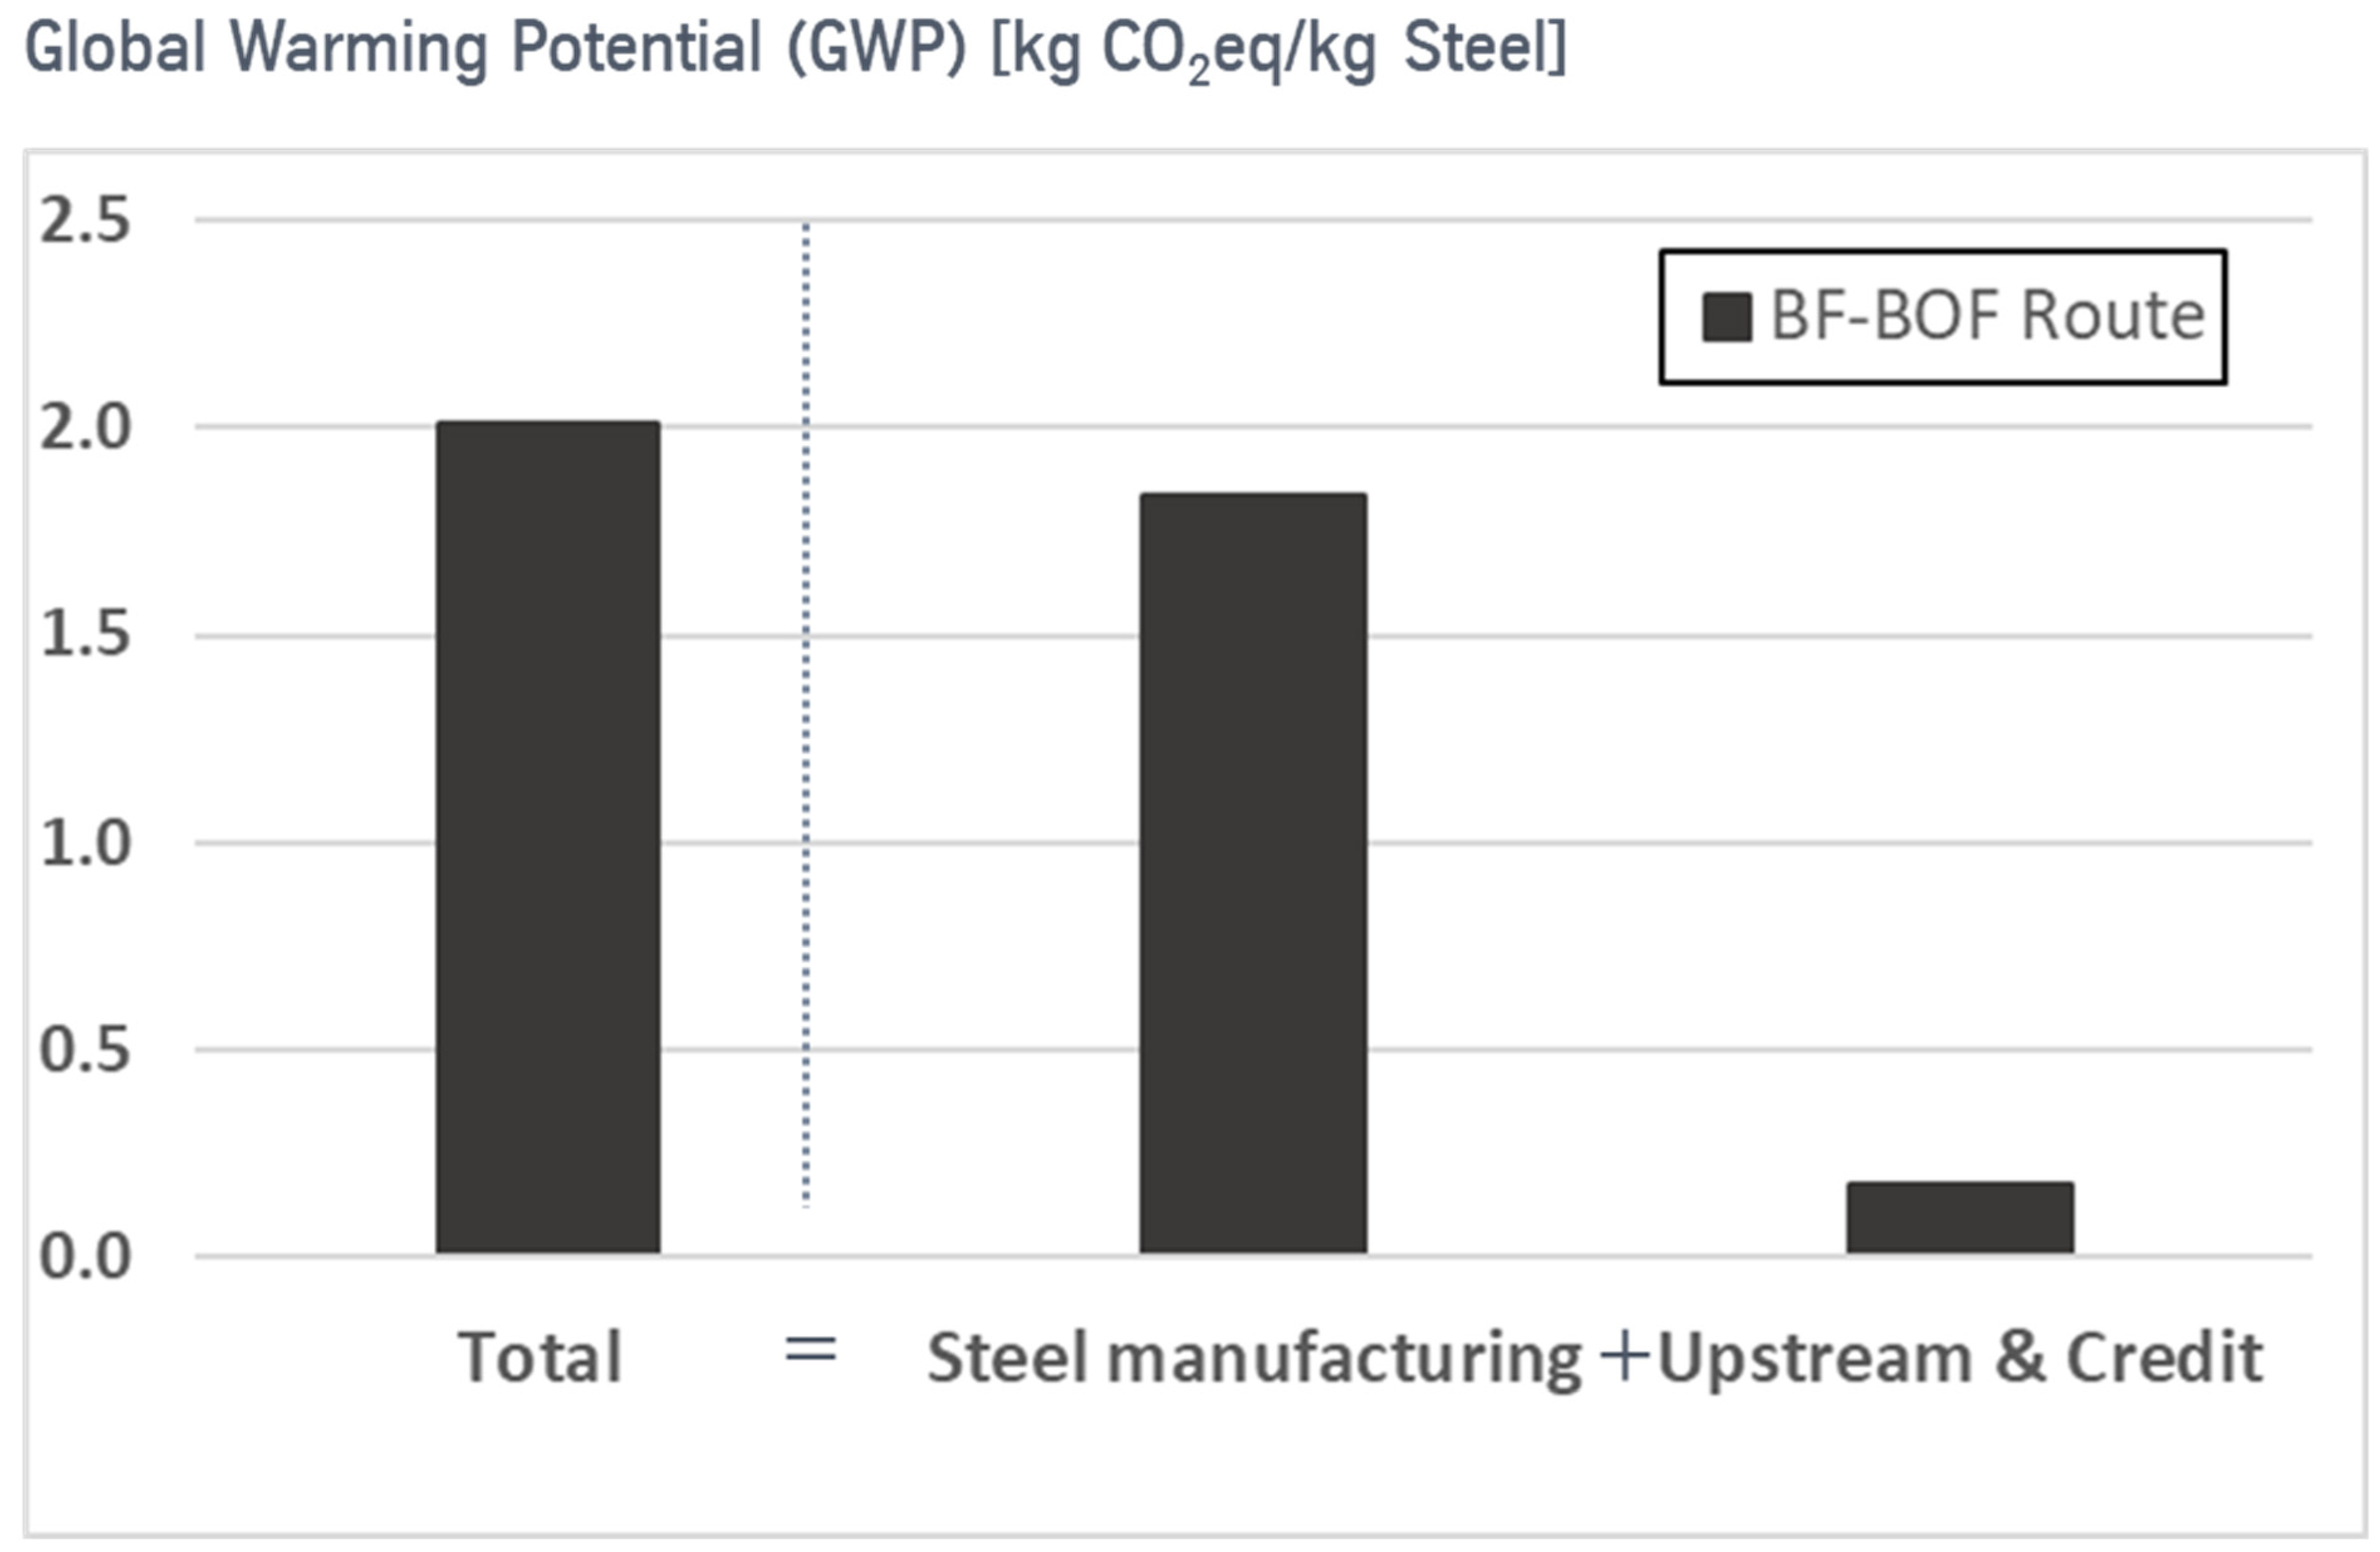
Figure 1. Global warming potential (GWP) of steel produced via the blast furnace–basic oxygen furnace (BF-BOF) route. Total GWP according to GaBi database 2021.1.
Energies 15 09468 g001
Figure 2. System boundary for hydrogen production.
Energies 15 09468 g002
Figure 3. Impact of the electricity grid mixes on the related hydrogen carbon footprint for the nations of Poland, Germany, and France, and the European Union. The points for grey H2 (from steam reforming), blue H2 (steam reforming with carbon capture and storage), green H2 (electrolysis using renewable energy), and grey H2 electrolyser (electrolysis using fossil-based electricity) correspond to the values listed in Table 1.
Energies 15 09468 g003
Figure 4. Development of the carbon footprint of hydrogen. For the European development, a stated policy scenario (a) and a sustainable development scenario (b) are considered, based on the IEA [34]. The German development scenario is based on Prognos et al. [35]. For the year 2018, the GWP values from the literature cited in Table 1 are listed referring to the defined colour code.
Energies 15 09468 g004
Figure 5. Steel production over the DR-EAF route. The steel manufacturing processes are listed in the white area and the inputs for these processes in the grey area. The environmental impacts of both are considered in this paper according to a cradle-to-gate approach. Either natural gas or hydrogen is used as reducing agent. Hydrogen is assumed to be obtained using electrolysis (see Figure 2).
Energies 15 09468 g005
Figure 6. Global warming potential (GWP) of steel. Comparison of production using the blast furnace-basic oxygen furnace (BF-BOF) route with production using the direct reduction-electric arc furnace (DR-EAF) route.
Energies 15 09468 g006
Figure 7. Carbon footprint of steel and impact of natural gas (NG)-based direct reduced iron (DRI) production.
Energies 15 09468 g007
Figure 8. Carbon footprint of direct reduced iron (DRI) depending on the origin of the electricity mix that is used for hydrogen electrolysis for the year 2018. The corresponding electricity mix carbon footprint and the resulting hydrogen carbon footprint are listed in Figure 3.
Energies 15 09468 g008
Figure 9. Development of the carbon footprint of direct reduced iron (DRI). For the European development, a stated policy scenario (SP) and a sustainable development scenario (SD) are considered, based on the IEA [34]. The German development scenario is based on Prognos et al. [35]. The carbon footprint of hydrogen in the scenarios are shown in Figure 4.
Energies 15 09468 g009
Figure 10. Carbon footprint of steel produced via conventional BF-BOF route, natural gas-based direct reduction–electric arc furnace (NG-DR-EAF) route, and H2-DR-EAF route. Hydrogen is gained using electrolysis driven by the European grid mix for the year 2040, referring to the sustainable development scenario of the IEA [34] (see Figure 4b).
Energies 15 09468 g010
Figure 11. Carbon footprint of steel and impact of the H2-based DRI production for the year 2040. Hydrogen is produced via electrolysis driven by the European grid mix following the sustainable development scenario in Figure 4 [34].
Energies 15 09468 g011
Figure 12. Global warming potential (GWP) of steel, produced using hydrogen-based direct reduction (DR) plant and EAF, in function of the GWP of the electricity mix. Electricity is used for the electrolysis process, the DR plant, and the electric arc furnace (EAF). Abbreviations: SP, stated policy scenario; SD, sustainable development; NG, natural gas.
Energies 15 09468 g012
Table 1. Global warming potential (GWP) of different hydrogen production technologies.
TechnologyGWPYear of DataSourceComment on System Boundary
kg CO2eq/kg H2
Grey hydrogen from reforming process
SMR a11.12021[11]LCA b analysis according to GaBi database “DE: Hydrogen (steam reforming natural gas)”
SMR12.02011[22]LCA of hydrogen production
SMR11.92012[23]LCA of hydrogen production
SMR13.02017[24]Holistic techno-environmental analysis
SMR12.12018[25]LCA of hydrogen production
ATR c13.32025[26]Includes natural gas production and transport
CG d22.72018[27]Holistic approach
CG24.22018[25]LCA of hydrogen production
CG19.02020[28]Only directly related CO2 emissions; no upstream
Grey hydrogen from electrolysis driven by fossil-based electricity
35.02015[29]Carbon footprint analysis; grid mix Netherlands 2015
1.132015[29]Carbon footprint analysis; grid mix Norway 2015
PEM e29.52018[25]LCA of hydrogen production
SOEC f23.32018[25]LCA of hydrogen production
10.02025[26]Grid mix Germany 2025; stated policy scenario
12.02025[26]Grid mix Germany 2025; failed policy scenario
Blue hydrogen from reforming with carbon capture and storage
ATR0.642016[29]Carbon footprint analysis
SMR1.732015[29]Carbon footprint analysis; grid mix Netherlands 2015
ATR 2.552015[29]Carbon footprint analysis; grid mix Netherlands 2015
SMR3.402017[24]Holistic techno-environmental analysis
SMR1.142018[29]Carbon footprint analysis; grid mix Norway 2015
ATR0.822018[29]Carbon footprint analysis; grid mix Norway 2015
SMR11–222021[30]Carbon footprint analysis; focus on fugitive methane emissions
ATR4.672025[26]Includes natural gas production and transport
Green hydrogen from electrolysis driven by renewable electricity
PEM2.212018[25]LCA of hydrogen production
Solar2.002011[22]LCA of hydrogen production
Wind1.22011[22]LCA of hydrogen production
Solar2.42012[23]LCA of hydrogen production
Wind0.972012[23]LCA of hydrogen production
Wind; SOEC5.102018[25]LCA of hydrogen production
a SMR (steam methane reforming); b LCA (life cycle assessment); c ATR (autothermal reforming); d CG (coal gasification); e PEM (proton exchange membrane); f SOEC (solid oxide electrolysis cell).
Table 2. Efficiency of electrolysis process based on Prognos (2020) [36].
YearEfficiency ηelectrolysis (%) Related to LHV a of HydrogenElectricity Input (MJ/kg H2)
201860.9197
203062.2193
204063.4189
a Lower heating value.
Table 3. Greenhouse gas (GHG) emissions of German grid mix, year 2018, and respective GHG emissions for hydrogen from electrolysis.
GHG Emissions(kg/kWh Electricity)(kg/kg Hydrogen)
Carbon dioxide0.4424
Methane1.1 × 10−30.058
Nitrous oxide1.4 × 10−57.8 × 10⁻⁴
Table 4. Major inputs of natural gas-based DR plant and EAF.
Input(Unit Input/kg Steel)
Iron ore (kg)1.5
Natural gas (MJ)12
Electricity (MJ)2.2
Table 5. GHG emissions of steel production using natural gas-based DR plant and EAF.
GHG Emission(kg Output/kg Steel)
Carbon dioxide1.3
Methane0.0021
Table 6. Major inputs of the processes of electrolysis, hydrogen-based DR plant, and EAF.
Input(Unit Input/kg Steel)
Iron ore pellets (kg)1.5
Electricity (MJ) 17 a
a including electricity for hydrogen electrolysis.
Publisher’s Note: MDPI stays neutral with regard to jurisdictional claims in published maps and institutional affiliations.