Article

Urban Sustainability: Recovering and Utilizing Urban Excess Heat

1
IVL Swedish Environmental Research Institute, SE-400 14 Göteborg, Sweden
2
Department of Energy Sciences, Efficient Energy Systems, Faculty of Engineering LTH, Lund University, SE-221 00 Lund, Sweden
*
Author to whom correspondence should be addressed.
Energies 2022, 15(24), 9466; https://doi.org/10.3390/en15249466
Submission received: 26 October 2022 / Revised: 26 November 2022 / Accepted: 12 December 2022 / Published: 14 December 2022

Abstract

:
Urban heat sources from urban infrastructure and buildings could meet ~10% of the European building heating demand. There is, however, limited information on how to use them. The EU project ReUseHeat has generated much of the existing knowledge on urban waste heat recovery implementation. Heat recovery from a data center, hospital and from water were demonstrated. Additionally, the project generated knowledge of stakeholders, risk profile, bankability and business models. The recovery of urban waste heat is characterized by high potential, high competitiveness compared to other heating alternatives, high avoidance of GHG emissions, payback within three years and low utilization. These characteristics reveal that barriers for increased utilization exist. The barriers are not technical. Instead, the absence of a waste heat EU level policy adds risk. Other showstoppers are low knowledge on the urban waste heat opportunity and new stakeholder relationships being needed for successful recovery. By combining key results and lessons learned from the project this article outlines the frontier of urban waste heat recovery research and practice in 2022.

1. Introduction

The urban infrastructure of district heating (DH) is not new. The idea of DH is traced to ancient Roman baths. Early baths were heated using water from hot wells; later on, under-floor (hypocaust) heating was used e.g., a central heating system with an underground furnace where the hot air was distributed under a raised floor standing on pillars [1]. A precursor was established in the French village of Chaudes-Aigues in the 14th century. It consisted of wooden pipes distributing geothermal hot water from the hot spring of Par, with a temperature of 80–82 °C, to some buildings in the village [2,3]. The history of modern DH started in the United States in the middle of 18th century as single trials of private persons to heat their homes using combustion of wood, coal, oil or natural gas to produce high-temperature steam that was distributed through pipes [4]. In commercial form, DH has existed since the 1880s [5] and has constituted an urban infrastructure since. For example, the system supplying Manhattan in New York was put into operation in 1882. The current systems tend to have a supply temperature of approximately 80–90 °C, often referred to as third-generation systems [6]. In this paper, this kind of system is referred to as a high-temperature (HT) system. Low-temperature (LT) systems are increasingly relevant, as they allow for increased shares of renewables, geothermal and waste heat sources. They have been defined as systems with a supply temperature of heat that is below 70 °C [7]. Urban waste heat is LT, possible to introduce into both HT District Heating Networks (DHNs) and LTDHNs. When inserted into HTDHNs, a heat pump (HP) is often resorted to.
Half of the energy use in the EU is used for heating and cooling [8]. The total heat demand for buildings in Europe has been estimated at 10 EJ/yr [9]. Industrial waste heat (resulting from different processes, often HT) has a large potential to contribute to the energy demand in Europe. An estimated 2.7 EJ/yr of available industrial waste heat [10] could meet one quarter of the heat and hot water demand in Europe. Industrial waste heat has been successfully integrated into DHNs in some countries but there is still a large untapped potential. The world champion on industrial waste heat recovery into DHNs is Sweden, but even there only a fraction of heat supplied (9%) originates from industrial processes [11,12,13,14,15,16,17]. Urban waste heat can come from IT (data centers), transport systems (metro), sewage water and buildings. The ReUseHeat project identified that urban waste heat could satisfy one tenth of the European building heating demand.
Despite its potential, only a restricted number of installations are present in Europe. There are individual examples of heat recovery refrigeration system of supermarkets [18,19], from wastewater treatment facilities [20,21], from data centers [22,23,24,25,26] and from an underground station [27]. One explanation for the low implementation is that where HTDHNs exist, the interest in LT sources has been low as a result of other fuels such as gas and biomass being cost-efficient.
How warm a network is will determine whether urban heat sources need a heat pump to be recovered. In ReUseHeat, heat was recovered using an HP. In addition to technical validation, analyses were performed on potential, stakeholders, investment risk, bankability, contracts, business models and competitiveness compared to other heating alternatives. By combining key results and lessons learned from the project, this paper provides unique, holistic information on urban waste heat recovery. The results are aggregated and discussed jointly, providing information on the 2022 frontier of LT heat recovery research and practice.
In the context of EU-funded research, ReUseHeat (2017–2022) [28] builds on previous knowledge and EU-funded projects, focusing on things such as potential studies for DH including industrial HT waste heat recovery (the finalized Heat Roadmap Europe Series) and DH implementation to create awareness about the solutions at city level (the finalized CELSIUS Project) [29,30,31]. ReUseHeat bridged the gap between conventional HTDH and unconventional LTDH and has been followed by the ongoing REWARDHeat project [32] addressing standardized solutions for LT heat recovery.
Next, materials and methods applied for collecting different kinds of results in the ReUseHeat project are described. In Section 3, the results on urban waste heat potential, LTDH performance, barriers and business aspects are provided. Discussion (Section 4) and conclusions (Section 5) round the paper off.

2. Materials and Methods

The ReUseHeat project has demonstrated three demonstration sites recovering urban waste heat. Four sites were targeted, but one could not be implemented (metro system heat recovery). To contextualize the urban waste heat recovery, its potential was estimated for EU 28. Moreover, business aspects were studied in depth to support demonstrator replication as well as to create awareness about urban waste heat recovery characteristics. The work with demonstration, potential assessments and business aspects is heterogenous. Therefore, a multitude of methods were applied to generate different results. These are presented next.

2.1. EU Potential

The urban excess heat potential of waste heat encompassed sources other than those foreseen to be demonstrated in the project. Waste heat from datacenter, metro, hospital and water (which were to be demonstrated in ReUseHeat) and food processes and buildings were identified [33]. LT waste heat has the disadvantage that it cannot be transported very far. Therefore, only heat sources within 2 km of the existing DHN across the EU-28 countries, at an average HP performance of COP 3 of the HP used, were included in the final assessment of the accessible excess heat. How far the waste heat can be transported depends on the size of the source and how warm it is. It is therefore difficult to identify a cut-off distance that applies to all LT heat sources. A cutoff was made, allowing LT waste heat transportation for a maximum of 2 km. These volumes were referred to as accessible excess heat volumes, an important distinction to gross available heat volumes.
For quantification of excess heat from the urban sources, an inventory of unique district energy installations, data centers, metro stations, wastewater treatment plants, food production and retail facilities, service sector buildings and residential sector buildings was drawn up. The general basis for the accessible excess heat assessment for the service sector buildings and residential sector buildings was data on specific cooling demand (cooling need reflects available waste heat) [34]. The excess heat sources have been characterized by recovery type, temperate ranges, temporality and heat pump conversion type (Table S1 in Supplementary Material).

2.2. Method to Assess Scalability and Replicability

Scalability reflects how well a system, network or process can expand to meet increasing demand. Replicability indicates how well a system can be copied and installed somewhere else. The methodology for assessment of the scalability and replicability consisted of collecting specific data from demonstration sites by means of a questionnaire survey. Several factors were assessed to identify the scalability and replicability of the demonstrator sites. Economical, regulatory, and stakeholder acceptance are examples of factors assessed. A cumulative result—a scalability index and a replicability index—were calculated for each of the demonstration sites [35].

2.3. Method to Compare Costs of Alternatives for Heating

A calculation tool has been developed by ReUseHeat that compares the cost of LT heat recovery with alternative heating solutions. The levelized cost of LTDH was identified. For assumptions of the tool and details on calculations, see Supplementary Material and Tables S2–S4. The tool is downloadable from the webpage of the project.

2.4. Method to Study Business Aspects

The project identified the key stakeholders, barriers, value chain, risks, bankability, organization, contractual factors and business models. The stakeholder perspectives, barriers and the status of the value chain were studied: the scientific literature and the existing laws, policies, regulations and guidelines (collectively defined as ‘institutional barriers’) in Europe were reviewed; interviews with multiple stakeholders were held, involving 76 respondents across eight European countries. The stakeholder groups interviewed were DH companies, waste heat owners, customers, policy makers and investors interested in green energy. For the risk assessment, scenario analysis in combination with a discourse on cognitive bias were applied to the context of the demonstrators. For the bankability assessment, financial principles were applied to urban waste heat recovery investment opportunities. The contract design was based on traditional methodologies related to infrastructure projects [36]. For identifying efficient business models for the demonstrator sites, the business model canvas was used [37].

2.5. Method for Technical Demonstration

The technical demonstration was conducted stepwise;a pre-feasibility study was succeeded by a feasibility study, commissioning and subsequent operation. The progression of the demonstration sites was followed up on a quarterly basis. Once the equipment was taken into operation the results of the demonstrators were monitored. Performance data from the demonstration sites are: heat supply, excess heat saved, electricity, primary energy saved, CO2 emissions saved and economic parameters such as simplified payback period. For the datacenter heat recovery, four months of monitored data were generated in the project. For the hospital heat recovery, 10 months of monitored data were generated in the project. Extrapolations for full-year operations were made for both demonstrators. For the awareness-generating demonstrator site, more than one year of monitoring data exists.

3. Results

The results are provided on urban waste heat potential (3.1), LT DH performance and barriers (3.2) and business aspects (3.3).

3.1. Urban Waste Heat Potential

The accessible waste heat volumes in the EU-28 countries are summarized in the supplementary materials (Table S5).
The total volume of the accessible urban waste heat is 1.2 EJ/yr per year. Most comes from sewage water (42%), followed by data centers (23%), buildings (service sector 19% and residential sector 8.8%). Smaller fractions come from metro systems and food processes. LT waste heat could meet ~10% of the European heat demand for buildings [9].

3.2. Urban Waste Heat Recovery Performance

3.2.1. Demonstrator Performance

Detailed information on demonstrators’ concepts is described in Chapter 3: ReUseHeat handbook [38]. Several Key Performance Indictors (see Tables 7 and 9 in the ReUseHeat Handbook, Chapter 3 for specification of the KPIs) were quantified for the data center and a service sector building (hospital) demonstrator sites.

Data Center

The demonstrator is situated in Braunschweig (Germany). The heat is injected into a newly built and operated LTDHN. The performance is shown in Table 1.
Comparing the estimated results for a complete year with the intended values shows a large positive deviation in PES (doubled). CO2 emissions saved and electricity usage were both larger than foreseen. More electricity was needed because hydraulic adjustments were necessary to avoid overheating of the HP. In terms of economic indication, the payback for results of a full year is foreseen to be much lower than anticipated (3.05 years instead of eight years).

Heat Recovery from a Hospital

The hospital is a public hospital in Madrid, Spain. LT heat from the condensation circuit of water-water electric chillers is recovered. The monitored data on the performance of the demonstrator are shown in Table 2.
The results show that the estimated results for a full year were better than expected. Again, the use of electricity was higher than foreseen but to be expected from the increased thermal energy production. Economically, the demonstrator had a significant shift of simplified payback from 15 to less than two years.

Awareness Building Demonstrator (Dashboard)

The third demonstration site was focused on developing a demonstrator for building awareness about the urban waste heat recovery by means of a visualization dashboard. To visualize is especially important in countries where heat demand provided by DH is low and awareness on DH is rather absent. It was developed for heat recovery from water (sea and sewage). The dashboard can be accessed through the project website. Detailed information is found in [39].

Metro Heat Recovery Demonstrator

A fourth demonstrator site was foreseen: metro tunnel/platform heat recovery. The metro demonstrator was not realized, as the stakeholders withdrew from the project. In spite of this, learnings were made from feasibility studies. Two design concepts exist and are ready for future implementation. For a review of these, please view Chapter 3 in the ReUseHeat Handbook [38].

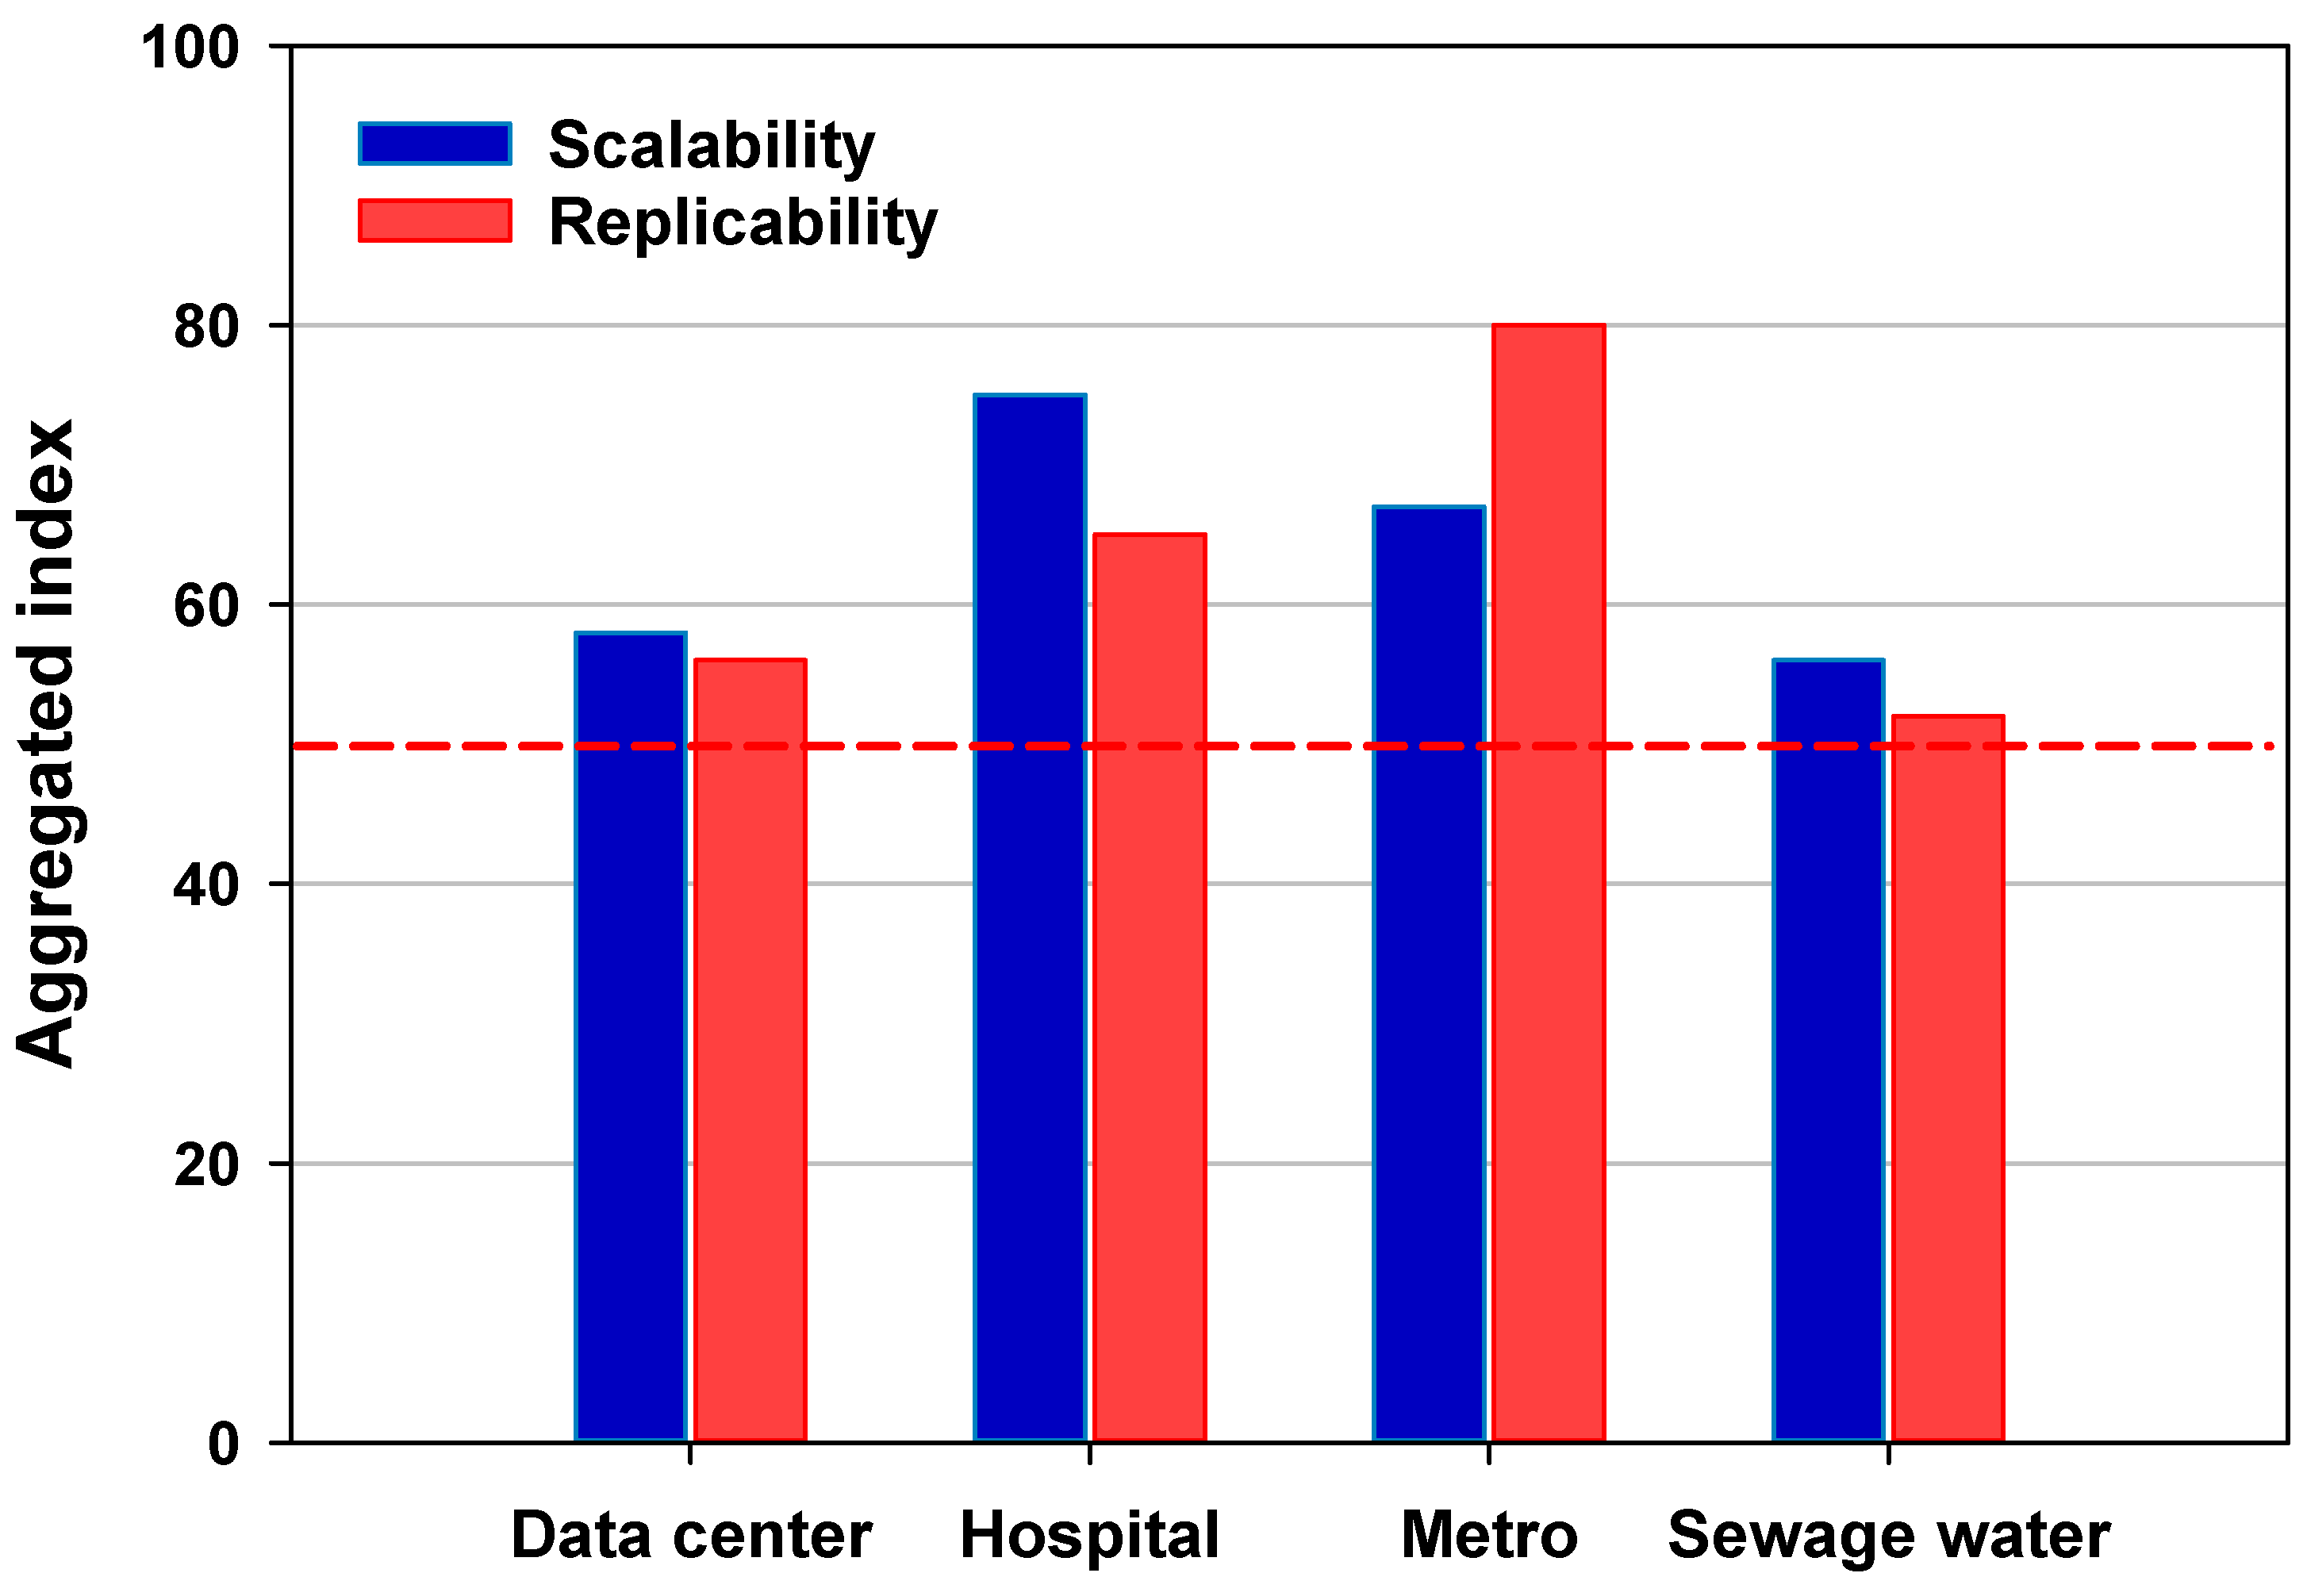
Scalability and Replicability Analysis of Demonstrator Sites

The aggregated scalability and replicability indices of the demonstrators are presented in Figure 1. Both ratios were above 50% (the red dashed line) for all demonstrators. The scalability index was highest for the hospital demonstrator (75) and the replicability index was highest for the metro demonstrator (80). The scores for the individual factors of scalability and replicability of all four demonstrators are presented in Figures S1 and S2 in Supplementary Material.
The detailed analysis of the scalability and replicability factors identified economy of scale as the most important factor for all demonstrator sites. Profitability was also an important factor for three of them (except for the hospital demonstrator). Software integration, interface design and technical development were the low-score scalability factors.

3.2.2. Competitiveness of Urban Waste Heat Recovery

A tool was developed in the project to compare the costs of heating alternatives. It was applied to the following heat supply options: gas-, biomass-, oil- and electric boilers, air-to-water heat pump, HT DH and LT DH in the ReUseHeat demonstrator countries (Spain, France and Germany). In Germany, resorting to HT DH (€83/MWh) or LT DH (€74/MWh) are on par with the costs of a gas boiler (€83/MWh). The pattern is similar for a house in Spain, with the LCOHs being €77/MWh, €65/MWh and €80/MWh, respectively for the HT DH system, LT DH system and natural gas-fired boiler. The highest LCOHs in both countries are associated with electric boilers. In France, on the other hand, the natural gas-fired boiler is the cheapest alternative (€80/MWh) compared to the DH solutions (HT DH system: €98/MWh; LT DH system: €89/MWh). Detailed results with a distribution of the individual cost types are presented in Supplementary Material (Figures S3–S5) and at the website of the project (2021 energy prices used).

3.3. Barriers

Policy: In the EU, there is no clarity on what waste heat is. There is no policy setting waste heat on par with, for example, solar or wind. Instead, there are incentivized investments in renewables which then compete with non-incentivized investments in urban excess heat. The unclear status of excess heat adds investment risk to any waste heat recovery investment (urban and industrial).
System maturity: Incomplete value chains and limited demonstration makes it difficult to both find competencies that can install the system for heat recovery and to make standardized implementations. Instead, every time a new design is needed, and installers face a learning curve during the implementation. This is also reflected in the fact that there are no standards to adhere to and no standardized contracts to resort to. Jointly, these aspects make the implementation more costly and time-consuming than conventional DH system implementations.
Value of waste heat: Another barrier beyond the institutional involves different perceptions of how much the waste heat is worth. This is particularly troublesome if the parties have different expectations of, for example, payback of investments. Also, there might be different views on the quality and usefulness of the heat. For example, DH companies often do not need waste heat in summer regardless of how high its quality is, which leads to different perspectives of the value of the excess resource across seasons [40].

3.4. Results on Business Aspects

Stakeholders and value chain: The main stakeholders have been identified [41,42]: DH companies, excess-heat owners, customers, investors and policymakers.
The LT value chain is not complete and piggybacks off the high-temperature DH value chain. DH companies are interested in completing the parts missing to make LT heat recovery profitable. The waste heat owners are important for the success of LT heat recovery but must be willing to engage in contracts delivering specified heat volumes over time. At the side of the value chain are investors and policy makers. They can impact demand and support market uptake by demanding and incentivizing the LT heat recovery solution.
Contracts and risks: Regarding the contracts for urban waste heat investments, the project often requires multiple parties, which makes the contract writing complex. In designing contracts, important factors are win-win solutions, supply conditions, ownership and usage of assets, clear communication pathways, operational activities, renegotiation, mitigation and simplicity of the contracts [36,40,43]. The question of contractual efficiency was addressed in [36].
Business models: Working on business models for the ReUseHeat demonstrators, a transition from the business model logic of centralized and large-scale thinking to also include the value that a local heat source can offer was identified as important. The urban waste heat offer is characterized by the customer value of sustainably and locally produced. On the activity side, the urban waste heat recovery relies on long-term, win-win relationships with heat owners, often prosumers, which necessitates ample customer dialogue. On the resource side, the inclusion of an HP and possibly a LTDHN must be accounted for. One important learning from the project was that the sustainability that customers recognize is not capitalized on. Instead, the conventional HT business model is applied to the LT business case, which erodes it. Indeed, the sustainable feature of LT heat recovery could be an opportunity for DH companies to diversify their customer offer.

4. Discussion

The urban waste heat potential is of such magnitude that it should be a heat supply worth pursuing. Taking into account that it also has features that will be standard in future energy supply (no combustion, making use of a local resource in a circular system) and that it can replace fossil fuels, it should be on the agenda of any urban development scheme.
The urban heat sources will differ in terms of how large they are and how warm they are. The larger and warmer, the further the heat can be transported before use. The main delimitation is that LT heat must be used near where it is generated, as transportation or long supply lines are not efficient. This makes the matching between demand and supply increasingly important compared to a conventional HTDHN. If there is not enough demand locally for the available LT heat, then there are limited possibilities to use the full LT heat volumes available. This was, for example, the case of the datacenter heat recovery and for the foreseen implementation of the metro heat recovery.
The demonstrated site of datacenter heat recovery and heat recovery from cooling towers of a hospital show important results. Primary energy savings for a year from those two demonstrator sites is 6.3 GWh, and 1133 tonnes of CO2 are saved; this is possible within a payback of three years (3.05 for the datacenter) or less (1.9 for the hospital). To put the size of the saving into proportion, an average-sized electric car uses 2 kWh per 10 km. The circumference at the equator is 40,074 km and to drive around it (theoretically) in the electric car one would need 2 kWh × 4007.4, which equals 8015 kWh or 0.008 GWh. Hence, the primary energy saved would allow an electrical car to drive 788 laps around the equator. For the context of the GHG savings, one ton of CO2 emissions corresponds to using a hair dryer for 20,000 h. The tonnes of CO2 saved would allow the usage of a hair dryer for 22.6 million hours or 944,167 days. The payback result was not expected. Rather, at the beginning of the project the novelty of the implementations and the absence of standards led to the assumption of paybacks in the range of 8–15 years. At the beginning of the project, the pre-assumption was also the LTDH solutions would have difficulty competing with gas boilers. For both Spain and Germany, applying the prices of 2021 (e.g., prices before the Russia-Ukraine war situation), LTDH proved to be a competitive option.
Profitability and a certain volume (scale) of the implementations were seen as important for scalability and replicability of the sites, whereas software integration for efficient operation was not seen as an issue. The most scalable site was the heat recovery from the hospital, whereas the most replicable site was the foreseen metro heat recovery. It was foreseen from the tunnel and platforms in metro systems. This implementation was the second foreseen implementation in Europe. In the CELCIUS Project, heat recovery was installed in the station of Islington in the metro system of London. Heat was recovered from the ventilation shafts and from transformers of electricity substations. The demonstrator encountered a number of barriers to implementation; one important one was the need to rebuild existing infrastructure to recover the waste heat. The ReUseHeat demonstrator foreseen for the metro system took this experience into account, and it was decided to target the heat from tunnels and station platforms. The idea was to make a compact implementation that could be placed in any metro tunnel. Returning to the element of distance, the distance between the heat recovery foreseen (in between rails in a small platform) and the customer (the building of the metro operator itself) complicated the implementation of the metro heat recovery. The project reviewed three alternative implementation sites for the metro heat recovery, where one would have been very efficient in terms of distance between heat supply and heat usage. This site had to be abandoned, as the metro operator decided to rebuild the space where the HP was foreseen to be installed.
That waste heat owners have core business activities that reduce the interest in waste heat recovery is known already from industrial waste heat collaborations. This was, however, also confirmed by the experiences in ReUseHeat, and it has been concluded that for new processes to be tested, organizational approvals take a long time. Several obstacles are identified and indicate that large-scale implementation will not come without an important effort. Some activities could support the development: (i) establishing that LT excess heat is a valuable asset at EU level and pushing its implementation by public sector requirements for urban waste heat recovery in new development areas; (ii) strengthening knowledge about the hidden urban asset; when there is awareness across the value chain from policy makers to customers, demand will follow; (iii) ensuring that waste heat investments are supported and placing them on a level playing field with investments in renewables; the current situation might lead to locally available heat supply being foregone; (iv) more implementation is needed to show the viability of urban heat recovery solutions. Standardization of technical configuration as well as of contractual arrangements are still pending. Not until such are in place will there be any large-scale private investment in this asset.
The DH market is heterogenous across countries. In addition, an EU-level framework on waste heat is missing, which makes it difficult for urban waste heat investments to keep pace with incentivized investments in renewable sources. Taking its large potential into account, it is important to foster interest in urban waste heat at both national and local levels. One possible way to push implementation is to make urban waste heat recovery standard in the construction of public spaces such as schools, hospitals and offices. Thereto, making heat planning mandatory at the municipal level across the EU would be feasible.

5. Conclusions

Globally, LT heat recovery has been implemented in a large number of places (more than 160 have been documented) [7], now augmented by the achievements from the ReUseHeat project. The number of these smart city installations confirms that interest in LT heat recovery is global. ReUseHeat project results validate that recovery of urban waste heat is technically, economically and environmentally feasible and can significantly support the decarbonization of cities [44,45].
In sum, the technology is there, and the heat supply is there; however, the policy framework and awareness amongst stakeholders are not. As a result, the demand is limited, and actors across the DH value chain deliver solutions they are used to delivering. In the light of the climate crisis and the Russia-Ukraine war, a strategy of “keeping the lights on” is no longer justifiable. It seems as if the time for large-scale LT heat recovery implementations has come.

Supplementary Materials

The following supporting information can be downloaded at: https://www.mdpi.com/article/10.3390/en15249466/s1, Figure S1: Computed Scalability factors; Figure S2: Computed Replicability factors; Figure S3: The LCOH estimations for the analysed heat supply options for Germany; Figure S4: The LCOH estimations for the analysed heat supply options for Spain; Figure S5: The LCOH estimations for the analysed heat supply options for France; Table S1: Excess heat source types, recovery types, temperature ranges, temporality and the HP conversion type for the investigated heat sources; Table S2: The techno-economic parameters assumed for the LCOH calculation of the individual and DH technologies—Germany; Table S3: The techno-economic parameters assumed for the LCOH calculation of the individual and DH technologies—Spain; Table S4: The techno-economic parameters assumed for the LCOH calculation of the individual and DH technologies—France; Table S5: Sources of urban excess heat, number of source units within the distance of two kilometers from a DHN and energy data (in the unit of PJ/year). References [46,47,48,49,50,51,52,53,54,55,56,57,58,59,60,61,62] are cited in the supplementary materials.

Author Contributions

K.L.: Ideation, Linking the results together from various deliverables in the project to provide a holistic perspective of LTDH, Funding acquisition, Project administration, Writing—Original Draft. S.L.: Review of material and analysis, Drafting, Review. All authors have read and agreed to the published version of the manuscript.

Funding

Materials collected from ‘ReUseHeat’, EH U2020, Grant Agreement 767429.

Data Availability Statement

Data can be obtained if requested.

Acknowledgments

We thank all contributors to ReUseHeat deliverables resorted to for creating this state of the art summary of urban waste heat recovery research and practice in 2022.

Conflicts of Interest

The authors declare no conflict of interest.

List of Abbreviations

DHDistrict Heating
DHNDistrict Heating Network
LTLow Temperature
HTHigh Temperature
HPHeat Pump

References

  1. Roman Baths. Available online: https://www.worldhistory.org/Roman_Baths/ (accessed on 26 July 2022).
  2. Raynal, P.; Gibert, J.; Barthomeuf, C. Chaudes-Aigues: Historique des utilisations de la géothermie. Reseaux Chal. 1992, 4, 67–75. [Google Scholar]
  3. Chaudes-Aigues: France’s First Heating Network. Available online: https://www.dhcnews.net/chaudes-aigues-frances-first-heating-network/ (accessed on 26 July 2022).
  4. Collins, J.F., Jr. The history of district heating. Dist. Heat. 1959, 44, 154–161. [Google Scholar]
  5. Werner, S. Development and Spread of District Heating (in Swedish: Fjärrvärmens Utveckling Och Utbredning); Värmeverksföreningen: Stockholm, Sweden, 1989. [Google Scholar]
  6. Frederiksen, S.; Werner, S. District Heating and Cooling, 1st ed.; Studentlitteratur AB: Lund, Sweden, 2013; ISBN 9789144085302. [Google Scholar]
  7. Lygnerud, K.; Werner, S. Low-Temperature District Heating Implementation Guidebook, IEA-DHC, Annex TS2, Final Report. 2021. Available online: https://www.iea-dhc.org/the-research/annexes/2017-2021-annex-ts2 (accessed on 26 July 2022).
  8. Köhler, B.; Dengler, J.; Dinkel, A.; Mauman, A.; Kalz, D.; Bonato, P.; Fleitern, T.; Steinbach, J.; Ragwitz, M.; Arens, M.; et al. Mapping and Analyses of the Current and Future (2020–2030) Heating/Cooling Fuel Deployment (Fossil/Renewables). Work package 2: Assessment of the technologies for the year 2012. Technology 2016. [Google Scholar] [CrossRef]
  9. Werner, S. International review of district heating and cooling. Energy 2017, 137, 617–631. [Google Scholar] [CrossRef]
  10. Miró, L.; Brückner, S.; Cabeza, L.F. Mapping and discussing Industrial Waste Heat (IWH) potentials for different countries. Renew. Sustain. Energy Rev. 2015, 51, 847–855. [Google Scholar] [CrossRef] [Green Version]
  11. Bühler, F.; Petrović, S.; Karlsson, K.; Elmegaard, B. Industrial excess heat for district heating in Denmark. Appl. Energy 2017, 205, 991–1001. [Google Scholar] [CrossRef] [Green Version]
  12. Fang, H.; Xia, J.; Zhu, K.; Su, Y.; Jiang, Y. Industrial waste heat utilization for low temperature district heating. Energy Policy 2013, 62, 236–246. [Google Scholar] [CrossRef]
  13. Sun, F.; Cheng, L.; Fu, L.; Gao, J. New low temperature industrial waste heat district heating system based on natural gas fired boilers with absorption heat exchangers. Appl. Therm. Eng. 2017, 125, 1437–1445. [Google Scholar] [CrossRef]
  14. Andrés, M.; Regidor, M.; Macía, A.; Vassalo, A.; Lygnerud, K. Assessment methodology for urban excess heat recovery solutions in energy-efficient District Heating Networks. Energy Procedia 2018, 149, 39–48. [Google Scholar] [CrossRef]
  15. Nielsen, S.; Hansen, K.; Lund, R.; Moreno, D. Unconventional Excess Heat Sources for District Heating in a National Energy System Context. Energies 2021, 13, 5068. [Google Scholar] [CrossRef]
  16. Soloha, R.; Pakere, I.; Blumberga, D. Solar energy use in district heating systems. A case study in Latvia. Energy 2017, 137, 586–594. [Google Scholar] [CrossRef]
  17. Oktay, Z.; Aslan, A. Geothermal district heating in Turkey: The Gonen case study. Geothermics 2007, 36, 167–182. [Google Scholar] [CrossRef]
  18. Sawalha, S. Investigation of heat recovery in CO2 trans-critical solution for supermarket refrigeration. Int. J. Refrig. 2013, 36, 145–156. [Google Scholar] [CrossRef] [Green Version]
  19. Zühlsdorf, B.; Christiansen, A.R.; Holm, F.M.; Funder-Kristensen, T.; Elmegaard, B. Analysis of possibilities to utilize excess heat of supermarkets as heat source for district heating. Energy Procedia 2018, 149, 276–285. [Google Scholar] [CrossRef]
  20. Somogyi, V.; Sebestyén, V.; Domokos, E. Assessment of wastewater heat potential for district heating in Hungary. Energy 2018, 163, 712–721. [Google Scholar] [CrossRef]
  21. Spriet, J.; McNabola, A.; Neugebauer, G.; Stoeglehner, G.; Ertl, T.; Kretschmer, F. Spatial and temporal considerations in the performance of wastewater heat recovery systems. J. Clean. Prod. 2020, 247, 119583. [Google Scholar] [CrossRef]
  22. Huang, P.; Copertaro, B.; Zhang, X.; Shen, J.; Löfgren, I.; Rönnelid, M.; Fahlen, J.; Andersson, D.; Svanfeldt, M. A review of data centers as prosumers in district energy systems: Renewable energy integration and wasteheat reuse for district heating. Appl. Energy 2020, 258, 114109. [Google Scholar] [CrossRef]
  23. Oró, E.; Taddeo, P.; Salom, J. Waste heat recovery from urban air cooled data centres to increase energy efficiency of district heating networks. Sustain. Cities Soc. 2019, 45, 522–542. [Google Scholar] [CrossRef]
  24. Petrović, S.; Colangelo, A.; Balyk, O.; Delmastro, C.; Gargiulo, M.; Simonsen, M.B.; Karlsson, K. The role of data centres in the future Danish energy system. Energy 2020, 194, 116928. [Google Scholar] [CrossRef]
  25. Wahlroos, M.; Syri, S.; Pärssinen, M.; Manner, J. Utilizing data center waste heat in district heating—Impact on energy efficiency and prospects for low-temperature district heating networks. Energy 2017, 140, 1228–1238. [Google Scholar] [CrossRef]
  26. Wahlroos, M.; Pärssinen, M.; Rinne, S.; Syri, S.; Manner, J. Future views on waste heat utilization—Case of data centers in Northern Europe. Renew. Sustain. Energy Rev. 2018, 82, 1749–1764. [Google Scholar] [CrossRef]
  27. Davies, G.; Boot-Handford, N.; Curry, D.; Dennis, W.; Ajileye, A.; Revesz, A.; Maidment, G. Combining cooling of underground railways with heat recovery and reuse. Sustain. Cities Soc. 2019, 45, 543–552. [Google Scholar] [CrossRef]
  28. ReUseHeat—Recovery of Urban Excess Heat. European Commission. Grant Agreement Number: 767429. H2020-EE-2016-2017/H2020-EE-2017-RIA-IA. Available online: https://www.reuseheat.eu/ (accessed on 20 July 2022).
  29. Nijs, W.; Castelló, P.R.; González, I.H. Heat Roadmap Europe. Baseline Scenario of the Total Energy System up to 2050. 2017. Available online: https://heatroadmap.eu/wp-content/uploads/2018/11/HRE4_D5.2.pdf (accessed on 26 July 2022).
  30. HRE3/Stratego. 2022. Available online: https://heatroadmap.eu/sp_faq/heat-roadmap-europe-3-stratego-2015/ (accessed on 26 July 2022).
  31. Celsius. Celsius-Smart Cities. 2020. Available online: https://celsiuscity.eu/ (accessed on 26 July 2022).
  32. REWARDHeat. 2022. Available online: https://www.rewardheat.eu/en/ (accessed on 26 July 2022).
  33. Persson, U.; Atabaki, S.; Nielsen, S.; Moreno, D. Report on the Amounts of Urban Waste Heat Accessible in the EU28: Update of Deliverable 1.4. Deliverable 1.9. 2022. Available online: https://www.reuseheat.eu/wp-content/uploads/2022/09/D1.9-Report-on-amounts-of-urban-waste-heat-accessible-in-EU28.pdf (accessed on 14 October 2022).
  34. Persson, U.; Averfalk, H.; Nielsen, S.; Moreno, D. Accessible Urban Waste Heat. Deliverable 1.4 (Revised version). ReUseHeat. Recovery of Urban Excess Heat. 2020. Available online: https://www.reuseheat.eu/wp-content/uploads/2021/02/D1.4-Accessible-urban-waste-heat_revised-compressed.pdf (accessed on 20 July 2022).
  35. Leonte, D. Scalability, Replicability and Modularity. Deliverable 2.9. ReUseHeat. Recovery of Urban Excess Heat. 2021. Available online: https://www.reuseheat.eu/wp-content/uploads/2021/09/D2.9-Scalability-replicability-and-modularity_Final-version_April-2021.pdf (accessed on 22 September 2022).
  36. Wheatcroft, E.; Wynn, H.P.; Volodina, V.; Dent, C.J.; Lygnerud, K. Model-Based Contract Design for Low Energy Waste Heat Contracts: The Route to Pricing. Energies 2021, 14, 3614. [Google Scholar] [CrossRef]
  37. Ostewalder, A.; Pigneur, Y. Business Model Generation; Wiley: New York, NY, USA, 2010; ISBN 978-0-470-87641-1. [Google Scholar]
  38. Lygnerud, K.; Nielsen, S.; Persson, U.; Wynn, H.; Wheatcroft, E.; Antolin-Gutierrez, J.; Leonte, D.; Rosebrock, O.; Ochsner, K.; Keim, C.; et al. Handbook for Increased Recovery of Urban Excess Heat; Deliverable 6.2. ReUseHeat. Recovery of Urban Excess Heat; European Commission: Brussels, Belgium, 2022; ISBN 978-91-7883-404-4. Available online: https://www.euroheat.org/static/378761b4-2d76-48ef-a77a73730832b05a/ReUseHeat-Handbook-For-Increased-Recovery-of-Urban-Excess-Heat.pdf (accessed on 11 December 2022).
  39. Antolín, J.; Sanz, R.; Miguel, F. Evaluation. Deliverable 4.5. ReUseHeat. Recovery of Urban Excess Heat. 2022. Available online: www.reuseheat.eu (accessed on 11 December 2022).
  40. Lygnerud, K.; Wheatcroft, E.; Wynn, H. Contracts, Business Models and Barriers to Investing in Low Temperature District Heating Projects. Appl. Sci. 2019, 9, 3142. [Google Scholar] [CrossRef] [Green Version]
  41. Leonte, D. Market and Stakeholder Analysis. Deliverable 2.1. ReUseHeat. Recovery of Urban Excess Heat. 2019. Available online: https://www.reuseheat.eu/wp-content/uploads/2019/03/D2.1-Market-and-stakeholder-analysis.pdf (accessed on 22 September 2022).
  42. Wheatcroft, E.; Wynn, H.; Lygnerud, K.; Bonvicini, G.; Leonte, D. The Role of Low Temperature Waste Heat Recovery in Achieving 2050 Goals: A Policy Positioning Paper. Energies 2020, 13, 2107. [Google Scholar] [CrossRef] [Green Version]
  43. Wynn, H.; Wheatcroft, E.; Lygnerud, K. Efficient Contractual Forms and Business Models for Urban Waste Heat Recovery. Deliverable 2.3. ReUseHeat. Recovery of Urban Excess Heat. 2021. Available online: https://www.reuseheat.eu/wp-content/uploads/2021/03/D2.3-UPDATED_20210223.pdf (accessed on 22 September 2022).
  44. European Commission. Committing to Climate-Neutrality by 2050: Commission Proposes European Climate Law and Consults on the European Climate Pact. 2020. Available online: https://ec.europa.eu/commission/presscorner/detail/en/ip_20_335 (accessed on 26 July 2022).
  45. European Union. A European Green Deal. 2021. Available online: https://ec.europa.eu/info/strategy/priorities-2019-2024/european-green-deal_en (accessed on 26 July 2022).
  46. IEA—International Energy Agency. World Energy Model. Macro Drivers. Available online: https://www.iea.org/reports/world-energy-model/macro-drivers (accessed on 26 July 2022).
  47. Danish Energy Agency. Technology Data. Available online: https://ens.dk/en/our-services/projections-and-models/technology-data (accessed on 26 July 2022).
  48. Hansen, C.H.; Gudmundsson, O. The-Competitiveness-of-District-Heating-Compared-to-Individual-Heatingv2. 2018. Available online: https://www.danskfjernvarme.dk/-/media/danskfjernvarme/gronenergi/analyser/03052018-the-competitiveness-of-district-heating-compared-to-individual-heatingv2.pdf (accessed on 26 July 2022).
  49. Greenhouse Gas Emission Intensity of Electricity Generation in Europe. Available online: https://www.eea.europa.eu/ims/greenhouse-gas-emission-intensity-of-1 (accessed on 26 July 2022).
  50. Schüppler, S.; Fleuchaus, P.; Blum, P. Techno-economic and environmental analysis of an Aquifer Thermal Energy Storage (ATES) in Germany. Geotherm. Energy 2019, 7, 11. [Google Scholar] [CrossRef]
  51. Malaich, B.; Oschatz, B. BDEW-Heizkostenvergleich Altbau 2021. Ein Vergleich der Gesamtkosten verschiedener Systeme zur Heizung und Warmwasserbereitung in Altbauten. 2021. Available online: https://www.bdew.de/media/documents/BDEW-HKV_Altbau.pdf (accessed on 26 July 2022).
  52. Großklos, M. Kumulierter Energieaufwand und CO2-Emissionsfaktoren Verschiedener Energieträger und–Versorgungen. 2020. Available online: https://www.iwu.de/fileadmin/tools/kea/kea.pdf (accessed on 26 July 2022).
  53. Miara, M.; Günther, D.; Kramer, T.; Oltersdorf, T.; Wapler, J. Wärmepumpen effizienz. Messtechnosche Untersuchung von Wärmepumpenangelan zur Analyse und Bewertung der Effizienz in realen Betrieb. 2011. Available online: https://wp-monitoring.ise.fraunhofer.de/wp-effizienz//download/wp_effizienz_endbericht_langfassung.pdf (accessed on 26 July 2022).
  54. Zukunfsheizen. Available online: https://www.zukunftsheizen.de/brennstoff/zusammensetzung-heizoelpreis/ (accessed on 26 July 2022).
  55. Bundesministerium für Wirtschaft und Klimaschuts. Staatlich veranlasste Bestanteile des Gaspreises. Available online: https://www.bmwi.de/Redaktion/DE/Artikel/Energie/gaspreise-bestandteile-staatlich.html#:~:text=Die%20Energiesteuer%20(Gassteuer)%20f%C3%BCr%20die,und%20flie%C3%9Ft%20in%20den%20Bundeshaushalt (accessed on 26 July 2022).
  56. Eurostat—Statistics Explained. Electricity Prices for Household Consumers, First Half 2021 v5. Available online: https://ec.europa.eu/eurostat/statistics-explained/index.php?title=File:Electricity_prices_for_household_consumers,_first_half_2021_v5.png#file (accessed on 26 July 2022).
  57. Eurostat—Statistics Explained. Electricity Prices for Household Consumers, First Half 2021 v1. Available online: https://ec.europa.eu/eurostat/statistics-explained/index.php?title=File:Natural_gas_prices_for_household_consumers,_first_half_2021_v1.png (accessed on 26 July 2022).
  58. AGFW—Der Energieeffizienzverband für Wärme, Kälte und KWK. Available online: https://ag-energiebilanzen.de/mitglied/agfw-der-energieeffizienzverband-fuer-waerme-kaelte-und-kwk-e-v/ (accessed on 11 December 2022).
  59. Resolution BOE-A-2020-11426. Ministerio para la Transición Ecológica y el Reto Demográfico. Resolución de 29 de septiembre de 2020, de la Dirección General de Política Energética y Minas, por la que se Publica la Tarifa de Último Recurso de gas Natural. Available online: https://www.boe.es/diario_boe/txt.php?id=BOE-A-2020-11426 (accessed on 26 July 2022).
  60. Precios de los Derivados del Petróleo: España. Available online: https://datosmacro.expansion.com/energia/precios-gasolina-diesel-calefaccion/espana (accessed on 26 July 2022).
  61. Precio neto de la Electricidad para uso Doméstico y uso Industrial—Euros/kWh. Available online: https://www.mincotur.gob.es/es-es/IndicadoresyEstadisticas/BoletinEstadistico/Energ%C3%ADa%20y%20emisiones/4_12.pdf (accessed on 26 July 2022).
  62. ADEME Agence de la Transition Écologique. Available online: https://librairie.ademe.fr/energies-renouvelables-reseaux-et-stockage/818-reseaux-de-chaleur-et-de-froid-etat-des-lieux-de-la-filiere-marches-emplois-couts.html (accessed on 26 July 2022).
Figure 1. Scalability and replicability indexes by heat source.
Energies 15 09466 g001
Table 1. Intended and achieved key performance indicators data from the data center demonstrator.
ImpactUnitIntended ResultEstimated Value for a Full Year
Heat supplyMWh/year23002451
Excess heat volumeMWh/year17501660
ElectricityMWh/year580791
Primary energy saved (PES)MWh/year12842602
CO2 emissions savedTonnes/year304412
Simplified payback periodYears83.1
Table 2. Intended and achieved key performance indicators data from the data center demonstrator.
ImpactUnitIntended ResultEstimated Value for a Full Year
Heat supplyMWh/year7702704
Waste heat recoveredMWh/year5321751
ElectricityMWh/year238789
Primary energy savedMWh/year5543768
CO2 emissions savedTonnes/year154721
Simplified payback periodYears151.9
Publisher’s Note: MDPI stays neutral with regard to jurisdictional claims in published maps and institutional affiliations.

