Article

Simulation-Based Fault Detection Remote Monitoring System for Small-Scale Photovoltaic Systems

Department of Architectural Engineering, Daejeon University, Daejeon 34520, Republic of Korea
*
Author to whom correspondence should be addressed.
Energies 2022, 15(24), 9422; https://doi.org/10.3390/en15249422
Submission received: 28 October 2022 / Revised: 27 November 2022 / Accepted: 8 December 2022 / Published: 13 December 2022
(This article belongs to the Special Issue Advances in Photovoltaic Technologies)

Abstract

:
A small-scale grid-connected PV system that is easy to install and is inexpensive as a remote monitoring system may cause economic losses if its failure is not found and it is left unattended for a long time. Thus, in this study, we developed a low-cost fault detection remote monitoring system for small-scale grid-connected PV systems. This active monitoring system equipped with a simulation-based fault detection algorithm accurately predicts AC power under normal operating conditions and notifies its failure when the measured power is abnormally low. In order to lower the cost, we used a single board computer (SBC) with edge computing as a data server and designed a monitoring system using openHAB, an open-source software. Additionally, we used the Shewhart control chart as a fault detection criterion and the ratio between the measured and predicted ac power for the normal operation data as an observation. As a result of the verification test for the actual grid-connected PV system, it was confirmed that the developed remote monitoring system was able to accurately identify the system failures in real-time, such as open circuit, short circuit, partial shading, etc.

1. Introduction

As the distribution of photovoltaic (PV) systems rapidly increases, monitoring systems for the management and maintenance of the facilities are becoming common. Monitoring systems are being implemented that range from a simple method limited to checking the real-time power generation status and failures, to a remote monitoring system based on the Internet of Things (IoT) that can detect and diagnose failures by string or module and can access the solar power system from anywhere through the Internet [1,2,3,4,5,6,7,8,9,10]. Looking at previous studies related to PV systems monitoring, Kang et al. (2019) presented a plan to establish a remote real-time monitoring system to manage photovoltaic facilities, described a monitoring method at the inverter level, and diagnosed abnormalities in the system through acquisition of power generation information through inverter VF [11]. Sushmita et al. (2019) developed a low-cost, cloud-based, real-time monitoring graphical dashboard with very few sensors installed and a very simple fault detection to ensure sustainable energy self-sufficiency through PV systems, and presented an IoT-based wireless sensor network operation and maintenance (O&M) method [12]. Mohammed et al. (2010) proposed a precision PV monitoring system with high reliability. A graphical user interface (GUI) program was developed through LabVIEW. All data collected on the computer was monitored and the system actuator was controlled through a microcontroller [13]. Jürgen et al. (2014) developed and tested an integrated monitoring and simulation method for precise online simulation of photovoltaic plants at the second level, unlike the previous studies described above. Since the developed system includes both monitoring and simulation datasets, a highly efficient fault detection scheme can be used, and the results show that it is suitable for providing automatic and real-time fault detection for solar power plants of various sizes, significantly improving the commissioning procedure [14]. As such, various studies using the PV monitoring system have been conducted, but it was difficult to find studies that suggested a failure detection method through simple simulation power generation calculation. The PV systems for domestic power generation are self-managed through a separate manpower and monitoring system. The systems installed in public buildings as a part of a new and compulsory renewable energy installation project or government-led project are subject to five years of real-time monitoring of the power generation status through an integrated renewable energy monitoring system. The efficient operation and management of small-scale PV systems of less than 10 kW installed for private use are insufficient. In the case of a small-scale, grid-connected system that is operated unmanned, a relatively expensive monitoring system is rarely used, and as a result, the system may be left unattended for a long time in the case of failure. This study proposes a remote monitoring system applicable to small-scale PV systems. Unlike the monitoring system that has been used in previous studies, it can be built at low cost by using an SBC server and applying an open source platform. In addition, PV remote monitoring system equipped with a simulation-based failure detection algorithm accurately estimates power production under normal operating conditions. Furthermore, this system refers to an active system that recognizes and notifies of a system failure when the amount of power generated is abnormally low. This allows the operator to take corrective action promptly and minimizes power loss due to short- and long-term performance degradation of the system.

2. Design of the Remote Monitoring System for Failure Detection
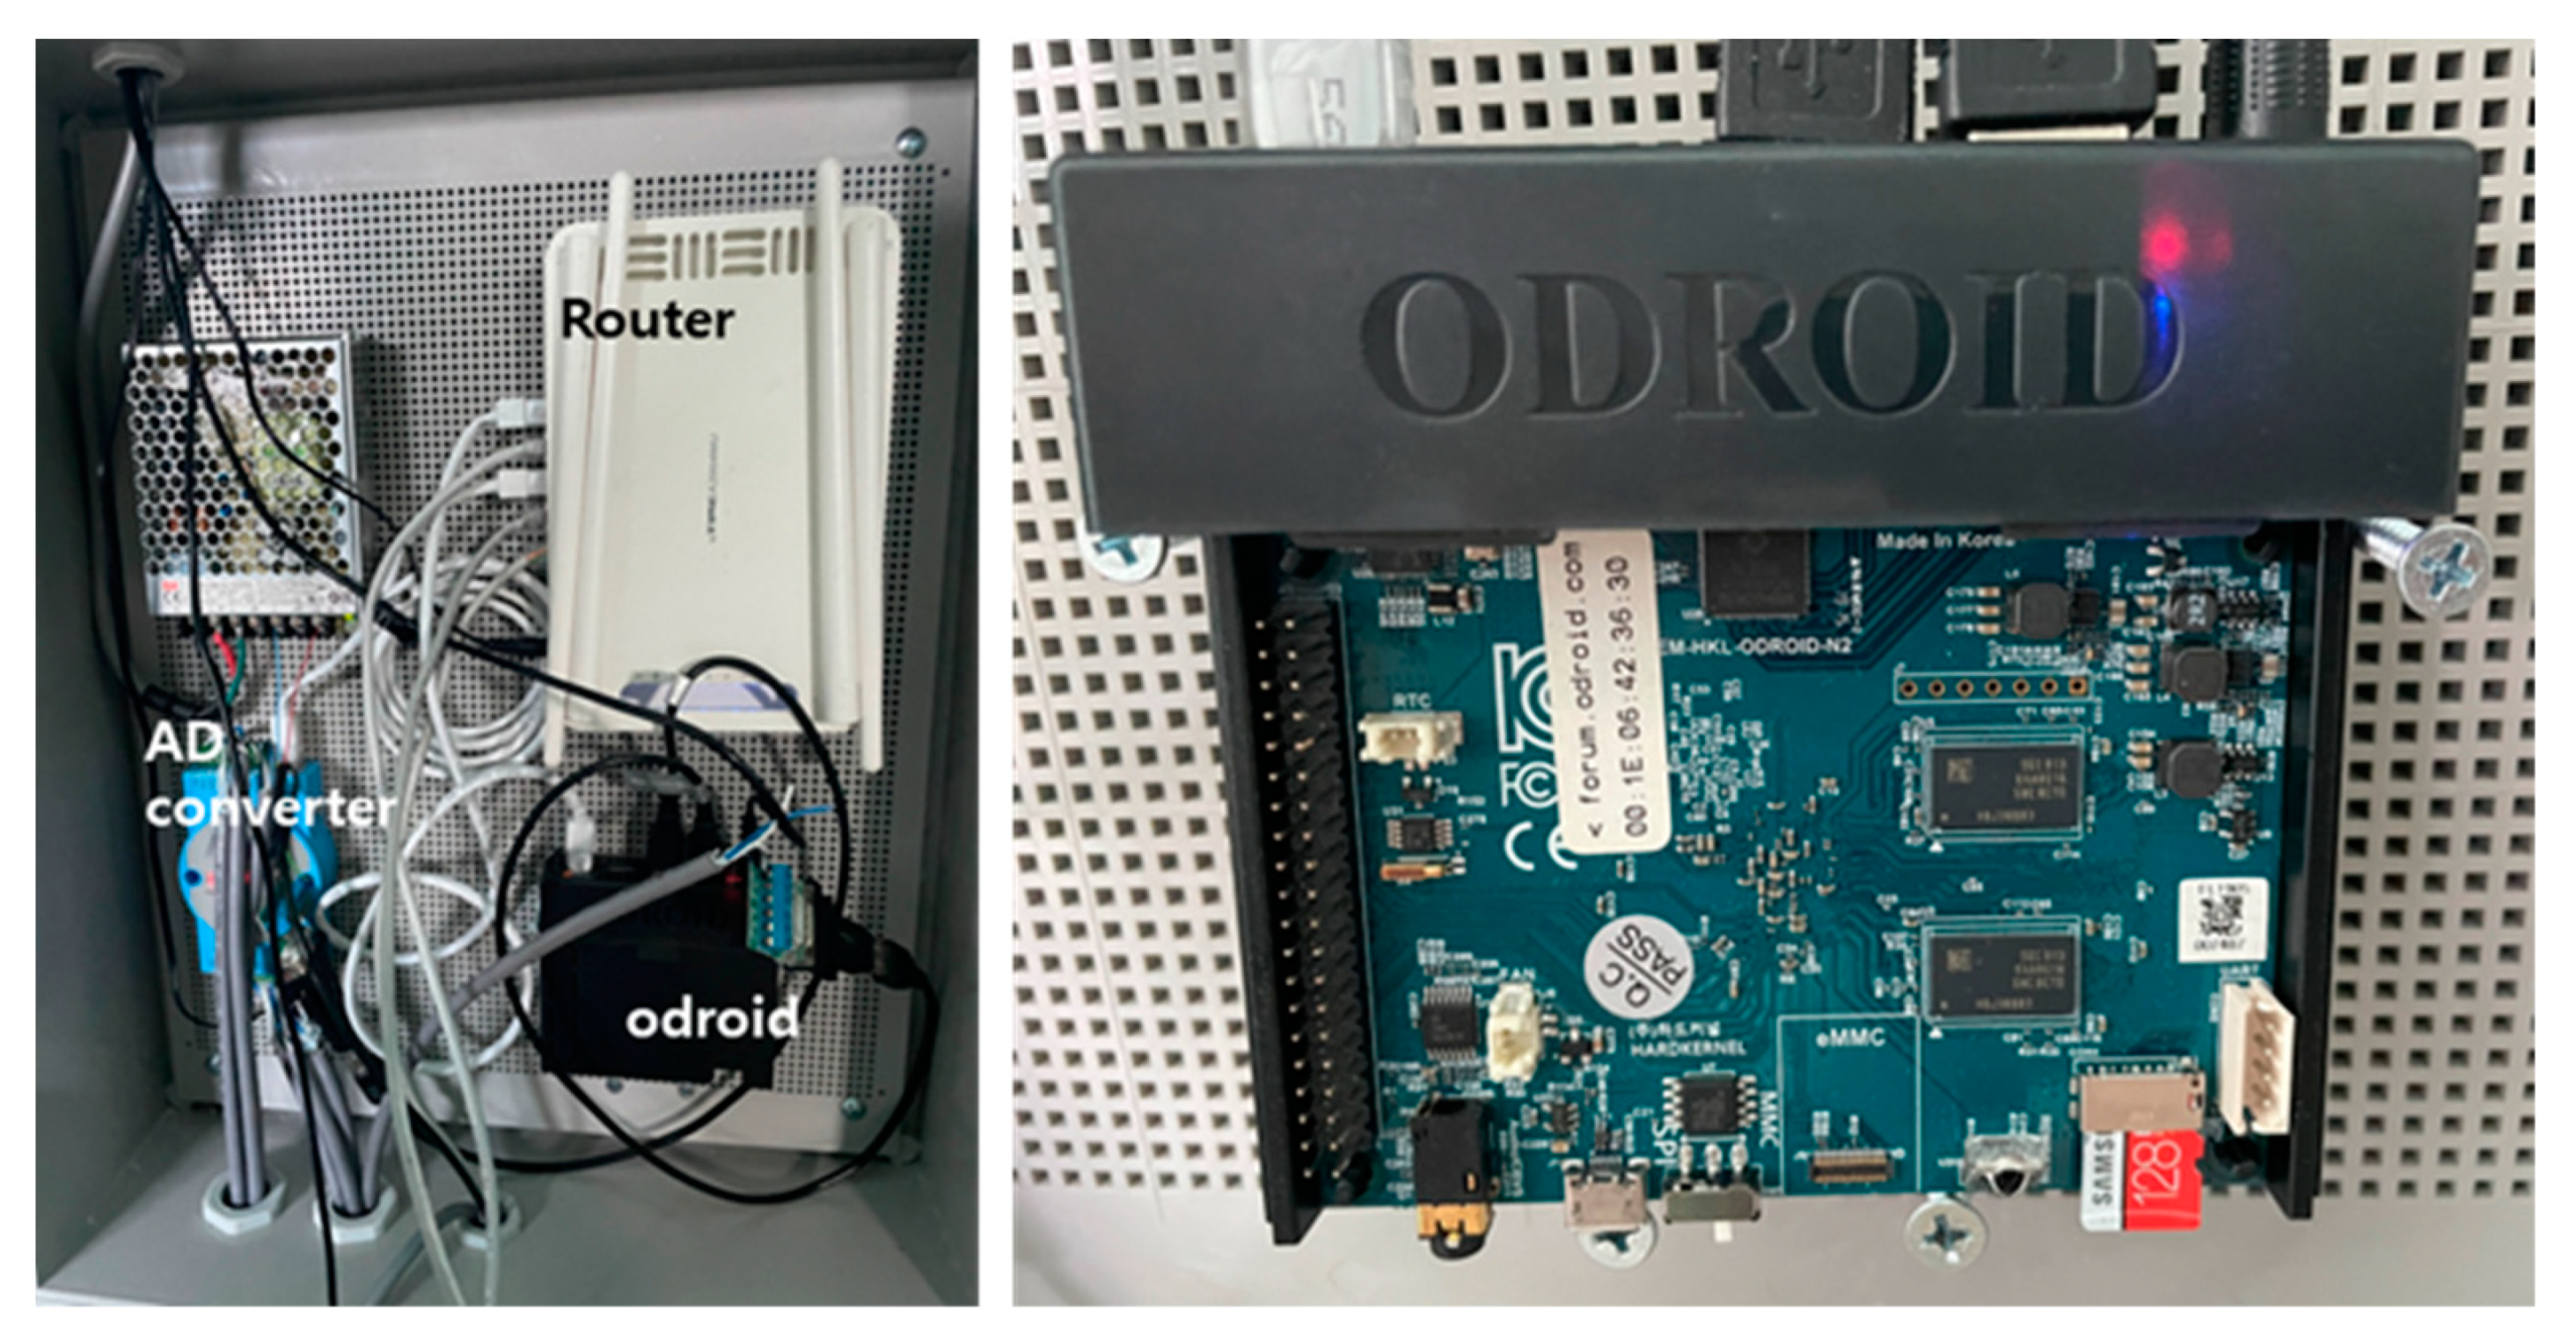
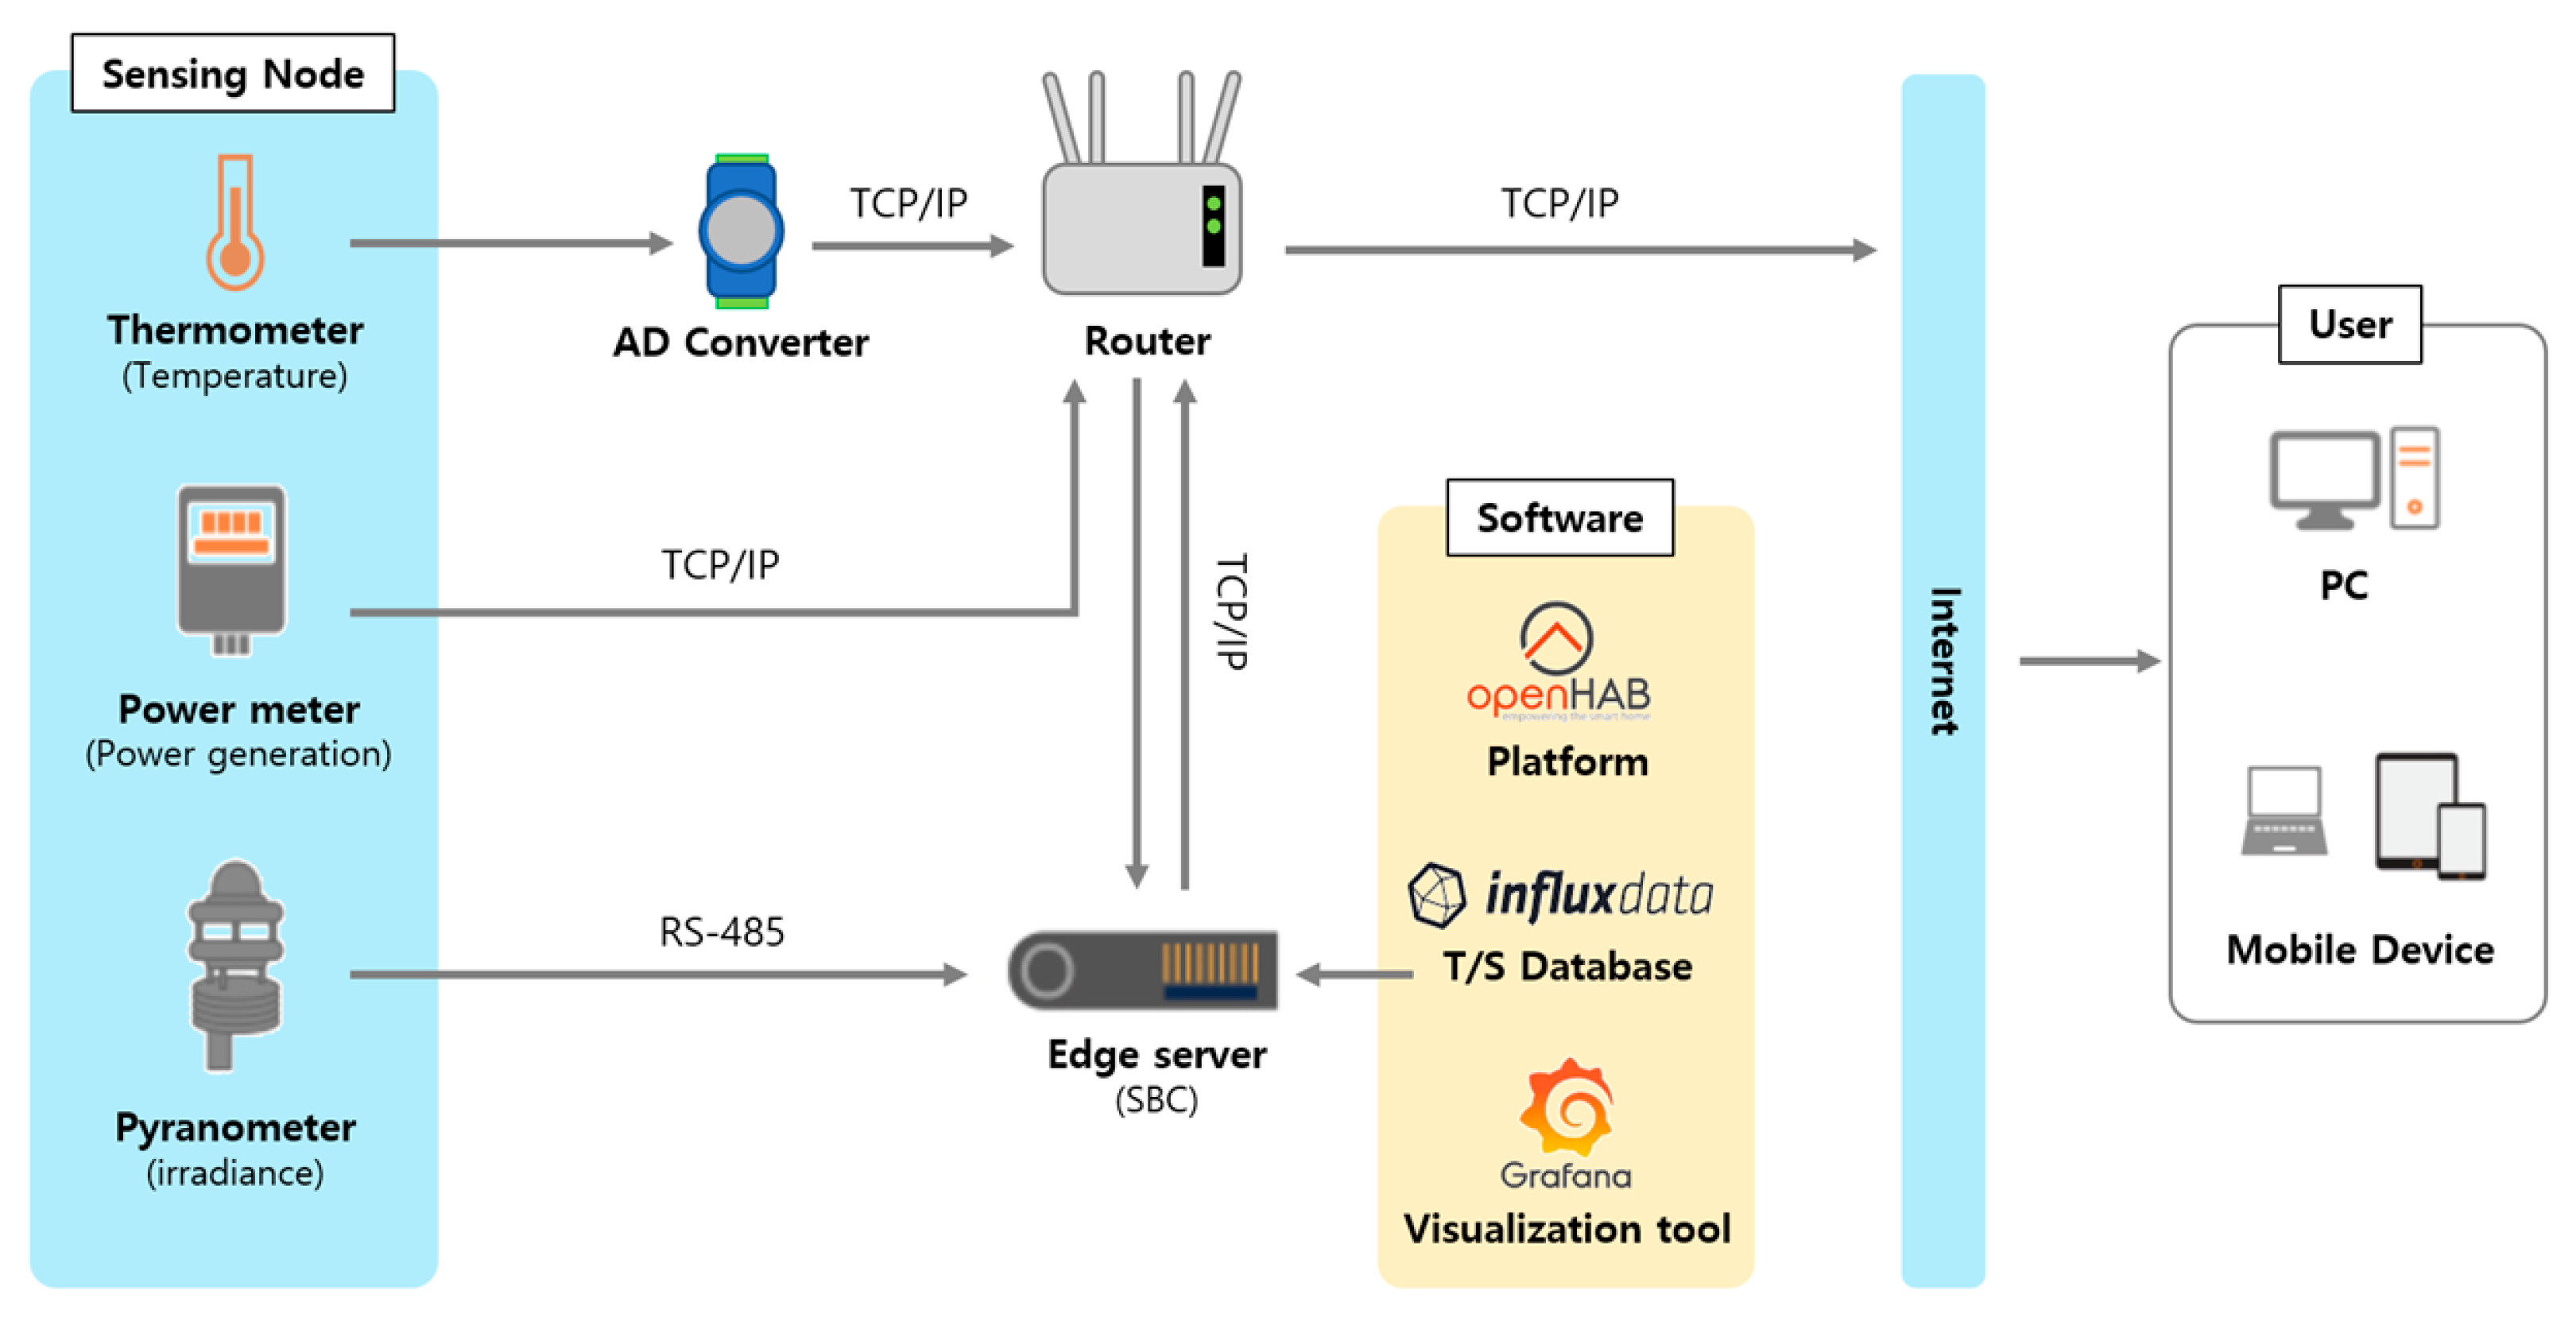
2.1. Data Server

Compared to cloud computing, edge computing occupies a relatively short distance between the device and the network, so the service can be performed quickly and the communication load can be reduced. In addition, this computing architecture minimizes damage to the entire system by preventing the loss of original data stored in the edge server when communication is cut off due to an external network problem. Accordingly, in this study, a data server was constructed using ODROID-N2, an ARM-based single board computer, as an edge method. ODROID-N2 is a low-power, ultra-compact computer that integrates components such as the microprocessor, memory, and input/output on a single circuit board, making it possible to build a low-cost system.

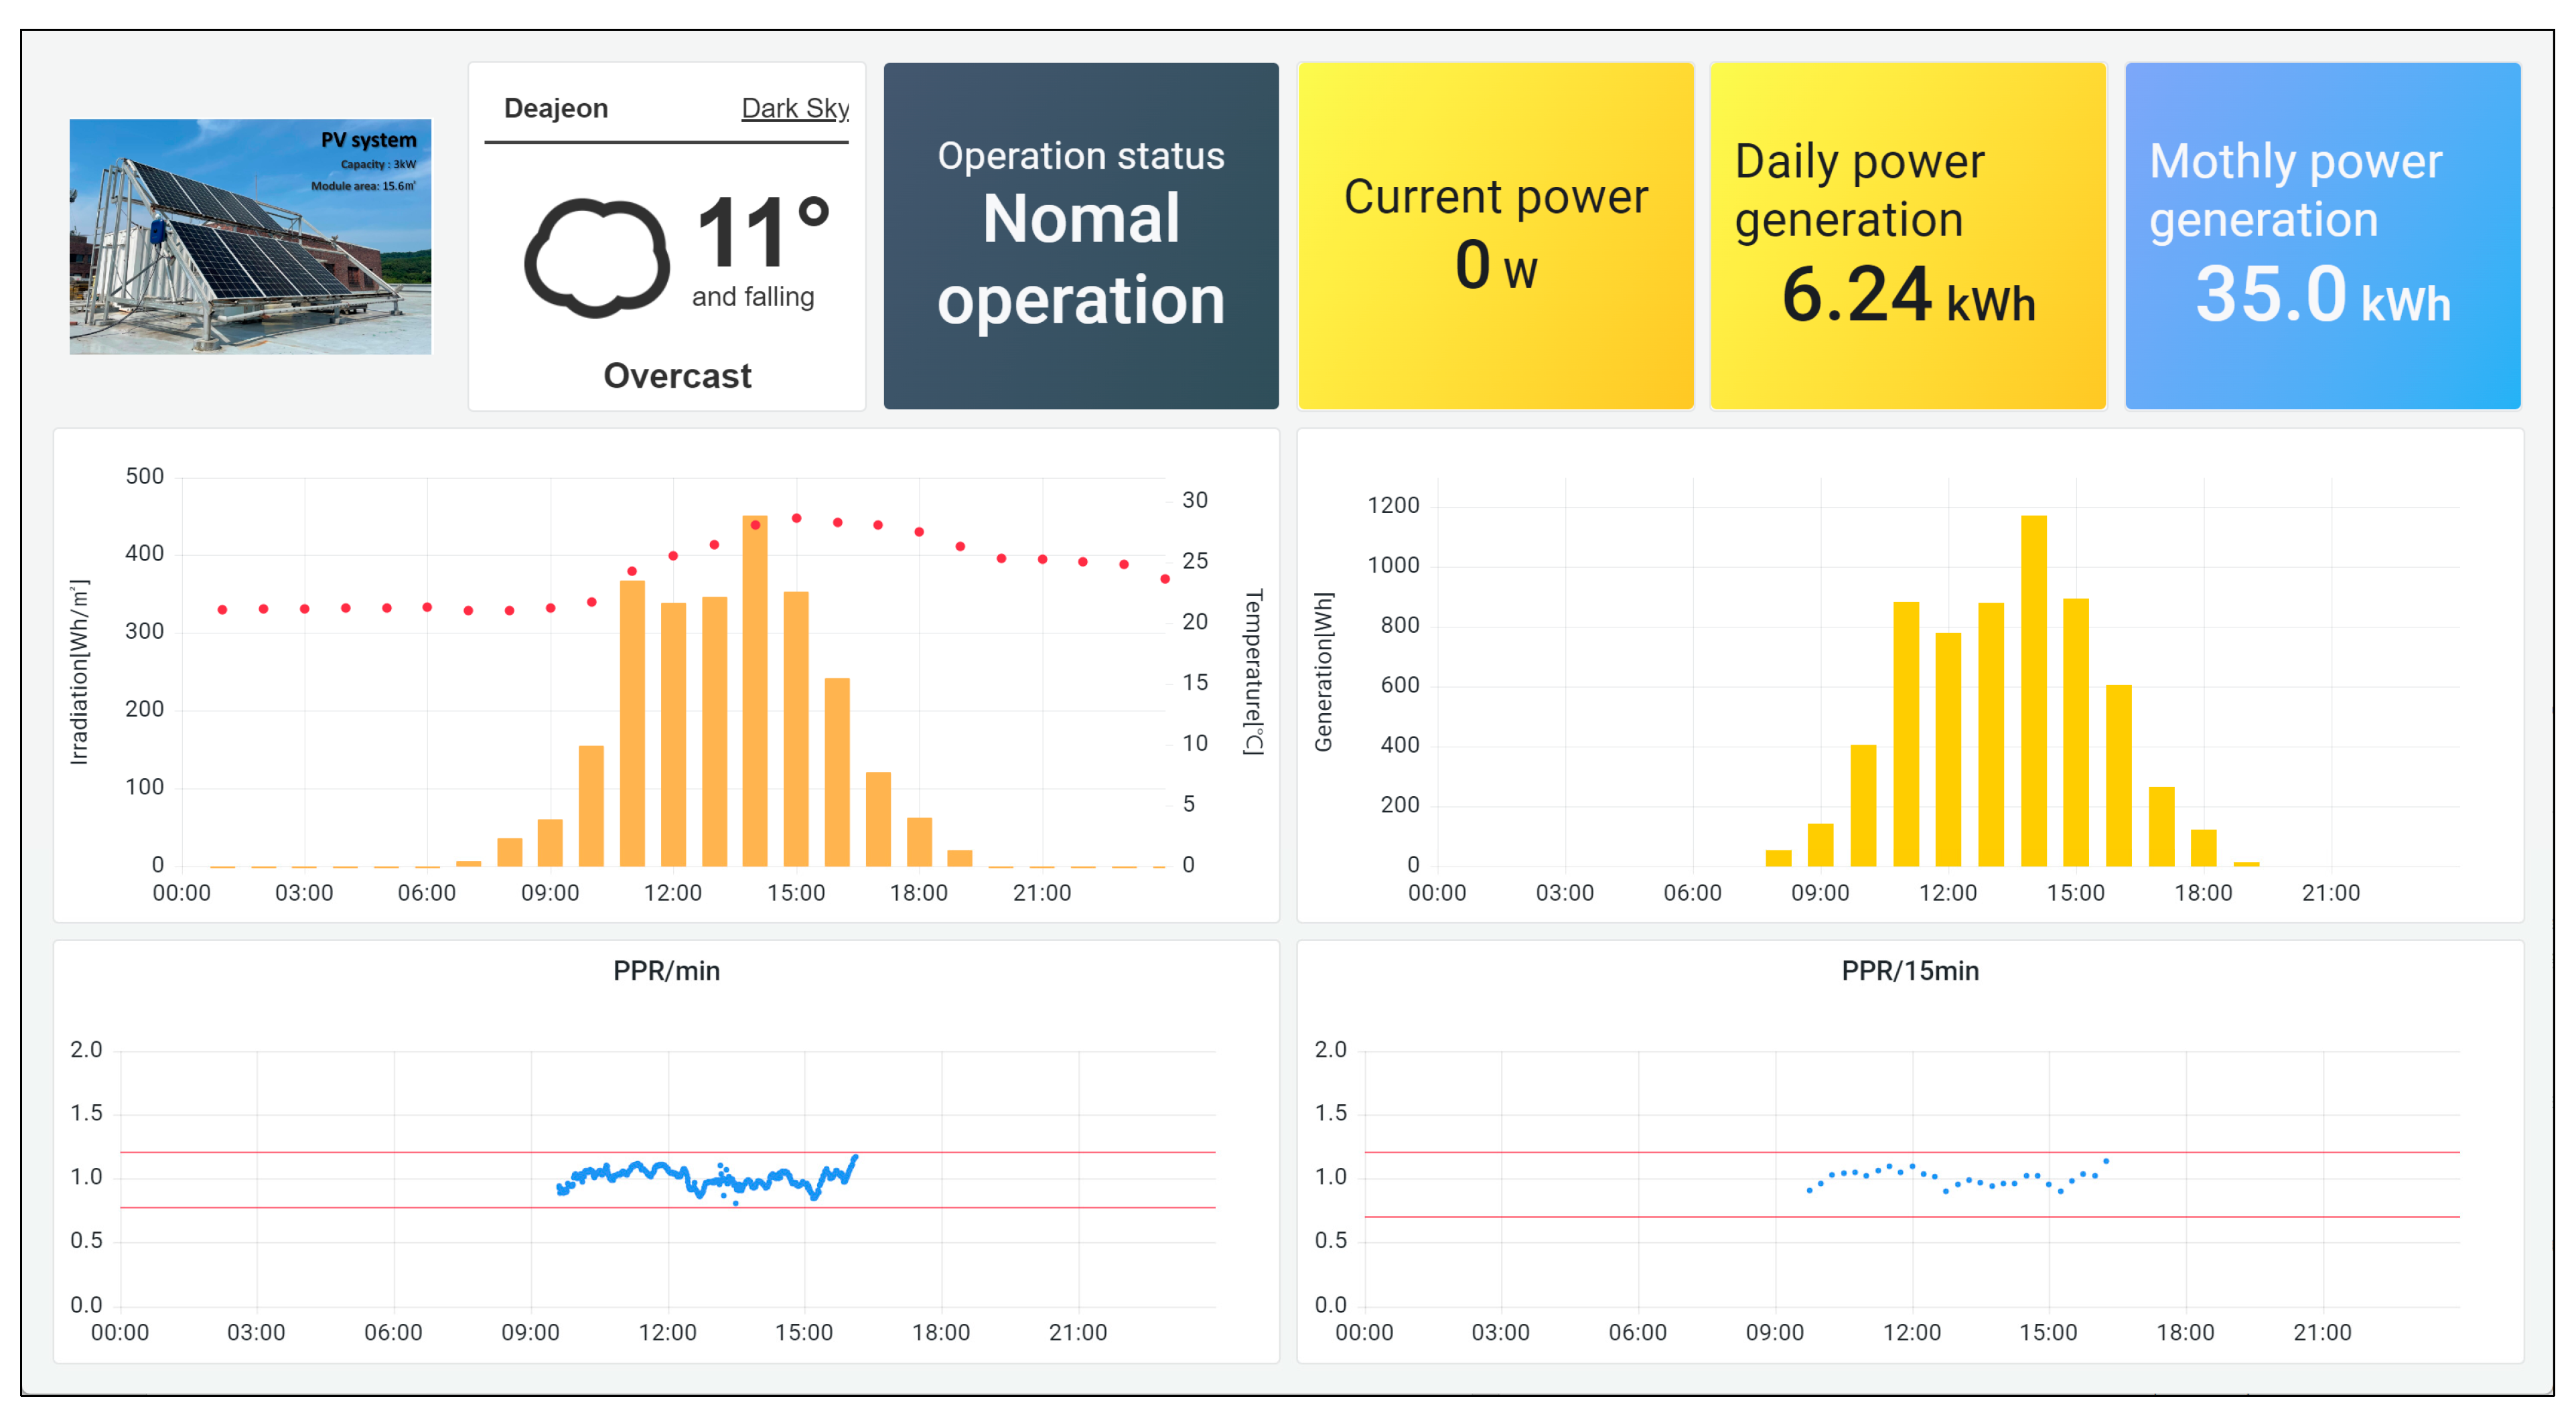
2.2. Building a Platform for the Monitoring System

The study developed a remote monitoring system for failure detection using openHAB that integrates device and sensor nodes with open-source software and can connect to a database. OpenHAB is implemented in Java on the Equinox OSGi framework. OpenHAB is designed to be dynamically integrated with various IoT devices and protocols such as KNX, Z-Wave, Insteon, Arduino, Ethernet, MQTT, and any operating systems such as Linux, macOS, Windows, Raspberry Pi, Docker, and Synology without restrictions. In addition, openHAB integrates Grafana and InfluxDB through binding. Grafana, an open-source project, is a visualization tool that does not depend on any specific software, supports connection with more than 30 different collection tools and DBs, and is mainly used for time series data visualization. InfluxDB is an open-source time-series database that has excellent write functions and is suitable for monitoring a large number of events.

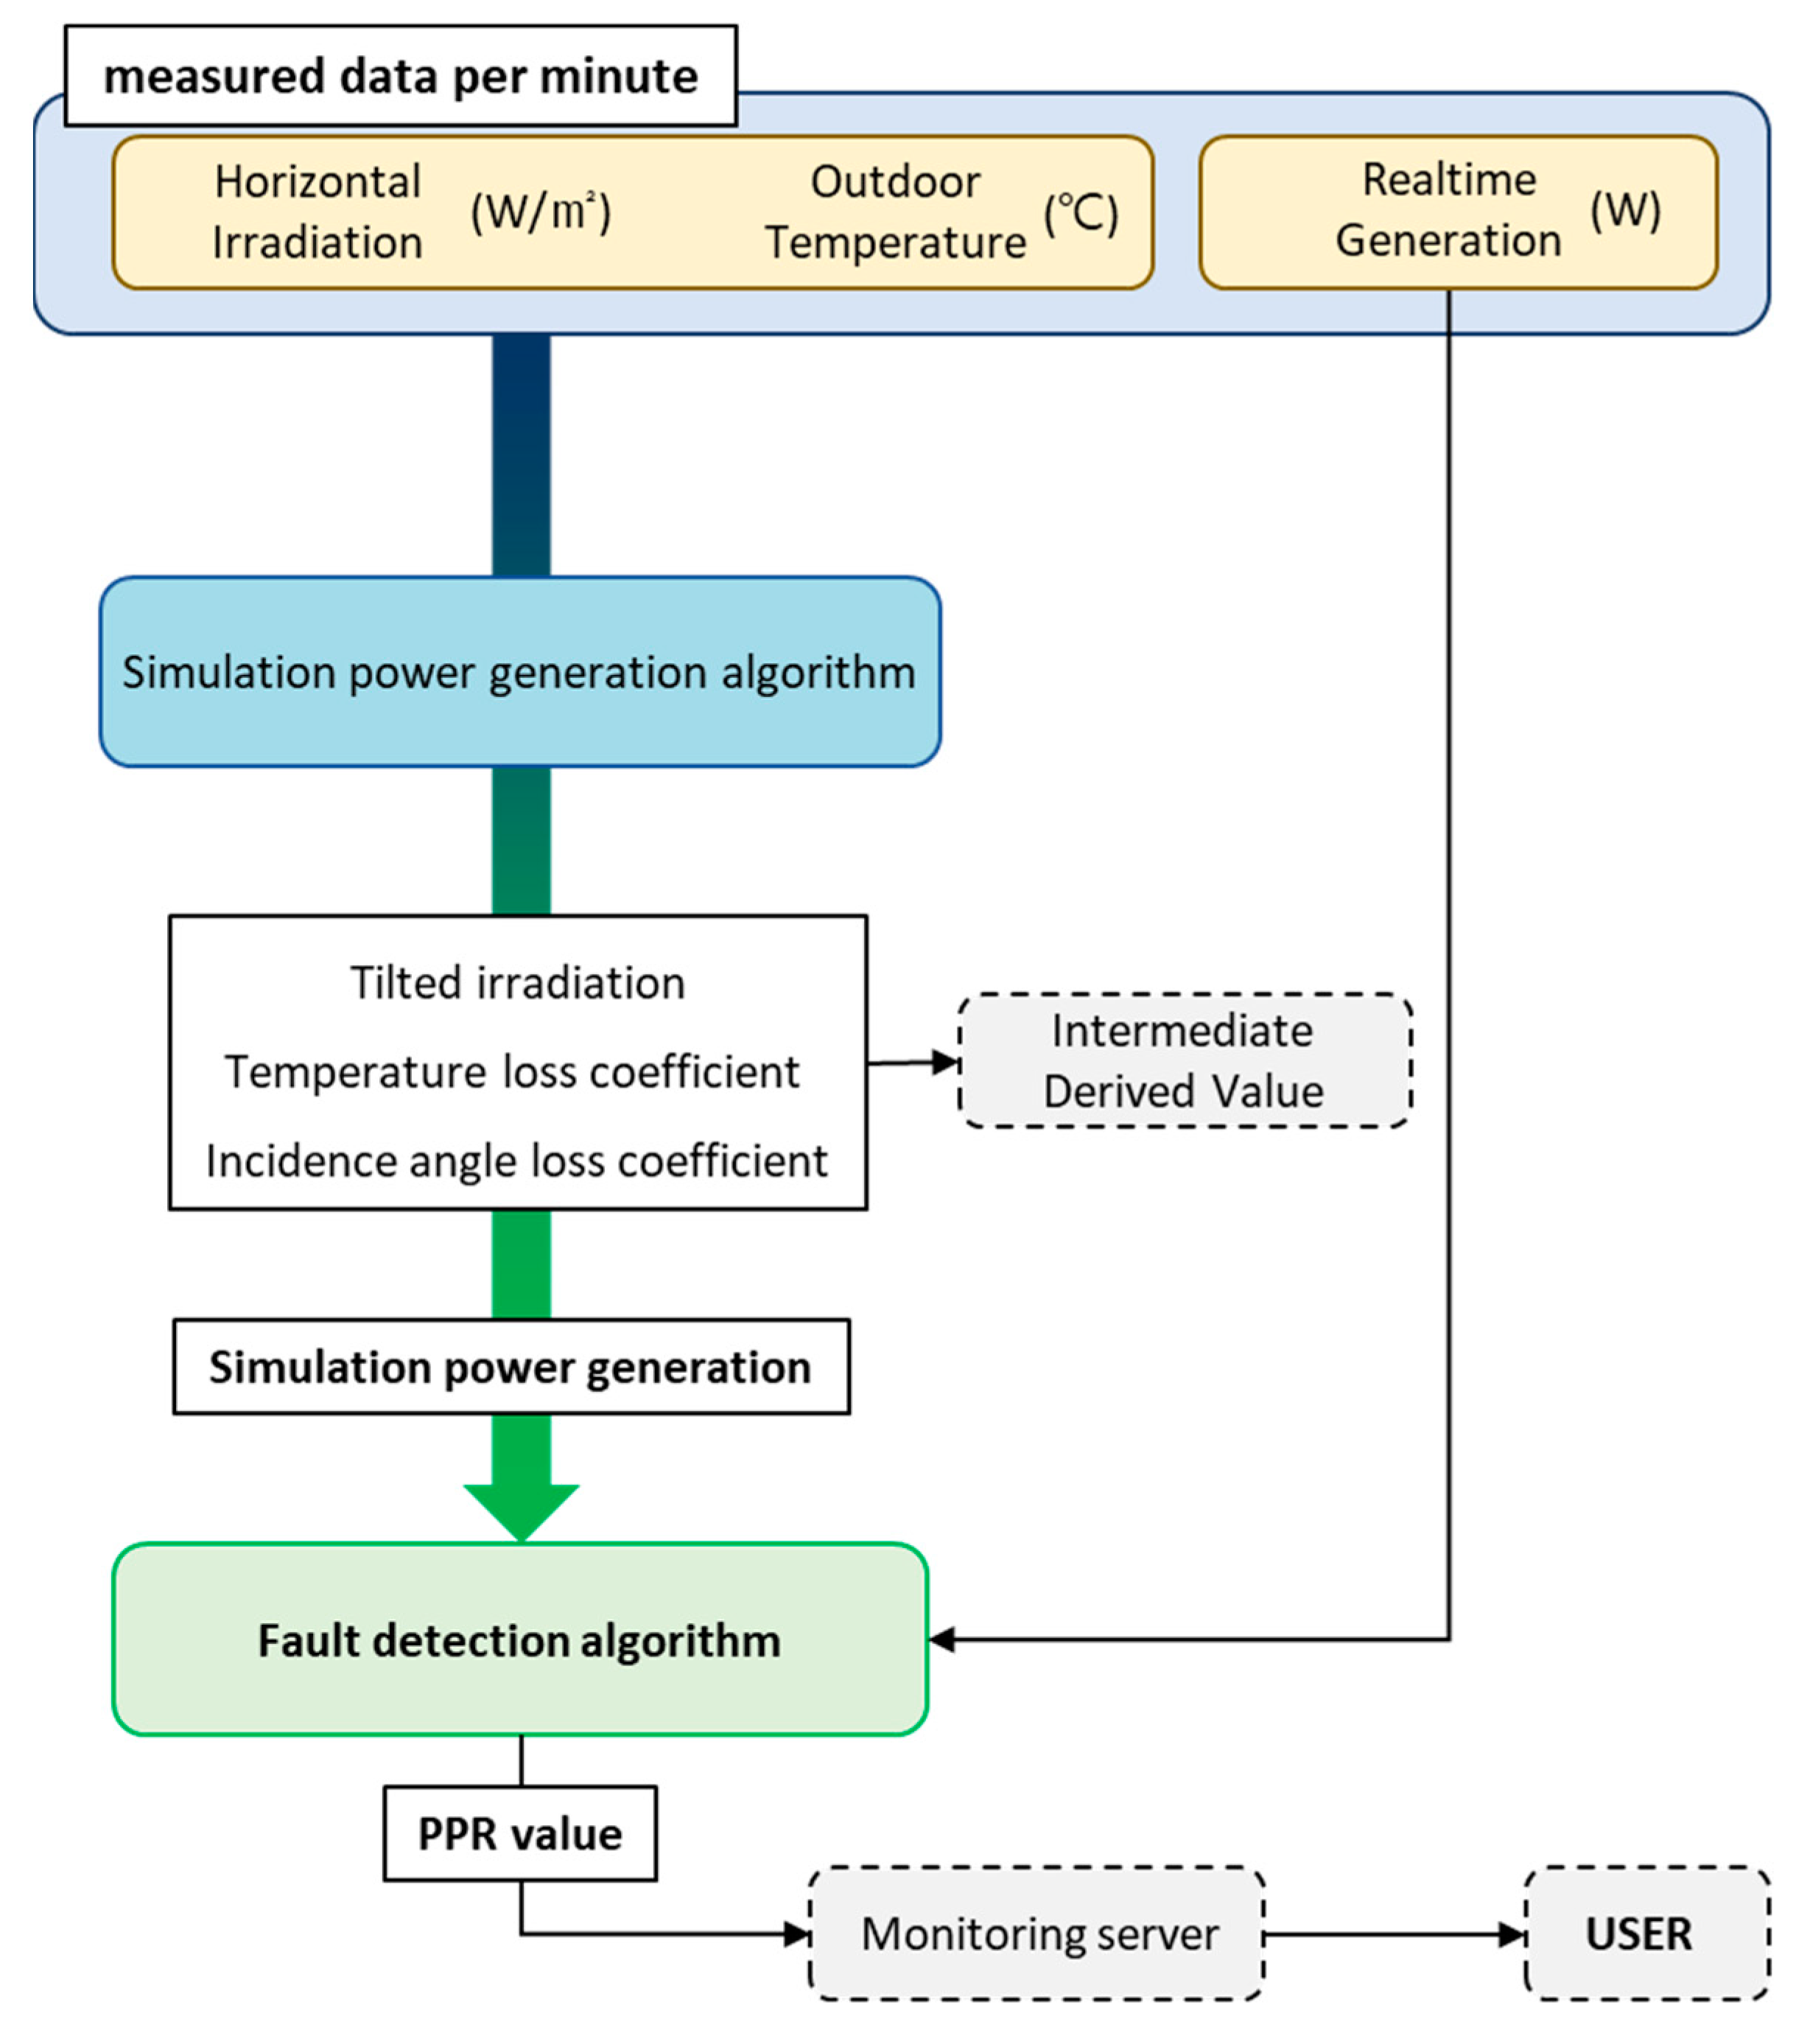
3. Simulation Algorithm

Various factors can affect the power generation loss (failure) of a PV system, such as deterioration of solar modules, errors in tracking the maximum power point, wiring shorts and aging, shading effects, and dust or snow. Many failure detection algorithms are based on comparisons between measurements of PV systems and simulation predictions to identify failures [15,16,17,18]. Accordingly, the algorithm used in the monitoring system applied in this study is subdivided into an algorithm that obtains power generation through simulation and a failure detection algorithm that is the basis for error when comparing measured power and predicted power generation.

3.1. Simulation Generation Model

The power generation efficiency of the crystalline solar module in the MPP output can be expressed as Equation (1), in the form of a linear function of the PV module temperature, T c   [19].
η c = η ref   [ 1     β ref   ( T c     T r ) ]
Here, η ref refers to the rated efficiency of the module under standard test conditions, β ref   is the temperature coefficient, T c   refers to the PV module temperature, and represents the reference temperature (25 °C).
The PV module temperature can be calculated using Equation (2) as a function of solar intensity and outside temperature.
( τ α ) I t = η c I t   +   U L ( T c     T a )
Here, (τα) represents the solar transmittance/absorption rate of the solar module, I t is the solar intensity, T a refers to the outside temperature, and U L   is the heat loss coefficient.
Substituting Equation (1) into Equation (2), the PV module temperature, T c is derived from Equation (3).
T c   =   U L T a   +   ( ( τ α )     η r e f     η r e f β r e f T r )   I t U L     η r e f β r e f I t
The heat loss coefficient, U L is shown in Table 1, according to the installation type (rear boundary condition) of the PV module [20].
The solar radiation on the slope of the PV module considering the incident angle loss from the total solar radiation on the horizontal plane can be estimated using Equation (4). In this study, the Orgill and Holland model [21] was applied to separate the direct and scattering components for the horizontal plane, and the scattering and ground reflection for the inclined plane were calculated using Reindl’s anisotropic puncture model [22,23].
I t = R b   I b K b +   I d K d   1   +   cos β 2   +   ( I b   +   I d )   ρ g K g   1     cos β 2
Here, R b is the direct irradiance ratio of the inclined plane to the horizontal plane, I b   is the horizontal direct irradiance, and I d is the horizontal sky scattering. K b and K d are the direct, scattering modifiers, and K g is the incident angle modifier for the ground reflection component ρ g is the ground reflectance; and β represents the PV module installation inclination angle.
The incident angle correction factor for each component of solar radiation is shown in Equation (5).
K i = 1     b 0 (   1 cos θ i     1 )
Here, b 0   is an incident angle correction coefficient, and θ i   is an incident angle of the PV module for each component of solar radiation.
Incident angles of direct irradiance, scattering, and ground reflected solar radiation on the slope are calculated as follows [24].
θ b = cos 1 ( cos ( φ β ) ) cos   ω   +   sin ( φ     β ) sin δ )
θ d = 59.68     0.1388   β   +   0.001497   β 2
θ g = 59     0.5788   β   +   0.002693   β 2
Here, φ represents latitude, ω refers to time angle, and δ indicates solar declination.
Therefore, the AC power generation of the PV system, considering the incident angle and temperature loss, is calculated by Equation (9).
P PV   =   η s η c   I t A PV
Here, η s is the operating efficiency reflecting the system loss, and A PV   is the total installation area of the module.
System losses are a combination of all losses caused by other mechanisms, such as ohmic, module quality, array mismatch contamination, and inverter losses.

3.2. Failure Detection Algorithm

The Shewhart control chart is a statistical process control technique and is a time series graph with three reference lines: a center line (CL), an upper control limit, and a lower control limit. The CL is an acceptable value, which is the average of observations, and a minimum of 100 observations is required to set it [25,26]. The control limit line is set as in Equations (10) and (11). When the observed value deviates from the control limit line, it is detected as a failure [27].
UCL = CL   +   3   σ
LCL = CL     3   σ
Here, CL refers to the mean of the observations and σ is the standard deviation of the observations.
In this study, the Shewhart control chart above was applied as a benchmark for fault detection in PV systems. The ratio of the AC power generation was measured from a PV system ( PP meas ) and simulation results ( PP s i m ), and PPR ( PP meas / PP s i m ) was set as the observed value. Figure 1 shows the process in which the PPR value is derived by applying the simulation generation model and the failure detection algorithm described above to the monitoring system.

4. Establishment of the Remote Monitoring System for Solar Power Generation

4.1. PV Systems and Sensor Installation

Figure 2 shows a 3-kW, grid-connected PV system installed on the roof of a building in Daejeon for the demonstration of a remote monitoring system. Eight 380 W PV modules were connected in series with an inclination angle of 45° to the southwest (10° azimuth), and a 3.5 kW class model (ESP3K5-KRA/B) from D company was used for the inverter. To secure the meteorological data required for analysis of power generation simulation, a horizontal solar pyrometer and an RTD temperature sensor for outdoor temperature measurement were installed in an instrument shelter around the PV system. The watt-hour meter was installed at the bottom of the inverter to measure the AC power generated.

4.2. Establishment of the Remote Monitoring System

As described above, the study used Odroid N2 equipped with an ARM processor as the data server for edge computing. Figure 3 shows the monitoring device installed in the field.
Figure 4 shows the schematic diagram of the remote monitoring system. The solar system was connected to the data server (Ordroid N2) through RS-485 communication, and the RTD temperature sensor, which was converted into a digital signal by the watt-hour meter and Adam-6015, was connected through the router through TCP/IP communication. Adam-6015 is a 16-bit 8-channel A/D converter that uses the Modbus protocol.
OpenHAB, an open-source platform, was loaded on the data server. It calls the sensing data from the end nodes through the request packets of ‘Things’ (a concept that defines a sensor or physical device connected to a server). These data are linked as ‘Items’ (a concept that groups values measured by sensors defined in ‘Things’ as assigned attributes), and are registered in openHAB. The interpretation algorithm derived from the ‘Items’ as a variable is programmed in Java, and the script is called and executed by ‘Rules’ (a concept that sets the rules of the groups defined in ‘Items’). If a script is written in another language (for example Python or Javascript), it can be registered in ‘Scripts’ (a concept used when declaring a rule in a script such as ‘Rules’ in a language other than Java for use) [28].

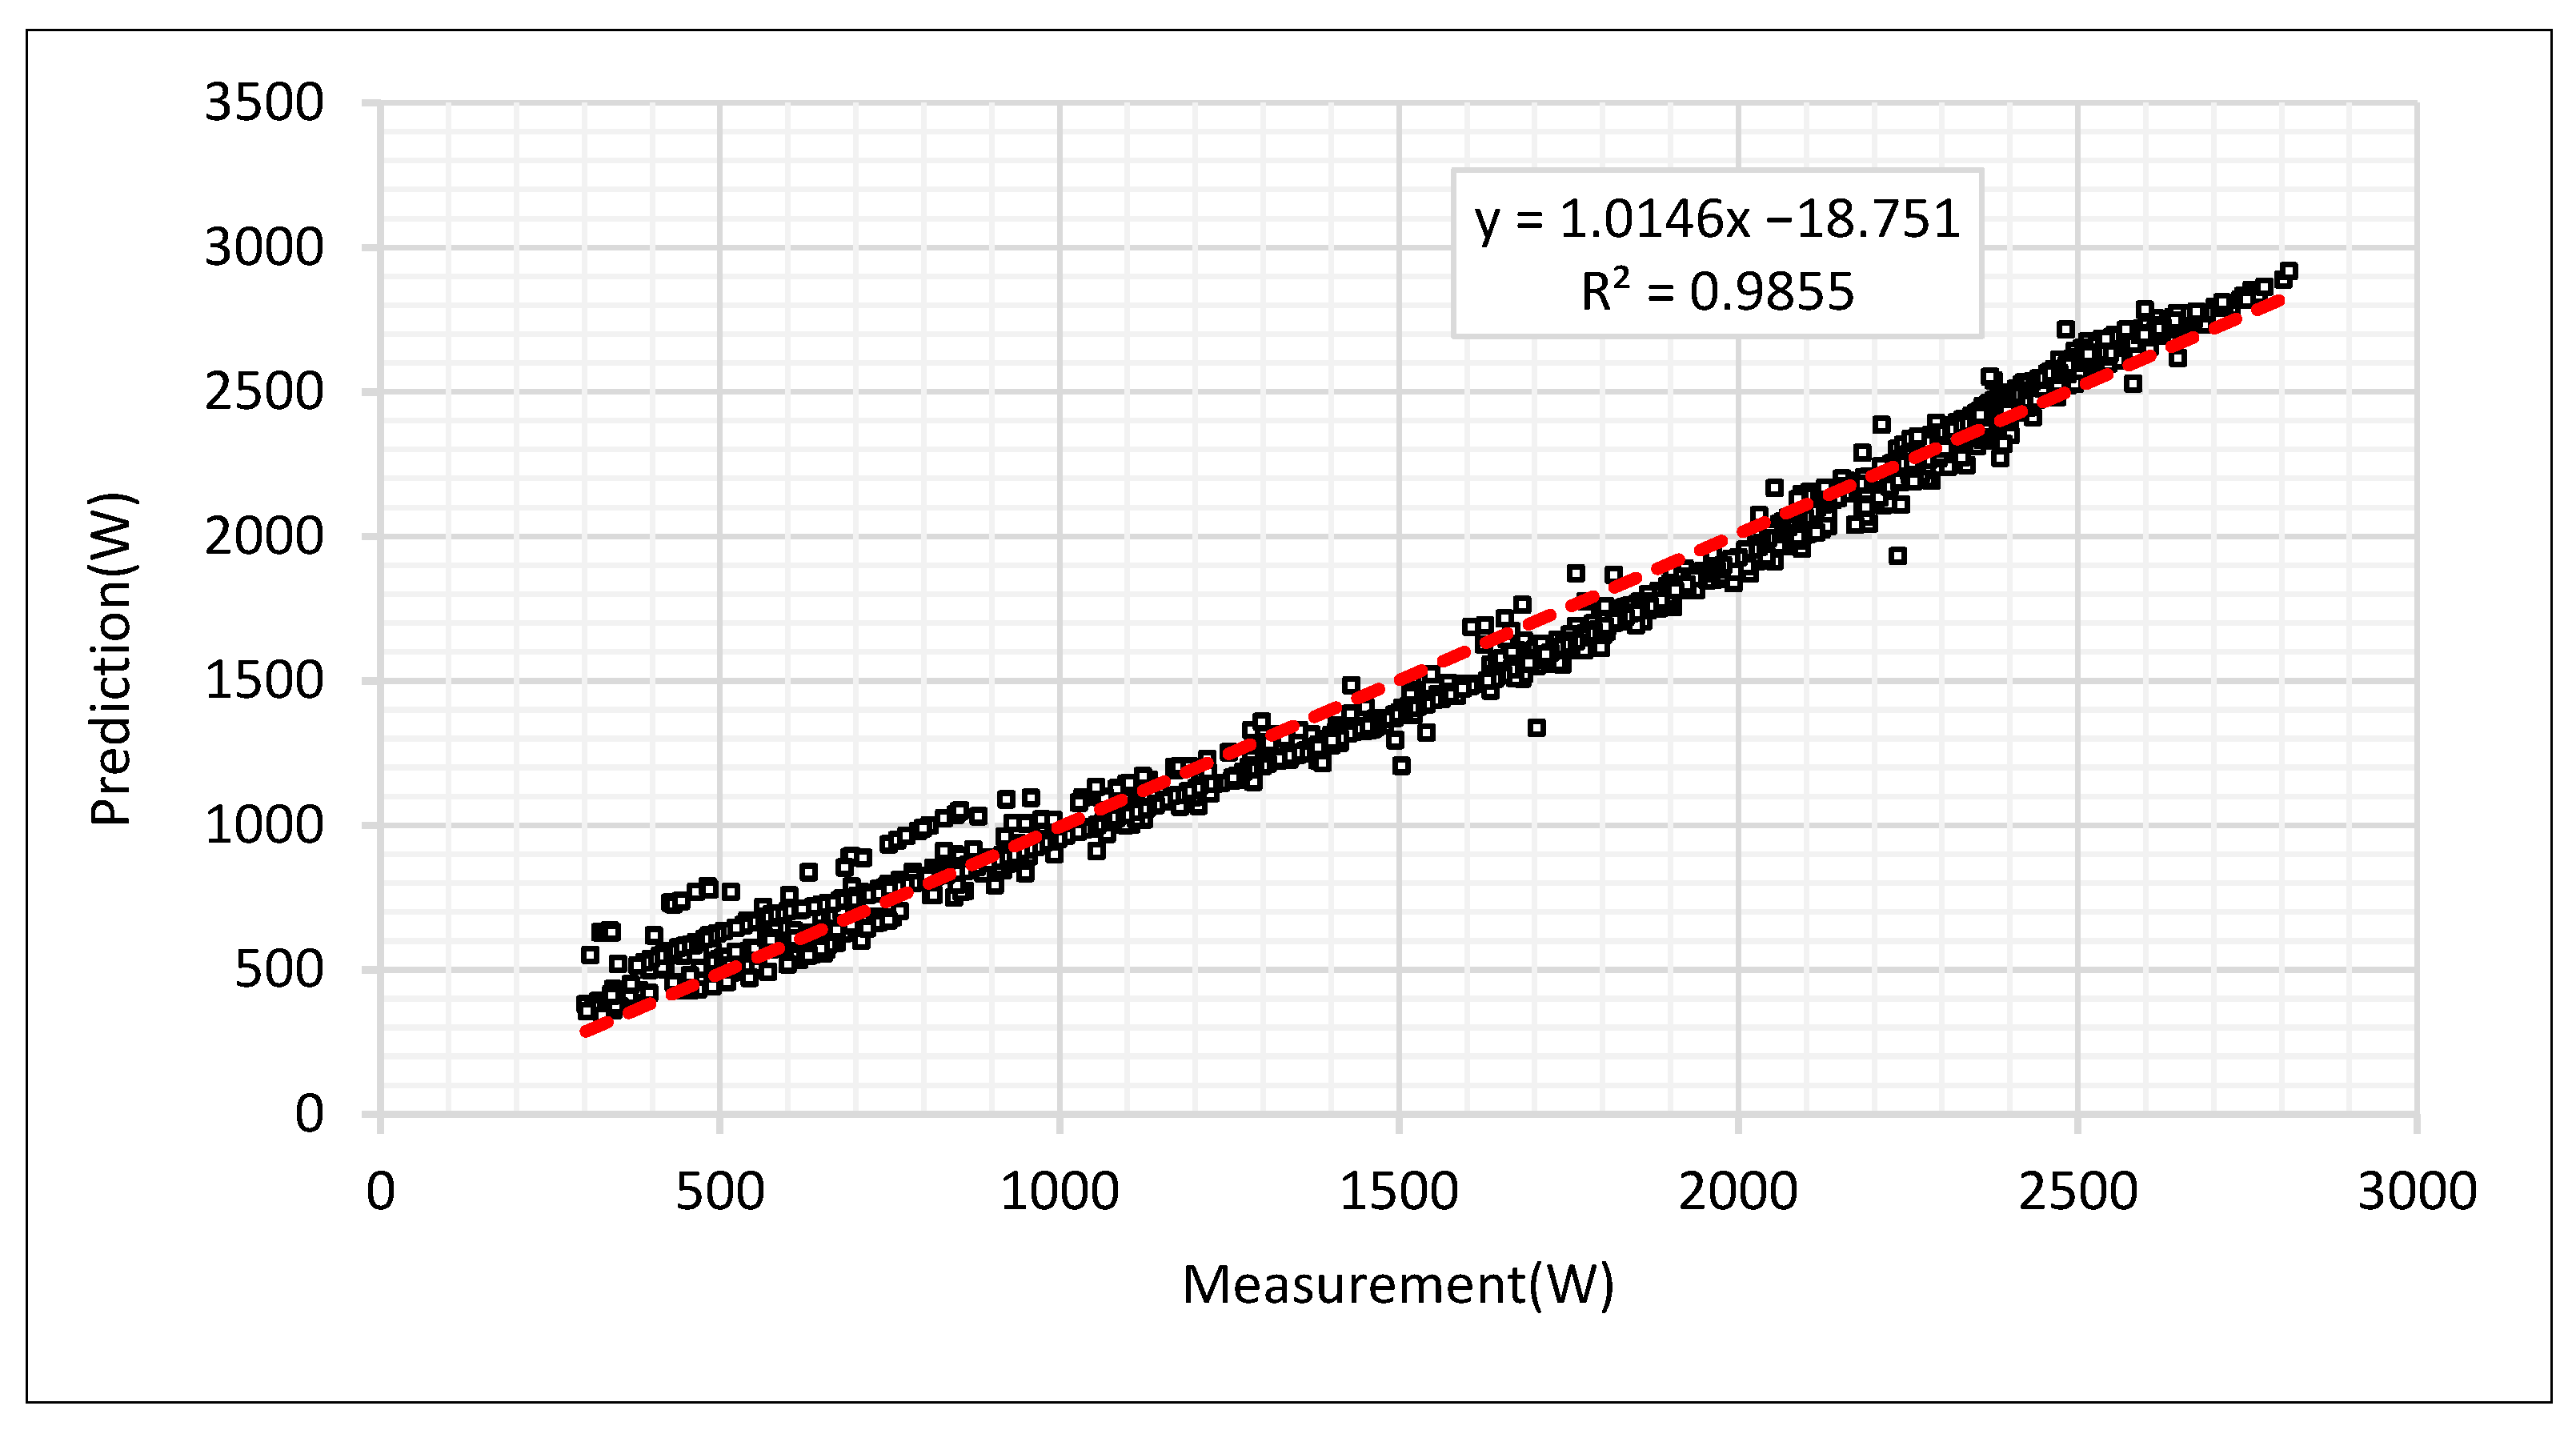
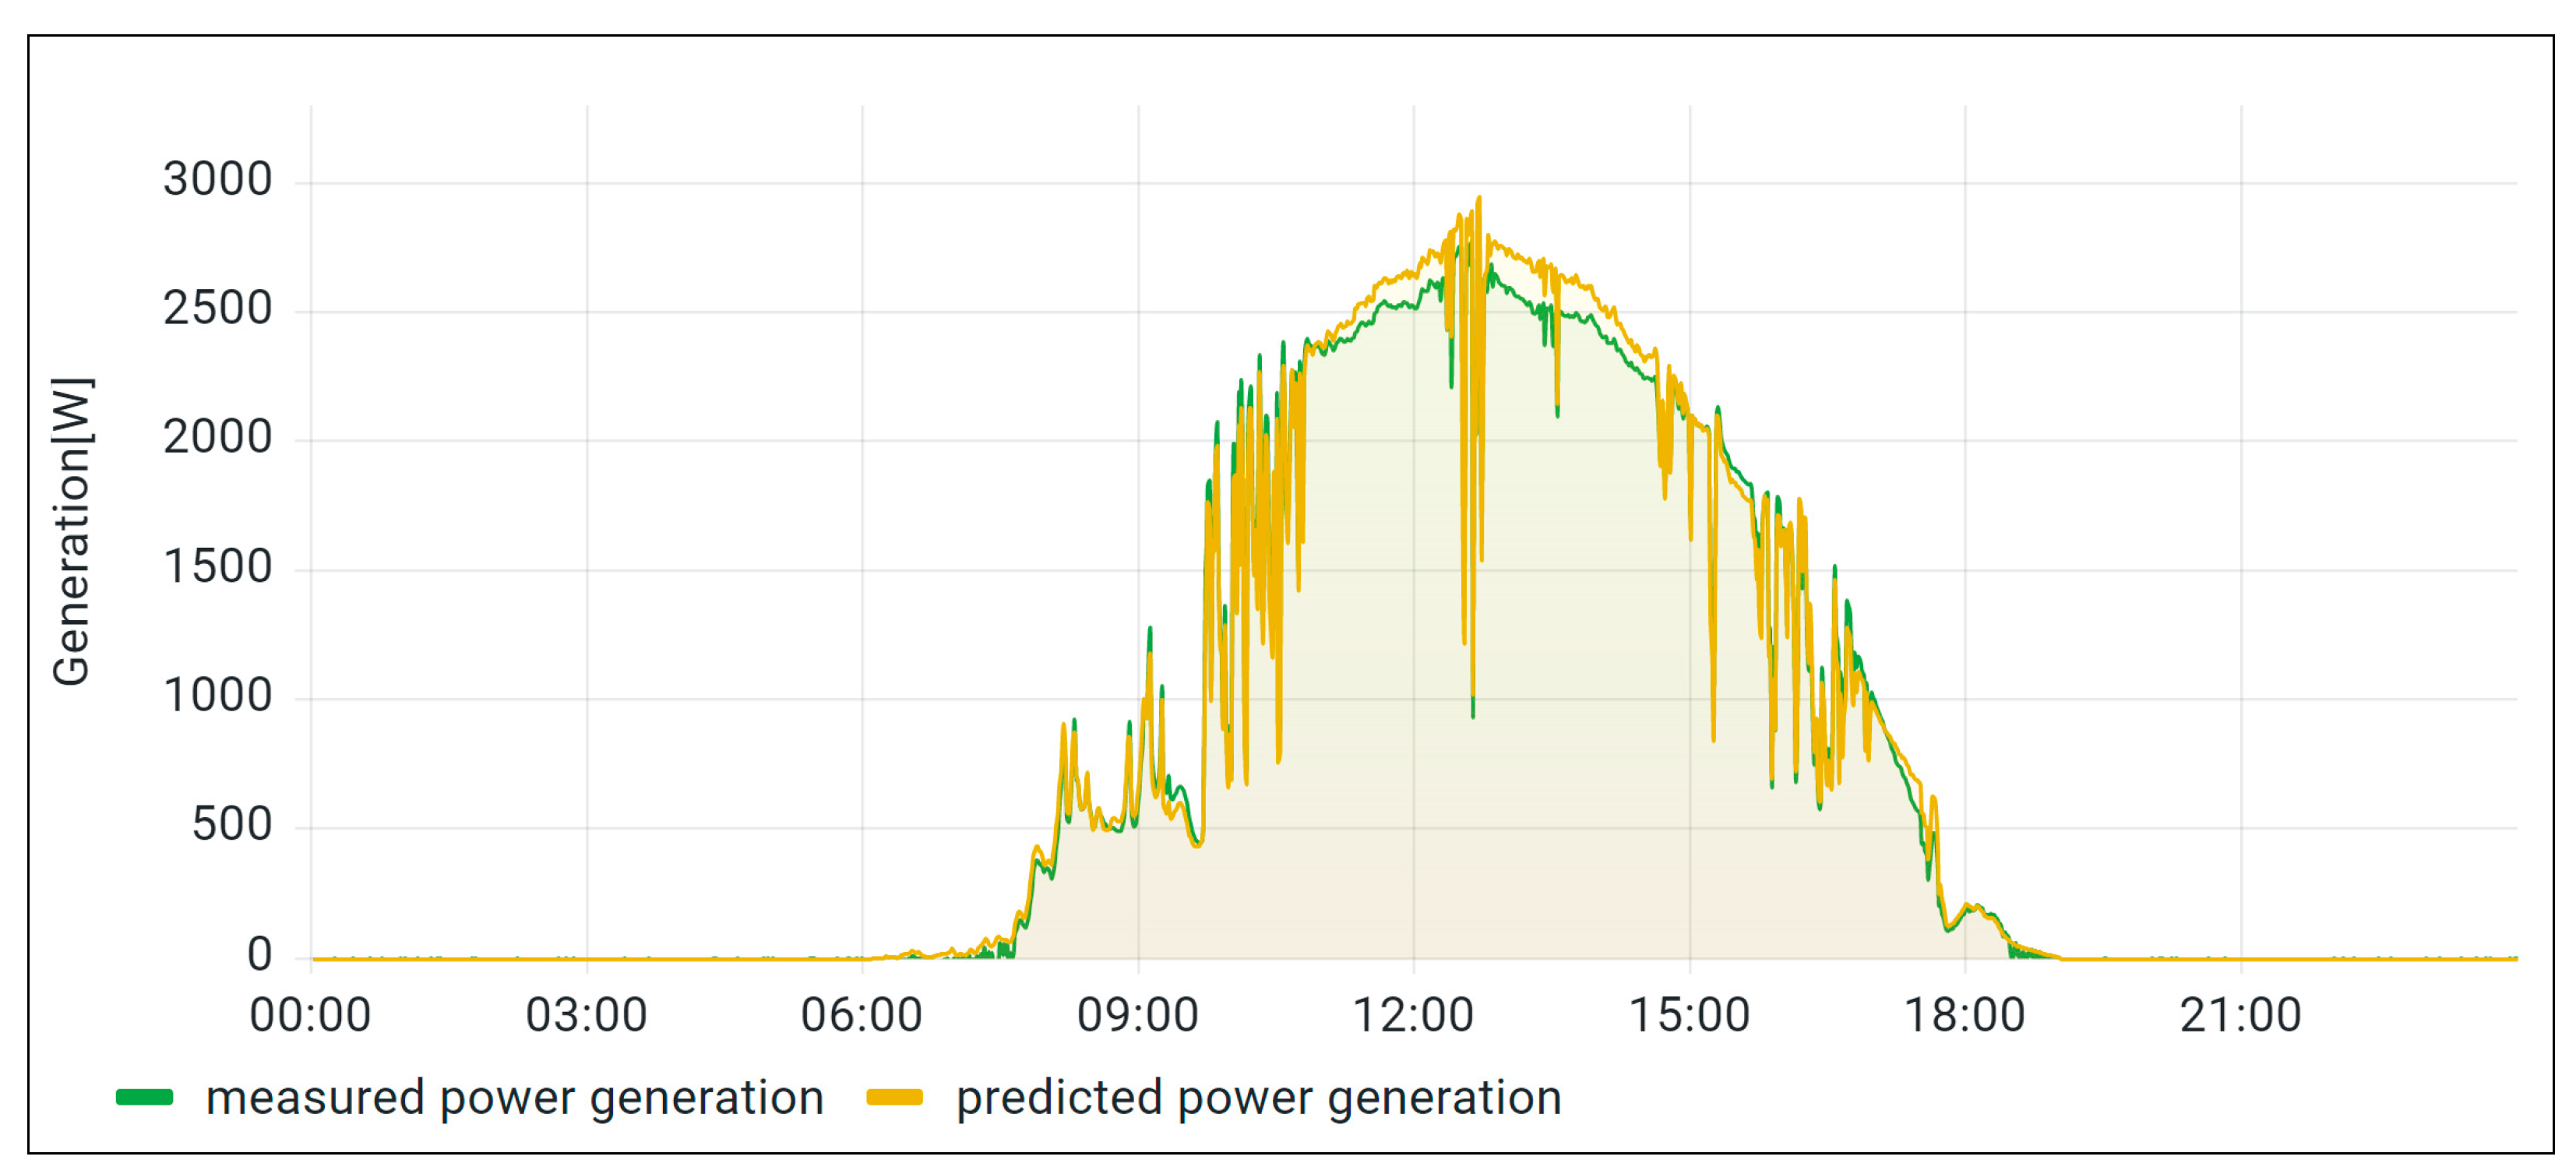
4.3. Validation of the Simulation Model
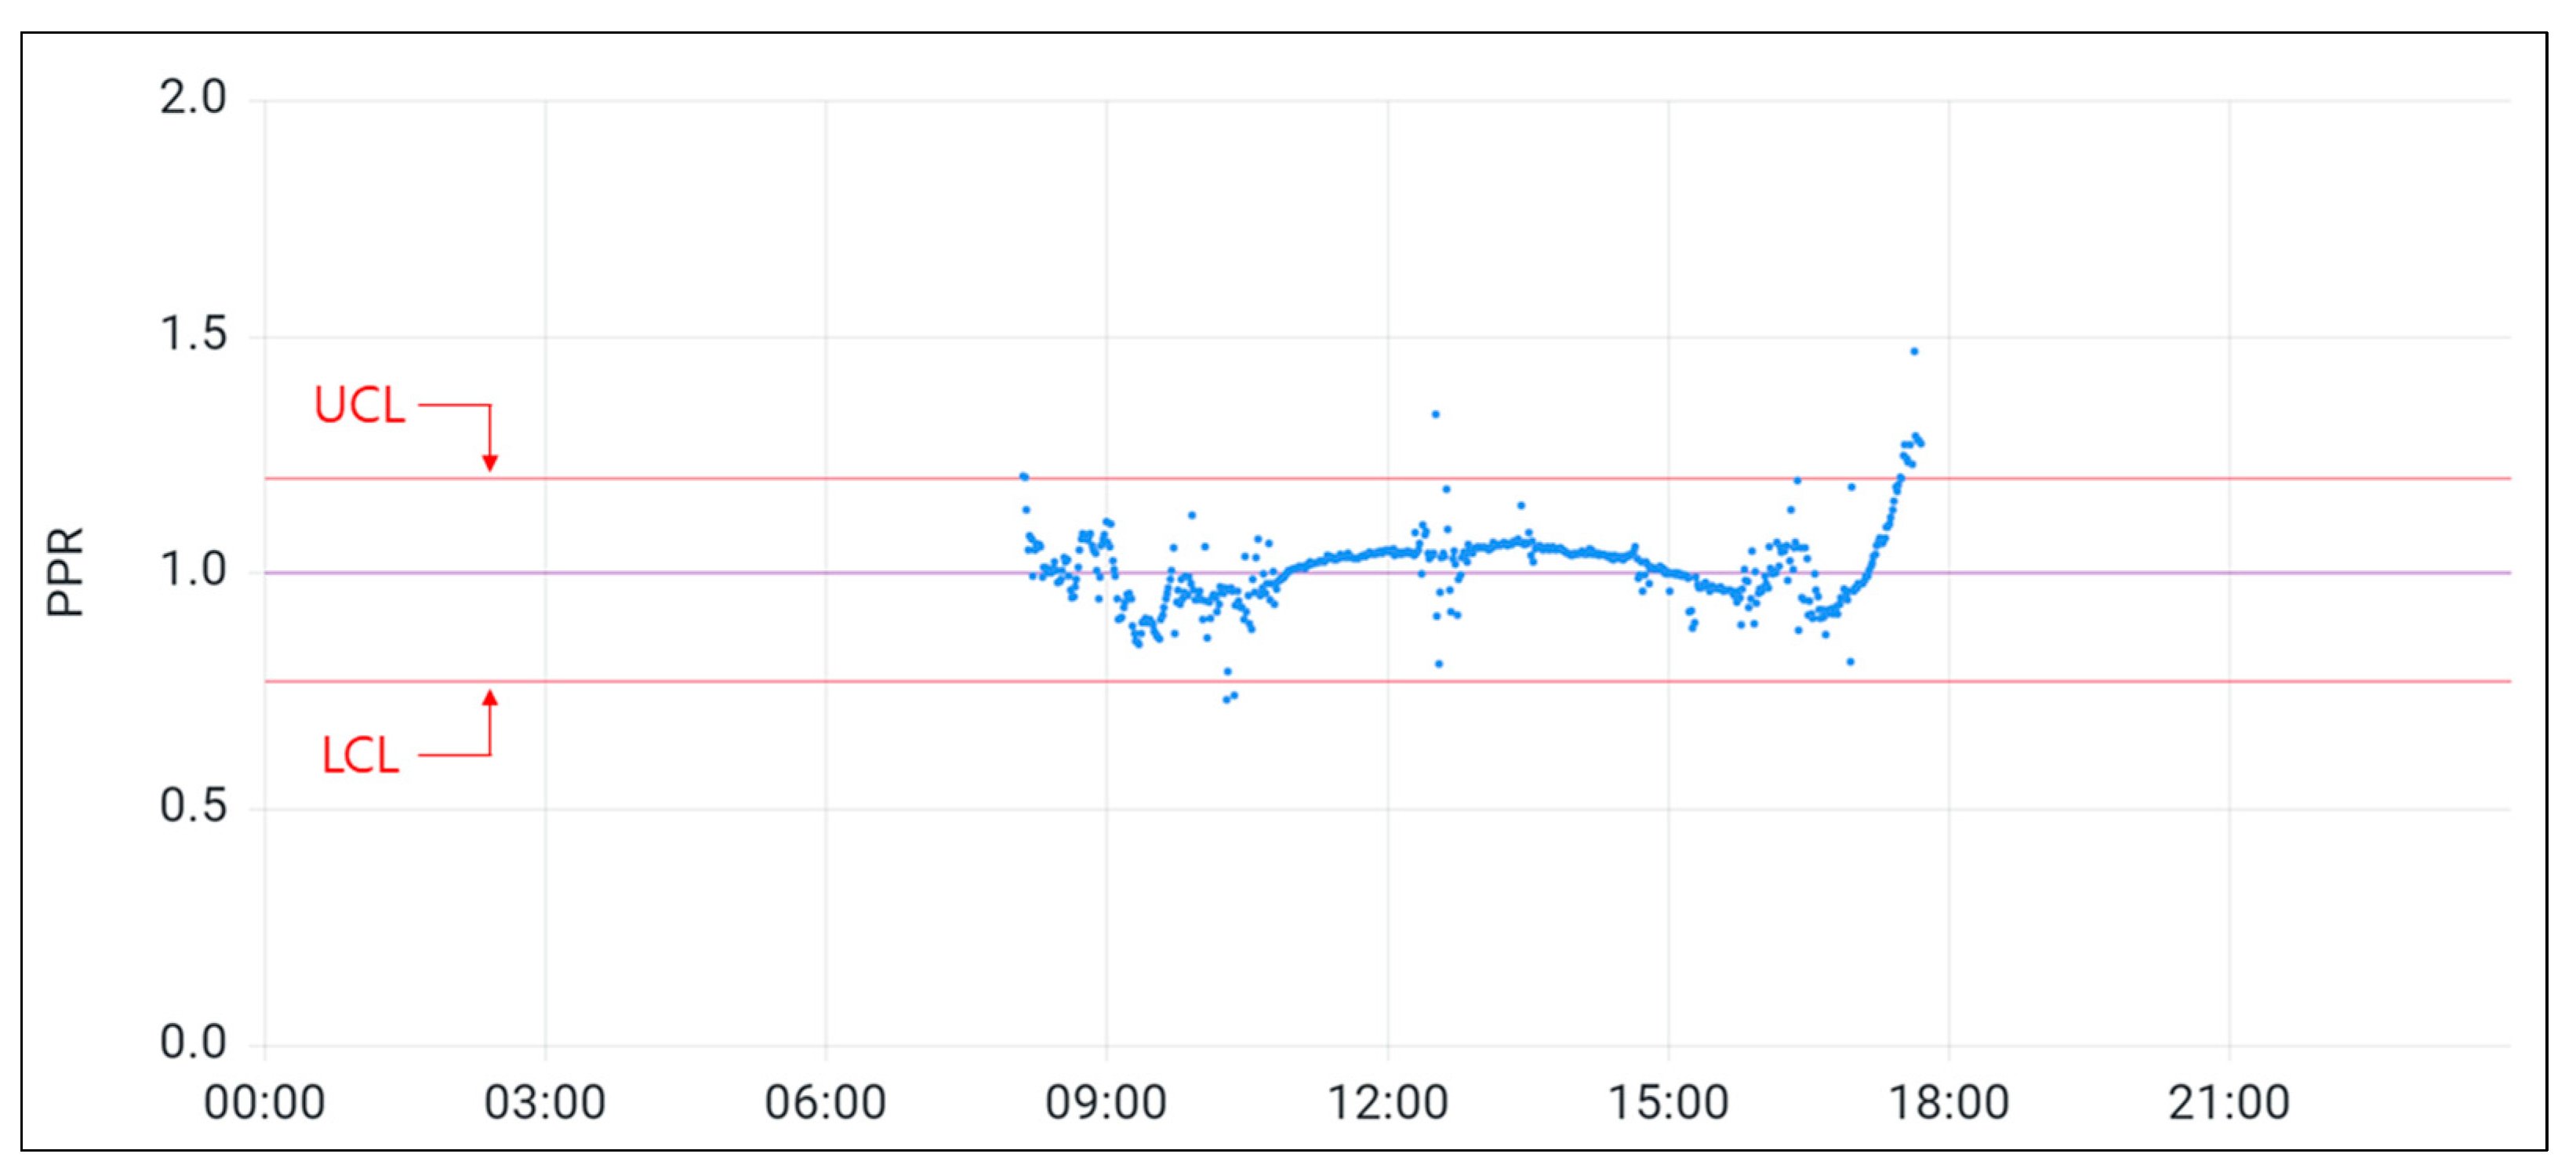
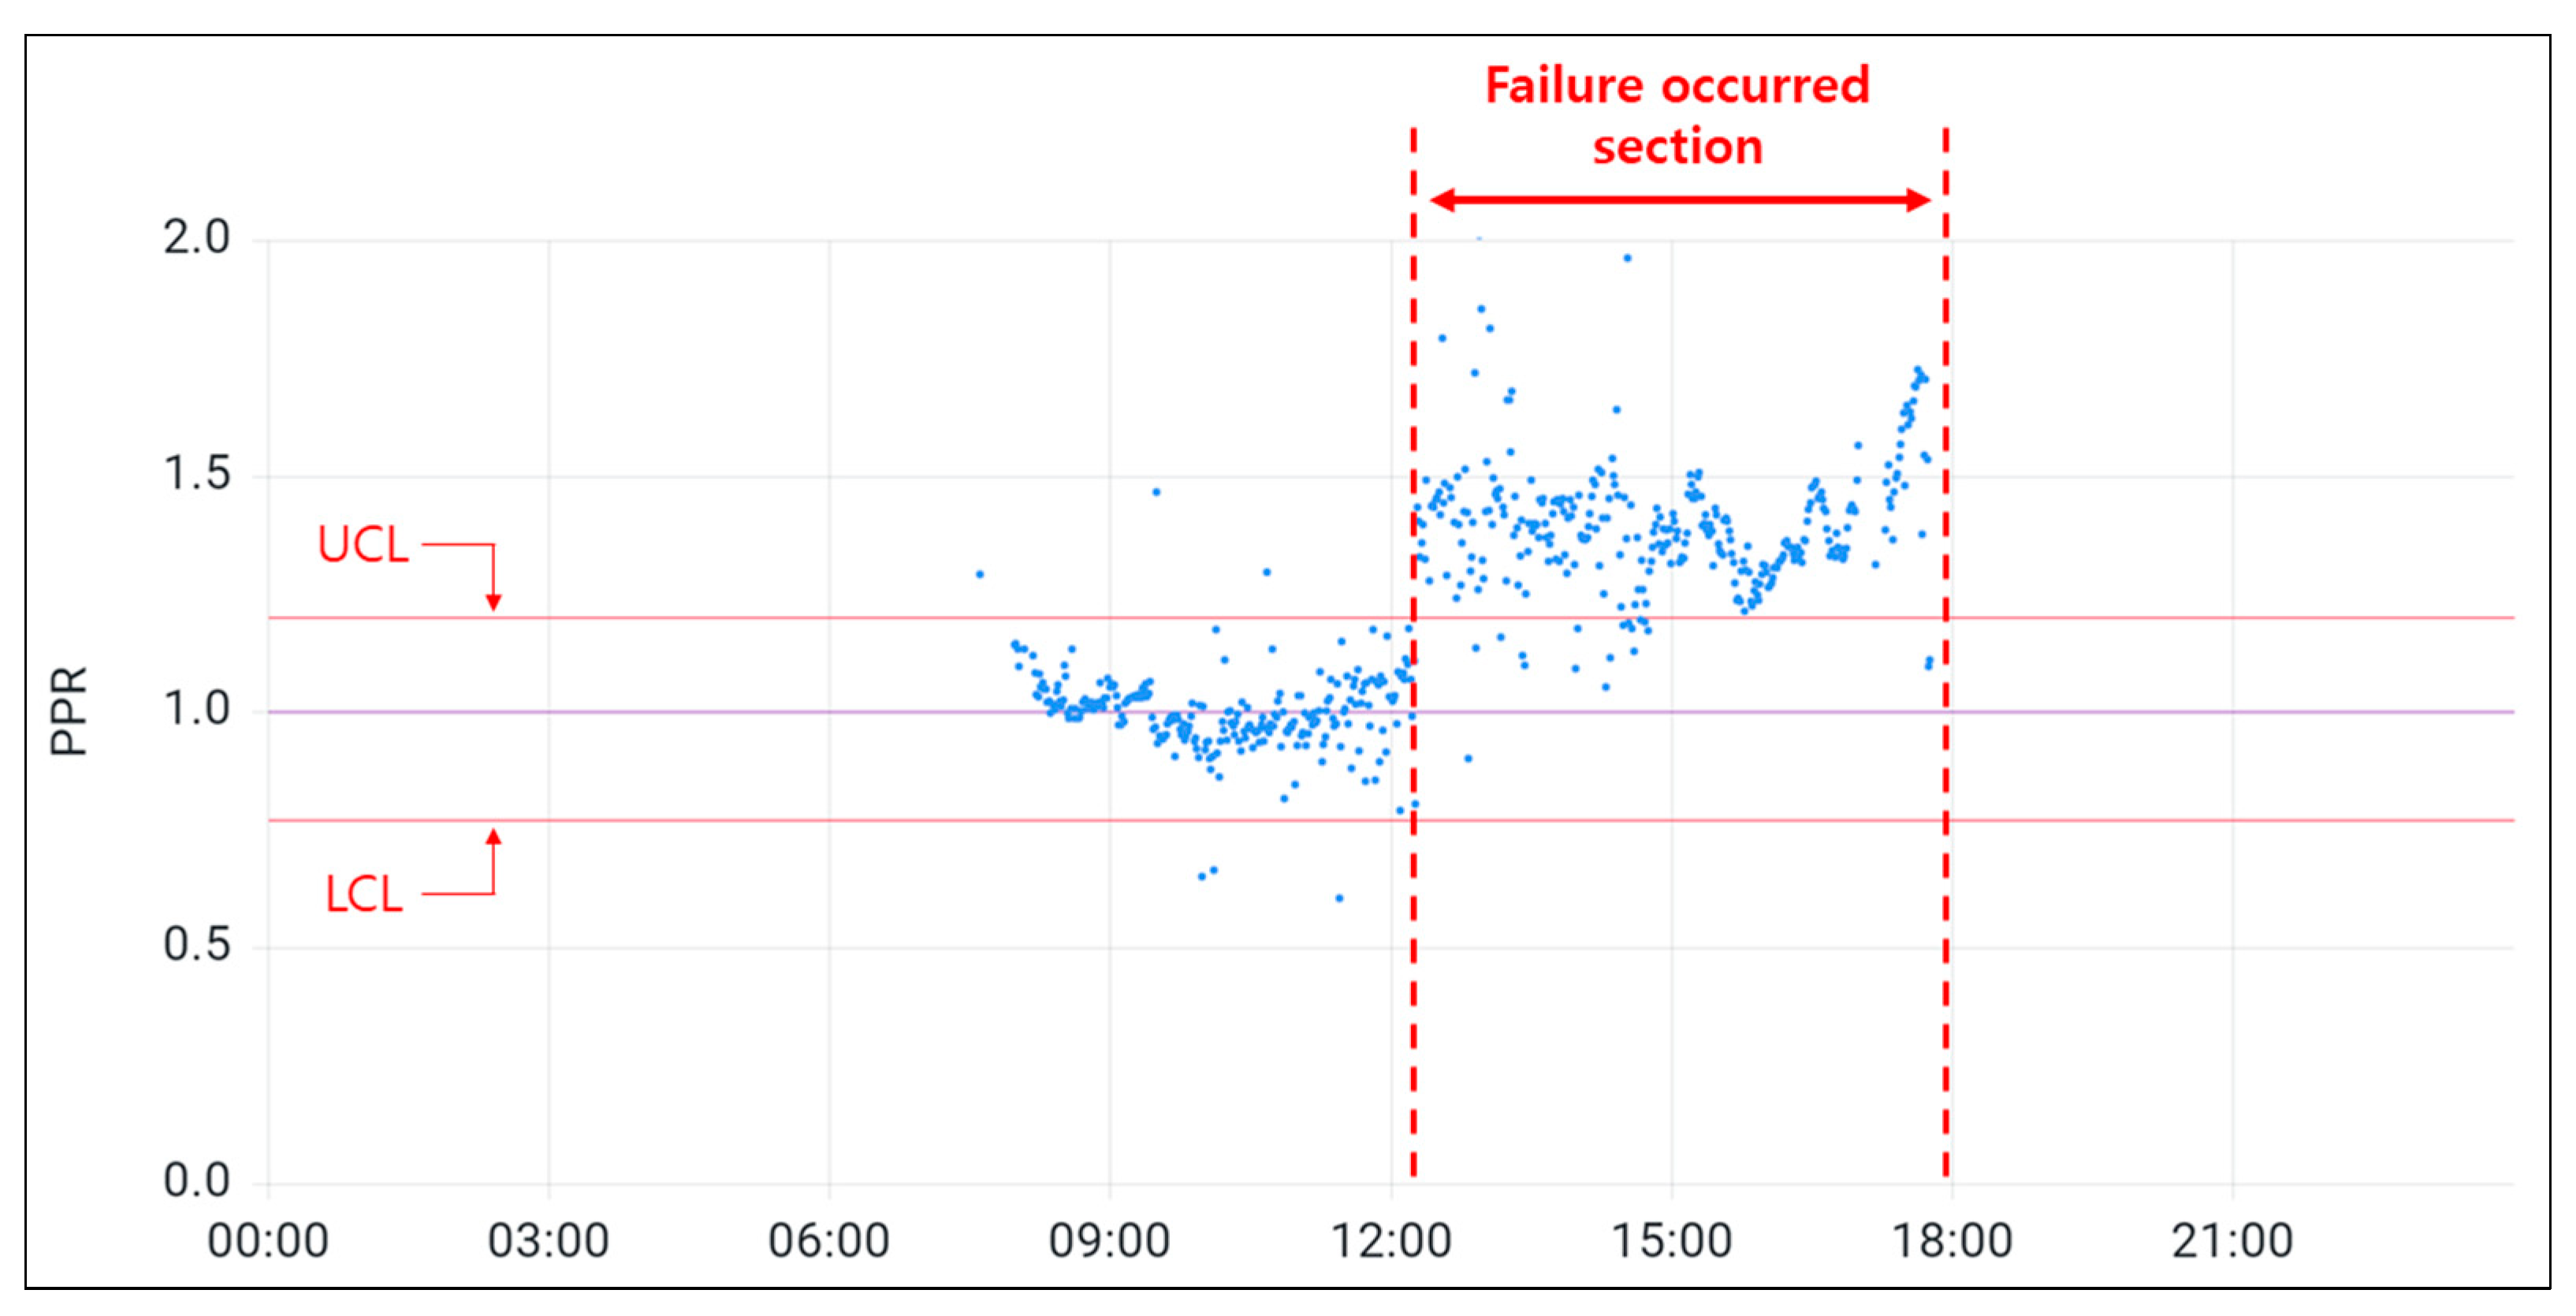
This study compared the power generation measured at 1 min intervals for 10 days and the simulation results through linear regression analysis and the normalized root mean square error of Equation (12) to examine the validity of the simulation model. The horizontal solar insolation measured and outside temperature were the input variables for the simulation model. Figure 5 shows the simulation results according to the amount of power generated. Here, the low solar radiation area [29] where power generation efficiency was significantly reduced due to the reduction of the open-circuit voltage and fill factor of the module was excluded. According to the linear regression analysis between the two results, R² and NRMSE were 0.9855 and 0.05, respectively, confirming the reliability of the simulation model [28].
NRMSE =   1 n   i = 1 n ( p i     m i m ¯   ) 2
Here, n is the number of measurements, p i   is the predicted value, m i is the measured value, and m ¯ is the average value of the measurement.

4.4. Control Limits

Table 2 shows the mean values and standard deviations for the PPR during the same period. The limit of the normal operation of the PV system according to the Shewhart control chart could be set as Equation (13). When it reaches the control limit, 99.73% of the normal operational observations ( PPR ref ± 3 σ ) are within this range.
0.77 PRP 1.2

5. Results and Discussion

Various types of monitoring systems have been developed and applied to grasp the power generation status and operation status of PV systems in real time, and there are also various fault diagnosis methods (algorithms) installed in them. The monitoring level of the PV system can be largely classified into three levels. In the case of Step 1, power generation information is acquired through the inverter interface and used as input data for fault diagnosis. In the second stage, monitoring work is performed on the solar junction panel, and generation information for each string of the solar array can be grasped, enabling a higher level of fault diagnosis than the first stage. In the last three steps, monitoring is performed at the PV panel level, generation information for each panel can be obtained, and deterioration and aging of abnormal panels can be tracked. Similar to this, the higher the monitoring step, the more precise fault diagnosis is possible, but the increase in construction cost due to the increase in the number of sensors used for this can be a disadvantage. Accordingly, this study proposed a PV failure detection method based on a real-time remote monitoring system at the first level. The fault detection approach compares the AC power generation measurement result of the PV power generation system and the simulation model prediction results in real-time, and considers a significant difference between the two results as a fault. The prediction model used in this approach applied a simple analysis model that does not require advanced circuit-based modeling methods, artificial intelligence techniques, or detailed understanding of the PV power generation process in the power generation analysis process. Figure 6 shows the main screen of the remote monitoring system built into the PV system. Various information such as real-time power generation status monitored at 1 min intervals, weather information, and operation statuses are stored in InfluxDB through openHAB and displayed in Grafana.
Figure 7 and Figure 8 show the daily measured and simulated power generation of the monitoring system and the corresponding PPR under normal operation. The study shows that the actual measurement and the power generated in the simulation are almost identical, and the PPR operates within the control limit (although there were several temporary deviations).
Figure 9 shows a clear deviation between the measured and predicted power generation in the case of inducement of shading and disconnection. Energy loss during power generation caused by partial shading occurred as one out of the eight PV modules connected in series was covered with an opaque cover. Figure 10 shows that the “PPR” goes over the control limit in such an abnormal state. A temporary drop in PV module output caused by partial shading or snow cannot be diagnosed as a failure, and the system generates a warning of failure at an early stage when the exceeding of the control limit continues.

6. Conclusions

PV systems of less than 10 kW, which are mostly operated unmanned as a grid-connected system, have a few relatively expensive monitoring systems. As a result, there is a lack of efficiency in the operating system and management; in the event of a failure, the system may be left unattended for a long time. Therefore, this study proposed a low-cost, fault detection remote monitoring system for small-scale PV systems. To implement the system at a low cost, SBC was applied as a data server with edge computing, and a monitoring system was designed using openHAB. For the failure detection benchmark, the ratio of predicted power generation to actual power generation under normal conditions was set as an observation value and a Shewhart chart was used. The verification test on the actual grid-connected PV system proved that the monitoring system accurately identified defects in real-time during normal operations or abnormal operations, such as disconnection or partial shading.
This remote monitoring system has advantages in that the system has a simple structure based on simulation and can be easily applied anywhere as long as the capacity and installation type of the PV system is identified. In the future, a more affordable and reliable monitoring system is expected to be available if weather data can be gathered in real-time through a domestic, open application programming interface.

Author Contributions

Conceptualization, H.-W.L., I.-K.K. and U.-C.S.; methodology, H.-W.L. and U.-C.S.; formal analysis, I.-K.K.; investigation, I.-K.K. and J.-H.K.; resource, J.-H.K., H.-W.L. and U.-C.S.; writing—original draft, H.-W.L.; writing—review and editing, I.-K.K. and U.-C.S.; visualization, J.-H.K. All authors have read and agreed to the published version of the manuscript.

Funding

This work was supported by the Korea Institute of Planning and Evaluation for Technology in Food, Agriculture, and Forestry (IPET) through the Agricultural Energy Self-Sufficient Industrial Model Development Program, funded by the Ministry of Agriculture, Food, and Rural Affairs (MAFRA) (120093-3).

Data Availability Statement

Not applicable.

Conflicts of Interest

The authors declare no conflict of interest.

Nomenclature

η c Efficiency of the module (%)
η ref Reference efficiency of the module (%)
β ref Temperature coefficient
T c PV module reference temperature (°C).
T r Outside temperature (°C).
τ α Solar transmittance/absorption rate
U L Heat loss coefficient
I t Solar radiation intensity (W/m2)
R b Direct irradiance ratio
I b Horizontal direct irradiance (W/m2)
I d Horizontal sky scattering irradiance (W/m2)
ρ g Ground reflectance
K b Incident angle modifier of direct irradiance
K d Incident angle modifier of sky scattering
K g Incident angle modifier of ground reflectance
β PV module Installation Slope Angle (°)
b 0   Incident angle correction coefficient
θ i Incident angle of the PV module for each component of solar radiation (°)
ωTime angle (°)
δSolar declination (°)
φLatitude (°)
θ b Incident angle of direct irradiance
θ d Incident angle of sky scattering
θ g Incident angle of ground reflectance
η s Operating efficiency reflecting the system loss (%)
A PV   Installation area of the PV module (m2)

References

  1. Silvestre, S.; da Silva, M.A.; Chouder, A.; Guasch, D.; Karatepe, E. New procedure for fault detection in grid-connected PV systems based on the evaluation of current and voltage indicators. Energy Convers. Manag. 2014, 86, 241–249. [Google Scholar] [CrossRef]
  2. Park, Y.; Kang, G.; Ju, Y.; Kim, S.; Ko, S.; Jang, G. The monitoring system of photovoltaic module using fault diagnosis sensor. J. Korean Sol. Energy Soc. 2016, 36, 91–100. [Google Scholar] [CrossRef] [Green Version]
  3. Lee, J.; Kim, K.; Park, S.; Byun, H.; Shim, K.; An, B. IoT-based mobile smart monitoring system for solar power generation. J. Inst. Electron. Inf. Eng. 2017, 54, 1175–1184. [Google Scholar]
  4. Hazra, A.; Das, S.; Basu, M. An efficient fault diagnosis method for PV systems following string current. J. Clean. Prod. 2017, 154, 220–232. [Google Scholar] [CrossRef]
  5. Ko, S.W.; So, J.H.; Hwang, H.M.; Ju, Y.C.; Song, H.J.; Shin, W.G.; Kang, G.H.; Choi, J.R.; Kang, I.C. The monitoring system with PV module-level fault diagnosis algorithm. J. Korean Sol. Energy Soc. 2018, 38, 21–28. [Google Scholar] [CrossRef]
  6. Hu, A.; Sun, Q.; Liu, H.; Zhou, N.; Tan, Z.; Honglu Zhu, H. A novel photovoltaic array outlier cleaning algorithm based on sliding standard deviation mutation. Energies 2019, 12, 4316. [Google Scholar] [CrossRef] [Green Version]
  7. Cho, K.; Kim, E.; Lee, D.; Lee, M.; Park, J. Development of fault diagnosis program for reducing power loss cost of the photovoltaic power system using actual operation data. Trans. Korean Inst. Electr. Eng. 2020, 69, 1682–1688. [Google Scholar] [CrossRef]
  8. Dhanraj, J.A.; Mostafaeipour, A.; Velmurugan, K.; Techato, K.; Chaurasiya, P.K.; Solomon, J.M.; Gopalan, A.; Phoungthong, K. An effective evaluation on fault detection in solar panels. Energies 2021, 14, 7770. [Google Scholar] [CrossRef]
  9. Madeti, S.R.K. A monitoring system for online fault detection in multiple photovoltaic arrays. Renew. Energy Focus 2022, 41, 160–178. [Google Scholar] [CrossRef]
  10. Hong, Y.Y.; Pula, R.A. Methods of photovoltaic fault detection and classification: A review. Energy Rep. 2022, 8, 5898–5929. [Google Scholar] [CrossRef]
  11. Kang, S.Y.; Lee, I.W. Implementation of Real-Time Monitoring System for Maintenance of PV Generation System; Korea Institute of Communication Sciences: Seoul, Republic of Korea, 2019; pp. 91–92. [Google Scholar]
  12. Sarkar, S.; Rao, K.U.; Bhargav, J.; Sheshaprasad, S.; Anirudh, S.C.A. IoT Based Wireless Sensor Network (WSN) for Condition Monitoring of Low Power Rooftop PV Panels. In Proceedings of the 2019 IEEE 4th International Conference on Condition Assessment Techniques in Electrical Systems (CATCON), Chennai, India, 21–23 November 2019; pp. 21–23. [Google Scholar]
  13. Mohamed, Z.; Yousry, A.; Abdullah, A.H.; Ihab, E.S. LabVIEW Based Monitoring System Applied for PV Power Station. In Proceedings of the 12th WSEAS International Conference on Automatic Control, Modelling and Simulation (ACMOS’10), Catania, Italy, 29–31 May 2010; pp. 65–70. [Google Scholar]
  14. Jürgen, S.; Dirk, P.; Ursula, E. Commissioning and operational control of photovoltaic power plants through online simulation. Energy Procedia 2014, 57, 152–160. [Google Scholar]
  15. Chouder, A.; Silvestre, S. Automatic supervision and fault detection of PV systems based on power loss analysis. Energy Convers. Manag. 2010, 51, 1929–1937. [Google Scholar] [CrossRef]
  16. Gokmen, N.; Karatepe, E.; Celik, B.; Silvestre, S. Simple diagnostic approach for determining of faulted PV modules in string based PV arrays. Sol. Energy 2012, 86, 3364–3377. [Google Scholar] [CrossRef]
  17. Silvestre, S.; Chouder, A.; Karatepe, E. Automatic fault detection in grid connected PV systems. Sol. Energy 2013, 94, 119–127. [Google Scholar] [CrossRef]
  18. Platon, R.P.; Martel, J.; Woodruff, N.; Chau, T.Y. Online fault detection in PV systems. IEEE Trans. Sustain. Energy 2015, 6, 1200–1207. [Google Scholar] [CrossRef]
  19. Evans, D.L. Simplified method for predicting photovoltaic array output. Sol. Energy 1981, 27, 555–560. [Google Scholar] [CrossRef]
  20. PVsyst 7 Help: Array Thermal Losses. 2019. Available online: https://www.pvsyst.com/help/index.html?thermal_loss.htm (accessed on 12 September 2022).
  21. Erbs, D.; Klein, S.; Duffie, J. Estimation of the diffuse radiation fraction for hourly, daily and monthly-average global radiation. Sol. Energy 1982, 287, 293–302. [Google Scholar] [CrossRef]
  22. Reindl, D.T.; Beckman, W.A.; Duffie, J.A. Diffuse fraction correlations. Sol. Energy 1990, 45, 1–7. [Google Scholar] [CrossRef]
  23. Loutzenhiser, P.G.; Manz, H.; Felsmann, C.; Strachan, P.A.; Frank, T.H.; Maxwell, G.M. Empirical validation of models to compute solar irradiance on inclined surfaces for building energy simulation. Sol. Energy 2007, 81, 254–267. [Google Scholar] [CrossRef] [Green Version]
  24. John, A.; Duffie, J.A.; William, A.; Beckman, W.A. Solar Engineering of Thermal Process; John Wiley & Sons: Hoboken, NJ, USA, 2013. [Google Scholar]
  25. NIST/SEMATECH e-Handbook of Statistical Methods. Available online: http://www.itl.nist.gov/div898/handbook/ (accessed on 12 September 2022).
  26. Montgomery, D.C. Introduction to Statistical Quality Control; John Wiley & Sons: New York, NY, USA, 2005. [Google Scholar]
  27. Garoudja, E.; Harrou, F.; Sun, Y.; Kara, K.; Chouder, A.; Silvestre, S. Statistical fault detection in photovoltaic systems. Sol. Energy 2017, 150, 485–499. [Google Scholar] [CrossRef]
  28. Pervaiz1, S.; Khan, H.A. Low irradiance loss quantification in c-Si panels for photovoltaic systems. J. Renew. Sustain. Energy 2015, 7, 013129. [Google Scholar] [CrossRef]
  29. OpenHAB. Available online: https://www.openhab.org/introduction.html (accessed on 12 September 2022).
Figure 1. Process flow diagram of monitoring system.
Energies 15 09422 g001
Figure 2. Photovoltaic system overview.
Energies 15 09422 g002
Figure 3. Monitoring devices installed on site.
Energies 15 09422 g003
Figure 4. Schematic of the PV remote monitoring system.
Energies 15 09422 g004
Figure 5. Comparison between predicted and measured power.
Energies 15 09422 g005
Figure 6. Web screen of PV remote monitoring system.
Energies 15 09422 g006
Figure 7. Predicted and measured power generation in normal operation.
Energies 15 09422 g007
Figure 8. PPR in normal operation.
Energies 15 09422 g008
Figure 9. Predicted and measured power generation in abnormal operation.
Energies 15 09422 g009
Figure 10. PPR in abnormal operation.
Energies 15 09422 g010
Table 1. Thermal loss factor by installation type.
Installation TypeThermal Loss Factor
(W/m2 K)
Mounted modules with air circulation29
Semi-integrated modules with air duct behind20
Integrated modules with fully insulated back15
Table 2. Control limits for Shewhart chart.
MeanStandard Deviations, σ
PPR ref 0.990.070.21
Publisher’s Note: MDPI stays neutral with regard to jurisdictional claims in published maps and institutional affiliations.

