Article

Improved Operation and Stability of a Wind-Hydro Microgrid by Means of a Li-Ion Battery Energy Storage

by
Rafael Sebastián
Department of Electrical, Electronic and Control Engineering (DIEEC), Universidad Nacional de Educación a Distancia (UNED), 28040 Madrid, Spain
Energies 2022, 15(23), 9230; https://doi.org/10.3390/en15239230
Submission received: 25 October 2022 / Revised: 2 December 2022 / Accepted: 2 December 2022 / Published: 6 December 2022

Abstract

:
This article presents an isolated microgrid which combines two renewable power generators: a Hydraulic-Turbine-Generator (HTG) and a Wind-Turbine-Generator (WTG) with a Li-ion battery-energy-storage (BES). Depending on the generator(s) which supply active power, the microgrid can operate in three modes: Hydro-Only (HO), Wind-Hydro (WH) and Wind-Only (WO). In WH mode, the HTG supplies the difference between the power demanded by the consumers and the power supplied by the WTG. This net demanded power can be negative when the WTG power is greater than the load and this situation can lead to a microgrid collapse. This article shows by means of simulations how the BES is controlled to consume the WTG power excess guaranteeing the microgrid stability. Additionally, when the negative net demanded load is persistent the microgrid must transition from WH mode to WO mode, where only the WTG supplies active power, and this WH-WO transition is also simulated. In the simulations in WO mode, the BES is controlled to regulate the microgrid frequency. The needed controls to command the BES in WH and WO modes and in the WH-WO transition are also explained. The simulations show the effectiveness of using the BES since the microgrid stability and reliability is improved.

1. Introduction

Isolated microgrids are microgrids (MG) located in remote places and that operate autonomously without connection to the main grid [1,2,3,4]. Isolated MGs have always a controllable generator such as a Diesel Generator (DG) and very often incorporate renewable power generators such as solar or wind ones. Short Term energy storage systems (ESS) based mainly in batteries, flywheels, or supercapacitors [5] may be also part of the isolated MGs. The controllable generator can supply the MG consumers alone when there is no availability of renewable sources or both controllable and renewable generators can supply jointly the MG consumers. Additionally, the controllable generator can act as backup generator in the case that the renewable generators with the support of ESS are the main MG power source. This article presents, models, and simulates an isolated MG which has two renewable power generators: a Hydraulic Turbine Generator (HTG) as the controllable generator and a Wind Turbine Generator (WTG).
Figure 1 shows the MG studied in this article. A hydraulic turbine (HT) drives a synchronous generator (SG) forming an HTG and a wind turbine (WT) drives an Induction Generator (IG) forming a WTG. In this article both generators are combined to form an isolated Wind-Hydro MG (WH-MG) to supply power to a community of remote consumers. The Figure 1 MG also includes a Li-ion Battery Energy Storage (BES). The BES has the aim of consuming the excess active power from the WTG and supplying power when an active power deficit exists in the MG.
In the WH-MG of Figure 1, the HTG is always running with the SG connected to the MG because the SG generates the MG voltage waveform and under the control of its voltage regulator, the SG supplies reactive power to keep the voltage amplitude in the predefined range. The following operation modes are available in the WH-MG: hydro only (HO) Wind-Hydro (WH) and Wind only (WO). In the HO mode the WTG is disconnected, and the HTG supplies all the demanded active power. In HO mode the HT speed governor performs the MG frequency regulation by controlling the flow rate Q incoming into the HT so that the HT produced mechanical power balances the consumed electrical active power. In the WH mode both HTG and WTG supply active power. Frequency regulation is performed also by the HT speed governor, however in WH mode the HTG must supply the difference between the demanded power by the consumers PL and the supplied power by the WTG PW or net active power demand (PLPW). The net power demand may become negative and then the BES must be ordered to consume power to absorb the WTG power excess and to guarantee a small positive power in the HTG, so that the MG can operate in that scenario. If the negative net power demand scenario is permanent, the MG must transition from the WH to the WO mode as the power generated by the WTG is enough to supply the consumer load. In the WO mode, only the WTG supplies active power, and the SG keeps connected to the MG to generate and regulate the MG voltage. The HT runner rotates jointly with the SG rotor, but in WO mode the flow rate Q incoming to the HT is null and therefore the HTG does not produce any power. In WO mode the frequency is regulated by using the BES. The BES is ordered to balance consumed and produced power to perform the frequency regulation. In WO mode, the BES consumes the WTG power excess when PW > PL and temporally supplies the power deficit when PW < PL.
Several past articles have dealt with the simulation of the different operation modes of a WH-MG. The operation of an isolated hydro-power plant is equivalent to the described HO mode. Ref. [6] shows the modeling and control of an isolated hydro-power plant which by means of AC/DC converter supplies a DC microgrid and therefore it deals with the HO mode. However, the present article deals with an AC microgrid, and no DC consumers are considered. Simulations in WH mode of a WH-MG can be seen in ref. [7]. Ref. [7] presents a WH-MG that does not use a controllable load such as a Dump Load (DL) nor an ESS. Ref. [7] concludes that the used constant speed WTG in the WH-MG adds damping to the frequency response in WH mode when it is compared to the MG response in the HO operation mode. However [7] does not consider in WH mode the negative net power demand scenario that it is studied in the present article. The operation in WO mode of a WH-MG is equivalent to an isolated wind power system. There are isolated wind power systems which include a DL to consume the excess power produced by WTG [8,9,10] while others include ESS for both storing WTG excess power and temporary supply power when the WTG does not produce enough power [11,12]. Ref. [11] uses a Ni-Cd battery-based ESS; Ref. [12] uses a low-speed flywheel-based ESS. This article uses a Li-ion BES to balance the active power of the WH-MG in WO mode.
The simulation of the transitions between operation modes in a WH-MG has been dealt partly in ref. [9]. Ref. [9] focus on the simulation and necessary controls to perform a quick transition from WO mode to WH mode in a WH-MG with a DL as a controllable load. HTGs are slow response generators [13], much slower than the DGs which are often used as a backup generator in MGs. During the whole WO to WH transition simulated in [9], the WTG power is not enough for the load demand and therefore there is a lack of active power that translates into a fall in the MG frequency. The longer is the time to arrive to the WH mode (where the HTG also supplies power) the bigger is the frequency falling. If the MG frequency reaches the minimum allowable value, the load supply must be disrupted and the MG collapses. Unlike ref. [9], in the present article a BES is used, so the MG active power excess is stored instead of wasted in a DL as in [9]. Additionally, the BES also allows to supply power temporally, what increases the MG operability when compared with [9] as it will be shown in the simulations section. Moreover, this article focusses on the simulation and necessary controls to perform a WH to WO transition, which is the reverse transition of the one simulated in [9].
The isolated power system of the Hierro island in the Canary archipelago includes HTGs, variable speed WTGs, DGs and a Pumping Station [14]. The Pumping station consists of several pumps both constant speed and variable speed types. Refs [15,16] simulate the Hierro island power system in the off-diesel mode. Ref. [15] shows in WO mode the frequency regulation by using the fixed and variable speed pumps. Ref [16] shows several frequency regulation schemes, one of which includes a flywheel ESS. This article also deals with the WO mode but uses a BES to perform the frequency regulation in WO mode and to increase the operability and stability of the WH-MG. Pumped storage is also included in the isolated MG of ref. [17] which includes a DG, WTG, photovoltaic generator, and a BES. Ref. [17] shows several MG simulations cases where a combined BES + pumped storage supports the MG frequency regulation. The used models in refs. [15,16,17] do not consider the modeling of the MG electrical machines, so that no voltage waveforms are shown. In the present article the electric machines models are included, and MG voltage graphs are shown.
This article deals with dynamic simulation of the WH-MG of Figure 1. Other studies deal with logistic simulations of WH-MG to calculate system efficiency [18] or perform economic and environmental impact studies [19].
The main contribution of this article is to show the power control of the BES in the different operation modes of the presented WH-MG by means of simulations. Firstly, it is studied and after simulated the case in WH mode where the WTG active power exceeds the load demanded power and therefore the HTG gets into reverse power. In this scenario with no additional controllable loads or ESS, the MG frequency increases without control, so finally the MG collapses. It will be shown that by controlling the BES consumed power so that a small positive power is needed on the HTG to balance active powers, the MG operation turns into stable. Second, from the previous negative net active power scenario it will be shown the MG transition from WH to WO, since the WTG produced power is enough for the MG operation. Finally, during the WH to WO transition and in the WO mode, which is also simulated, it will be shown how the control of the BES power performs the MG frequency regulation.
In summary, the main objectives of this article are the following:
  • To develop a detailed dynamic model of the presented WH-MG along with the Li-ion BES.
  • To size the Li-ion battery bank for the considered WH-MG.
  • To design controllers to control the BES active power in WH and WO modes
  • To test the performance of the modeled MG and designed controls through several simulation cases
  • To show that the Li-ion BES increases the stability and operability of the presented WH-MG
After this introduction, the article has the following sections: Section 2 presents the HTG, WTG and BES modelling. In addition, Section 2.5 presents the sizing of Li-ion battery. Section 3 presents the needed controls to avoid in WH mode the reverse power scenario, to transition from WH to WO and to perform the frequency regulation in WO mode. Section 4 presents the WH-MG simulations and finally Section 5 concludes by highlighting the main contributions of the article.

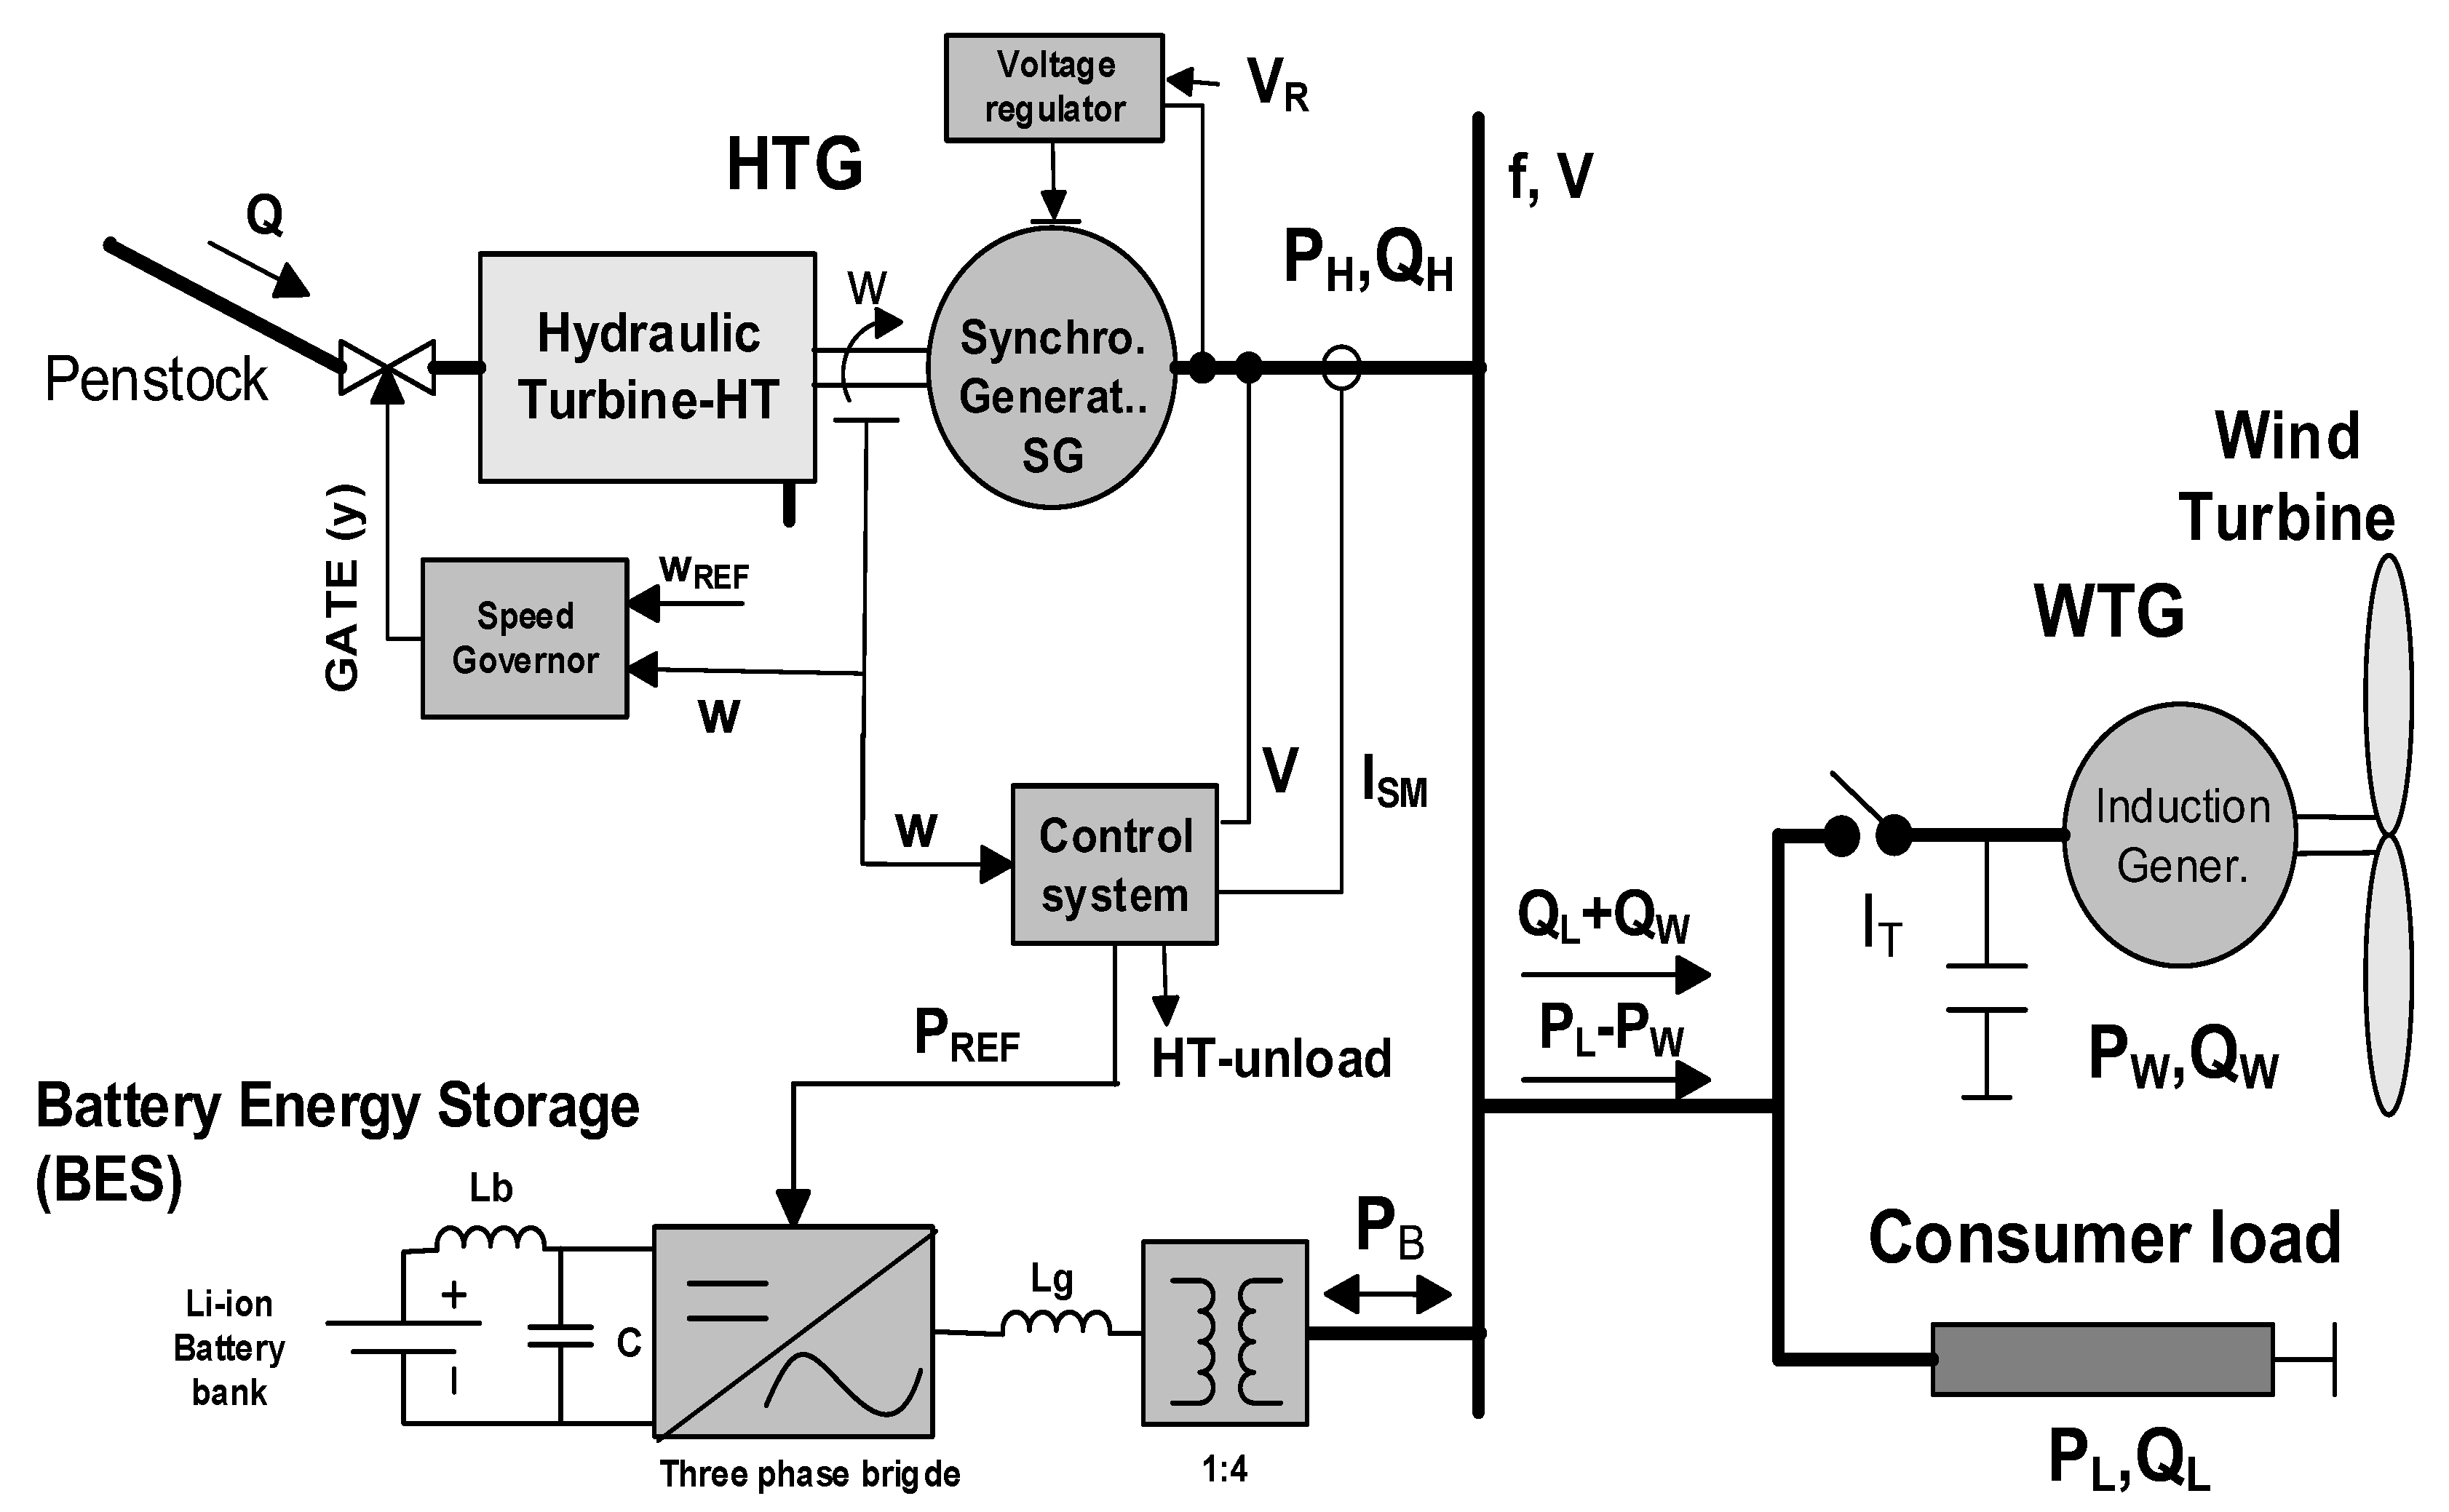
2. The Wind-Hydro Microgrid (WH-MG) Modeling

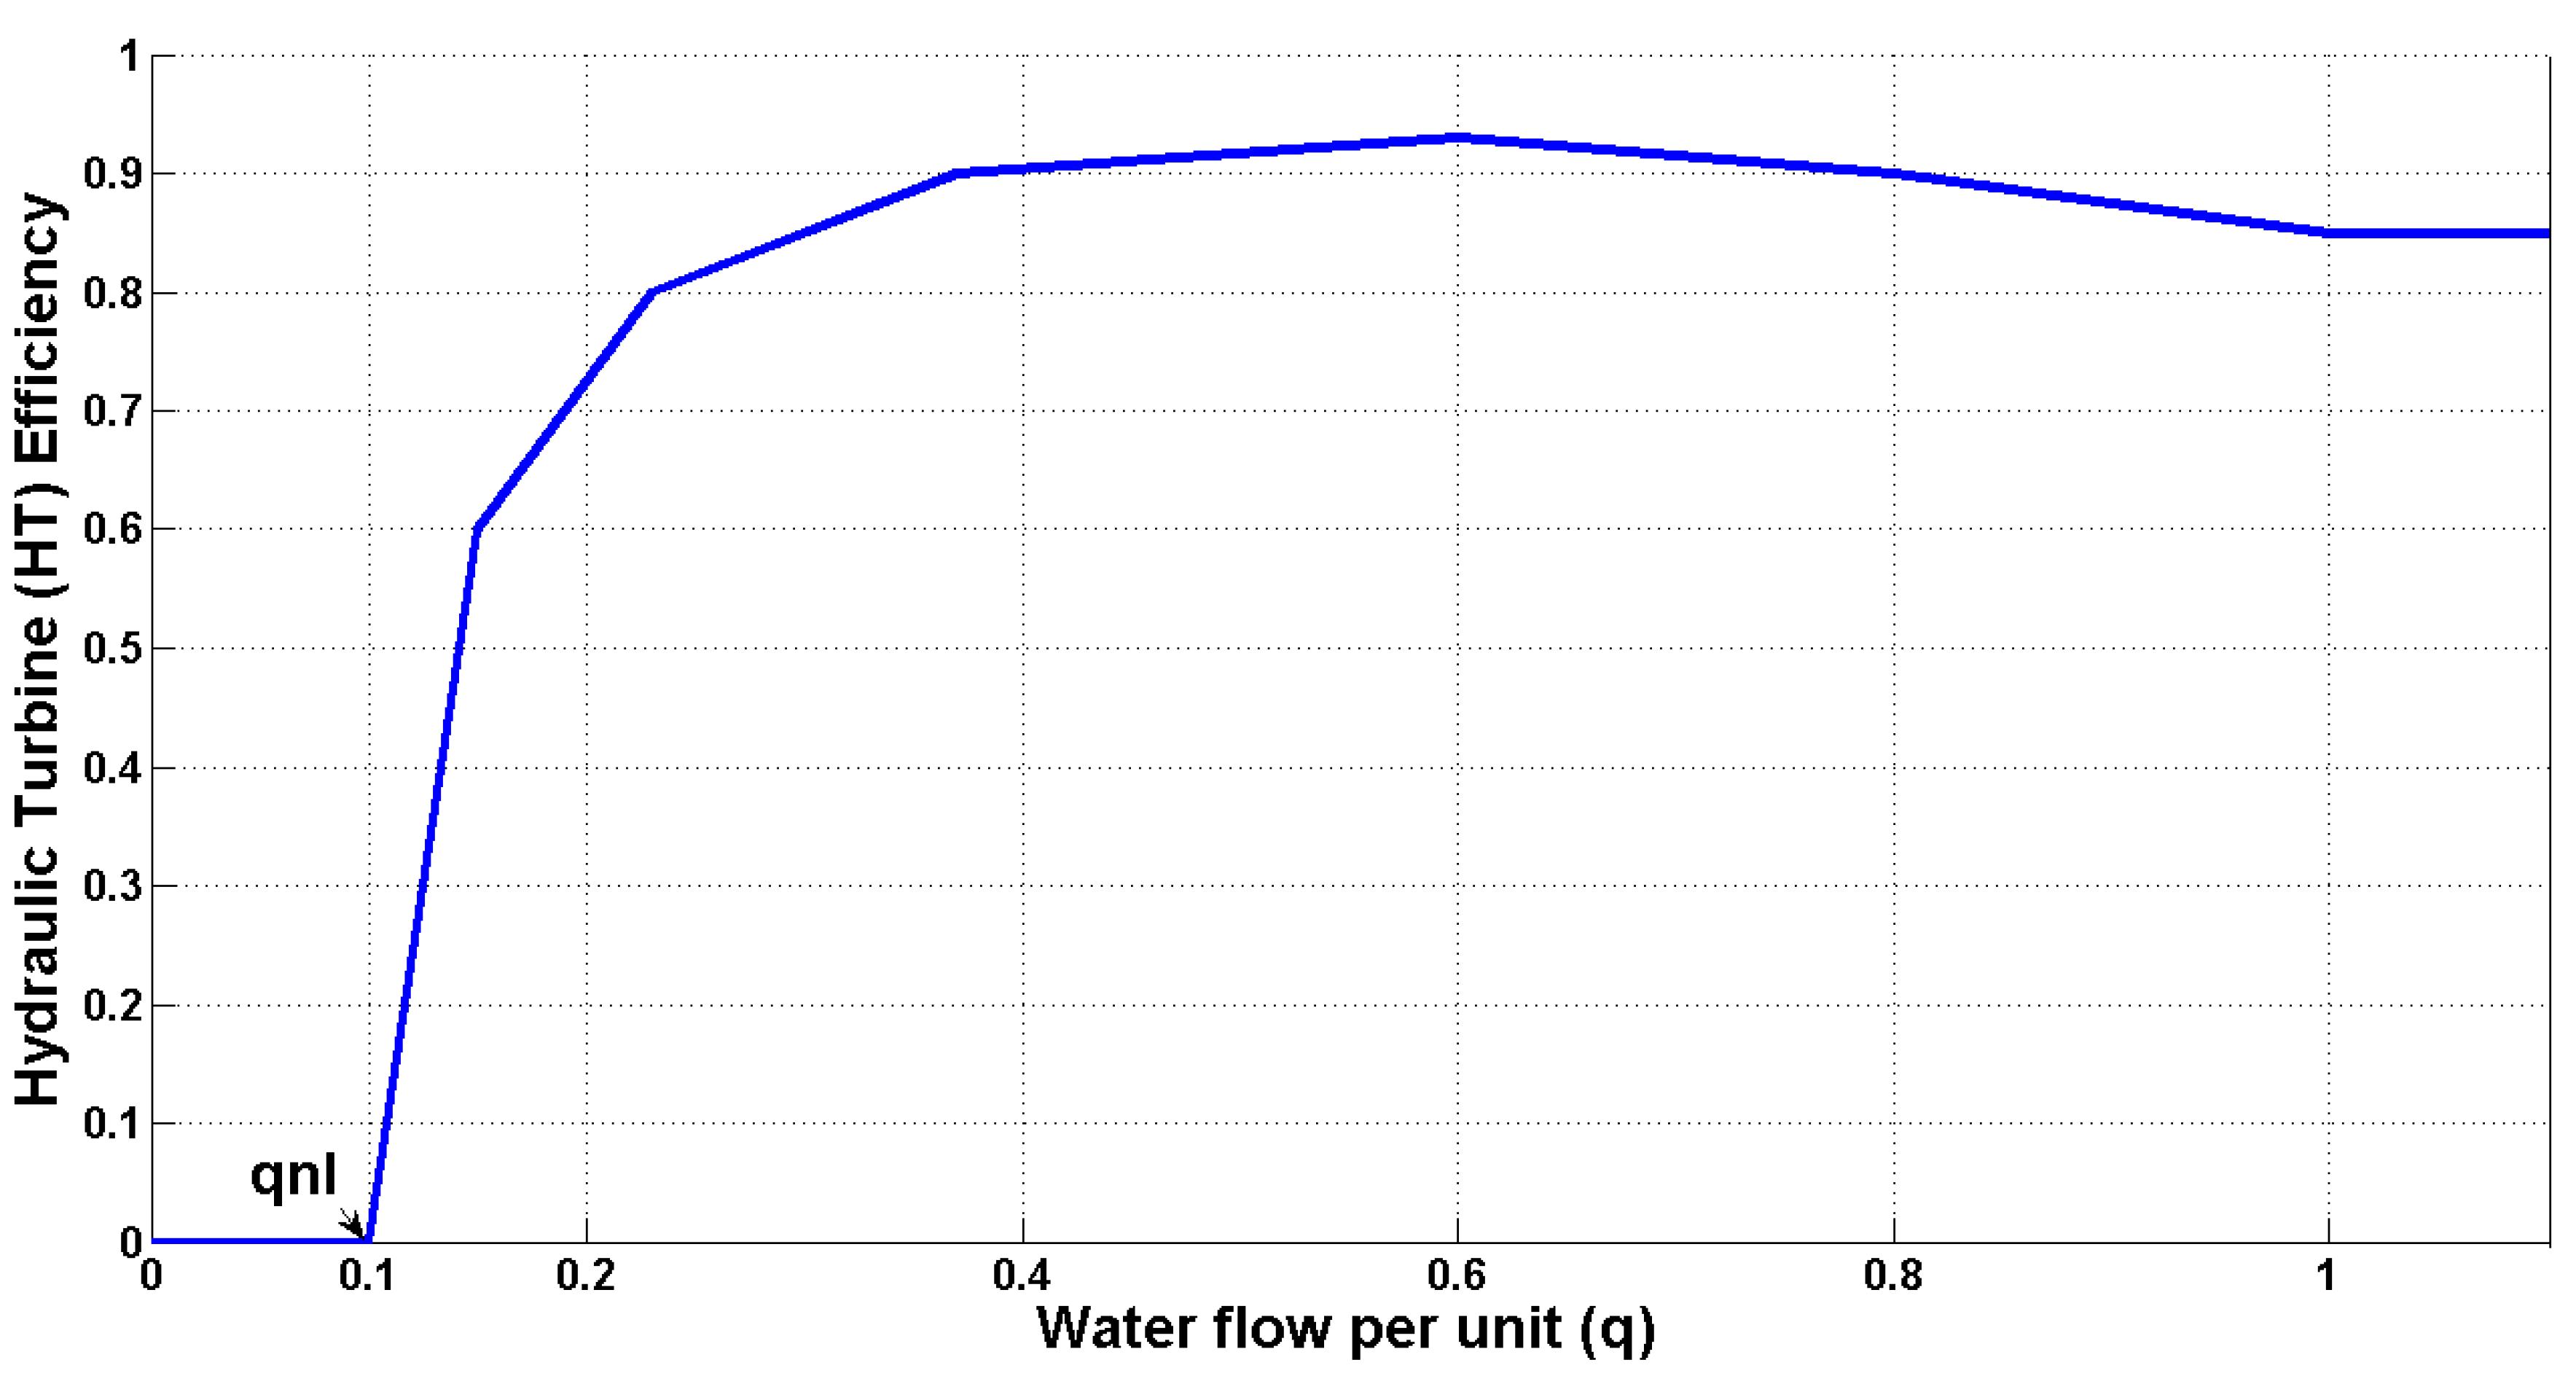
2.1. The Hydraulic Turbine (HT) Modelling

The HT converts the kinetic energy of the falling water into mechanical power in its shaft. The HT mechanical power Ph−mec is controlled by regulating the flow rate Q passing through the HT by the Figure 1 valve. The valve variable y defines the opening of this valve from the fully closed (y = 0) to the fully open (y = 1) positions. The penstock is the pressure pipe where the water flows from the dam to the HT admission. In big power system studies is usual to represent the penstock-HT system with the following linearized model around the operating point defined by the valve opening position y0 [20]:
Δ p h m e c Δ y = A t 1 y 0 T W s 1 + y 0 T W s 2  
where Δphmec is the change in the HT mechanical power in per unit (pu) and Δy is the change in the gate opening, with respect to their values in the operating point (p0, y0). In Equation (1) At is a constant that depends on the HT rated mechanical power and SG rated apparent power [20] and TW is the water starting time constant further defined.
In the WH-MG presented here, the operation range of the HT varies from y = 0 which corresponds to its value in the WO mode to its maximum value 1 that can be reached in HO mode, and therefore it is not possible to use the lineal model of Equation (1) around a fixed operating point. The used non-linear HT model is based on the following equations where all the variables are in pu values [7,20]:
q = y h
p h m e c = A t η q h K D y ( ω 1 )  
Equation (2) is the valve equation, y is the valve opening position previously mentioned; h = H/Hbase, where h-H is the pressure head at the HT admission in pu and m respectively, and Hbase (m) is the total static head above the HT admission; q = Q/Qbase, q-Q is the flow rate through the HT in pu and m3/s respectively and Qbase (m3/s) is the HT flow rate with the valve fully open and H = Hbase
Equation (3) calculates the HT produced mechanical power phmec. It has 2 terms: the first one is the mechanical power pu that the HT produces when the flow rate q with a pressure head h passes through the HT, being η the HT hydraulic efficiency and At is the constant previously defined. The second term considers the damping that appears when the HT shaft speed pu ω is not rated (1 pu), being KD the torque damping factor.
To model the penstock, it is supposed that the water is incompressible, the pipe is rigid, and traveling pressure waves are not considered. In this case the penstock equation is [7,20]:
d q d t = 1 T W ( 1 h h f )  
where hf is head loss pu due to friction losses in the penstock and TW (s) is the penstock water starting time constant previously commented, defined as:
T W = L A g Q b a s e H b a s e  
where A (m2) and L (m) are the penstock area and length respectively and g is the gravity acceleration.
In this article a Pelton type HT is used. The Pelton type HT efficiency η curve vs. the flow rate pu q [21] is shown in Figure 2. The efficiency is null with flow rate below the no load flow rate qnl (0.1 pu in Figure 2). Above qnl the efficiency rises, reaching 0.7 for q = 0.2 y being greater than 0.7 for q > 0.2. This performance curve is the most suitable among the different existing HT types (Pelton, Francis, Kaplan) to operate in WH mode as the HT power range and flow rates are usually low in the WH mode since the HT supplies the net active power. Therefore, the good efficiency in the low flow rate range of the Pelton type HT improves the MG overall efficiency.

2.2. The Synchronous Generator (SG) Modelling

The SG converts the HT mechanical power output to electric power for the MG. In addition, the SG generates the MG sinusoidal voltage waveform of frequency f and amplitude V and therefore the SG connection circuit breaker must be permanently closed. The SG voltage regulator orders the SG to compensate the MG reactive power to keep the MG voltage amplitude V in its allowable range around the rated value. The isolated MG frequency f (60 Hz rated) is set by the HT-SG rotation speed n (rpm) by the relation n = 60 f/p with p the SG number of pole pairs. With p= 16 in the used SG, the HT-SG rated speed is 225 rpm. The Simulink Simscape Electric library [22] provides the sixth order SG model and IEEE type 1 voltage regulator used for the SG modelling. The SG rated apparent power is 300 kVA.

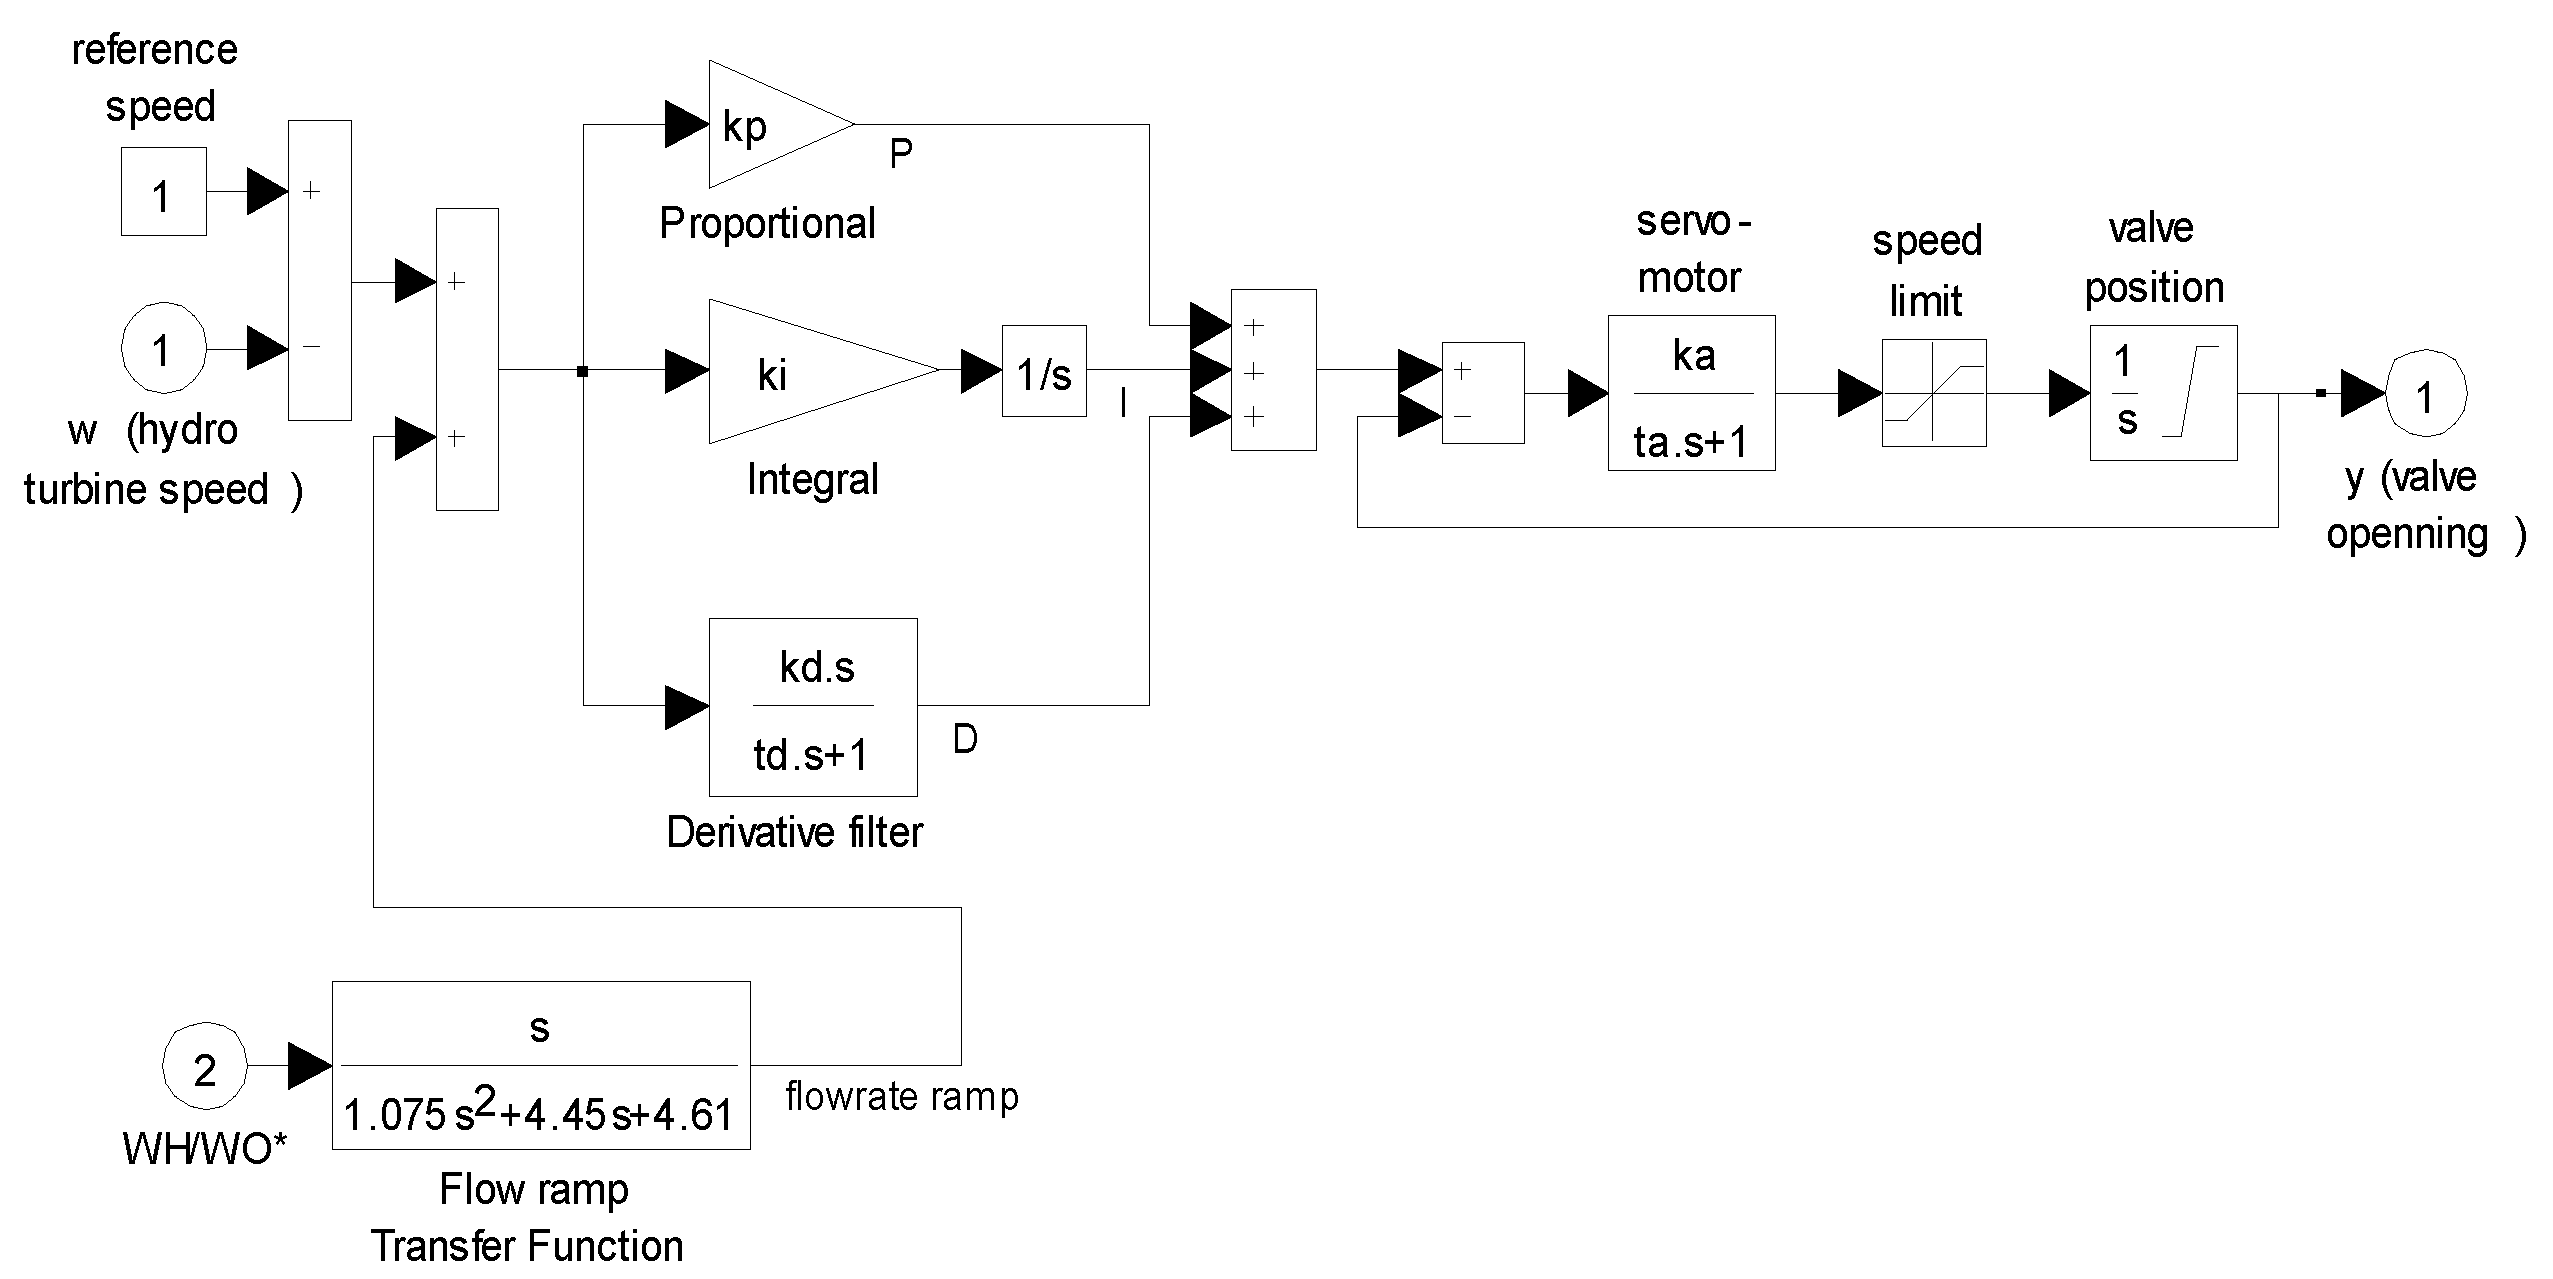
2.3. The Hydraulic Turbine Speed Governor Modelling

The rotating speed of the HT-SG and therefore the MG frequency is regulated by the HT speed governor whose Simulink block diagram is shown in Figure 3. This speed governor controls the flow rate incoming in the HT by varying the input valve position (y variable) through the servo motor of Figure 3 and this flow rate variation translates into HT mechanic power variation according to Equation (3). Not considering the BES, the MG frequency (f)/HTG speed (ω) (rad/s) is related with the active powers of the HTG (PH), WTG (PW) and load (PL) by the following equation:
P H + P W P L = J ω d ω d t    
in Equation (6), the generators powers are positive if produced and the load power is positive if consumed, J is the moment of inertia of the HTG and the system losses are not considered. In equilibrium (/dt = 0) the speed governor adjusts the flow rate into the HT and therefore the HT produced power to the net demanded power (PH = PLPW). The above speed regulation is not possible if the net demanded power PLPW is negative (HTG reverse power) nor above the maximum HT power (slightly higher than the HT rated power) (overload) [11]. As seen in Figure 3, the servomotor input is the PID regulator output. The servomotor moves the flow rate input valve converting the low power PID output into input valve position (y variable). The servo speed, which is the speed of the valve position, is limited to ±0.1 pu to avoid big pressure transients and water hammer [23]. This valve speed limitations impose harsh restrictions to any kind of speed regulator used in the speed governor. The PID main input is the HT speed error (reference speed- HT current speed). The PID regulator keeps the MG frequency constant (works in isochronous mode) provided that the power limitations (0-HT maximum power) are fulfilled. Other MGs work in droop speed mode, regulation frequency mode that improves the MG stability, but that needs a secondary control to restore the MG frequency to rated value. The PID proportional (Kp), integral (Ki) and derivative (Kd) parameters are calculated according to ref. [20]:
K p = 1.6 H / T W  
K i = 0.48 K p / ( 3.33 T W )  
K d = 0.54 H    
In Equations (7)–(9) H is the HTG inertia constant and TW is the constant defined in Equation (5), so the PID parameters in Equations (7)–(9) are closely related to the system hydromechanical parameters. Ref. [24] gives values for H for HTGs between 2–3 s. As the used HTG is low power, H = 2 s is selected. As it is supposed that the penstock is short, TW = 1 s is selected. With these selected values of H and TW, the PID parameters have been calculated.
Finally, the “Flow ramp transfer function” of Figure 3 produces positive/negative impulses when the MG transitions from WO->WH/WH->WO respectively. This transfer function output is added to the HTG speed error to be the input of the PID regulator. Its action for the present article is described in Section 3.

2.4. The Wind Turbine Generator (WTG) Modelling

The WTG consist of a fixed pitch WT which drives through a gearbox a squirrel cage IG with its stator directly connected to the MG. The WT converts wind power in mechanical power at its shaft and the IG converts this mechanical power to electrical power to feed the MG. This type of WTG is called constant speed WTG type since its rotating speed range operating as a generator is between 1–1.02 the IG synchronous speed [25]. As the WT has fixed pitch and the WT speed variability is very small, its produced power depends mainly on the cube of wind speed [26]. Therefore, the WT produced mechanical power follows the wind speed, and the WTG generated electrical power is uncontrolled. However, this WTG type is quite robust and requires little maintenance, which are desired features in remote places. The WT model is based on ref. [27] and uses a lookup table to output the WT produced mechanical power for a given wind speed and WT rotating speed. The Simulink Simscape Electrical library [22] provides for the fourth IG model and the power factor capacitor bank which compensates the IG reactive power consumption. The IG rated power is 275 kW. Ref. [28] gives values for WTG inertia constant HW from 2 to 6 s and HW = 2 s is selected as the used WTG is low power.

2.5. The Li-Ion Battery Energy Storage (BES) Modelling

The BES is used in the WH-MG as a controllable load in WH and WO modes to consume the WTG active power excess. Additionally, the BES is temporarily used as a controllable source in WO mode. The consumed/produced electrical power by the BES follows the reference power PREF generated by the control explained in the next section. The BES of Figure 1 consists of a Li-ion battery bank, a 150 kW IGBT three-phase full-bridge power electronic converter and a 150 kVA step-up transformer whose secondary winding is connected to the MG.
The Lithium-ion (Li-ion) battery type was chosen because it is superior in many features when compared with the most used battery types (Lead Acid, Nickel-Cadmium and Nickel-Metal-Hydride), so Li-ion batteries are replacing previous applications of lead and Ni-Cd batteries. Li-ion batteries have high specific energy (wh/Kg). The Li-ion voltage cell is high: 3.2/3.6/3.7 V for the Phosphate/Cobalt/Manganese Li-on battery subtypes [29], which allows to reduce the number of cells in series to achieve the desired rated voltage. The Li-ion battery charging and discharging currents are very high allowing high power when the BES is used as a temporary load/supplier as the case of the present article. Additionally, the Li-ion battery cycle life is high, needs low maintenance and the toxicity of its materials is low. As drawbacks Li-ion batteries need a protection circuit due to safety reasons. In addition, Li-ion batteries have high cost, but its price is decreasing year after year [30] and if cost-per-cycle is considered, Li-ion may have lower cost-per-cycle than lead acid [29].
The Li-ion battery works as the DC-link of the full-bridge converter which performs the DC/AC conversion to connect the battery to the transformer primary winding. The presented solution uses a step-up transformer to increase the converter 120 VAC output to the 480 VAC MG rated voltage (both phase to phase voltages). Additionally, the transformer provides galvanic isolation between the battery bank- converter and the MG. This BES architecture has been used in [31,32]. Other BES architectures use a DC/DC boost converter that increases the battery voltage up to the needed DC input voltage in the DC/AC converter and the DC/AC converter is directly connected to the grid [33], so no isolation between the battery and the grid exists in this case.
The BES can supply/absorb power to/from the grid by discharging/charging the battery when the bidirectional full-bridge converter works as an inverter/rectifier. The converter uses voltage-oriented control (VOC), as VOC decouples the control of the active and reactive power exchanged by the converter. The VOC employs a rotating dq-coordinate framework where the d axis is aligned with the MG voltage vector E. A phase locked loop (PLL) block synchronizes the dq-framework with the MG voltage vector E. If Ed is the grid voltage direct component (Ed = E if orientation is perfect), the direct id and quadrature iq currents required to exchange the active p and reactive q reference powers are calculated with the following equations:
q = 3 2 E d i q   ;     p = 3 2 E d i d    
where the 3/2 constant considers the 2–3 axes scaling and losses are not considered. As seen in Equation (10) the direct current id in phase with the MG voltage E controls the active power and the quadrature current iq at 90° degrees with E controls the reactive power. Figure 4 shows the VOC control of the three-phase converter. The inner loops correspond to the id (4.a) and iq (4.b) currents and the outer loops correspond to the active p (4.a) and reactive q (4.b) powers. The dq-current controllers are proportional-integral (PI) with controller parameters KP = 1 and KI = 200. The active and reactive powers are Integral (I) to remove steady state errors and with the active and reactive current references idref and iqref respectively being feed-forwarded for fast dynamic response.
To minimize converter sizing the power factor of the converter is 1, so its reactive power reference is null (qref = 0), but BES can also be used to support voltage regulation [34]. The converter IGBTs switching frequency is 5 kHz. The BES grid side inductance filter Lg reduces the harmonic content of the converter grid current.
Ref. [31] uses a DC/AC converter with the same rated values that the one used in this article. Ref. [31] establishes that a battery voltage of 240 V fulfills the rated power and AC voltage (150 kW/120 VAC) constraints of the DC/AC converter and therefore the used Li-ion battery bank has a standard 240 V rated voltage (240.5/3.7 V = 65 Li-ion cells in series). The Li-on battery voltage will be greater than 240 V provided that the Li-ion battery works above of its 20% state of charge (SOC) [35] which is the low limit of the battery nominal zone and the Li-ion battery voltage variations in the SOC nominal zone (100–20%) are assumed by the DC/AC converter. The Li-ion battery electrical model consists of a no-load DC variable voltage source in series with a constant resistance [35]. The voltage source [35] follows the Volts-SOC (state of charge) battery nominal discharge curve. For the sizing of the Li-ion battery, the sizing of ref. [11] that deals with the near field of Wind Diesel isolated MGs is followed. In ref. [11], an optimum storage time of 15 min the average MG load is used to reduce the start-stop cycles of DGs. In the solution presented here, the HTG is permanently connected to the MG and running close to the rated speed, so the start-stop time of the HT is related to the length of the transitions from WO to WH for HT starting and from WH to WO for HT stopping. Ref. [9] establishes for the time length for a complete WO to WH transition in a no-storage WH-MG around 30 s. These 30 s are like the time a DG needs to start, reach rated conditions, synchronize with the MG voltage, connect to the MG, and supply the demanded power. Therefore, considering the similarity between both types of MGs, it is selected 15 min the maximum storage time that the BES can supply the converter rated power 150 kW. The maximum number of discharging cycles of a battery decrease with the deep of discharge [36], so the minimum allowed SOC for the Li-ion battery is 25%. Charging the Li-ion battery with the higher voltages that require a 100% SOC also reduces the battery life [37], so the maximum battery SOC is fixed at 85%. Additionally, ref. [38] shows that this 25–85% SOC selected range is the most suitable in terms of battery life and battery energy utilization when compared with other ranges. Moreover, this 25–85% battery SOC range belongs to the Li-ion battery discharge curve nominal zone [35], where the battery voltage decreases slowly as SOC decreases and this voltage variations can be assumed by the DC/AC converter. With the utilization of the 60% of the Li-ion battery capacity, and the BES sizing of supplying 150 kW during 15 min previously established, the maximum battery stored energy is 62.5 kWh (150 kW·15 min/(0.6·60 min/h) = 62.5 kWh) or a battery capacity of 62.5 kWh/240 V = 260.41 Ah. In Figure 1 the battery side LC filter limits the ripple in the battery current caused by the converter.

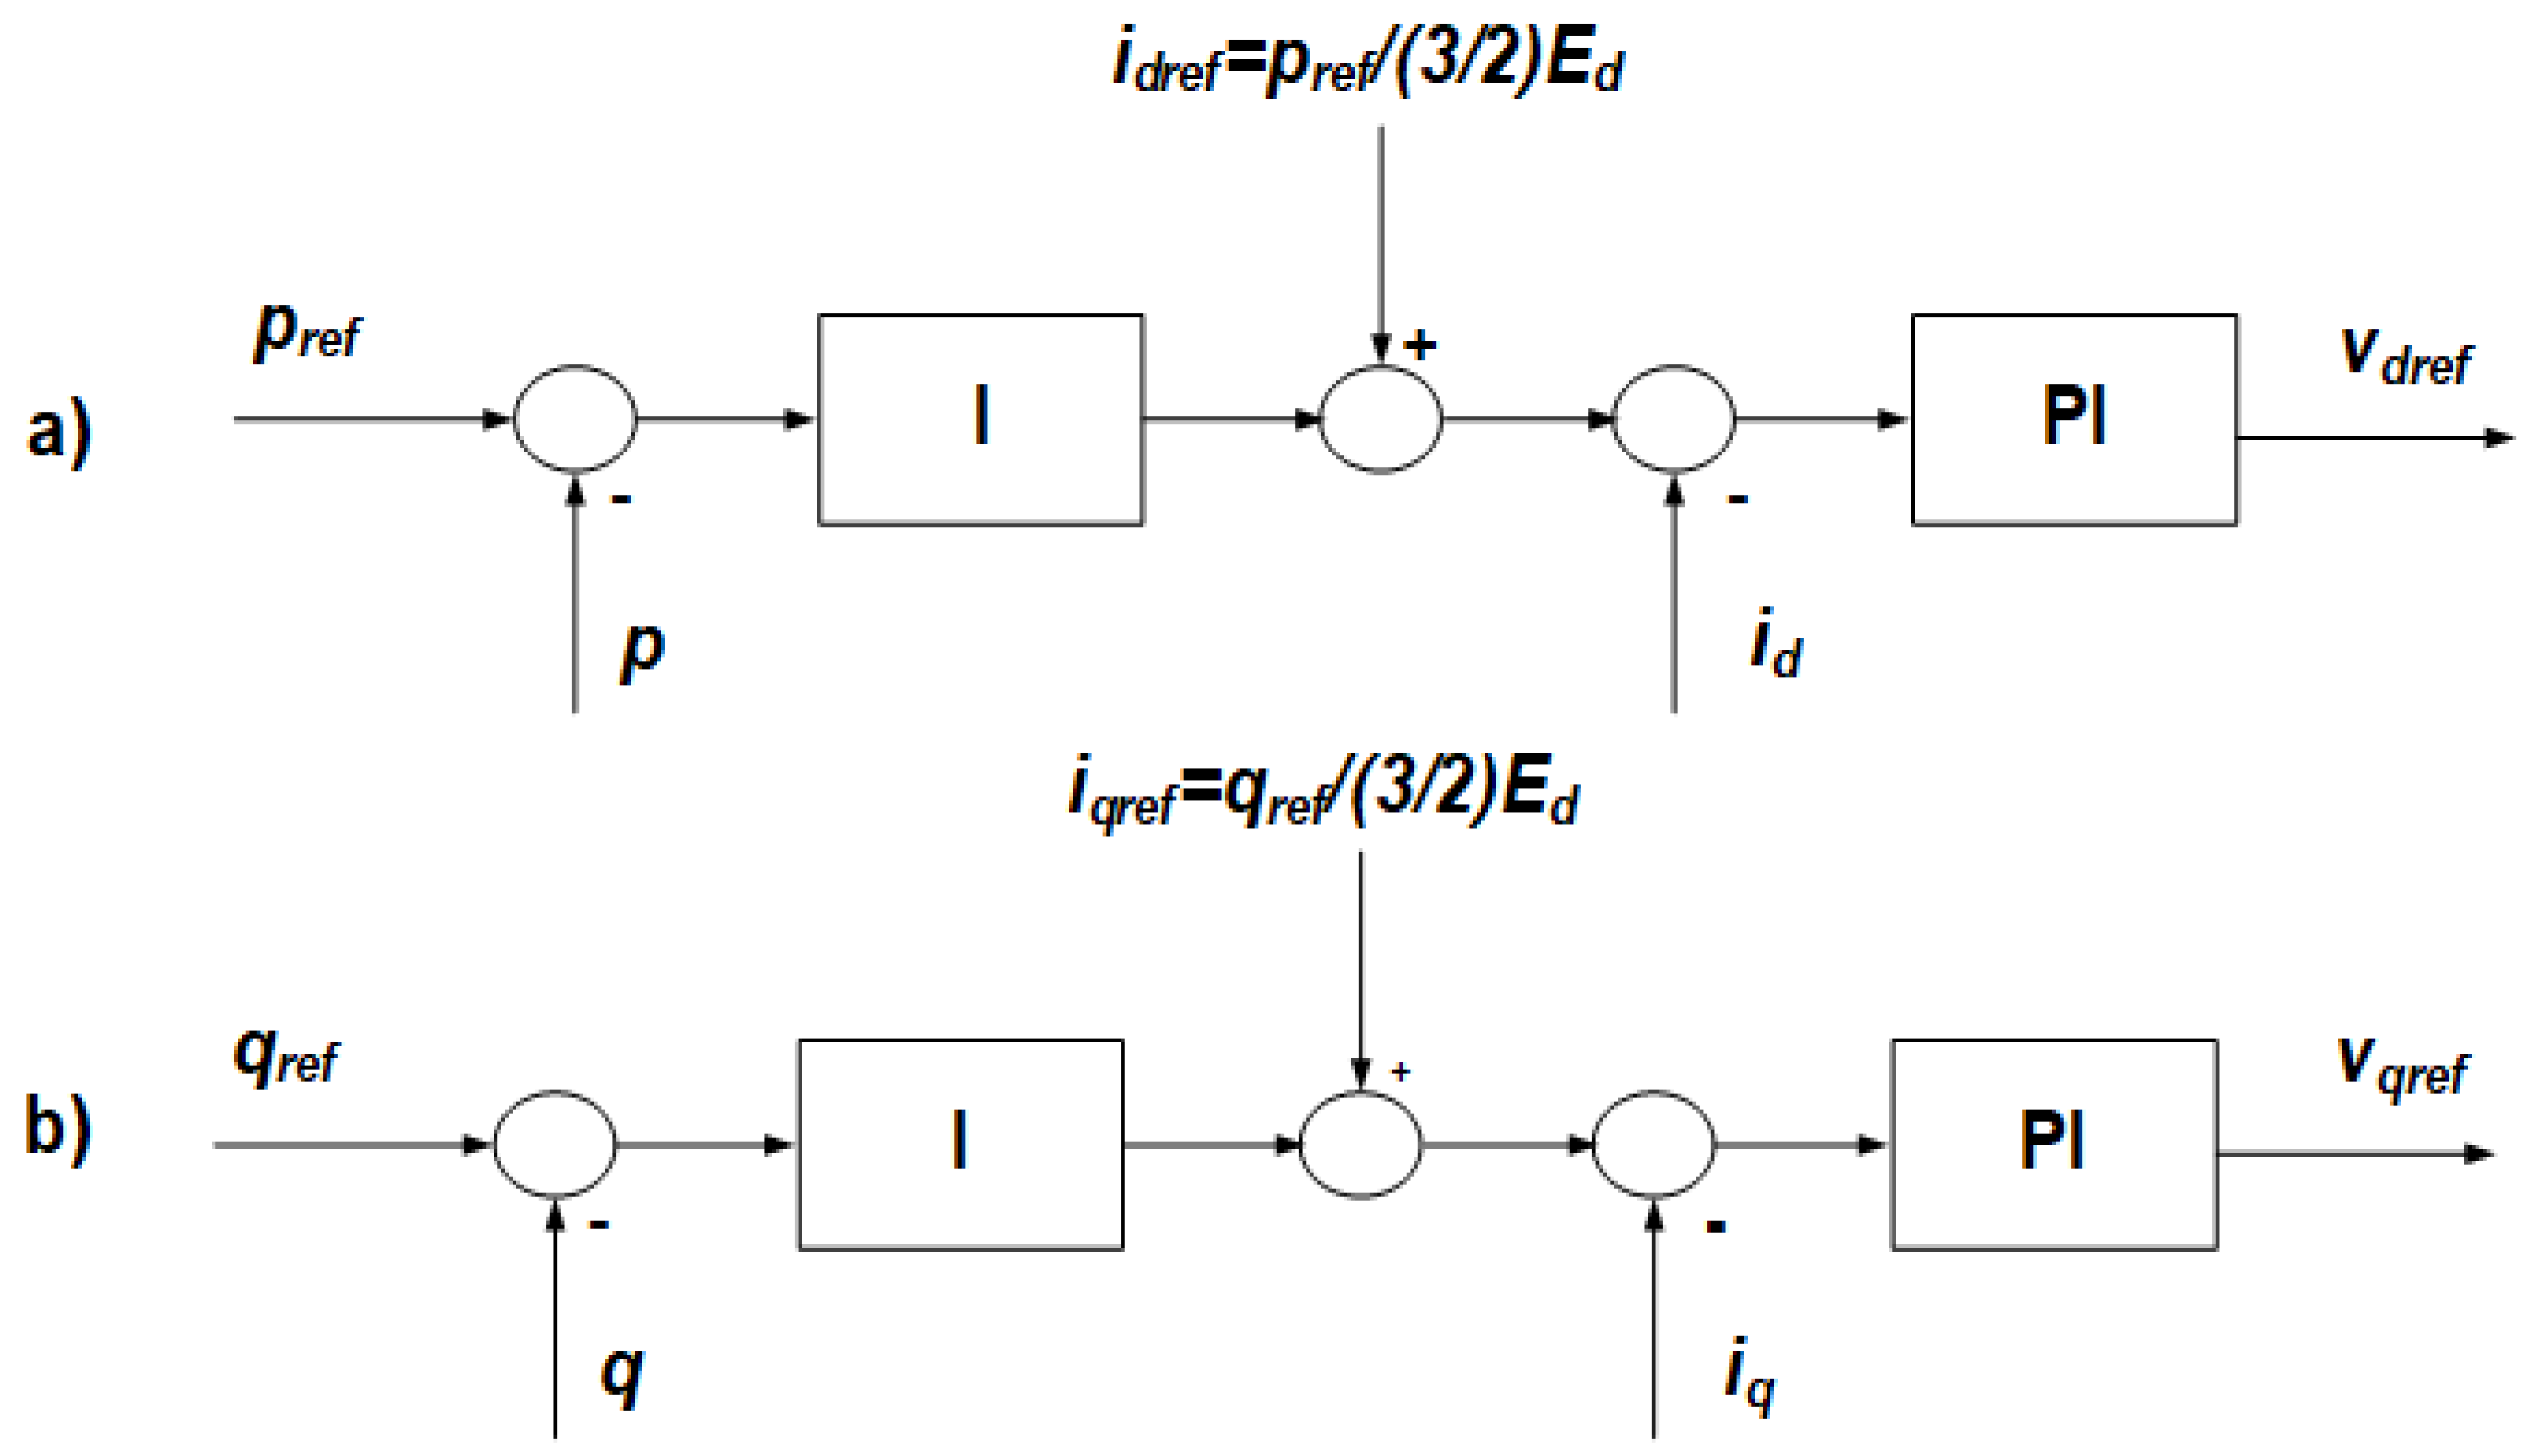
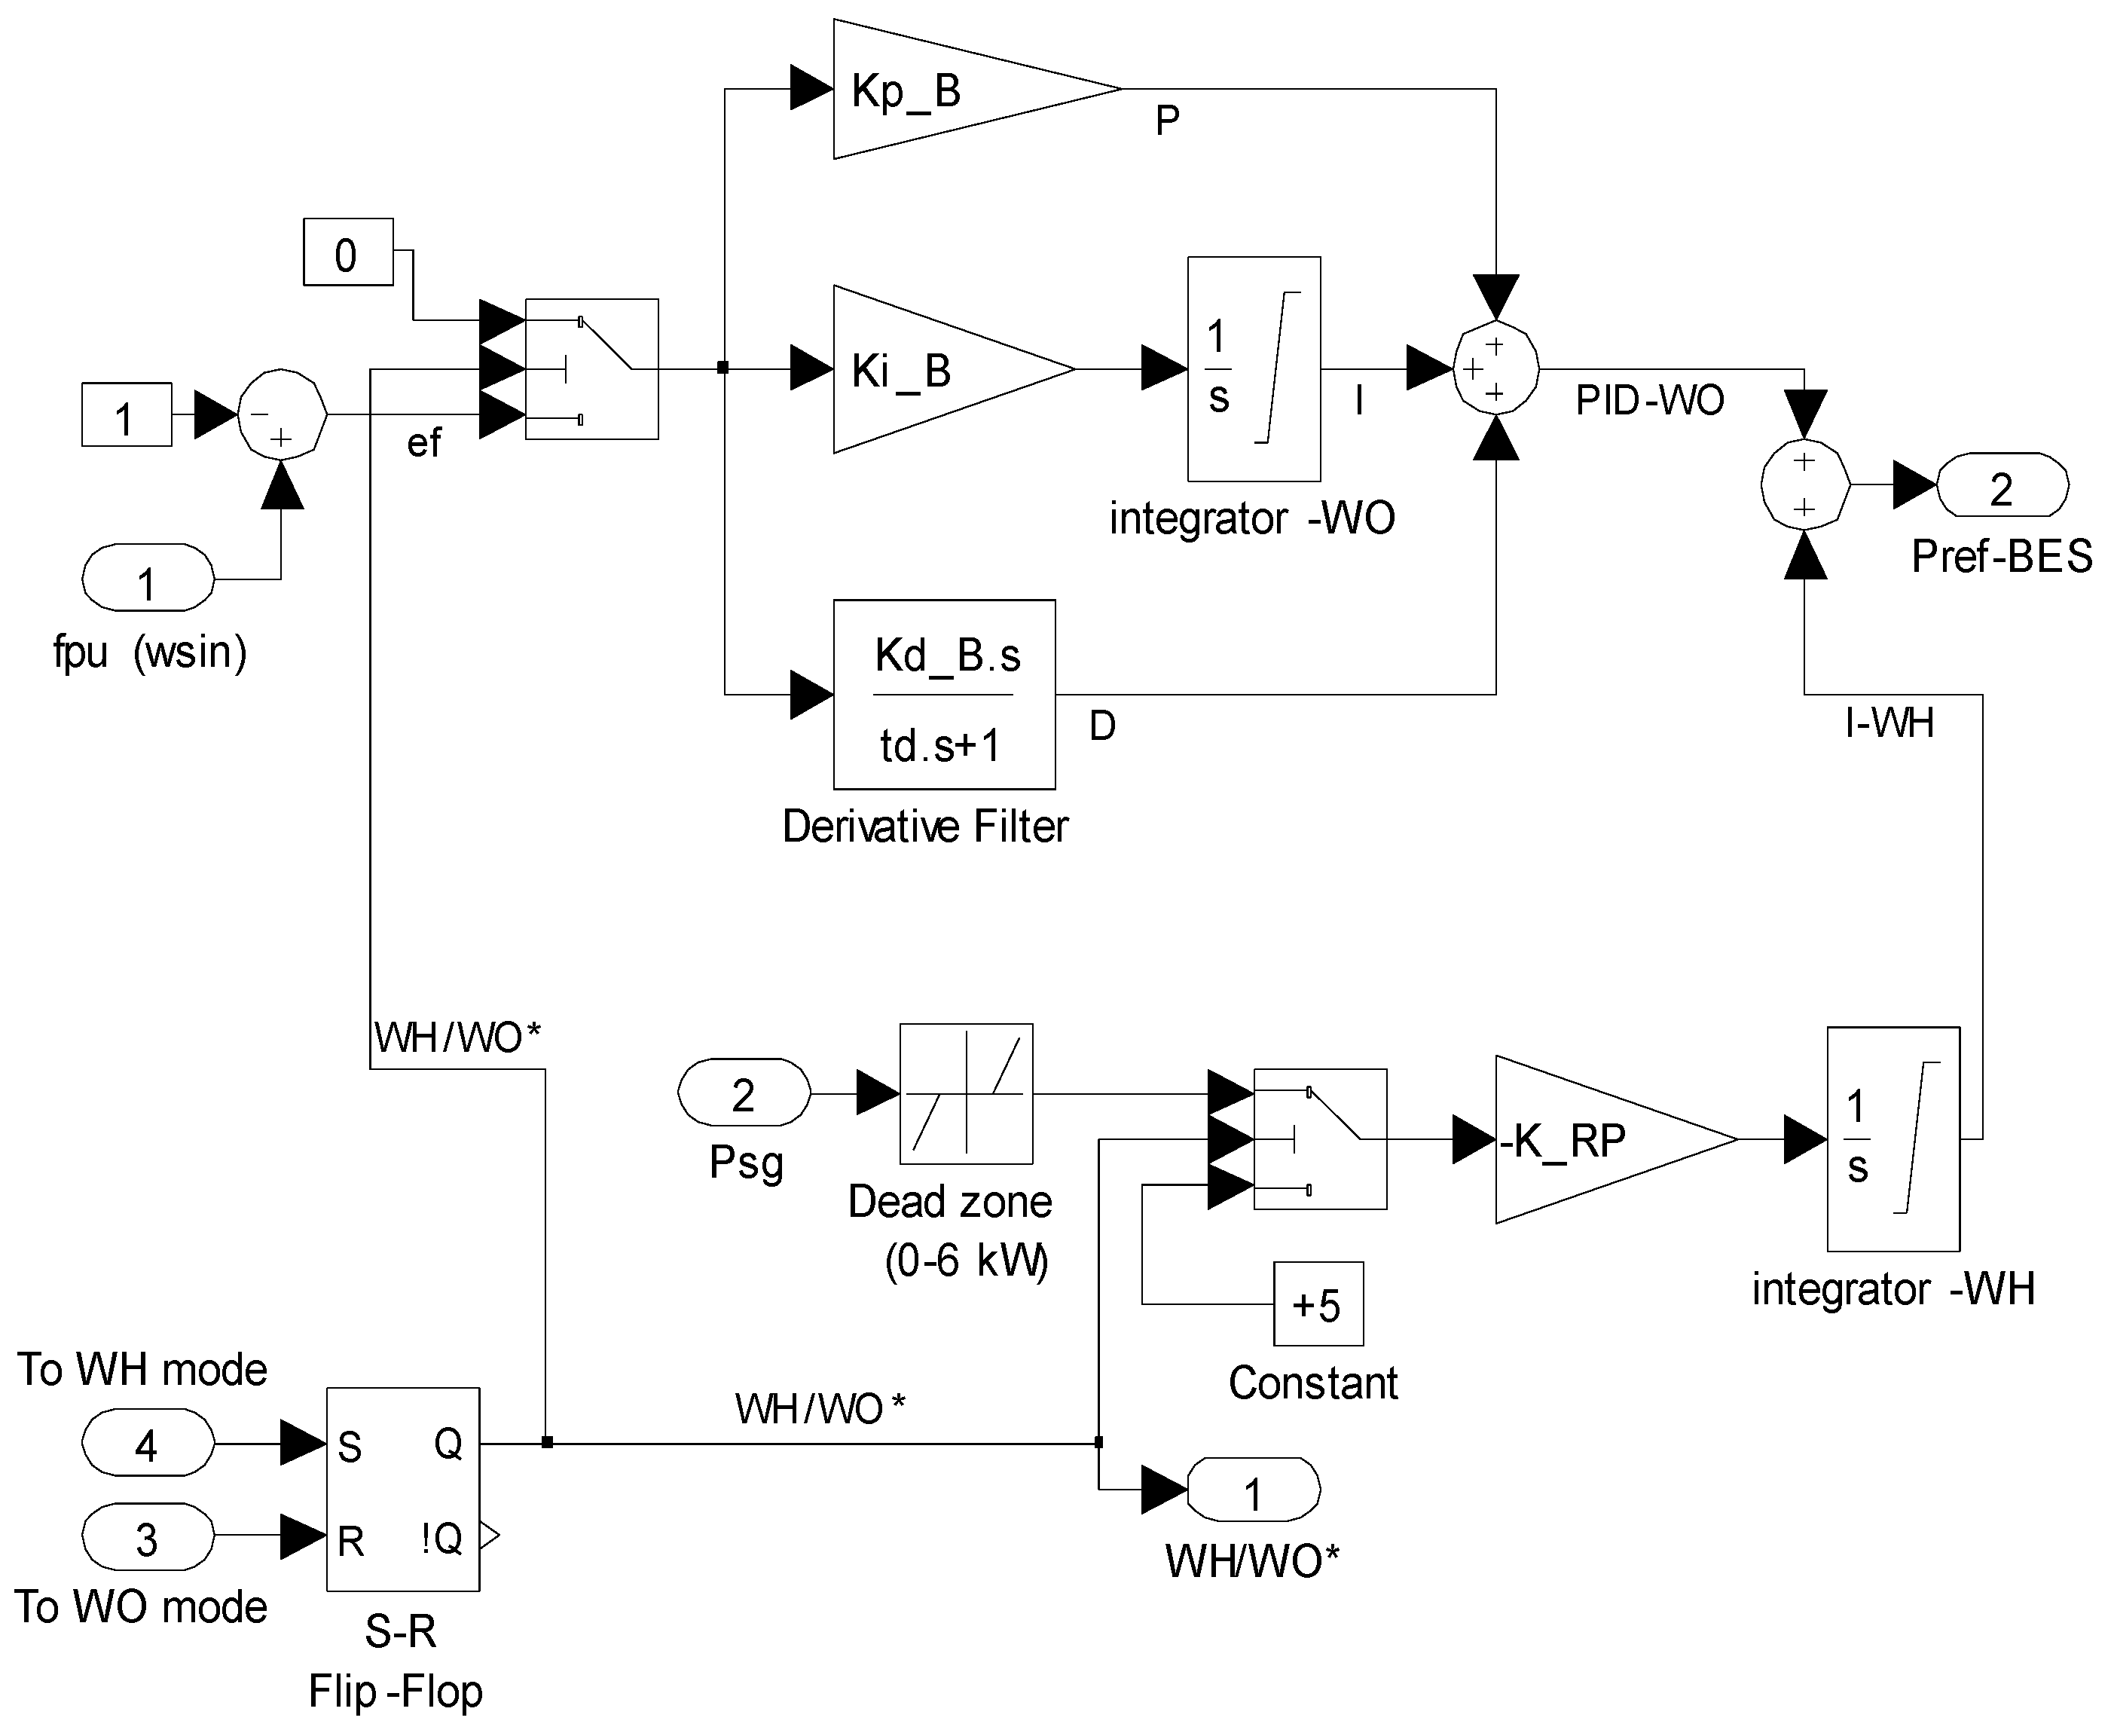
3. The Control of the BES Consumed/Supplied Power

As commented before the HT speed governor can control MG frequency only if the HTG must supply positive power and this constraint is not met when the WTG power exceeds load power in WH mode (PLPW < 0, negative net active power).
As Figure 2 shows, with flow rate less than 0.1 pu (qnl), the HT efficiency is null and therefore the HT produced mechanical power is null. With the input valve closed and flow rate null, the HT consumes power due to mechanical losses, but these losses depend on the rotation speed and are no controllable. Therefore, in the negative net active power scenario and without additional controllable loads as in the case of Equation (6), the left side of this equation is positive and since J and ω are positive magnitudes, dω/dt must be positive and this means a constant increase of the MG frequency as it is shown in the following simulations section.
Therefore, when a negative net active power in WH mode exists, the BES power control must order the BES to consume power PB, so that the net active power in this case PL + PBPW is positive and therefore a positive power is required from the HTG to balance MG active powers, allowing the HT speed governor to perform the MG frequency regulation. The BES consumed power in WH mode is controlled by the integral actuation (-K_RP gain and integrator blocks) along with the 0–6 kW dead zone block whose input is the SG electrical power PSG shown in the lower part of Figure 5. When PSG < 0 the BES consumed power (I-WH in Figure 5) is ordered to increase with the BES rated power as high limit and when PSG > 6 kW (2% of PSG-NOM) the BES consumed power is ordered to decrease with a 0-low limit. In the range 0 < PSG < 6 kW the BES consumed power is not changed, since the dead zone block output is zero. This WH mode integral control makes that the HTG power in steady state remains in the positive range 0–6 kW when a negative net active power scenario exists as it will be seen in the next simulations section.
If the negative net active power scenario is permanent, the MG control may order to change to WO mode and in response the RS flip-flop of Figure 5 which output defines the mode of operation, toggles its output from the WH mode (WH/WO* = 1) to “0” corresponding to WO mode. In WO mode, the BES power control changes to MG frequency regulation and follows the PID-WO output shown in the upper part of Figure 5 with the aim of balancing the MG active powers. This PID-WO has as input the frequency error eF. Additionally, in WO mode the WH integral control is eliminated by ramping down its value to 0.
The WH to WO mode change produces a negative step (1->0) in the RS flip-flop output that is applied to the input of the flow ramp transfer function (TF) of Figure 3. The TF output response is a negative impulse which is added to the speed error forming the total input to the HT-PID. The HT-PID output decreases as a response to the input negative impulse, decrease which is replicated by the servo until the valve position reaches the 0-low limit. As a result, the flow rate decreases from its initial value at the WH to WO order instant towards zero. When the flow rate into the HT becomes zero it is considered that the WH-MG is in the WO mode.

4. The Wind Hydro MicroGrid (WH-MG) Simulations

In the simulation test starting point, the microgrid is in steady state and operating in WH mode (Figure 5 RS flip-flop output WH/WO* = 1). The microgrid components initial active powers are the following: the WTG produces PW = 143 kW (with a 9 m/s wind speed), the HTG produces PH = 77 kW and the load consumes PL = 220 kW. The BES is not consuming any power because the net active power (PL − PW) is positive.
The simulations are shown with plots of the frequency per unit (fpu) (Figure 6), RMS voltage per unit (Figure 7) and active powers in kW in the different components (Figure 8). In Figure 8 the active powers are positive/negative when generated/consumed, so the consumer load power is always negative. In the different presented tests, it is considered that the steady state is reached when the fpu reaches and stays within the 0.01% of its final 1 pu value.

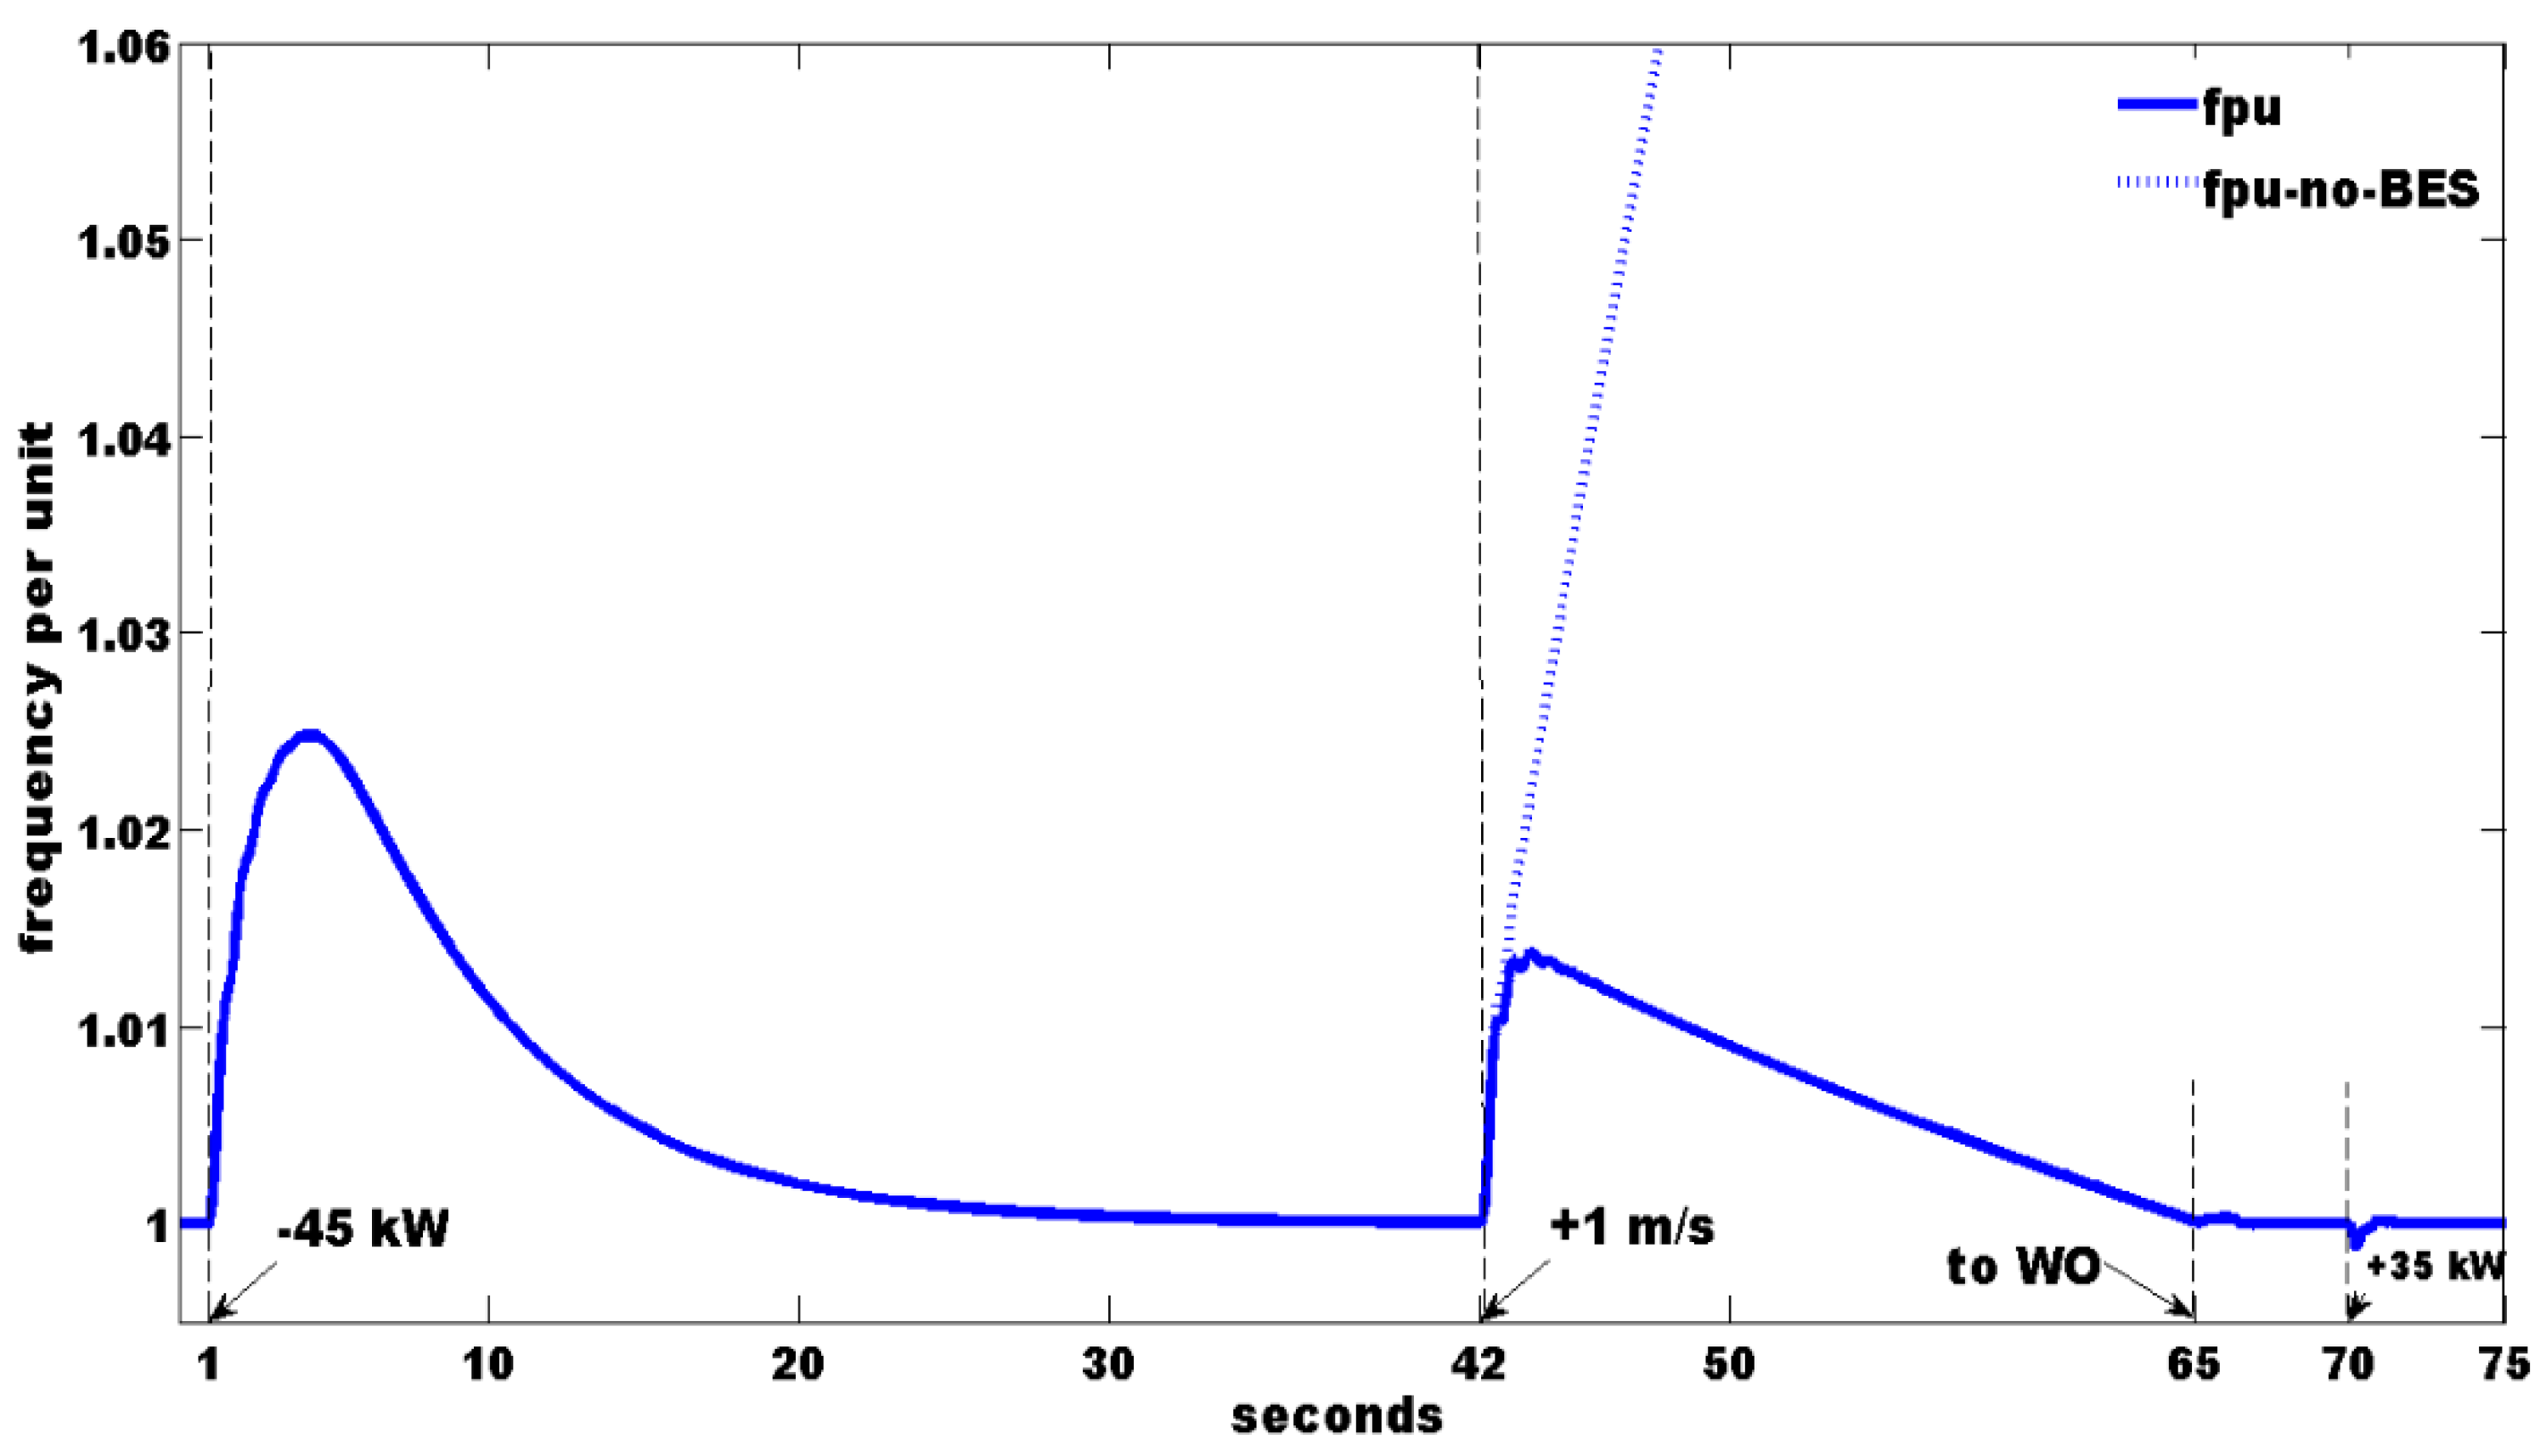
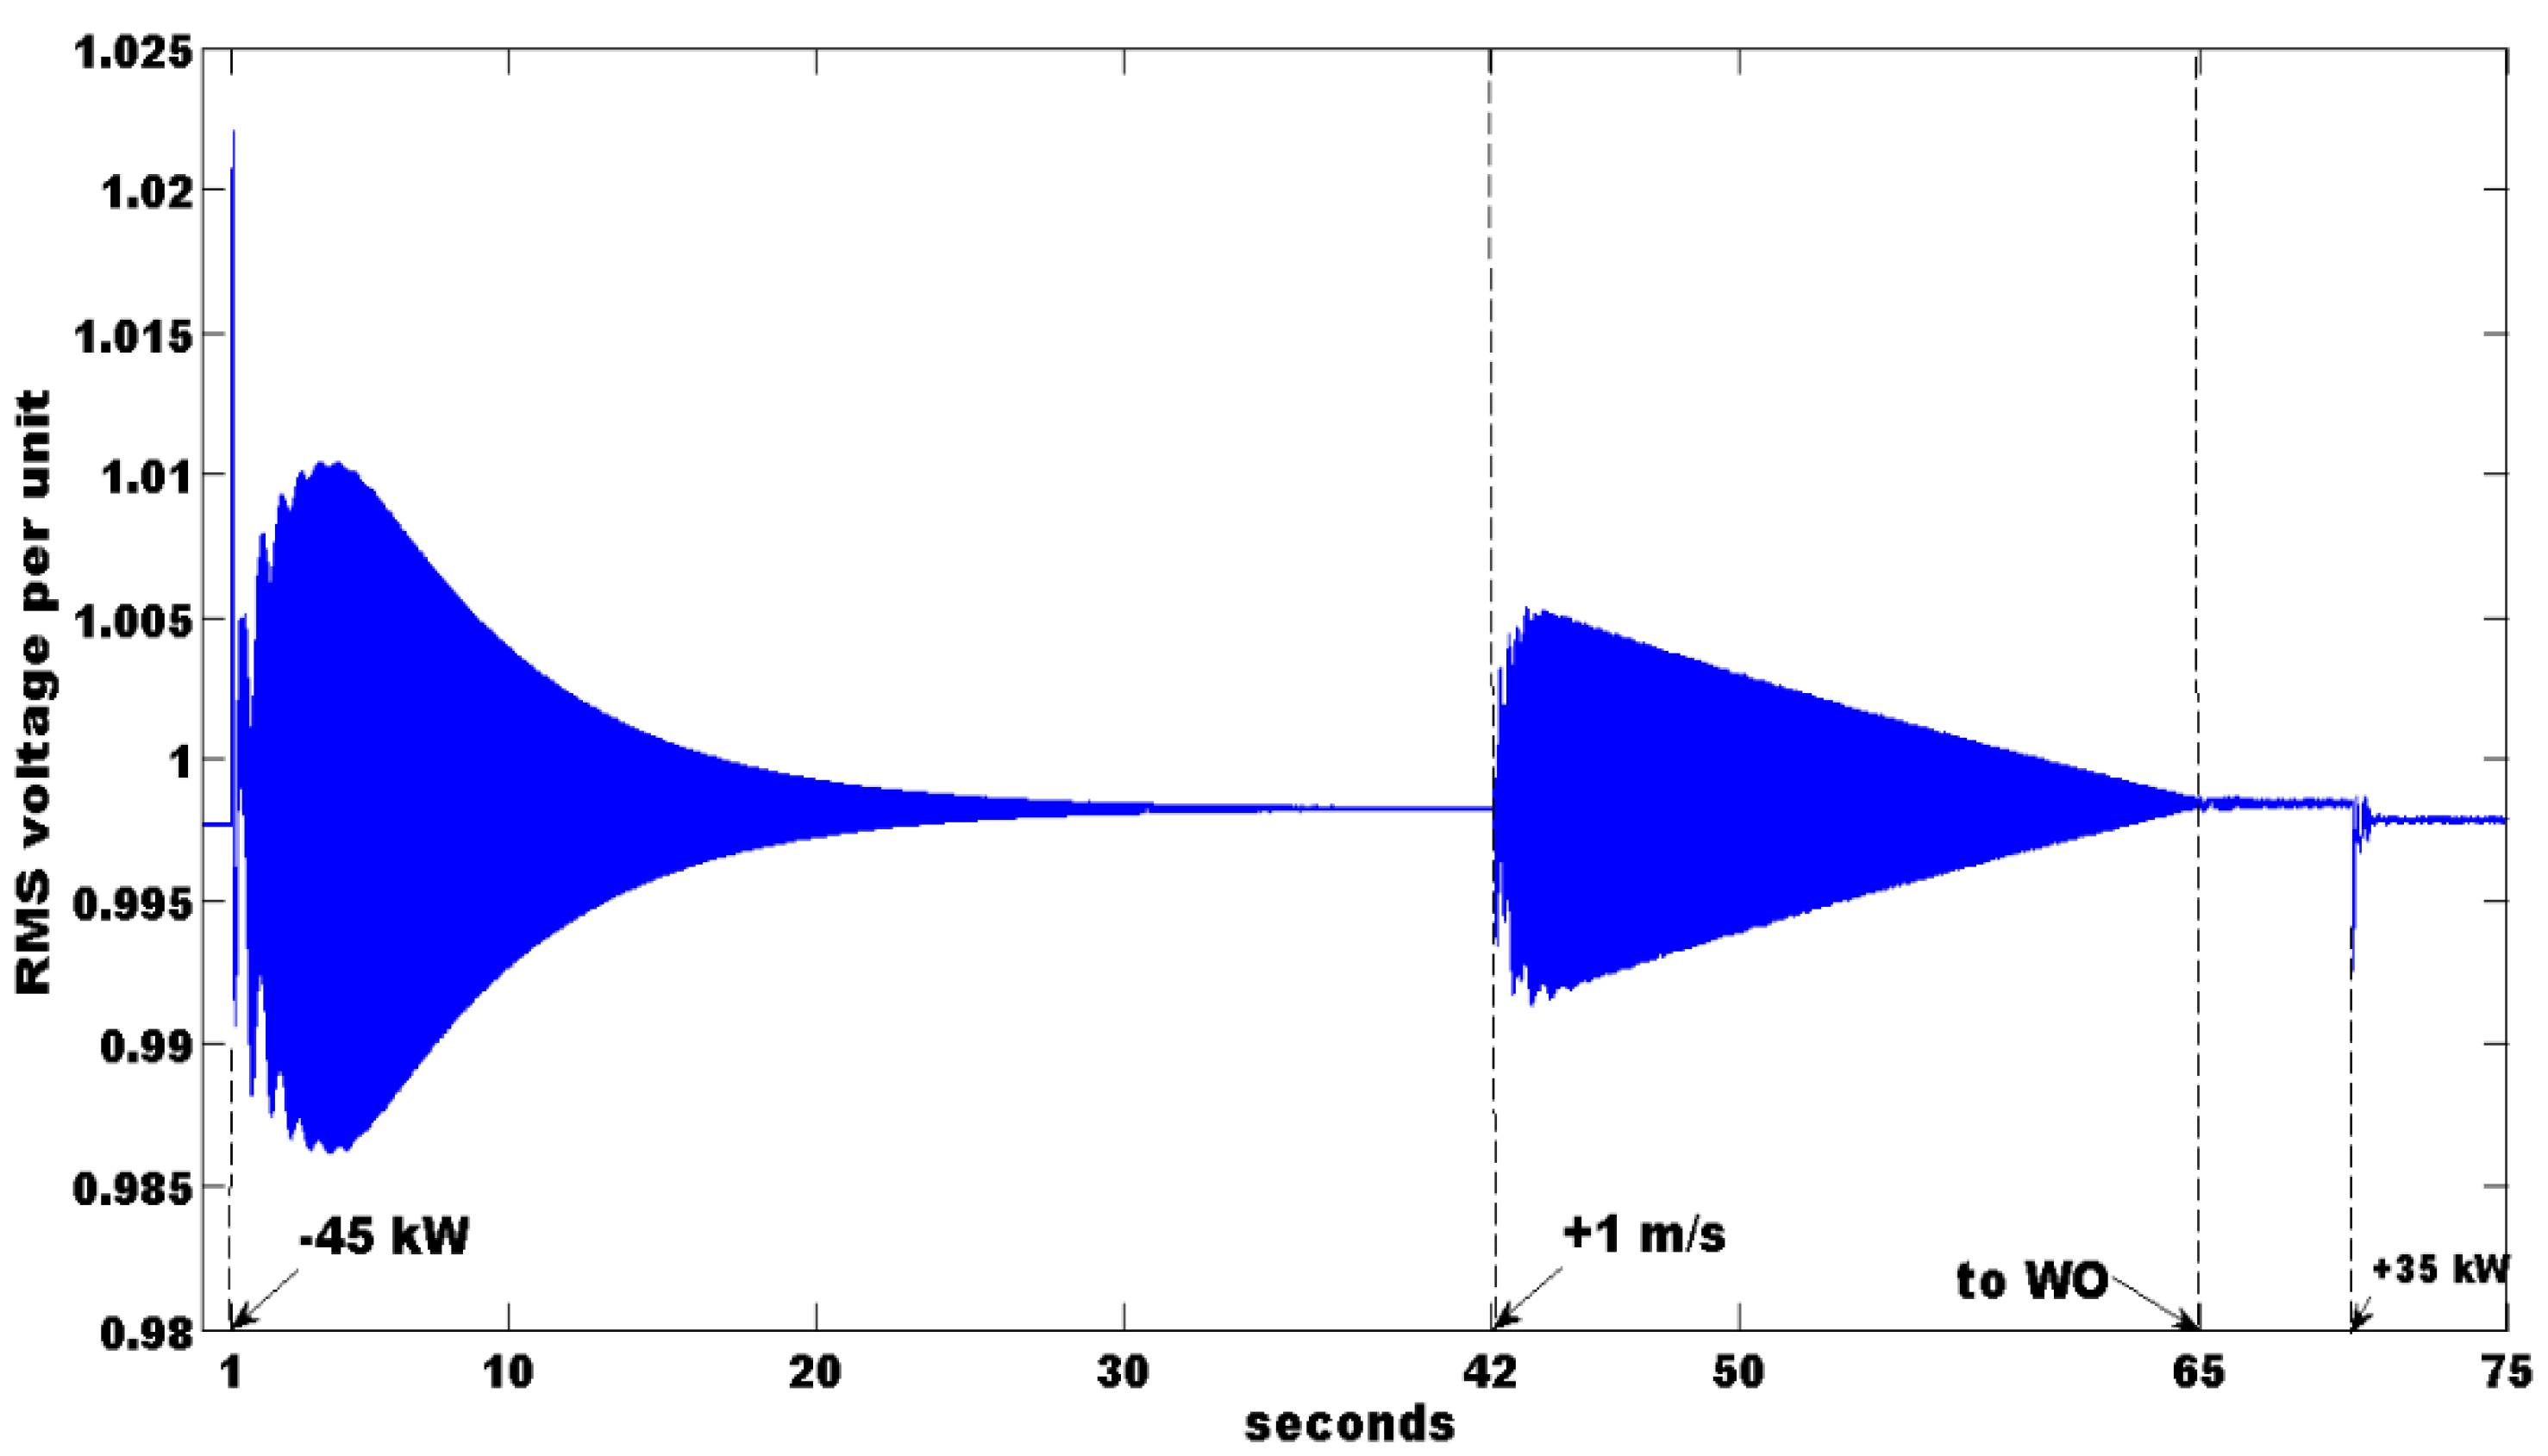
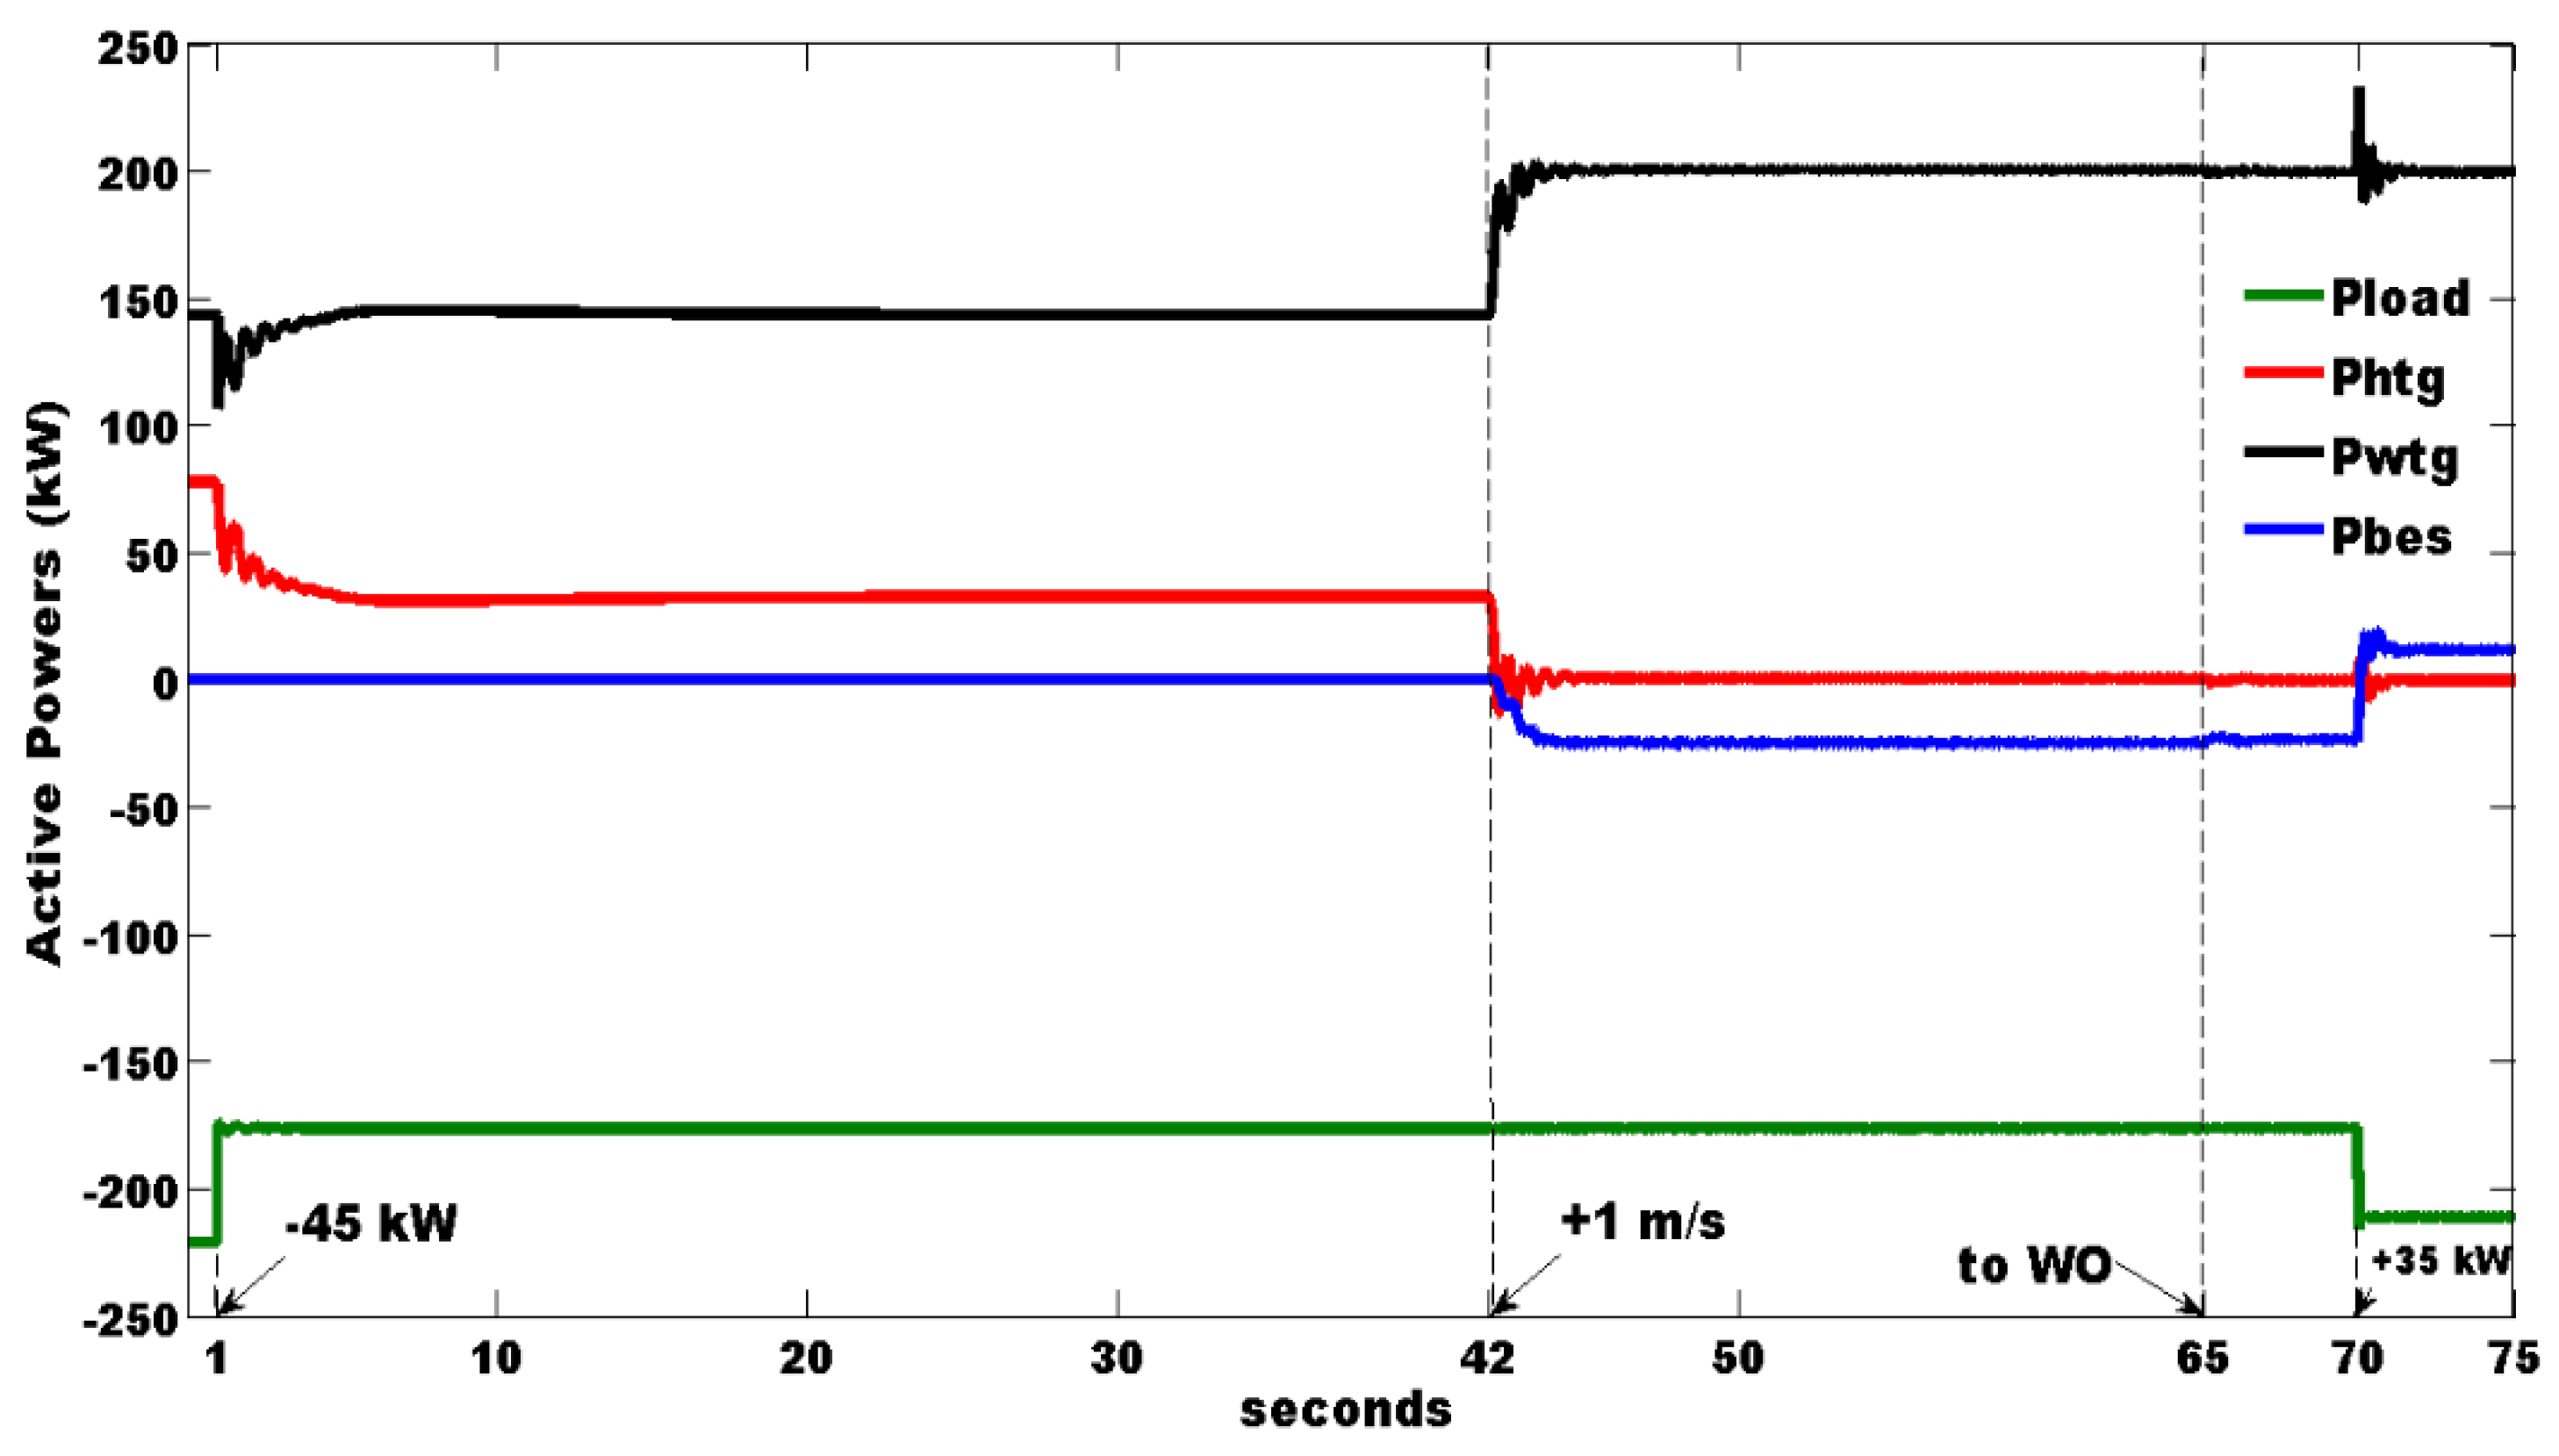
4.1. Wind-Hydro (WH) Mode Simulation

The consumer load is reduced in 45 kW at t = 1 s as the load active power curve of Figure 8 shows. This negative load step leads to an active power excess scenario, so the microgrid frequency increases up to a maximum of 1.0249 pu. Figure 8 also shows WTG, HTG and load active powers transients after t = 1 s. During the WTG active power transient, the WTG power decreases below its initial value, so it counteracts the MG active power excess, providing damping to the response and increasing the MG relative stability. This damping effect is due to the IG included in the WTG [39]. The load active power transient is due to the voltage variations (minimum-maximum: 0.9862–1.022 pu) as the load is resistive. After the transient, the HTG active power compensates the load decreasing by reducing its power with a final value of PH = 32 kW. At t= 37.15 s the steady state is reached with the WTG producing the same initial power and the load consuming 175 kW. The BES is not actuated as the net consumed power is positive during the whole test.

4.2. The HTG Reverse Power Scenario

At t = 42 s the wind speed increases 1 m/s. The WTG active power increases as Figure 8 shows and gets bigger than the consumer load, so the net active consumed power turns negative. The HTG reduces its power commanded by its speed governor and gets into negative power and the BES power control starts to actuate on the BES consumed power. The active power excess makes that the MG frequency increases very fast, but the actuation on the BES makes the HTG power turns into positive again and the set HTG-speed governor reassumes the microgrid frequency control, so the frequency decreases after a maximum of 1.014 pu. After the transient, the active powers stabilize in the following values: PW = 200 kW, PC = 175 kW, PH = 1 kW (inside the 0–6 kW range), PB = 26 kW (excess active power plus artificial loading of the HTG).
In the Figure 6 it is also shown in dotted line the microgrid frequency if there is no actuation on the BES. In this case, as explained through Equation (6) in Section 3, the active power excess leads to a continuous increasing of the MG frequency, so that the frequency reaches the maximum frequency allowed in which the load consumer supply must be interrupted. Therefore, the simulations show that the actuation on the BES consumed power is needed to guarantee the microgrid reliability and stability.

4.3. The WH to WO Mode Transition

As the WTG power is enough for the operation of the microgrid, an order to change to WO mode is given when the microgrid frequency is close to 1 pu at t = 65 s. The mode change order makes the Figure 5 RS flipflop output toggle to 0 (WH/WO* signal) and the BES consumed power control turns into the PID of Figure 5 and therefore the microgrid frequency is controlled through the BES. Additionally, the WH integral control is ramped down towards 0. As the microgrid frequency is close to 1 pu when the transition starts, and the HTG initial power before the transition order is small (1 kW), the WH to WO transient is brief.
The falling edge of the WH/WO* signal at t = 65 s triggers a ramping down in the flow rate as explained previously in Section 3. These two variables flow rate q and HT mechanical power ph-mec are plotted in Figure 9. In Figure 9 it is seen that the produced mechanical power in the HT becomes 0 when the flow rate q is below 0.1 pu, as the HT efficiency is null below that value (Figure 2). In steady state, the WTG produces 200 kW, the load remains in its 175 kW and the BES consumes 25 kW. As mentioned before in the introduction section, the SG stays connected to the microgrid with null flow rate in the HT during operation in WO mode.

4.4. The Wind Only (WO) Mode Simulation

At t = 70 s the load increases in 35 kW, so the 210-kW total load gets bigger than the WTG generated power. The BES control orders the BES to supply the active power deficit, so the BES changes from consuming the previous 25 kW to supply 10 kW in steady state. Again, the WTG provides damping with a positive power peak right after the 35-kW load increasing. The transient lasts 1.055 s and has minimum frequency of 0.9987 pu and voltage minimum/maximum of 0.9926/0.9987. It is worth noting that the BES frequency control is much faster than the performed one by the HT speed governor (1.055 s vs. 36.15 s in the WH test), so the HT speed governor is not turned off in WO mode. This final WO state is possible due to the BES supplying capability, so the BES increases the WH-MG stability. In addition, the BES increases the WH-MG operability as it can continue supplying power in WO mode as long as its SOC is above the minimum 25%. Once the battery SOC drops below the 25% minimum, the WH-MG control should order a mode change to WH. The final WO state cannot be reached using only a DL, as the DL can only consume power, so in the only DL case, after the +35 kW at t = 70 s, the control will detect a MG active power deficit and will order the change to WH mode [9].

5. Conclusions

In this article an isolated WH-MG with a Li-on BES has been modelled and simulated. The models of the different components of the WH-MG: HT and penstock, SG, HT speed governor, WTG, and BES have been presented in Section 2. In Section 2.5 the Li-ion battery has been sized for the used WH-MG. The parameters of the WH-MG components are summarized in Appendix A. The control of the consumed/supplied power of the BES in the different modes of operation has been shown in Section 3. This control orders the BES to load the MG in WH mode when the net load is negative, to support the MG in the WH to WO mode transition and to regulate the MG frequency in WO mode. A comprehensive simulation tests have been presented in Section 4, dealing with the WH mode, the HTG reverse power scenario, the WH to WO mode change and the WO mode. In the WH mode simulation, the frequency variation Δf, voltage variation Δv and the setup time tS are: Δf = 1–1.0249 pu, Δv = 0.9862–1.022 pu and tS = 36.15 s. These values in the WO mode simulation are: Δf = 0.9987–1 pu, Δv = 0.9926–0.9987 pu and tS = 1.055 s. The frequency control in WO mode by means of the BES is 34 times faster than the one in WH mode performed by the HTG commanded by its speed governor, and for this reason the frequency and voltage variations are much smaller in the WO mode simulations. In Section 4.2 it has been shown that the WH-MG collapses in case of no BES actuation, so the BES increases the reliability and stability of the MG. In Section 4.4 it has been shown that the BES increases in WO mode the stability and operability of the WH-MG. The BES drawback is its limited energy storage that constrain the maximum time of operation in WO mode as the BES can reach maximum/minimum SOC limits when consuming/supplying.
Finally, future works will address the optimization of the HT speed regulator fulfilling with the constraint of input valve maximum/minimum speed limitation to ±0.1 pu. By improving the HT speed regulator, the MG transients in WH mode will be shorter and the MG power quality will be improved.

Funding

This research received no external funding.

Data Availability Statement

Not applicable.

Conflicts of Interest

The author declares no conflict of interest.

Abbreviations

BESbattery energy storage
DGdiesel generator
DLDump Load
ESSEnergy storage system
HThydraulic turbine
HTGhydraulic turbine generator
IGInduction Generator
MGMicrogrid
SGsynchronous generator
WH-MGWind hydro microgrid
WH-MG operation modesHydro Only (HO), Wind Hydro (WH), Wind Only (WO)
WTWind Turbine
WTGWind Turbine Generator

Appendix A. System Parameters

Isolated MG rated frequency & voltage: 60 Hz & 480 V.
HTG rated power & inertia constant: PH−NOM = 300 kVA & HW = 2 s
At (hydraulic turbine gain) =1.375
Parameters of the HT-PID: KP= 3.2, KI= 0.46, KD = 0.98
WTG rated power & Inertia constant: PW−NOM = 275 kW & HW = 2 s.
BES rated power 150 kW
Step up transformer primary/secondary voltages = 120/480 VAC
Li-ion Battery rated voltage & capacity: 240 V & 260 Ah
Parameters of the BES-PID: KP_B = 650, KI_B= 2500, KD_B = 30

References

  1. Piagi, P.; Lasseter, R.H. Autonomous Control of Microgrids. In Proceedings of the IEEE PES Meeting, Montreal, QC, Canada, 18–22 June 2006. [Google Scholar] [CrossRef]
  2. Prasenjit, B.; Chowdhury, S.; Halder nee Dey, S.; Chowdhury, S.P. A literature review on integration of distributed energy resources in the perspective of control, protection and stability of microgrid. Renew. Sustain. Energy Rev. 2012, 16, 5545–5556. [Google Scholar] [CrossRef]
  3. Hirsch, A.; Parag, Y.; Guerrero, J. Microgrids: A review of technologies, key drivers, and outstanding issues. Renew. Sustain. Energy Rev. 2018, 90, 402–411. [Google Scholar] [CrossRef]
  4. Elmetwaly, H.; ElDesouky, A.A.; Omar, A.I.; Saad, M.A. Operation control, energy management, and power quality enhancement for a cluster of isolated microgrids. Ain Shams Eng. J. 2022, 13, 101737. [Google Scholar] [CrossRef]
  5. Sebastián, R. Review on Dynamic Simulation of Wind Diesel Isolated Microgrids. Energies 2021, 14, 1812. [Google Scholar] [CrossRef]
  6. Gil-González, W.; Montoya, O.D.; Garces, A. Modeling and control of a small hydro-power plant for a DC microgrid. Electr. Power Syst. Res. 2020, 180, 106104. [Google Scholar] [CrossRef]
  7. Sebastián, R.; Quesada, J. Modeling and simulation of an isolated wind Hydro Power System. In Proceedings of the IECON 2016—42nd Annual Conference of the IEEE Industrial Electronics Society, Florence, Italy, 23–26 October 2016; pp. 4169–4174. [Google Scholar] [CrossRef]
  8. Sebastian, R. Simulation of the transition from Wind only mode to Wind Diesel mode in a no-storage Wind Diesel System. IEEE Lat. Am. Trans. 2009, 7, 539–544. [Google Scholar] [CrossRef]
  9. Sebastián, R.; Nevado, A. Study and Simulation of a Wind Hydro Isolated Microgrid. Energies 2020, 13, 5937. [Google Scholar] [CrossRef]
  10. Lukasievicz, T.; Oliveira, R.; Torrico, C. A Control Approach and Supplementary Controllers for a Stand-Alone System with Predominance of Wind Generation. Energies 2018, 11, 411. [Google Scholar] [CrossRef]
  11. Sebastián, R. Application of a battery energy storage for frequency regulation and peak shaving in a wind diesel power system. IET Gener. Transm. Distrib. 2016, 10, 764–770. [Google Scholar] [CrossRef]
  12. Sebastián, R.; Peña-Alzola, R.; Quesada, J. Simulation of a wind diesel power system with flywheel energy storage. In Proceedings of the 2017 IEEE 26th International Symposium on Industrial Electronics (ISIE), Edinburgh, UK, 19–21 June 2017; pp. 2115–2120. [Google Scholar] [CrossRef]
  13. Hasmaini, M.; Hazlie, M.; Bakar, A.H.; Ping, H.W. A Review on Islanding Operation and Control for Distribution Network Connected with Small Hydro Power Plant. Renew. Sustain. Energy Rev. 2011, 15, 3952–3962. [Google Scholar] [CrossRef]
  14. Canary Government. Anuario Energético de Canarias 2016; Consejería de Economía, Industria, Comercio y Conocimiento: Santa Cruz de Tenerife, Spain, 2017. [Google Scholar]
  15. Sarasúa, J.; Martínez-Lucas, G.; Platero, C.; Sánchez-Fernández, J. Dual Frequency Regulation in Pumping Mode in a Wind–Hydro Isolated System. Energies 2018, 11, 2865. [Google Scholar] [CrossRef] [Green Version]
  16. Sarasúa, J.; Martínez-Lucas, G.; Lafof, M. Analysis of Alternative Frequency Control Schemes for Increasing Renewable Energy Penetration in El Hierro Island Power System. Int. J. Electr. Power Energy Syst. 2019, 113, 807–823. [Google Scholar] [CrossRef]
  17. Coban, H.H.; Rehman, A.; Mousa, M. Load Frequency Control of Microgrid System by Battery and Pumped-Hydro Energy Storage. Water 2022, 14, 1818. [Google Scholar] [CrossRef]
  18. Briongos, F.; Platero, C.A.; Sánchez-Fernández, J.A.; Nicolet, C. Evaluation of the Operating Efficiency of a Hybrid Wind–Hydro Powerplant. Sustainability 2020, 12, 668. [Google Scholar] [CrossRef] [Green Version]
  19. Canales, F.A.; Beluco, A.; Mendes, C.A.B. A comparative study of a wind hydro hybrid system with water storage capacity: Conventional reservoir or pumped storage plant? J. Energy Storage 2015, 4, 96–105. [Google Scholar] [CrossRef]
  20. Working Group Prime Mover and Energy Supply. Hydraulic turbine and turbine control models for system dynamic studies. IEEE Trans. Power Syst. 1992, 7, 167–179. [Google Scholar] [CrossRef]
  21. Paish, O. Small Hydro Power: Technology and Current Status. Renew. Sustain. Energy Rev. 2002, 6, 537–556. [Google Scholar] [CrossRef]
  22. Simscape Electrical™ Libraries. Available online: https://es.mathworks.com/products/simscape-electrical.html (accessed on 24 October 2022).
  23. Platero, C.A.; Nicolet, C.; Sánchez, J.A.; Kawkabani, B. Increasing Wind Power Penetration in Autonomous Power Systems Through No-Flow Operation of Pelton Turbines. Renew. Energy 2014, 68, 515–523. [Google Scholar] [CrossRef] [Green Version]
  24. Kothari, D.P.; Nagrath, I.J. Modern Power System Analysis; Tata McGraw-Hill Education: New York, NY, USA, 2003. [Google Scholar]
  25. Hansen, A.; Jauch, C.; Sørensen, P.; Iov, F.; Blaabjerg, F. Dynamic Wind Turbine Models in Power System Simulation Tool DIgSILENT; Report Risø-R-1400(EN); Risø National Laboratory: Roskilde, Denmark, 2003. Available online: https://www.osti.gov/etdeweb/servlets/purl/20437623 (accessed on 24 October 2022).
  26. Rodríguez-Amenedo, J.L.; Burgos-Díaz, J.C.; Arnalte-Gómez, S. Sistemas Eólicos de Producción de Energía Eléctrica; Rueda: Madrid, Spain, 2003; ISBN 9788472071391. [Google Scholar]
  27. Gagnon, R.; Saulnier, B.; Sybille, G.; Giroux, P. Modeling of a Generic High-Penetration No-Storage Wind-Diesel System Using Matlab Power System Blockset. In Proceedings of the 2002 Global Windpower Conference, Paris, France, 2–5 April 2002. [Google Scholar]
  28. Knudsen, H.; Nielsen, J.N. Introduction to the Modeling of Wind Turbines. In Wind Power in Power Systems; Wiley: Chicester, UK, 2005; pp. 525–585. [Google Scholar]
  29. Battery University. BU-107: Comparison Table of Secondary Batteries. Available online: https://batteryuniversity.com/article/bu-107-comparison-table-of-secondary-batteries (accessed on 4 July 2022).
  30. Hannan, M.A.; Wali, S.B.; Ker, P.J.; Rahman, M.S.A.; Mansor, M.; Ramachandaramurthy, V.K.; Muttaqi, K.M.; Mahlia, T.M.I.; Dong, Z.Y. Battery energy-storage system: A review of technologies, optimization objectives, constraints, approaches, and outstanding issues. J. Energy Storage 2021, 42, 103023. [Google Scholar] [CrossRef]
  31. Sebastián, R.; Alzola, R.P. Simulation of an isolated Wind Diesel System with battery energy storage. Electr. Power Syst. Res. 2011, 81, 677–686. [Google Scholar] [CrossRef]
  32. Sebastián, R.; Peña-Alzola, R. Study and simulation of a battery based energy storage system for wind diesel hybrid systems. In Proceedings of the 2012 IEEE International Energy Conference and Exhibition (ENERGYCON), Florence, Italy, 9–12 September 2012; pp. 563–568. [Google Scholar] [CrossRef]
  33. Rezkallah, M.; Chandra, A. Wind diesel battery hybrid system with power quality improvement for remote communities. In Proceedings of the IEEE Industry Applications Society Annual Meeting (IAS), Orlando, FL, USA, 9–13 October 2011; pp. 1–6. [Google Scholar] [CrossRef]
  34. Krata, J.; Saha, T.K. Real-Time Coordinated Voltage Support with Battery Energy Storage in a Distribution Grid Equipped with Medium-Scale PV Generation. IEEE Trans. Smart Grid. 2019, 10, 3486–3497. [Google Scholar] [CrossRef]
  35. Tremblay, O.; Dessaint, L.-A.; Dekkiche, A.-I. A generic battery model for the dynamic simulation of hybrid electric vehicles. In Proceedings of the Vehicle Power and Propulsion Conference, VPPC 2007, Arlington, TX, USA, 9–12 September 2007; pp. 284–289. [Google Scholar] [CrossRef]
  36. Bindner, H.; Cronin, T.; Lundsager, P.; Manwell, J.F.; Abdulwahid, U.; Baring-Gould, I. Lifetime Modelling of Lead Acid Batteries; Risø National Laboratory Report; Risø National Laboratory: Roskilde, Denmark, April 2005; 81p, ISBN 87-550-3441-1. [Google Scholar]
  37. Battery University. BU-808: How to Prolong Lithium-based Batteries. Battery University. Last Updated: 3-Nov-2021. Available online: https://batteryuniversity.com/article/bu-808-how-to-prolong-lithium-based-batteries (accessed on 24 October 2022).
  38. Xu, B.; Oudalov, A.; Ulbig, A.; Andersson, G.; Kirschen, D.S. Modeling of Lithium-Ion Battery Degradation for Cell Life Assessment. IEEE Trans. Smart Grid 2018, 9, 1131–1140. [Google Scholar] [CrossRef]
  39. Margaris, I.D.; Papathanassiou, S.A.; Hatziargyriou, N.D.; Hansen, A.D.; Sorensen, P. Frequency Control in Autonomous Power Systems with High Wind Power Penetration. IEEE Trans. Sustain. Energy 2012, 3, 189–199. [Google Scholar] [CrossRef]
Figure 1. Wind Hydro isolated Microgrid (WH-MG) diagram.
Energies 15 09230 g001
Figure 2. Pelton hydro turbine efficiency.
Energies 15 09230 g002
Figure 3. Hydro turbine speed governor Simulink schematic.
Energies 15 09230 g003
Figure 4. BES three phase converter control. (a) Active power control. (b) Reactive power control.
Energies 15 09230 g004
Figure 5. WH and WO modes Battery Energy Storage (BES) active power control Simulink schematic.
Energies 15 09230 g005
Figure 6. Frequency per unit.
Energies 15 09230 g006
Figure 7. Voltage per unit (RMS).
Energies 15 09230 g007
Figure 8. Supplied (+)/Consumed (−) MG active powers (kW).
Energies 15 09230 g008
Figure 9. Hydro Turbine (HT) variables.
Energies 15 09230 g009
Publisher’s Note: MDPI stays neutral with regard to jurisdictional claims in published maps and institutional affiliations.

