Article

Real-Time Power Quality Enhancement in a Hybrid Micro-Grid Using Nonlinear Autoregressive Neural Network

Department of EEE, ITER, SOA Deemed to be University, Odisha 700107, India
*
Author to whom correspondence should be addressed.
Energies 2022, 15(23), 9081; https://doi.org/10.3390/en15239081
Submission received: 9 November 2022 / Revised: 25 November 2022 / Accepted: 28 November 2022 / Published: 30 November 2022
(This article belongs to the Section A2: Solar Energy and Photovoltaic Systems)

Abstract

:
The extensive use of renewable energy sources (RESs) in energy sectors plays a vital role in meeting the present energy demand. The widespread utilization of allocated resources leads to multiple usages of converters for synchronization with the power grid, introducing poor power quality. The integration of distributed energy resources produces uncertainties which are reflected in the distribution system. The major power quality problems such as voltage sag/swell, voltage unbalancing, poor power factor, harmonics distortion (THD), and power transients appear during the transition of micro-grids (MGs). In this research, a single micro-grid is designed with PVs, wind generators, and fuel cells as distributed energy resources (DERs). A nonlinear auto regressive exogenous input neural network (NARX-NN) controller has been investigated in this micro-grid in order to maintain the above power quality issues within the specific standard range (IEEE/IEC standards). The performance of the NARX-NN controller is compared with PID and fuzzy-PID controllers. The single micro-grid is extended to design a three-phase large-scale realistic micro-grid structure to test the feasibility of the proposed controller. The realistic micro-grid is verified through addition of line-impedance, communication delay, demand response, and off-nominal situations. The proposed controller is also validated by simulating different test scenarios using MATLAB/Simulink and TMS320-based processor-in-loop (PIL) for real-time implementation.

1. Introduction

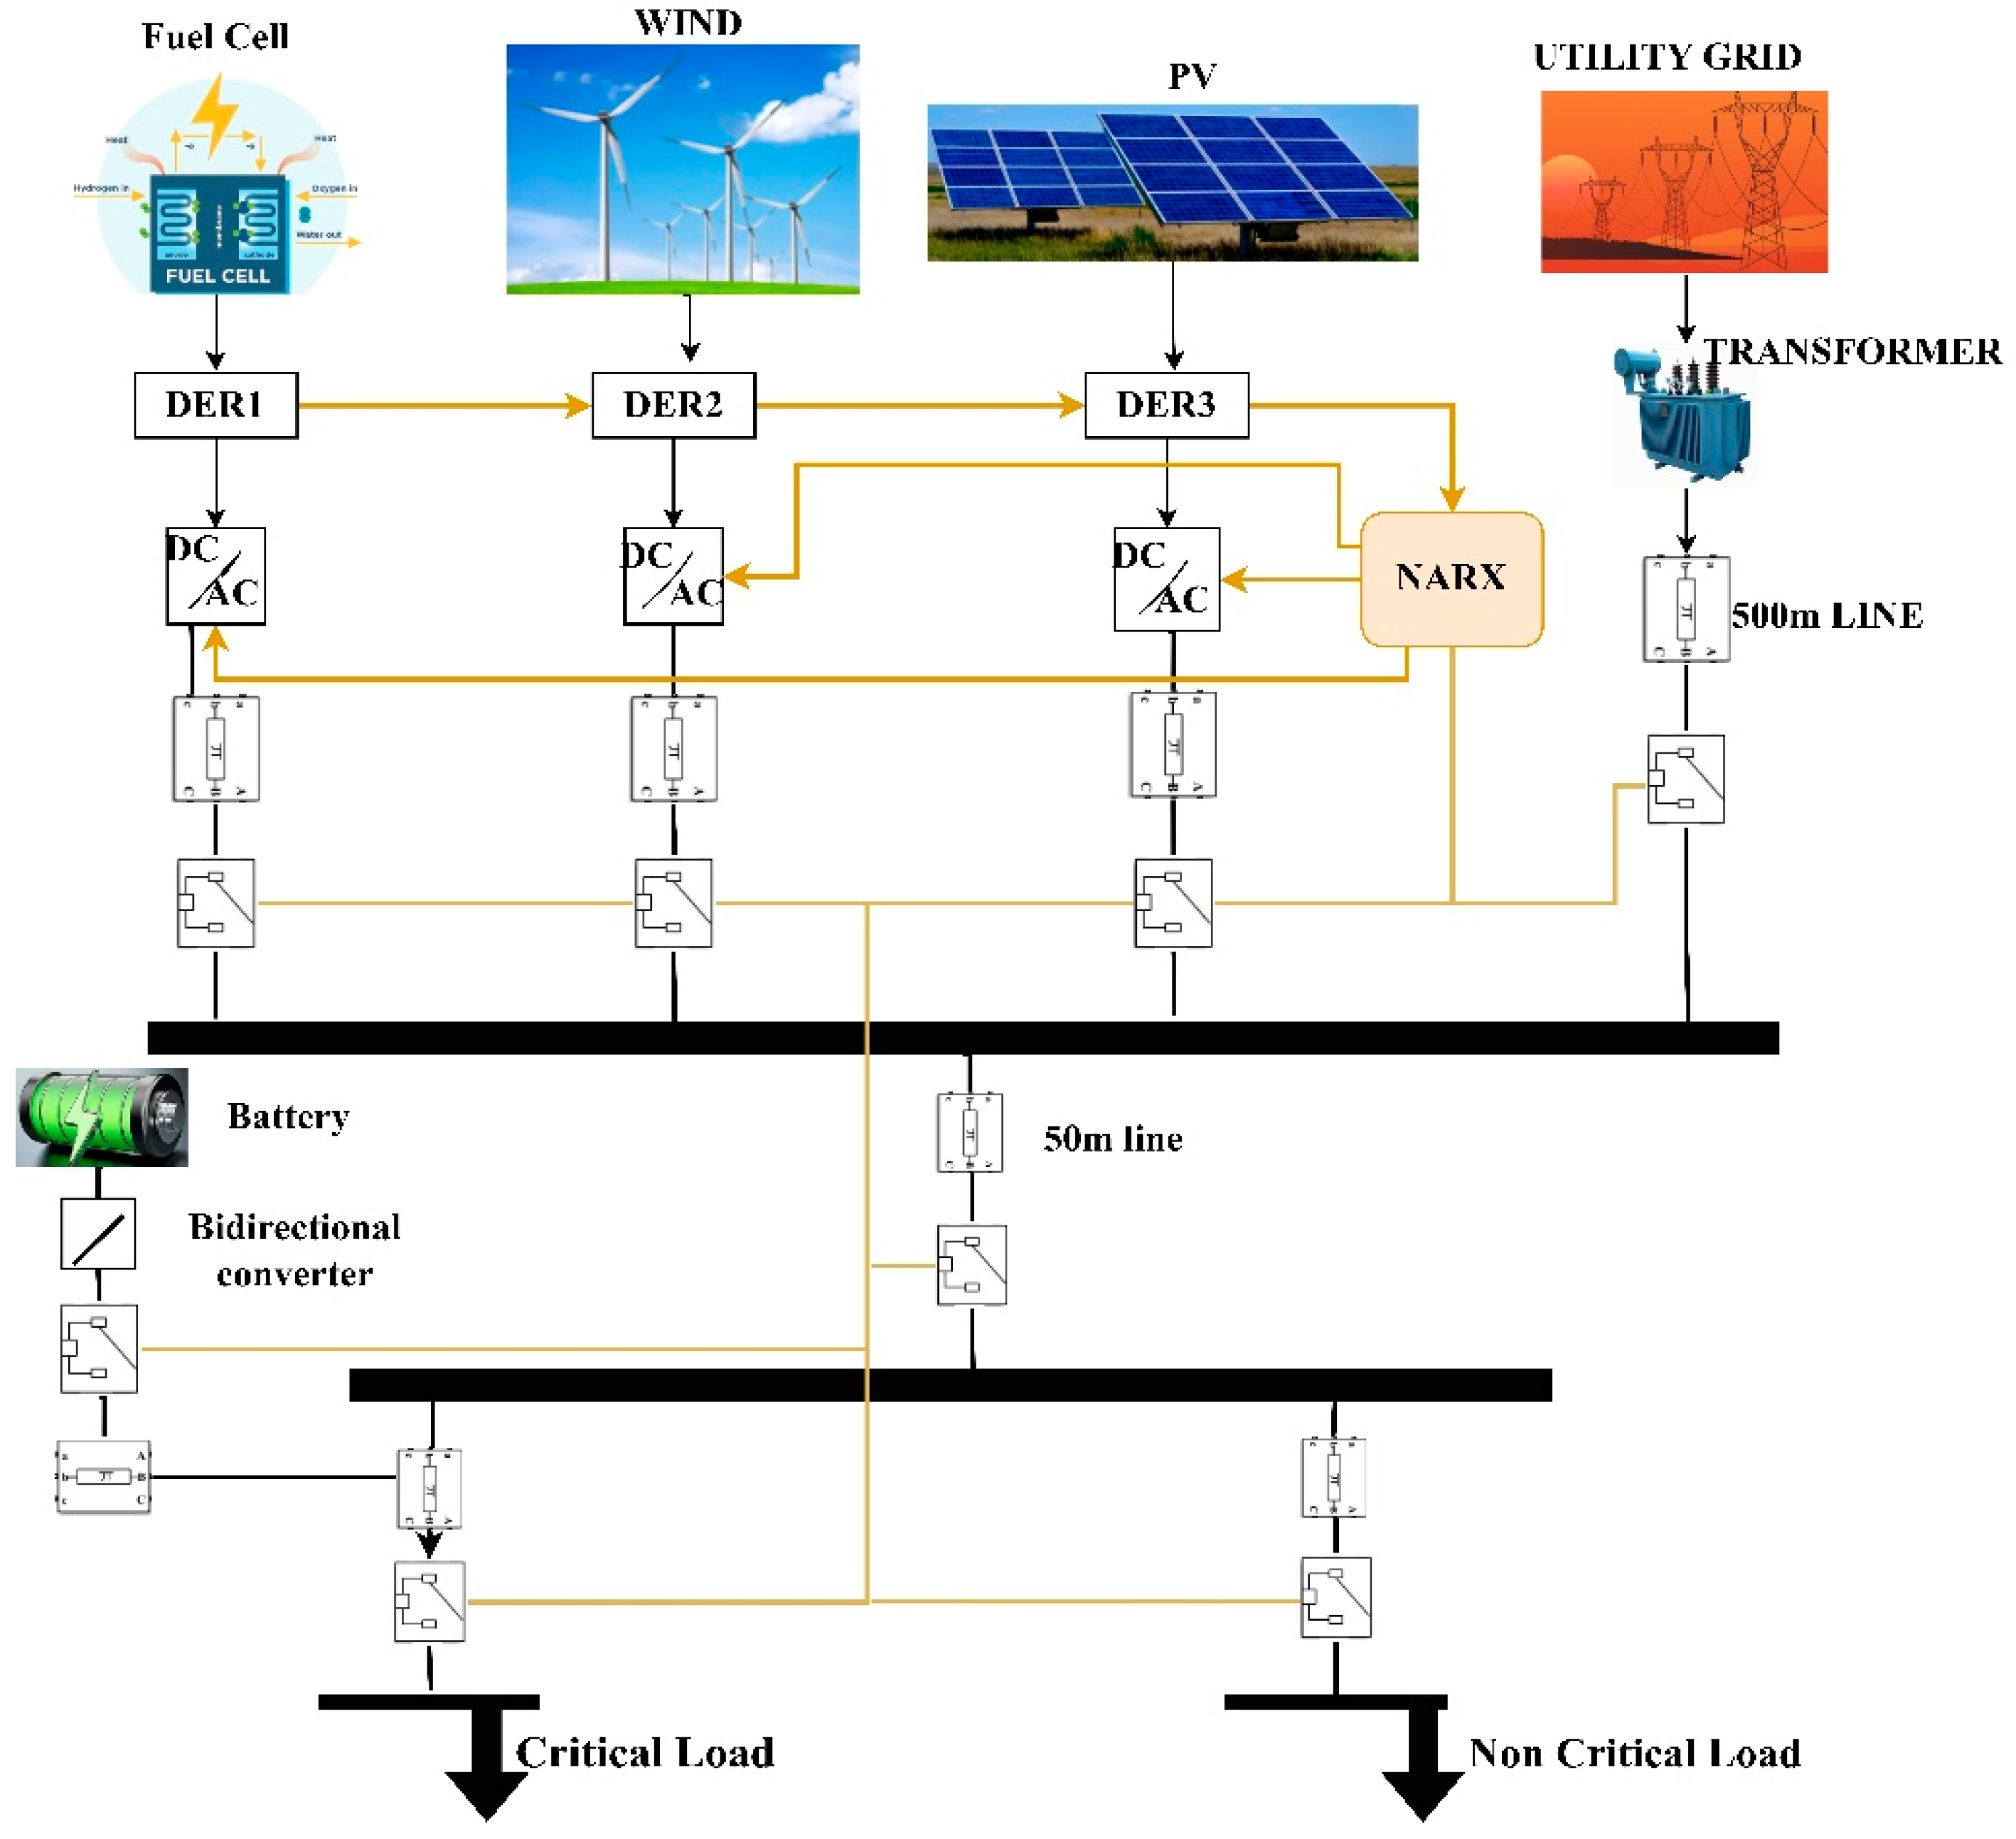
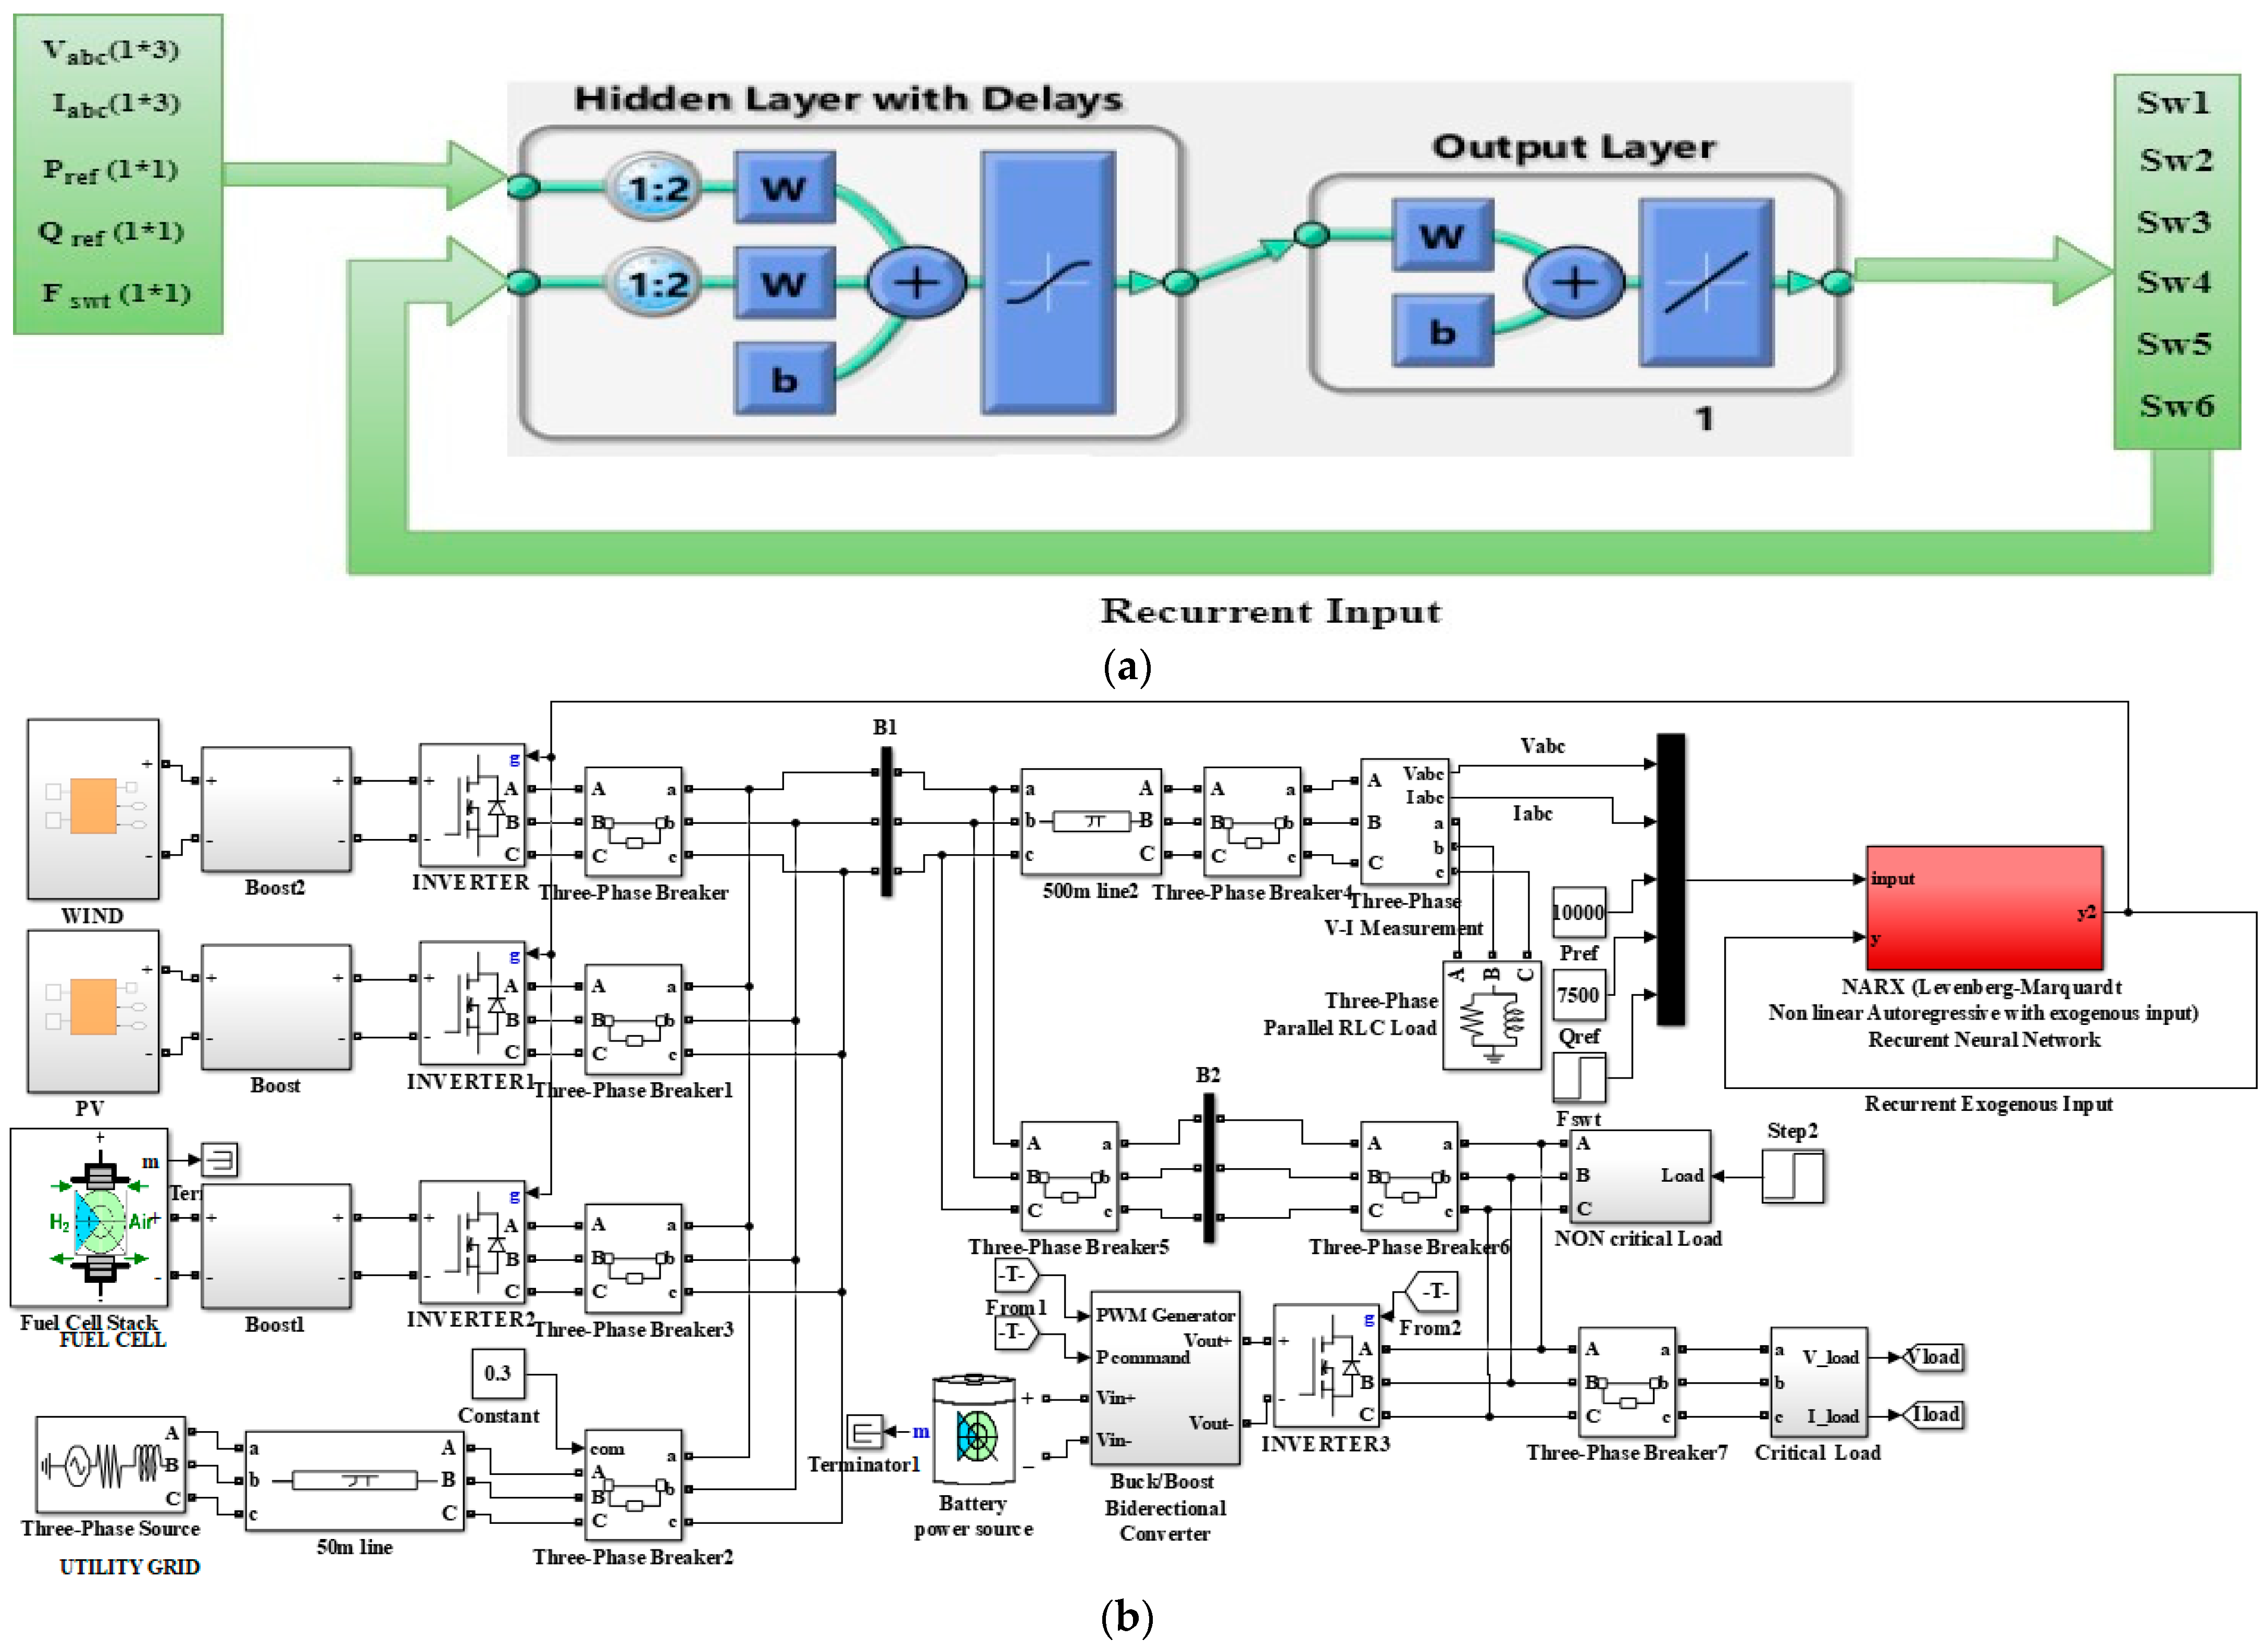
The entire work process is mentioned in Figure 1.
The depletion of traditional energy sources leads to the utilisation of non-conventional energy sources such as PV arrays, windmills, geothermal energy, fuel cell, etc. These sources are also known as distributed energy resources (DER), which are vital in the modern grid system. The DER-based resources lead to the vast utilisation of power electronic devices, which introduces PQ issues in the network. These small-scale resources give rise to MG, which is connected to the grid but can operate in islanded mode whenever required. The power generation in MGs is associated with several factors and limitations. For instance, solar energy depends on solar irradiance, humidity, climatic conditions, etc., while wind energy depends on wind speed, geographical conditions, and climatic variations. MG’s efficient operation requires that the power quality remain within an acceptable range for better domestic and industrial uses, causing reduced harmful effects to the supply side. Custom power devices such as custom power active transformer (CPAT) can decrease the fluctuations in sinusoidal waveforms at both the load and the source end by integrating both series and shunt power conditioning devices with a unique magnetic circuit modification and auxiliary windings of the transformer [1]. Custom power park (CPP) has been established to deal with the PQ issues, which contains a dynamic voltage restorer (DVR) and static transfer switch (STS) and is supplied by two feeders. The STS selects an alternate feeder whenever a fault happens in the preferred feeder. The two-inlet DVR-based on the matrix converter can deliver steady voltage [2]. The power quality instabilities, such as single and combined PQ turbulences, are distinguished and categorized utilizing sparse signal decomposition on hybrid dictionaries allowing for different noise intensities [3]. A control method for a novel hybrid static var compensator in parallel with a hybrid active power filter (HSVC//HAPF) is proposed in [4], where the SVC portion of the HSVC//HAPF is used for dynamic compensation of the unreal power and the HAPF portion is responsible for providing harmonic power and minor compensating unreal power. An isolated, dual-converter topology is inherited for a high-power D-STATCOM, where coupled inductors built on single magnetic cores improve both the transient response and the steady-state error in the system [5]. The custom power devices (CPDs) are presented in [6], which could perform extensive research in power quality regulation for domestic loads. The power factor might be preserved with static var compensator (SVC) and real power filtering by using reactive power reimbursement to improve the quality of power. The open unified power quality conditioner (UPQC-O) performs reactive power compensation for power quality improvisation. It is a CPD consisting of series and shunt inverters. The UPQC-O is incorporated with a battery energy storage system (BESS) to introduce real power to the system throughout peak hours for peak load shaving [7]. Enhancing power quality, consistency of power and complex load reimbursement in a PV-based MG having BESS are accomplished by performing an improved form of the adaptive filtering method, such as a “momentum”-based least mean square (MLMS) control algorithm, applied for controlling the switching signals to the voltage source converter(VSC) at the grid [8]. Smart abstraction and optimum power dispatch by utilising a fuzzy-logic controller (FLC) through a combined generating unit tied with the grid are given in [9]. An innovative artificial neural network (ANN) control method has been performed in [10], which can improve the PQ issues more accurately. The above literature emphasises the regulation of power quality and power reliability for MGs. Both large- and small-scale MGs require improvement of power quality issues, and at the same time, the fulfilment of requirements of both the demand and supply sides must be considered. MG advocates for the combination of dispersed production units, such as windmills, fuel cells, PV panels, etc., in a typical geographical area. The healthy operation of MGs requires better coordination and control of itself for different stages of DERs and loads, as well as the proper configuration of the MG [11]. Dynamic NN-based control is proposed in [12] for operational scheduling, centralised, decentralised and dispersed methods for MG control. The general functional coordination of an MG can be enclosed with the grading of a network interface, MG regulation, fortification, and organisation [13]. A new smart working methodology has been developed by the unified use of FLC and the particle swarm optimization (PSO) techniques for modifying and optimising the conventional proportional-integral (PI) method for better control of frequency in the AC-based MGs [14]. Shunt active power filter (SAPF) could reimburse unreal power (P) as current harmonics are centred on an ADALINE neural network-based current sensor, which can regulate the SAPF for maintenance of sine wave property of source currents and power factor (PF) closer to 1 as presented in [15]. A generalised droop control (GDC) system for an extensive array of load alteration cases is developed in [16], based upon conventional voltage/frequency droop control. A new structure established upon adaptive neuro-fuzzy inference system (ANFIS) is suggested to eliminate its dependence on the line parameters changes. A leaky least mean fourth (LLMF) control procedure is projected for the compensation of reactive power, mitigation of harmonics, load harmonising, and power factor improvement of a three-phase single-level grid-coupled PV array connected to a static compensator [17]. Moreover, for optimisation of power quality of a PV-based DSTATCOM, techniques such as adaptive reweighted zero drawing control method through perturbation and observation-based maximum power point tracking (MPPT), controlling algorithm, JAYA optimisation technique to enhance the PI-controller parameters are proposed [18,19,20]. Supply systems’ power quality improvement and consistency are performed by commissioning optimal network reconfiguration (ONR) [21]. ONR is fed autonomously to a system in a predefined interval to minimise the number of transmitted voltages drops. The distortion and disturbance reimbursement to decrease the voltage distortions at the point of common coupling (PCC) is performed with a new hierarchical regulation system which utilises a complementary control loop for small- and large-signal stability improvement [22]. A synchronised controller having current-controlled mode (CCM) and voltage-controlled mode (VCM) components for reactive power distribution and voltage harmonics reimbursement is suggested in [23] and based on the local measurement of signals. The reimbursement of highly fluctuating load stresses in a distribution network is achieved with a superconducting magnetic energy storage (SMES) associated shunt active power filter (SAPF) [24]. An adaptive neuro-fuzzy inference system has been utilised for online minimum real power inoculation with UPQC by collecting the PSO-based data for different voltage sag circumstances in an AC-based MG [25]. The hybrid method combining the bacterial foraging optimization algorithm (BFOA) and ANN method is utilised [26] to decrease the generation charge and enhance the usage of DERs in an MG model containing a PV array, wind turbine, and storage system. A decentralised droop-based controller scheme with three graded control levels for either grid-connected or islanded modes of operation has been described in [27] with a unique application of radial basis function neural networks (RBFNNs) for precise and firm power sharing in an MG with several DERs. A hybrid energy storage system (HESS) employing a SMES and the battery is considered to compensate for power fluctuations within an MG. Operation of an MG at a remote location supplied from the windmill and a PV array is proposed in [28], where voltage and frequency are regulated with the help of an indirect vector controller at the line side converter, which is integrated with droop characteristics. The PV system operates in either MPPT or loads power tracking mode to avoid overcharging the battery depending upon the battery’s state of charge [29]. The novel gradient descent least squares regression (GDLSR) centred neural network (NN) structure for the regulation of grid-connected solar panels can improve the PQ issues [30], where a single-layer neuron arrangement is utilised for the abstraction of a fundamental constituent of load current. In most of the above-discussed literature, most of the research papers suggest improved techniques for enhancing power quality issues such as voltage swell, voltage sag, power fluctuations, harmonics in the load current, etc., in a typical MG; however, the simultaneous consideration of voltage, frequency, THD, and power factor as assessing factors has not been well-thought-out in MG operation. So, for the efficient and reliable operation of MGs, most of the power quality issues must be taken as factors and should be dealt with carefully by minimising the unwanted fluctuations in the system. This work demonstrates improving the power quality disturbances by taking into account issues such as power factor, total harmonic distortion (THD), voltage sag, and voltage swell simultaneously. At the same time, the versatility of the proposed work has been verified by considering different test scenarios such as miniature MGs, MGs where line impedance is considered, and a complex MG structure. The load variations taken in the model can explain the operation of the model on varying load conditions.
The proposed work presents the following listed contributions:
The various power quality issues such as voltage unbalancing and harmonics in the load current have been measured and regulated. The frequency deviation, harmonic distortion, and power factor has been corrected.
The MG model is simulated for switching delay, inclusion of line impedance, communication delay, power loss, sharing, etc.
Importance of the used controller is authenticated by a comprehensive complex three-phase AC-based MG.
The working of the suggested control action has been examined by considering influence of line impedance on power allocation and losses throughout grid-connected and islanded mode of operation for complex MG structures.
The effect of demand and response (DR) has been scrutinised and the power quality issues have been regulated considering addition of switching interruption on controller operation for the complex MGs. The off-nominal frequency parameter incorporating an additional noise is also assessed for the complex MG model.
The proposed controller performance is validated through a real time simulation with TMS320-based processor-in-loop (PIL).
In this work the power quality issues are examined through voltage sag/swells, deviation in voltage, frequency, total harmonic distortion (THD), and power factor. A battery energy storage system (BESS) is integrated with the micro-grid for back-up supply. The NARX-NN tunes the controller operation with dissolute, reliable, and steady simulation of MGs because of consideration of multiple factors with complex calculations. This work proposes an NARX-based controller for enhancing the power quality of MGs and considering multiple sets of complex calculations. The ANN is recognized with substantial test environments in re-training the NARX neural network to evaluate the dissimilar type of operation. The suggested controller is simulated and authenticated in an accurate three-phase AC-based MG assembly along with the impedance parameter associated with the line, switching delay, and demand response analysis. The entire structure of this research paper has been divided into the following sections. Section 2 deals with the problem statement of the proposed model. The organisation of the model is described in Section 3 along with the description of various MG components. The proposed model approach, small scale, and realistic MG constructions are given in Section 4. Section 5 represents the result analysis for the miniature and complex MG assemblies with and without the influence of line impedance, switching interruption, demand response, and off-nominal situations. Section 6 deals with the conclusion and scope of current research work in future.

2. Problem Definition

The utilization of power electronic equipment, switching devices, and reactive loads leads to the disturbances in normal sinusoidal patterns of current and voltage, giving rise to the poor quality of power. Power electronic equipment such as D-STATCOM, automatic voltage regulator (AVR), unified power quality conditioner (UPQC), etc., are used to maintain the power quality issues at both load and source end. This equipment helps maintain power quality issues and is coupled to the network at the PCC, which in alternate ways supply the compensating reactive power at the PCC to improve unstable non-sinusoidal voltage and current waveforms. According to IEEE Std. 1250–2011, the power quality factors such as voltage deviation must be maintained within acceptable range within 10% of the nominal limit in MG system. The power factor must be equivalent or more than 0.9 as given in IEC 60831-1/2 standard. The voltage/current harmonic is limited to within 5% as denoted in IEEE Std. 519–2014. The frequency distortion must be within IEEE Std. 1159–2009. These limitations demand a consistent and efficient controller, which must be installed to preserve power quality comprehensively. The factors taken into consideration for evaluating power quality issues in the three-phase AC MG model are given below.

2.1. Voltage Sag/Swell

The root mean square (RMS) value of voltage can be represented mathematically as given in Equation (1).
V i t h r m s = 1 M j = 1 i t h + M V j 2
where ‘ M ’ denotes number of samples, ‘ V j ’ denotes ‘ J t h ’ voltage waveform, and ‘ V i t h R M S ’ is the RMS voltage of ‘ i t h ’ sample. It is considered that the simulation of at least a single cycle must be completed as a running average window is taken before measuring the output as it gives the accurate value.
During both sag and swell conditions of voltage, the RMS value diminishes during period of 1/2 sequence to 1 min with distinctive magnitude of 0.1 to that of 0.9 per unit and the potential difference upsurges from 1.1 to 1.8 per unit. The status of sag and swell is decided by the sample ‘ V j ’ taken from the samples of logged waveform. Among conventional power quality issues, voltage sag/swell conditions denote the most common issues for maintaining the PQ of the power network. In the off-grid approach, the power quality improvement is performed by means of a NARX regulator through the impact of voltage-sag and voltage-swell conditions. A LLL-G fault is created at time 0.05 s to 0.1 s to study the voltage sag condition and a three-phase dynamic load is connected at time 0.15 s to 0.2 s to create the voltage swell condition for the validation of proposed scheme and investigation of the influence of sag and swell conditions on power quality. The load impedance is varied for initiating a three-phase disturbance condition by varying and desynchronizing line voltages and phase angles.
For example,
[ V a , V b , V c ] = [ 400 , 200 , 450 ] / 3 ,   [ φ i a , φ i b , φ i c ] = [ 0 ° , 60 ° , + 180 ° ]
where V a , V b , a n d   V c denote voltages associated with phases a, b, and c, respectively, and φ i a , φ i b , a n d   φ i c are the angles of phase a, b, and c, respectively.

2.2. Total Harmonic Distortion (THD)

The THD is the fraction of the RMS value of harmonic voltage or current to that of fundamental waveform, which can be represented mathematically as Equation (3).
T H D v = i = 2 N V i V 1 = V r m s 2 V 1 2 V 1
Similarly current harmonics can be written as
T H D I = I r m s 2 I 1 2 I 1
where ‘ T H D V ’, ‘ V i ’, ‘ V r m s ’, ‘ V 1 ’, ‘ I r m s ’, ‘ I 1 ’, and ‘ T H D I ’ are harmonic distortion associated with voltage.
i t h The constituent of voltage, RMS value of voltage, fundamental voltage component, RMS magnitude of current, fundamental constituent of current, and THD are associated with current, respectively.

2.3. Power Factor (PF)

The PF is the proportion of the active power engrossed by the load to that of apparent power streaming in the network. The reactive power value is determined as given in Equation (4) and the real working PF is attained as given in Equation (5).
k var i d e a l = k var × sin [ cos 1 ( P F ) ]
P F n e w = cos [ tan 1 ( k var i d e a l k var a c t u a l ) k V A × P F ]
where ‘ K var i d e a l ’ denotes the ideal magnitude of the power factor correction (PFC) capacitor, ‘PF’ denotes the present power factor of the network, ‘ K var a c t u a l . ’ denotes real value of the PFC capacitor, and ‘ P F n e w ’ signifies the required power factor.

2.4. Frequency

The application of the BESS with the PV array preserves the load frequency nearer to 50 Hz as given in Equation (6)
Δ f = ( Δ P P V + Δ P B E S S )
where represents the frequency droop coefficient and it is anticipated as 5% and Δ f denotes change in frequency. ‘ Δ P P V ’ and ‘ Δ P B E S S ’ denote alteration of power because of PV array and change in power due to BESS, respectively. The elimination of root causes of power quality issues is not feasible but it can be enhanced by using advanced methods such as CPDs and power quality enhancing devices. So in this paper a nonlinear auto regressive exogenous input neural network (NARX) method is suggested and simulated effectively by sustaining voltage dips, THD, PF, system frequency, and destabilising of the AC MG. The proposed MG consists of PV panels, a fuel cell, a wind turbine, and a battery system.

3. System Design

The MG organization consists of a PV array, a PEMFC fuel cell, a wind energy resource, a BESS, an inverter, line impedance, loads, and a utility grid as shown in Figure 2. The miniature MG prototype shown in Figure 2 can be projected to a complex MG assembly as given in details in Section 4.1.3. The planning, organization, and regulation of the MG are given below. The components of the MG are designated in the Section 3.1, Section 3.2, Section 3.3, Section 3.4 and Section 3.5.

3.1. PV Panel Model

The PV panel consists of PV arrays and PV modules which in turn consist of basis units of PV system called the solar cells. The PV cells are connected in series and parallel to form a PV module. Several PV modules are further combined together to form a PV array. In this study a 2 KW PV array is taken [31].

3.2. Fuel Cell Model

The basic operation of a proton exchange membrane fuel cell (PEMFC) includes the conversion of chemical energy into electrical energy. It consumes hydrogen ( H 2 ) as input and an oxidizer ( O 2 ) . The PEMFC can be divided into two parts [32,33]: (1) ANODE, where the fuel is supplied at certain partial pressure. The supplied fuel goes through the electrode before it touches the positive electrode to produce protons and electrons through a catalytic reaction. The production rating of the fuel cell as a DER in the proposed model is 1 KW.

3.3. Wind Energy Model

The dynamic kinetic energy associated with wind is first transformed to rotational energy by wind mills and, through gear box movement, is matched with the speed of the turbine and generator. The generator converts the mechanical energy of turbine to electrical energy. The power rating of the wind turbine is 1 KW [34].

3.4. Battery Energy Storage System (BESS) Model

A battery energy storage system (BESS) is a technology involved for the electric power storage by the utilization of batteries which can store power during ideal conditions and can provide electric power during power deficit scenarios. The most common type of BESS utilized for PV array to yield maximum capability of battery are lead–acid batteries [35,36]. The charging and discharging of battery is adjusted at its state of charge (SOC) at 80% and 20%, respectively.

3.5. Inverter Model

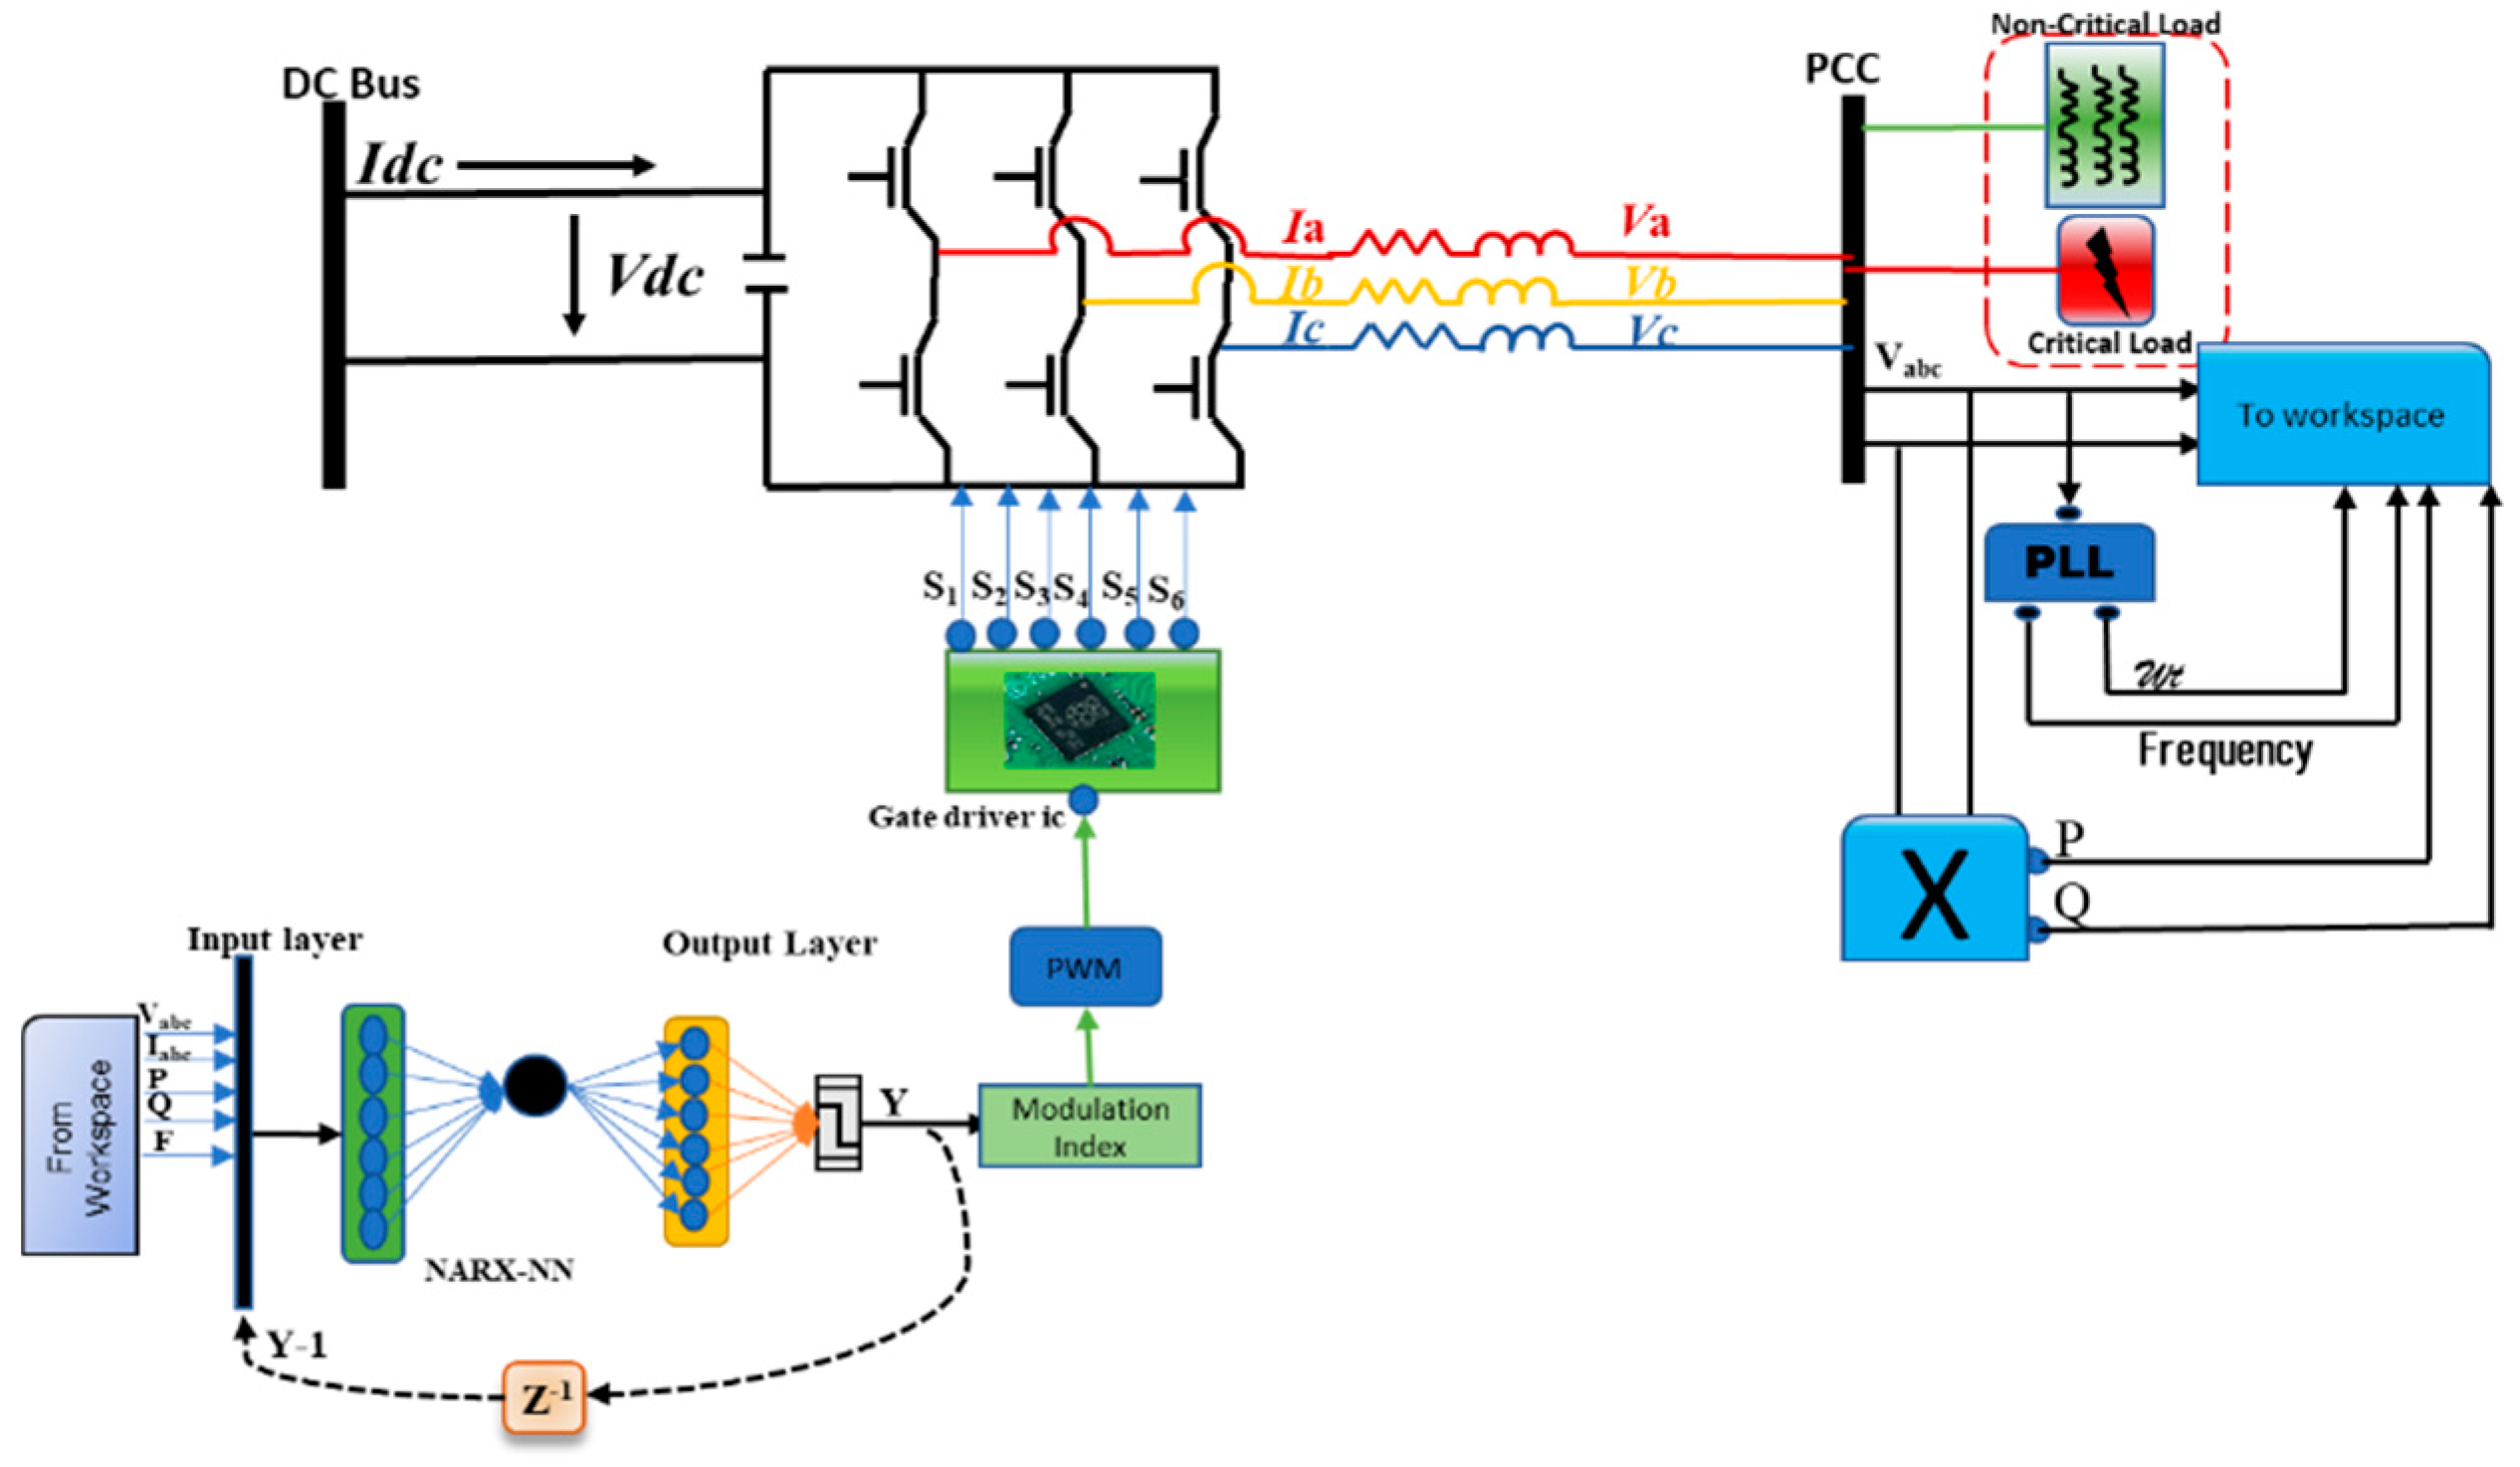
The modelling of the three-phase inverter can be employed by means of a three-phase bridge inverter that comprises six switching devices associated in a bridge alignment. The simulation of the three-phase bridge converter is performed by forced-commutated insulated gate bipolar transistor (IGBT) diode device. The parameters chosen are, (1) snubber resistance ‘ R s ’ to be 5 K Ω and (2) capacitance ‘ C s ’ taken as infinite which provides a resistive snubber circuit. The forward voltages are designated as 0, the internal resistance ‘ R i n ’ of the IGBT-diode is taken as 1 m Ω . The design of the proposed three-phase inverter controller involves four main parts including a three-phase phase locked loop (PLL) unit, a voltage direct current (VDC) controller unit, a current regulator unit, and a pulse-width modulation (PWM) unit as given in Figure 2. The line to line voltage ‘ V a b c ’ and the line current ‘ I a b c ’ are supplied to PLL unit which is essential for the synchronization and measurement of current and voltage. The ‘ a b c ’ components and the angle of phase ‘ ω t ’ for reference signal are converted to the corresponding ‘ d q ’ parameters through the PLL. The DC voltage output ‘ V d c ’ of the solar panel is matched with reference voltage ‘ V d c r e f ’ in the VDC controller which limits the real current component ‘ I d r e f ’ as reference-signal by means of the PID regulator. The current regulator block is supplied with the output signals of the PLL block and VDC regulator block and produces ‘ V d c o n v ’ and ‘ V q c o n v ’ through its internal PID controller. This converter produces active power if ‘ I d ’ is positive in inverter mode of operation and engrosses reactive power in case of positive ‘ I q ’ in inductive mode. The measured variables ‘ V d c o n v ’, ‘ V q c o n v ’and ‘ ω t ’ from current regulator and PLL units correspondingly are converted back to ‘ a b c ’ reference component ‘ U a b c r e f ’. This signal is supplied to the PWM unit after crossing a unit delay which grips and delays ‘ U a b c r e f ’ as a distinct passage by the indicated sampling period during the simulation of the model. The firing pulses to the IGBT are produced by the PWM generator through the reference voltage ‘ U r e f ’ again after crossing a delay unit as presented in Figure 3. Table 1 denotes the switching logic for the inverter.

4. Proposed Methodology

In the proposed model, the power quality is improved by regulating the gate pulses to the inverter with the help of the proposed nonlinear auto regressive recurrent exogenous input (NARX) method. The simulation is performed using a 10 kW, AC micro-grid to supply the critical load (CL)-(4 kW) and non-critical load (NCL)-(6 kW). Most of the required mandate is provided to the critical load particularly in off-grid mode, if the utility grid is aborted or detached for maintenance. The load side is detailed as 10 kW of active power, 7.5 kVAR of reactive power, 400 Volt, and 50 Hz frequency. The modelling of proposed miniature/complex MG with additional line impedances and loads are discussed in Section 4.1. The description of a NARX-based approach is presented in Section 4.2 which includes the mathematical approach and application. The traditional PID and fuzzy-PID-based control methods are presented in Section 4.3.

4.1. MG Modelling

Three cases have been considered for verifying the efficacy of the proposed control approach and are discussed in Section 4.1.1, Section 4.1.2 and Section 4.1.3, respectively.
Case 1. Miniature MG model.
Case 2. MG with consideration of impedances of the line.
Case 3. Complex MG assembly.

4.1.1. Miniature MG Model

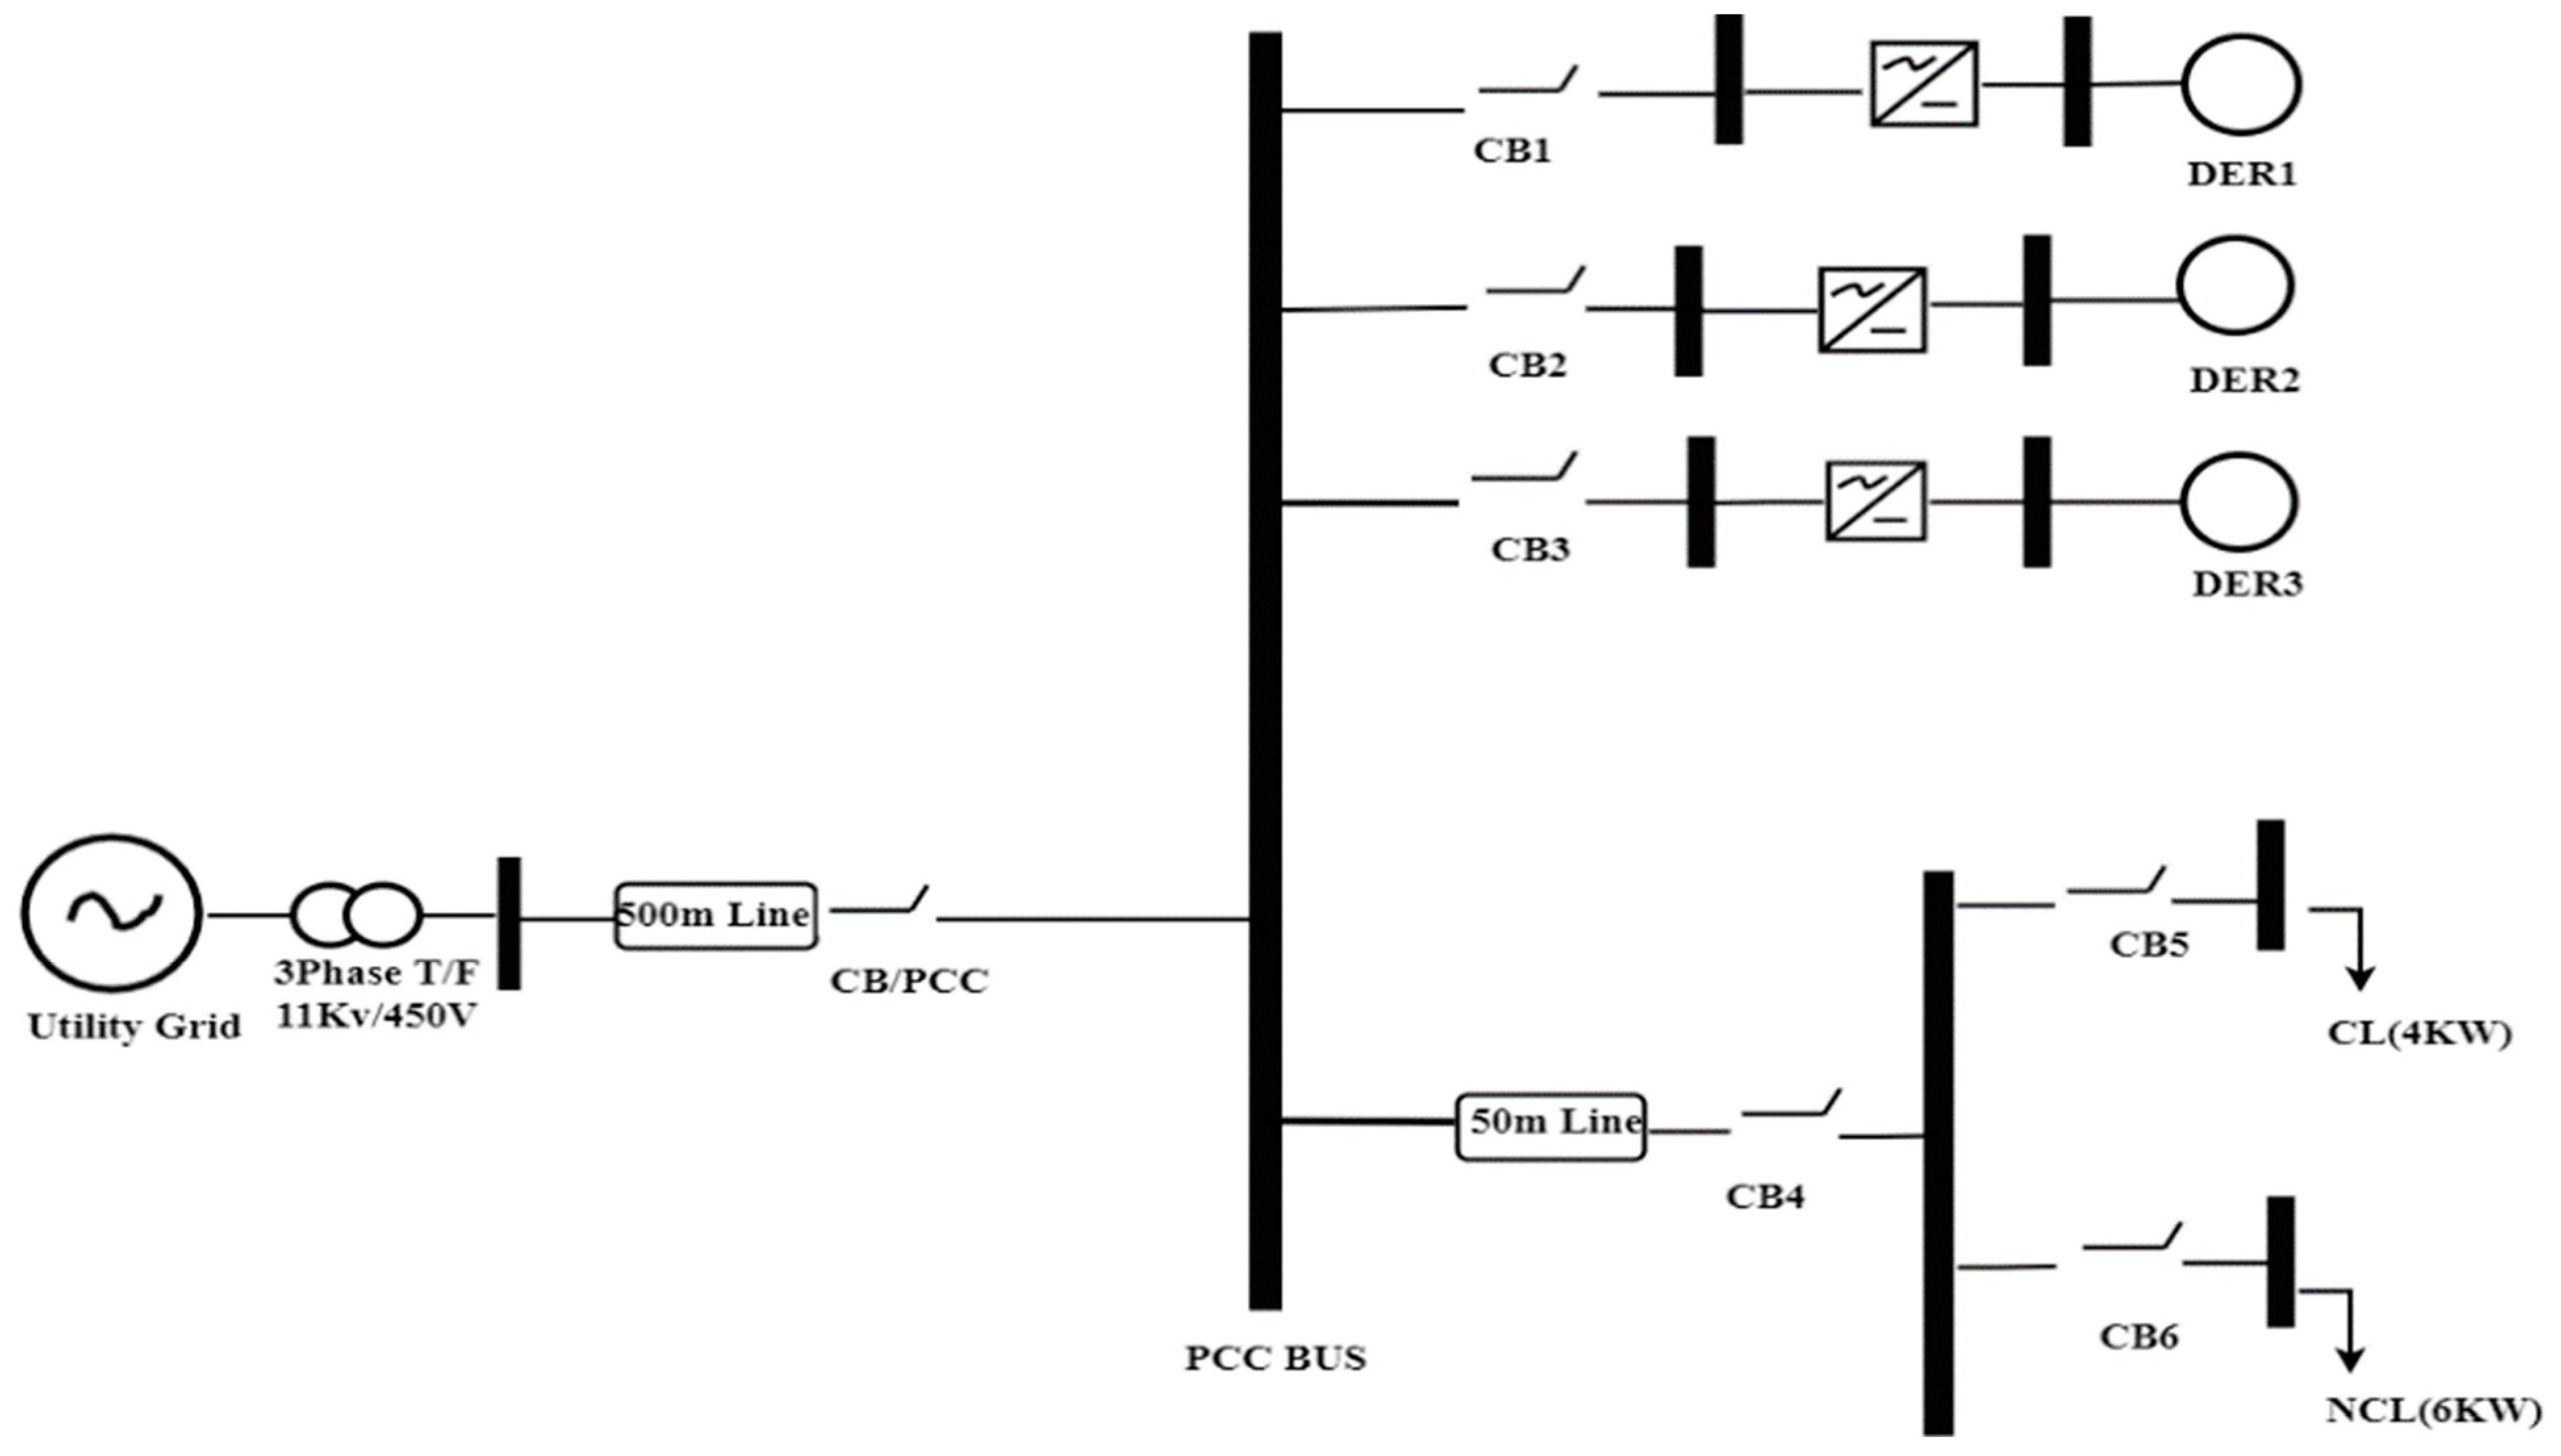
The miniature MG comprises three DERs, one solar panel, a fuel cell, and a wind turbine connected at the PCC with the help of three-phase circuit breakers. The three DERs, the two critical and non-critical loads (4 kW and 6 kW) are connected to the grid at the PCC. The loads are planned so that any load can be coupled or separated from the utility grid as per convenience. Again, the critical load bus is supplied by a local BESS for preserving uninterrupted supply if a grid failure occurs at DER1/DER2/DER3. The combination of more than one distributed generator having the same rating produces high level harmonics in the network in the islanded mode of operation. It is because of the application of power electronic converters that produce disturbances and harmonics in current and voltage. The system parameters for the suggested MG assembly are given in Table 2. The NARX controller is given in Figure 2 interconnecting the three DERs, utility grid, and BESS and bus supplying load with their corresponding breakers (CB) named as CB1, CB2, CB3, CB4, and CB5. The utility grid is positioned at a remoteness of 500 m after the PCC and the chief load bus (LB) is positioned at a remoteness of 50 m from the station bus (SB). A BESS is provided for the proposed model and the solar panels and acts as an emergency backup source in case of source failure. The controller observes the uninterrupted power flow of DER1, DER2, DER3, UG, BESS, SB, LB, PCC, and load demand. For low voltage (LV) MGs, the permissible bounds of voltage variation are inside 10% of the ideal value according to IEEE Std. 1250–2011. The acceptable fluctuation in system frequency is 0.1 Hz according to IEEE Std. 1159–2009. The inoculation of harmonics is mainly dependent upon non-linear loads in the system. The harmonics introduced in the system are non-linear in the micro-grid system. Hence, the controller has to sustain harmonic distortion within the tolerable limit of 5% according to IEEE Std. 519–2014. Further, PF is similarly reflected as a main factor of the power quality at load side but literature review suggests that the PF is not always assessed for the power quality. The tolerable limit for PF as mentioned in IEC 60831-1/2 standard must be more than or equivalent to 0.9 else inadequate PF may harm the equipment due to disproportionate streaming of active and reactive power.

4.1.2. Addition of Line Impedance

The above-mentioned MG system along with the line impedance is investigated and the performance of the micro-grid and its power quality issues are determined in this section. The structure of the miniature micro-grid is shown in Figure 4 allowing for the supplementary influence of line impedance parameter on MG operation. The magnitude of the line impedance can be estimated by calculating the R: X value in low-voltage power systems. A review of the literature suggests that the R: X ratio is more in low-voltage distribution systems contributing the load. The magnitude of resistance of line and reactance of line are taken as 0.642 Ω/km and 0.083 Ω/km correspondingly for low-voltage distribution network [37]. The line impedance can be calculated as per line lengths which are given in Table 3. The 4 kW (critical load) and 6 kW (non-critical load) are located at line remoteness of 50 m (0.0321 + j0.00415 Ω) and 100 m (0.0642 + j0.0083 Ω), respectively, and are presented in Figure 4. The solar plant and fuel cell generator are far nearer to PCC through SB. The central load bus with capability of 10 kW is coupled with the station bus, with breaker CB4 having a line distance of 50 m as presented in Figure 4.
The miniature MG shown in Figure 4 has been analyzed with the inclusion of line impedance on power quality factors, allocation of power, and loss of power through the grid and DERs. Again, the influence of the switching delay on power quality factors is also discoursed in Section 5.2. Table 3 represents the computation of line impedance according to the length of the line.

4.1.3. Complex Micro-Grid

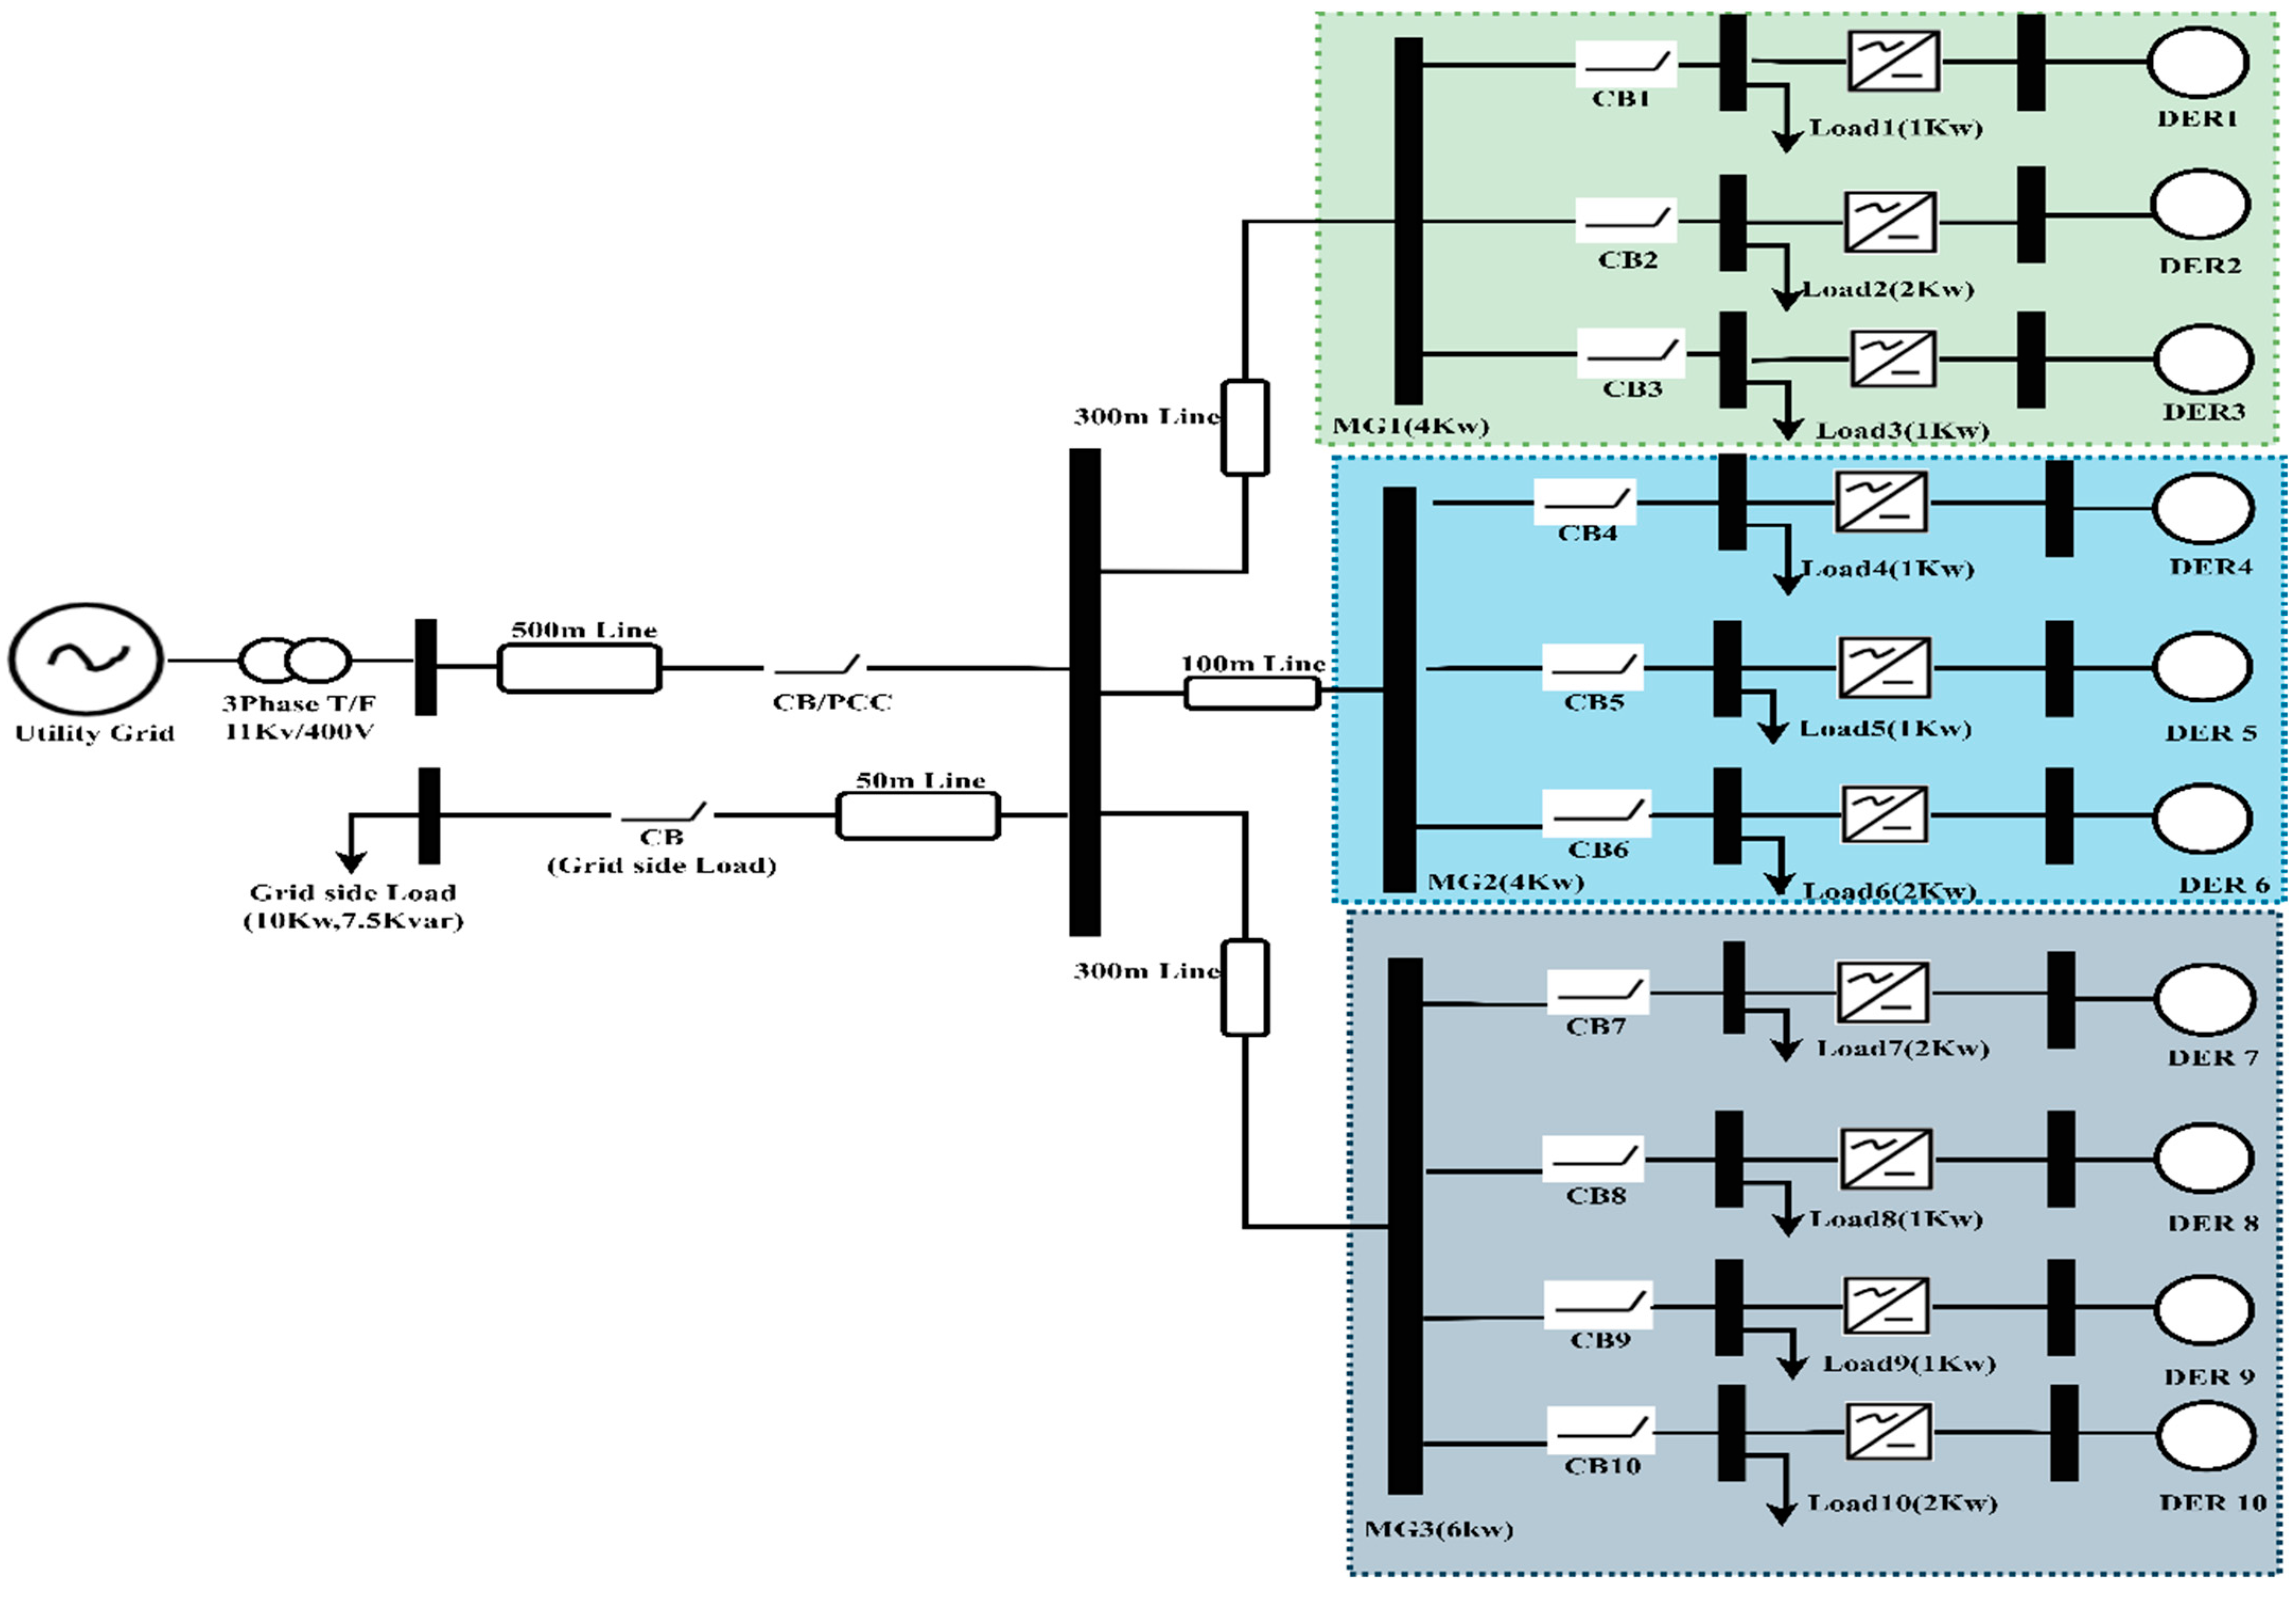
The complex MG model can be achieved by increasing the actual distribution network parameters such as generation resources, line impedances, bus-bars, consequence of loads on generating components, inverters, etc. For the practical feasibility of the proposed controller, it is necessary to expand the miniature MG model to a realistic complex MG assembly. The complex micro-grid construction and planning is designed with the help of many distributed generators and loads which permit a wide range of operation for the MG. The distribution of power, failure of DRs, influence of line impedance on power quality, and switching delays may be verified in several scenarios. The maintenance of power equilibrium between generation and consumption allows for the evaluation of the demand response. One or more DERs are helpful for supplying the consumers as presented in Figure 5. The complex MG construction is the comprehensive form of miniature MG, as discussed in Case 2. The dispersal system is partitioned into multiple micro-grid named as MG1, MG2 and MG3 having capacity of 4 kW, 4 kW and 6 kW respectively. The gross installed capability of proposed MG is 14 kW which is coupled with the main grid through PCC as represented in Figure 5. The islanding mode of operation for Case 3 can be commenced by separating the utility grid from the PCC while functioning the local grids individually or together. A maximum value of 14 kW load can be delivered through the arrangement of DERs during islanded mode condition.

4.2. Description and Implementation of Proposed NARX-NN Technique

Nonlinear auto regressive exogenous input recurrent neural network is a kind of neural network which recognizes time series data as input for a nonlinear system [38,39]. The NARX-based controller is more accurate and robust than other traditional neural network systems because of its recurrent nature where the NARX takes input from the output value or takes the desired output values along with the input variables. Further, it possesses another great advantage when compared to all the classical neural network systems by allowing more input variables due to the accuracy of the system in predicting the fault. It becomes relatively easy to identify, understand, and predict the power system disturbances. Exogenous input recurrent neural network also requires a training technique such as Levenberg—Marquardt training method [40], scaled conjugate method [41,42], and Bayesian regularization method [43]. The Levenberg—Marquardt algorithm is the best suited training algorithm when compared to the other two because of its fast back propagation nature through which it can train large amounts of datasets and quickly update the system weights.

4.2.1. Mathematical Design of NARX-NN Model in Micro-Grid

The NARX recurrent neural network is defined by a class of discrete time nonlinear systems. The ultimate nature of a dynamic system is to maintain the instantaneous values of the input signal with respect to its past values to obtain a better output. The proposed controller satisfies the above criterion in a robust manner. The mathematical design of NARX is given as:
y ( t ) = f ( u ( t n k ) , u ( t n k 1 ) , u ( t n k n u ) , u ( t n y ) )
In the above equation ‘ y ( t ) ’ and ‘ u ( t ) ’ denote the output and input data corresponding to the system at a discrete time step where n y 1 ,   n u 1 ,   n u n y represent the input and output memory orders or delay, n k 0 is the input sample count later which the output is influenced by the input, and ‘ f ’ is considered as a nonlinear mapping function. When the mapping function is approximated by a multi-layer perceptron (MLP), the subsequent output is identified as a NARX neural network. Hence, a NARX network consists of a MLP that takes as input a window of past independent (exogenous) input (5 inputs have been considered such as ( V a b c , I a b c , P r e f , Q r e f , F s w i t c h i n g ) and past output as recurrent input such as ( S w 1 , S w 2 , S w 3 , S w 4 , S w 5 , S w 6 ) ) and then computes the instantaneous output. It is probable to familiarize ‘ x ’ as the vector of the state variables, so that ‘ x i ( t ) ’ is the i t h state variable in the proposed NARX system. Then the states of NARX given by a set of two tapper delay lines as ‘ n u ’ taps as the input values and ‘ n y ’ taps as the output values are instantaneously updated according to the law described as:
x i ( t + 1 ) = { u ( t n k ) i = n y ( t ) i = n u + n y x i + 1 ( t ) 1 n u o r n u < i < n u + n y
Consequently, at the time ‘t’ the tap corresponds to the values specified in Equation (11)
x ( t ) = [ u ( t n k 1 ) u ( t n k n u ) , y ( t 1 ) y ( t n y ) ]
The organization of MLP structure consists of two layers a hidden layer and an output layer. The n k nodes of the hidden layer execute the function y .
Z i ( t ) = x i ( t + 1 ) = σ [ j = 1 N a i , j x i ( t ) b i u ( t ) + c i ]   Where i = 1 , N k
where a i , j , b i , and c i denote constant real weights, ‘ σ ’ represents the sigmoidal function and ‘N’ denotes the quantity of state variables.
At last the output layer of Proposed NARX model can be written as:
y ( t ) = j = 1 N k ω i j Z ( t ) + ω
The sigmoidal function ‘ σ ’ denotes the activation function of the hidden neuron layer, which estimates the heavy side step function to access if the input is beyond or underneath a specified value. The activation function associated with the output neuron should be linear for a continuous desired output.

4.2.2. Steps Taken to Calculate the Optimum Weight

Step 1: Calculate Z i ( t ) at iteration; ‘ i ’ represent the number of iterations.
Step 2: Select a suitable value of x i ( t + 1 ) say x i ( t + 1 ) = u ( t n k ) .
Step 3: Solve Equation (10) for optimum values of taps on the input values and taps of the output value.
Step 4: If 1 i n u or n u < i < n u + n y then point x i + 1 ( t ) else go back to step 3.
Step 5: Compute equation (11) if the solution contains suitable values of a i , j , b i , c i real weights, then execute the activation function else go back to step 3.
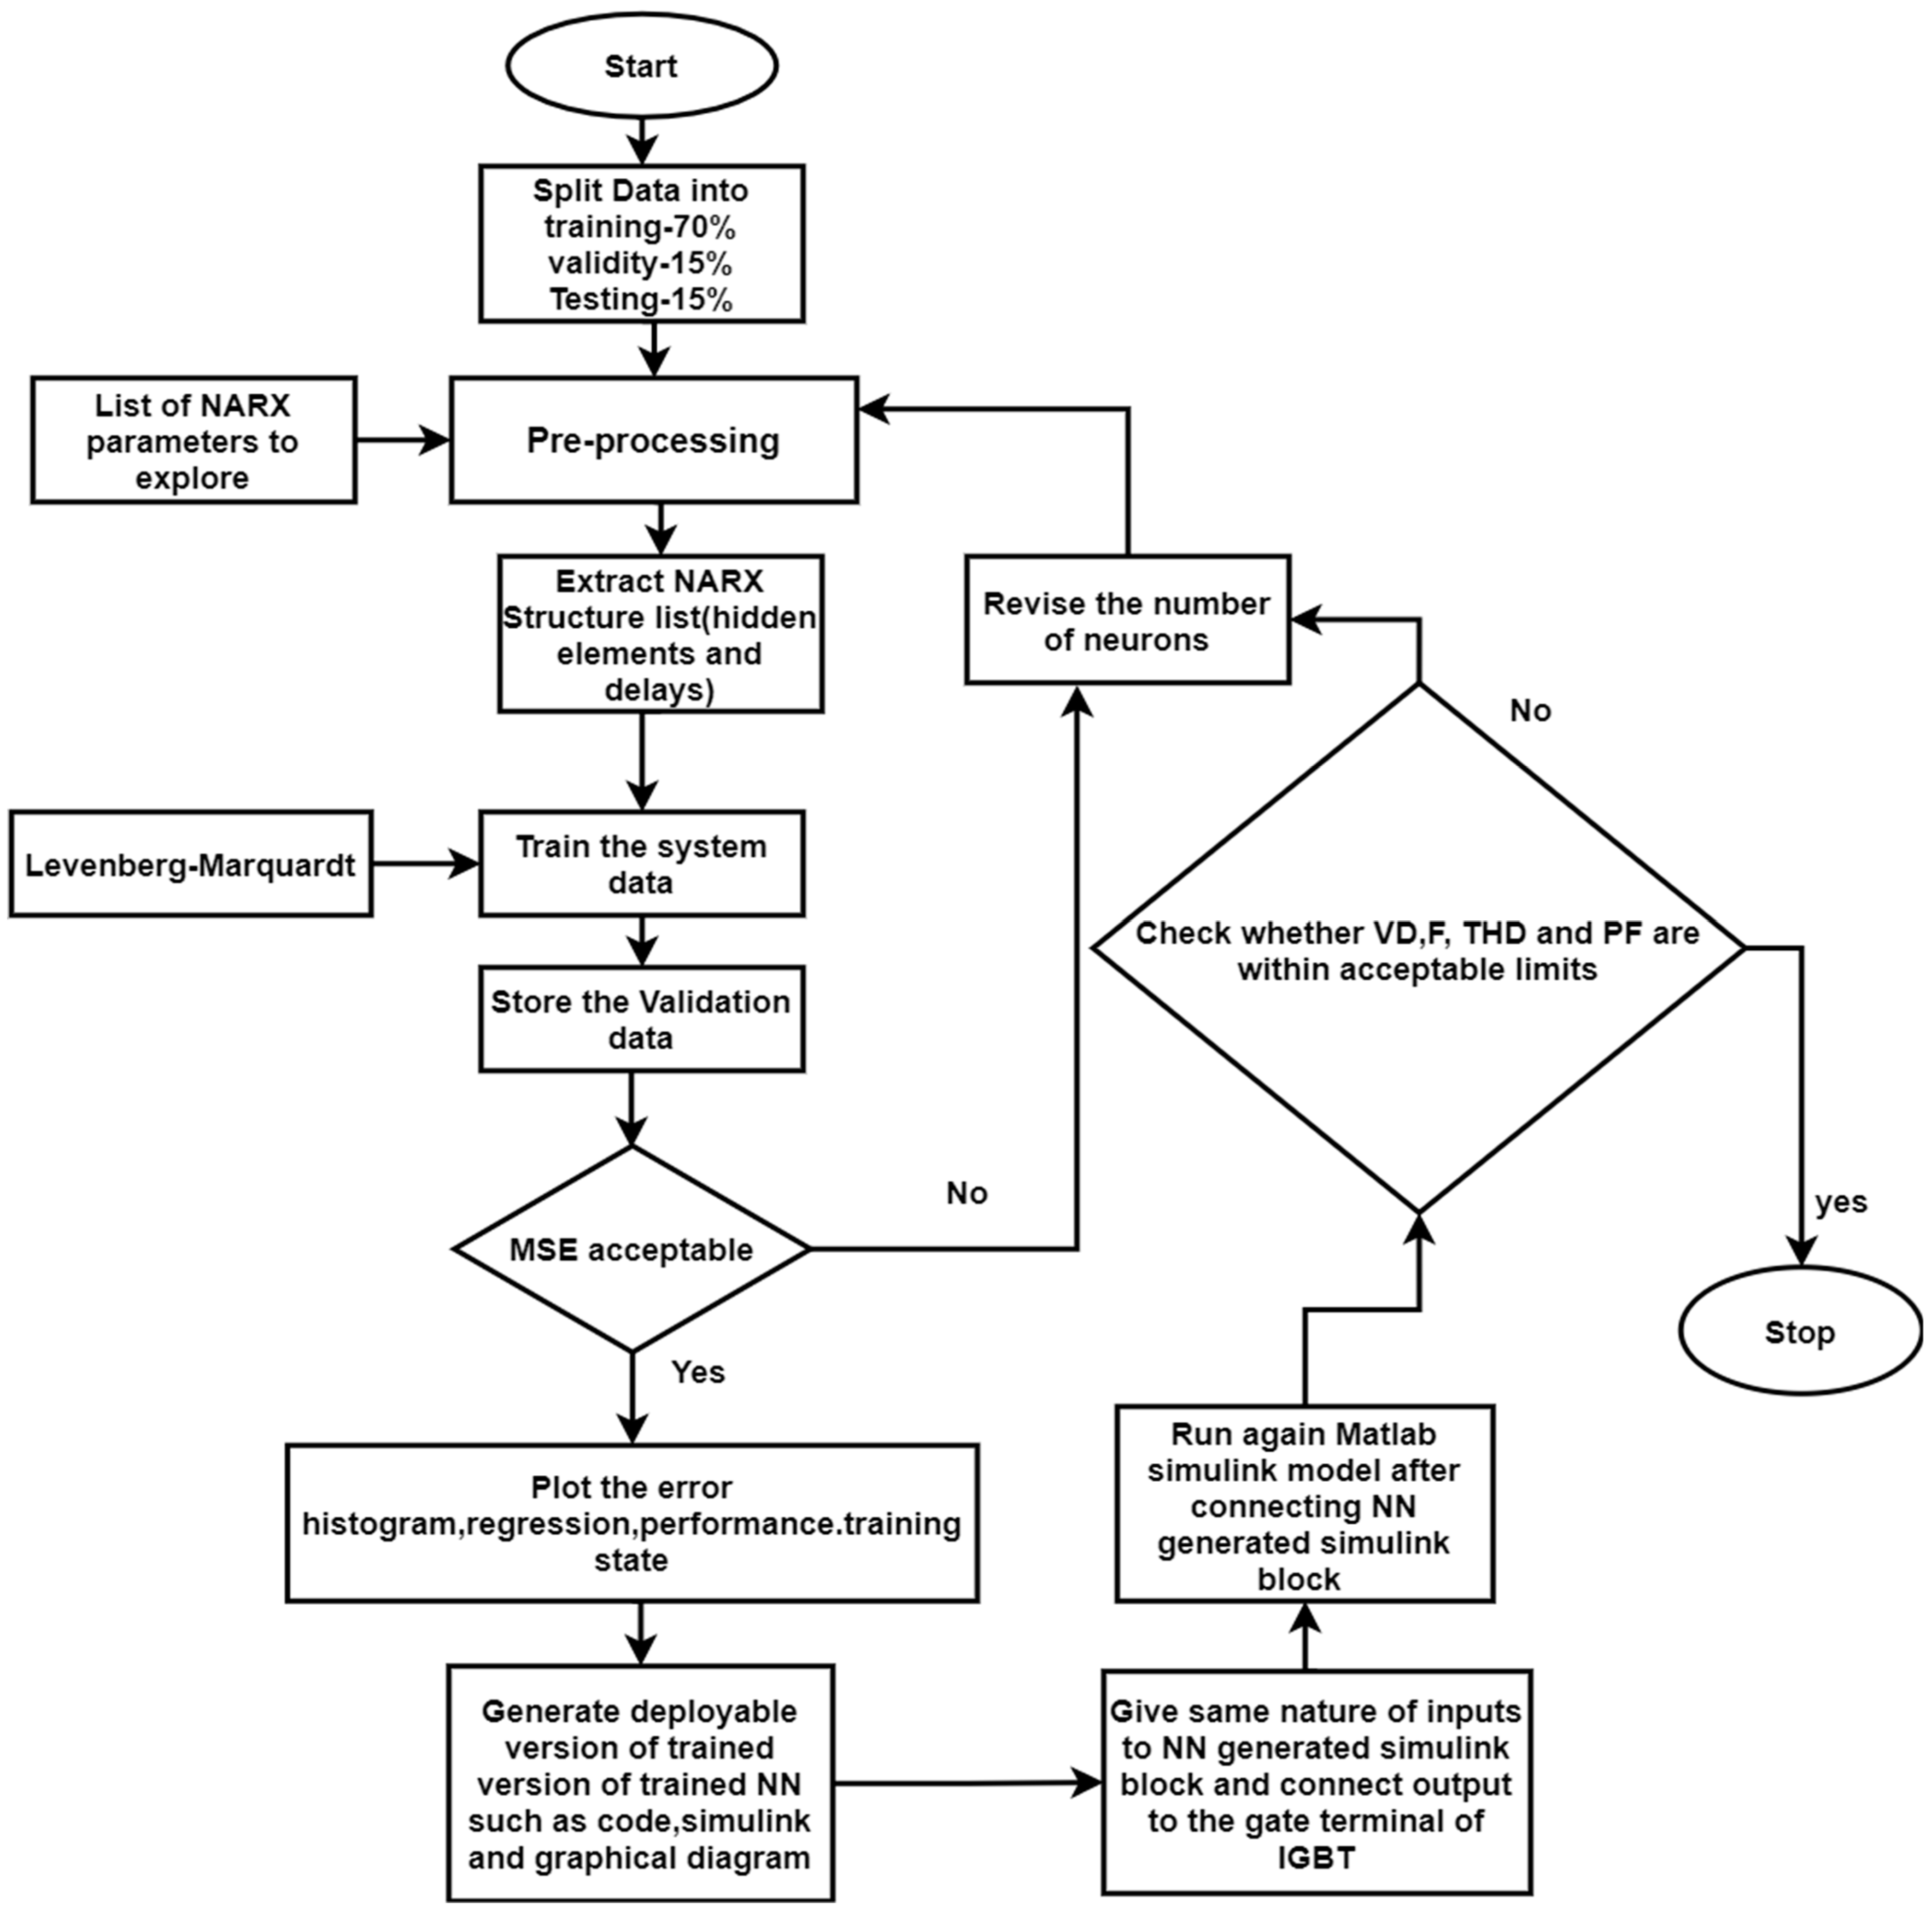
Figure 5 denotes the algorithm for the working of the proposed NARX recurrent neural network, which is used to improve the power quality issues in this model. The flowchart given in Figure 6 indicates an auto regressive NN established with the back propagation NN technique for the whole process, which improves the power quality issues of micro-grid. The proposed model helps to preserve the fluctuation of voltage, frequency, THD, and PF within the prescribed limits.
In the proposed MG model shown in Figure 7a the power quality is preserved by taking 5 elements as input and 6 elements as outputs, respectively, for simulating NARX. The proposed NARX model is tested and trained with the grouping of 159201 samples as input data vector V a b c , I a b c , P r e f , Q r e f , F s w i t c h i n g and the similar 159201 samples are extracted from MATLAB workspace while simulation MG model shown in Figure 1. The 6output data (SW1, SW2, SW3, SW4, SW5 and SW6) are taken out from a gate driver circuit as depicted in Figure 1. The selected elements from the miniature MG Simulink model have been revealed in Figure 7b. The gate of the inverter circuit is commanded as presented in Table 1. In proposed model, the acceptable optimal solution is obtained with 10 hidden layers of neurons the hidden layers are chosen in between the size of input and output layers and the hidden layer neurons maintain two-third ratio. After testing the NARX with satisfactory mean value of squared error (MSE), a NARX neural network block is generated. This NARX block is connected to the main MATLAB/Simulink MG as presented in Figure 7b. The yield of the NARX block is nourished to the gate electrode of Wind, PV, and fuel cell inverter.
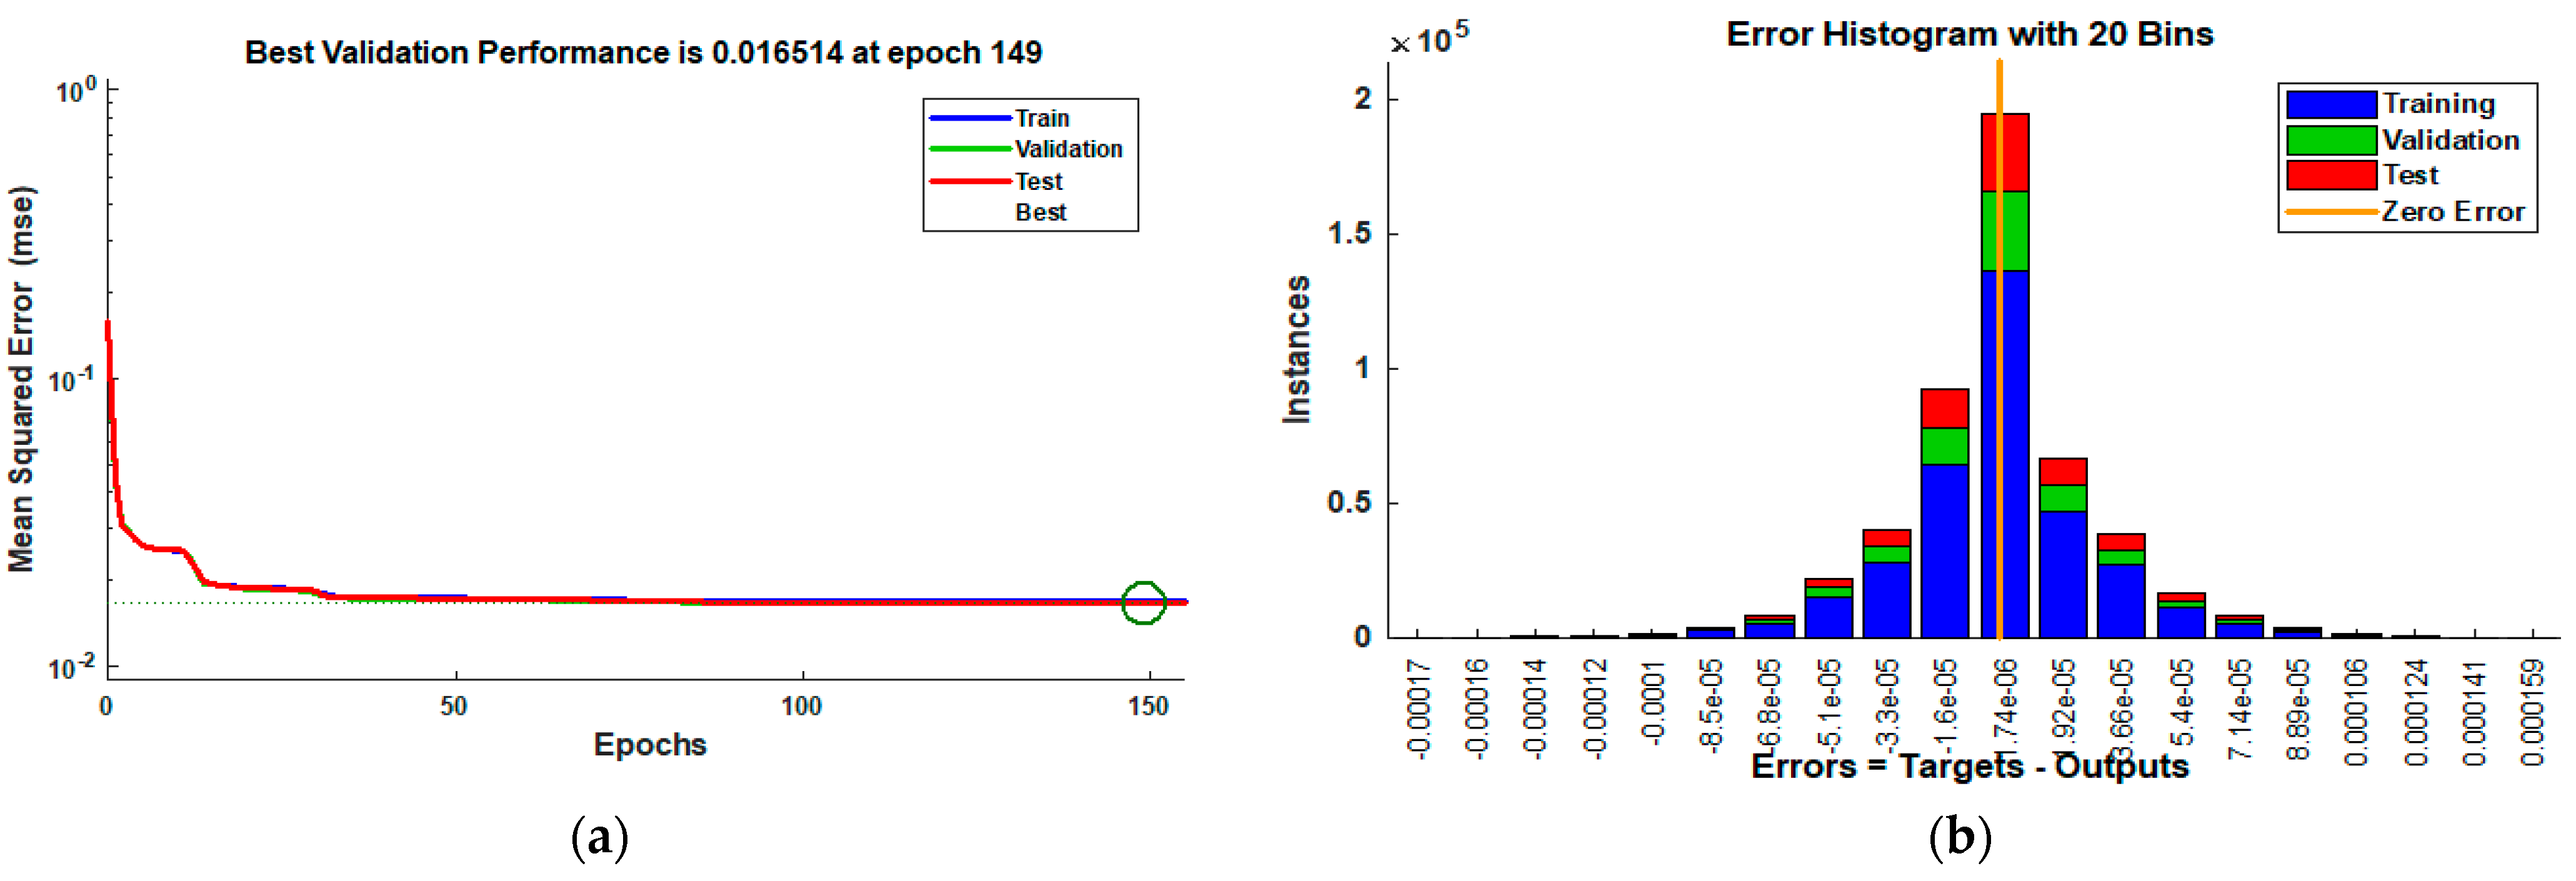
The NARX method is tested and trained and the optimized validation performance is found out to be 0. 01651. This process took 149 epochs as given in Figure 8a. The histogram of MSE is given in Figure 8b, displaying an optimal error of 1.74 × 10 6 The number of samples and MSEs associated with training, validation, testing, and overall system are given in Table 4, which approves the practicality of produced NARX technique in current research work. The regression plot for the proposed model is given in Figure 8.

4.2.3. ANN Verification by Various Test Scenarios

The training of NARX needs constant operational architecture, while alteration in the functioning scenarios demands training of the NARX again, which is computationally dense and time consuming. It is very challenging to apply NARX for a certain test condition in MG dynamics training set in MGs under different scenarios. The design of the NARX model is performed with 10 hidden layers where input data are divided as training 70%, validation 15%, and testing 15%. In Table 5, the highlighted font parameters denote the better dataset covering all the power quality factors afterwards multiple training of NARX through dissimilar test scenarios. In Figure 9. shows that the proposed NARX-NN gives best regression.

4.3. Conventional PID, Fuzzy-PID and NARX-NN Controllers

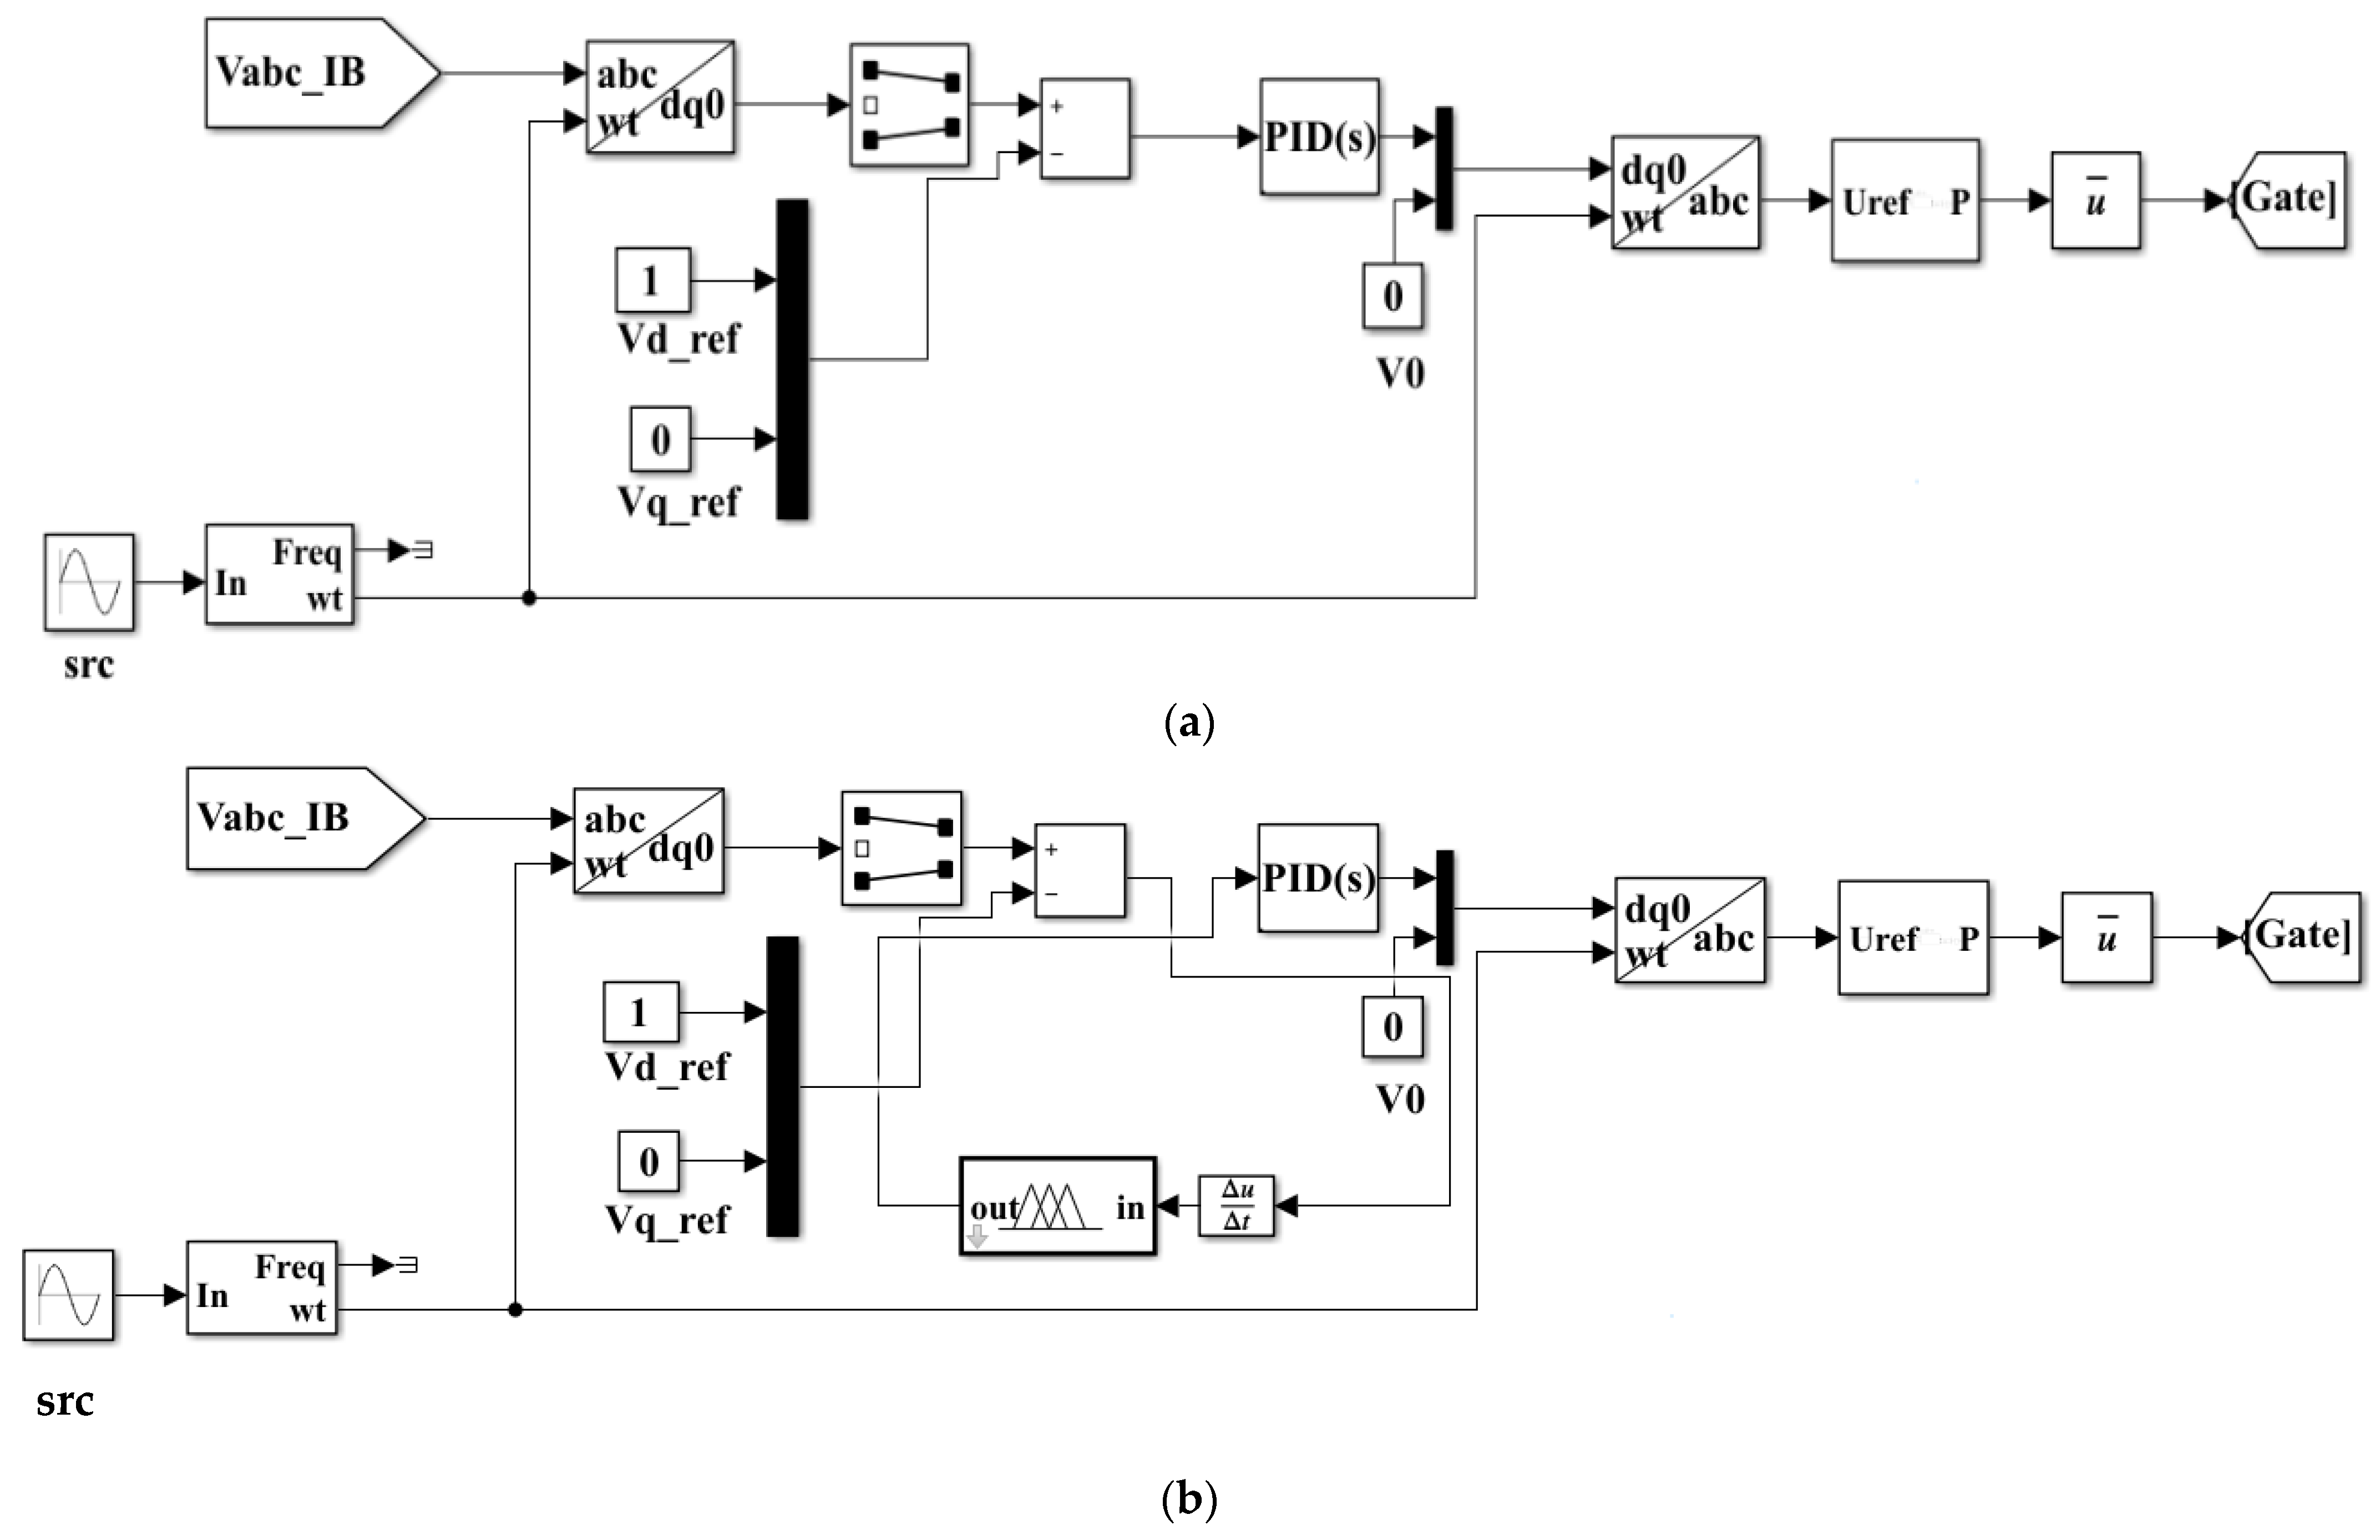
The MG model is simulated with PID, fuzzy-PID, and new NARX-based controller for its practicability in MG working and regulation. The grid-connected PID-controller can enhance the power quality of MG under standard and distressed working circumstances [44]. A fuzzy-PID regulator is employed to control frequency and voltage of a doubly fed induction generator connected to a DC micro-grid [45]. The artificial neural network (ANN)-based MG central controller (MGCC) is proposed in [10] for the improvement of power quality issues such as voltage sag/swell, PF, THD, and frequency. Here, more than one PQ issues are taken as factors in a MG associated with two PV panels as distribute resources (DER). The PID and fuzzy-PID-based controllers are given in Figure 10a,b.

5. Results and Discussion

The projected model is verified in Matlab/Simulink for multiple cases with different environments of the proposed MG model. The outcomes are compared for miniature MG model with and without line impedance and complex MG model in Section 5.1, Section 5.2 and Section 5.3, respectively.

5.1. (Case 1) Miniature MG Model

The proposed AC MG is verified for the evaluation of the power quality issues in grid-coupled as well as off-grid operations for sustaining the load of 10 kW and 7.5 kVAR (inductive). The outcomes thus obtained are shown for the following scenarios.
Scenario 1. Power quality improvement using deviation of voltage (VD), distortion of harmonic (THD), frequency (F), and power factor (PF).
Scenario 2. Power quality improvement using sag/swell and unbalanced condition of voltage.
Scenario 3. Local backup of power for critical load.

5.1.1. PQ Improvement through Voltage Deviation, Total Harmonic Distortion, Frequency, and Power Factor

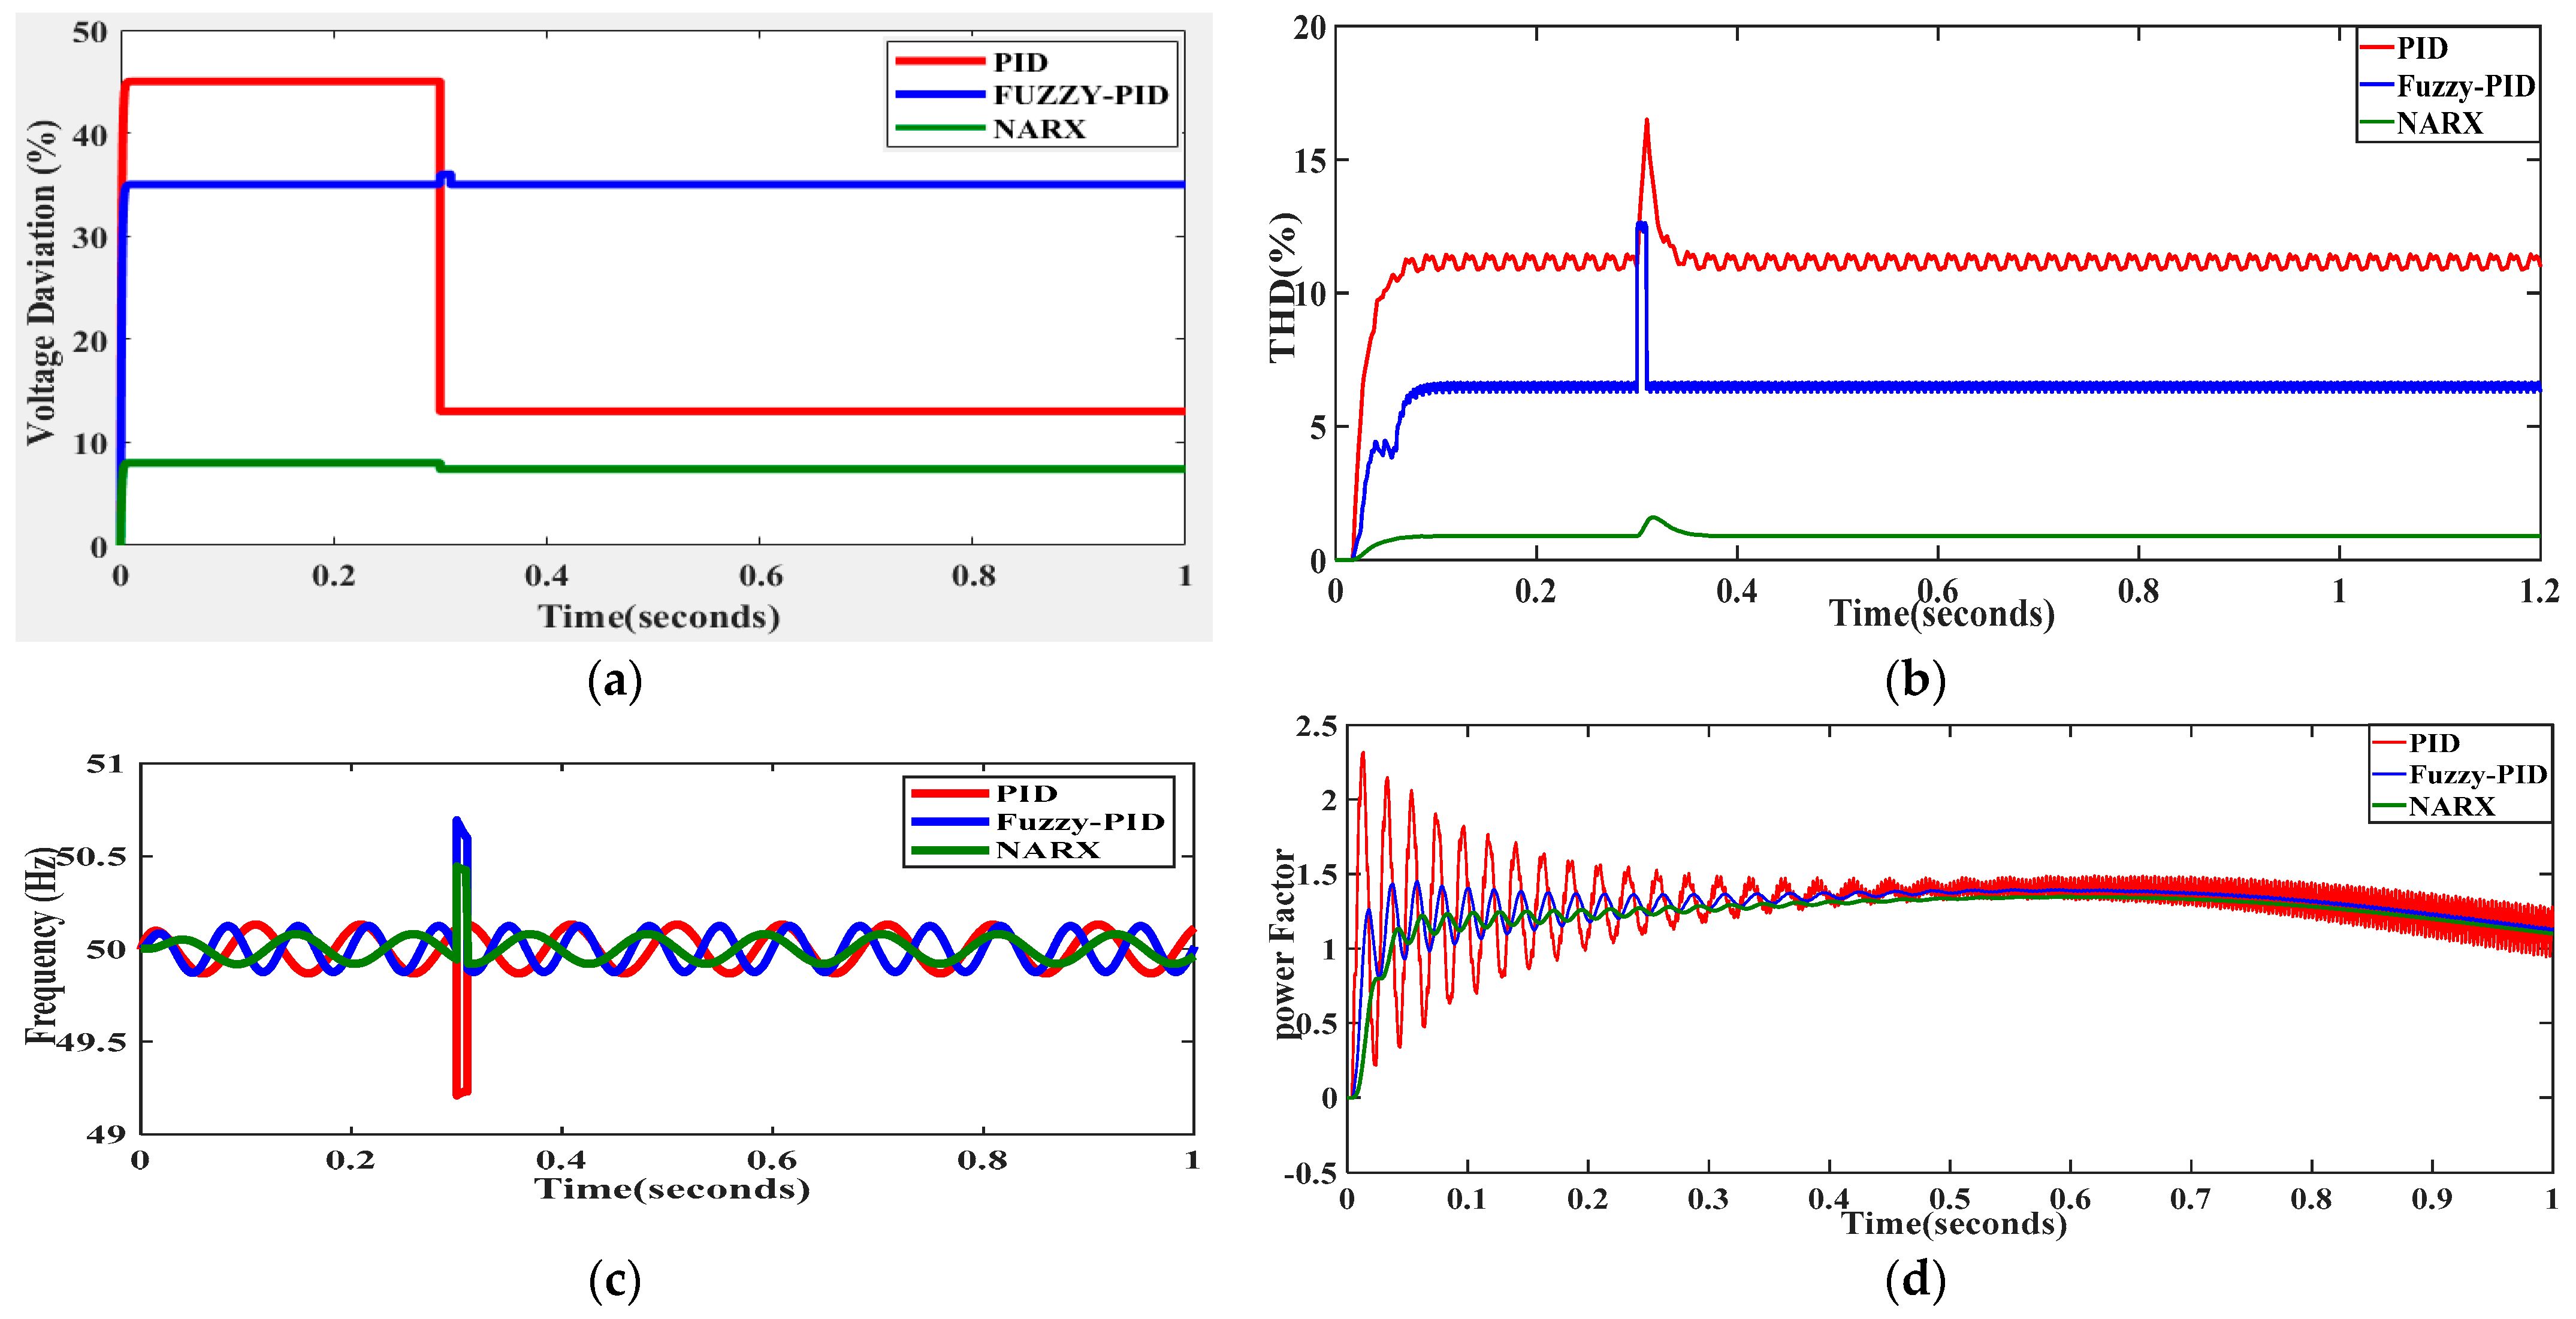
The simulation of the suggested MG network is carried out for time, t = 2 s. The grid-connected model is simulated for 0 to 1 s while islanded mode of operation is simulated for 1 to 2 s. The PID controller gain parameters are taken as proportional ( K p ), integral ( K i ), and differential ( K d ) values of 0.2, 1.2, and 500, respectively, to generate gate signals for the inverter. Two input variables are taken for the fuzzy-based PID controller such as error and alteration in error and a fuzzy-controller output as K P , K i , and K d within the range of 0.2 to 0.8, 0.5 to 1.25, and 300 to 800, respectively. From the simulation, it can be concluded that the PID and fuzzy-based PID controller consume more iterations and intervals as equated to the ANN algorithm due to presence of more non-linear variables for attaining optimal values of K p , K i , and K d for producing gate pulses. The voltage deviation summary is given in Figure 10a and it can be apprehended that the PID and fuzzy-based PID have shown a smaller amount of variation as matched to no controller but the NARX controller operates with horizontal and nearly zero variation. It can be verified that the planned NARX controller can reimburse higher limits of voltage distortion and THD higher than 15% to 45% as presented in Figure 11a,b.
As of Figure 11a,b it can be observed that the VD and THD does not lie within satisfactory limits (PID, fuzzy-PID) according to standards as mentioned in Section 2. However, with the help of the recommended NARX-based control method, it can be confirmed that the VD and THD variation is uniform and nearly zero apart from at the interval of switching as presented in Figure 11a,b. Again, oscillations are present in frequency and PF curves in PID and fuzzy-PID regulators but with the NARX control action desired output can be obtained as given in Figure 11c,d. Data given in Table 6 prove that that NARX-based controller limits the variation of VD, THD, F, and PF to a minimum level, which improves the PQ under grid tied and islanding mode of operations of the proposed MG model.
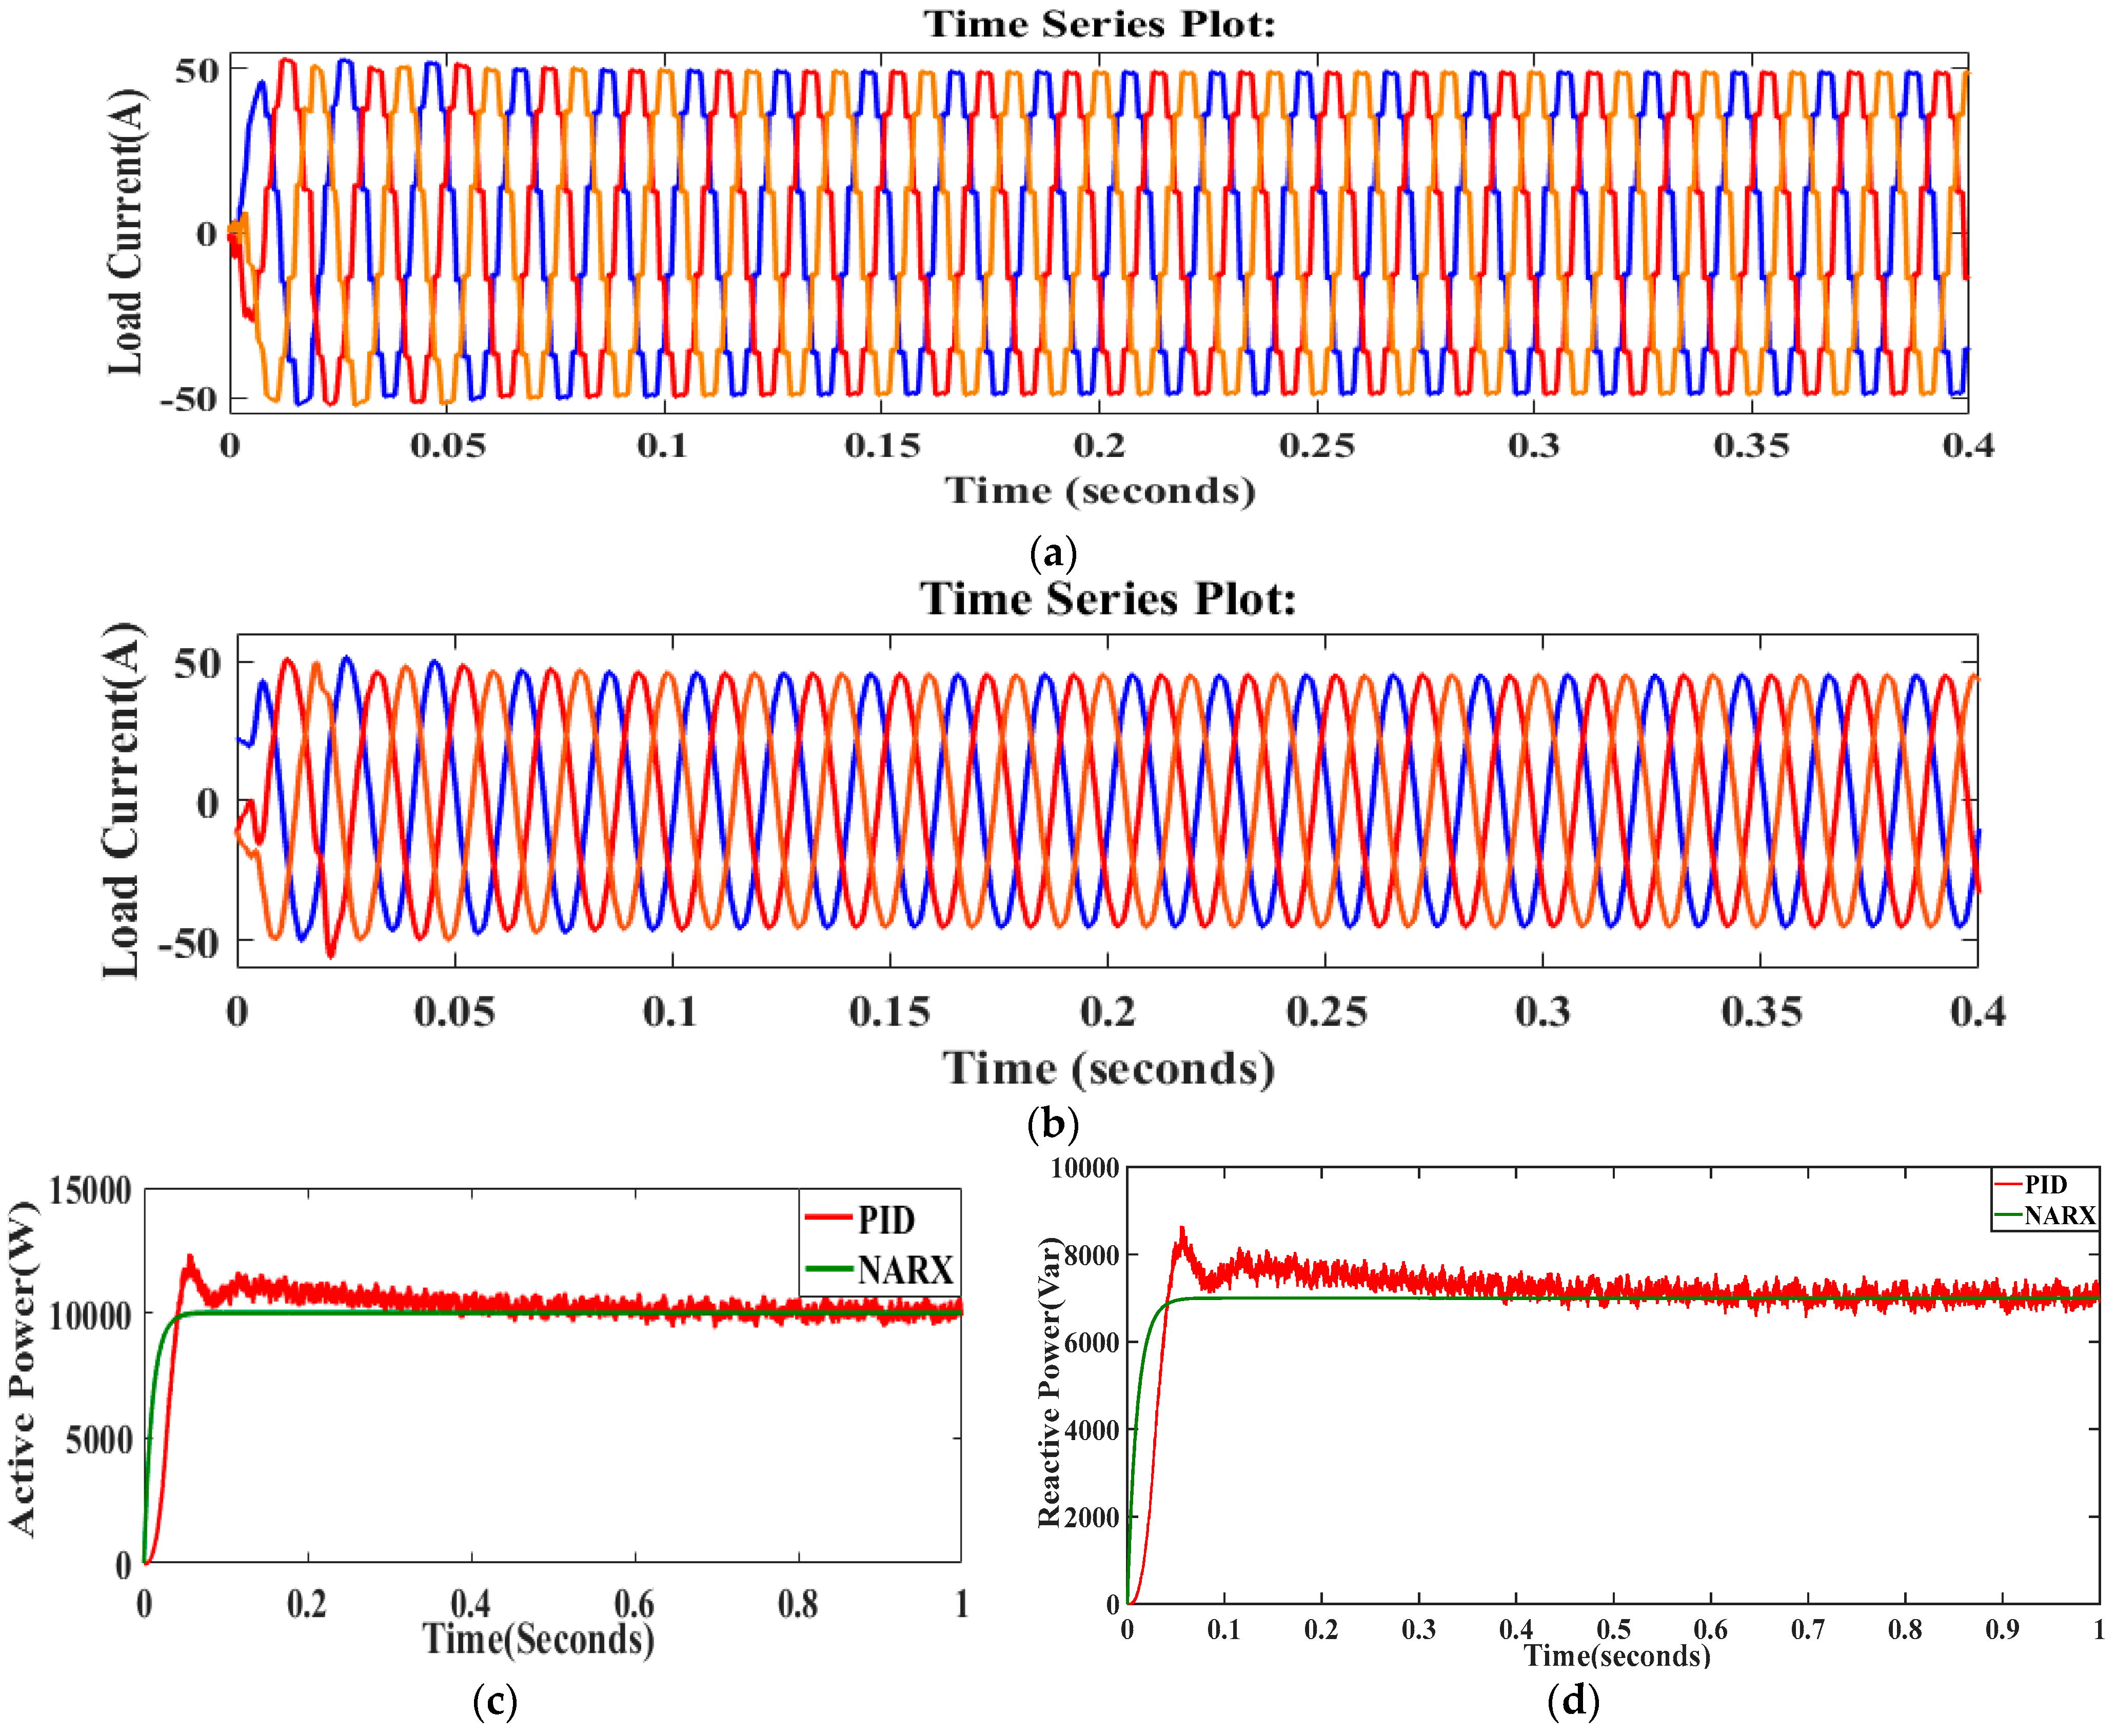
Hence, the factors associated with power quality are found out to be poor for PID and fuzzy-PID control action as matched to the NARX control action. The deviation of voltage level and harmonic distortion are attained under 10% and 5% (for low-voltage networks), respectively, through the suggested controlling technique. The peak overshoot has been witnessed at the time (1 s) during switching from grid-tied to islanding approach as given in Figure 11a to Figure 11d. The load current using PID controller and proposed ANN procedure are shown in Figure 12a to Figure 12b. From the figures it can be clearly verified that proposed NARX-based controller has revealed uniform sinusoidal current as matched to the PID controller. The real and reactive powers expended by load are presented in Figure 12c to Figure 12d, from which it can be seen that the NARX controller helps in retaining better waveforms as matched to PID controller.

5.1.2. Power Quality Improvement through Voltage Sag/Swell and Unbalanced Condition

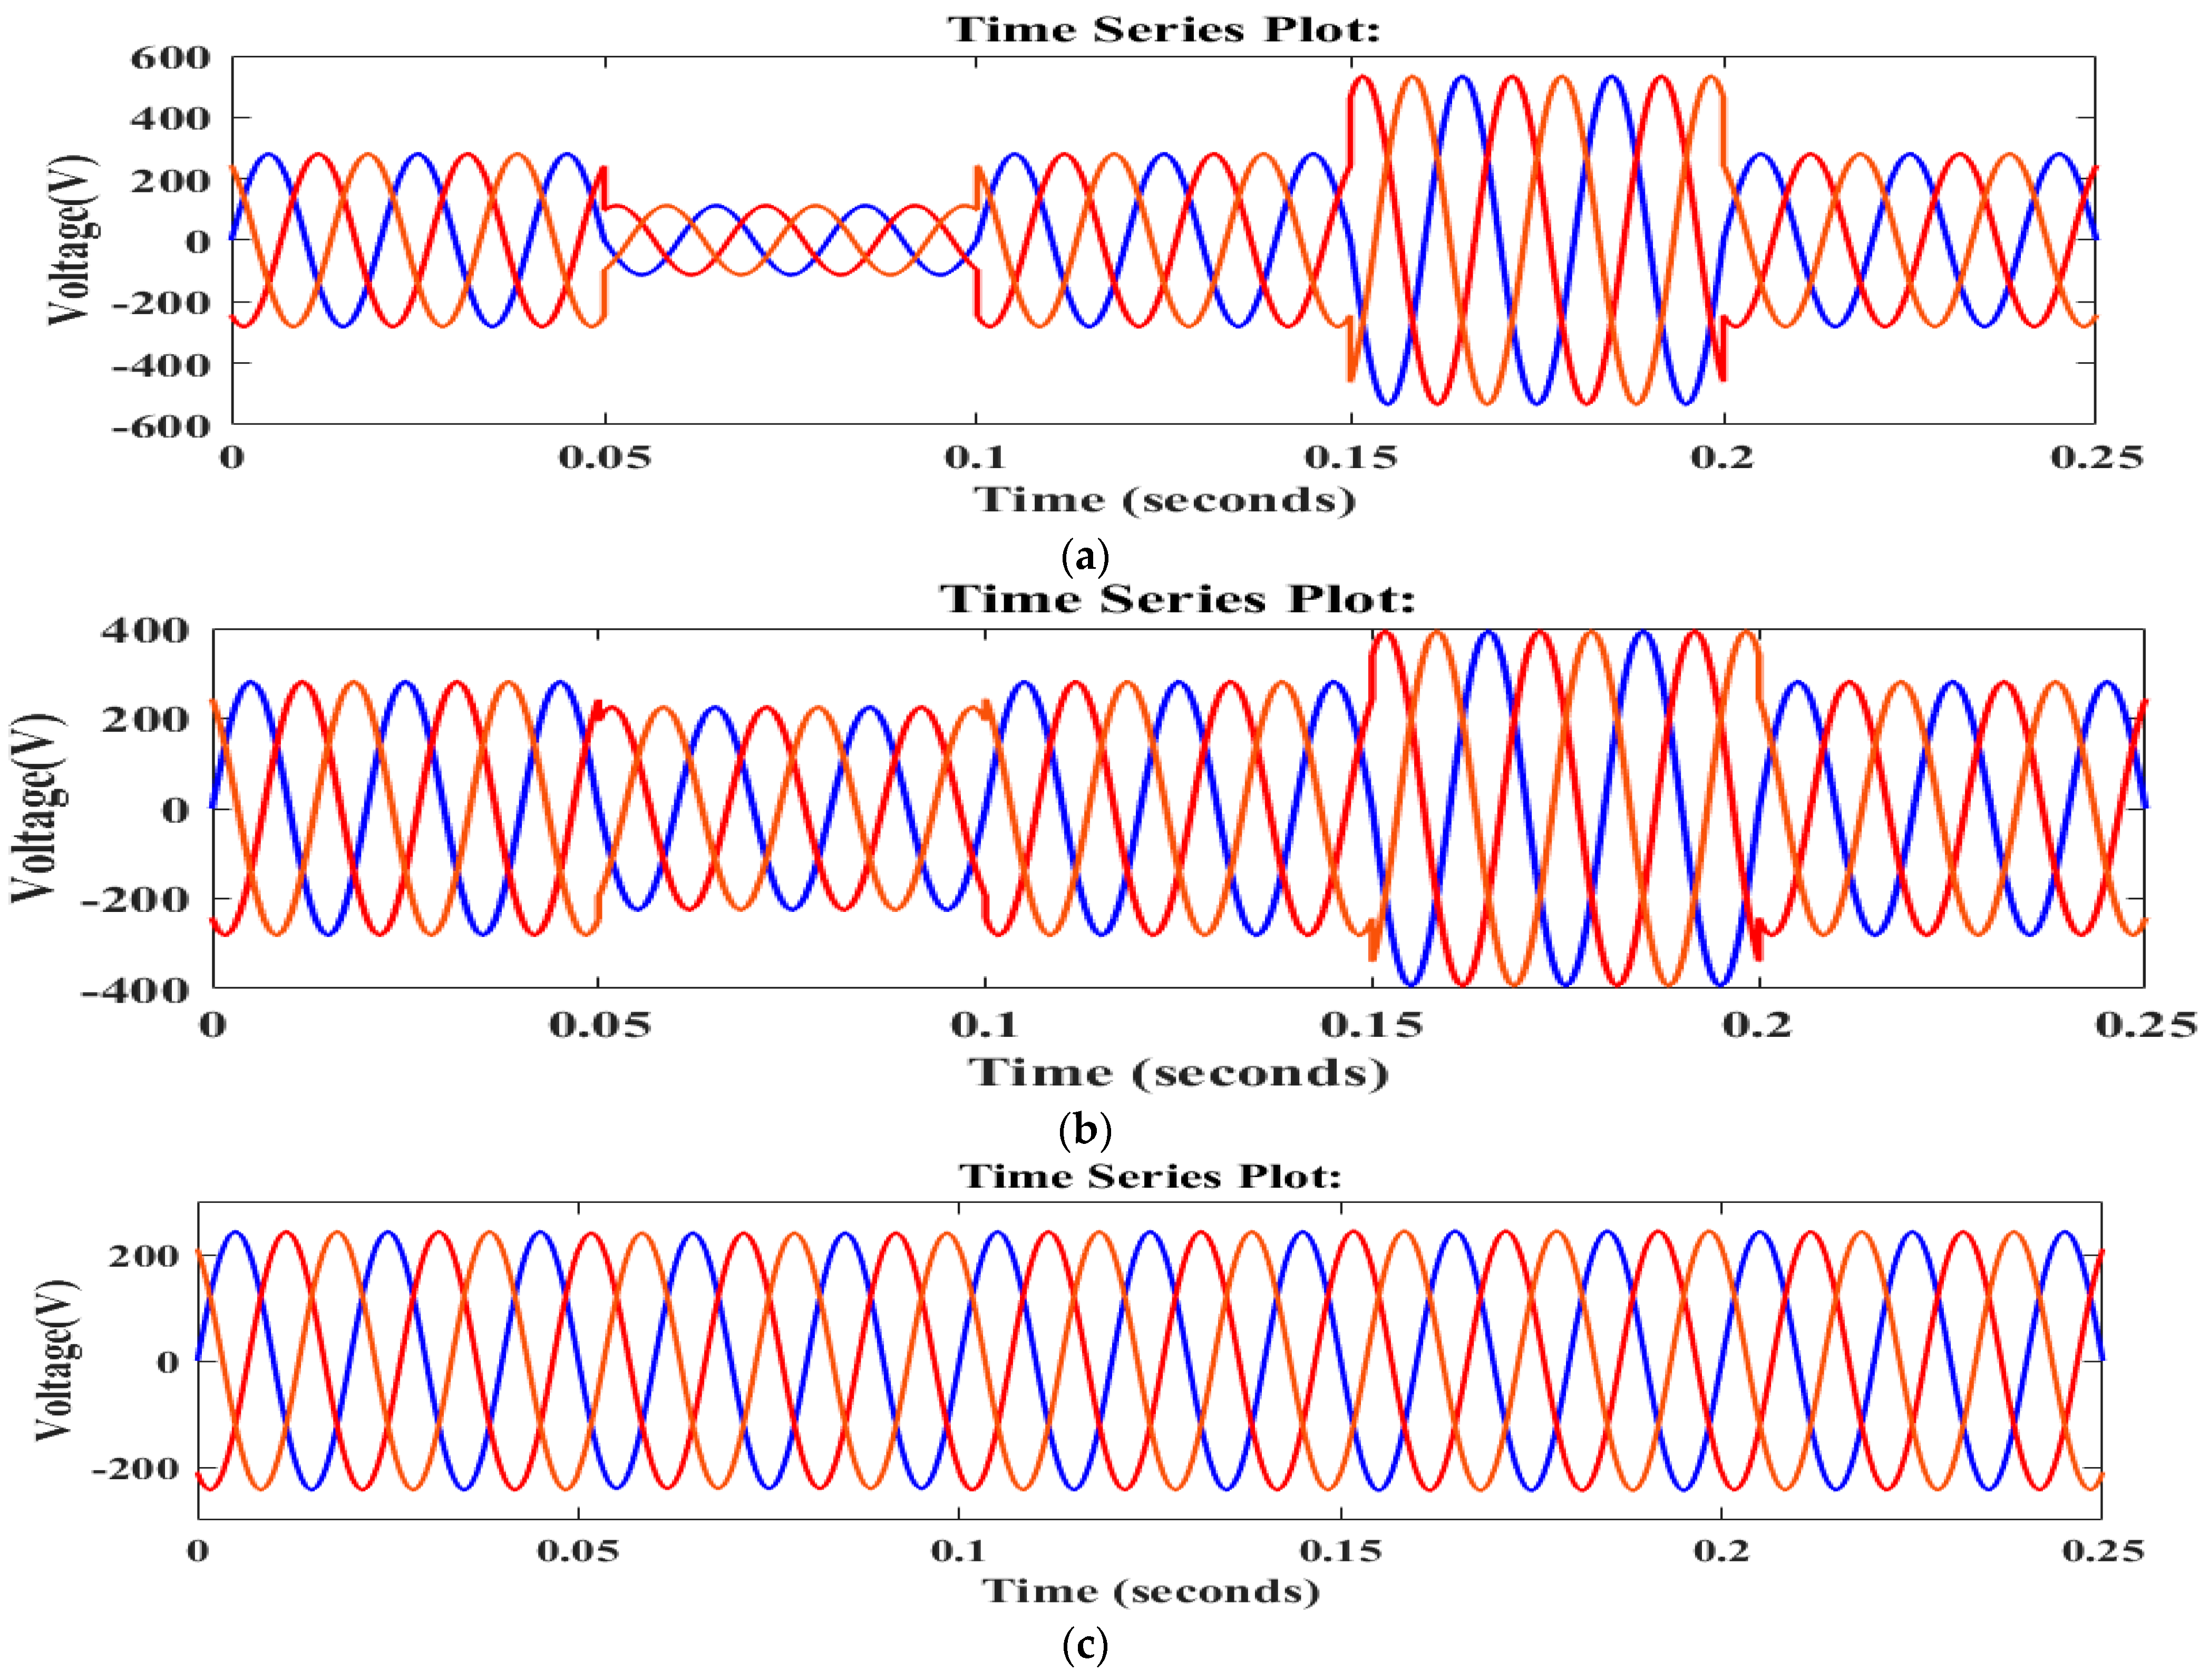
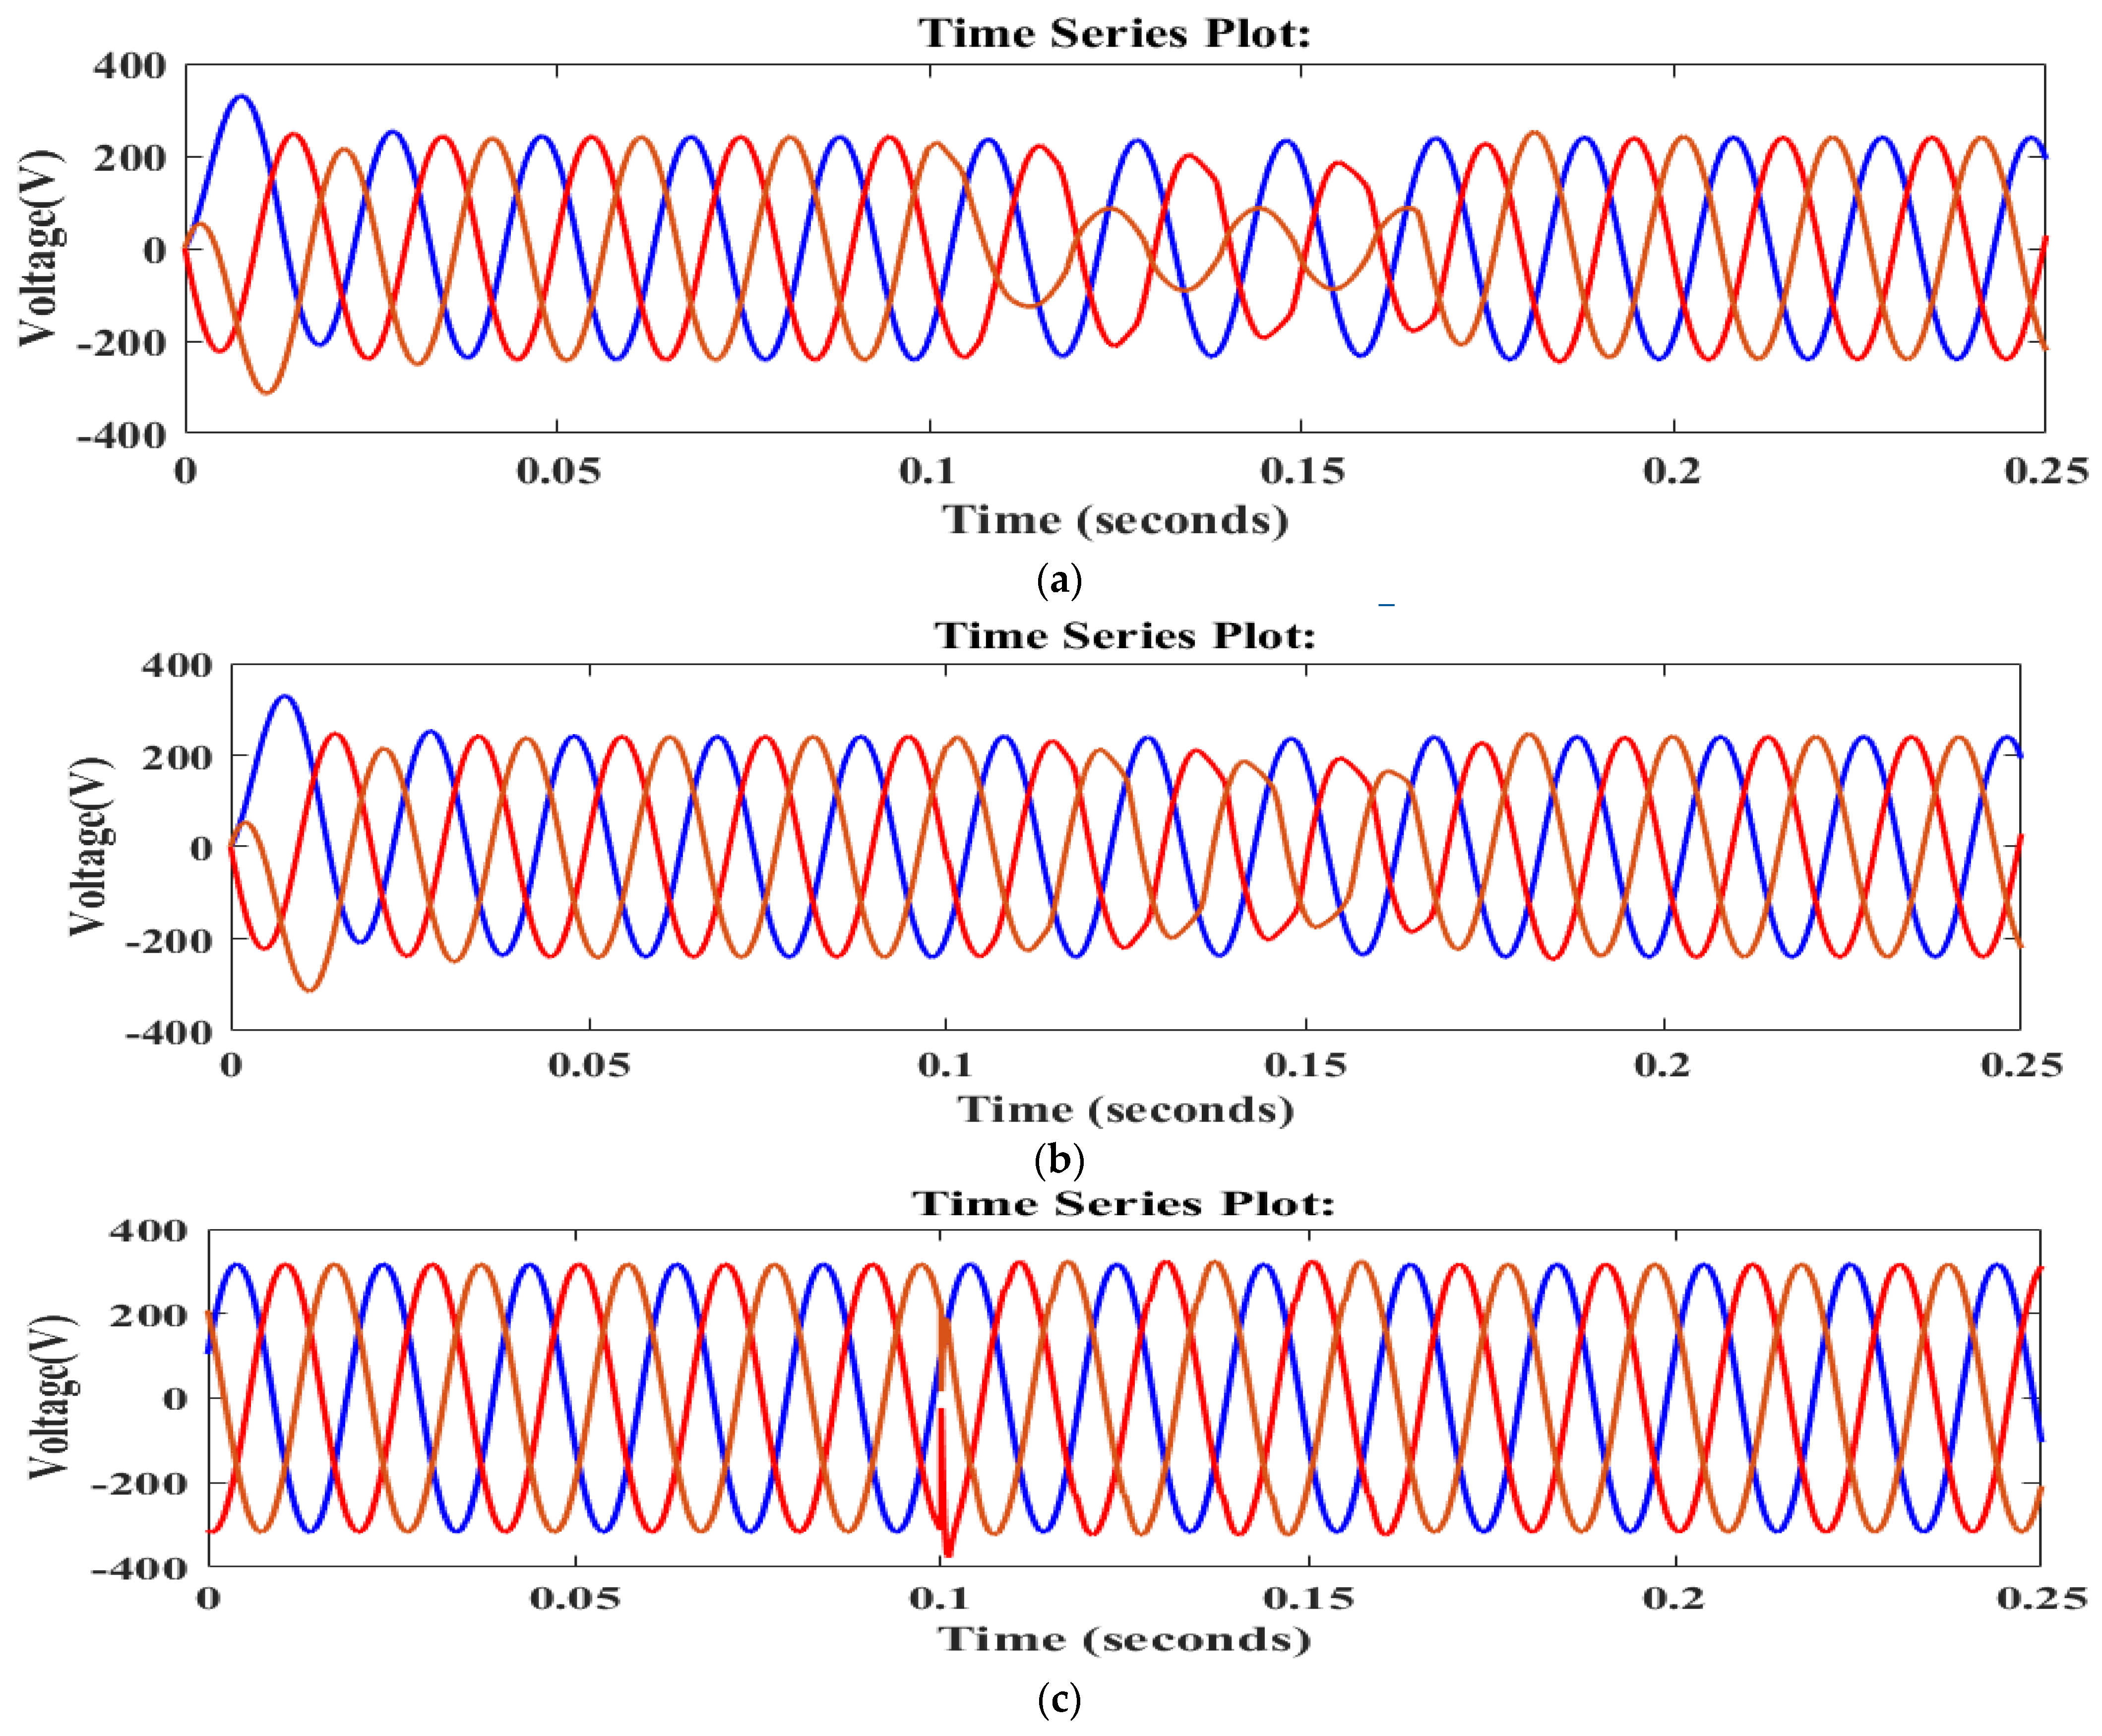
The condition of voltage-dip is introduced at time instant of 0.05 s up to 0.1 s with the use of fault (3- Φ ) and voltage-swell condition is conceded at instant 0.15 s up to 0.2 s by removing of a heavy three-phase load abruptly. The MG model is simulated for a duration of 0.25 s and the unbalanced load voltage is given in Figure 13a. The PID-based controller can enhance the sag/swell condition in voltage as presented in Figure 13b to Figure 13c, which can be further improved by a fuzzy-PID and NARX-based controllers by connecting a capacitor (3 × 33.2 μF) across the load bus with 1.67 kVAR. From the figures it may be verified that with the help of NARX controller almost pure sinusoidal and balanced three-phase voltage can be maintained as equated to PID and fuzzy-PID controlling techniques as seen in Figure 13. The waveform of load voltage can be also preserved during distorting condition. The distortion is introduced from 0.10 s to 0.15 s as given in Figure 14a to Figure 14c. The amplitude of voltage and phase angle are maintained by controlling the inverter pulses so that a three-phase balance is established quickly. Figure 14b to Figure 14c indicates that the NARX controller introduces quick generation of gating signals by optimizing amplitude and phase angle of voltage as related to PID and fuzzy-PID.

5.1.3. Battery Energy Storage System (BESS) Backup for Critical Load

A continuous power supply can be maintained by means of connecting a hybrid energy storage system to remote DER generators connected to a utility grid for better maintenance during an energy crisis or failure of one or more DERs. In this scenario a remote battery energy storage system (BESS) is connected to nourish the critical load of 4 kW during failure in DER1, DER2, or the utility grid. The charging of the battery can be performed through local PV Panels during peak insolation period, from the wind turbines during windy weather climate, and from grid side during disruption of DERs.
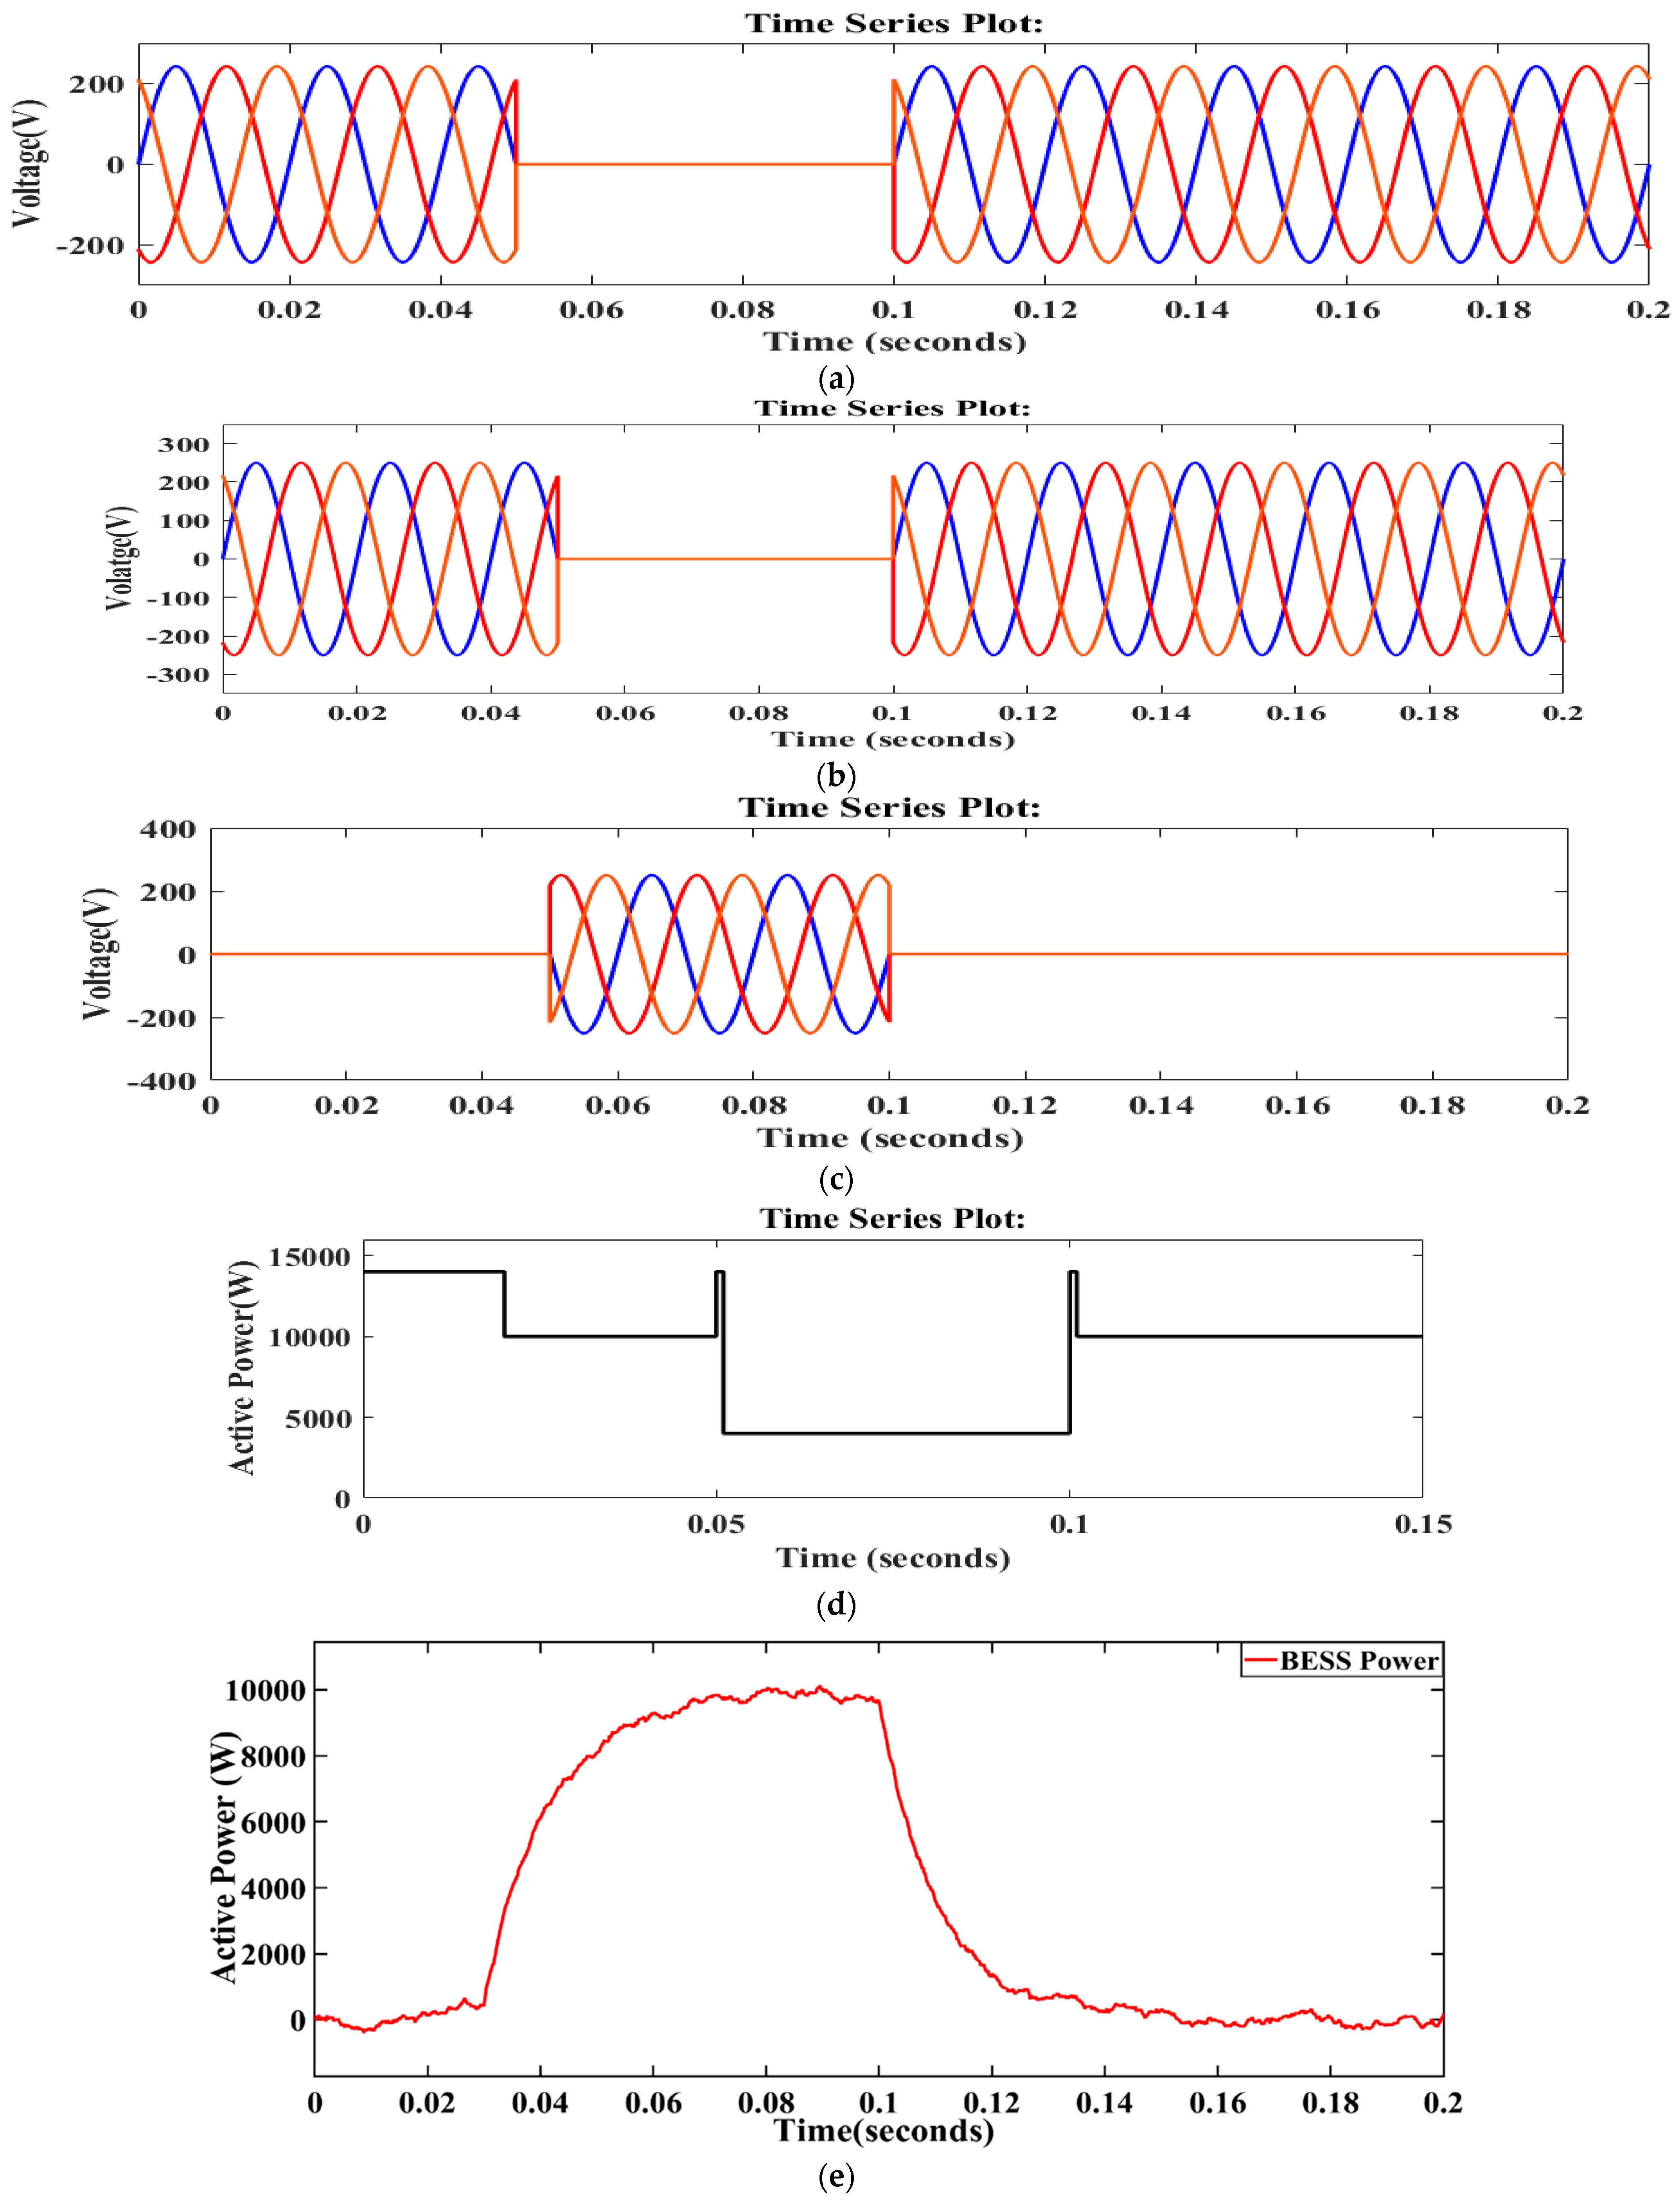
The three DERs along with utility grid are connected from 0 to 0.05 s and 0.1 to 0.15 s, for supplying 10 kW of load as shown in Figure 15a to Figure 15b. The three DERs and utility grid are cut from supply for duration of 0.05 to 0.1 s as given in Figure 15a to Figure 15b. The power that will be provided through BESS to the critical load of 4 kW is presented in Figure 15c. The load voltage prior to 0.05 s and after 0.1 s as provided by BESS is zero as at that duration the load is delivered by DERs and utility grid. In this case, the BESS’s energy-providing duration is dependent upon the dimension of battery, utilization, and ingestion of power of critical load bus. The amount of real power supplied to load is drawn from the DERs, utility grid, and the BESS as shown in Figure 15d. From the above discussion, it can be verified that the PQ can be enhanced by connecting a BESS for optimized operation of the proposed MG model.

5.2. (Case 2) MG Considering Supplementary LI Effect

The AC MG prototype as shown in Figure 3 has been simulated for the valuation of power-quality issues allowing for the line impedance parameter. The distribution of power and losses associated with the main utility and distributed resources are estimated. Further, the NARX-based model has also been simulated through transient responses because of the switching delay condition and the PQ factors have been measured for the unchanged scenario, which is discussed below.

5.2.1. Influence of Line Impedance on Power Quality Parameters

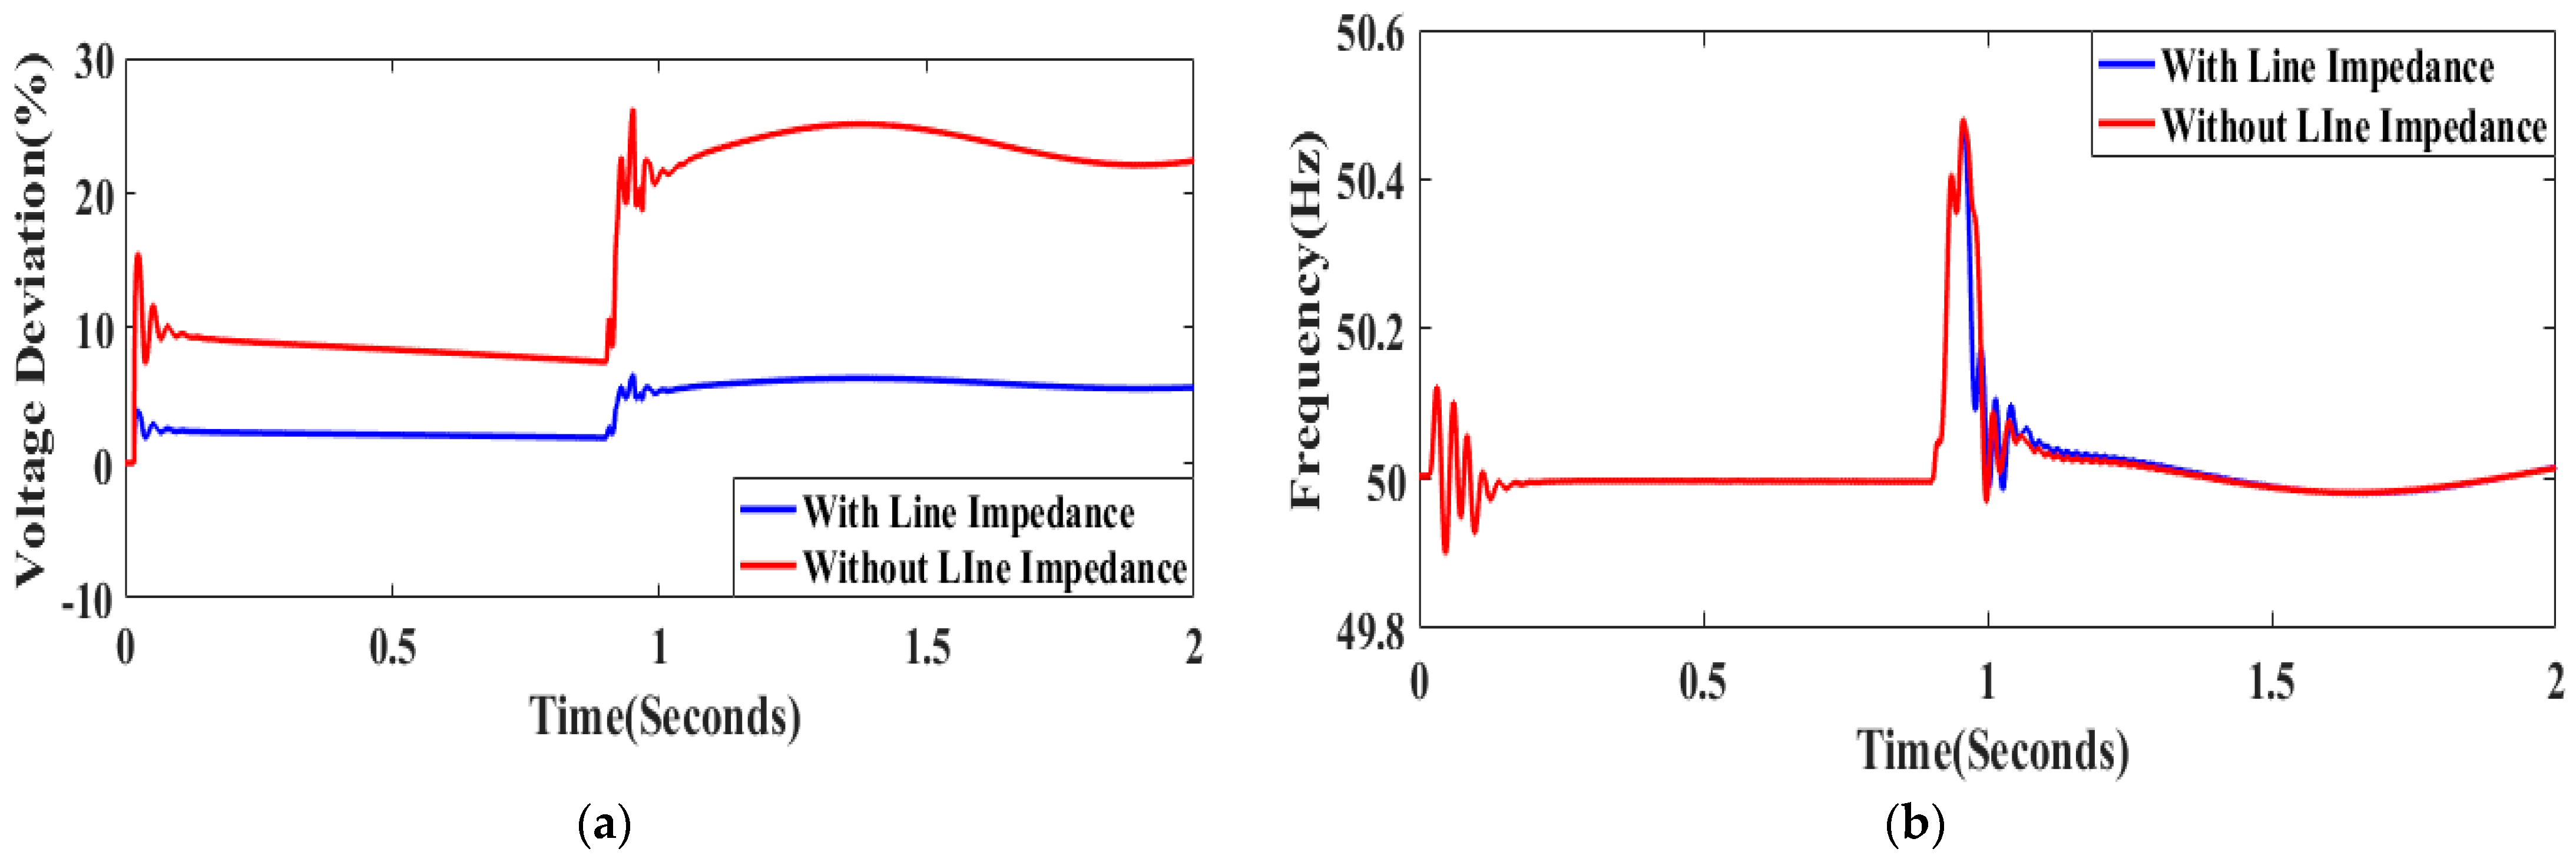
The proposed MG model comprising three DERs (PV array, wind turbine, and fuel cell) and a utility grid have been investigated for grid-tied and off grid mode of operations. In the course of the changeover of operation from on-grid to islanding approach of operation, transients have been witnessed with/without the effect of line impedances. The power quality issues such as voltage abnormality, harmonic distortion, frequency, and PF have been measured to confirm the working of NARX controller through switching duration as given in Figure 16a to Figure 16d. The efficiency of MG without line impedance is matched by considering the line impedance. The voltage aberration is found to be greater (exceeding 15%) because of line impedance as represented in Figure 16a due to the additional impedance due to main grid (500 m line), station to main load bus (50 m line), critical load (50 m line), and non-critical load (100 m line). The line impedance does not introduce any major change in THD and frequency as given in Figure 16b to Figure 16c. There is a little improvement of PF as presented in Figure 16d due to escalation in total line impedance due to greater R: X value for low-voltage power system. The transition from grid-connected mode to islanded modes of operation introduces transients at 1s in all four power quality factors considered due to alteration in state of the circuit breaker.

5.2.2. Allocation of Power and Loss between Grid and DERs

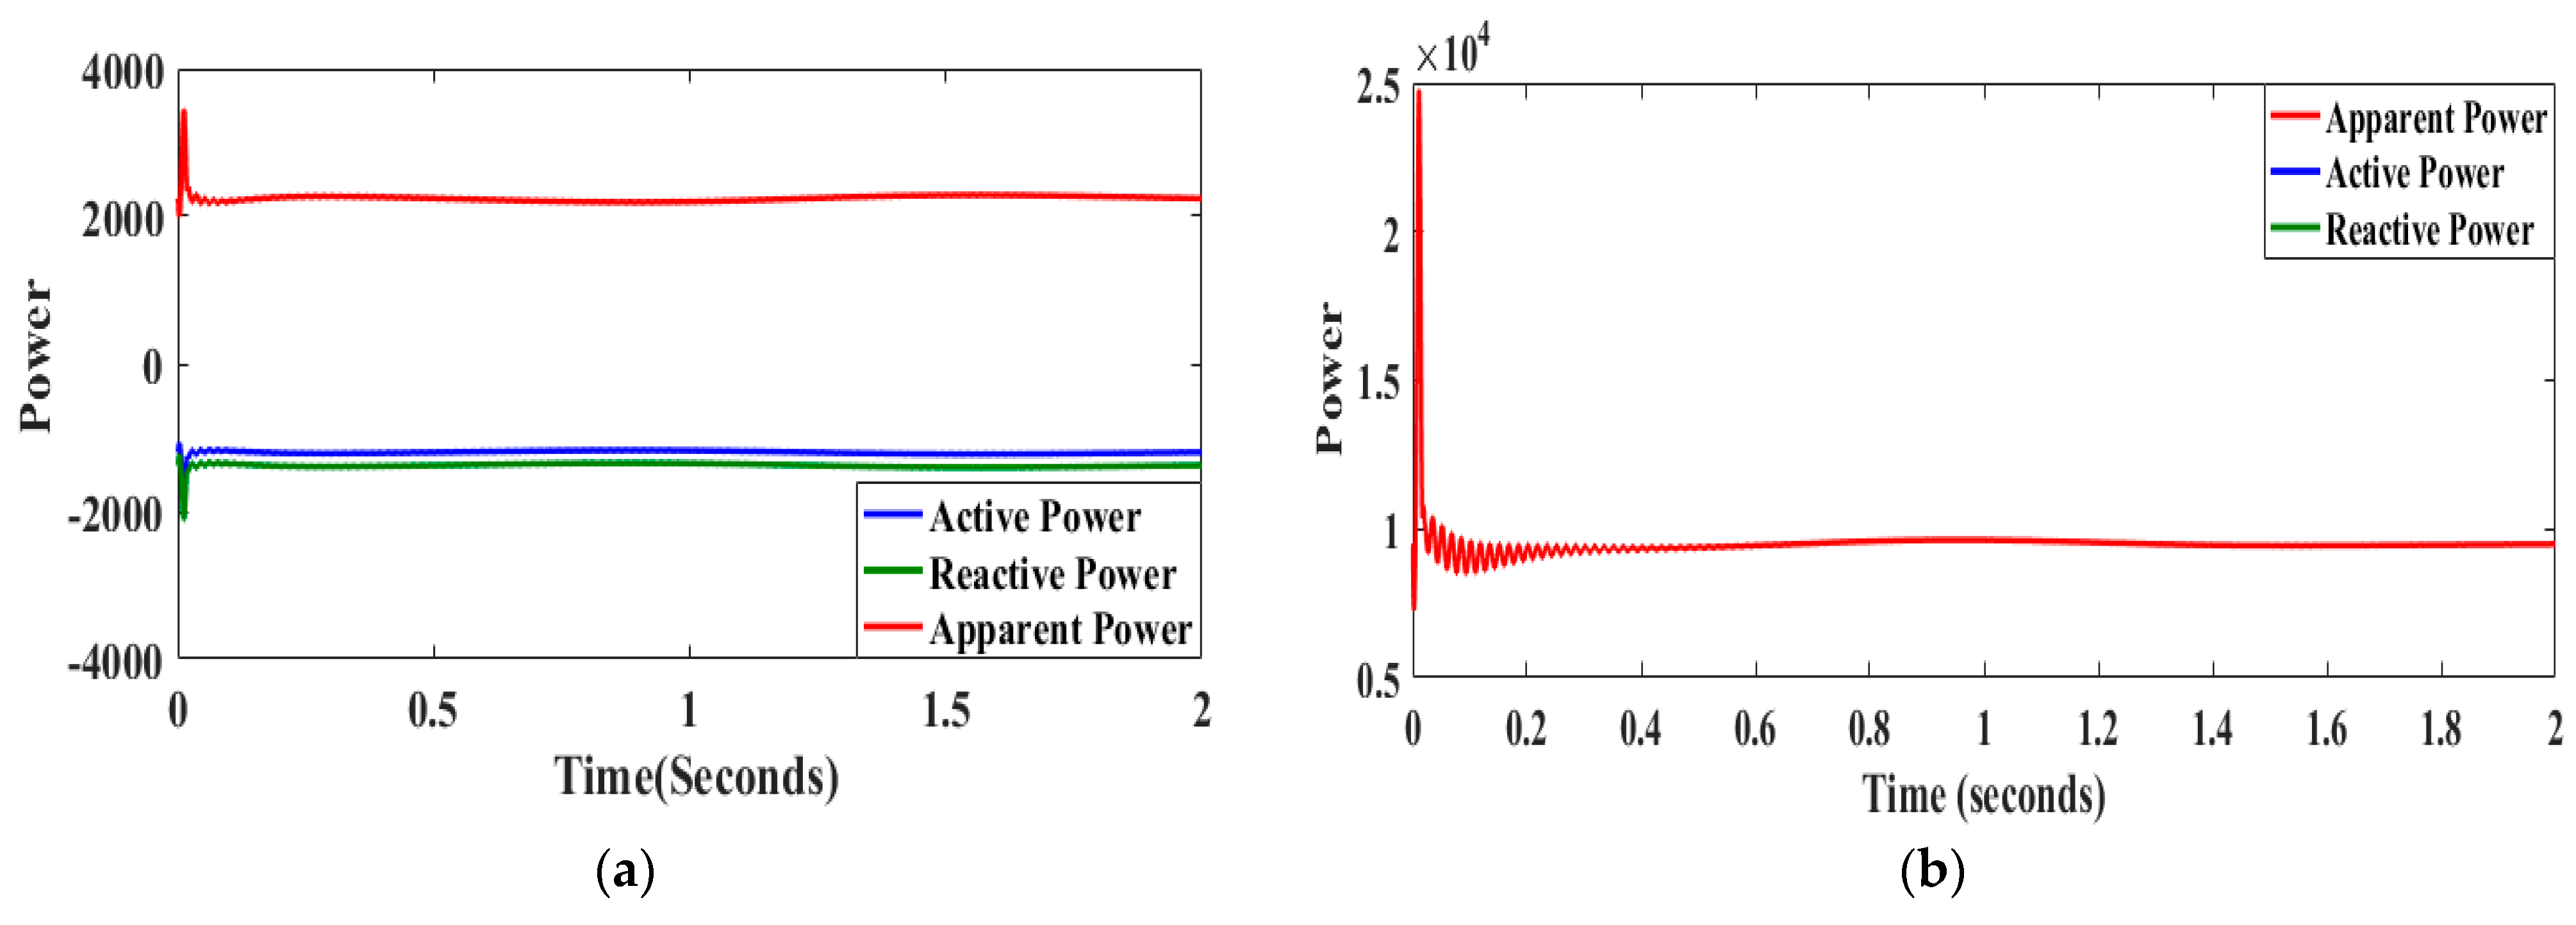
The distribution of real, unreal, and apparent power by the DERs and main grid have been calculated with 0% and 100% disposal of solar panel as presented in Figure 16a to Figure 16c. Figure 16a to Figure 16b show allocation of power between the DERs and grid, respectively, without the solar panel. The DERs engross the reactive power due to generation of no active power which justifies the fundamental idea of power as presented in Figure 16a. The negative reactive power, suggests the inductive operation for the IGBT-inverter ( I q is positive) and engrossing unreal power. The total power is estimated as ( A c t i v e p o w e r 2 + Re a c t i v e p o w e r 2 ) and presented in Figure 17a. The grid provides the burden of 10 kW and 7.5 kVAR in islanded mode. The waveforms of real and unreal powers provided by the grid are given in Figure 17b. The power shared by DER autonomously with solar panel when operating with full time insolation and solar panel (inverter side) when operating as a real power source with reduced or no reactive power production is given in Figure 17c. From the figure it can be seen that that the apparent power coincides with the real power due to zero unreal power. As observed from the Figure 17c, the DER supplies only real power with magnitude of 9520 W during 100% convenience of solar power. The presence of line impedance on DERs, grid, and distribution network accounts for power loss as presented in Table 7. In grid-connected mode of operation, the loss of real power in the sources and delivery lines are more because of line impedances associated with grid side (500 m) non-critical load and critical load side line (100 m and 50 m); however, in islanded approach, the real power consumption by distribution system are insignificant as given in Table 7.

5.2.3. Influence of Switching Delay on PQ Parameters

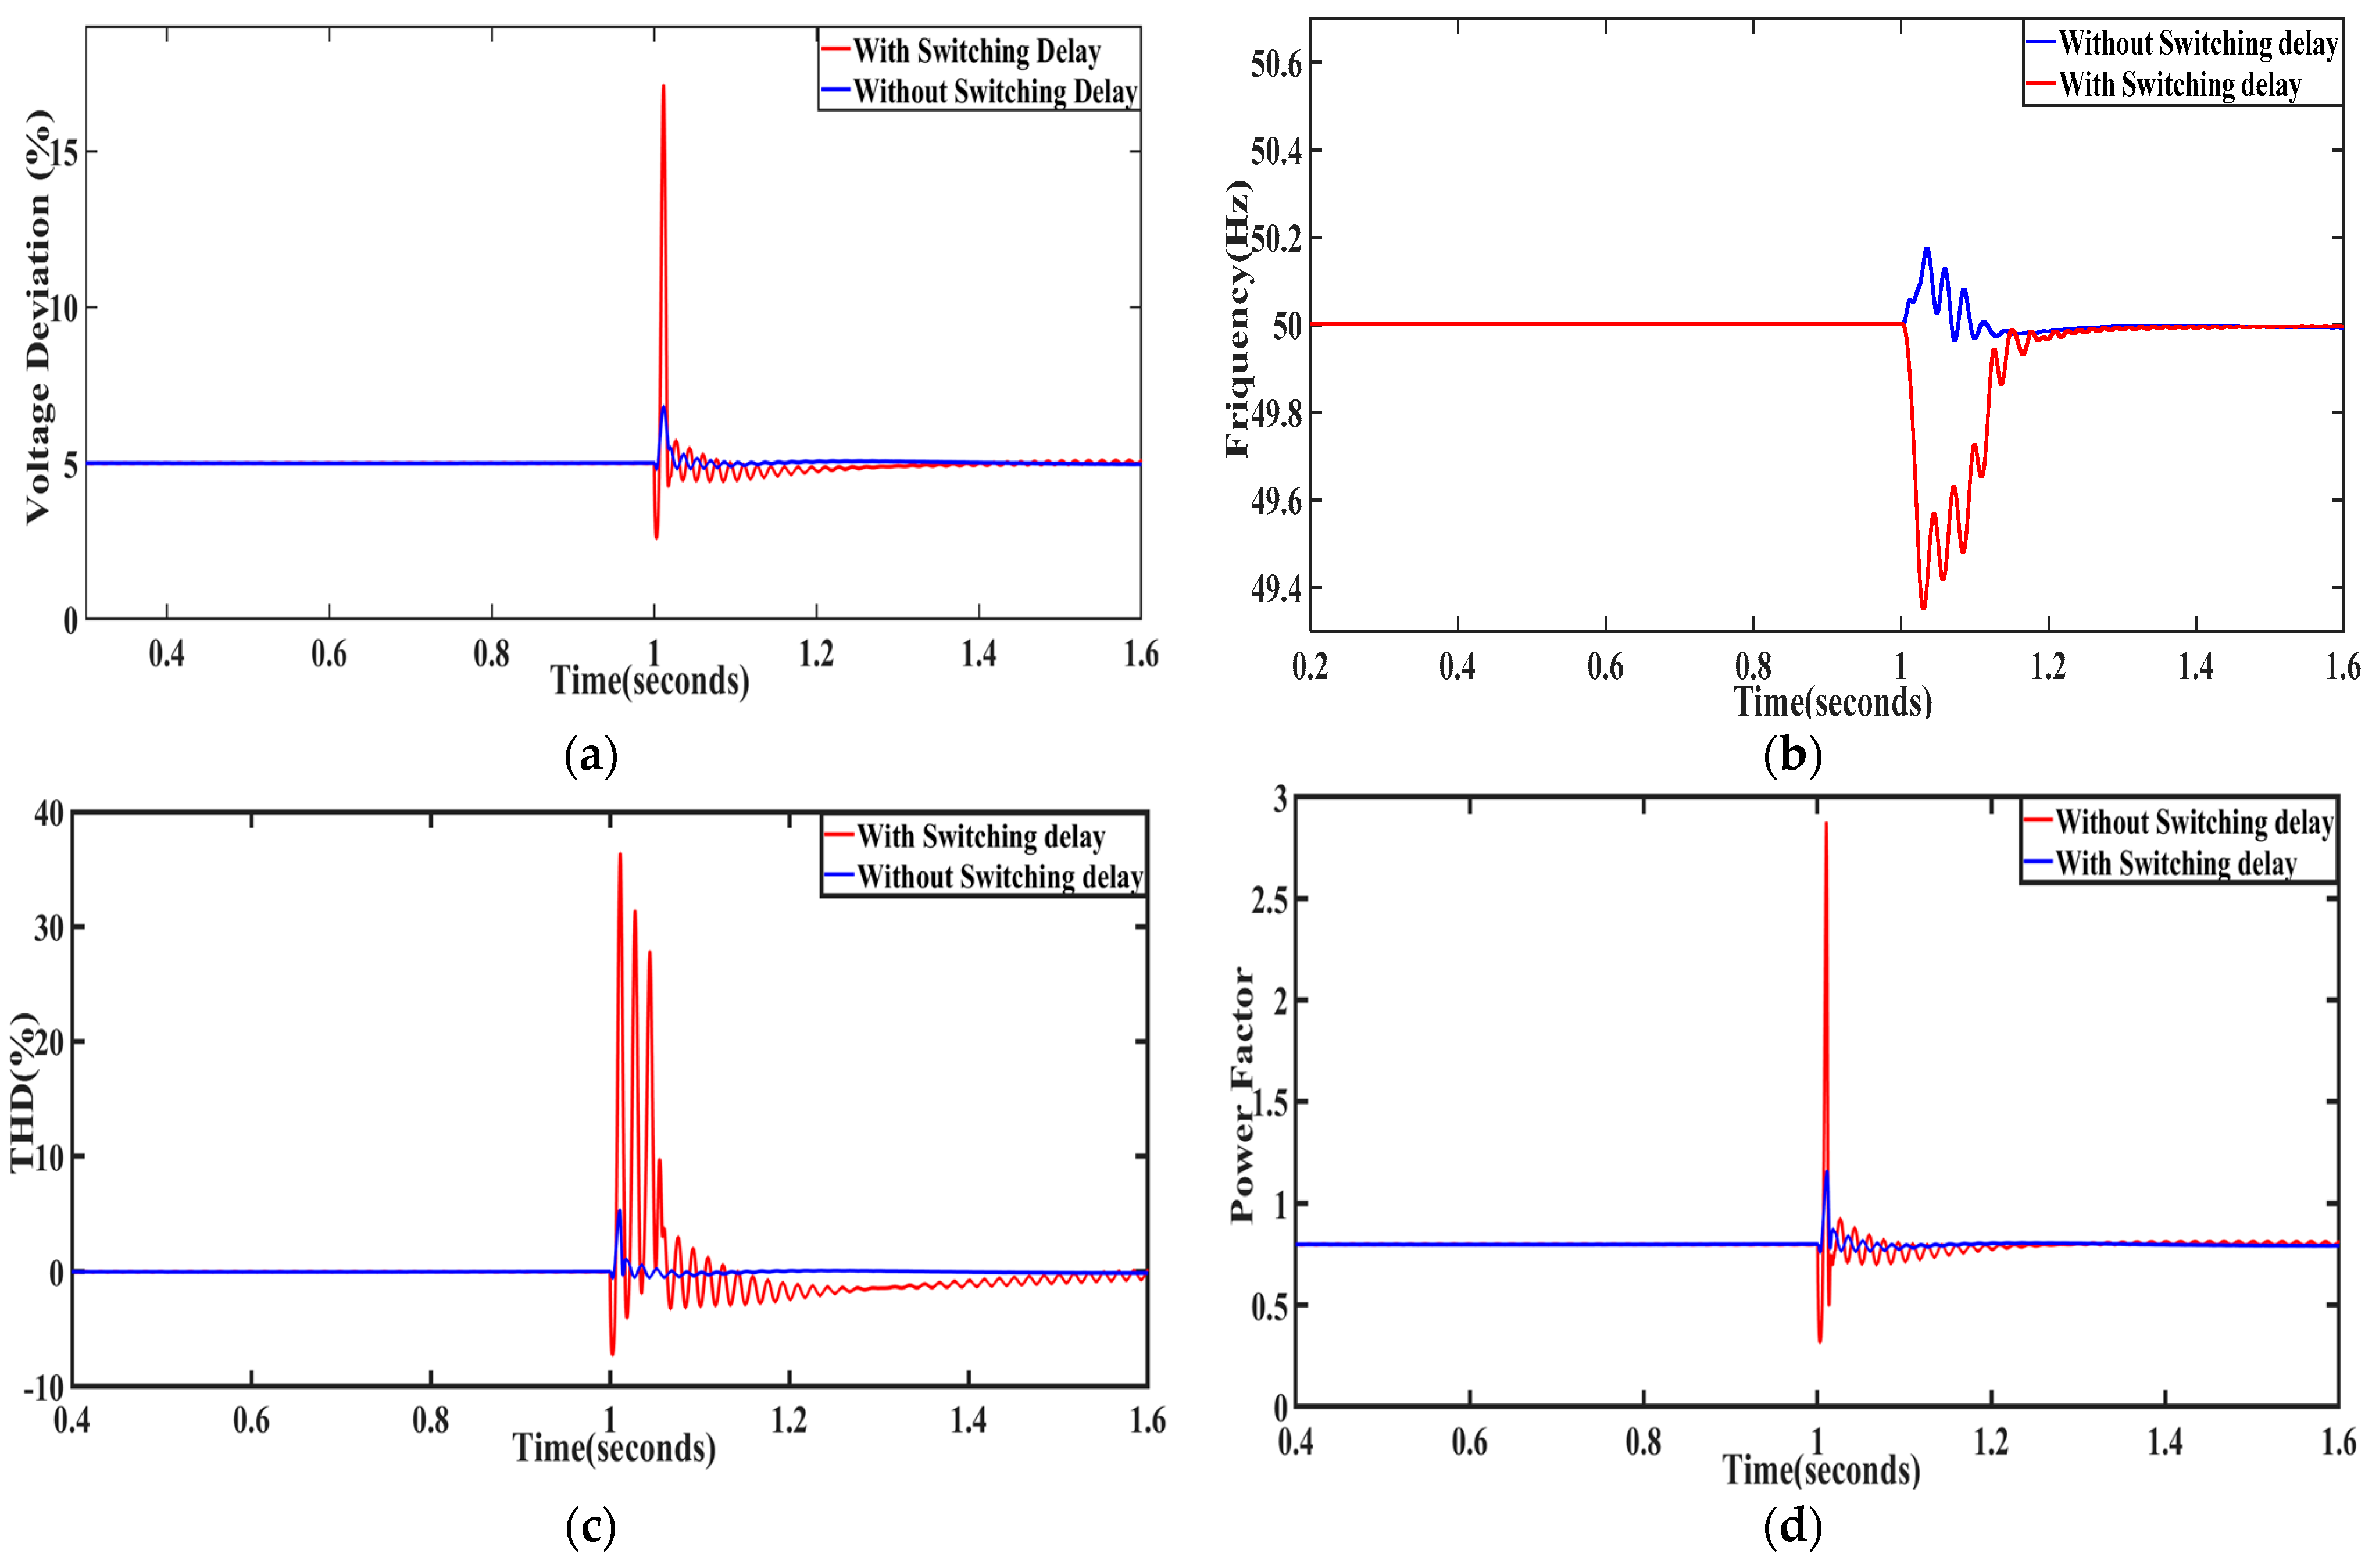
The validity of NARX controller can be performed by introducing a switching delay in breaker set-up during changeover from grid-connected mode to islanded mode of operation. A delay is introduced in controller operation to evaluate the power quality factors such as voltage fluctuation, harmonic distortion, frequency, and PF as presented in Figure 18a to Figure 18d. During the switching delay, a huge level of voltage deviance (45%) has been noticed when compared to no switching delay (5%) at the duration of 1 s when switching happens from grid-tied to islanding mode as represented in Figure 18a. Again, the value of THD as measured in Figure 18b shows that the transient is more in the case of switching delay, contrary to no delay given to the controller. The base frequency of the MG is severely disturbed by the introduction of switching delay from 1 s up to 1.4 s as presented in Figure 18c, which can cause failure of synchronization among three DERs. This is because there is a steep reduction in frequency up to 49.3 Hz after switching because of the switching delay. Figure 18d shows more transients in power factor due to switching delay but little transients are observed while neglecting the switching delay taking 0.8 as the reference power factor. Thus, it can be resolved from Figure 18a to Figure 18d that the frequency of MG is influenced for the elongated duration as related to voltage fluctuation, harmonic distortion, and PF which further lead to the loss of synchronization. The effect of the switching delay could vary from 0–700 mili seconds, for investigating the disturbing influence on PQ parameters [46]. The power quality of the model can be badly influenced by the ANN controller output because of the introduction of the delay. It can be verified that 400 ms is required by the frequency (1 to 1.4 s) to touch stable magnitude after the introduction of the switching delay, as presented in Figure 18c. Similarly, THD and power factor require a time duration of 100 ms. (1 to 1.1 s) as shown in Figure 18b to Figure 18d, respectively, to settle after the introduction of the switching delay. The voltage distortion lasts for 50 ms. (1 to 1.05 s) as a result of the switching delay, as presented in Figure 18a. Longer intervals of switching delay may cause damage to the controller operation due to the converter switching, power quality issues, and loss of synchronization. The time duration of the switching delay forces the modification of the controller parameters so that the power quality can be conserved within the satisfactory range. The effect of switching delay on frequency of MG is discussed in [47] which justifies that the long switching delay is disastrous on frequency and cost of operation of MG. Ref. [48] justifies the influence of the switching delays on the secondary frequency regulation of an off-grid MG supplied by several DERs. Here, delay margins have been found under which the MG allows stable operation.

5.3. (Case 3) Complex MG Assembly

A practical MG assembly is shown in Figure 4, which has been scrutinized for power distribution between MG1, MG2, MG3, and that of main grid during grid-tied and off-grid operation and is presented in Section 5.3.1. In off-grid mode of operation, the demand-response analysis has been examined in Section 5.3.2, when MG1, MG2, and MG3 supply the load. The PQ factors have been studied along with influence of switching delay in Section 5.3.3 for MG1, MG2, and MG3 through islanded mode. The off-nominal situations with effect of the switching delay and supplementary noise is introduced for the practical MG testing in Section 5.3.3.

5.3.1. Allocation of Power and Losses in Complex MG Assembly

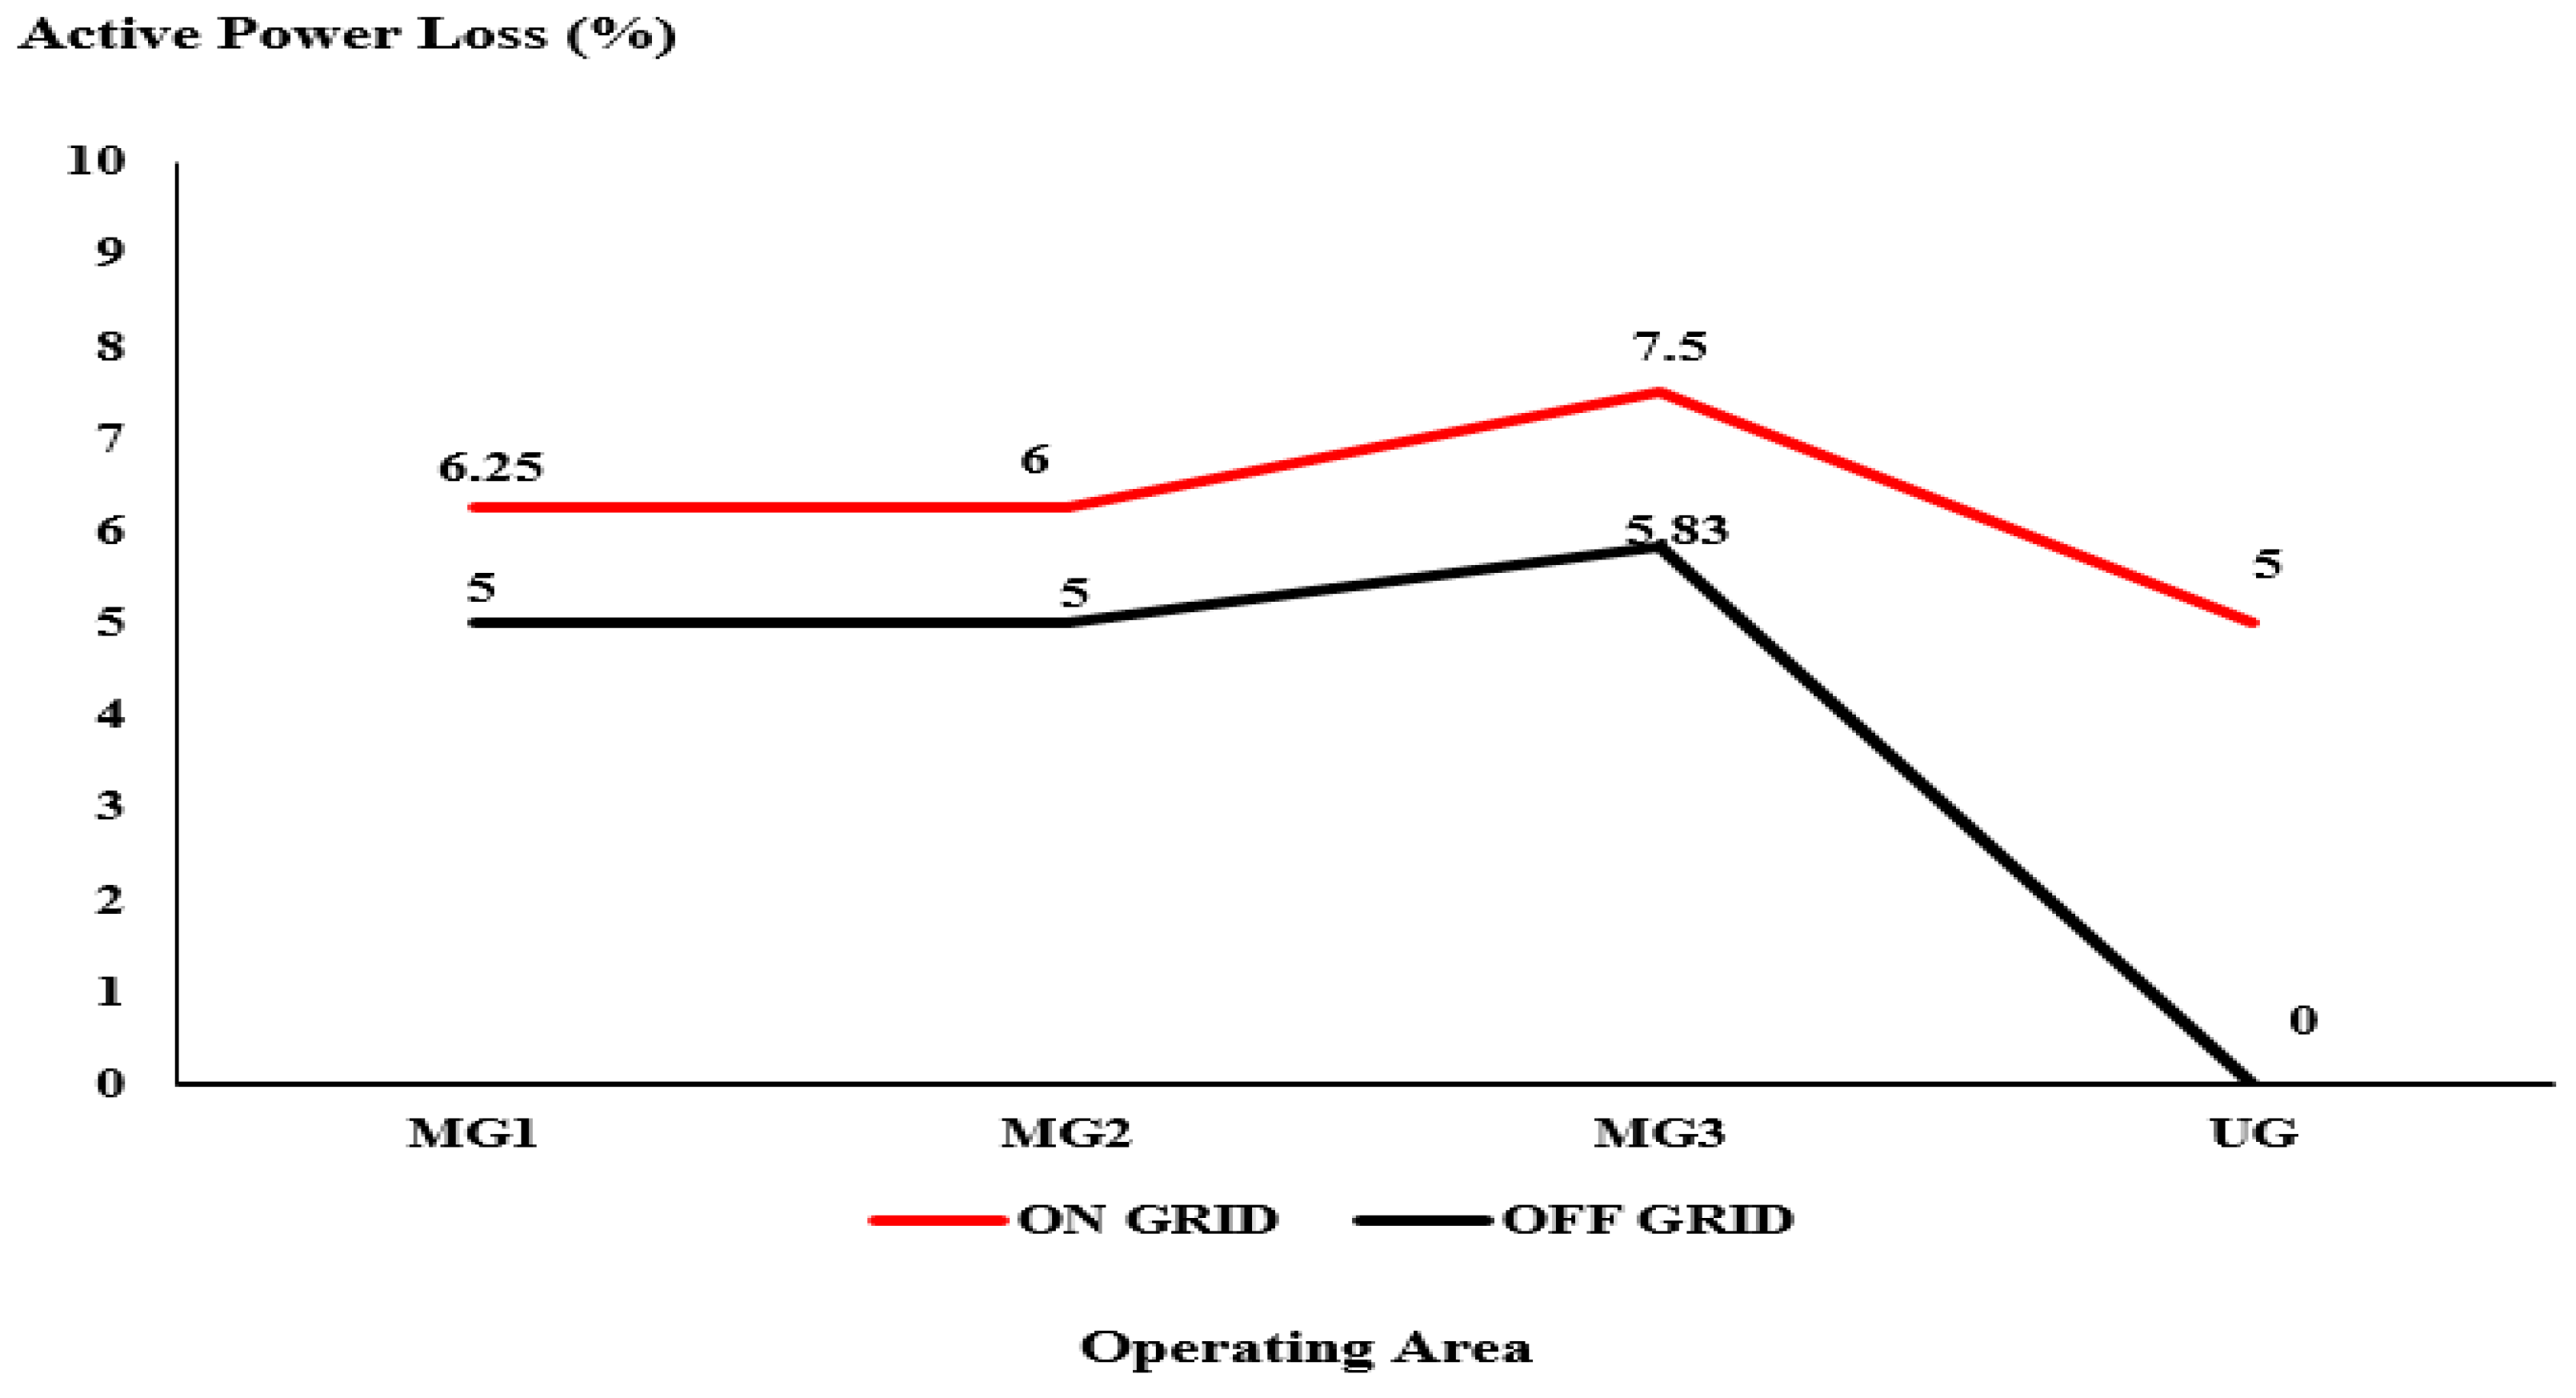
Three loads of magnitude 4 kW, 4 kW, and 6 kW are provided for the proposed model to MG1, MG2, and MG3, respectively. Hence the gross active power production rating is 14 kW for the three DERs. In the case that load demand exceeds 14 kW, the main grid can be coupled to accommodate the additional load requirement. The MG3 is associated with maximum loss of 7.5% in grid-connected mode of operation as presented in Table 8 as it is associated with four distribution lines which produce higher losses as compared to MG1 and MG2 as given in Figure 4. The power demand, losses, and production associated with MG1, MG2, and MG3 in islanded mode are given in Table 9. From this table it can be understood that MG3 is associated with 5.83% of loss as matched to 5% in event of MG1 and MG2. The curves have been drawn for MG1, MG2, MG3, and main grid power loss in grid-connected and islanded modes as presented in Figure 19. During islanded mode, the net real power losses are small as matched to grid-tied mode of operation, as the loads are delivered from local resources such as MG1 to MG3. In islanded mode, the total loss of power by the utility grid is zero as it is detached from the PCC as shown in Figure 19.

5.3.2. Demand Response (DR) Investigation

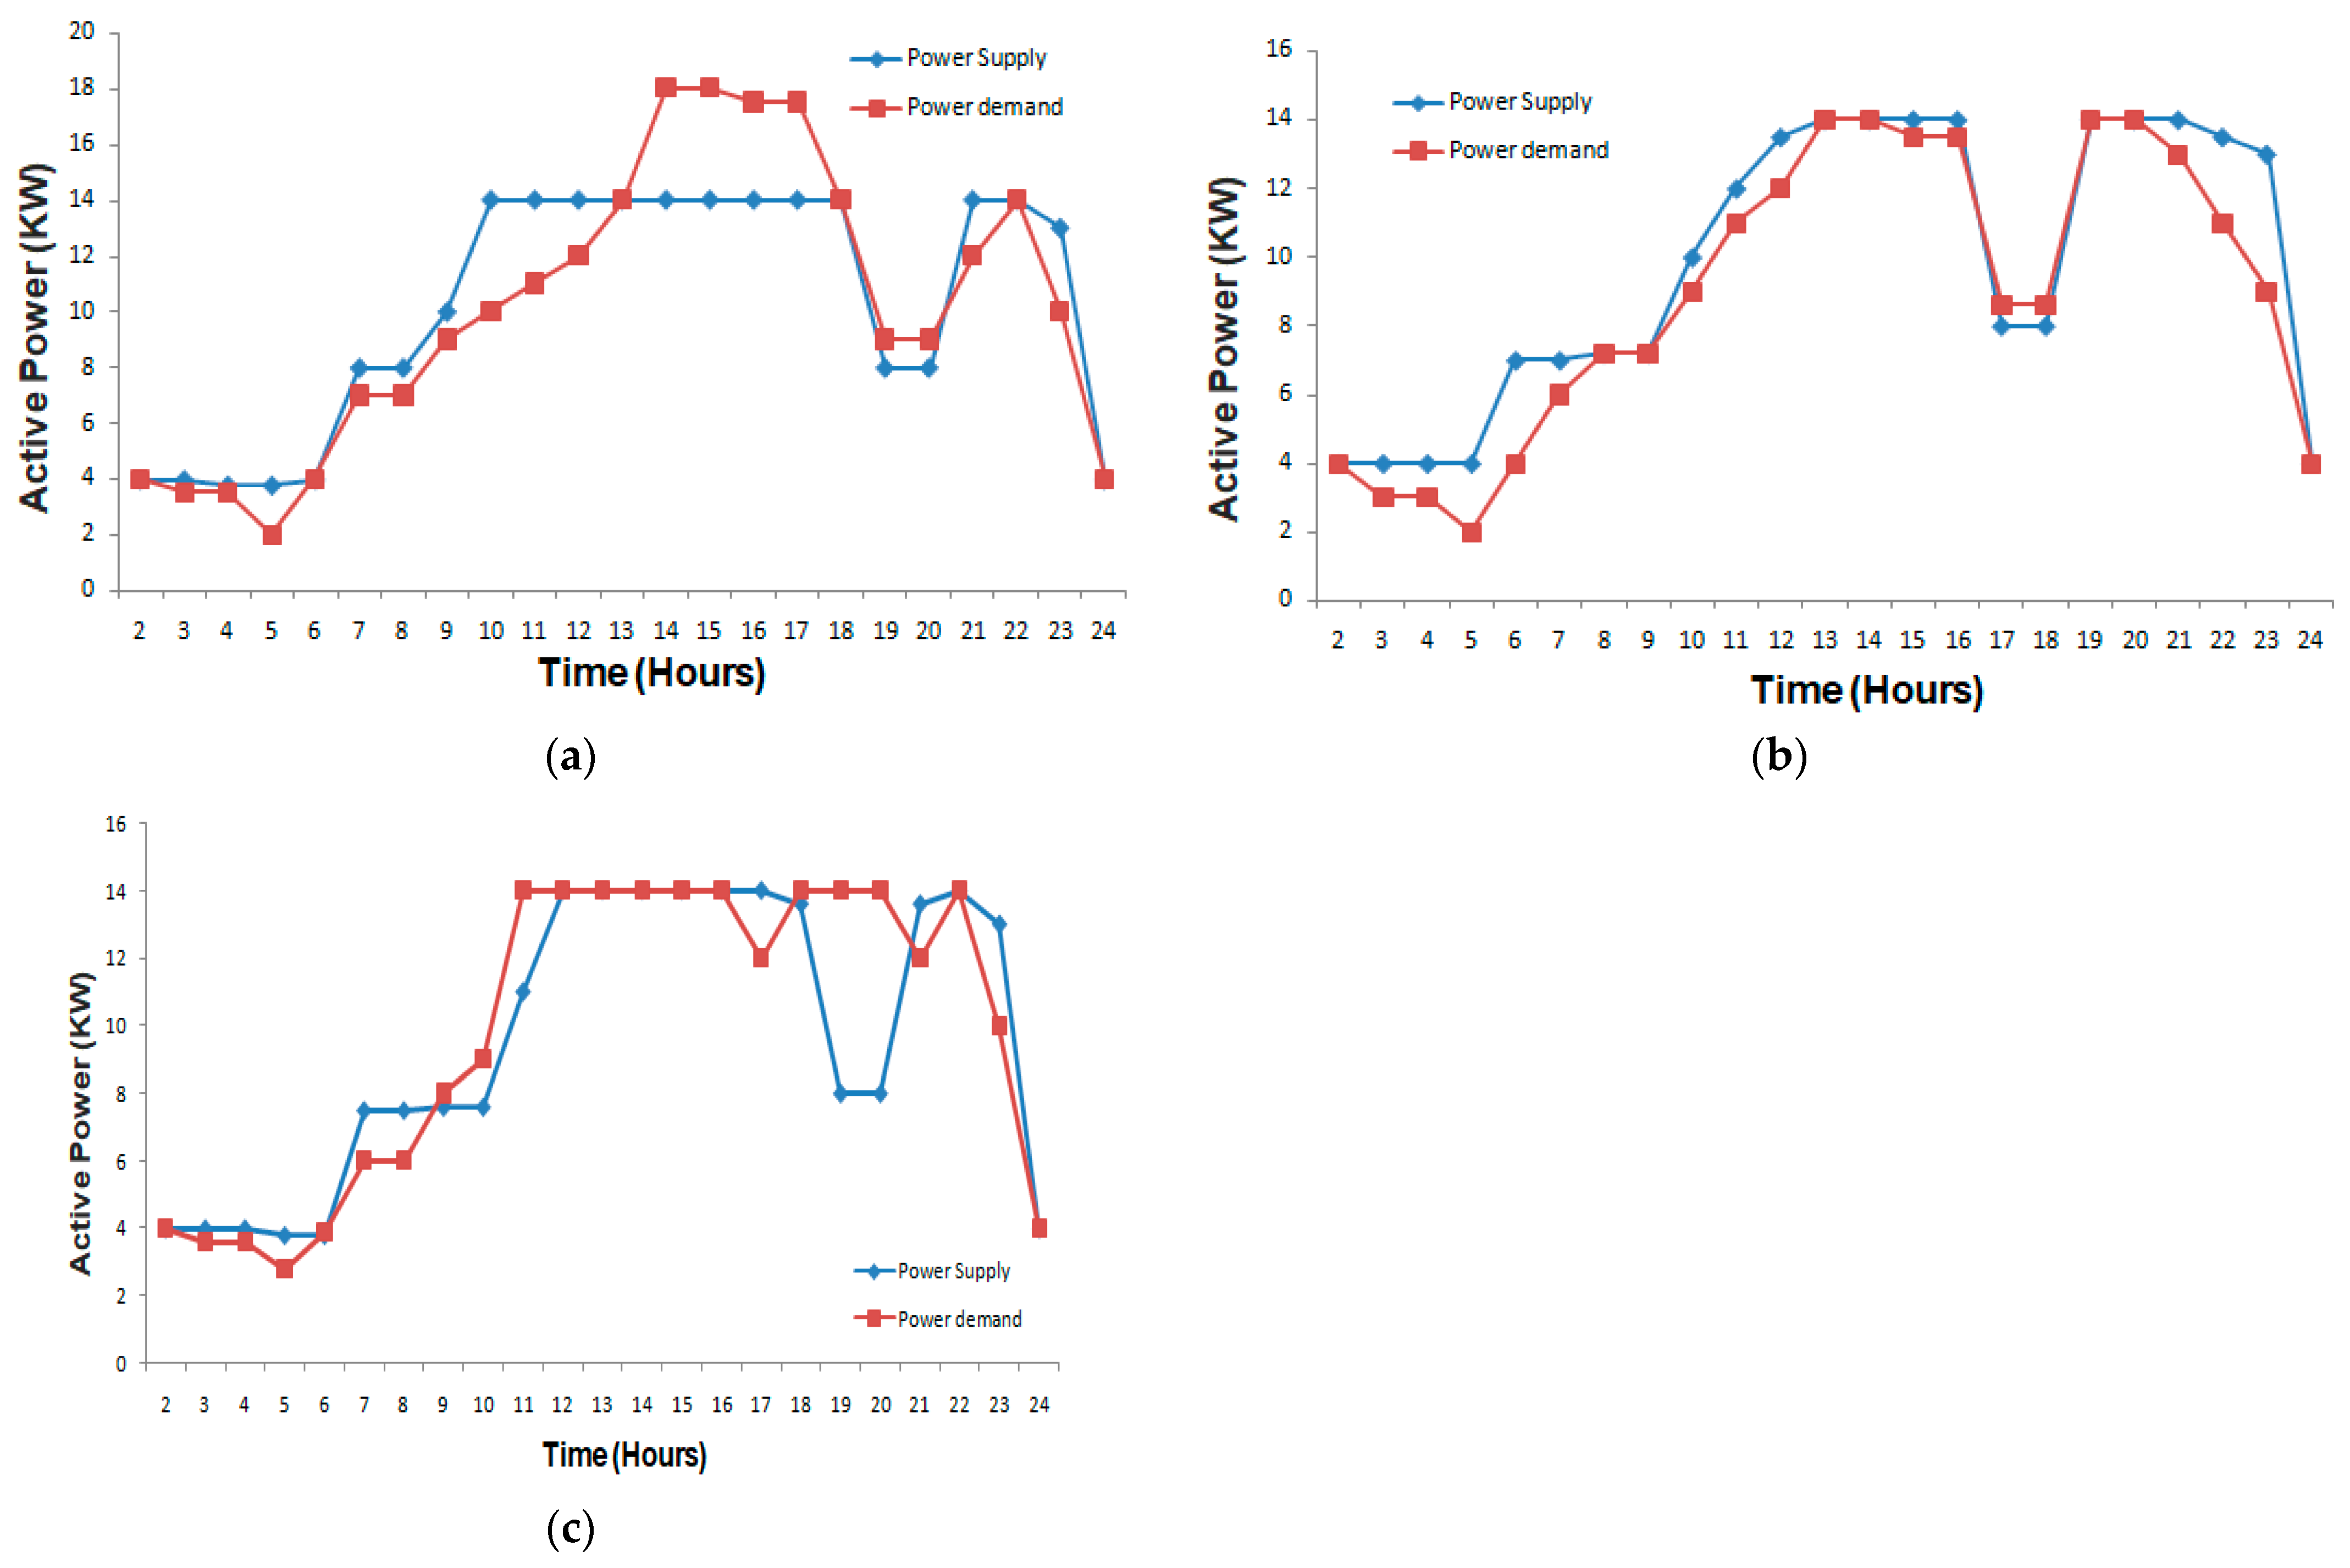
MG1, MG2, and MG3 have production ratings of 4 kW, 4 kW, and 6 kW individually. Hence, they can accomplish the load mandate of 14 kW during islanded mode. Figure 20a shows the plotting of the active power for a period of 24 h with respect to the supply and load requirement. For 24 h simulation in MATLAB, one simulation time is 1 s so 24 × 3600 is equivalent to 24 h in the simulation environment. The real power while load requirement is amplified from 14 kW to 20 kW of production during 12:00 h to 17:00 h with no BESS backup is presented in Figure 20b. As there is no backup power, the load has been cut off above the production limit of 14 kW as presented in Figure 20b. However, it is the duty of production sites to satisfy the load mandate for customer needs in any situation. So, shifting the load is performed to duration when the load requirement is less and could be delivered through a BESS. For this purpose, the load mandate beyond 14 kW is accustomed or moved to the duration from 09:00 h to 11:00 h and 18:00 h to 19:00 h as given in Figure 20c. The additional load mandate may be satisfied by transferring the load to the low-utilizing duration or providing a BESS support to the MGs (MG1 to MG3).

5.3.3. Power Quality Factors Valuation by the Influence of Switching Delay and off-Nominal Frequency

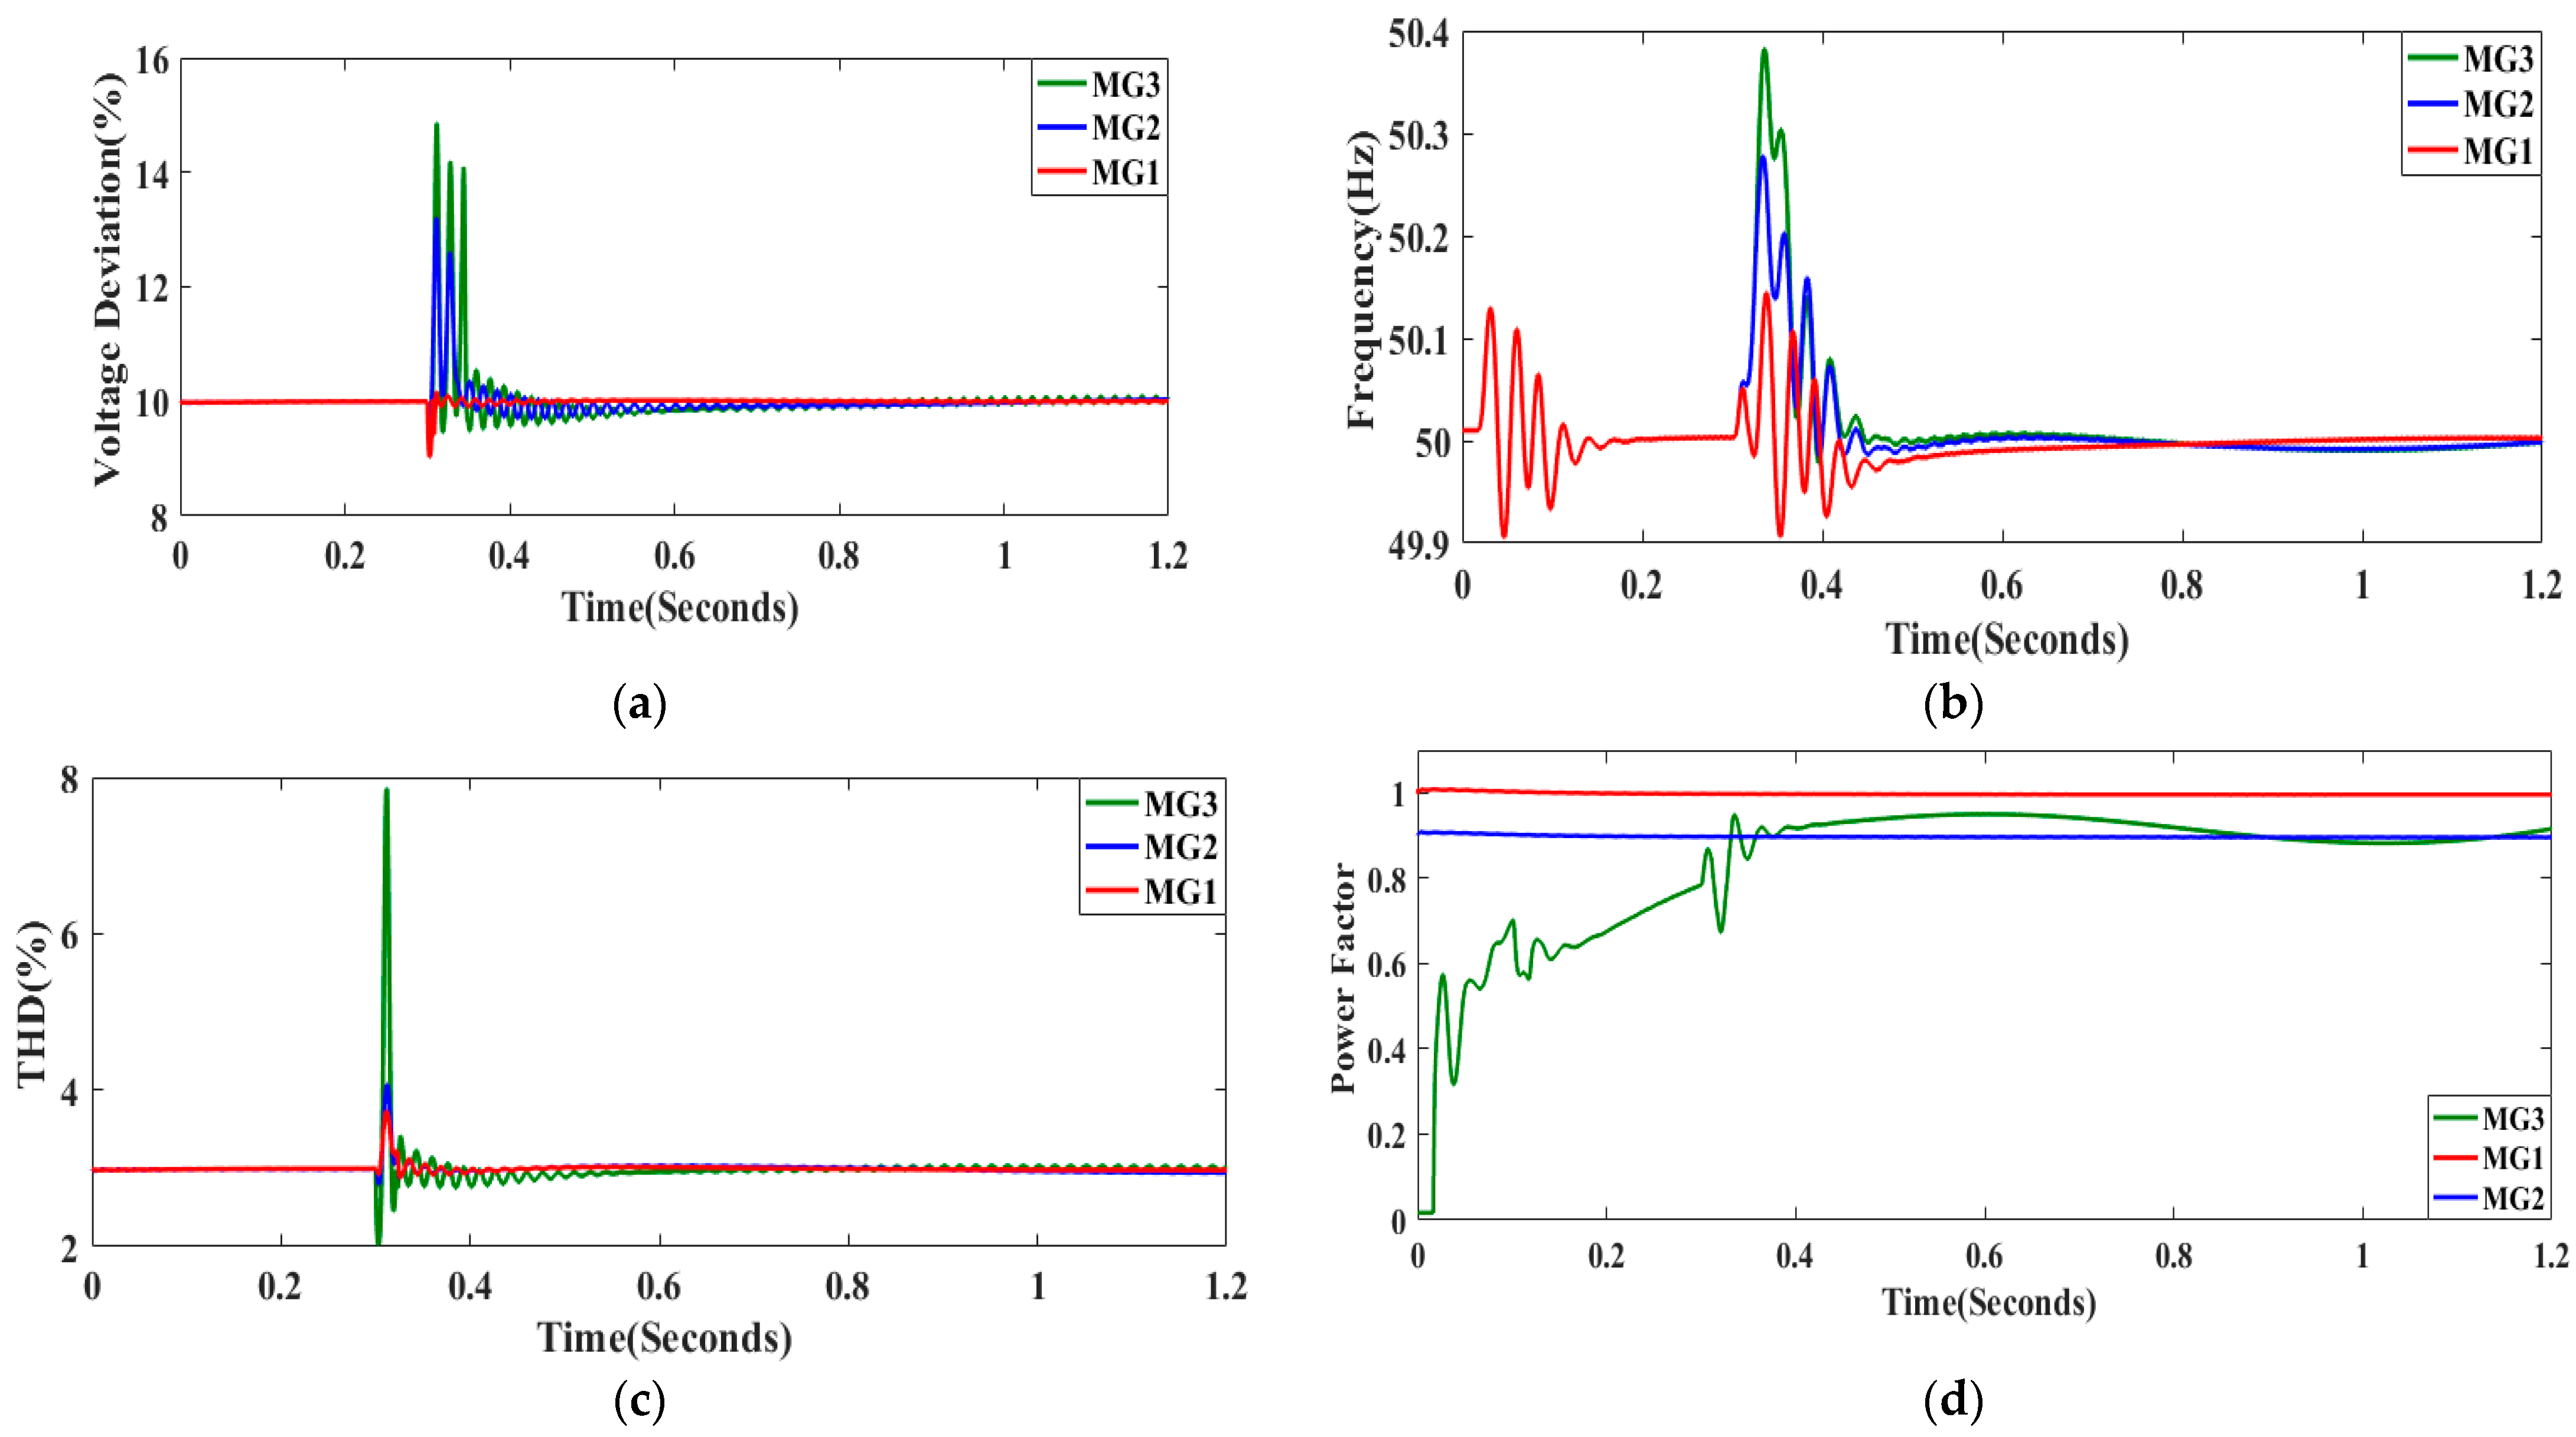
The complex MG arrangement has the ability to distribute the power between the three small DERs with the help of utility grid in grid-tied and islanding modes of operation as mentioned in Section 5.3.1 and Section 5.3.2. The power quality factors have been measured for authenticating the working of NARX-based regulator for local MG (1, 2, and 3) with and without the effect of switching delay. MG1 and MG2 comprise three DERs and three loads with a net capability of 4 kW and load as presented in Figure 5. The impedance of MG1 and MG2 is estimated according to the remoteness of three parallel lines of 50 m and one 300 m line coupled to grid at the PCC. MG3 consists of four DERs associated with four load buses with a load ability of 6 kW. Four equivalent lines of 50 m each are linked in series with 300 m line and the combination has been associated with main grid as presented in Figure 5. The load variants associated with MG1, MG2, and MG3 are given in Table 10 which displays the rating of resistive, inductive and revolving loads. The power quality in the three MGs is influenced through the type of load and switching from grid-connected mode of operation to off-grid mode. The NARX-based controller ability has been explored during switching duration with the influence of the switching delay on power quality issues. The power quality parameters variation has been shown in Figure 21a to Figure 21d when the application of proposed controller is hindered by 0.05 s during changeover from grid-tied to off-grid approach of operation.

Switching Delay (Case a)

The switching delay condition is the change of state of the MG from grid-connected mode of operation to islanded mode through the three phase breaker adjustment. The practical MG assembly is simulated for 1.2 s in Matlab/Simulink environment. The changeover (grid-tied to islanding mode) happens at 0.3 s while the main grid is detached from PCC and the 14 kW power is to be delivered by the remote local MG (1, 2, and 3). The voltage deviation curve is plotted in Figure 21a which justifies that MG1 shows least fluctuation during changeover in comparison to MG2 and MG3 because of its least equivalent impedance. At the end of switching, the voltage seems to be steady at 0.38 s in islanded mode exposed to controller operation hindered by 0.05 s just later 0.3 s as presented in Figure 21a,b shows that MG1 have least fluctuation of THD during the switching period for a resistive load of 4 kW but MG3 has revealed huge transients at 0.3 s due to grouping of resistive, inductive, and rotating loads of 6 kW. After 0.45 s the THDs of MG1, MG2, and MG3 are found to become stable to 3.5%, which is lower to the limit as mentioned in Section 1. It can be observed that the THD is limited inside 0.30 and 0.36 by the introduction of 0.05 s delay due to breaking process along with controller operation. The investigation of frequency deviations shows that the initial decline in frequency of 49.85 Hz at 0.14 s in case of MG3 was aroused by the starting of 1 kW induction motor linked on load 9. The frequency deviation is observed in MG1, MG2, and MG3 at the duration of switching but the deviation lie within the permissible limit of ± 0.5   Hz which will not disturb the MG operation. The MG1, MG2, and MG3 individual frequencies have been stable after 0.4 s during islanded mode. The switching delay may introduce transients in the PF according to the load type. It can be seen that the rotating load at load 9 associated with MG3 have shown huge transients at the time of transition from grid-connected mode to islanded mode because of suspension of controller operation by 0.05 s as presented in Figure 21c. The power factor is found to be poor (0.4), due to starting of the 1 kW induction motor load and when it achieves its rated speed at 0.17 s then PF attains stable magnitude of 0.92 as shown in Figure 21d. The values of PF for MG1 and MG2 are steady and even because of the constant resistive and inductive loads.

Off-Nominal Frequency Circumstances with Influence of Switching Delay and Supplementary Noise (Case b)

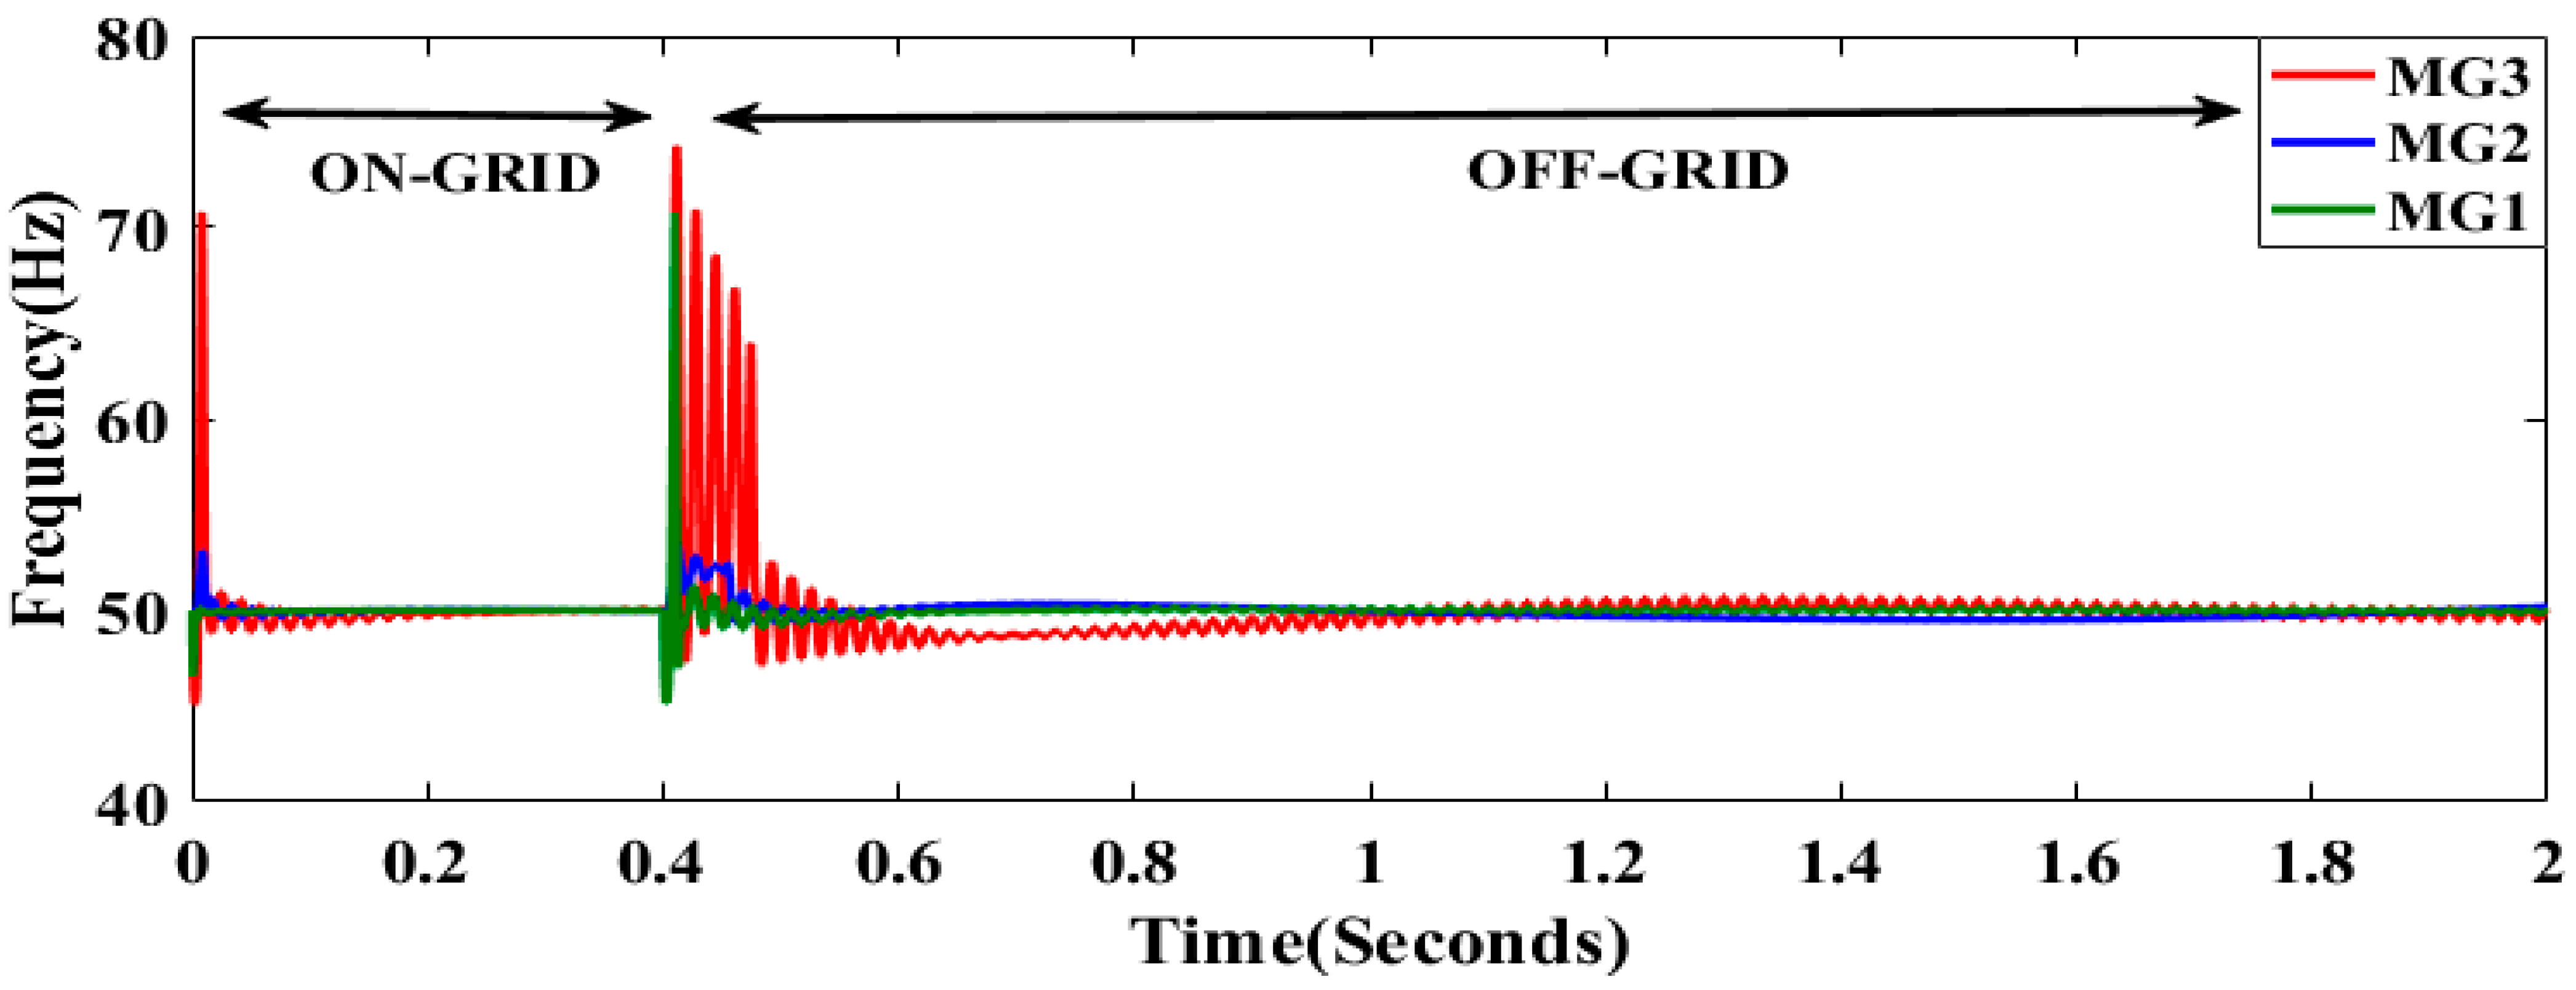
The complex MG assembly is verified for off-nominal circumstances along with the switching delay and additional noise. A noise is introduced during islanded mode of operation at time t = 0.40 s. The alteration of noise may be shown as the dependent of real power fluctuation and can be given by ‘ f p j i p j ( t τ ) p i ( t τ ) ) ’ representing the state range of i t h DER from nearby DER ‘ J ’; ‘ τ ’ is the introduced time interruption. The noise introduced with a variance of 0.2 and switching delay of 0.15 s are supplied at the time of changeover from grid-connected mode to islanded mode of operation at time t = 0.40 s. The frequency plot verifies that the basic frequencies of the three MGs are re-established to 50 Hz and steady after 1 s with the application of the NARX-based controller as shown in Figure 22. The sudden fluctuations in frequency plot have been witnessed in Figure 22 because of the properties of loads coupled such as constant R-load in MG1, static L-load in case of MG2, and constant-R, L and revolving loads for MG3 as given in Table 10. When the additional noise is introduced with the variance of 0.2, instability in frequency curves of three MGs have been seen. The transient magnitude in frequency (0.4 s to 0.6 s) can be decreased by minimizing the alteration amplitude of the additional noise as given in Figure 22. The separate regulation of inverter is slower for islanded mode of operation taking into account the effect of both switching delay and additional noise. Due to this phenomenon, the coupling acquaintances are influenced by switching interruption along with noise added in scattered MGs. From the above discussions it can be resolved that the proposed NARX-based controller produces necessary control action taking into account off-nominal circumstances with switching interruption and supplementary referenced noise to that of basic system frequency of 50 Hz.

5.3.4. TMS320-Based Processor-in-Loop (PIL) Validation

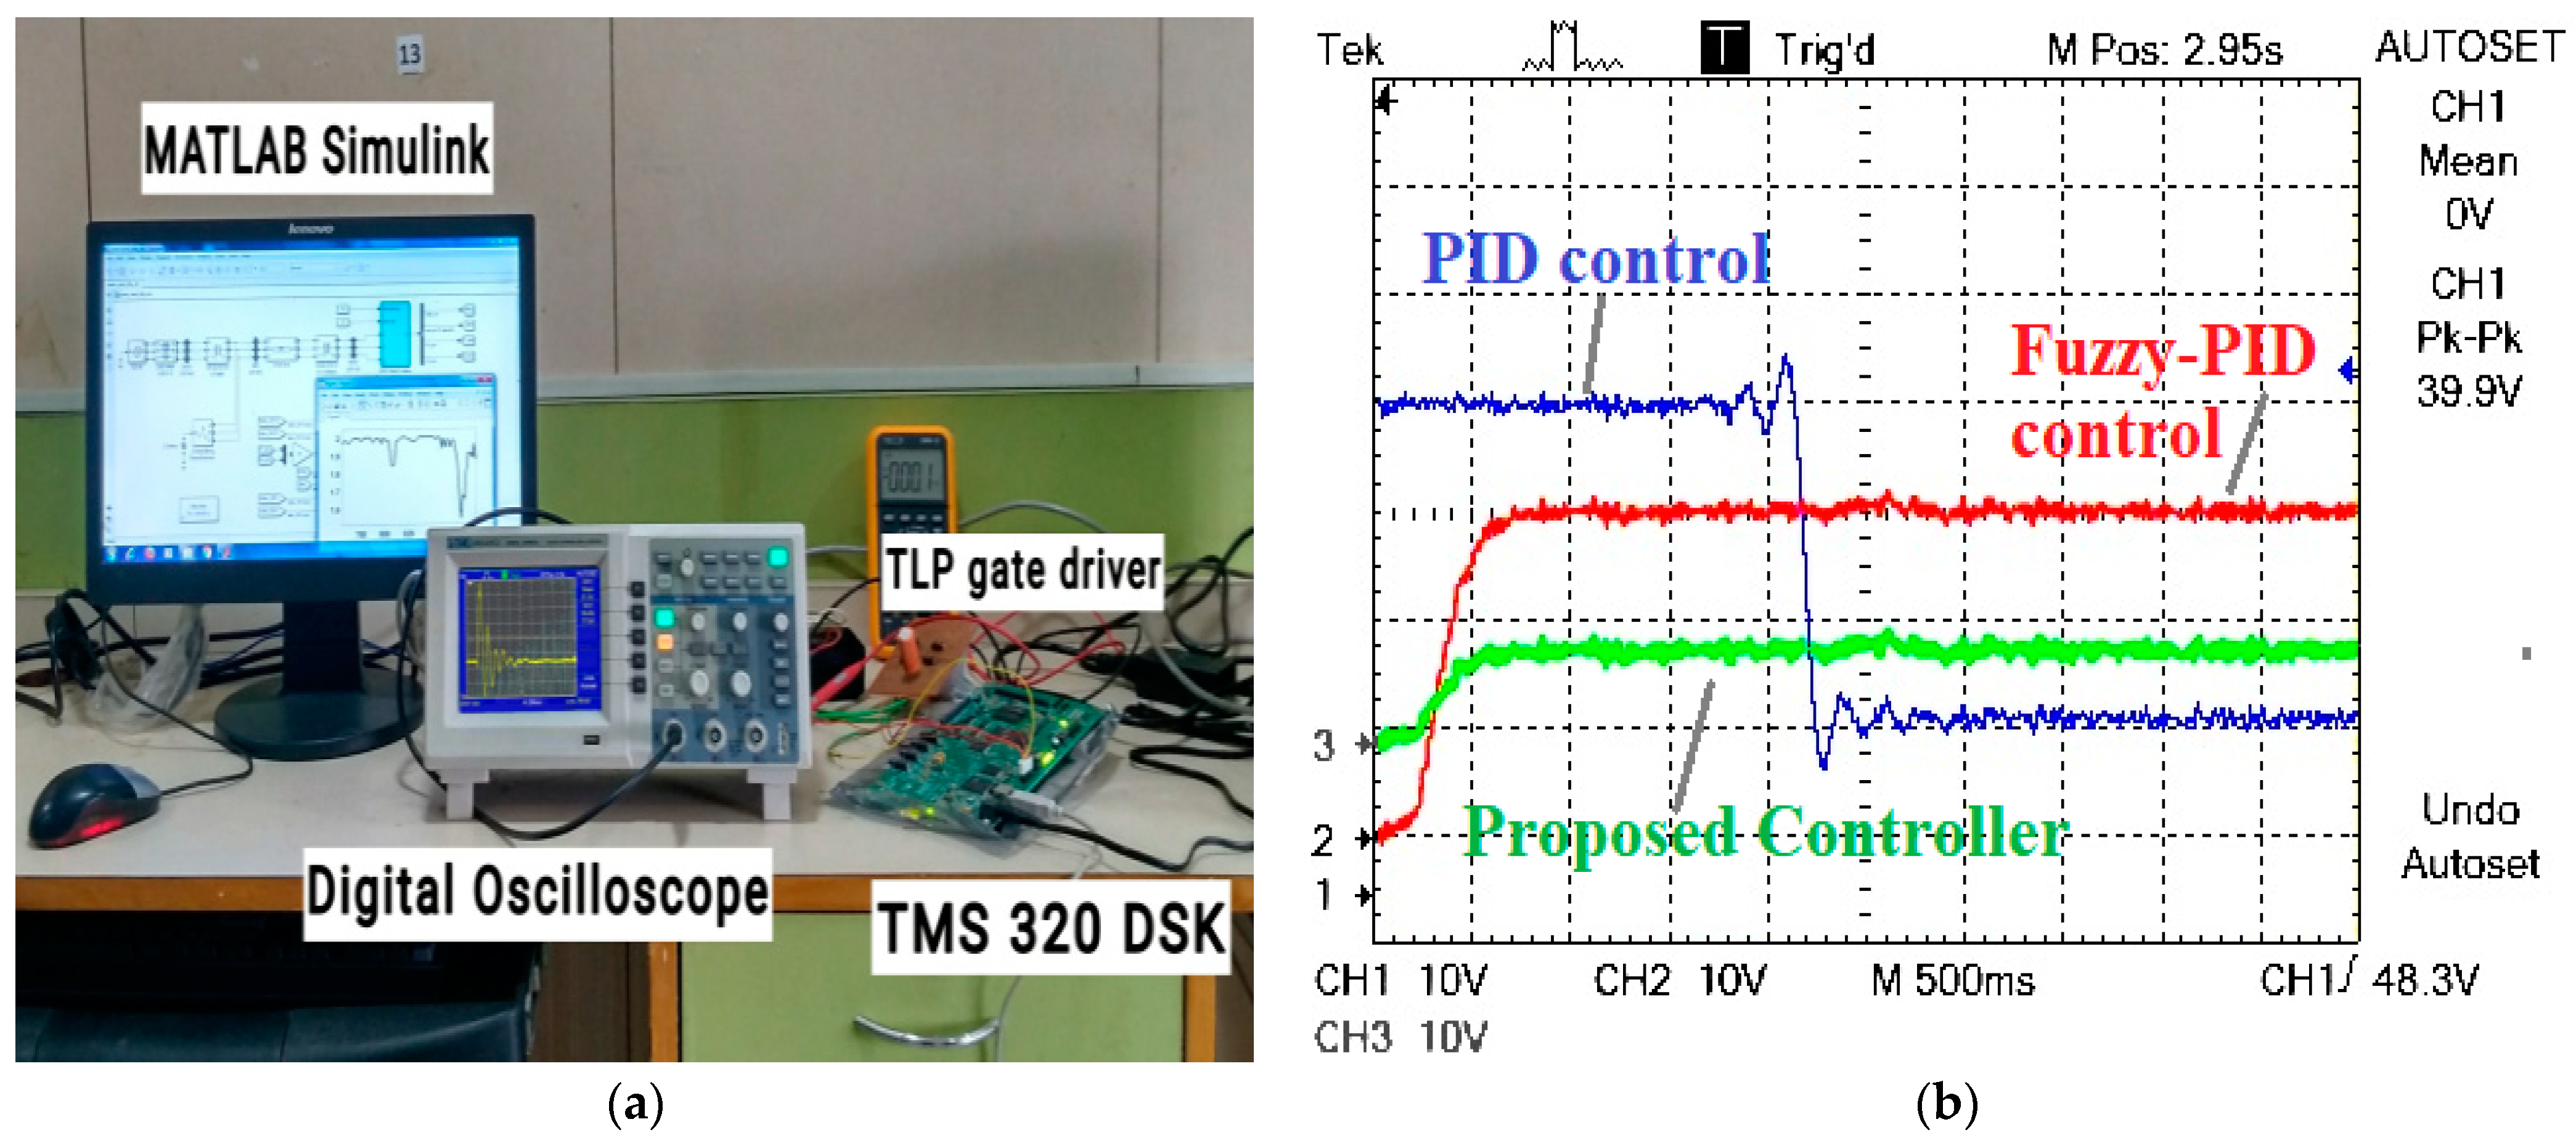
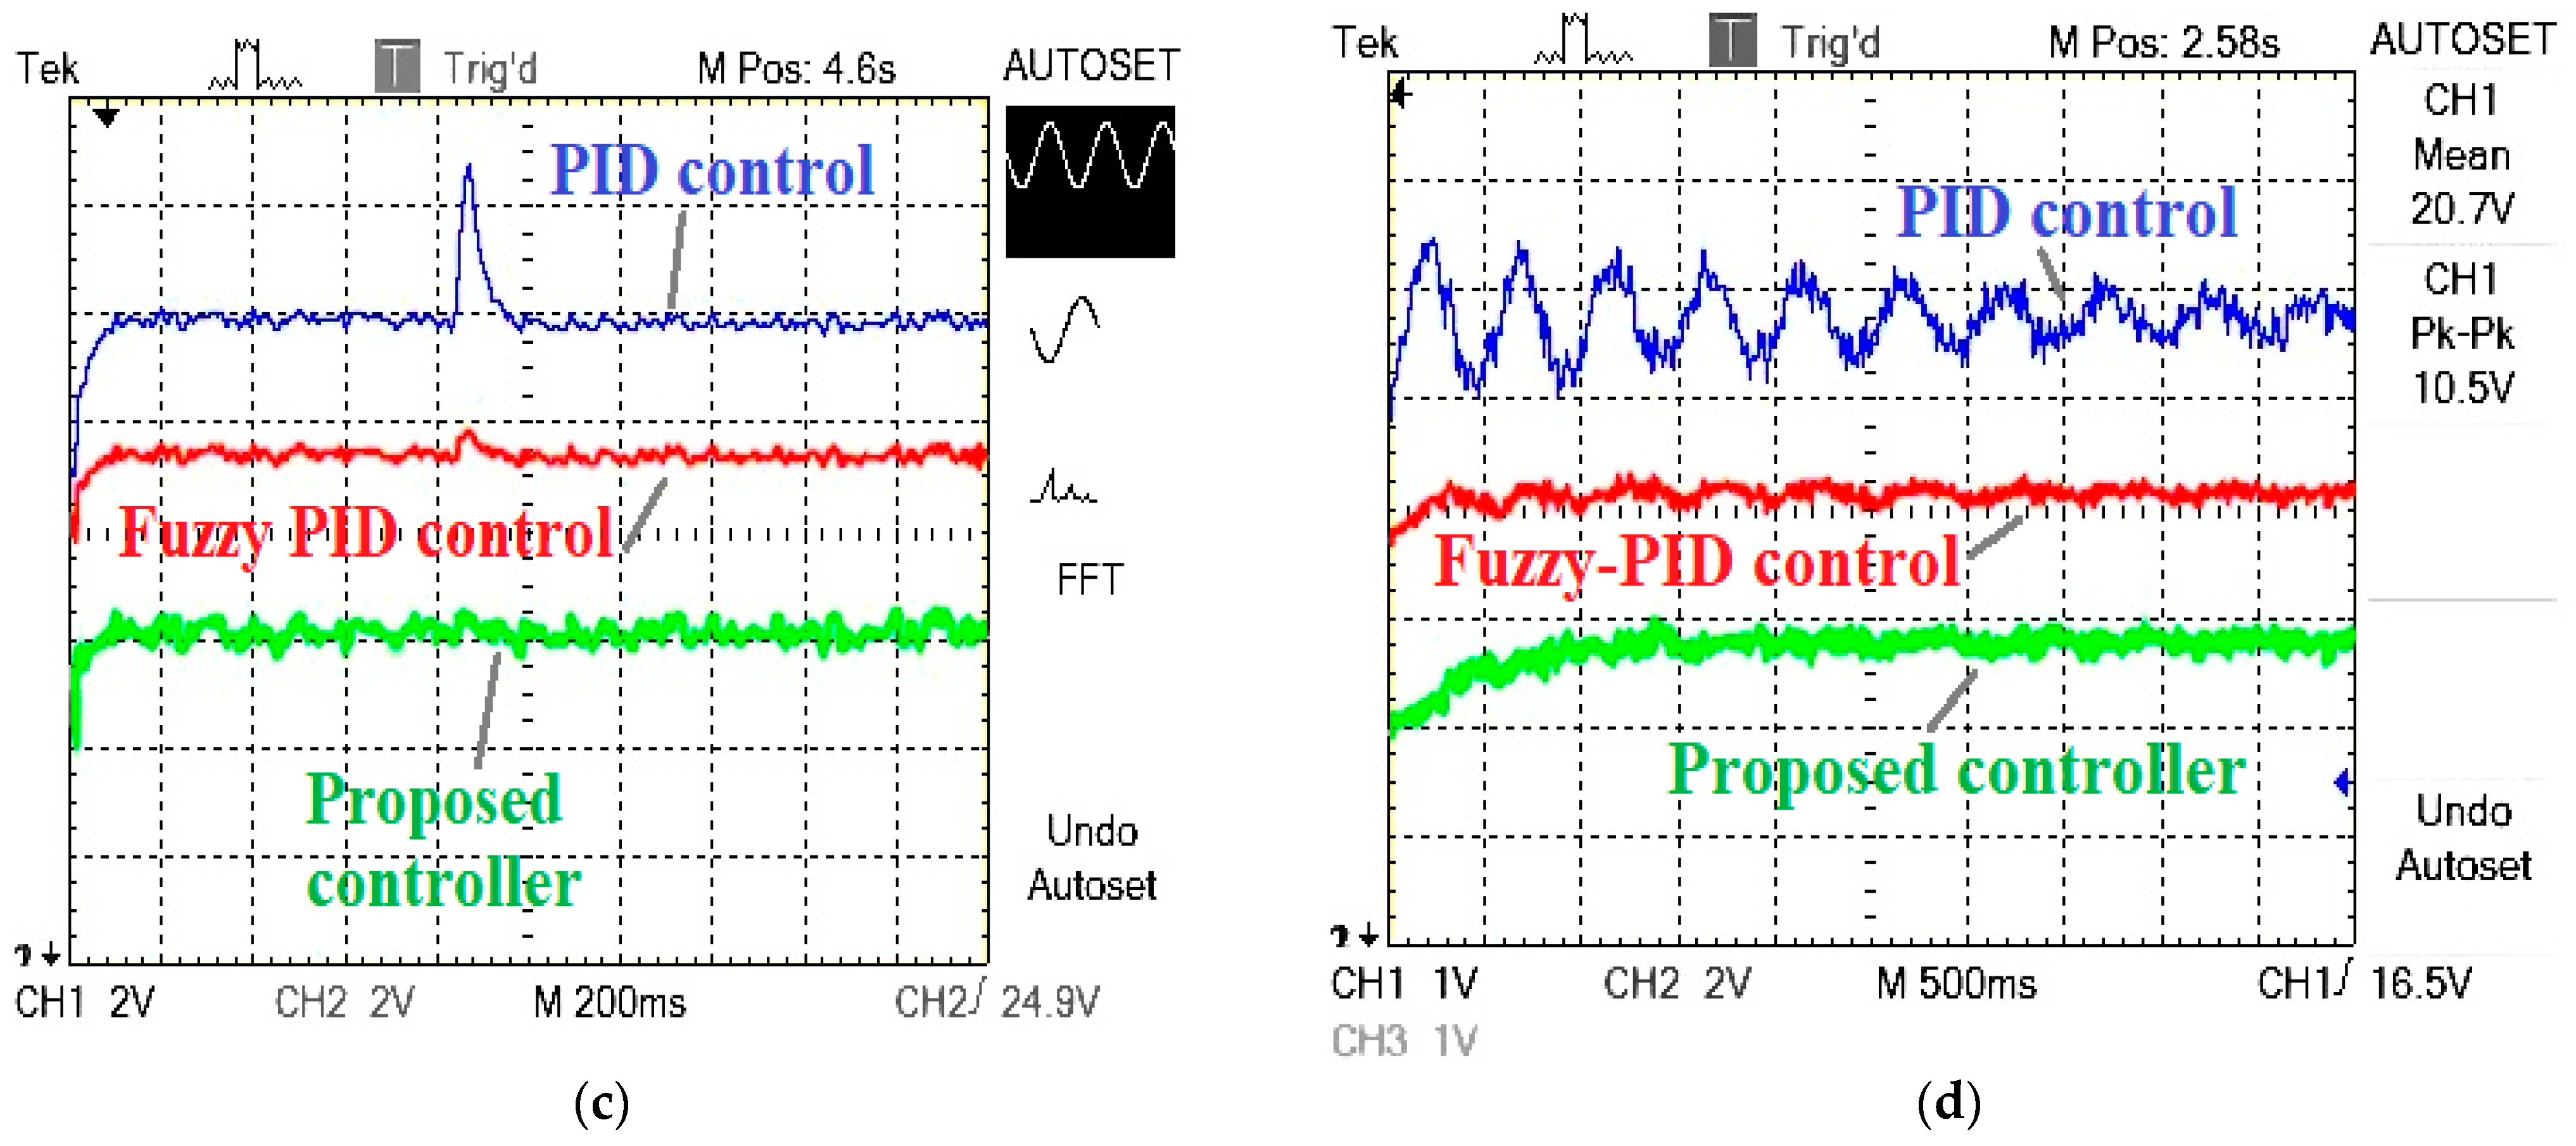
To validate the performance of the proposed controller-based DG stability in ADN a PIL simulation is considered as shown in Figure 23. The considered system (Figure 1) with RSC/GSC-based WPGS-DG is modelled (Table 1) in MATLAB Simulink environment. To validate the feedback controller path a TMS 320C6713 (32 bit floating point DSP with baud rate up to 225 MHz [23]) digital signal processor (DSP) platform-based study is presented. The micro-grid model data is subjected to the ADN as ‘Controlled Voltage Source’ in Simulink library, where the contingencies are simulated. The IDGC-based feedback path is designed and implemented for same sample time (10 kHz) in TMS320. The DSP kit is integrated with MATLAB Simulink-based grid architecture by Embedded USB JTAG cable. The software interfacing is achieved by Code Composer Studio (i.e., CCStudio v3.1), Texas Instruments. DSK6713_waitusec (td) syntax is used to provide sufficient delay time between data transit from one platform to other. The controllers’ response under uncertainty is manifested across Toshiba TLP 250 gate driver and plotted on Tektronix TBS1022 Digital Storage Oscilloscope/ DSO. The validation of figures (Figure 11a–c) for Case 2 of Section 5.2.1 have been conducted and shown in Figure 22, Figure 23c,d, respectively.

6. Conclusions

The NARX controller is employed to sustain the PQ issues of the MG system for grid-tied and off-grid approaches of operation displaying acceptable consequences. This study examines the PQ issues taking into account factors including fluctuation of voltage, sag and swell conditions of voltage, voltage destabilizing, frequency, THD, and PF. The proposed NARX-based controller optimizes these factors. The proposed controller can operate adequately irrespective of the type of DERs and regardless of the topographical position of MG system allowing multiple international standards to preserve the PQ issues. Further unaffected by the presence of a huge number of factors and nonlinearity in mathematical equations, it can be observed that the NARX-based technique produces speedy, uniform, and steady operation in MGs to improve the efficiency of operation. The alteration in the working environment demands repeated training of the NARX controller which is computationally lengthy. Multiple test scenarios are taken into consideration which coincide with each other. It can be found out that if the proposed controller can bring the transients to normal state within duration of 700 ms, then re-training of NARX is not essential. The proposed NARX technique has 10 hidden layer neurons for training and testing, and the results are being compared with the conventional PID and fuzzy-PID-based controllers, which clarifies best performance of NARX technique using Matlab/Simulink architecture. The complex MG assembly is realised by taking multiple DERs and loads attached to a utility grid and is scrutinized for the evaluation of PQ factors for grid-connected and islanded mode taking into account effect of LI. The efficiency of the proposed technique is satisfactorily verified along with a switching delay on the controller operation when changeover happens from grid-connected to islanded mode of operation. The results suggest that the NARX-based controller shows transients in operation and slightly sluggish response because of the delay in controller operation during switching duration. The three practical MGs share sensible quantity of power and losses between the DERs and main grid. The demand response analysis shows load sharing profiles which have shown equilibrium between power supply and demand through off-grid operation. Further, the complex MG arrangement is also simulated effectively with off-nominal frequency environments with variation in switching interruption and supplementary noise for the changeover from grid-connected mode to islanded mode of operation. The system under study and the proposed controller with a case study has also been validated using TMS320-based processor-in-loop (PIL) for real time applications. The future scope various robust controllers-based on artificial intelligence (AI) and machine learning (ML) techniques may be implemented to achieve faster and more accurate control actions towards power quality improvement.

Author Contributions

Conceptualization, N.N.; Methodology, Anshuman Satpathy; Formal analysis, A.S. and T.P.; Investigation, A.S.; Data curation, A.S. and T.P.; Supervision, N.N.; Funding acquisition, A.S. All authors have read and agreed to the published version of the manuscript.

Funding

This research did not receive any specific grant from funding agencies in the public, commercial, or not-for-profit sectors.

Data Availability Statement

Not applicable.

Acknowledgments

The authors hereby acknowledge the authority of MDRC, Institute of Technical Education and Research (SOA Deemed to be University), India for offering the infrastructural and hardware facility for the present research work.

Conflicts of Interest

The author declares no conflict of interest.

References

  1. Elsaharty, M.A.; Candela, J.I.; Rodriguez, P. Custom power active transformer for flexible operation of power systems. IEEE Trans. Power Electron. 2017, 33, 5773–5783. [Google Scholar] [CrossRef] [Green Version]
  2. Yáñez-Campos, S.C.; Cerda-Villafaña, G.; Lozano-Garcia, J.M. Two-Feeder Dynamic Voltage Restorer for Application in Custom Power Parks. Energies 2019, 12, 3248. [Google Scholar] [CrossRef] [Green Version]
  3. Manikandan, M.S.; Samantaray, S.R.; Kamwa, I. Detection and classification of power quality disturbances using sparse signal decomposition on hybrid dictionaries. IEEE Trans. Instrum. Meas. 2014, 64, 27–38. [Google Scholar] [CrossRef]
  4. Wang, L.; Lam, C.S.; Wong, M.C. Hybrid structure of static var compensator and hybrid active power filter (SVC//HAPF) for medium-voltage heavy loads compensation. IEEE Trans. Ind. Electron. 2017, 65, 4432–4442. [Google Scholar] [CrossRef]
  5. Mehouachi, I.; Abbes, M.; Chebbi, S. Design of a high power D-STATCOM based on the isolated dual-converter topology. Int. J. Electr. Power Energy Syst. 2019, 106, 401–410. [Google Scholar] [CrossRef]
  6. Liu, Y.W.; Rau, S.H.; Wu, C.J.; Lee, W.J. Improvement of power quality by using advanced reactive power compensation. IEEE Trans. Ind. Appl. 2017, 54, 18–24. [Google Scholar] [CrossRef]
  7. Lakshmi, S.; Ganguly, S. Multi-objective planning for the allocation of PV-BESS integrated open UPQC for peak load shaving of radial distribution networks. J. Energy Storage 2019, 22, 208–218. [Google Scholar] [CrossRef]
  8. Chishti, F.; Murshid, S.; Singh, B. Development of wind and solar based ac microgrid with power quality improvement for local nonlinear load using MLMS. IEEE Trans. Ind. Appl. 2019, 55, 7134–7145. [Google Scholar]
  9. Bhattacharjee, C.; Roy, B.K. Advanced fuzzy power extraction control of wind energy conversion system for power quality improvement in a grid tied hybrid generation system. IET Gener. Transm. Distrib. 2016, 10, 1179–1189. [Google Scholar] [CrossRef]
  10. Kaushal, J.; Basak, P. Power quality control based on voltage sag/swell, unbalancing, frequency, THD and power factor using artificial neural network in PV integrated AC microgrid. Sustain. Energy Grids Netw. 2020, 23, 100365. [Google Scholar] [CrossRef]
  11. Hatziargyriou, N. (Ed.) Microgrids: Architectures and Control; John Wiley & Sons: Hoboken, NJ, USA, 2014. [Google Scholar]
  12. Kazmierkowski, M.; Silva, F.A. Clean energy microgrids [book news]. IEEE Ind. Electron. Mag. 2018, 12, 79–80. [Google Scholar] [CrossRef]
  13. Hatziargyriou, N. Microgrids Control Issues. 2014. Available online: https://ieeexplore.ieee.org/abstract/document/6689675 (accessed on 8 November 2022).
  14. Bevrani, H.; Habibi, F.; Babahajyani, P.; Watanabe, M.; Mitani, Y. Intelligent frequency control in an AC microgrid: Online PSO-based fuzzy tuning approach. IEEE Trans. Smart Grid 2012, 3, 1935–1944. [Google Scholar] [CrossRef]
  15. Karthikeyan, M.; Sharmilee, K.; Balasubramaniam, P.M.; Prakash, N.B.; Babu, M.R.; Subramaniyaswamy, V.; Sudhakar, S. Design and implementation of ANN-based SAPF approach for current harmonics mitigation in industrial power systems. Microprocess. Microsyst. 2020, 77, 103194. [Google Scholar] [CrossRef]
  16. Bevrani, H.; Shokoohi, S. An intelligent droop control for simultaneous voltage and frequency regulation in islanded microgrids. IEEE Trans. Smart Grid 2013, 4, 1505–1513. [Google Scholar] [CrossRef]
  17. Agarwal, R.K.; Hussain, I.; Singh, B. Implementation of LLMF control algorithm for three-phase grid-tied SPV-DSTATCOM system. IEEE Trans. Ind. Electron. 2016, 64, 7414–7424. [Google Scholar] [CrossRef]
  18. Singh, B.; Kandpal, M.; Hussain, I. Control of grid tied smart PV-DSTATCOM system using an adaptive technique. IEEE Trans. Smart Grid 2016, 9, 3986–3993. [Google Scholar] [CrossRef]
  19. Kannan, V.K.; Rengarajan, N. Investigating the performance of photovoltaic based DSTATCOM using I cos Φ algorithm. Int. J. Electr. Power Energy Syst. 2014, 54, 376–386. [Google Scholar] [CrossRef]
  20. Mishra, S.; Ray, P.K. Power quality improvement using photovoltaic fed DSTATCOM based on JAYA optimization. IEEE Trans. Sustain. Energy 2016, 7, 1672–1680. [Google Scholar] [CrossRef]
  21. Shareef, H.; Ibrahim, A.A.; Salman, N.; Mohamed, A.; Ai, W.L. Power quality and reliability enhancement in distribution systems via optimum network reconfiguration by using quantum firefly algorithm. Int. J. Electr. Power Energy Syst. 2014, 58, 160–169. [Google Scholar] [CrossRef]
  22. Baghaee, H.R.; Mirsalim, M.; Gharehpetian, G.B.; Talebi, H.A. Unbalanced harmonic power sharing and voltage compensation of microgrids using radial basis function neural network-based harmonic power-flow calculations for distributed and decentralised control structures. IET Gener. Transm. Distrib. 2017, 12, 1518–1530. [Google Scholar] [CrossRef]
  23. Mousavi, S.Y.; Jalilian, A.; Savaghebi, M.; Guerrero, J.M. Autonomous control of current-and voltage-controlled DG interface inverters for reactive power sharing and harmonics compensation in islanded microgrids. IEEE Trans. Power Electron. 2018, 33, 9375–9386. [Google Scholar]
  24. Panda, A.K.; Penthia, T. Design and modeling of SMES based SAPF for pulsed power load demands. Int. J. Electr. Power Energy Syst. 2017, 92, 114–124. [Google Scholar] [CrossRef]
  25. Kumar, G.S.; Kumar, B.K.; Mishra, M.K. Mitigation of voltage sags with phase jumps by UPQC with PSO-based ANFIS. IEEE Trans. Power Deliv. 2011, 26, 2761–2773. [Google Scholar] [CrossRef]
  26. Roy, K.; Mandal, K.K.; Mandal, A.C.; Patra, S.N. Analysis of energy management in micro grid–A hybrid BFOA and ANN approach. Renew. Sustain. Energy Rev. 2018, 82, 4296–4308. [Google Scholar] [CrossRef]
  27. Baghaee, H.R.; Mirsalim, M.; Gharehpetian, G.B. Power calculation using RBF neural networks to improve power sharing of hierarchical control scheme in multi-DER microgrids. IEEE J. Emerg. Sel. Top. Power Electron. 2016, 4, 1217–1225. [Google Scholar] [CrossRef]
  28. Tiwari, S.K.; Singh, B.; Goel, P.K. Design and control of microgrid fed by renewable energy generating sources. IEEE Trans. Ind. Appl. 2018, 54, 2041–2050. [Google Scholar]
  29. Wen, S.; Wang, S.; Liu, G.; Liu, R. Energy management and coordinated control strategy of PV/HESS AC microgrid during Islanded operation. IEEE Access 2018, 7, 4432–4441. [Google Scholar] [CrossRef]
  30. Kumar, N.; Singh, B.; Panigrahi, B.K. Framework of Gradient Descent Least Squares Regression-Based NN Structure for Power Quality Improvement in PV-Integrated Low-Voltage Weak Grid System. IEEE Trans. Ind. Electron. 2019, 66, 9724–9733. [Google Scholar] [CrossRef]
  31. Acharya, D.P.; Nayak, N.; Choudhury, S. Power quality enhancement of a photovoltaic based micro grid system using optimized fuzzy controller with SAPF. In Proceedings of the 2019 International Conference on Smart Systems and Inventive Technology (ICSSIT), Tirunelveli, India, 27–29 November 2019. [Google Scholar]
  32. Corrêa, J.M.; Farret, F.A.; Canha, L.N.; Simoes, M.G. An electrochemical-based fuel-cell model suitable for electrical engineering automation approach. IEEE Trans. Ind. Electron. 2004, 51, 1103–1112. [Google Scholar] [CrossRef]
  33. Acharya, D.P.; Nayak, N.; Choudhury, S.; Padhy, R. Power quality improvement in a fuel-cell based micro-grid with shunt active power filter. Int. J. Renew. Energy Res. (IJRER) 2020, 10, 1071–1082. [Google Scholar]
  34. Parida, S.M.; Choudhury, S.; Rout, P.K.; Kar, S.K. A new self-adjusting PI controller for power control in a wind turbine generator. World J. Eng. 2018, 15, 362–372. [Google Scholar] [CrossRef]
  35. Lawder, M.T.; Suthar, B.; Northrop, P.W.; De, S.; Hoff, C.M.; Leitermann, O.; Crow, M.L.; Santhanagopalan, S.; Subramanian, V.R. Battery energy storage system (BESS) and battery management system (BMS) for grid-scale applications. Proc. IEEE 2014, 102, 1014–1030. [Google Scholar] [CrossRef]
  36. Xu, X.; Bishop, M.; Oikarinen, D.G.; Hao, C. Application and modeling of battery energy storage in power systems. CSEE J. Power Energy Syst. 2016, 2, 82–90. [Google Scholar] [CrossRef]
  37. Laaksonen, H.; Saari, P.; Komulainen, R. Voltage and frequency control of inverter based weak LV network microgrid. In Proceedings of the International Conference on Future Power Systems, Amsterdam, The Netherlands, 18 November 2005; pp. 1–6. [Google Scholar]
  38. Boussaada, Z.; Curea, O.; Remaci, A.; Camblong, H.; Mrabet Bellaaj, N. A nonlinear autoregressive exogenous (NARX) neural network model for the prediction of the daily direct solar radiation. Energies 2018, 11, 620. [Google Scholar] [CrossRef]
  39. Marcjasz, G.; Uniejewski, B.; Weron, R. On the importance of the long-term seasonal component in day-ahead electricity price forecasting with NARX neural networks. Int. J. Forecast. 2019, 35, 1520–1532. [Google Scholar] [CrossRef]
  40. Hao, Y.; Wilamowski, B.M. Levenberg-marquardt training. In Industrial Electronics Handbook; CRC Press: Auburn, AL, USA, 2011; Volume 5. [Google Scholar]
  41. Møller, M.F. A scaled conjugate gradient algorithm for fast supervised learning. Neural Netw. 1993, 6, 525–533. [Google Scholar] [CrossRef]
  42. Khoshgam, Z.; Ashrafi, A. A new modified scaled conjugate gradient method for large-scale unconstrained optimization with non-convex objective function. Optim. Methods Softw. 2019, 34, 783–796. [Google Scholar] [CrossRef]
  43. Khan, I.; Raja, M.A.; Shoaib, M.; Kumam, P.; Alrabaiah, H.; Shah, Z.; Islam, S. Design of Neural Network with Levenberg-Marquardt and Bayesian Regularization Backpropagation for Solving Pantograph Delay Differential Equations. IEEE Access 2020, 8, 137918–137933. [Google Scholar] [CrossRef]
  44. Khorramabadi, S.S.; Bakhshai, A. Critic-based self-tuning PI structure for active and reactive power control of VSCs in microgrid systems. IEEE Trans. Smart Grid 2014, 6, 92–103. [Google Scholar] [CrossRef]
  45. Bayhan, S.; Demirbas, S.; Abu-Rub, H. Fuzzy-PI-based sensorless frequency and voltage controller for doubly fed induction generator connected to a DC microgrid. IET Renew. Power Gener. 2016, 10, 1069–1077. [Google Scholar] [CrossRef]
  46. Ghosh, S.; Ali, M.H. Minimization of adverse effects of time delay on power quality enhancement in hybrid grid. IEEE Syst. J. 2019, 13, 3091–3101. [Google Scholar] [CrossRef]
  47. Alizadeh, G.A.; Rahimi, T.; Babayi Nozadian, M.H.; Padmanaban, S.; Leonowicz, Z. Improving microgrid frequency regulation based on the virtual inertia concept while considering communication system delay. Energies 2019, 12, 2016. [Google Scholar] [CrossRef] [Green Version]
  48. Liu, S.; Wang, X.; Liu, P.X. Impact of communication delays on secondary frequency control in an islanded microgrid. IEEE Trans. Ind. Electron. 2014, 62, 2021–2031. [Google Scholar] [CrossRef]
Figure 1. Proposed work.
Energies 15 09081 g001
Figure 2. Proposed micro-grid system.
Energies 15 09081 g002
Figure 3. VSC controller for three-phase inverter.
Energies 15 09081 g003
Figure 4. A miniature MG structure with additional line impedance.
Energies 15 09081 g004
Figure 5. Complex MG assembly considering LI.
Energies 15 09081 g005
Figure 6. Flow chart showing Employment of NARX algorithm.
Energies 15 09081 g006
Figure 7. (a) A NARX model for the valuation of the PQ in MG system. (b) NARX controller linked to Wind, PV, and Fuel Cell (DER1, DER2, and DER3) inverters.
Energies 15 09081 g007
Figure 8. (a) Validation performance of proposed system. (b) NARX method histogram MSE.
Energies 15 09081 g008
Figure 9. NARX controller showing best regression.
Energies 15 09081 g009
Figure 10. (a) Schematic diagram of conventional PID controller. (b) Schematic diagram of conventional PID controller.
Energies 15 09081 g010
Figure 11. (a). Comparison of micro-grid voltage deviation (VD). (b) Comparison of micro-grid total harmonic distortion (THD). (c) Comparison of micro-grid frequency. (d) Comparison of micro-grid Power Factor.
Energies 15 09081 g011
Figure 12. (a) Load current waveform with conventional PID. (b) Load current profile with proposed controller. (c) Relative load power variation: real power with PID and NARX controller. (d) Comparative load power profile: unreal power with PID and NARX controller.
Energies 15 09081 g012
Figure 13. (a) MG operation through voltage-sag and voltage-swell: (a) PID-controller. (b) MG operation through voltage-sag and voltage-swell: fuzzy-PID controller. (c) MG operation through voltage-sag and voltage-swell: proposed controller.
Energies 15 09081 g013
Figure 14. (a). MG operation through unbalanced condition: PID controller. (b) MG operation during unbalanced condition: fuzzy-PID controller. (c) MG operation during unbalanced condition: NARX controller.
Energies 15 09081 g014
Figure 15. (a). Voltage delivered by DER1, DER2, and DER3. (b) Voltage supplied by utility grid. (c) Voltage supplied by BES system. (d) Sharing of power by load. (e) Active power supplied by BESS.
Energies 15 09081 g015
Figure 16. (a). Voltage deviation with/without influence of LI. (b) THD with/without influence of LI. (c) Frequency with/without influence of LI. (d) Power Factor with/without influence of LI.
Energies 15 09081 g016aEnergies 15 09081 g016b
Figure 17. (a). Distribution of Power among the DERs. (b) Power allocation by grid using 0% convenience of Solar panel. (c) Power allocation by DERs using 100% convenience of Solar panel.
Energies 15 09081 g017aEnergies 15 09081 g017b
Figure 18. (a). Influence of switching delay on deviation of voltage. (b) Effect of switching delay on THD. (c) Effect of switching delay on frequency. (d) Effect of switching delay on PF.
Energies 15 09081 g018
Figure 19. Loss of power in grid-tied and islanded mode by MG1, MG2, and MG3.
Energies 15 09081 g019
Figure 20. (a) Demand response analysis during islanded mode without load curtailment. (b) Demand response analysis during islanded mode with load curtailment. (c) Demand response analysis during islanded mode showing load shifting/adjustment using BESS.
Energies 15 09081 g020
Figure 21. (a). Voltage deviation of complex MG with the effect of the switching delay. (b) THD of complex MG with the effect of the switching delay. (c) Frequency of complex MG with the influence of the switching delay. (d) PF of complex MG with the effect of the switching delay.
Energies 15 09081 g021
Figure 22. Frequency profile of the complex MG assembly during off-nominal situations with switching interruption and additional noise.
Energies 15 09081 g022
Figure 23. PIL validation for proposed controllers: (a) the PIL setup with MATLAB and TMS320 DSK platform, (b) validation of Figure 10a,c, (c) validation of Figure 10b,d, (d) validation of Figure 10c.
Energies 15 09081 g023aEnergies 15 09081 g023b
Table 1. Inverter switching logics.
Sw1Sw3Sw5VA0VB0VC0
Sw2Sw4Sw6
OffOffOff−0.5Vdc−0.5Vdc−0.5Vdc
OnOffOff−0.5Vdc−0.5Vdc+0.5Vdc
OnOnOff−0.5Vdc+0.5Vdc−0.5Vdc
OnOnOn−0.5Vdc+0.5Vdc+0.5Vdc
OffOffOn+0.5Vdc−0.5Vdc−0.5Vdc
OnOffOn+0.5Vdc−0.5Vdc+0.5Vdc
OffOnOn+0.5Vdc+0.5Vdc−0.5Vdc
OnOnOn+0.5Vdc+0.5Vdc+0.5Vdc
Sw1, Sw2, Sw3, Sw4, Sw5, and Sw6 denote the logic state of switches whose values are either 0 (off) or 1 (on). VA0, VB0, and VC0 represent the line to neutral voltages associated with phases A, B, and C, respectively.
Table 2. MG Details.
Parameter(s)Specification(s)
Inverter parameters: DC input voltage800–900 V
Least starting DC voltage180 V
Rated real AC power10,000 W
Max. apparent AC power10,000 VA
AC line voltage300 V
Frequency/limit50 ± 0.5 Hz
Max. O/P AC current(3 × 20) A
PF at rated power>0.98
THD <5%
IGBT-based inverter:
Snubber resistance, Rs6000 Ω
Snubber capacitor, CsInfinite
Transmission line (LV): Resistance of Line- R, reactance-XR = 0.742 Ω/km, X = 0.0983 Ω/km
Solar array 1.87 KW (213 w × 9 nos), Voc = 36.3 V, VMp = 29 V, Isc = 7.84 A, IMp = 7.35 V
Fuel cell(DER2)1.26 KW, 24 V DC, Nominal Stack Efficiency (55%), No of cells-65,Operating Temperature −65 °C
Wind energy system(DER3)Nominal power − 1.87 KW, Line to Line voltage – 230 V, Current − 8.130 A, Reactances − Xd = 1.305 Ω, Xd′ = 0.296 Ω, Xd″ = 0.252 Ω, Xq = 0.479, Xq′ = 0.243, Xq″ = 0.1 (All in Ω)
BESS 12 V, 1200 Ah
Table 3. LI estimation.
Length of Tr. line (m)Impedance of Line (Ω)
500.0421 + j 0.00715
1000.0642 + j 0.0083
3000.1926 + j 0.0249
5000.321 + j 0.0415
Table 4. Training Outcomes by Means of Proposed NARX Controller.
Observation TypeNumber of SampleMean Squared Error (MSE)
Training111,4400.02589
Validation23,8800.02722
Testing23,8800.02611
Overall159,2010.02252
Table 5. Tabulation of PQ Parameters for Different Test Situations.
Fault/Event SituationMean Squared Error (MSE)No. of Hidden LayersPeriod Occupied by the PQ Parameters to Approach Steady-State after Switching (On-Grid to Islanding) (ms)
VDTHDFPF
Communication Delay0.03040022218050
0.01098055258560
0.0265610103011580
0.03727158359870
0.09168202080110100
0.3920330320250840400
0.0204002206010080
0.00109305308012090
Unbalanced Condition0.0365610150260600180
0.0471715102210040
0.0915620120800700220
0.282303090012001600800
0.30400250150300150
0.010930560160400200
Sag0.0365610220600900240
0.047171580140600200
0.052112050200700200
0.0926530100014001600850
0.405202204030020
0.0019305405040070
Swell0.0365610120100300240
0.0517115120200800200
0.05271203530180200
0.09865308009501200850
0.302502408012020
0.01192057011016070
Line Impedance0.04717151050112014001080
0.091562080250700210
0.28230301100140016501050
Table 6. PID, Fuzzy-PID, and NARX-NN controller comparison.
FactorsGrid-Tied Approach (0 s–1 s)Islanding Approach (1 s–2 s)
PIDFuzzy-PIDNARXPIDFuzzy-PIDNARX
VD (% age)32291.255280.9
THD (% age)8.960.114.550
F (Hz)5150.9505250.250
PF0.50.650.890.320.590.92
Table 7. Influence of LI on power loss in generation and distribution system.
Mode of OperationPower Loss Associated with Generation (W)Power Loss Associated with Distribution Lines (W)
Transformer (Grid Side)DER1, DER2, DER3Tr.Line Grid Side (500 m)Non Critical Load Side Line (100 m)Critical Load Side Line (50 m)
Grid-tied470540152.85306.53
Grid-tied0211.5064.59
Grid-tied0211.506.258.54
Table 8. Allocation of power and losses between MG1, MG2, MG3, and main grid in grid-tied mode.
MGProduction (Pg, kW)Power Demand (Pd, kW)Power Loss (PL, W)Power Loss (% Age)
143.752456.28
243.72456.20
365.554507.3
Main grid109.54504.9
Table 9. Allocation of power and losses between MG1, MG2, and MG3 in islanding mode.
MG Production (Pg, kW)Power Demand (Pd, kW)Power Loss (Pl, W)Power Loss (% Age)
143.82005
243.82005
365.653505.83
Table 10. Categories of loads associated in MG architecture.
LBMG1 (4 kW)MG2 (4 kW)MG3 (6 kW)
11 kW (R-load)
22 kW (R-load)
31 kW (R-load)
4 1 kW (R-load)
5 1 kW (R-load)
6 2 kW (R-load)
7 2 kW (R-load)
8 1.67 kvar (L-load)
9 1 kW, 0.75 VAR (RL-load)
Publisher’s Note: MDPI stays neutral with regard to jurisdictional claims in published maps and institutional affiliations.