Article

Effect of Hydrogen Enhancement on Natural Flame Luminosity of Tri-Fuel Combustion in an Optical Engine

1
Department of Mechanical Engineering, Aalto University, 02150 Espoo, Finland
2
Wärtsilä Finland Oy, 65101 Vaasa, Finland
*
Author to whom correspondence should be addressed.
Energies 2022, 15(23), 9080; https://doi.org/10.3390/en15239080
Submission received: 16 September 2022 / Revised: 5 October 2022 / Accepted: 28 November 2022 / Published: 30 November 2022
(This article belongs to the Special Issue Low-Carbon Fuel Combustion from Fundamentals to Applications)

Abstract

:
A novel combustion mode, namely tri-fuel (TF) combustion using a diesel pilot to ignite the premixed methane–hydrogen–air (CH4–H2–air) mixtures, was experimentally investigated under various H2 fractions (0%, 10%, 20%, 40%, 60%) and ultra-lean conditions (equivalence ratio of φ = 0.5). The overarching objective is to evaluate the effect of H2 fraction on flame characteristics and engine performance. To visualize the effect of H2 fraction on the combustion process and flame characteristics, a high-speed color camera (Photron SA-Z) was employed for natural flame luminosity (NFL) imaging to visualize the instantaneous TF combustion process. The engine performance, flame characteristics, and flame stability are characterized based on cylinder pressure and color natural flame images. Both pressure-based and optical imaging-based analyses indicate that adding H2 into the CH4–air mixture can dramatically improve engine performance, such as combustion efficiency, flame speed, and flame stability. The visualization results of NFL show that the addition of H2 promotes the high-temperature reaction, which exhibits a brighter bluish flame during the start of combustion and main combustion, however, a brighter orangish flame during the end of combustion. Since the combustion is ultra-lean, increasing the H2 concentration in the CH4–air mixture dramatically improves the flame propagation, which might reduce the CH4 slip. However, higher H2 concentration in the CH4–air mixture might lead to a high-temperature reaction that sequentially promotes soot emissions, which emit a bright yellowish flame.

1. Introduction

According to the IEA 2020 Transport 2020 Emissions Report, road transportation powered by internal combustion engines (ICEs) accounted for nearly 75% of CO2 emissions from fuel combustion [1]. To achieve the target of the first climate-neutral continent by 2050, Europe must significantly reduce CO2 emissions from ICE-based transportation in the coming decades [2]. Low-carbon fuels (e.g., CH4), carbon-free fuels (e.g., hydrogen (H2)), or their blends are the main candidates for ICE decarbonization. In particular, the European Commission initiated a new dedicated strategy on H2, in parallel with the strategy on energy system integration to explore the potential of clean H2 for helping the process of decarbonizing the EU economy, aiming to achieve net zero greenhouse gas emissions by 2030 in a socially fair, cost-effective and competitive way [3]. This strategy will promote the application of H2 as a fuel or additive in the market for zero- and low-emissions propulsion systems.
In this context, the H2-burning combustion engine offers great potential to mitigate CO2 emissions in the combustion process. However, there are also a series of challenges that need to be overcome when H2 is to be applied as an energy carrier; for instance, very low density implies low volumetric energy densities compared to conventional fossil fuels, difficulties in storage and transportation, safety issues due to the extremely low minimum ignition energy (MIE) and high flame velocity [4]. The recent pure H2-powered ICEs studies mostly focused on premixed combustion concepts, such as the spark ignition (SI) engine, including port-fuel injection [5,6,7] and direct injection [8,9,10]. However, the application of H2 as a sole fuel in ICEs suffers from some problems, such as low volumetric energy density [4], knocking [11,12], backfire [13,14], as well as relatively high NOx emissions depending on the engine types (e.g., compression ignition (CI) or spark ignition (SI)) and operating conditions [4,14]. Compared to pure H2 combustion, dual-fuel concepts, which involve premixing H2 with some hydrocarbon fuels as a promotor to take advantage of both fuels, have attracted a lot of attention. This strategy has been successfully applied in both SI [15,16,17] and CI [18,19,20] engines. For H2-enriched diesel engines, H2–air mixtures are induced into the cylinder and then ignited by a small amount of diesel, which has been extensively investigated in the last decades. Again, the main challenges are (1) low volumetric energy density [4], (2) limited operating range [21], and (3) NOx emissions [22], hence (4) limited efficiency, etc. To overcome such problems, using a tri-fuel (TF) combustion flexibly blending CH4–H2 mixture at different engine operating conditions, and then igniting the mixtures by a low diesel energy share ratio, could help the pilot to improve engine combustion efficiency and reduce emissions, for instance, unburned hydrocarbon (UHC), carbon monoxide (CO), and carbon dioxide (CO2). However, NOx emissions are also increased. The application of TF has the following advantages: (1) extends the flammability of the lean charge mixtures, (2) improves the combustion stability (reduces the unburned hydrocarbons) and combustion efficiency, (3) extends the operating range and improves the engine performance, (4) compromises the CO2 and NOx emissions compared to pure H2 or CH4 combustion.
Over the past few years, several convincing studies have been conducted in the research and development of TF combustion fueled with premixed CH4–H2–air mixtures ignited by a diesel pilot [23,24,25,26]. Fundamental studies, including experimental and computational studies, have evaluated the effects of the CH4–H2 ratio [27,28], oxidizer compositions, operating temperature, and pressure on the ignition process, flame properties, and combustion stabilities [4,24,29,30]. Meanwhile, the effect of charge-air temperature [31] and pilot-fuel properties under different engine operating conditions [32,33,34,35] have been extensively studied as well. However, the fundamental experiments mostly focused on some specific properties, such as the ignition delay time (IDT), laminar flame velocity, flame structure, and emission formation using shock tubes, rapid compression machines (RCM), and constant volume combustion chambers (CVCC), which have different operating conditions and a less complex flow field compared to the practical engine. The tri-fuel combustion in full-metal engines has been extensively studied, which has provided a detailed understanding of engine performance and emissions under various H2–CH4 mixtures and engine operating conditions. However, full-metal engine studies can not visualize the combustion process for a deep understanding of the combustion details in the cylinder, even though the computational studies can typically provide detailed reaction mechanisms and combustion processes based on 0D or 3D (computational fluid dynamics, CFD) simulation to identify the effect of H2 addition on IDT and flame characteristics. It is still necessary to understand the ignition process and combustion characteristics under engine-like conditions due to the lack of high-fidelity experimental data for simulation validation [36,37]. For this purpose, high-speed imaging diagnostic techniques have been extensively implemented to improve the understanding of combustion characteristics under various engine-like conditions. Among all the optical diagnostics techniques, natural flame luminosity (NFL) imaging is one of the simplest and most straightforward approaches to visualize the combustion process in the cylinder [36]. NFL can be used to visualize the broadband spectrum emitted (380–1000 nm) by the flame chemiluminescence as well as the high-temperature soot particle radiation during combustion [38]. Therefore, using a high-speed color camera (CCD/CMOS) for simple NFL imaging can detect radiant emissions from flames, which are the combinational RGB signals emitting from chemiluminescence-induced digital coloration from electronically excited reactive species (to be denoted henceforth by “*”) and the combination of black-body radiation from soot particles [39]. Generally, there are five main electronically self-excited species generated through chemical reactions that are interested in the flame, which include OH* (306.4 nm), CH2O* (512–514 nm), CH* (431.5 nm), C2* (516.5 nm), and CO2* (broadband emission 340-650 nm), alluding to chemiluminescence in the near UV and visible range [40]. Such radicals or species are believed to exist in high concentrations near the flame front.
The flame from hydrocarbon fuels can be considered a self-illuminating source. Chemiluminescence is the self-excited species or radicals, which can be conducted by NFL imaging to identify the specific chemical kinetics during combustion [41]. Therefore, several studies have been reported adopting high-speed NFL imaging to evaluate the fuel–air mixture formation, ignition behavior, combustion characteristics and emissions in optically accessible engines. For instance, Tang et al. [42,43] investigated the combustion characteristics (e.g., ignition behavior, flame front propagation and flame probability) and the tendency of soot formation using a high-speed NFL imaging technique in reactivity-controlled compression ignition (RCCI) combustion mode. Upatnieks et al. [44,45] employed a high-speed NFL imaging technique to investigate flame characteristics (e.g., lift-off length and flame propagation) and soot incandescence under low-temperature combustion (LTC) conditions in an optical engine. Vallinayagam Raman et al. applied a complicated combinational optical setup, including high-speed NFL imaging, qualitative fuel-tracer planar laser-induced fluorescence (PLIF), formaldehyde (CH2O) PLIF, and unburned hydrocarbon (UHC) PLIF to quantify the flame characteristics, fuel–air mixing process, local low- and high-temperature heat release in the flames (LTHR and HTHR), as well as the UHC distribution in an optically accessible engine under partially premixed combustion (PPC) mode [46]. The observation indicated that the self-excited species such as band spectra of C2*, HCO*, CH2O*, and CH*, are accompanied by continuous spectra of CO*, which are the main contributors to the blue flame, which can be detected by colored NFL imaging. These intermediate species are likely to be released due to the fuel decomposition process, in particular, during the premixed combustion when the HTHR phase is initiated. With the evolution of combustion and the elevation of the temperature, especially in fuel-rich zones, the color of the NFL images turns from blue to yellow or orange due to soot formation and radiation. Liu et al. [47,48] extensively studied the flame front propagation and auto-ignition in an optical engine using various combustion modes, including micro-DI, RCCI, and PPC by a simultaneous CH2O-PLIF and high-speed NFL imaging setup. They observed that chemiluminescence typically starts from low-temperature combustion due to the relaxation of the excited combustion radicals returning to their ground states, which indicates that the chemiluminescence signal can be an indicator of the start of exothermic chemical reactions and heat release. The chemiluminescence signal exists in the whole combustion process and emits a specific wavelength depending on the fuel compositions and conditions. However, when the flame is rich with soot emissions, the spectrum emitted from the other species might be overwhelmed by strong radiation luminous from soot incandescence [49].
According to the above literature review, H2 is an excellent promoter for diesel pilot tri-fuel combustion to improve engine performance and reduce CO2 emission. However, the previous studies have been concerned more with the fundamental combustion characteristics, lacking the investigation of TF combustion in practical engines, especially in optical engines. Meanwhile, NFL imaging is one of the most flexible techniques, which has been widely applied in optical engine studies for chemiluminescence and soot visualization. Nevertheless, in the aforementioned studies, H2 was absent. Therefore, in the present study, the effect of H2 fraction in a CH4–air mixture on engine performance and combustion processes will be comprehensively investigated based on the cylinder pressure and NFL imaging. The overarching objective of this study is to fill the gap between fundamental combustion and a practical engine with H2 addition. Additionally, the current study can provide valuable optical engine data for 0D and 3D numerical model validation. The structure of this paper is organized as follows.
Section 2 describes the experimental apparatus, including the optical engine specifications, operating conditions, fuel properties and specification of high-speed natural flame luminosity imaging technique.
Section 3 introduces the methodology and image postprocessing. In this section, the raw images, integrated spatiotemporal flame intensity, and flame stability are introduced to characterize the flame features.
Section 4 evaluates the influence of the H2 fraction on engine performance, flame characteristics, and combustion stabilities.
Section 5 represents conclusions on the suitability and advantages of tri-fuel combustion.
The novelty of this study is using high-speed NFL imaging to visualize the combustion process and to evaluate the effect of the addition of H2 in a CH4–air mixture on engine performance and flame characteristics in an optical engine. Moreover, the results of this study will provide valuable experimental data for CFD validation for TF combustion.

2. Experimental Setup and Methodology

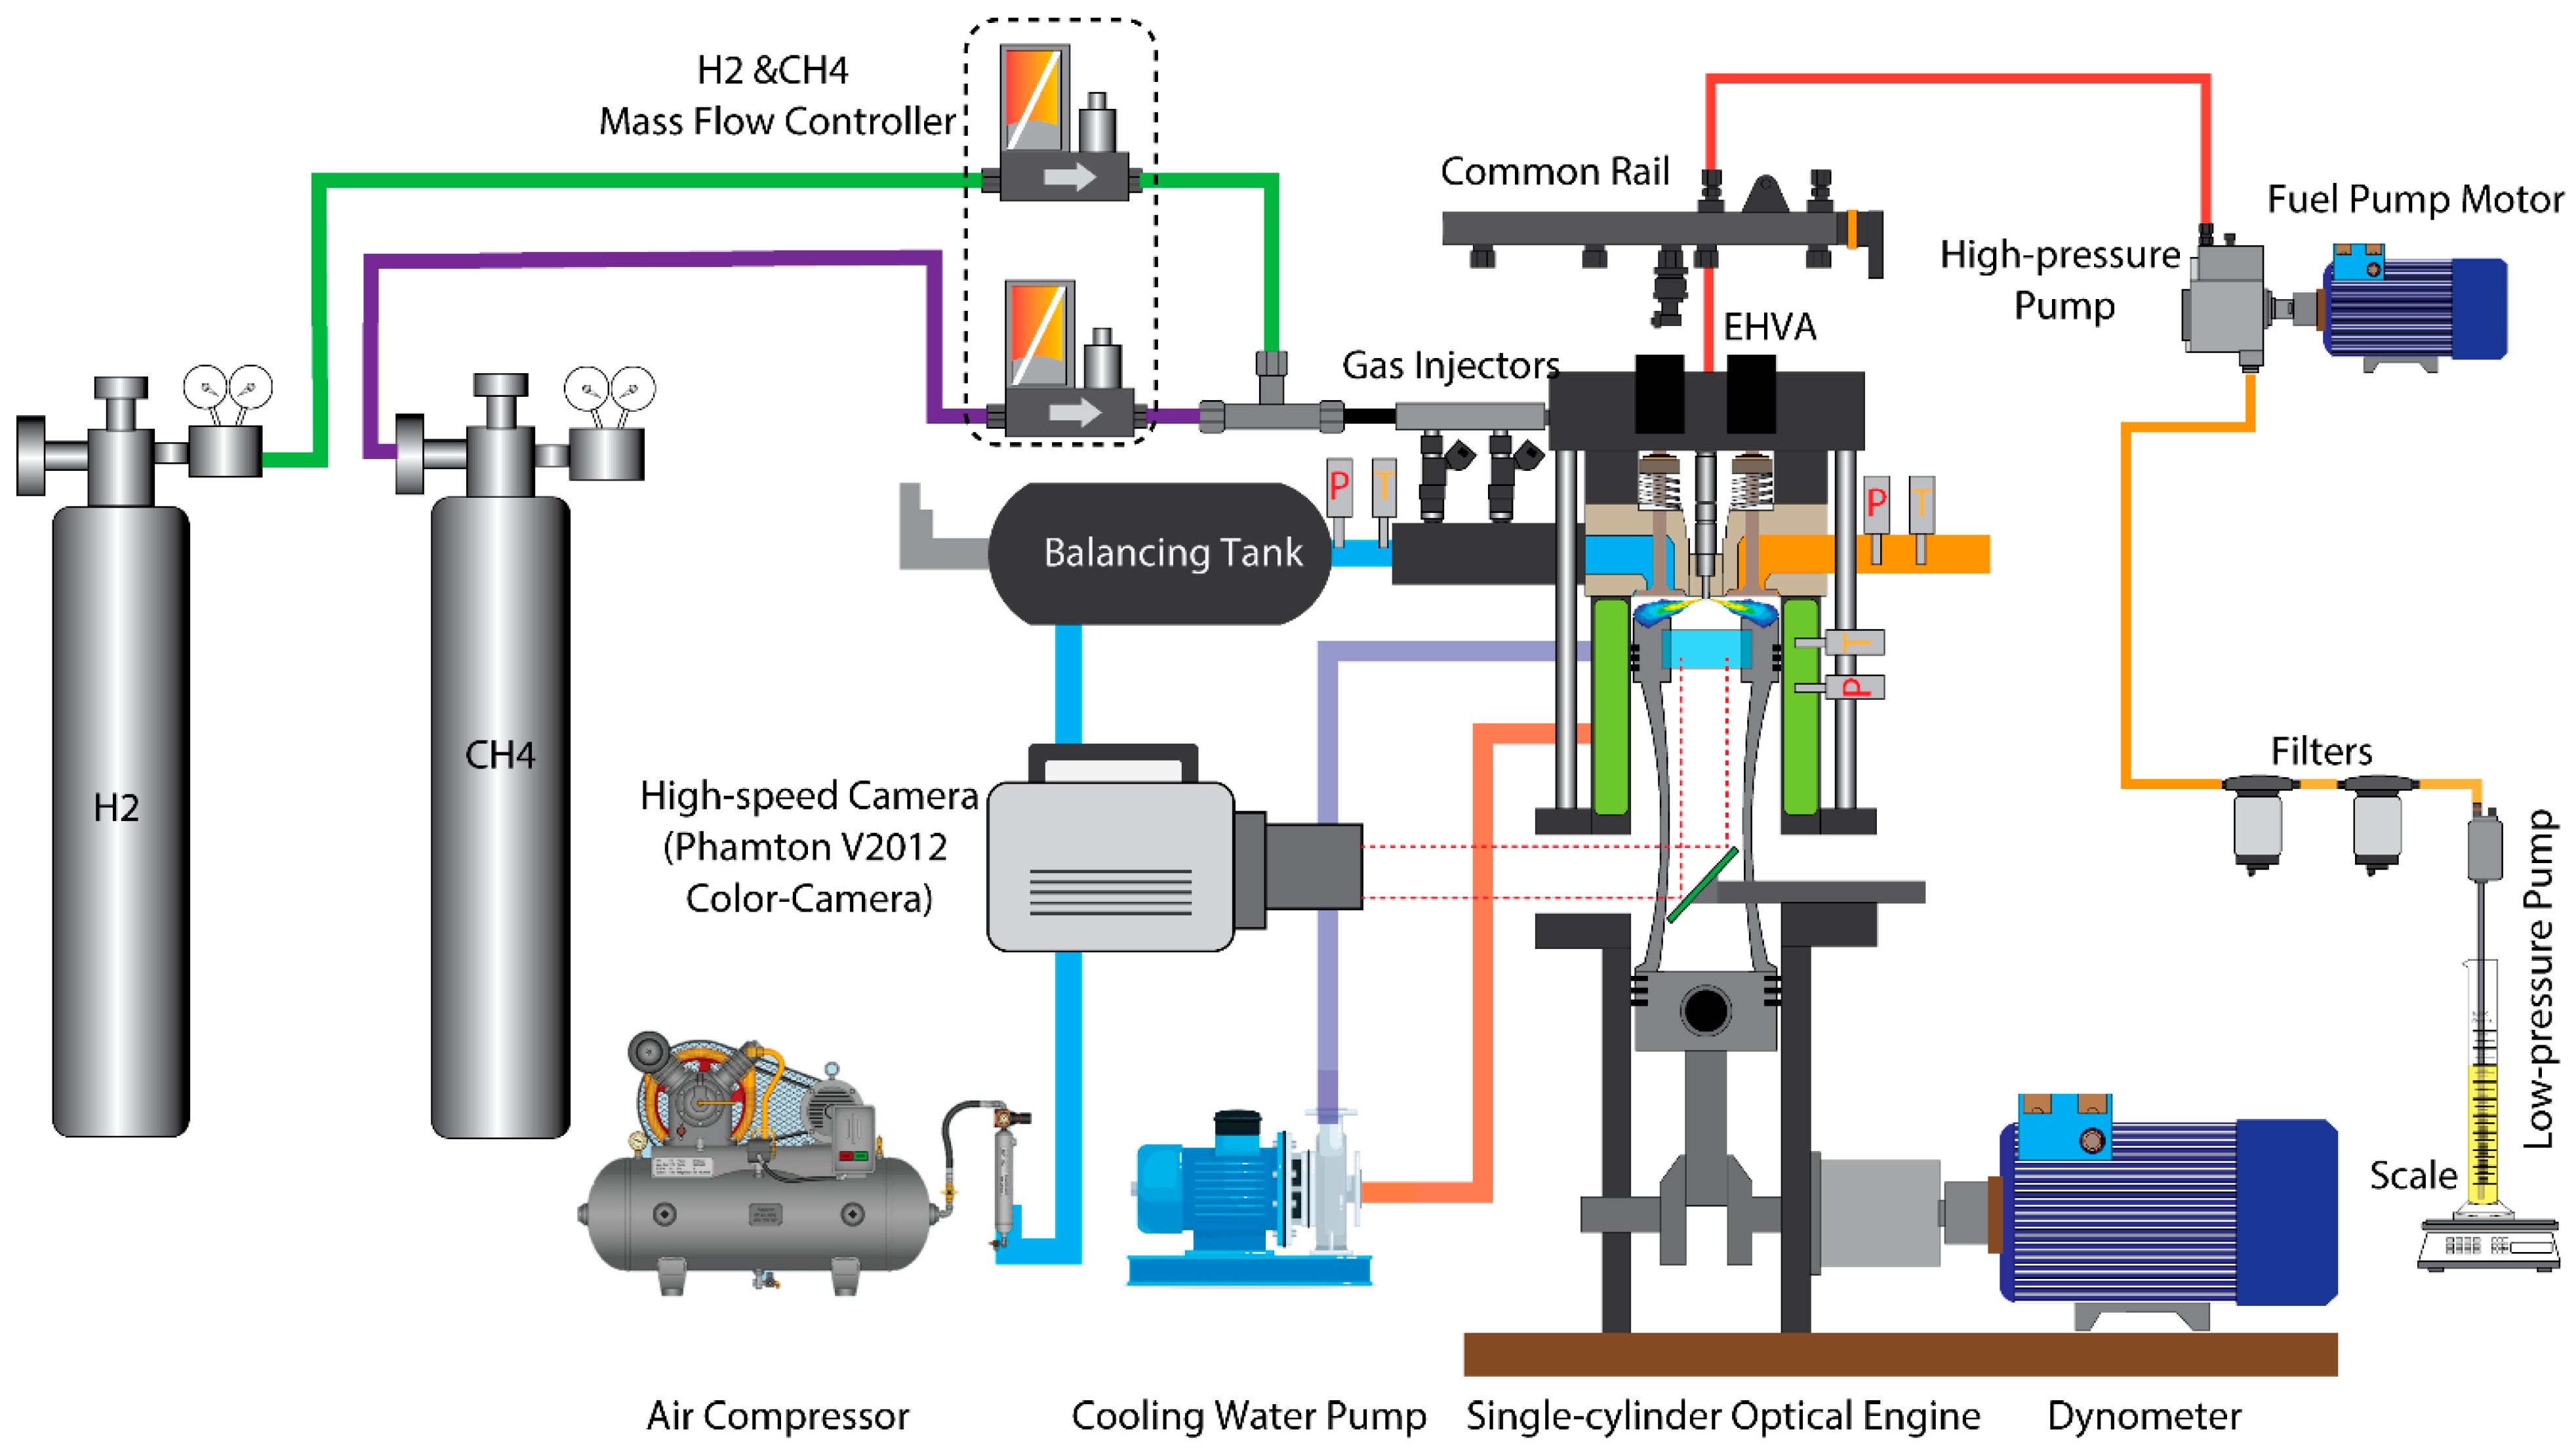
2.1. Specifications of the Optically Accessible Engine

Figure 1 illuminates the schematic of the optically accessible engine and the main sub-systems. Table 1 summarizes the most important specifications of the optically accessible engine. The optically accessible engine was modified based on an 6-cylinder common rail AGCO 84AWI diesel engine, which has full flexibility to be operated under various combustion modes, for instance, dual-fuel (DF) and tri-fuel (TF). The engine speed and load were controlled by a 45 kW ABB low-voltage motor coupled with a frequency converter (ACS800-11). Two low-pressure natural gas port fuel injectors (Bosch NGI2) were applied to inject the premixed CH4–H2 mixture into a modified manifold to prepare the well-mixed charge mixture. The mass flow of the gaseous fuels (e.g., CH4 and H2) was controlled independently by two specific mass flow meters/controllers (EL-FLOW®, Netherlands) to provide accurate gaseous mass flows and H2 fractions. An electrohydraulic valve actuator (EHVA) system, which has the full capability to control the timing and lift for intake and exhaust valves, was employed to offer precise control for the valve system. An electric compressor (E-turbo) accompanied with an air mass flow meter (RHM-08 Coriolis mass flow meter, Rheonik Messtechnik GmbH, Odelzhausen, Germany) was integrated to control the charge-air mass flow rate based on a closed-loop PID controller. The pilot diesel was injected by a 6-hole piezo injector (Bosch CRI 3, Gerlingen-Schillerhöhe, Germany) with centralized installation at the cylinder head. This piezo injector is beneficial to the fast response and precisely controls the fuel quantity, which can accurately provide a tiny amount of pilot diesel spray for ignition. The nozzle diameter of the injector was 90 µm. The crank angle signal was obtained by a high-resolution crank-angle encoder with a resolution of 0.2° CAD. The cylinder pressure was detected by a high-frequency piezoelectric sensor (type 6125C, Kistler Co., Inc., Winterthur, Switzerland), and the signal was amplified by a charge amplifier (type 5011B, Kistler Co., Inc., Winterthur, Switzerland) at a resolution of 0.2 CAD. A self-made external water-cooling system was adopted to warm the engine before operation. The engine control and data acquisition system were established based on a National Instrument field, programmable gate array (NI-FPGA, National Instruments, Austin, Texas, United States) system and LabView software (National Instruments, Austin, TX, USA), which has the capacity to monitor, control, and synchronize all signals, including engine speed, injection pressure, injection timing, charge-air flow, gaseous fuel mass flow, camera synchronization, etc. The piston of the optical engine was replaced with a Bowditch-type extended piston, which provided optical access from the bottom via a 45° UV–visible mirror and a flat sapphire window. The view diameter of the optical window was 65 mm, and the reflective mirror had a high reflection ratio of above 95%, which can provide a high-quality combustion signal to high-speed cameras.
Table 2 lists the specifications of the most important devices, which were used for controlling and monitoring the operating conditions, including measured variables, range, and accuracy. To accurately control the engine, the error analysis was conducted before the experiments.

2.2. Operating Conditions

The operating conditions of the present study are listed in Table 3. The speed of the optical engine was fixed at 1200 rpm. The equivalence ratio of the gaseous fuels was kept constant at 0.5 (ϕ = 0.5) with varying H2 concentrations ( χ H 2 / CH 4 = 0 % ,   10 % ,   20 % ,   40 % ,   60 %   ) on TF combustion. A closed-loop PID controller accompanied by the electric compressor and charge-air mass flow meter were adopted to maintain the charge-air mass flow rate of 50 kg/h. The total energy input into the cylinder was ~78 MJ/h according to the lower heating value and mass flow rate of the fuels. The total energy slightly increased with the addition of H2 due to the higher lower heating value of H2. The indicated mean effective pressure (IMPE) was around 7 bar, depending on the H2 concentration in the charge mixture as well as on the combustion efficiency. A constant pilot injection pressure of 1000 bar and a fixed injection duration of 0.174 ms at 7 CAD BTDC were adopted to ignite the CH4–H2–air mixture with a ~5% energy share ratio (Pratio = ~5%). A skip fire strategy was employed to protect the engine with a skip order of 7 (firing every 7 cycles). The data acquisition was started, the combustion was stabilized, and a total of 25 combustion cycles were recorded for data analysis. More details regarding H2 concentrations in the charge mixture and energy share ratio can be seen in Table 4.

2.3. Fuel Properties

The high reactivity fuel EN590 was applied as a pilot fuel to ignite the CH4–H2–air mixture in the cylinder. The high-purity CH4 and H2 were provided by AGA Industrial Gases (Helsinki, Finland) with a purity of 99.95% and 99.9%, respectively. More details of the fuel properties can be seen in our previous studies [23]. Since H2 has a lower density as well as extremely low minimum ignition energy and quenching gas, but higher autoignition temperature and broader flammability limit, it has a higher burning velocity. The most attractive property of H2 is being carbon-free, which would be an excellent fuel for clean and efficient combustion.

2.4. High-Speed Natural Flame Luminosity Imaging

A high-speed color camera (Photron SA-Z, San Diego, CA, USA) equipped with a Nikon lens (Nikon AF Nikkor 180 mm f/2.8, Tokyo, Japan) was implemented for NFL imaging. The maximum resolution of the camera is 1024 × 1024 pixels, and a spatial resolution of 16.4 pixels/mm can be achieved. In this study, the exposure time of the camera was set to 33.33 μs at the highest frame rate of 20,000 fps for full resolution. A powerful LED ring light (Smart Version Light, RM140, Muskegon, MI, USA) was mounted at the front of the camera to provide illumination for the liquid spray before the start of combustion. The LED light was synchronized with the injection signal and switched off before ignition. In this study, the total duration of the LED light was around 800 µs after triggering. The temporal resolution of image acquisition was 0.36° CAD. Figure 2 shows the relative spectral response of the color camera. It can be seen that the color camera records the spectrum of colors based on a Bayer filter mosaic, which consists of three channels: red, green, and blue, respectively. The blue filter has the lowest spectral sensitivity, while the red filter has the highest spectral response. Each channel has a specific bandpass spectral wavelength that allows for specific light transmission. Therefore, according to the color of the natural flame luminosity, it is possible to qualitatively identify the combustion characteristics.

3. Image Postprocessing

3.1. Raw Image Postprocessing

Figure 3 demonstrates the raw images of the pilot fuel spray (Figure 3a), ignition (Figure 3b), premixed low-temperature combustion (Figure 3c) and high-temperature combustion (Figure 3d) using a high-speed color camera. The spray image shown in Figure 3a is around 5 CAD BTDC. Since the Mie-scattering imaging only detects the liquid droplets, the vapor phase is not visible. Figure 3b shows that the ignition occurs at around 2 CAD ATDC, and a small blue flame kernel close to the combustion bowl can be observed from the 4th plume. The flame kernels grew rapidly after the ignition, and large bluish flames located in the pilot diesel clouds can be observed in Figure 3c at 3.8 CAD ATDC. The bluish flames correspond to low-temperature combustion. Figure 3d depicts high-temperature combustion (or main combustion); during this stage, more CH4–H2–air mixtures was involved in the combustion, and the flame turned bright due to the high temperature violating the combustion. The condition of the images shown in Figure 3 is from the same cycle with an equivalence ratio of 0.5 and an H2 concentration of 20%. The ignition first happened in the diesel clouds, where the evaporated pilot fuel was premixed with the hot CH4–H2–air mixture and subsequently ignited at suitable local fuel–air mixing conditions [39]. Since the pilot fuel is injected from a 6-hole piezo injector, the combustion chamber is divided into six parts based on the spray propagation direction. The blue flame can be observed during the start of combustion and during main combustion due to the spectral emissions of CH2O*, CH*, CO2*, and C2* chemiluminescence in the visible spectrum. Compared to conventional diesel combustion, DF, or TF combustion, especially under ultra-lean conditions, soot formation was critically inhibited due to the low temperature.

3.2. Spatiotemporal Flame Intensity Integration

Qualitative and quantitative analyses on the spatial and temporal evolution of the liquid spray, ignition kernel creation and subsequent flame propagation after pilot-fuel injection were investigated based on the colored NFL images. A spatiotemporal flame intensity integration according to the brightness of the image was adopted to estimate the evolution of the flame and combustion characteristics. To evaluate the spatial flame location, the intensity of each image was integrated for each axis distance of the injector tip ( r 1 ,   r 2 , , r n ) . The spatiotemporal intensity I ( r n ,   C A D ) was calculated based on the over 25 individual combustion cycles, which integrates the image pixel intensity over a circumference of a circle of discretized radius ( r 1 ,   r 2 , , r n ) , as represented in Figure 4. Equation (1) defines the spatiotemporal intensity I ( r n ,   C A D ) , which represents the intensity distribution of the axial distance from the injector tip (as shown in Figure 4),
I ( r n ,   C A D ) = r n = 0 r n = r I ( x ,   y ,   C A D ) | x 2 + y 2 = r n 2
where, r n is the distance from the view center to the discretized radius, r is the maximum radius of the view size, CAD is the crank angle degree, and ( x ,   y ) are the coordinates on the discretized radius, x 2 + y 2 = r n 2 . Therefore,   I ( x ,   y ,   C A D )   is the intensity of a pixel at ( x ,   y ) , and I ( r n ,   C A D ) is the integrated intensity on the discretized radius at each crank angle. Figure 4 shows more details and examples of the integrated intensity calculation. The white lines segment the view based on the spray plumes. The red dashed circle represents the discretized radius, and the green arrow shows the distance from the center of the cylinder to the selected discretized radius.

3.3. Flame Stability

To estimate the flame stability, the flame intensity and distribution were considered to evaluate the flame stability index (FSI), which corresponds to the intensity and probability of flame appearance at any specified pixel ( x , y ) . The color NFL images were first converted to grayscale images, and then, the gray-scaled images were normalized to the scale of [0 1] based on the maximum intensity. After that, a binarization process was adopted to judge the probability of the flame appearance at pixel ( x , y ) for each of the 25 images. To remove the noisy pixels, a threshold of 5% of the FSI was employed to assign the noisy pixel to 0. This procedure was implemented in every pixel of the image to obtain the FSI distribution in the whole field of view. FSI exhibiting a small value means that there are no flames or there are flames but with very low intensity and low occurrence in the specified region, while FSI showing a large value indicates that the flames always appear in a specific region with high intensity.
F S I ( x , y ) = n = 1 n = 25 I n , n o r ( x , y ) 25
where F S I ( x , y ) is the flame stability index value of pixel ( x , y ) , and I n , n o r ( x , y ) denotes the normalized intensity of the pixel ( x , y ) in its n th cycle.

4. Results and Discussion

In this section, the effect of H2 enhancement on tri-fuel combustion in an optically accessible engine will be comprehensively analyzed based on cylinder pressure, NFL, and reconstructed chemiluminescence images under various H2 fractions (e.g., χ H 2 / C H 4 = 0, 10%, 20%, 40%, 60%).

4.1. Effect of H2 Addition on the Engine Performance

Figure 5 shows the cylinder pressure (upper) and apparent heat release rate (aHRR, lower) at various H2 fractions ( χ H 2 / C H 4 = 0, 10%, 20%, 40%, 60%). There were 25 cycles conducted for the comparison; here, the averaged cylinder pressure and aHRR are shown with solid lines, and the transparent shadow-colored lines represent cyclic cylinder pressure and aHRR profiles. In Figure 5, a monotonical increase in in-cylinder peak pressure can be observed with the addition of the H2 fraction. The in-cylinder profile as well as the aHRR profile seems to grow steeper with the enhancement of the H2 combustion. The results indicate that increasing the H2 concentration in CH4–air mixture accelerates the fuel burning rate, which increases the aHRR and shortens the combustion duration. The interpretation relies on the excellent combustion properties of H2, such as broad flammability limits and higher laminar/turbulent flame speed, which potentially extend the lean–burn limits and improve the combustion efficiency. There is more combustion happening in the premixed stage rather than the diffusion stage as the concentration of H2 increases. This phenomenon can be related to the lower ignition energy needed for the H2 and faster flame speed, which results in spontaneous multiple flame propagation and a faster burning rate. However, the increase in H2 concentration in the charge gas mixture shows an insignificant influence on the ignition delay time, as shown in Figure 6.
Figure 6 illustrates the effect of H2 enhancement on ignition delay time (IDT) (Figure 6a), indicating mean effective pressure (IMEP) (Figure 6b) and thermal efficiency (ITE) (Figure 6c). IDT is identified based on the second derivative of the heat release rate (SDHRR) in this study and the detailed analysis represented in our previous work [50]. The IDT in Figure 6a shows that the IDT at χ H 2 / C H 4 =0, 20%, 40%, and 60% are almost the same, except at χ H 2 / C H 4 =10%, which is slightly higher than the others. This observation is against the conclusion from the 0D simulation results [24] that the addition of H2 prolongs IDT. The reason can be related to the complexity of the flow field and heat transfer in an optical engine, which leads to highly complicated local conditions during ignition rather than fixable and homogenous conditions in the 0D simulation [24]. Therefore, even though the addition of H2 might prolong the IDT in a numerical simulation, in practicality, the heat accumulated in the engine might inhibit this effect. Figure 6b,c indicate that the increase in the IMEP is up to 21.2% from 6.5 bar ( χ H 2 / C H 4 = 0) to 7.88 bar ( χ H 2 / C H 4 = 60%) while the increase in the ITE is up to 6.5% from 43.07% ( χ H 2 / C H 4 = 0) to 49.58% ( χ H 2 / C H 4 = 60%) with the enhancement of H2. The interpretation can be related to: (1) adding H2 to the charge mixture increases the total energy up to 5.5% from 76.3 MJ/h ( χ H 2 / C H 4 = 0) to 80.5 MJ/h ( χ H 2 / C H 4 = 60%) due to the higher lower heating value of H2 when keeping the lambda value the same; (2) increasing the H2 concentration in the CH4–air mixture promotes flame propagation and extends the lean–burn limits, which results in more complete combustion and improves the combustion efficiency. We used gross indicated thermal efficiency to define the ITE in the present work.
To clarify the effect of H2 addition on engine combustion emissions, a full metal engine with the same mode was operated under the H2 concentrations at various charge-air temperatures. The engine used normal firing steps. The key emissions were measured with an exhaust-gas analyzing system containing various emission analyzers, a CH4 slip, unburned hydrocarbons (total hydrocarbon), CO2, and NOx. Figure 7 shows the effect of H2 addition on engine emissions. It is clearly shown that the addition of H2 in the charge mixture can dramatically reduce the CH4 slip and THC, in particular, from 0% to 10% H2; the reduction of the CH4 slip is over 60%, and the reduction of the THC is over 20%. There is no evident effect of H2 enhancement on the reduction of CO2 due to the small amount of H2 and more completed combustion. However, while increasing the H2 in the CH4–air mixture, the NOx emissions dramatically increase because of the higher local combustion temperature.

4.2. Effect of H2 Addition on the NFL Intensity

Figure 8 depicts the true-color images and integrated spatiotemporal flame intensity profiles of TF combustion under various H2 concentrations ( χ H 2 / C H 4 = 0%, 20%, 40%, and 60%). A total of 10 images at different combustion stages, including the start of the combustion, premixed low-temperature combustion, high-temperature combustion, and tail diffusion combustion, are selected to identify the effect of χ H 2 / C H 4 on the combustion characteristics. The dashed white lines with numbers 1–10 in the integrated intensity plot represent the timing of the selected images. The red profile presents the integrated intensity image versus the crank angle.
The start of the flame kernel creation and propagation can be applied to define the start of the combustion (SoC) or IDT. In Figure 8, the flame kernels are typically created close to the bowl edge, showing a bluish color due to the intermediate species with band spectra that emit specific wavelengths of light, for instance, self-excited radicals or species such as OH*, HCO*, CH2O*, and CH*, which generally have short spectral wavelengths (<500 nm). The continuous broadband spectra of CO2* (340 nm-650 nm) might also contribute to the emission of short wavelengths [44]. These intermediate radicals or species are most likely to be released due to the fuel decomposition process (corresponding to low-temperature heat release, LTHR) as well as the initial stage of the high-temperature heat release (HTHR) phase [44]. With flame evolution, more areas in the cylinder are occupied with the high-temperature flames due to more CH4–H2–air mixtures involved in the combustion, which further elevate the cylinder pressure and temperature. The high temperature in the cylinder finally leads to a more violent combustion and brighter flames. Meanwhile, with the consumption of the low-temperature species (e.g., HCO*, CH2O*, CH*) and the increase in the CO2* and H2O vapor, as well as in soot formation, the flame color gradually turns to yellowish and orangish. Bright spots close to the vicinity of the injector tip are a consequence of fuel dribbling. This is because with the in-cylinder temperature increasing and fuel depleting, the large dribbling droplets start to burn, and residual gas starts to glow, which emits bright-yellowish flames. The appearance of the ignition of the dribbling later than the end of the injector might be related to the larger droplet size than the normal spray, which needs more time to evaporate. More details about the effect of dribbling on DF combustion can be found in [51,52,53,54]. The general observation from Figure 8 indicates that the natural flame luminosity can be categorized into three combustion stages, including: (1) the SoC stage, which exhibits dark blue color due to the low-temperature HRR in the flame; (2) the main combustion stage, which means more unburned gas is involved in the reaction and high-temperature HRR in the flame, while the flame emits bright bluish luminosity; (3) the tail combustion stage, where the residual gas and large dribbling droplets glow as bright yellowish light [55]. As observed from Figure 8I–IV, increasing the χ H 2 / C H 4 leads to more enhanced combustion, which exhibits a higher flame intensity and shorter low-temperature combustion duration. Meanwhile, the addition of H2 does not only affect the intensity of the flame luminosity, but also the flame velocity (flame area). At χ H 2 / C H 4 = 0, the maximum indicated intensity of the discretized radius is around 1000 a.u., and the flame is far away from the injector tip (~25 mm). It can be interpreted that the ignition kernels are close to the tip of the spray, where the diesel–air equivalence ratio is close to the stoichiometric value. The flames propagate based on the flame kernels being quenched due to the ultra-lean CH4–H2–air mixtures. With the increase in the χ H 2 / C H 4 , the flames propagate toward the center of the cylinder, due to the enhancement of H2 on the combustion characteristics and because of the border flammability limits and higher burning velocity of H2 than CH4. Additionally, the maximum indicated intensity of the discretized radius is much higher than the combustion at χ H 2 / C H 4 = 0. With the increase in H2 in the CH4–air mixture, the flame gradually propagates to the center of the cylinder with brighter flames, which implies more complete combustion in the cylinder. According to our observation, it is indicated that the addition of H2 extends the lean limits for the CH4–air mixture, which may lead to more completed combustion and less CH4 slip and unburned hydrocarbons (UHC). However, adding the H2 exceeding a specific level ( χ H 2 / C H 4 > 40%) dramatically increased the combustion intensity, emitting extremely bright light as shown in Figure 8IV. This bright light can be related to the soot formation caused by high-temperature combustion.

4.3. Effect of H2 Addition on Flame Stability

To clarify the influences of H2 concentration on combustion stability, the flame FSI was introduced for the flame probability analysis, as shown in Figure 9. In this analysis, a total of 25 cycles were considered in each case. At the start of the combustion (SoC) stage (~362.72 CAD), a low FSI value (<0.2) can be observed in all cases, which relates to the random flame kernel occurrence. The explanation is that the lean mixture (ϕ = 0.5) and highly turbulent flow conditions in the cylinder resulted in a highly uncertain pilot diesel autoignition location. Meanwhile, it was observed that increasing χ H 2 / C H 4 shows insignificant improvement in the FSI in the SoC stage. In the main combustion stage (364.78–388.64 CAD), the relatively higher FSI was distributed compared to the SOC stage. It was observed that the H2 addition still showed an inconsiderable effect on the FSI distribution, where the flame was mostly located far from the nozzle tip with a relatively low flame probability ( F S I < 0.5 ). Nevertheless, when χ H 2 / C H 4 40%, a significant increase in FSI can be observed, which exhibits a much higher FSI (>0.5) and a larger flame area. This indicates that the significant effect of H2 addition on the tri-fuel combustion happened when χ H 2 / C H 4 40%. In the tail combustion stage, the FSI started to decrease when χ H 2 / C H 4 40% due to the depletion of the fuel. However, the FSI in the χ H 2 / C H 4 = 60 % case still showed a high level (>0.9) due to the dribbling droplets burning and soot radiation.

5. Conclusions

In the present paper, a TF combustion mode, which adopts premixed CH4/H2 mixtures as the main fuel and is ignited by a diesel pilot was comprehensively investigated with varying H2 fractions in CH4–air mixtures ( χ H 2 / C H 4 = 0%, 10%, 20%, 40%, 60%) in an optical engine. The engine performance, combustion process, flame characteristics, and stability were evaluated based on the cylinder pressure and colored natural flame luminosity. According to the systematical exploration of the experimental results, the following conclusions and intimations for the evaluation of tri-fuel combustion are stated:
(1)
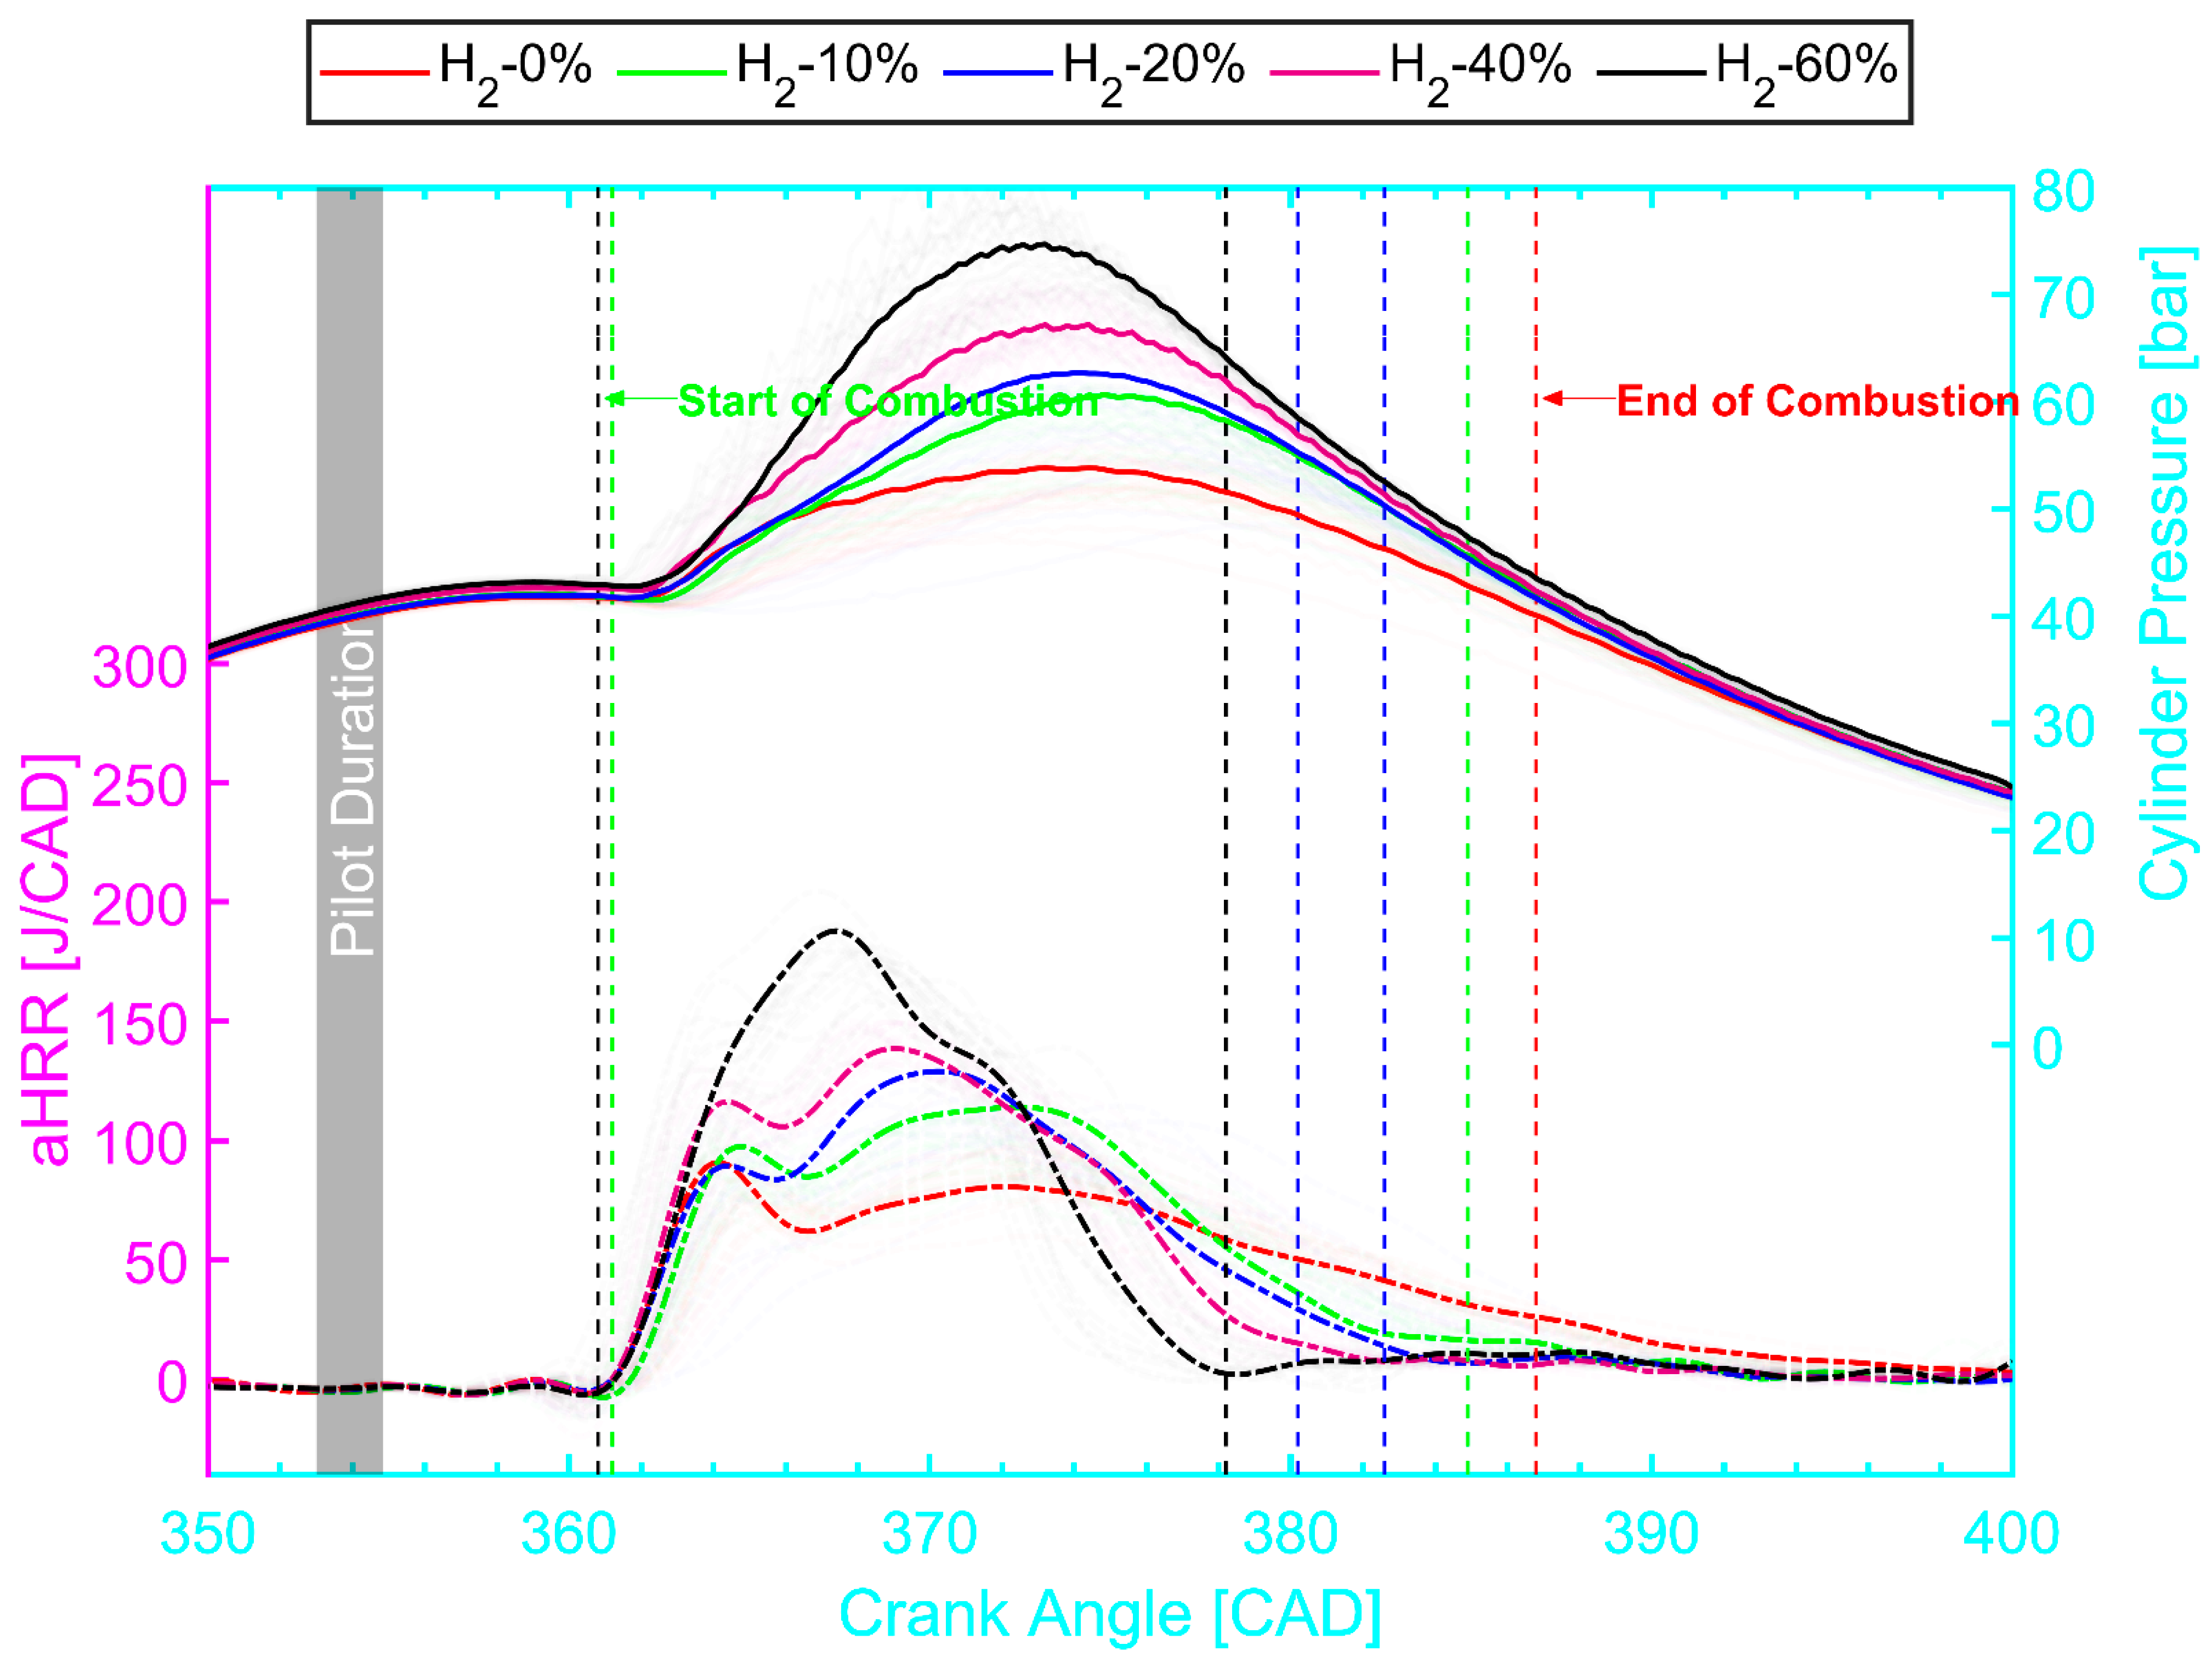
The AHRR and in-cylinder profiles were steeper with the increased H2 concentration. Meanwhile, more combustion happened in the premixed stage rather than in the diffusion stage as the concentration of H2 increased. This explanation is related to the lower ignition energy needed for the H2 and faster flame speed, which resulted in spontaneous multiple flame propagation and a faster burning rate.
(2)
Adding H2 into the CH4–air mixture promoted combustion efficiency as well as improved the engine thermal efficiency by up to 6.5% due to the border flammability limit and higher flame velocity of the H2 over CH4. However, increasing the H2 fraction in CH4–air mixture showed an insignificant effect of the H2 on the ignition delay time.
(3)
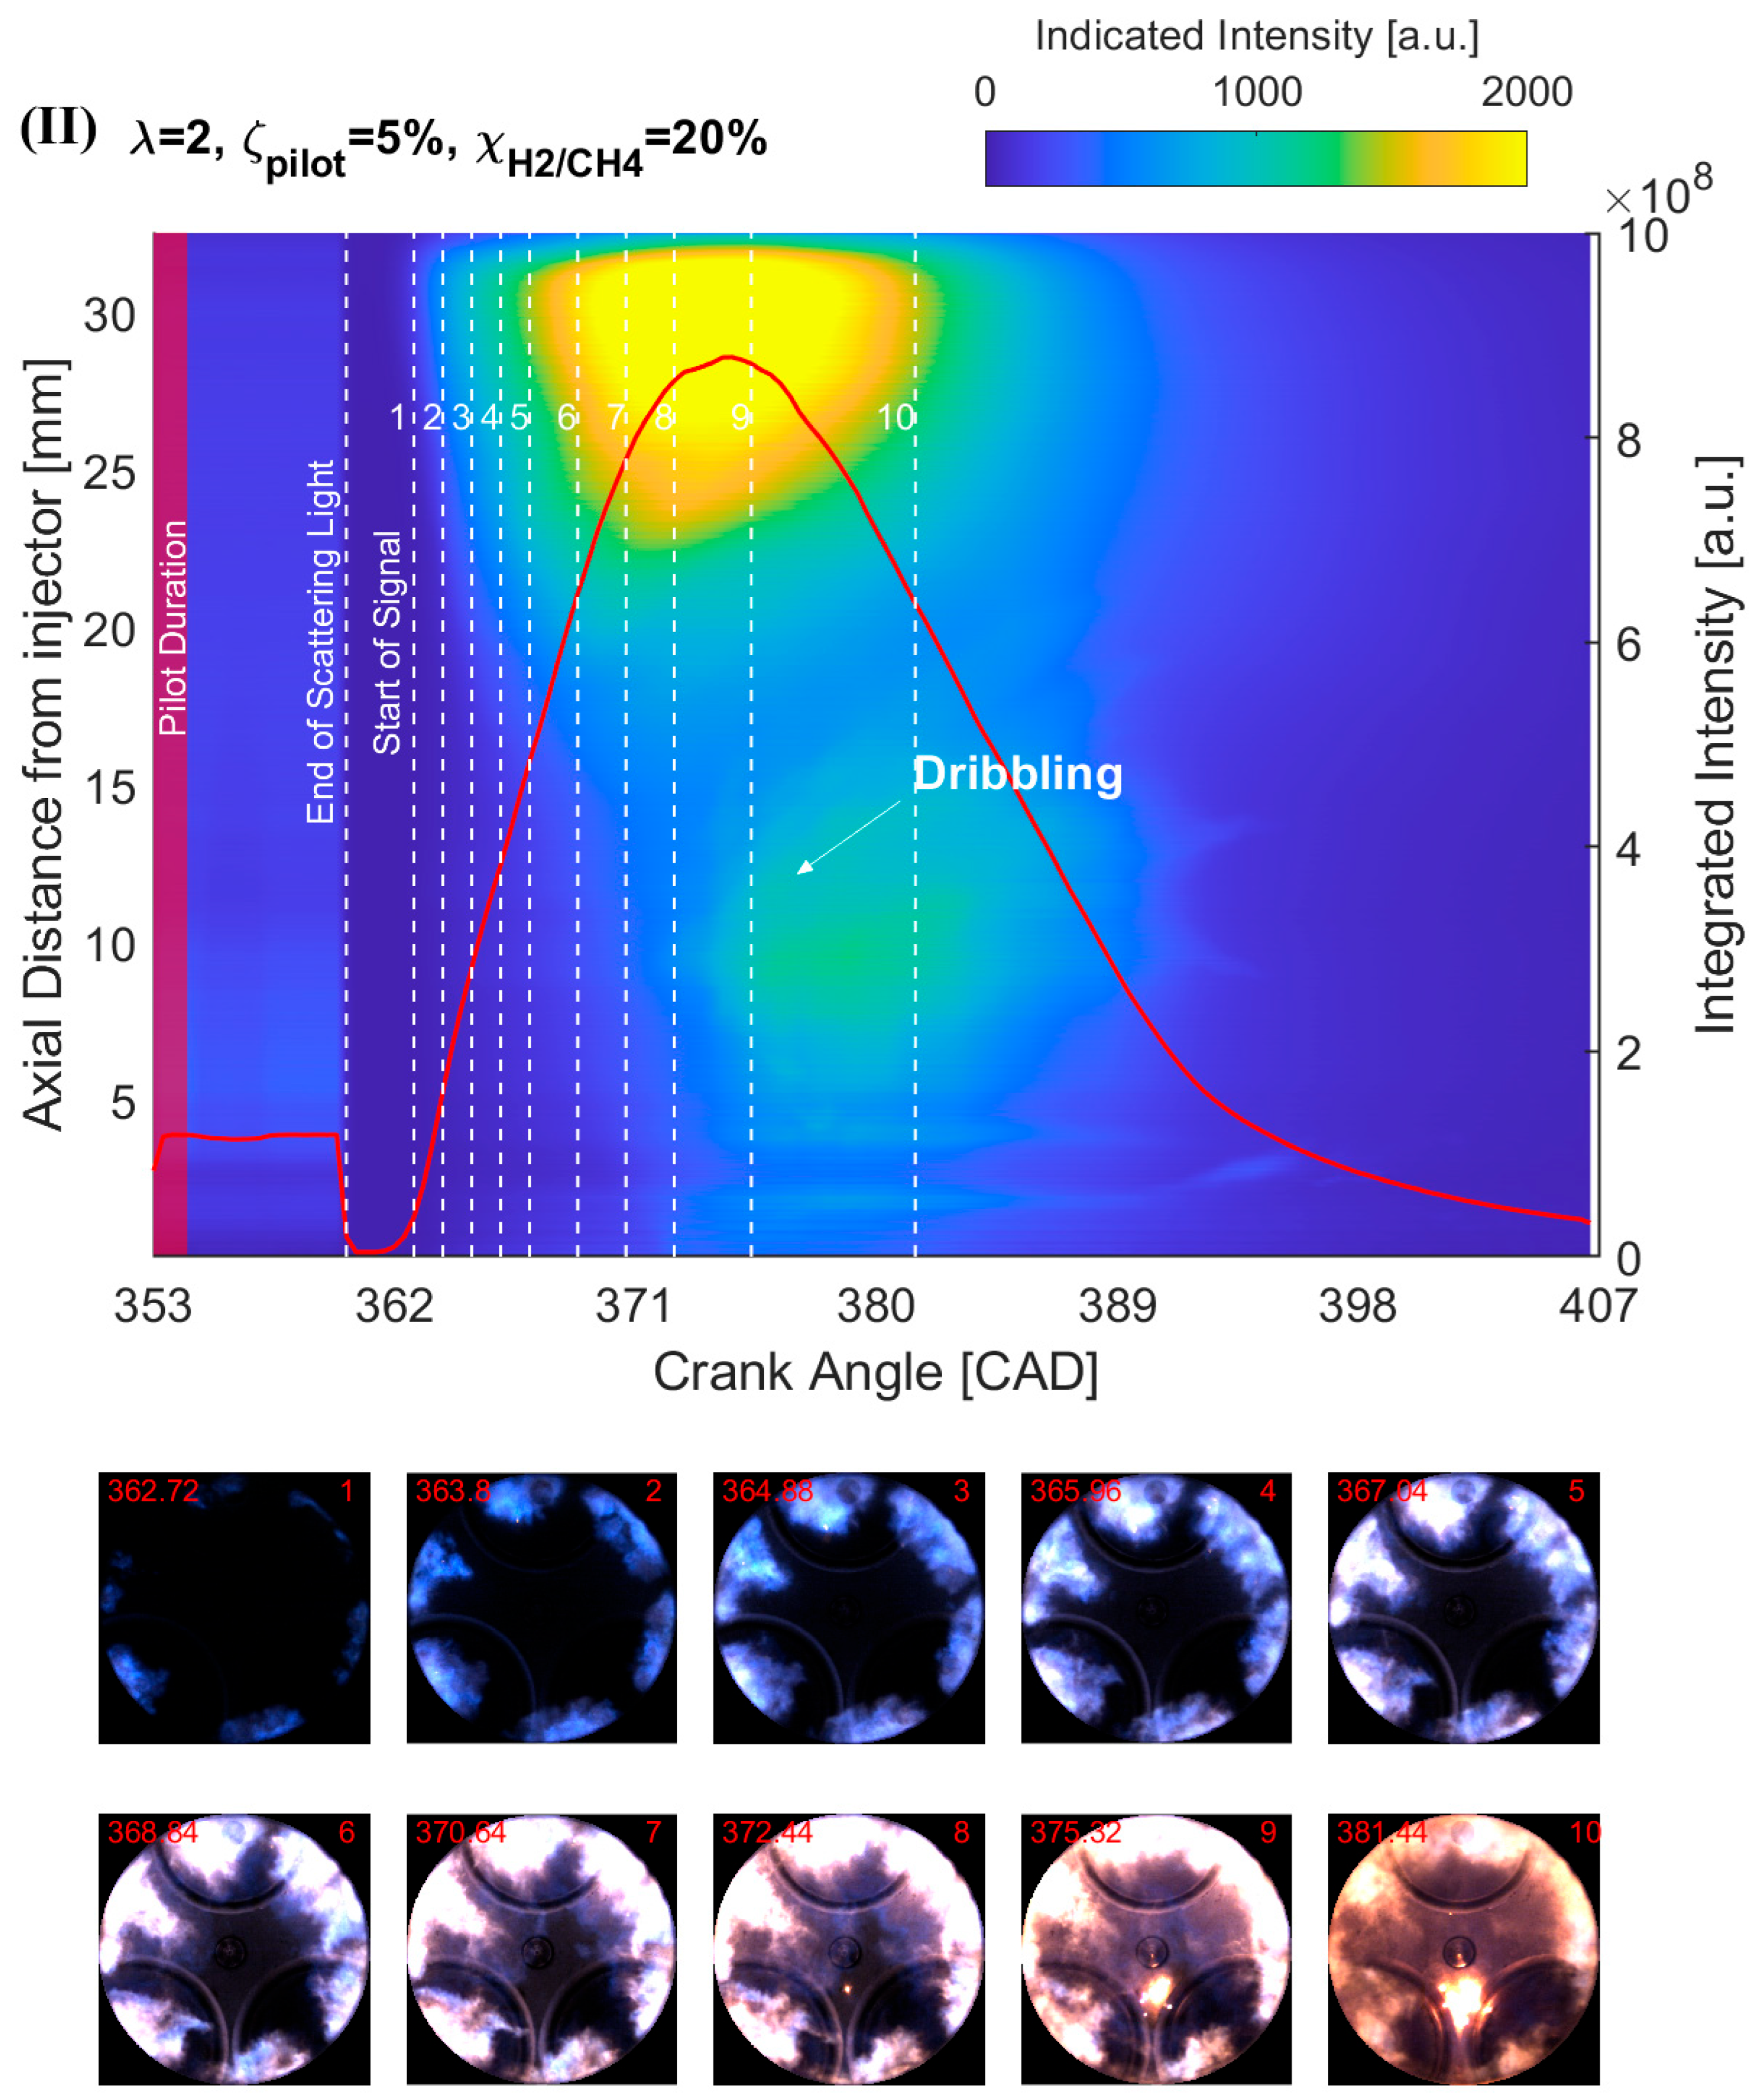
The results from the natural flame luminosity image analysis indicate that tri-fuel combustion can be categorized as a three-stage combustion. The dark-bluish flame can be observed at the initial combustion stage, which represents the low-temperature HRR combustion in-cylinder. With more H2/CH4–air involved in the combustion, the main combustion stage starts with the high-temperature HRR combustion, which exhibits bright-bluish flames in-cylinder. With the in-cylinder temperature increasing and fuel depleting, the large dribbling droplets start to burn, and residual gas starts to glow, which emits bright-yellowish flames.
(4)
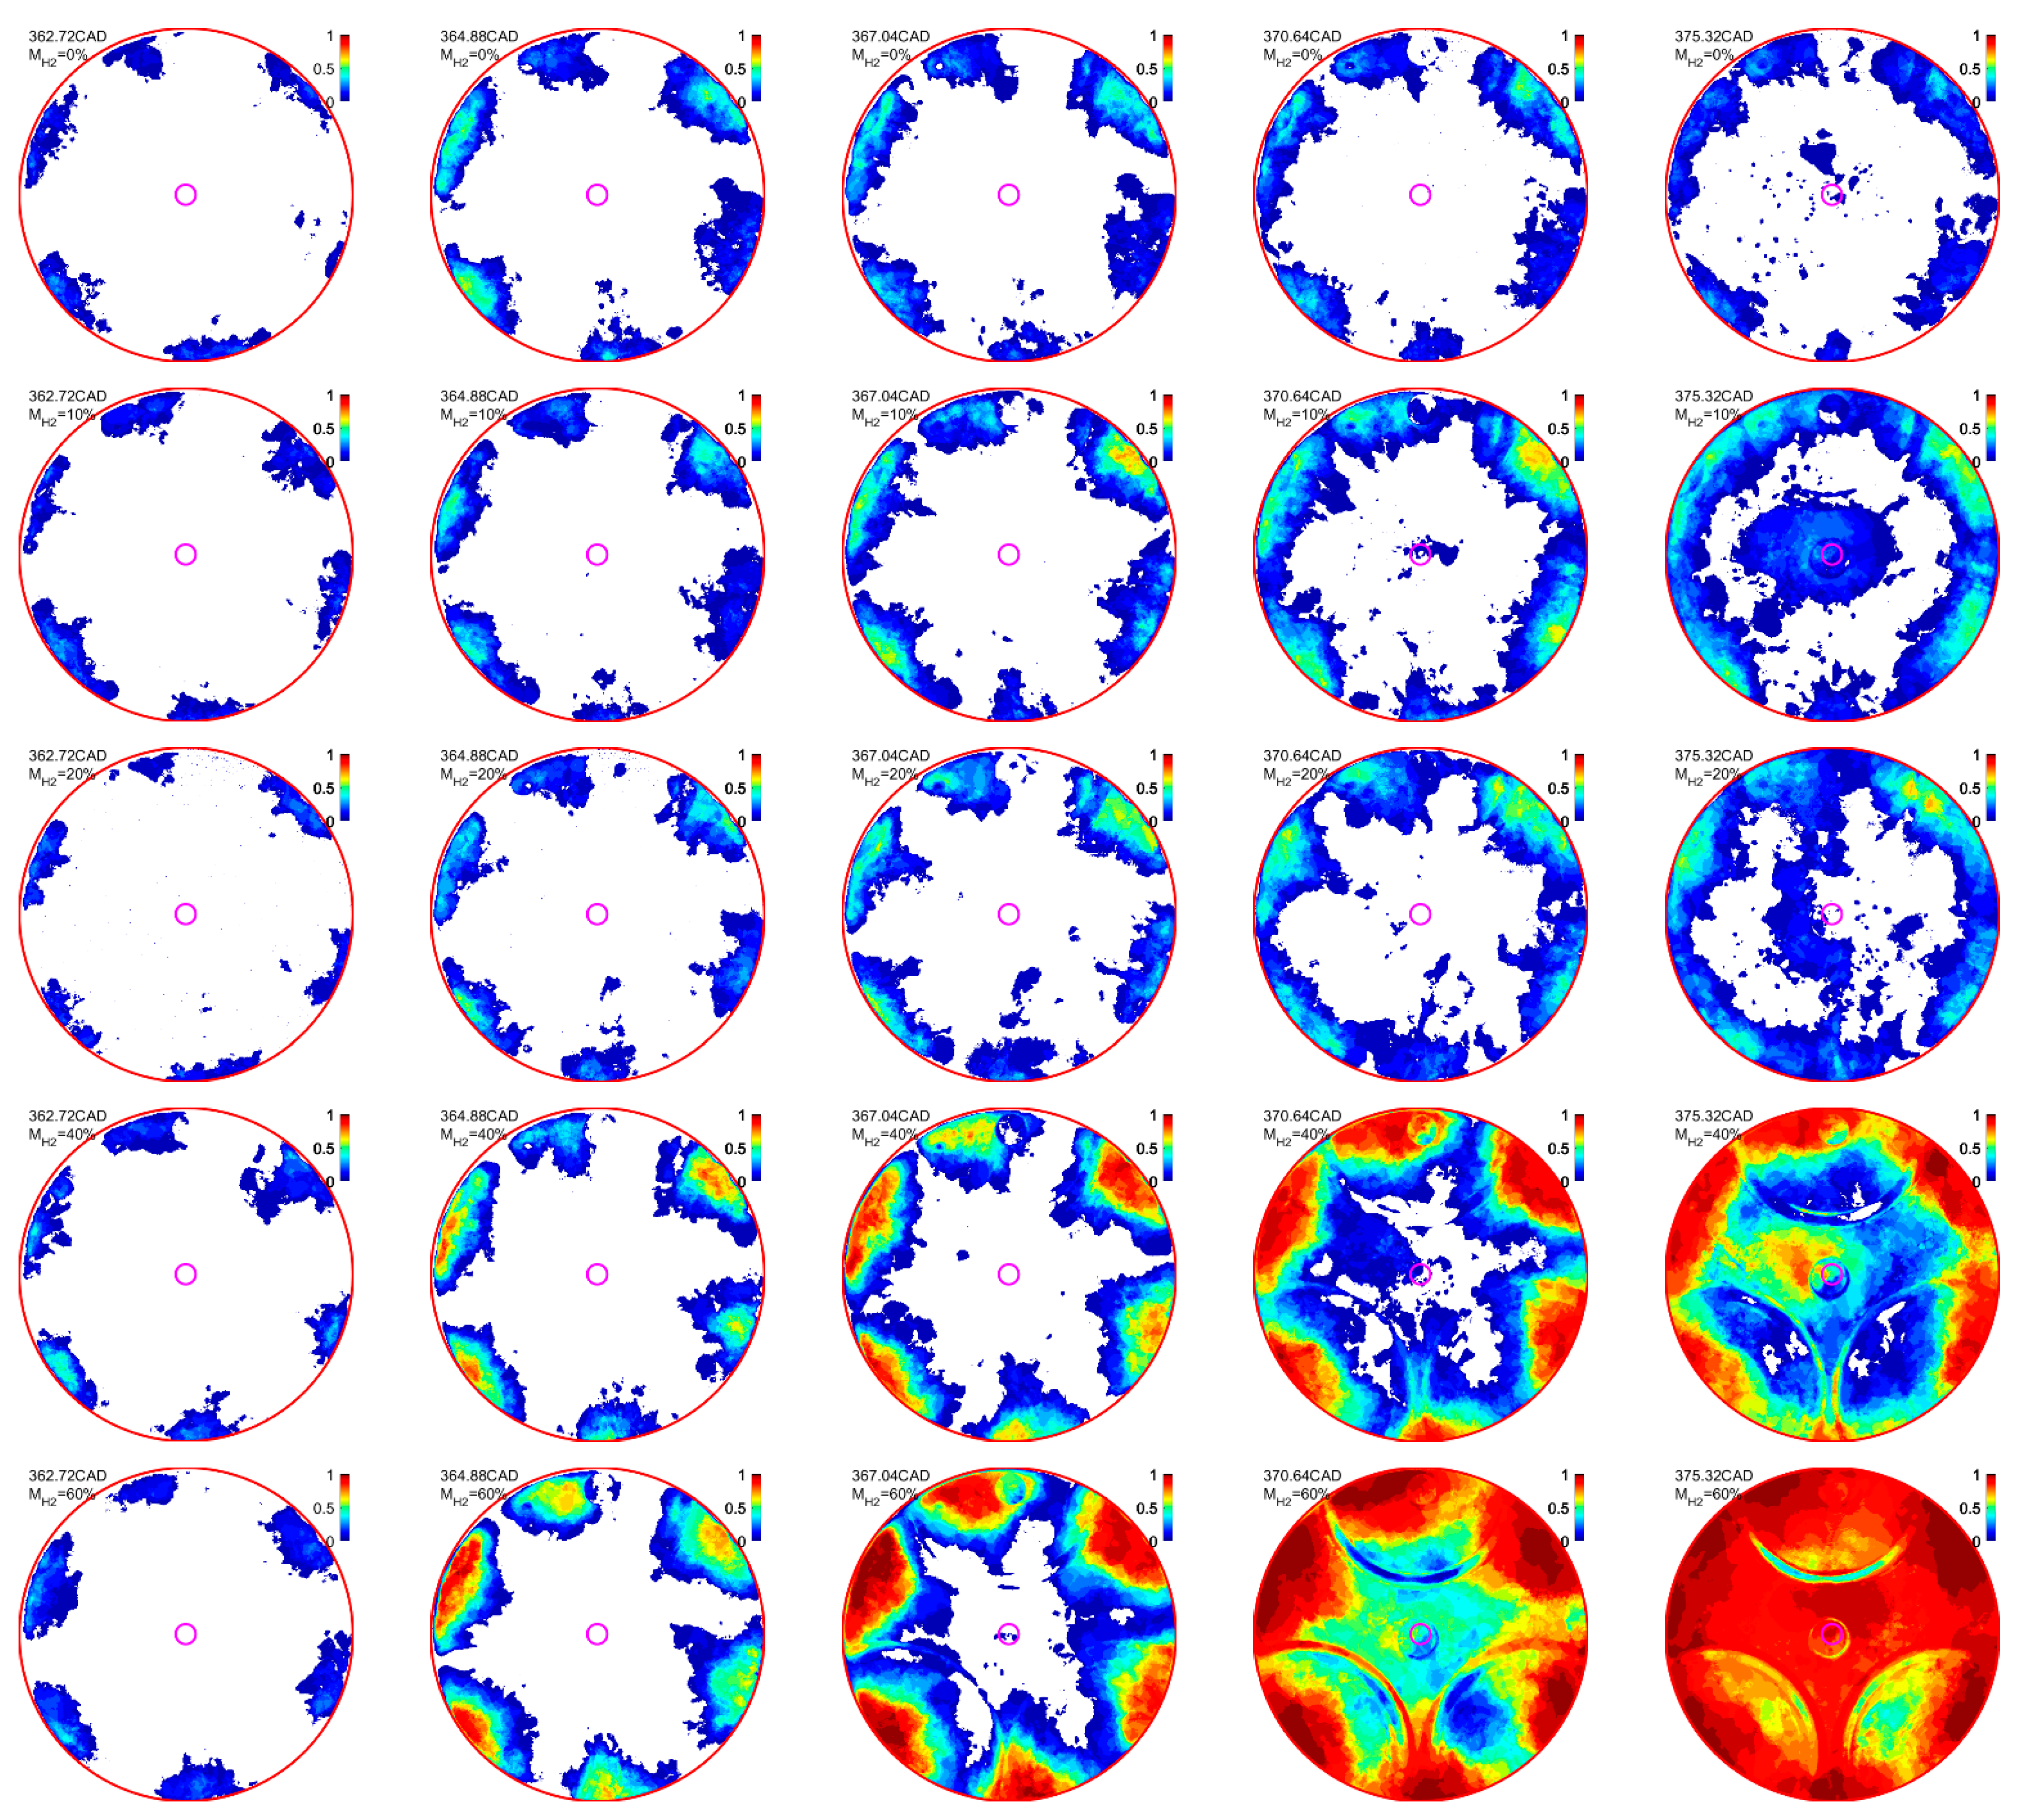
The effect of H2 enhancement on the natural flame luminosity also indicates that the increase in the H2 fraction in the CH4–air mixture monotonically increases the natural flame luminosity and flame area, especially when χ H 2 / C H 4 40%.
(5)
The flame stability index (FSI) was introduced to estimate the effect of H2 addition on the ignition and flame stability. The results indicate that the H2 induction has an inconsiderable effect on the flame kernel creation, which shows a low FSI value in all cases. Meanwhile, the addition of H2 also shows an insignificant effect on the FSI in the main and tail combustions when χ H 2 / C H 4 < 40%, which exhibits a similar FSI distribution and flame area. Nevertheless, when χ H 2 / C H 4 40%, a significant FSI improvement can be observed in the main and tail combustions.

6. Recommendation for Future Work

Using H2 as a fuel promoter is a promising strategy to shift toward decarbonization in the stationary and transportation systems. In the present study, a tri-fuel combustion mode, which is extended from the conventional dual-fuel (DF) combustion mode, was systematically investigated in an optically accessible engine using high-speed natural flame luminosity imaging. In the present TF study, the addition of H2 showed significant improvements in thermal efficiency and reductions in unburnt hydrocarbons (including CH4 slip). With relevance to the present study, it is of particular urgency to gain a deep understanding of (1) ignition properties of H2-based blended fuels, with the combinations for both emerging and existing fuels in the market (2) the effect of H2 addition on other gaseous fuels, e.g., NH3, methanol, etc.; (3) optimization of the H2/CH4 mixture for compromising unburned hydrocarbon and NOx emissions; (4) the application of the tri-fuel combustion mode for large bore engines, e.g., marine engines.

Author Contributions

Q.C.: Conceptualization, Investigation, Methodology, Image Post-Processing, Validation, Main Manuscript Text Writing. Z.A.: Investigation and Data Acquisition, Review and Editing. O.K.: Funding acquisition, Supervision, Writing—review and editing. V.V.: Funding acquisition, Writing—review and editing. M.L.: Supervision, Funding acquisition, Writing—review and editing. All authors have read and agreed to the published version of the manuscript.

Funding

This research was funded by the Academy of Finland projects (grant nos. 297248, 332835 and 318024), which are gratefully acknowledged.

Data Availability Statement

The datasets used and/or analyzed during the current study are available from the corresponding author on reasonable request.

Acknowledgments

The authors are thankful to Ranta Olli and Blomstedt Otto for their support in the engine preparations.

Conflicts of Interest

The authors declare no conflict to interest.

Nomenclature

Abbreviations
BTDCBefore top dead centerNFLNatural flame luminosity
CADCrank angle degreeLTCLow-temperature combustion
CICompression–ignitionPLIFPlanar laser-induced fluorescence
DFDual fuelPPCPartially premixed combustion
EHVAElectrohydraulic valve actuatorPratioPilot fuel ratio
FSIFlame stability indexRCCIReactivity-controlled compression ignition
HRRHeat release rateSoCStart of combustion
IDTIgnition delay timing
IMEPIndicated mean effective pressureSoIStart of injection
ITEIndicated thermal efficiencyTFTri-fuel
Mathematic and Greek Symbols
λmixtureGaseous fuel lambda F S I ( x , y ) Flame   stability   index   of   a   pixel   at   ( x ,   y )
r n Discretized radius of the combustion chamber air , m ˙ pilot , m ˙ CH 4 , m ˙ H 2 , Mass flow rate of charge-air, pilot diesel, methane, and hydrogen
I ( x ,   y ,   C A D ) Intensity of a pixel at ( x ,   y ) TairCharge-air temperature
I ( r n ,   C A D ) Intensity   on   the   radius   of   r n χ H 2 / CH 4 Hydrogen and methane volumetric ratio
I n , n o r ( x , y ) Normalized intensity of a pixel at ( x ,   y ) ζ p i l o t Energy share ratio of diesel pilot

References

  1. International Energy Agency (IEA). Tracking Transport 2020. Available online: https://www.iea.org/reports/tracking-transport-2020 (accessed on 3 March 2022).
  2. European Commission. Delivering the European Green Deal. Available online: https://ec.europa.eu/info/strategy/priorities-2019-2024/european-green-deal/delivering-european-green-deal_en (accessed on 3 March 2022).
  3. European Commission. A Hydrogen Strategy for a Climate Neutral Europe. Available online: https://www.h2greentech.eu/a-hydrogen-strategy-for-a-climate-neutral-europe/ (accessed on 3 March 2022).
  4. Verhelst, S.; Wallner, T. Hydrogen-fueled internal combustion engines. Prog. Energy Combust. Sci. 2009, 35, 490–527. [Google Scholar] [CrossRef] [Green Version]
  5. Nguyen, D.; Choi, Y.; Park, C.; Kim, Y.; Lee, J. Effect of supercharger system on power enhancement of hydrogen-fueled spark-ignition engine under low-load condition. Int. J. Hydrogen Energy 2021, 46, 6928–6936. [Google Scholar] [CrossRef]
  6. Gürbüz, H.; Akçay, İ.H. Evaluating the effects of boosting intake-air pressure on the performance and environmental-economic indicators in a hydrogen-fueled SI engine. Int. J. Hydrogen Energy 2021, 46, 28801–28810. [Google Scholar] [CrossRef]
  7. Şöhret, Y.; Gürbüz, H.; Akçay, İ.H. Energy and exergy analyses of a hydrogen fueled SI engine: Effect of ignition timing and compression ratio. Energy 2019, 175, 410–422. [Google Scholar] [CrossRef]
  8. Mohammadi, A.; Shioji, M.; Nakai, Y.; Ishikura, W.; Tabo, E. Performance and combustion characteristics of a direct injection SI hydrogen engine. Int. J. Hydrogen Energy 2007, 32, 296–304. [Google Scholar] [CrossRef]
  9. Babayev, R.; Andersson, A.; Dalmau, A.S.; Im, H.G.; Johansson, B. Computational characterization of hydrogen direct injection and nonpremixed combustion in a compression-ignition engine. Int. J. Hydrogen Energy 2021, 46, 18678–18696. [Google Scholar] [CrossRef]
  10. Takagi, Y.; Oikawa, M.; Sato, R.; Kojiya, Y.; Mihara, Y. Near-zero emissions with high thermal efficiency realized by optimizing jet plume location relative to combustion chamber wall, jet geometry and injection timing in a direct-injection hydrogen engine. Int. J. Hydrogen Energy 2019, 44, 9456–9465. [Google Scholar] [CrossRef]
  11. Li, H.; Karim, G.A. Knock in spark ignition hydrogen engines. Int. J. Hydrogen Energy 2004, 29, 859–865. [Google Scholar] [CrossRef]
  12. Li, Y.; Gao, W.; Zhang, P.; Fu, Z.; Cao, X. Influence of the equivalence ratio on the knock and performance of a hydrogen direct injection internal combustion engine under different compression ratios. Int. J. Hydrogen Energy 2021, 46, 11982–11993. [Google Scholar] [CrossRef]
  13. Dhyani, V.; Subramanian, K.A. Development of online control system for elimination of backfire in a hydrogen fuelled spark ignition engine. Int. J. Hydrogen Energy 2021, 46, 14757–14763. [Google Scholar] [CrossRef]
  14. Dhyani, V.; Subramanian, K.A. Control of backfire and NOx emission reduction in a hydrogen fueled multi-cylinder spark ignition engine using cooled EGR and water injection strategies. Int. J. Hydrogen Energy 2019, 44, 6287–6298. [Google Scholar] [CrossRef]
  15. Zhen, X.; Li, X.; Wang, Y.; Liu, D.; Tian, Z. Comparative study on combustion and emission characteristics of methanol/hydrogen, ethanol/hydrogen and methane/hydrogen blends in high compression ratio SI engine. Fuel 2020, 267, 117193. [Google Scholar] [CrossRef]
  16. Zareei, J.; Rohani, A.; Mazari, F.; Mikkhailova, M.V. Numerical investigation of the effect of two-step injection (direct and port injection) of hydrogen blending and natural gas on engine performance and exhaust gas emissions. Energy 2021, 231, 120957. [Google Scholar] [CrossRef]
  17. Zhang, R.; Chen, L.; Wei, H.; Pan, J.; Li, J.; Yang, P.; Chen, R. Optical study on the effects of the hydrogen injection timing on lean combustion characteristics using a natural gas/hydrogen dual-fuel injected spark-ignition engine. Int. J. Hydrogen Energy 2021, 46, 20777–20789. [Google Scholar] [CrossRef]
  18. Taghavifar, H.; Nemati, A.; Salvador, F.J.; De la Morena, J. 1D energy, exergy, and performance assessment of turbocharged diesel/hydrogen RCCI engine at different levels of diesel, hydrogen, compressor pressure ratio, and combustion duration. Int. J. Hydrogen Energy 2021, 46, 22180–22194. [Google Scholar] [CrossRef]
  19. Liu, X.; Srna, A.; Yip, H.L.; Kook, S.; Chan, Q.N.; Hawkes, E.R. Performance and emissions of hydrogen-diesel dual direct injection (H2DDI) in a single-cylinder compression-ignition engine. Int. J. Hydrogen Energy 2021, 46, 1302–1314. [Google Scholar] [CrossRef]
  20. Jamrozik, A.; Grab-Rogaliński, K.; Tutak, W. Hydrogen effects on combustion stability, performance and emission of diesel engine. Int. J. Hydrogen Energy 2020, 45, 19936–19947. [Google Scholar] [CrossRef]
  21. Ikegami, M.; Miwa, K.; Shioji, M. A study of hydrogen fuelled compression ignition engines. Int. J. Hydrogen Energy 1982, 7, 341–353. [Google Scholar] [CrossRef]
  22. Kavtaradze, R.Z. Improving the ecological indices of a hydrogen diesel engine with direct gaseous hydrogen injection. J. Mach. Manuf. Reliab. 2016, 45, 307–315. [Google Scholar] [CrossRef]
  23. Cheng, Q.; Ahmad, Z.; Kaario, O.; Vuorinen, V.; Larmi, M. Experimental study on tri-fuel combustion using premixed methane-hydrogen mixtures ignited by a diesel pilot. Int. J. Hydrogen Energy 2021, 46, 21182–21197. [Google Scholar] [CrossRef]
  24. Karimkashi, S.; Kahila, H.; Kaario, O.; Larmi, M.; Vuorinen, V. Numerical study on tri-fuel combustion: Ignition properties of hydrogen-enriched methane-diesel and methanol-diesel mixtures. Int. J. Hydrogen Energy 2020, 45, 4946–4962. [Google Scholar] [CrossRef]
  25. Sanli, A.; Yılmaz, I.T.; Gümüş, M. Assessment of combustion and exhaust emissions in a common-rail diesel engine fueled with methane and hydrogen/methane mixtures under different compression ratio. Int. J. Hydrogen Energy 2020, 45, 3263–3283. [Google Scholar] [CrossRef]
  26. Mansor MR, A.; Abbood, M.M.; Mohamad, T.I. The influence of varying hydrogen-methane-diesel mixture ratio on the combustion characteristics and emissions of a direct injection diesel engine. Fuel 2017, 190, 281–291. [Google Scholar] [CrossRef]
  27. Rahimi, H.M.; Jazayeri, S.A.; Ebrahimi, M. Hydrogen energy share enhancement in a heavy duty diesel engine under RCCI combustion fueled with natural gas and diesel oil. Int. J. Hydrogen Energy 2020, 45, 17975–17991. [Google Scholar] [CrossRef]
  28. Ebrahimi, M.; Jazayeri, S.A. Effect of hydrogen addition on RCCI combustion of a heavy duty diesel engine fueled with landfill gas and diesel oil. Int. J. Hydrogen Energy 2019, 44, 7607–7615. [Google Scholar] [CrossRef]
  29. Kannan, J.; Gadalla, M.; Tekgül, B.; Karimkashi, S.; Kaario, O.; Vuorinen, V. Large-eddy simulation of tri-fuel ignition: Diesel spray-assisted ignition of lean hydrogen–methane–air mixtures. Combust. Theory Model. 2021, 25, 436–459. [Google Scholar] [CrossRef]
  30. Rui, Z.; Leping, X.; Shiquan, F. Construction of a reduced mechanism for diesel-natural gas -hydrogen using HCCI model with Direct Relation Graph and Sensitivity Analysis. Pol. J. Chem. Technol. 2020, 22, 55–60. [Google Scholar] [CrossRef]
  31. Zhou, J.H.; Cheung, C.S.; Leung, C.W. Combustion, performance and emissions of a diesel engine with H2, CH4 and H2–CH4 addition. Int. J. Hydrogen Energy 2014, 39, 4611–4621. [Google Scholar] [CrossRef]
  32. Sabah, O.; Mohammad, T.I.; Mansor, M.R.A. Effect on changing of intake temperature to hydrogen-methane-diesel mixture combustion characteristics. IOP Conf. Ser. Earth Environ. Sci. 2020, 463, 012059. [Google Scholar] [CrossRef]
  33. Cernat, A.; Pana, C.; Negurescu, N.; Lazaroiu, G.; Nutu, C.; Fuiorescu, D. Hydrogen—An Alternative Fuel for Automotive Diesel Engines Used in Transportation. Sustainability 2020, 12, 9321. [Google Scholar] [CrossRef]
  34. Talibi, M.; Balachandran, R.; Ladommatos, N. Influence of combusting methane-hydrogen mixtures on compression–ignition engine exhaust emissions and in-cylinder gas composition. Int. J. Hydrogen Energy 2017, 42, 2381–2396. [Google Scholar] [CrossRef]
  35. Saanum, I.; Bysveen, M.; Hustad, J. Study of Particulate Matter-, NOx- and Hydrocarbon Emissions from a Diesel Engine Fueled with Diesel Oil and Biodiesel with Fumigation of Hydrogen, Methane and Propane; SAE Technical Paper 2008-01-1809; SAE: Warrendale, PA, USA, 2008. [Google Scholar] [CrossRef]
  36. Abu-Jrai, A.M.; Ala’a, H.; Hasan, A.O. Combustion, performance, and selective catalytic reduction of NOx for a diesel engine operated with combined tri fuel (H2, CH4, and conventional diesel). Energy 2017, 119, 901–910. [Google Scholar] [CrossRef]
  37. Liu, X.; Kokjohn, S.; Wang, H.; Yao, M. A comparative numerical investigation of reactivity controlled compression ignition combustion using Large Eddy Simulation and Reynolds-Averaged Navier-Stokes approaches. Fuel 2019, 257, 116023. [Google Scholar] [CrossRef]
  38. Tang, Q.; Liu, X.; Liu, H.; Wang, H.; Yao, M. Investigation on the dual-fuel active-thermal atmosphere combustion strategy based on optical diagnostics and numerical simulations. Fuel 2020, 276, 118023. [Google Scholar] [CrossRef]
  39. Gehmlich, R.K.; Dumitrescu, C.E.; Wang, Y.; Mueller, C.J. Leaner Lifted-Flame Combustion Enabled by the Use of an Oxygenated Fuel in an Optical CI Engine. SAE Int. J. Engines 2016, 9, 1526–1543. [Google Scholar] [CrossRef]
  40. Huang, H.W.; Zhang, Y. Digital colour image processing based measurement of premixed CH4+air and C2H4+air flame chemiluminescence. Fuel 2011, 90, 48–53. [Google Scholar] [CrossRef]
  41. Bedard, M.J.; Fuller, T.L.; Sardeshmukh, S.; Anderson, W.E. Chemiluminescence as a diagnostic in studying combustion instability in a practical combustor. Combust. Flame 2020, 213, 211–225. [Google Scholar] [CrossRef]
  42. Gupta, S.B.; Bihari, B.P.; Biruduganti, M.S.; Sekar, R.R.; Zigan, J. On use of CO2∗ chemiluminescence for combustion metrics in natural gas fired reciprocating engines. Proc. Combust. Inst. 2011, 33, 3131–3139. [Google Scholar] [CrossRef]
  43. Tang, Q.; Liu, H.; Ran, X.; Li, M.; Yao, M. Effects of direct-injection fuel types and proportion on late-injection reactivity controlled compression ignition. Combust. Flame 2020, 211, 445–455. [Google Scholar] [CrossRef]
  44. Tang, Q.; Liu, H.; Yao, M. Simultaneous Measurement of Natural Flame Luminosity and Emission Spectra in a RCCI Engine under Different Fuel Stratification Degrees. SAE Int. J. Engines 2017, 10, 1155–1162. [Google Scholar] [CrossRef]
  45. Upatnieks, A.; Mueller, C.; Martin, G. The Influence of Charge-Gas Dilution and Temperature on DI Diesel Combustion Processes Using a Short-Ignition-Delay, Oxygenated Fuel; SAE Technical Paper 2005-01-2088; SAE: Warrendale, PA, USA, 2005. [Google Scholar] [CrossRef]
  46. Upatnieks, A.; Mueller, C. Clean, Controlled DI Diesel Combustion Using Dilute, Cool Charge Gas and a Short-Ignition-Delay, Oxygenated Fuel; SAE Technical Paper 2005-01-0363; SAE: Warrendale, PA, USA, 2005. [Google Scholar] [CrossRef]
  47. Raman, V.; Tang, Q.; An, Y.; Shi, H.; Sharma, P.; Magnotti, G.; Chang, J.; Johansson, B. Impact of spray-wall interaction on the in-cylinder spatial unburned hydrocarbon distribution of a gasoline partially premixed combustion engine. Combust. Flame 2020, 215, 157–168. [Google Scholar] [CrossRef]
  48. Liu, H.; Tang, Q.; Ran, X.; Fang, X.; Yao, M. Optical diagnostics on the reactivity controlled compression ignition (RCCI) with micro direct-injection strategy. Proc. Combust. Inst. 2019, 37, 4767–4775. [Google Scholar] [CrossRef]
  49. Liu, H.; Tang, Q.; Yang, Z.; Ran, X.; Geng, C.; Chen, B.; Feng, L.; Yao, M. A comparative study on partially premixed combustion (PPC) and reactivity controlled compression ignition (RCCI) in an optical engine. Proc. Combust. Inst. 2019, 37, 4759–4766. [Google Scholar] [CrossRef]
  50. Escofet-Martin, D.; Chien, Y.-C.; Dunn-Rankin, D. PLIF and chemiluminescence in a small laminar coflow methane-air diffusion flame at elevated pressures. Combust. Flame 2022, 243, 112067. [Google Scholar] [CrossRef]
  51. Ahmad, Z.; Kaario, O.; Qiang, C.; Larmi, M. Effect of pilot fuel properties on lean dual-fuel combustion and emission characteristics in a heavy-duty engine. Applied Energy 2021, 282 Pt A, 116134. [Google Scholar] [CrossRef]
  52. Dronniou, N.; Kashdan, J.; Lecointe, B.; Sauve, K.; Soleri, D. Optical investigation of dual-fuel CNG/diesel combustion strategies to reduce CO2 emissions. SAE Int. J. Engines 2014, 7, 873–887. [Google Scholar] [CrossRef]
  53. Nithyanandan, K.; Gao, Y.; Wu, H.; Lee, C.-F.; Liu, F.; Yan, J. An Optical Investigation of Multiple Diesel Injections in CNG/Diesel Dual-Fuel Combustion in a Light-Duty Optical Diesel Engine; SAE Technical Paper Series; SAE International: Warrendale, PA, USA, 2017; Volume 1. [Google Scholar] [CrossRef]
  54. Khosravi, M.; Rochussen, J.; Yeo, J.; Kirchen, P.; McTaggart-Cowan, G.; Wu, N. Effect of Fuelling Control Parameters on Combustion Characteristics of Diesel-Ignited Natural Gas Dual-Fuel Combustion in an Optical Engine; ASME International: New York, NY, USA, 2016; p. V001T03A012. [Google Scholar] [CrossRef]
  55. Ahmad, Z.; Aryal, J.; Ranta, O.; Kaario, O.; Vuorinen, V.; Larmi, M. An Optical Characterization of Dual-Fuel Combustion in a Heavy-Duty Diesel Engine; SAE Technical Paper Series; SAE International: Warrendale, PA, USA, 2018; Volume 1. [Google Scholar] [CrossRef]
Figure 1. Schematic of the optical engine and high-speed camera location relative to the combustion chamber. (Note: P represents the pressure sensor, and T represents the thermocouple).
Energies 15 09080 g001
Figure 2. Relative spectral response curves of Photron SA-Z color camera.
Energies 15 09080 g002
Figure 3. Raw images of the (a) pilot diesel spray, (b) flame kernel creation, (c) low-temperature flame propagation, and (d) high-temperature combustion.
Energies 15 09080 g003
Figure 4. Integrated intensity of axial distance from injector tip I( r n , CAD) over 25 individual combustion cycles. Left: example of the integrated intensity of axial distance r n = 5 ,   15 ,   25   mm at 364.52 CAD. Bottom: example of the integrated intensity of axial distance r n = 20   mm and crank angle of 363.08 CAD, 373.16 CAD, 383.24 CAD, and 393.32 CAD.
Energies 15 09080 g004
Figure 5. Evolution of cylinder pressure and apparent heat release rate (aHRR) under various H2 concentrations in the H2–CH4 mixture. The pilot injection durations are shown with gray rectangles and the starts of combustions are shown in dashed lines.
Energies 15 09080 g005
Figure 6. A summary of the effect of H2 addition on TF combustion. (a) IDT, (b) ITE, (c) IMEP.
Energies 15 09080 g006
Figure 7. The effect of H2 addition on the engine emissions under various charge-air temperatures in a full-metal single-cylinder engine.
Energies 15 09080 g007
Figure 8. The true-color natural flame luminosity (bottom) and axial integrated intensity on the discretized radius (upper) of TF combustion under various χ H 2 / CH 4 , (I) χ H 2 / CH 4 = 0, (II) χ H 2 / CH 4 = 20%, (III) χ H 2 / CH 4 = 40%, (IV) χ H 2 / CH 4 = 60%. (The red profile is the axial integrated intensity of the flame, and the white lines clarify the timing of the selected images in the axial intensity distribution.)
Energies 15 09080 g008aEnergies 15 09080 g008bEnergies 15 09080 g008cEnergies 15 09080 g008d
Figure 9. Probability of flame distribution index of NFL images at different crank angles. All five test cases from χ H 2 / CH 4 = 0 to 60% (row 1 to row 5) at various crank angles (column 1 to 5) are summarized to characterize the FSI. The color contour from blue to red represents the FSI from 0 to 1. (The pink circle is the edge of the combustion bowl).
Energies 15 09080 g009
Table 1. Specifications of optically accessible engine.
ParameterUnitValue
Engine model Modified 6-cylinder AGCO 84AWI engine
Output powerkW200–298 @2100 rpm
Operating engine speedrpm1200
Bore × strokemm × mm111 × 145
Connecting rod lengthmm132
Displacement volumecm31402
Combustion bowl volumecm389.9
Geometric compression ratio 16.7:1
Swirl ratio <0.1
Diesel pilot injector Bosch CRI3 injector (piezo)
Hole number of diesel pilot 6
µm90
Diesel pilot pressurebar1000
Gas Injector 2 × Bosch NGI injectors
Gas pressurebar8
Crank angle of intake openingCAD BTDC2
Crank angle of intake closingCAD ATDC210
Crank angle of exhaust openingCAD BTDC225
Crank angle of exhaust closingCAD BTDC6
Table 2. Specification of measurement devices for controlling and monitoring the engine operating conditions.
VariableDevice Type/Model and ManufactureManufactureRangeAccuracy
Load and speed45 KW 94 AMP MOTOR with ACS800-11 frequency converter, ABB, Switzerland0–2960 rpm±10 rpm
Valve TimingEHVAParker, US0–12 mm±0.05 mm
Cooling temperatureCooling system Customized, Finland0–100 °C±1 °C
Charge-air pressureElectric CompressorCustomized, Finland0–3 bar±0.5%
Charge-air mass flowRHM-08 Coriolis Rheonik Messtechnik, Germany0–200 kg/h±0.5%
Charge-air temperaturePT100TC, UK0–200 °C±0.1%
Charge-air pressurePiezoelectric/AVL LPD11DA05AVL, Austra0–5 bar±0.1%
Cylinder pressure6125C sensor and 5011B amplifier Kistler, Switzerland0–300 bar≤±0.4%
Exhaust temperatureType K, TCTC, UK0–1000 °C±0.5%
Exhaust pressurePiezoelectric/AVL GU21CAVL, Austra0–10 bar±0.1%
H2 mass flowMVM-030-PAEL-FLOW®, Netherland1–30 L/min±0.3%
CH4 mass flowMVM-060-PAEL-FLOW®, Netherland1–60 L/min±0.3%
Table 3. Overview of the engine operating conditions.
ParameterUnitValue
Pilot fuel EN590
Start of injection timingCAD BTDC7
m ˙ airkg/h80
Lambda 2
Pilot energy share ratio%5
Cooling temperature°C70
Pilot energyMJ/h13.26
m ˙ pilotg/h318.4
Pilot durationms0.174
Charge-air temperatureK298
Table 4. Details of gaseous fuel substations and energy share ratio.
Case No.H2 Volume FractionH2 Energy Share Ratio m ˙ H 2 m ˙ CH 4 H2 EnergyCH4 Energy
Vol.%%g/hg/hMJ/hMJ/h
10001450072.51
2103.119.71410.72.3670.54
3206.742.861364.45.1468.22
44015.9104.05124212.4962.1
56029.6198.51053.123.8252.66
Publisher’s Note: MDPI stays neutral with regard to jurisdictional claims in published maps and institutional affiliations.

