Article

Numerical Simulation Research on the Vibration of Helical Tube Arrays under Transverse Flow

1
College of Mechanical Engineering, Zhejiang University of Technology, Hangzhou 310014, China
2
High Speed Aerodynamic Institute, China Aerodynamics Research and Development Center, Mianyang 621000, China
*
Author to whom correspondence should be addressed.
Energies 2022, 15(23), 9082; https://doi.org/10.3390/en15239082
Submission received: 28 October 2022 / Revised: 17 November 2022 / Accepted: 18 November 2022 / Published: 30 November 2022

Abstract

:
Helical tube steam generators are often used in nuclear power plants because of their compact structure and high heat transfer efficiency. The impact of the internal fluid causes the vibration of the tube bundle, which leads to the failure of the integrity of the safety structure. Aiming at flow-induced vibration (FIV) of helical tube arrays, a finite element model of the helical tube was established to consider the constraint of the support structure. The computational fluid dynamics (CFD)/computational structural dynamics (CSD) coupling calculation method based on the superposition of three modes was used to study the FIV characteristics of helical tube arrays at different flow velocities. The influence of adjacent helical tubes’ vibration on the vibration of the target tube was also investigated. The results show that when FIV occurs in the helical tube, with the increase of inlet velocity, the axial amplitude will be greater than the radial at the same velocity. When some tubes vibrate, the vibration of the target tube will be enhanced; while adjacent tubes vibrate, it will weaken the impact of the fluid on the target tube and obviously weaken the vibration of the target tube.

1. Introduction

The helical tube steam generator is often used in small modular nuclear reactors in the field of nuclear engineering [1]. The shell side flow is mainly composed of single-phase fluid, and the tube side internal flow is the second one [2,3,4]. In the history of the operation of nuclear plants, a considerable number of steam generators fail every year, and the internal FIV is the main cause of tube rupture [5]. FIV induces fretting wear and fatigue, resulting in the growth of preexisting defects, ultimately leading to serious tube failure, which affects the safe operation of heat exchange equipment. Therefore, a complete FIV analysis of the tubes in the heat exchanger is necessary.
In recent years, scholars have carried out extensive research on the FIV behavior of straight tubes and U-shaped tubes [6,7], but the research on the FIV of helical tubes is still in its infancy. Jo [8] studied the flow-induced vibration and fretting wear of the helical tube of the once-through steam generator of an integral nuclear reactor under the action of external transverse flow and internal multiphase flow. The effects of the support number, helical diameter and pitch of the helical tube on the mode of the helical tube are simulated by the finite element method, and the effects of these conditions on turbulent buffeting, flow elastic instability and fretting wear are analyzed by theoretical calculation. Yuan et al. [9] carried out a numerical study on FIV of a fan-shaped helical tube array model, but only one-way coupling was used in the study. The pressure load generated by the fluid was transferred to the structure, and the structural displacement would not be fed back to the fluid. Lee et al. [10] established a five-layer helical tube bundle experimental device, as shown in Figure 1. The vorticity in the five-layer tube bundle was studied using the sector tube bundle interface of 22.5°, and the flow field at different inlet velocities was measured using particle image velocimetry. This study was only aimed at the tube bundle flow field in the shell side and did not analyze the tube bundle vibration. Delgado et al. [11] established a 24° fan-shaped helical tube array interface device to study the flow direction and transverse velocity field distribution under different axial sections. It can be found that the current research on helical tubes has been focused on the shell side flow field in the simplified fan-shaped tube array interface. The FIV essentially revolves around the theoretical level for rough calculation and evaluation. However, numerical simulation of the FIV of the helical tube array is rarely carried out.
The CFD method can visualize the flow phenomenon in the fluid domain, but the fluid dynamics is not enough to predict the FIV [12,13]. The structural responses of the tube caused by the flow conditions are equally important. The tube structure affects the flow characteristics; therefore, the most comprehensive analysis is related to the fluid-structure coupling method, so that the flow field and tube structure can respond and interact with each other. CFD and CSD can be integrated to predict the fluid elastic response in the time domain. The coupling method of CFD/CSD has been proved to be reliable because of its rapid response, high accuracy, and continuous development and improvement [14]. Li et al. [15] reported, based on the loosely coupled CFD/CSD calculation method, that this method has high accuracy for the analysis of unsteady aeroelastic loads of rotor, and can accurately capture the peak pressure and shock position on the blade surface. Tang et al. [16] proposed a high-order CFD/CSD coupling method, which uses the linear multistep tight coupling fluid elastic coupling method to improve the accuracy of the calculation results.
At present, the research on helical tubes focuses on flow field monitoring of the established HTSG simplified model using PIV technology. The model selection method is to intercept a sector area to simplify the whole model, taking into account the amount of calculation and accuracy. These have good guiding significance for understanding the helical tube steam generator, but the understanding is very limited. The numerical simulation is also mainly aimed at the transverse flow field at the shell side when the helical tube bundle is not vibrated. The flow-induced vibration of the helical tube is also roughly calculated and evaluated around the theoretical part. Research on the flow field response and tube bundle response when the helical tube bundle is vibrated is very rare at present, and research on the flow-induced vibration behavior of the tube bundle is an essential part. Therefore, research on this subject is of great significance. Furthermore, the CFD/CSD coupling method has been applied to many studies, and many scholars have proved the correctness and reliability of this method. Moreover, when studying FIV behavior of heat exchange tubes, only the first-order mode vibration response is considered [17,18,19], but the vibration of heat exchange tubes is a multi-order mode superposition process. It is necessary to superimpose the heat exchange tube mode into the coupling calculation method, considering the effect of the multi-order mode on the flow-induced vibration of the heat exchange tube, and understand the flow-induced vibration behavior of the helical tube bundle more comprehensively. In addition, it is found that the vibration of adjacent tube arrays affects each other. The problem of coupled vibration between adjacent tubes that we have studied before was mainly aimed at the 2D U tube [20], and the mode superposition effect on the 3D helical tube was not considered; this paper is based on the previous work. Based on the CFD/CSD coupling method, this paper mainly studies the flow-induced vibration characteristics of helical tube bundles under multi-order mode superposition and the influence of adjacent tubes on the vibration of target tubes.

2. Numerical and Modeling Method

2.1. CFD Method

In the paper, the fluid is controlled by incompressible Navier–Stokes equations:
u i x i = 0
ρ ( u i t + u i u j x j ) = x j [ ( μ + μ t ) u i x j ] p x i
where t is the time, s; u is the velocity, m/s; p is the pressure; Pa; ρ is the fluid density, kg/m3; μ is the dynamic viscosity coefficient, kg/m·s; and μ t is the turbulent viscosity.
The root mean square (RMS) lift coefficient is defined as follows:
C L ( R M S ) = 1 n i = 1 n C L i 2
where CL is the lift coefficient, mm. The root mean square values of other parameters are solved according to Equation (3).
The k-ε and k-ω, SST k-ω, and Transition SST were used to measure the distribution of the time average pressure coefficient on the cylinder surface, as shown in Figure 2. The results were compared with those measured experimentally by Achenbach [21]. It can be concluded that the time average pressure coefficient CP of all the models is in good agreement with experimental data before 70° from Table 1. However, the deviation between the Transition SST model and experimental data is 2.51% at the maximum CP, and the maximum deviation of the transition SST model in the range of 120~240° is 8.70%. However, the deviation was large when using other simulation models. The data results show that the maximum positive CP simulated by the Transition SST model is 1.0, which is consistent with the theoretical value. The minimum negative CP is in good agreement with the results of the experiment, although there is a small deviation in the range of 120~240°. Therefore, it can be approximately considered that the calculated results are consistent with the experimental data, so the Transition SST model is used in this study. It is proved that the numerical calculation model selected in this paper can solve the flow field of tube arrays well, and the conclusion obtained is also reliable as an academic reference.

2.2. CFD/CSD Coupling Method under Mode Superposition

In the flow field calculation of a three-dimensional elastic helical tube, the fluid force load is obtained by UDF (User−Defined Function) and loaded into the element node. The helical tube is vibrated by fluid force in the radial and axial directions, and its motion control equation:
[ m ] { x ¨ ( t ) } + [ C ] { x ˙ ( t ) } + [ k ] { x ( t ) } = { F x ( t ) }
where [ m ] is the mass matrix of the helical tube, kg; [ C ] is the damping matrix of the helical tube, N·s/m; [ k ] is the stiffness matrix of the helical tube, N/m; x ( t ) is the helical tube displacement in the radial direction, m; and F x ( t ) is the directional fluid force, N. F x ( t ) , which represents the resultant force of external forces on the spiral tube, is the integral of normal force as well as the tangent force against the cylinder surface. In this equation, the mass matrix, stiffness matrix, and damping matrix can be extracted from the modal calculation of the spiral tube through finite element analysis.
The above CFD/CSD coupling method is aimed at the vibration response of the cylinder under the first-order mode. In the paper, the vibration under the superposition of three-order modes is considered. Firstly, the modal matrix of the helical tube is obtained from the finite element software, and the motion control Equation (4) is transformed into (7) by decoupling. Combined with the dynamic grid method to predict the coupled vibration of the helical tube, motion control equation for coordinate transformation { x ( t ) } = [ N ] { s ( t ) } :
[ m ] [ N ] { s ¨ ( t ) } + [ c ] [ N ] { s ˙ ( t ) } + [ k ] [ N ] { s ( t ) } = { F x ( t ) }
Multiply each side of Equation (5) by normalized modal matrix [ N ] T resulting the Equation (6):
[ I ] { s ¨ ( t ) } + 2 ξ n ω n { s ˙ ( t ) } + [ ω 1 2 ω n 2 ] { s ( t ) } = { F s ( t ) }
where { F s ( t ) } is the generalized fluid force, N; ξ n is the nth modal damping rate of the helical tube; ω n is the natural frequency of the nth mode of the helical tube; and [ N ] is the normalized helical tube modal matrix.

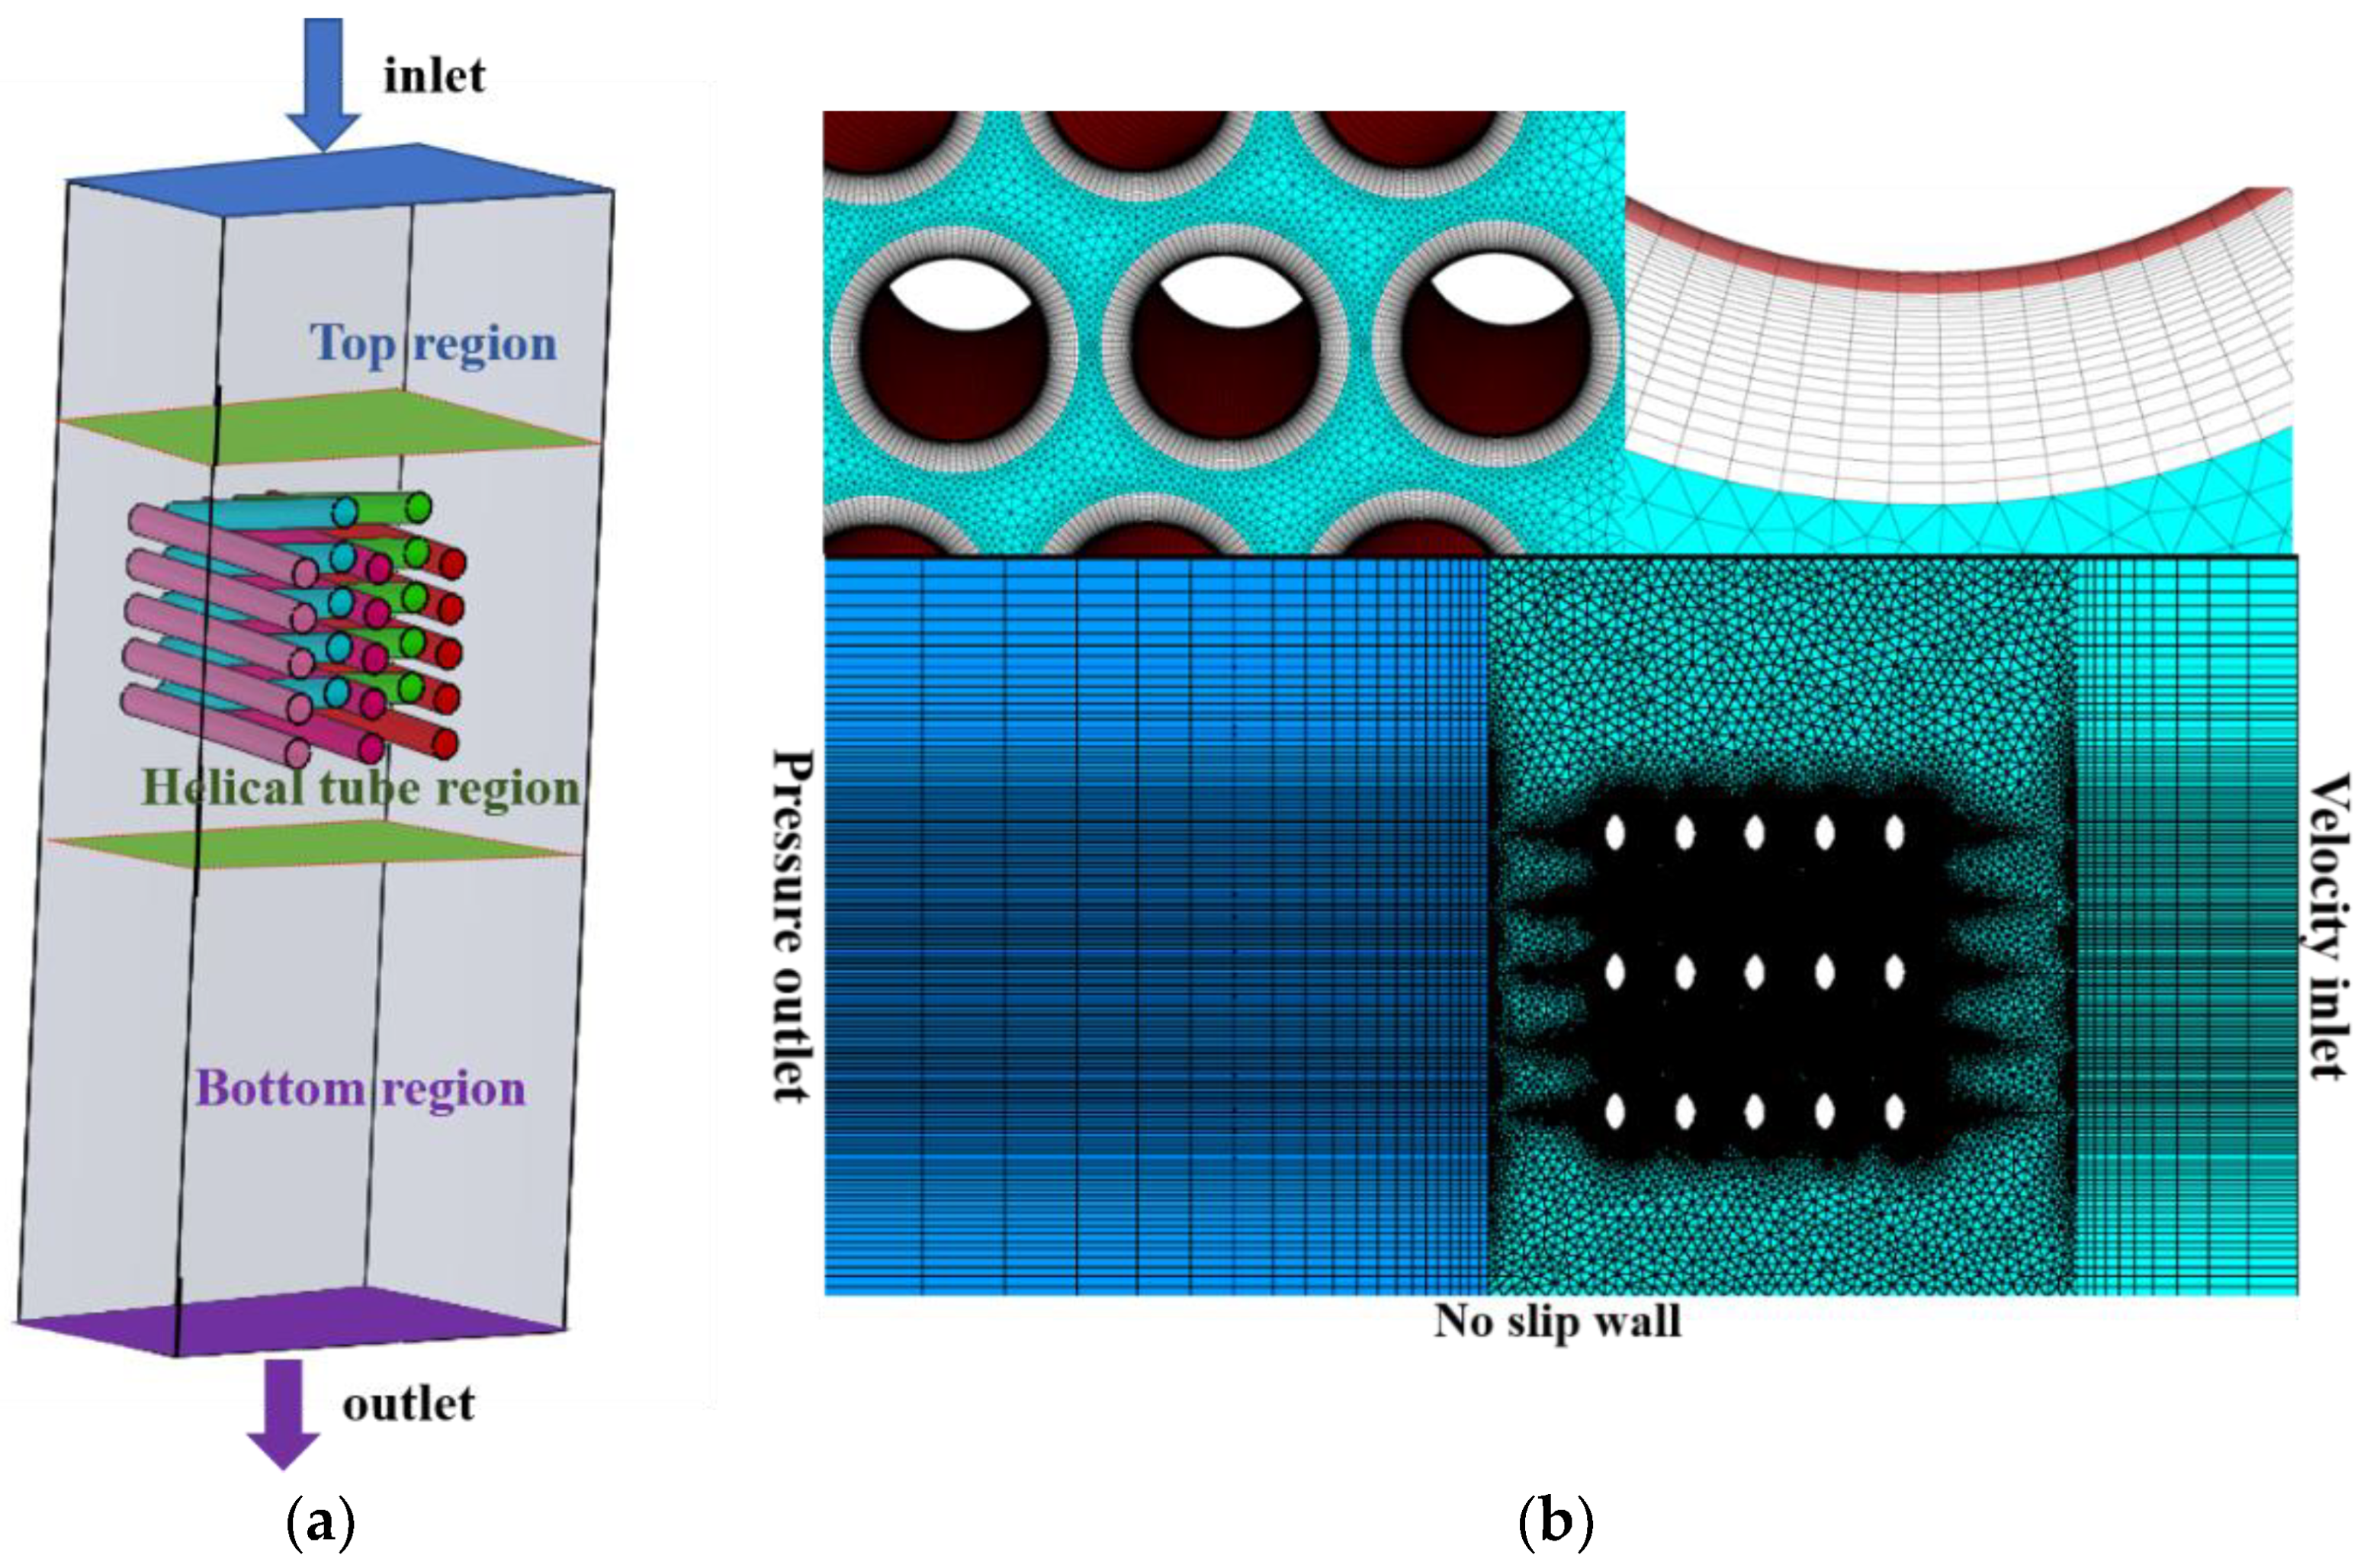
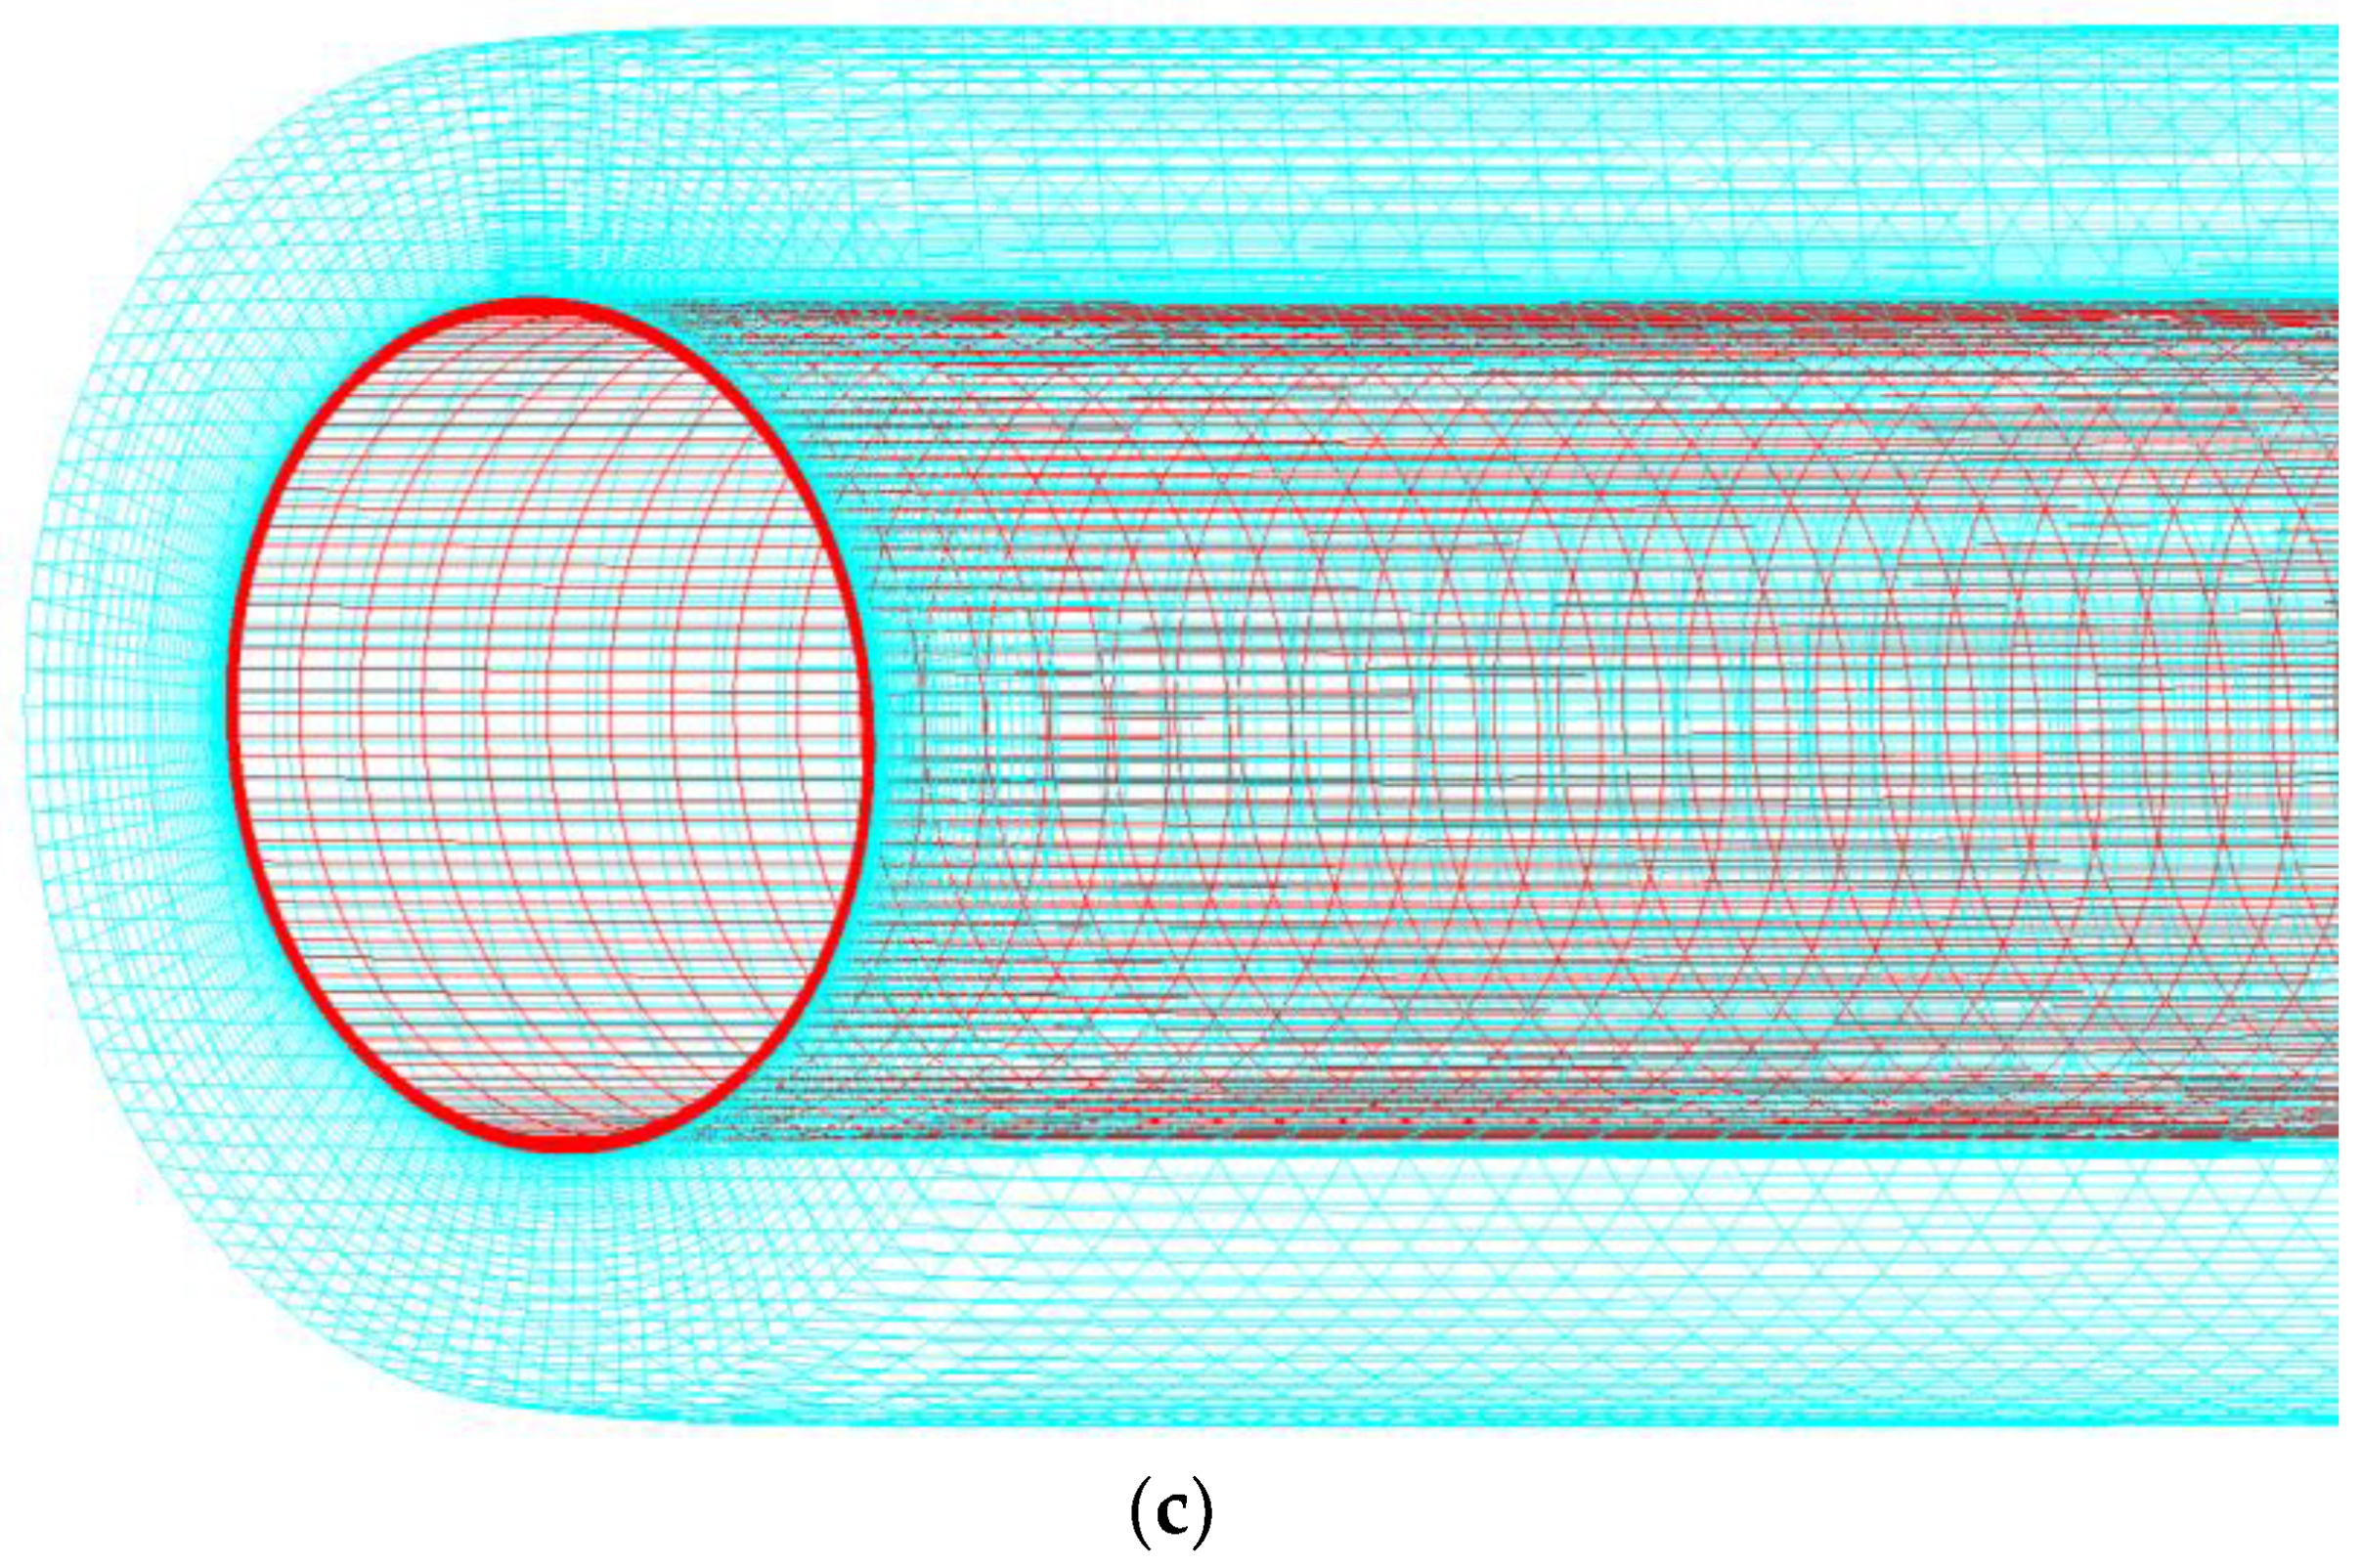
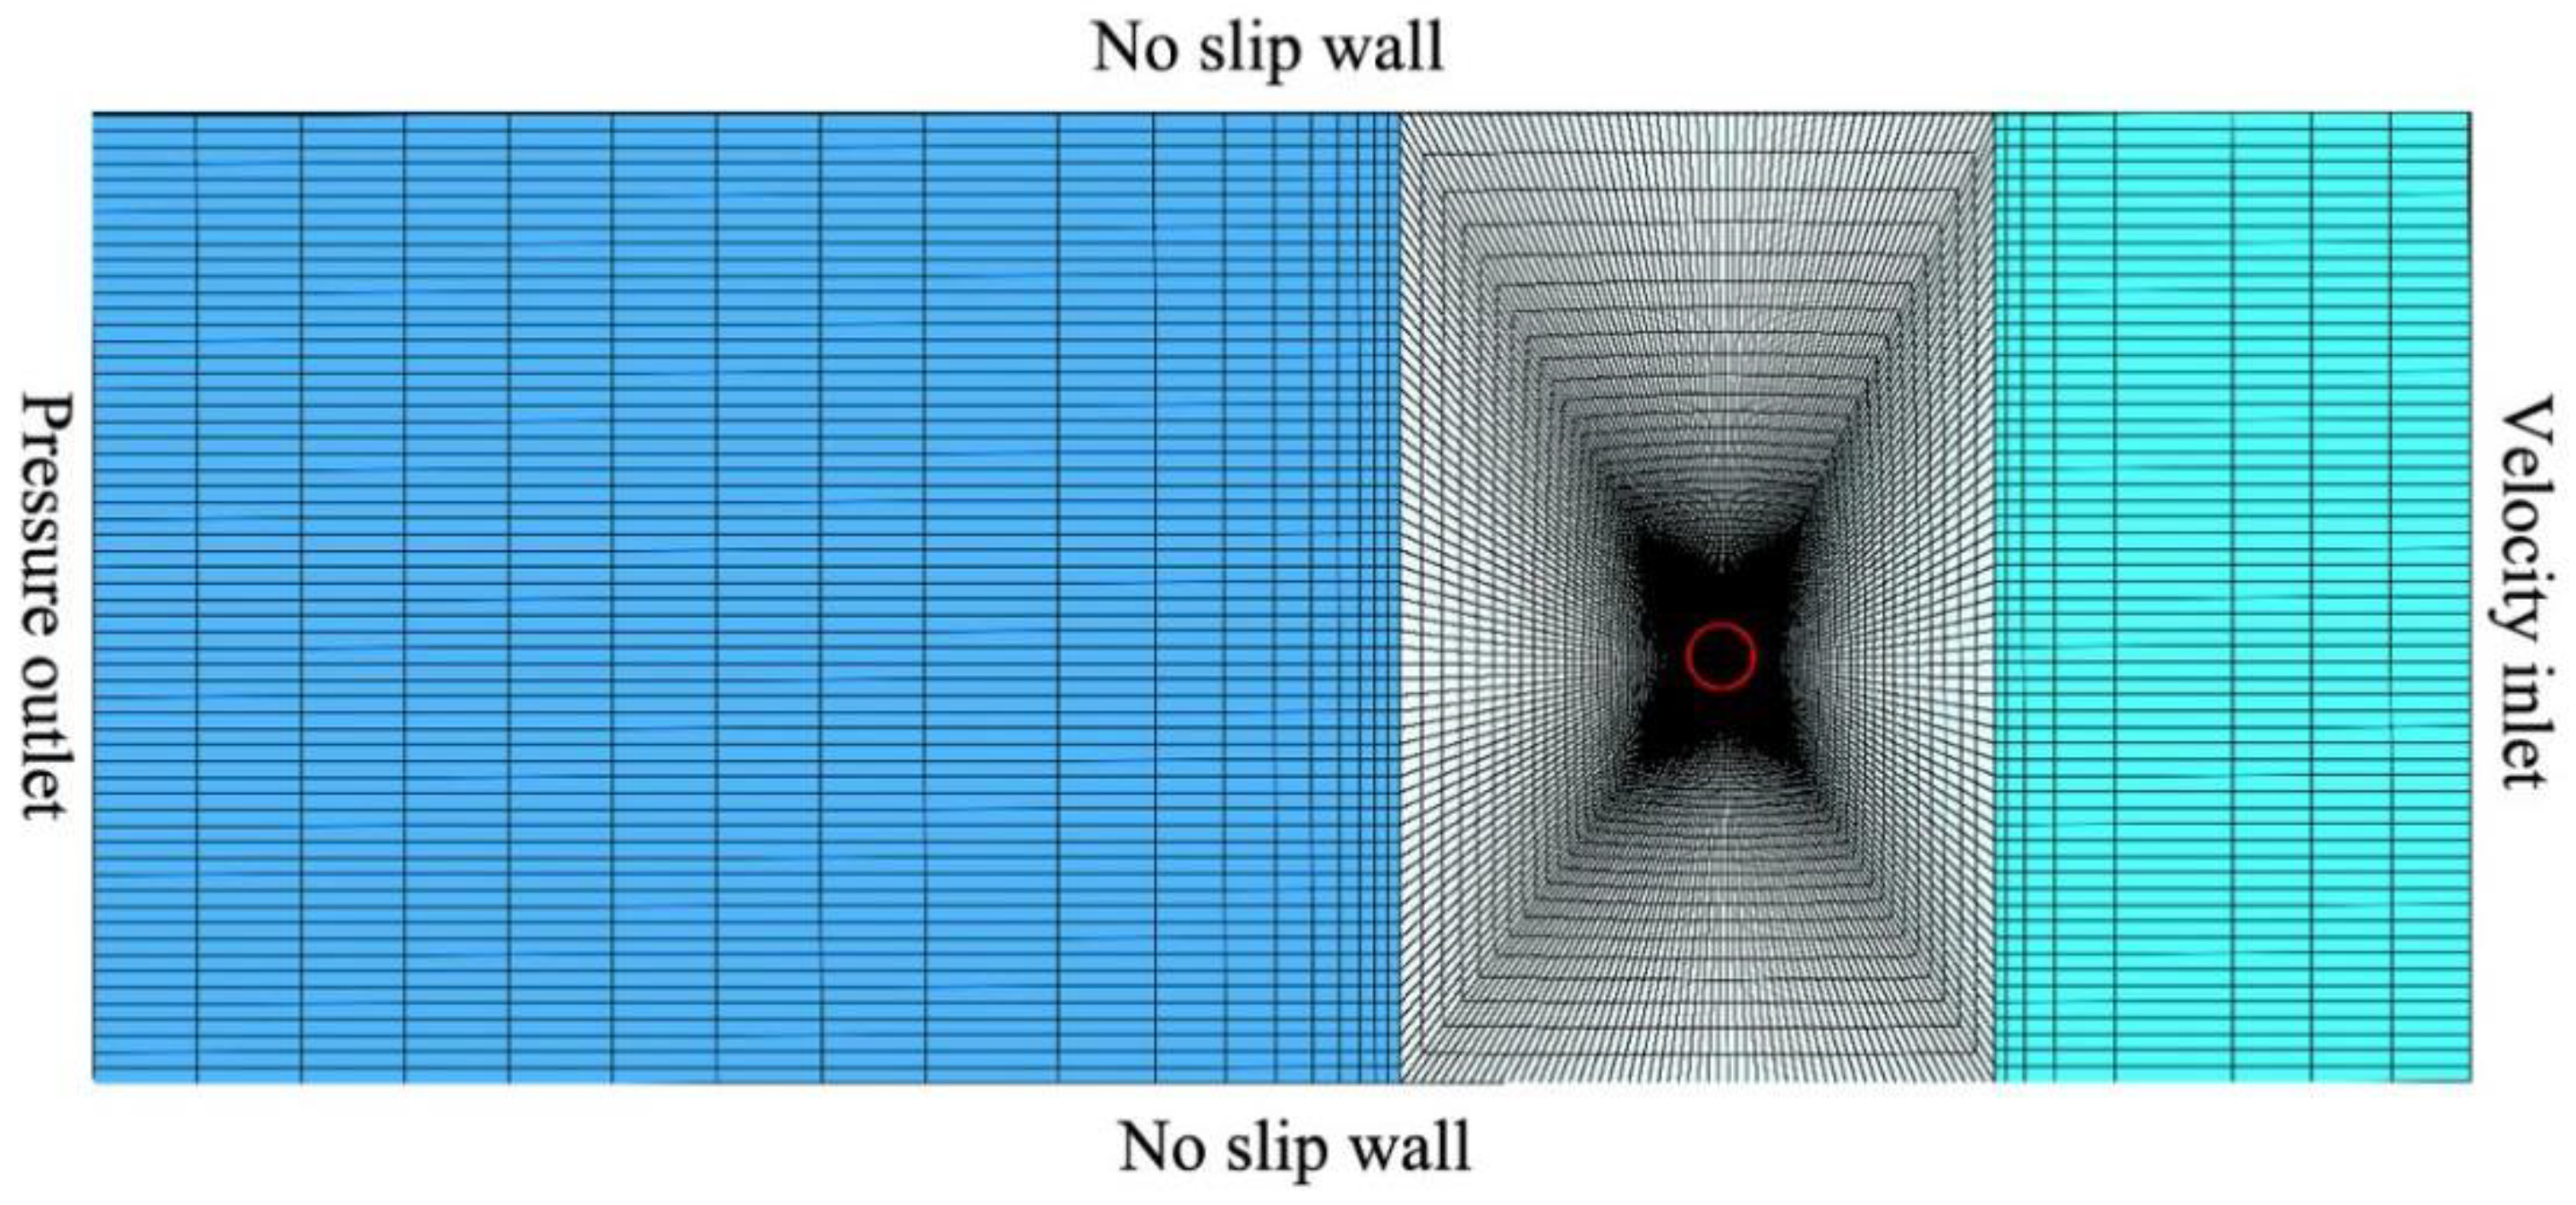
3. Computational Domain and Meshing Strategy

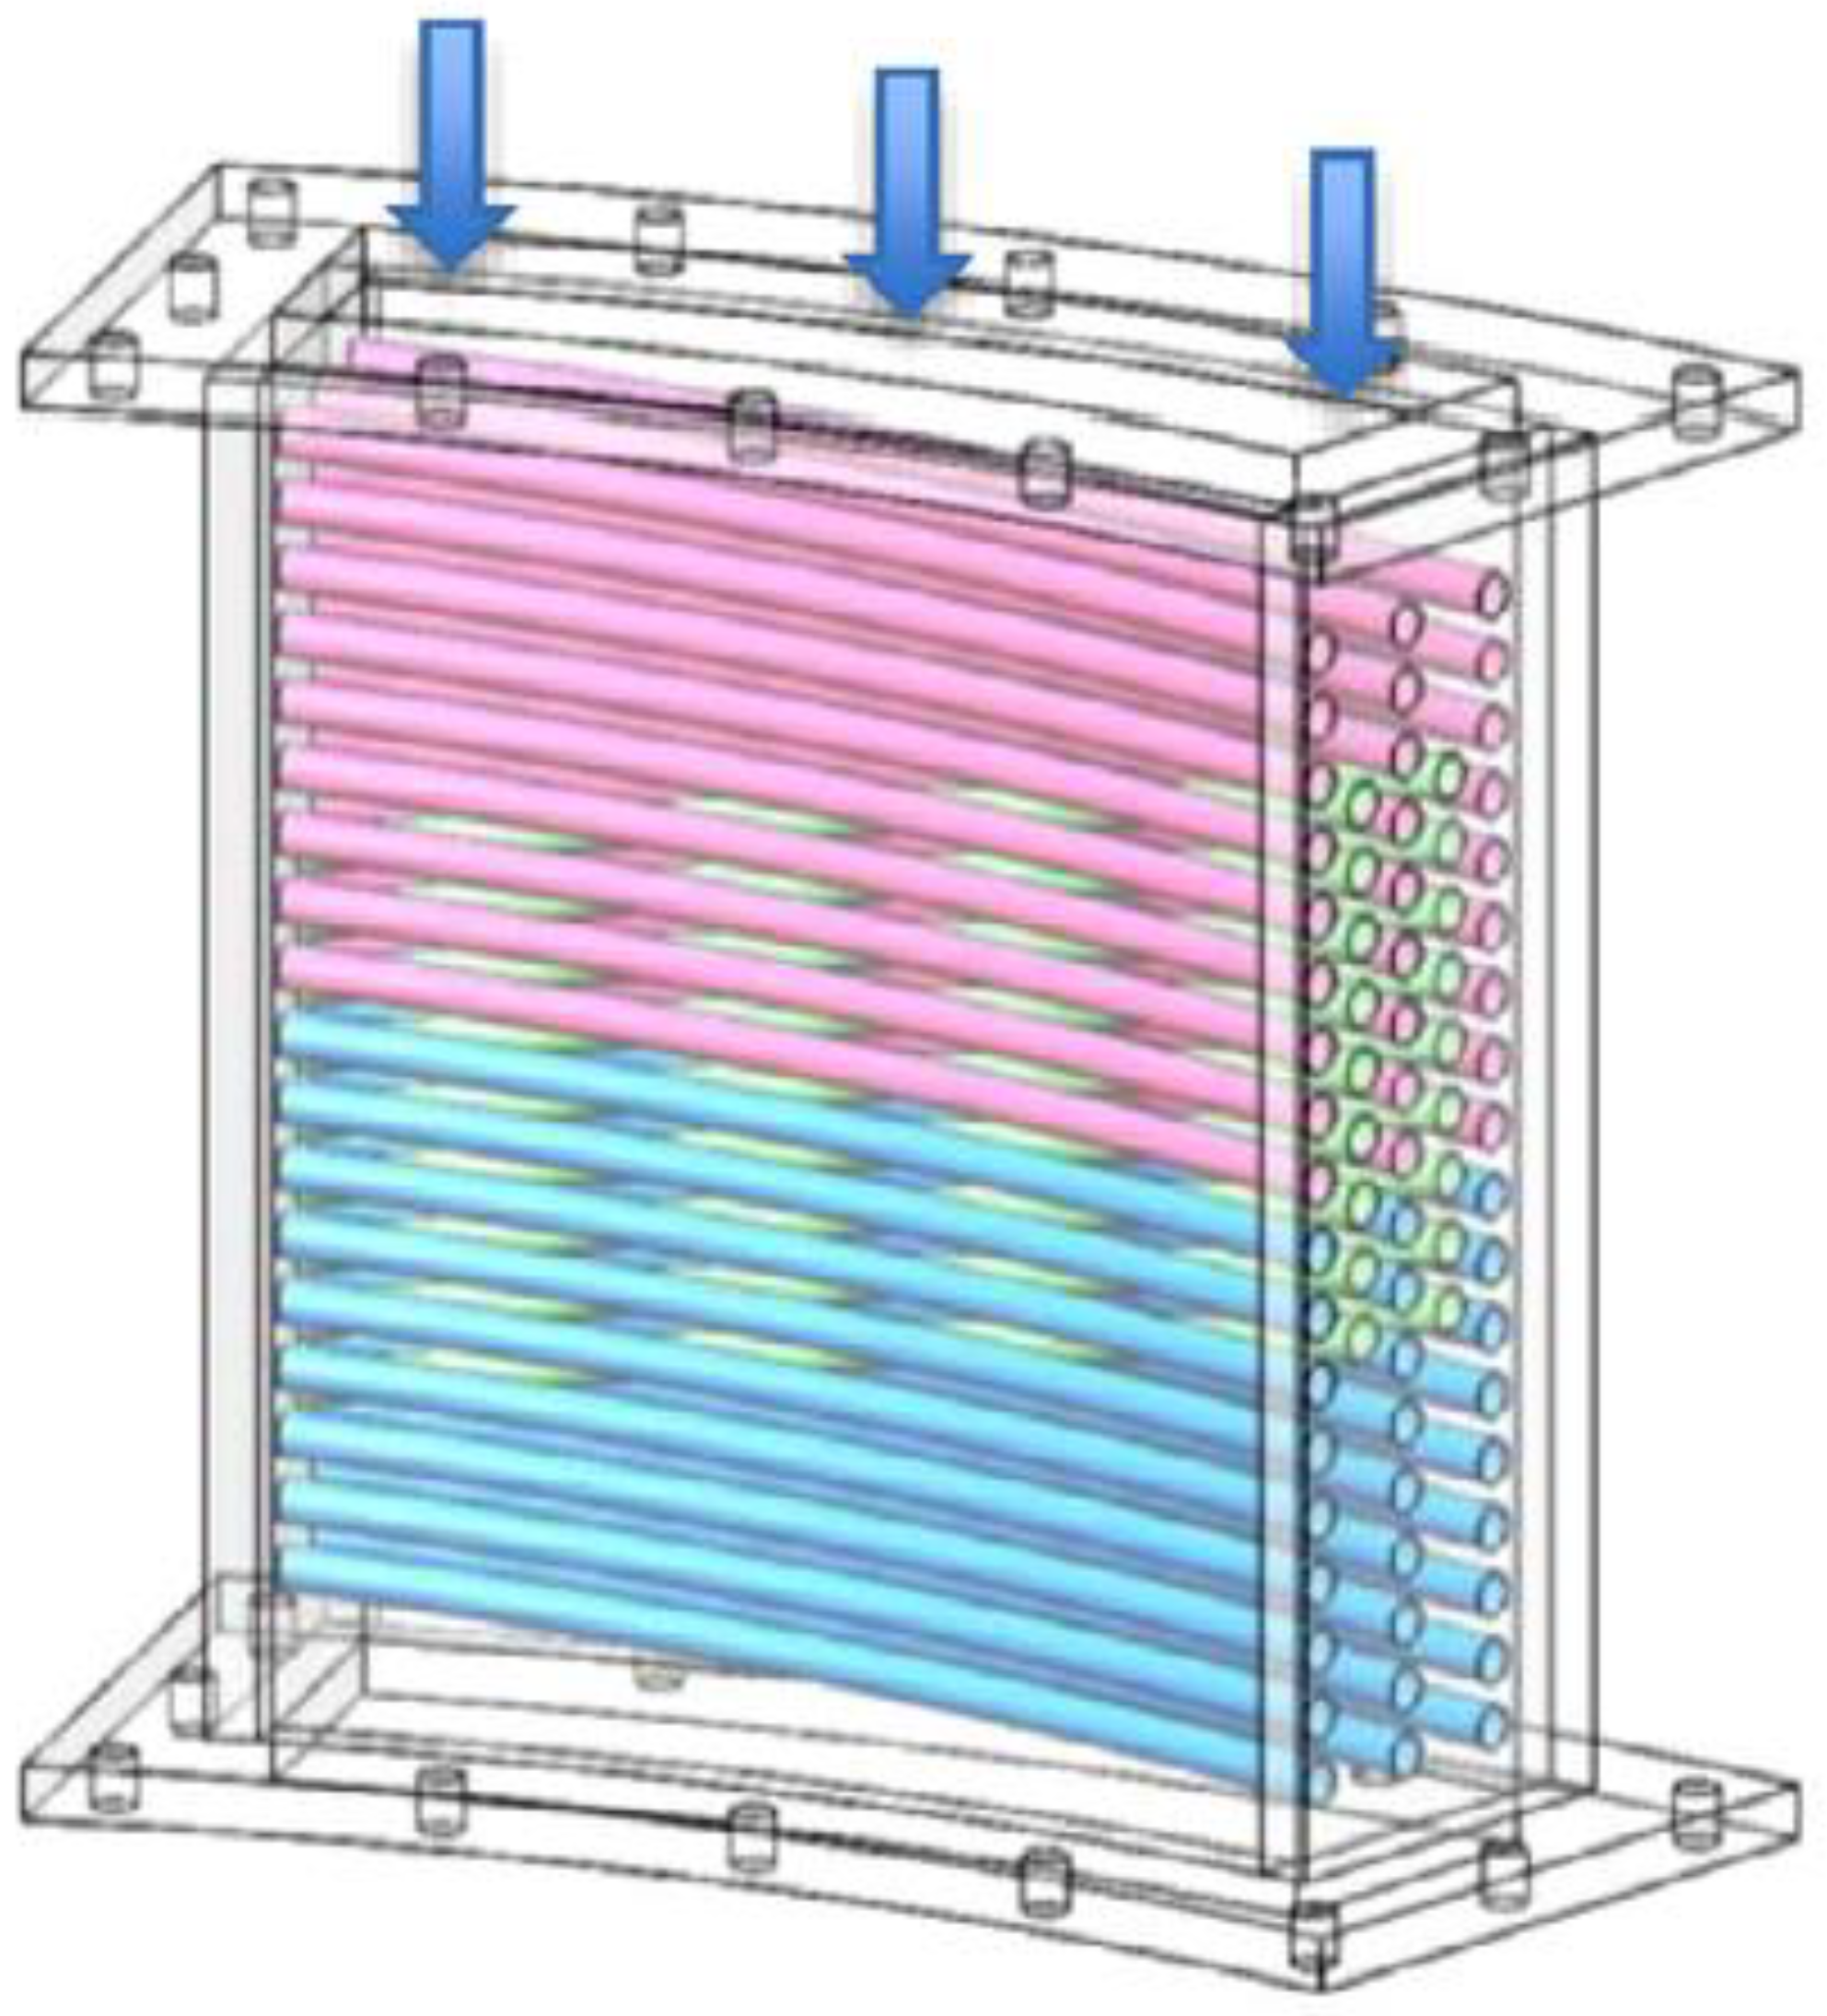
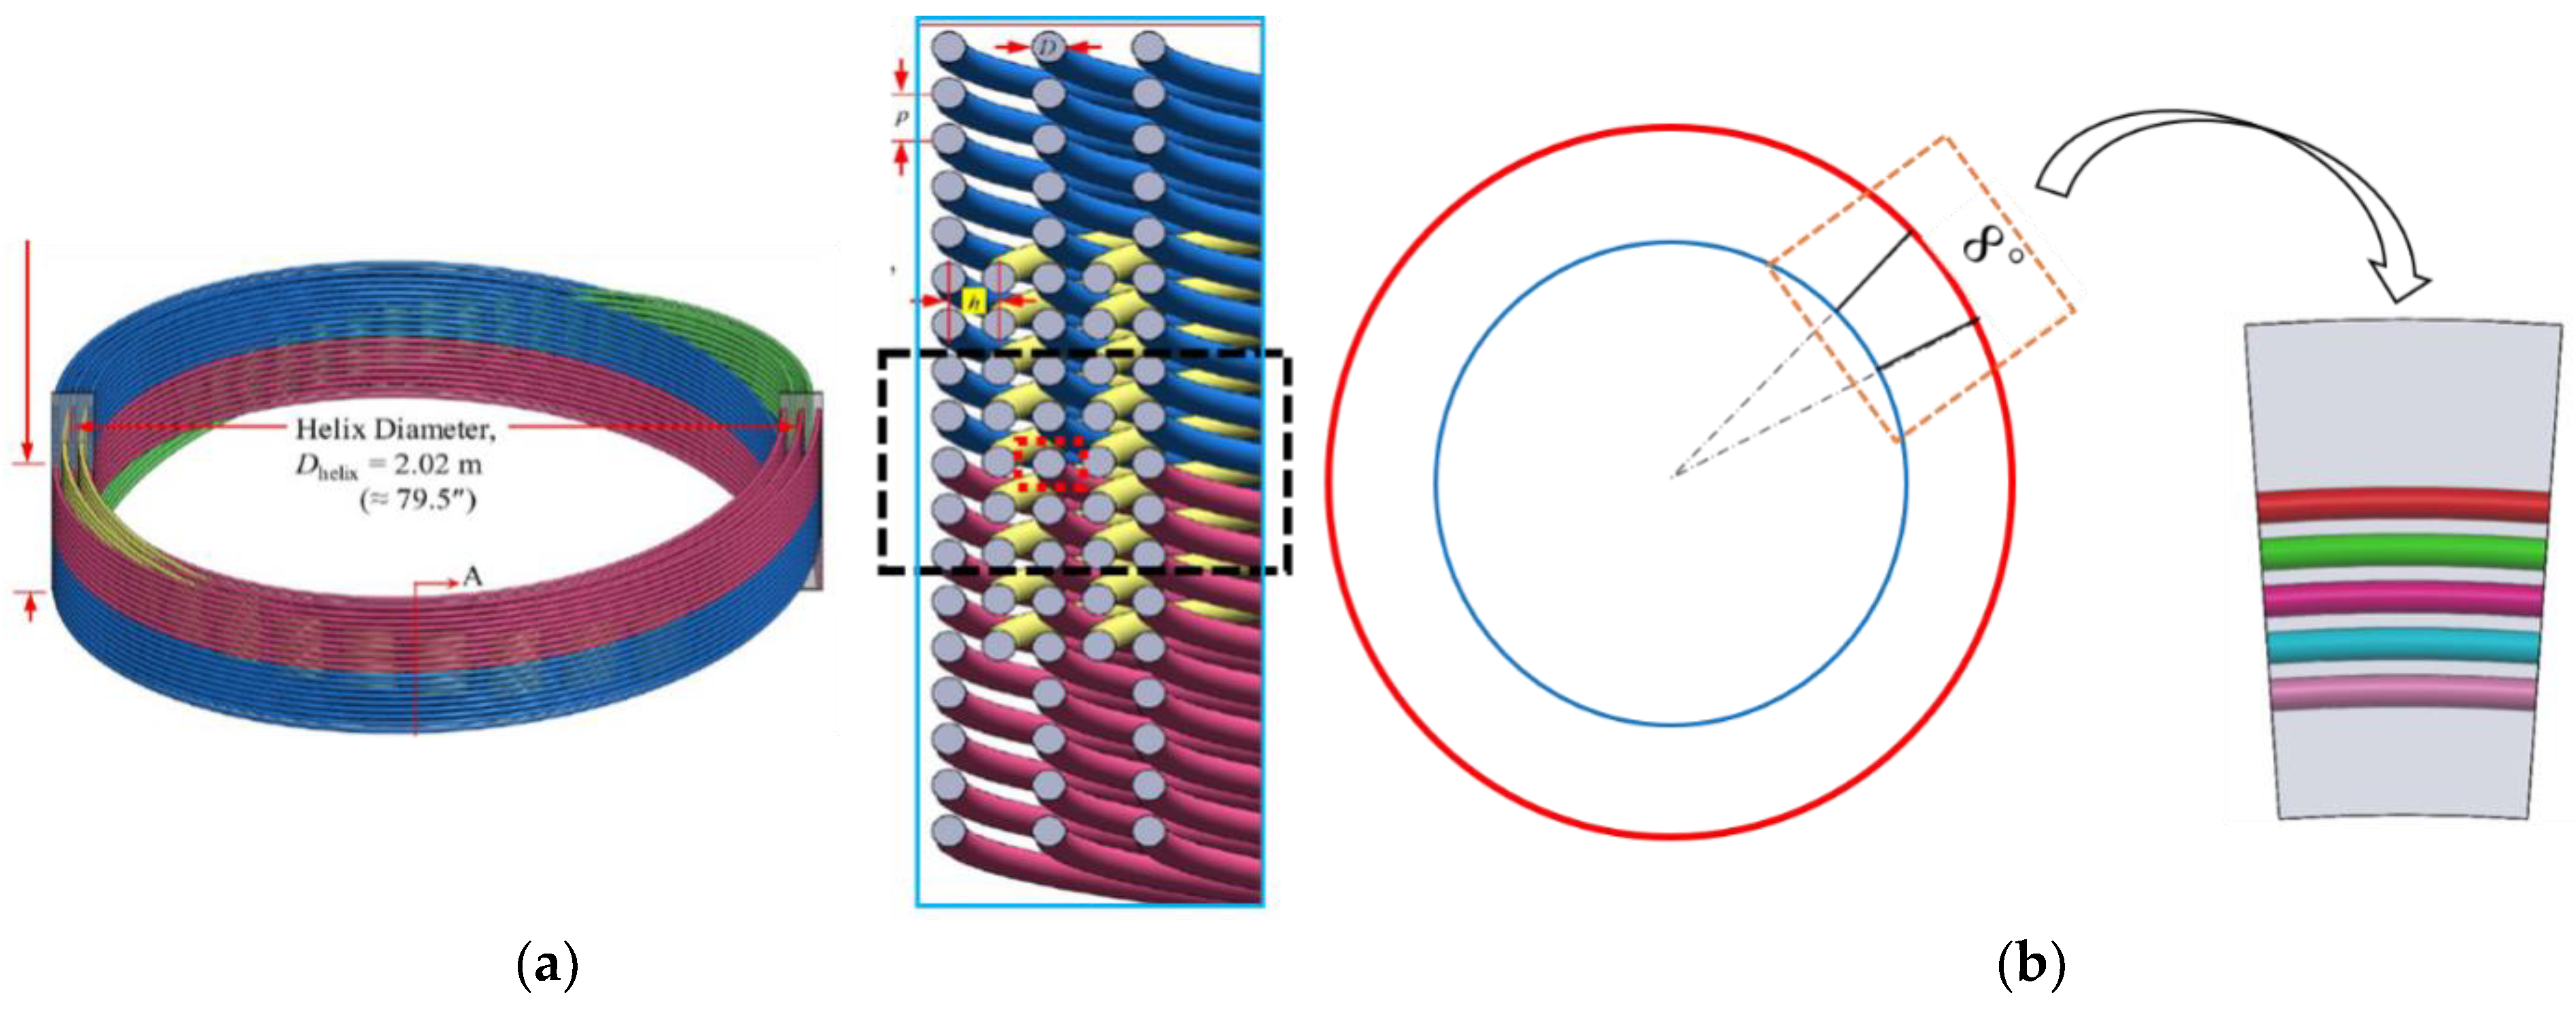
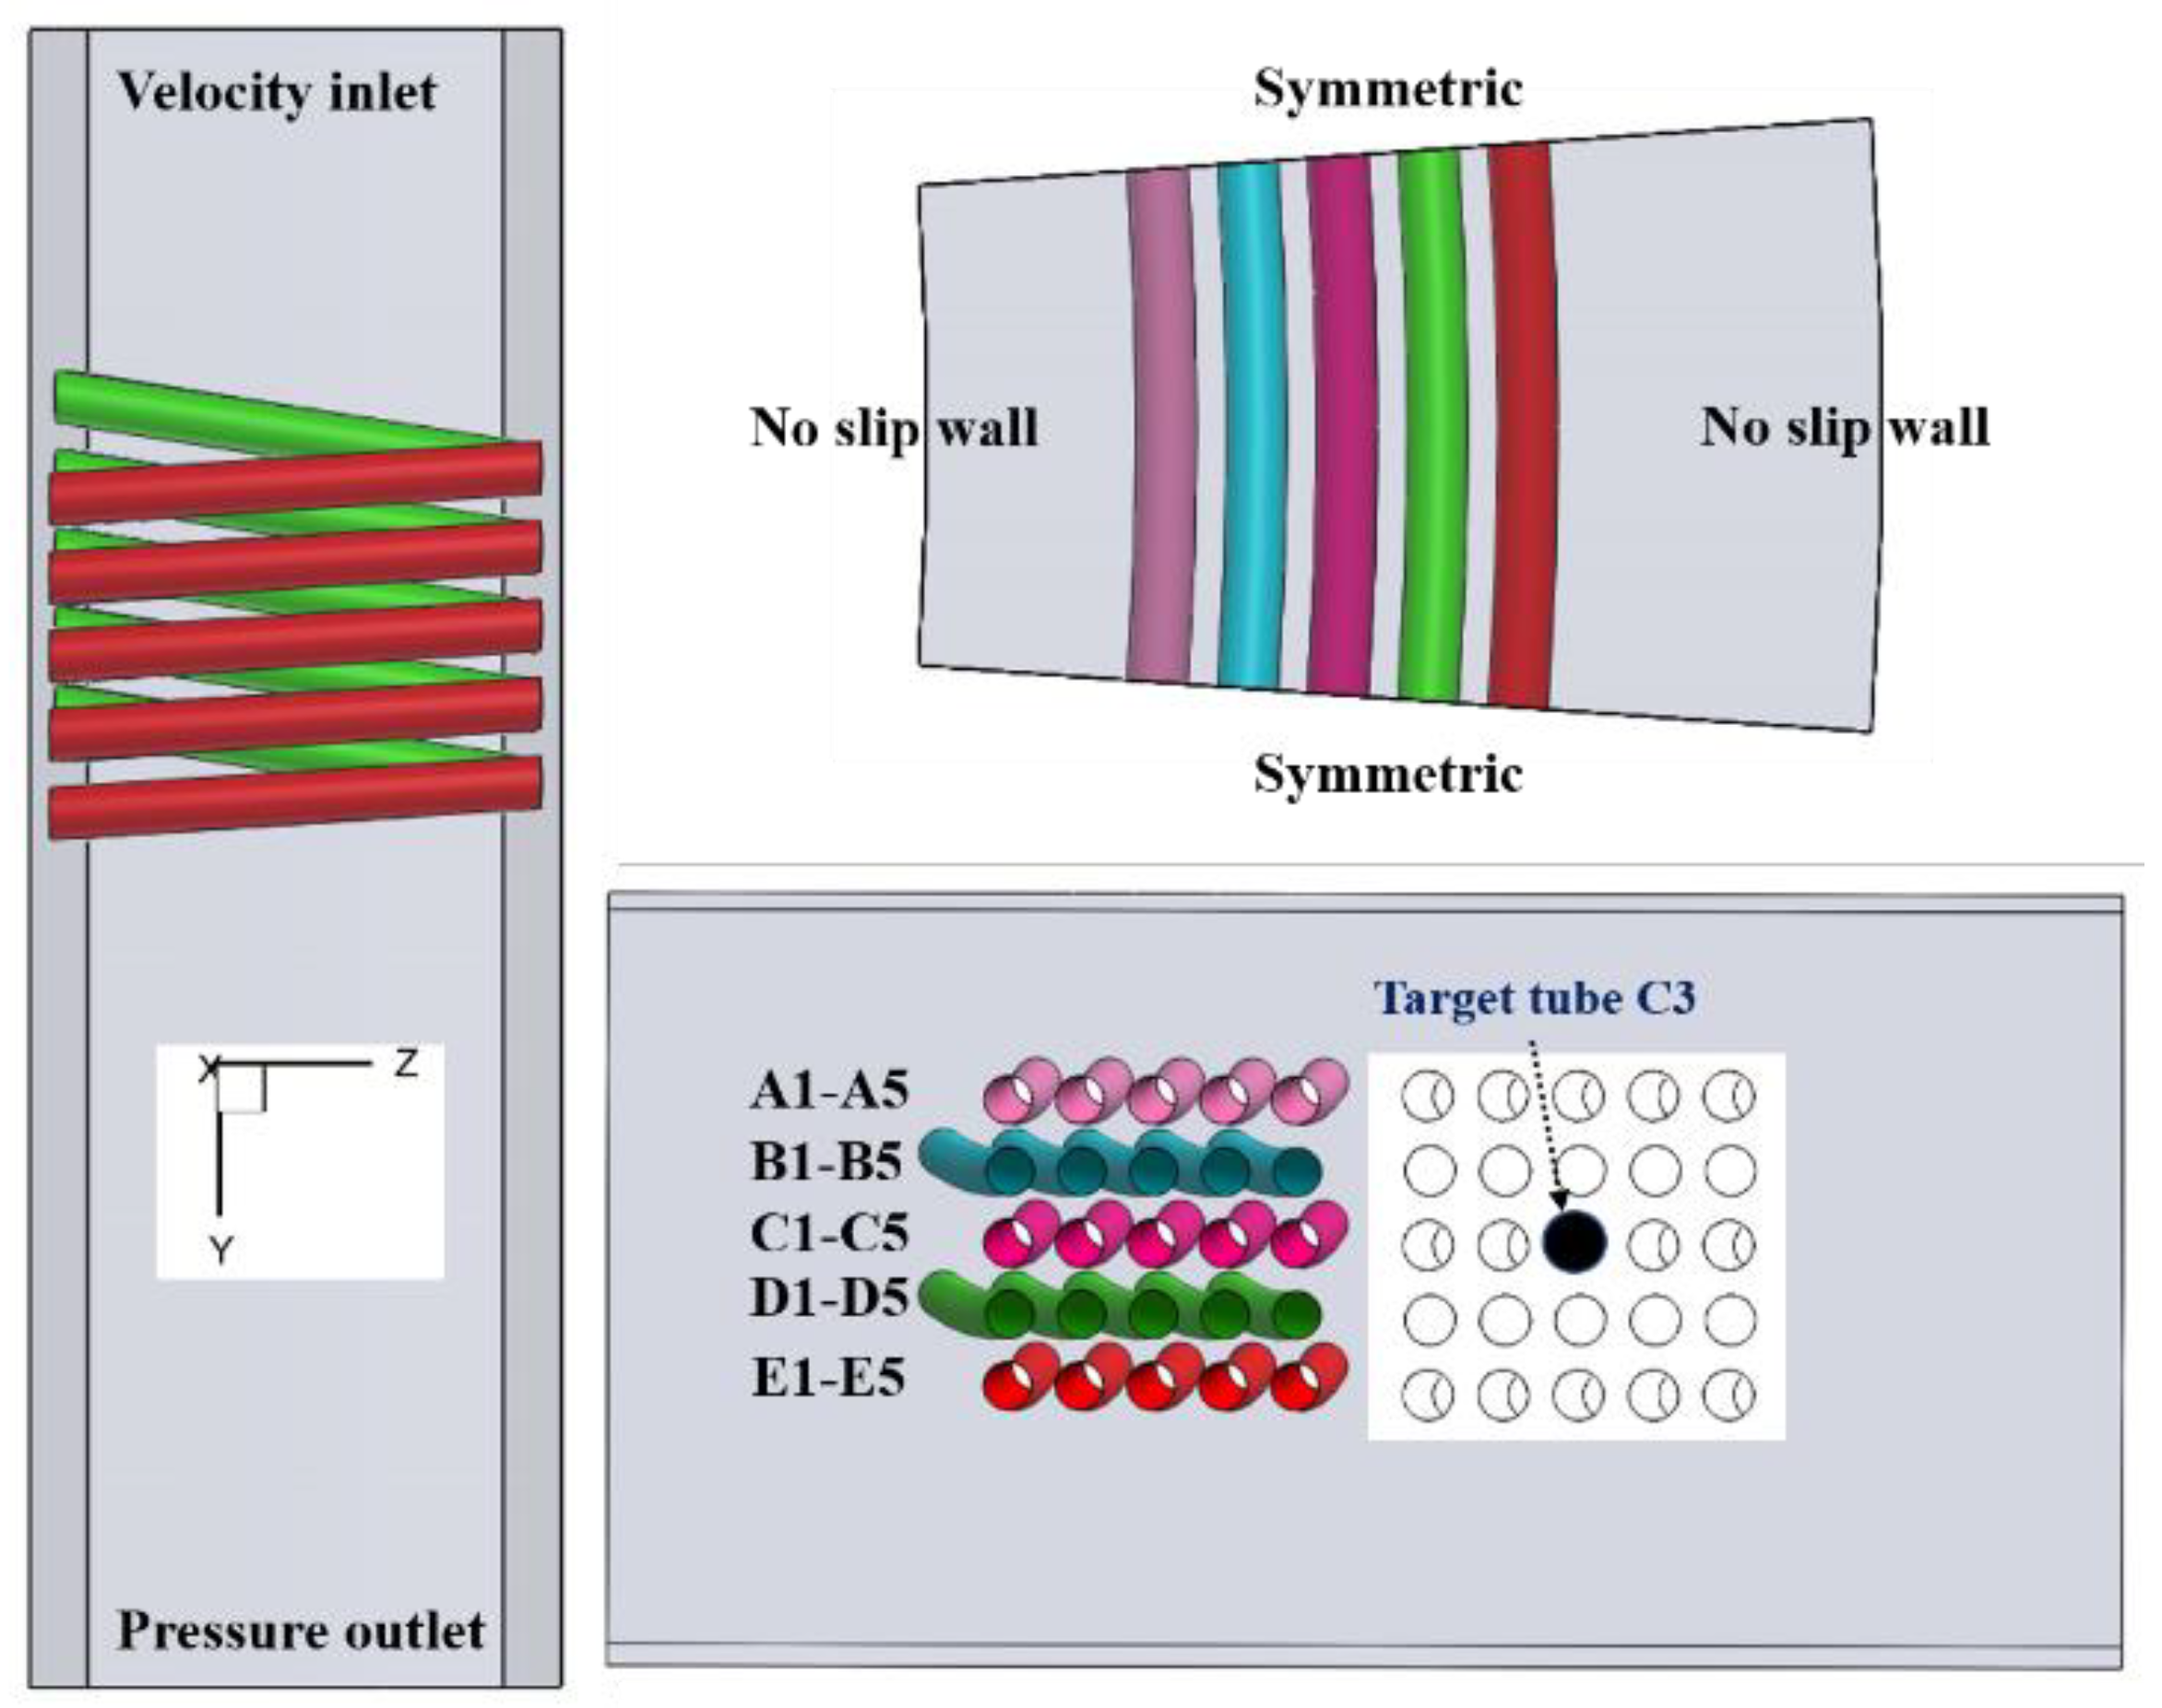
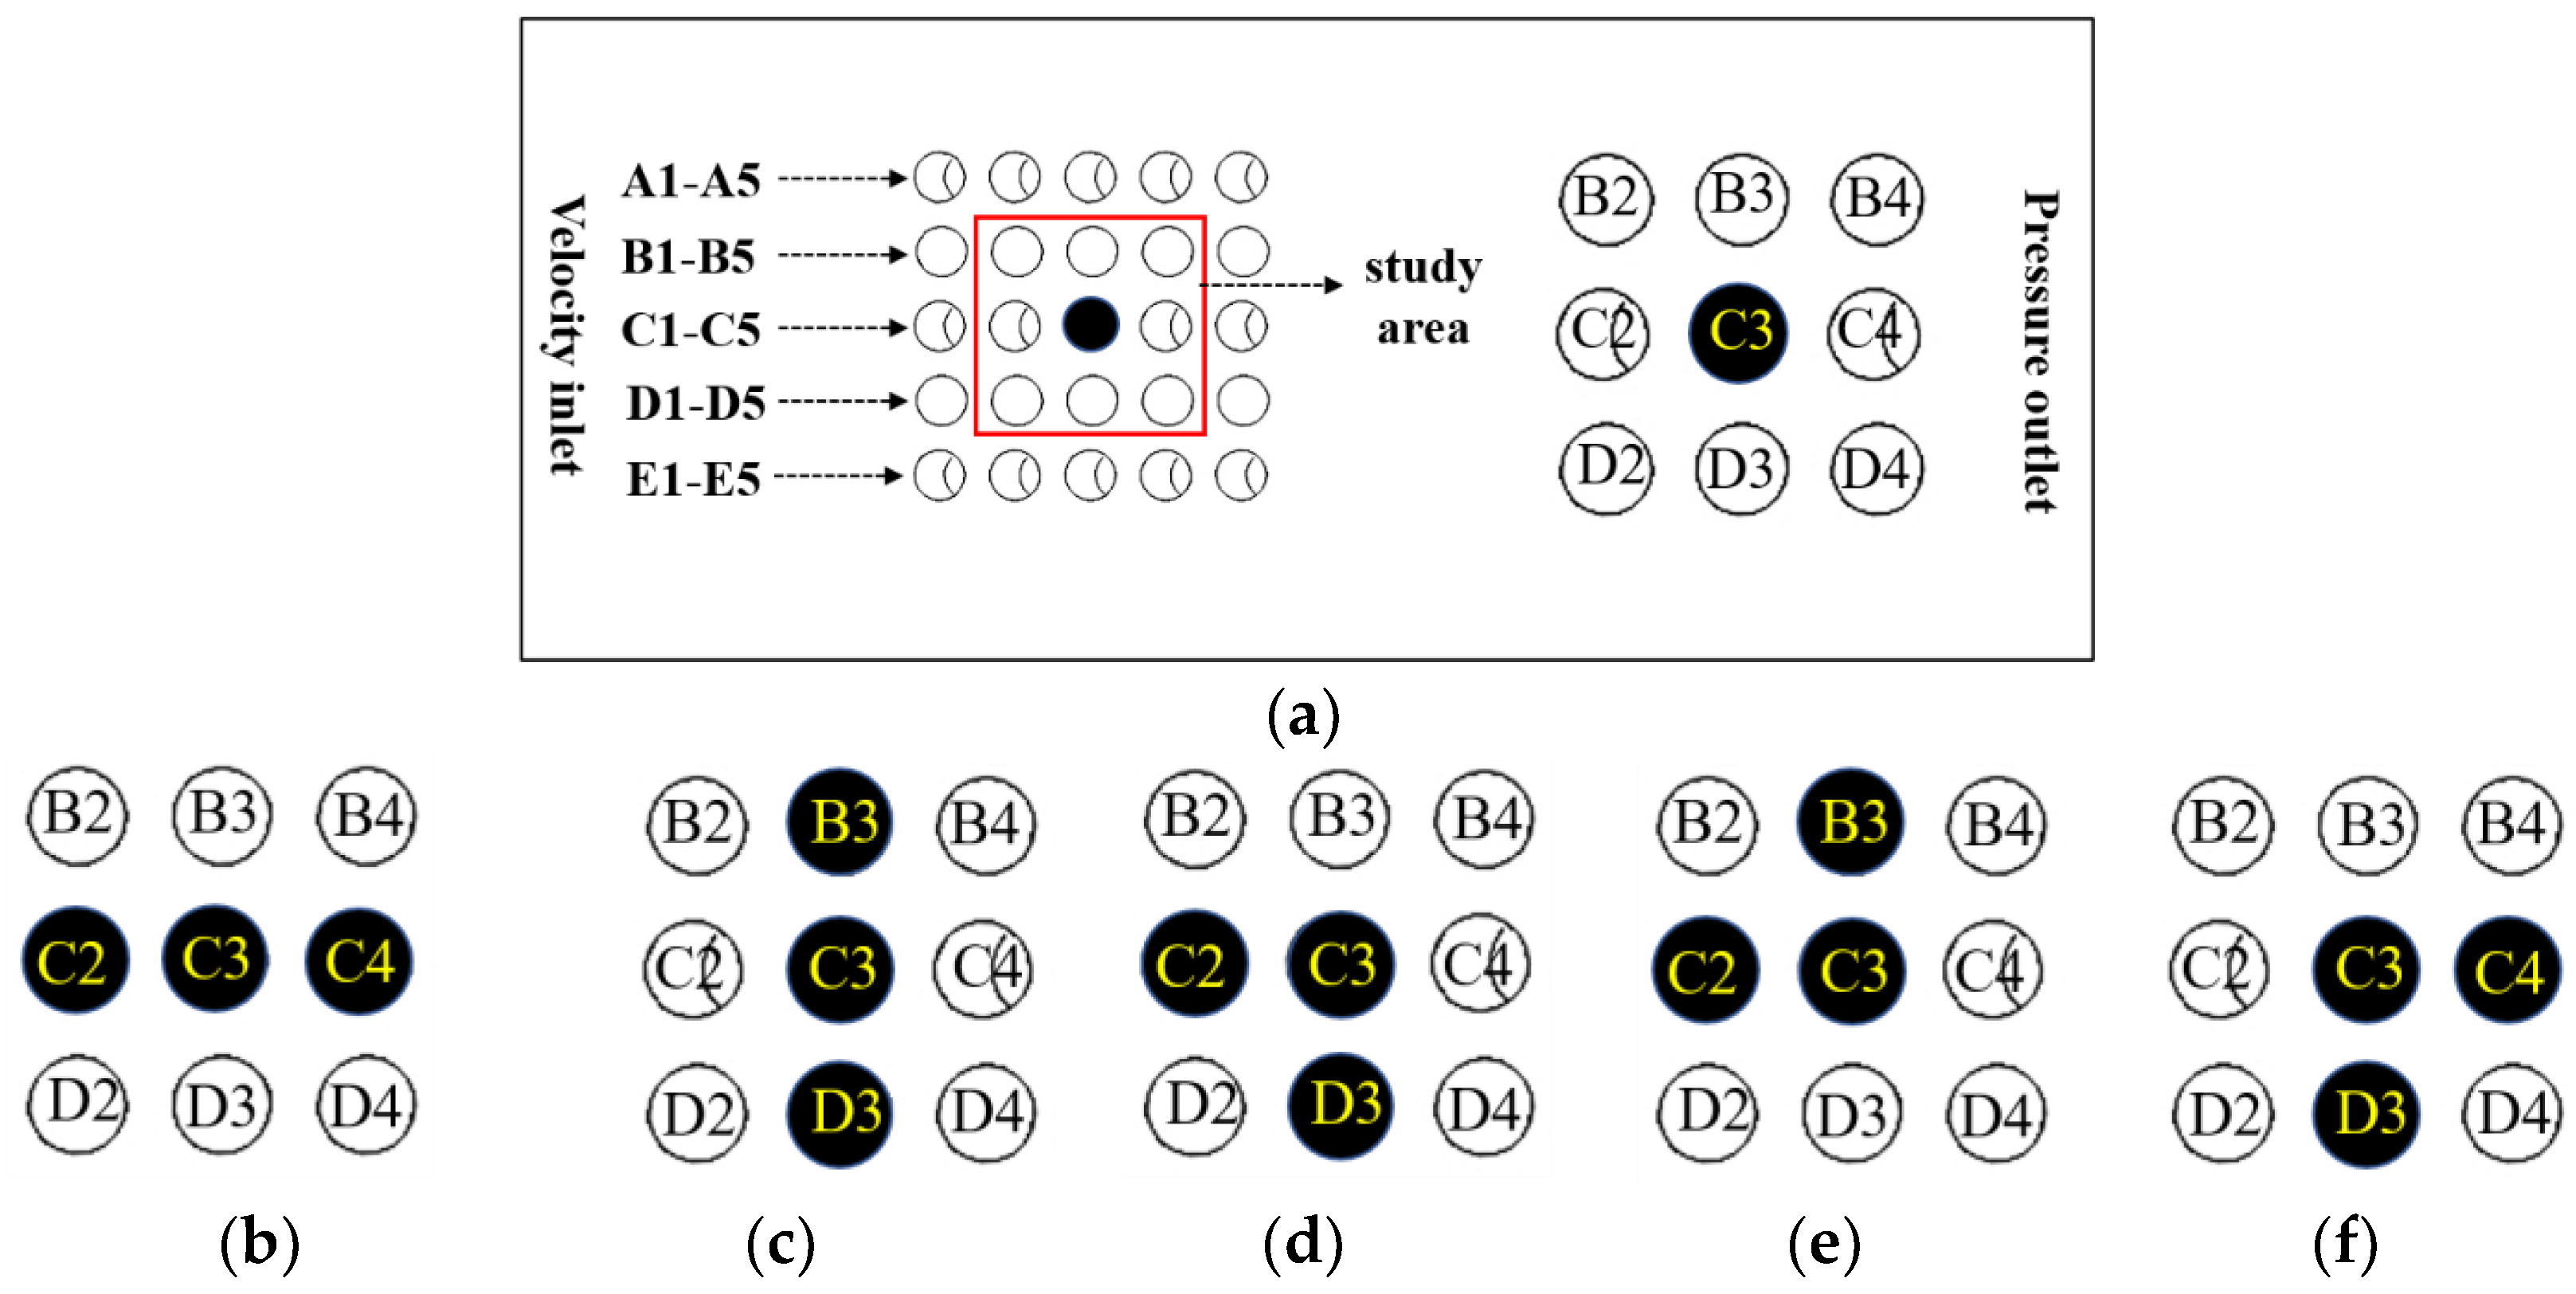
3.1. Physical Modeling

In this paper, the calculation is principally based on the five-layer helical tube array structure designed by Lee et al. [10], which is shown in Figure 3a. Taking into account the calculation efficiency and accuracy, an appropriate sector area is intercepted along the circumference of the helical tube, as shown in Figure 3b. This design mainly includes three anti-clockwise helical tube layers and two clockwise helical tube layers, which are arranged alternately in the radial direction. The pitch of the counterclockwise helical tube layer is 426.6 mm, and the pitch of the clockwise helical tube layer is 995.3 mm. The distance between the layers is 23.62 mm, and the diameter of the middle helical layer is 2020 mm.
Due to the similarity of shell side flow in a heat exchanger, to reduce the calculation cost, the shell side flow region is simplified and limited to a small region. Duan et al. [23] used five rows of tubes to simulate the flow distribution of three-dimensional helical tube arrays. Tang et al. [24] studied a series of tube arrays contrasting the experimental data with the calculated results, and found that an acceptable level of consistency can be achieved when there are three or more rows of tubes in the transverse direction. Based on the above analysis, the tube arrays studied in this paper are selected as 5 × 5 tube arrays in the black box in Figure 3a. The C3 tube in the red frame is set as the target vibration tube, and the rest are set as the adjacent tubes. The calculation model is determined as shown in Figure 4.
It is essential to accurately predict the near-wall flow behavior to find a solution to the turbulent mixing phenomenon. This paper adopted the ‘two-layer’ wall y+ treatment approach for all helical tube vibration simulations. The ‘two-layer’ wall treatment is a hybrid treatment that approximates the low-y+ wall treatment for fine meshes (wall boundary y+ ~ 1), and the high-y+ wall treatment for coarse meshes (wall boundary y+ > 20).
As shown in Figure 5a, the helical tube bundle region, the top region above the helical tubes, and the bottom region below the helical tubes comprised the three regions of the simulation domain. The closer the distance to the helical tube region, the denser the top and the bottom region grids are. A coarse and gradient grid structure mesh resolution was used because the flow behavior in the top and bottom regions is less complex and has little effect on the flow fluctuation in the steam generator regions.
For the helical tube bundle region, through the pointwise y+ calculator, the thickness of the first boundary layer of the tube wall was calculated. Then, the boundary layer expanded along the helical angle to yield hexahedra at a growth rate of 1.1. Finally, the outermost boundary layers of all helical tubes were connected with each other, and the 2D unstructured grid was generated and swept along the helical angle to yield hexahedra. So far, all volume grids were generated. The overall grid model and grid near C3 tube was determined as shown in Figure 5.
The working medium is water with a density of 998.2 kg/m3, and the dynamic viscosity is 1.003 × 10⁻³ kg/m·s. The main boundary conditions and calculation settings of the tube array model and the single tube model are shown in Table 2. In addition, in order to accelerate the convergence of the iterative process, the SIMPLEC algorithm is used to solve the coupling of pressure and velocity, and the least squares cell-based method is used for gradient calculation. Due to the high vortex number between the tube arrays studied in this paper, Presto is used for pressure interpolation. The second-order upwind scheme is used to discretize the momentum equation, turbulent kinetic energy, and turbulent dissipation rate. The sub relaxation factor of all variables is set as the default value. In order to improve the calculation accuracy, the convergence standard of the residual value of each variable is set to 10−6.

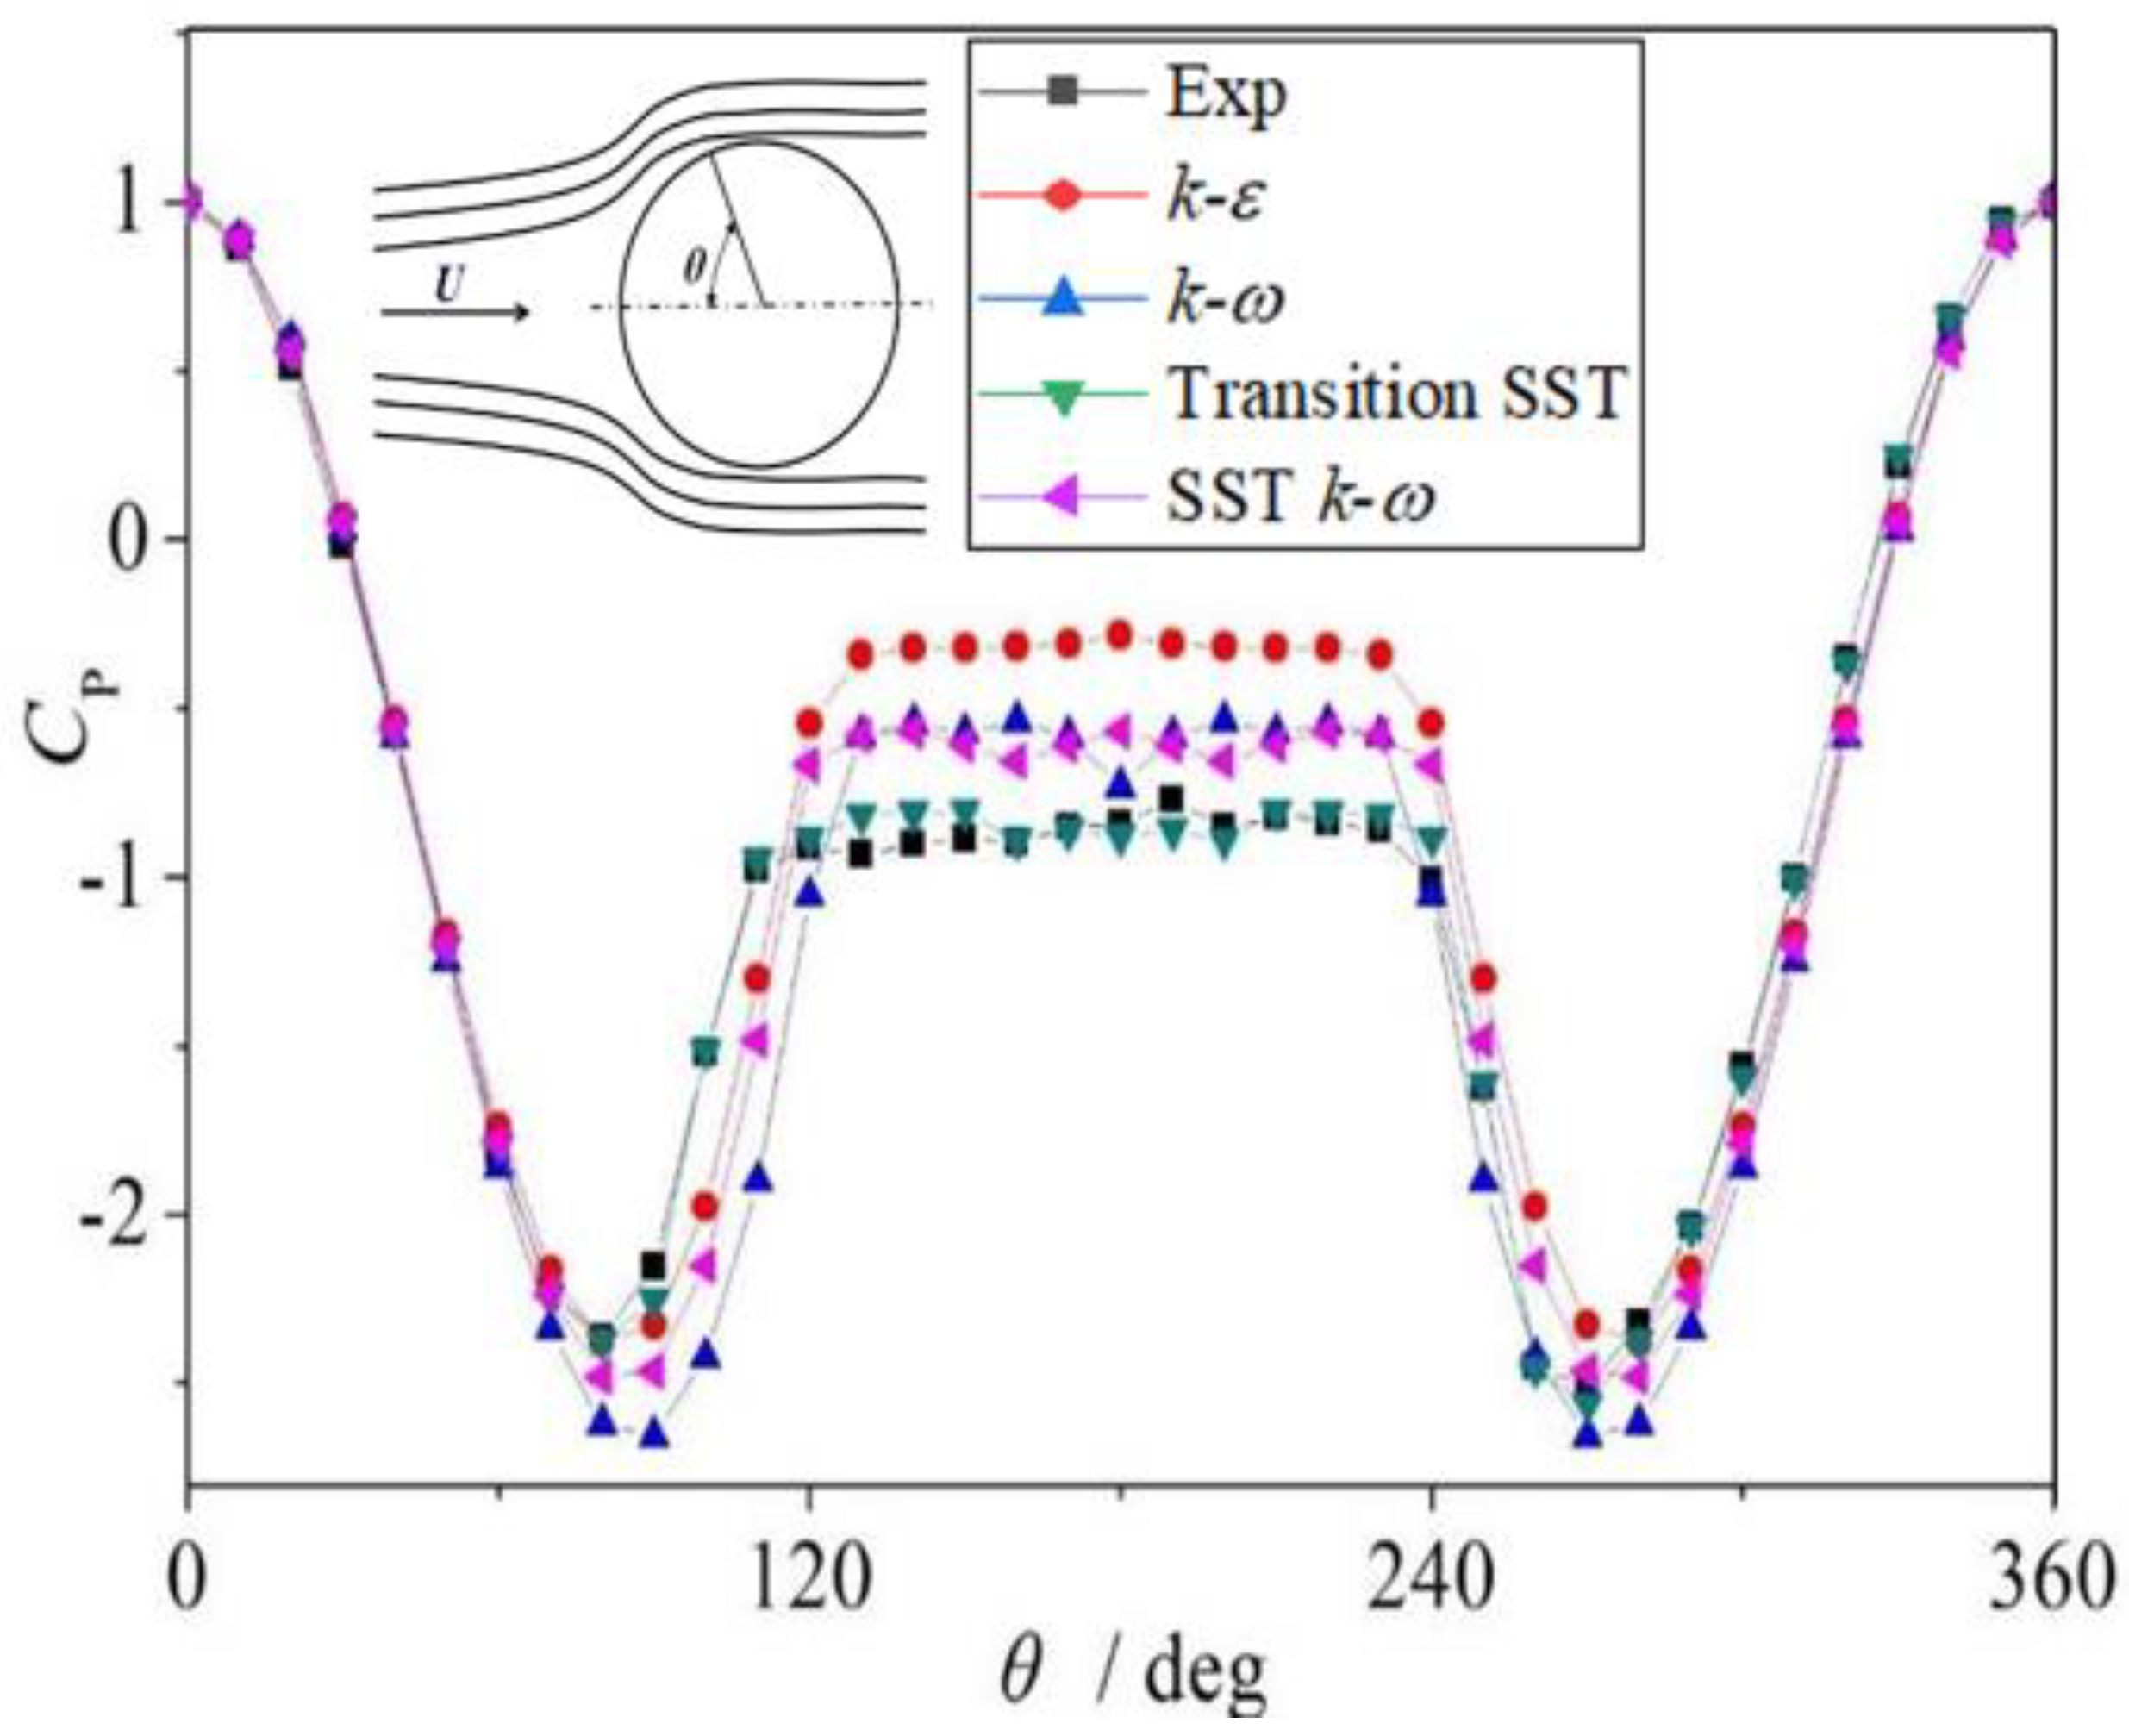
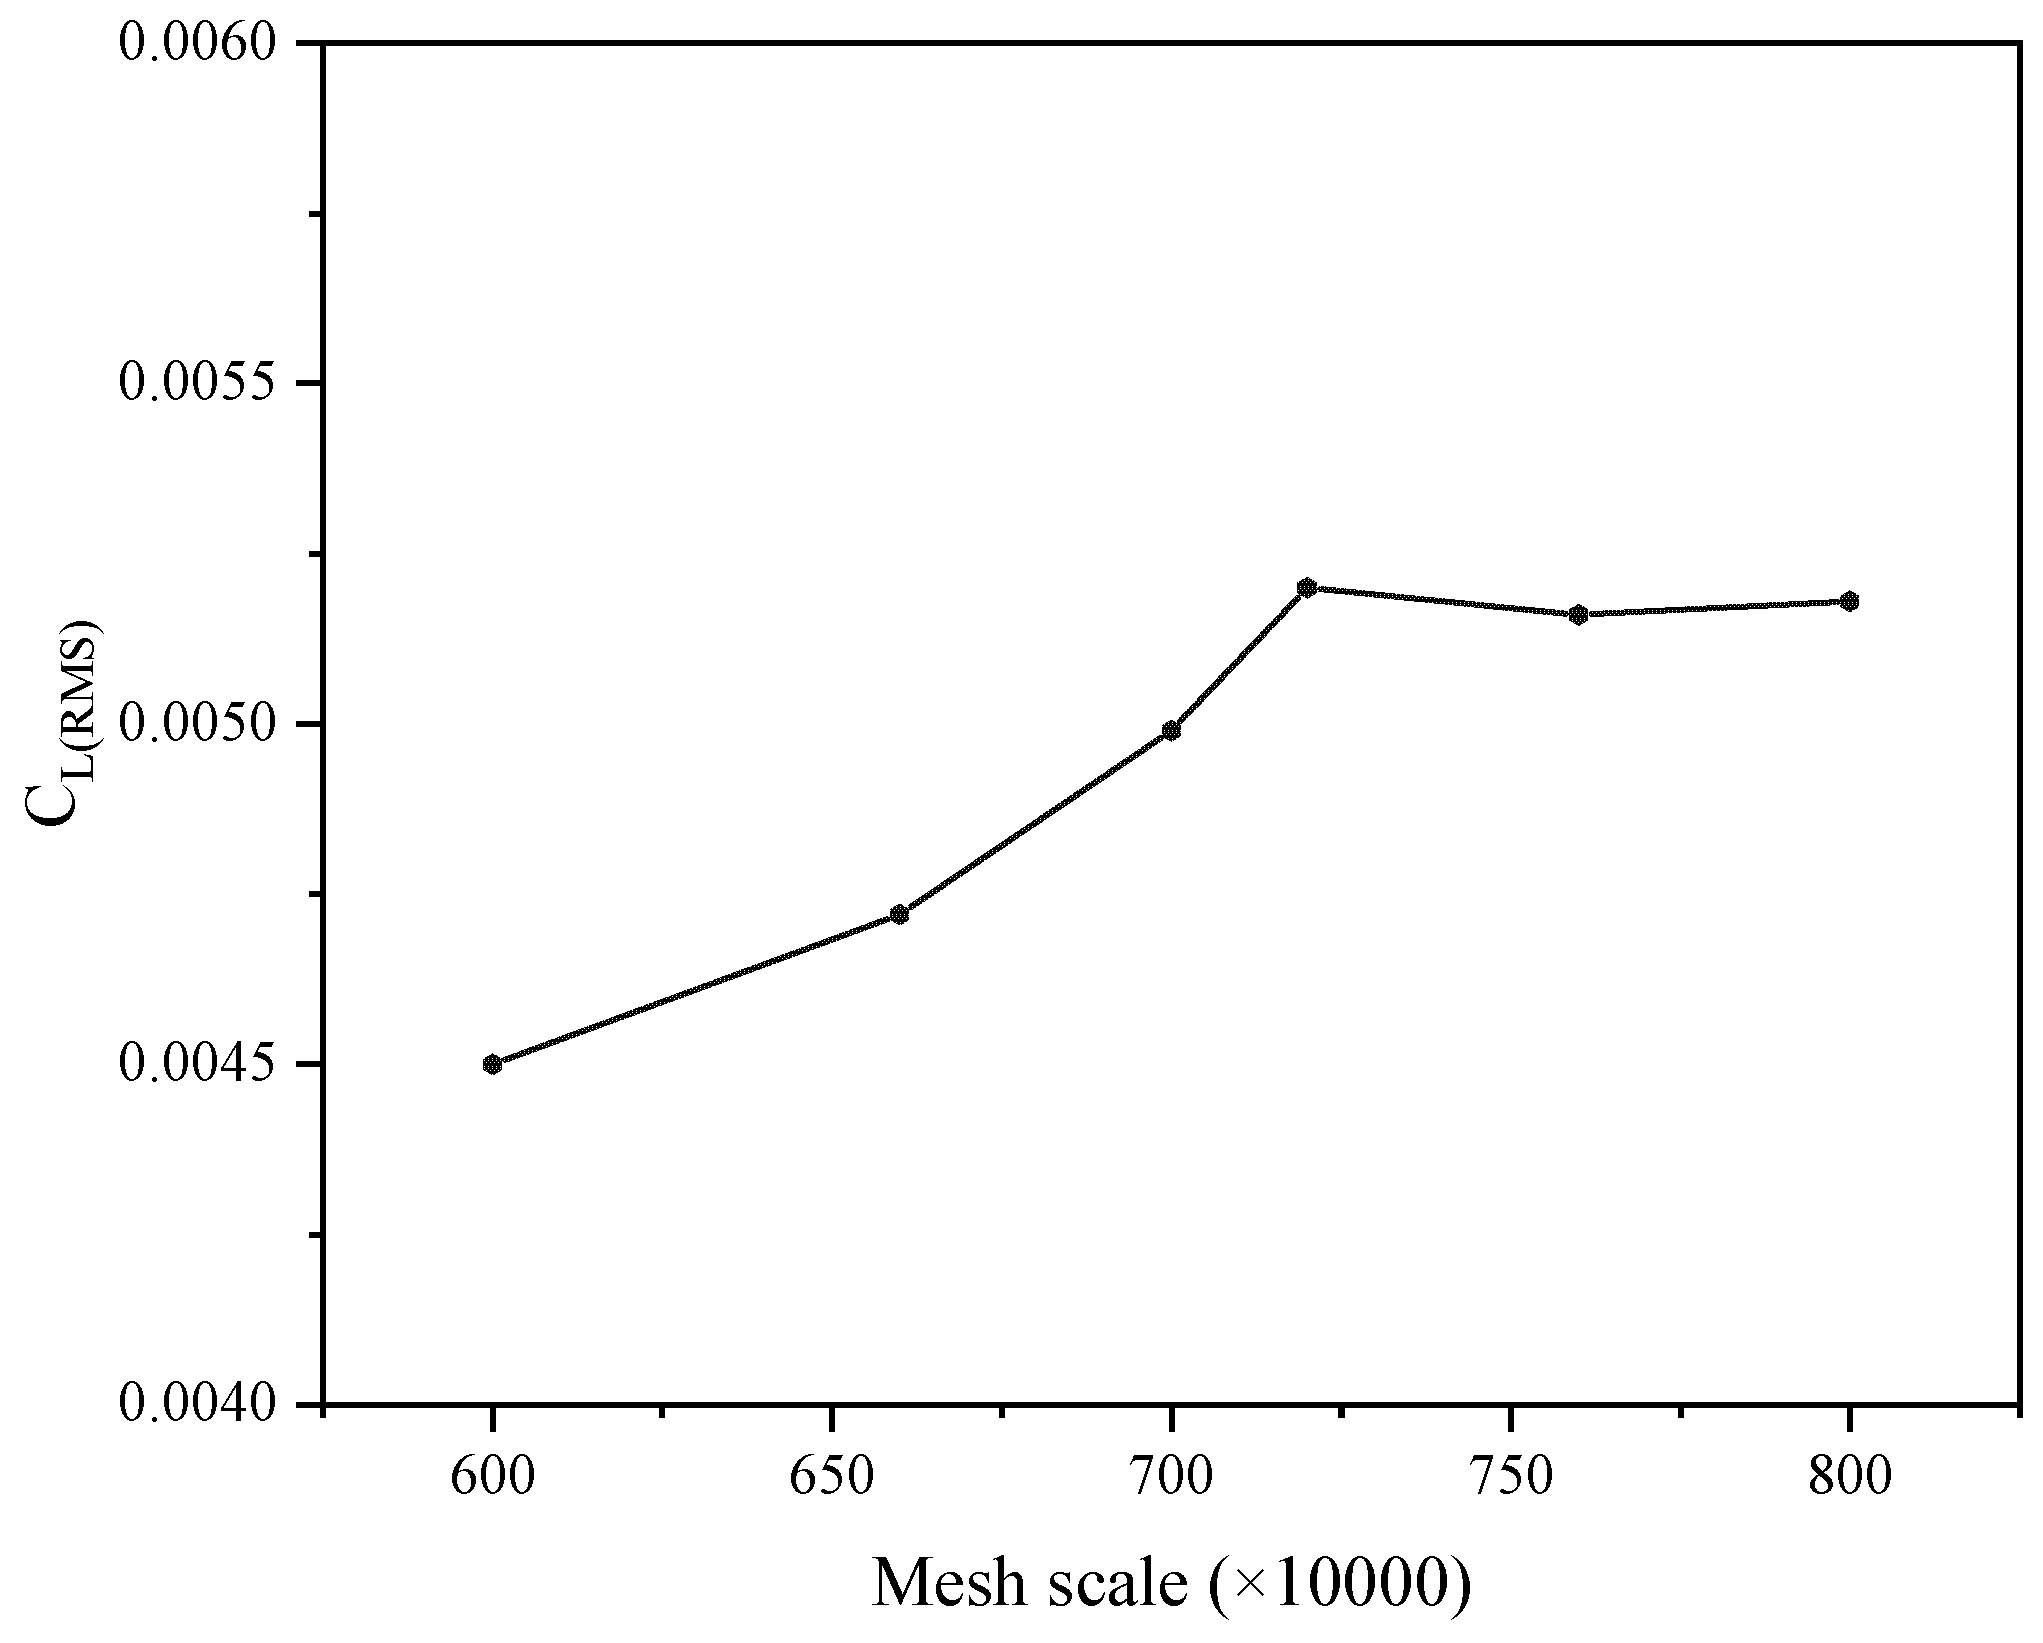
3.2. Grid Independence Test Analysis

The calculated grids were divided into 600, 660, 700, 720, 760, and 8 million grid numbers. The root mean square of the lift coefficient of the spiral tube C3 was used to characterize the influence of the mesh number on the calculation results, and the obtained verification results are shown in Figure 6. When the number of grid cells exceeds 7.2 million, the degree of network density has little influence on the calculation results. Considering the cost and accuracy of the calculation, 7.2 million grids are selected for the calculation model.

4. Results and Discussion

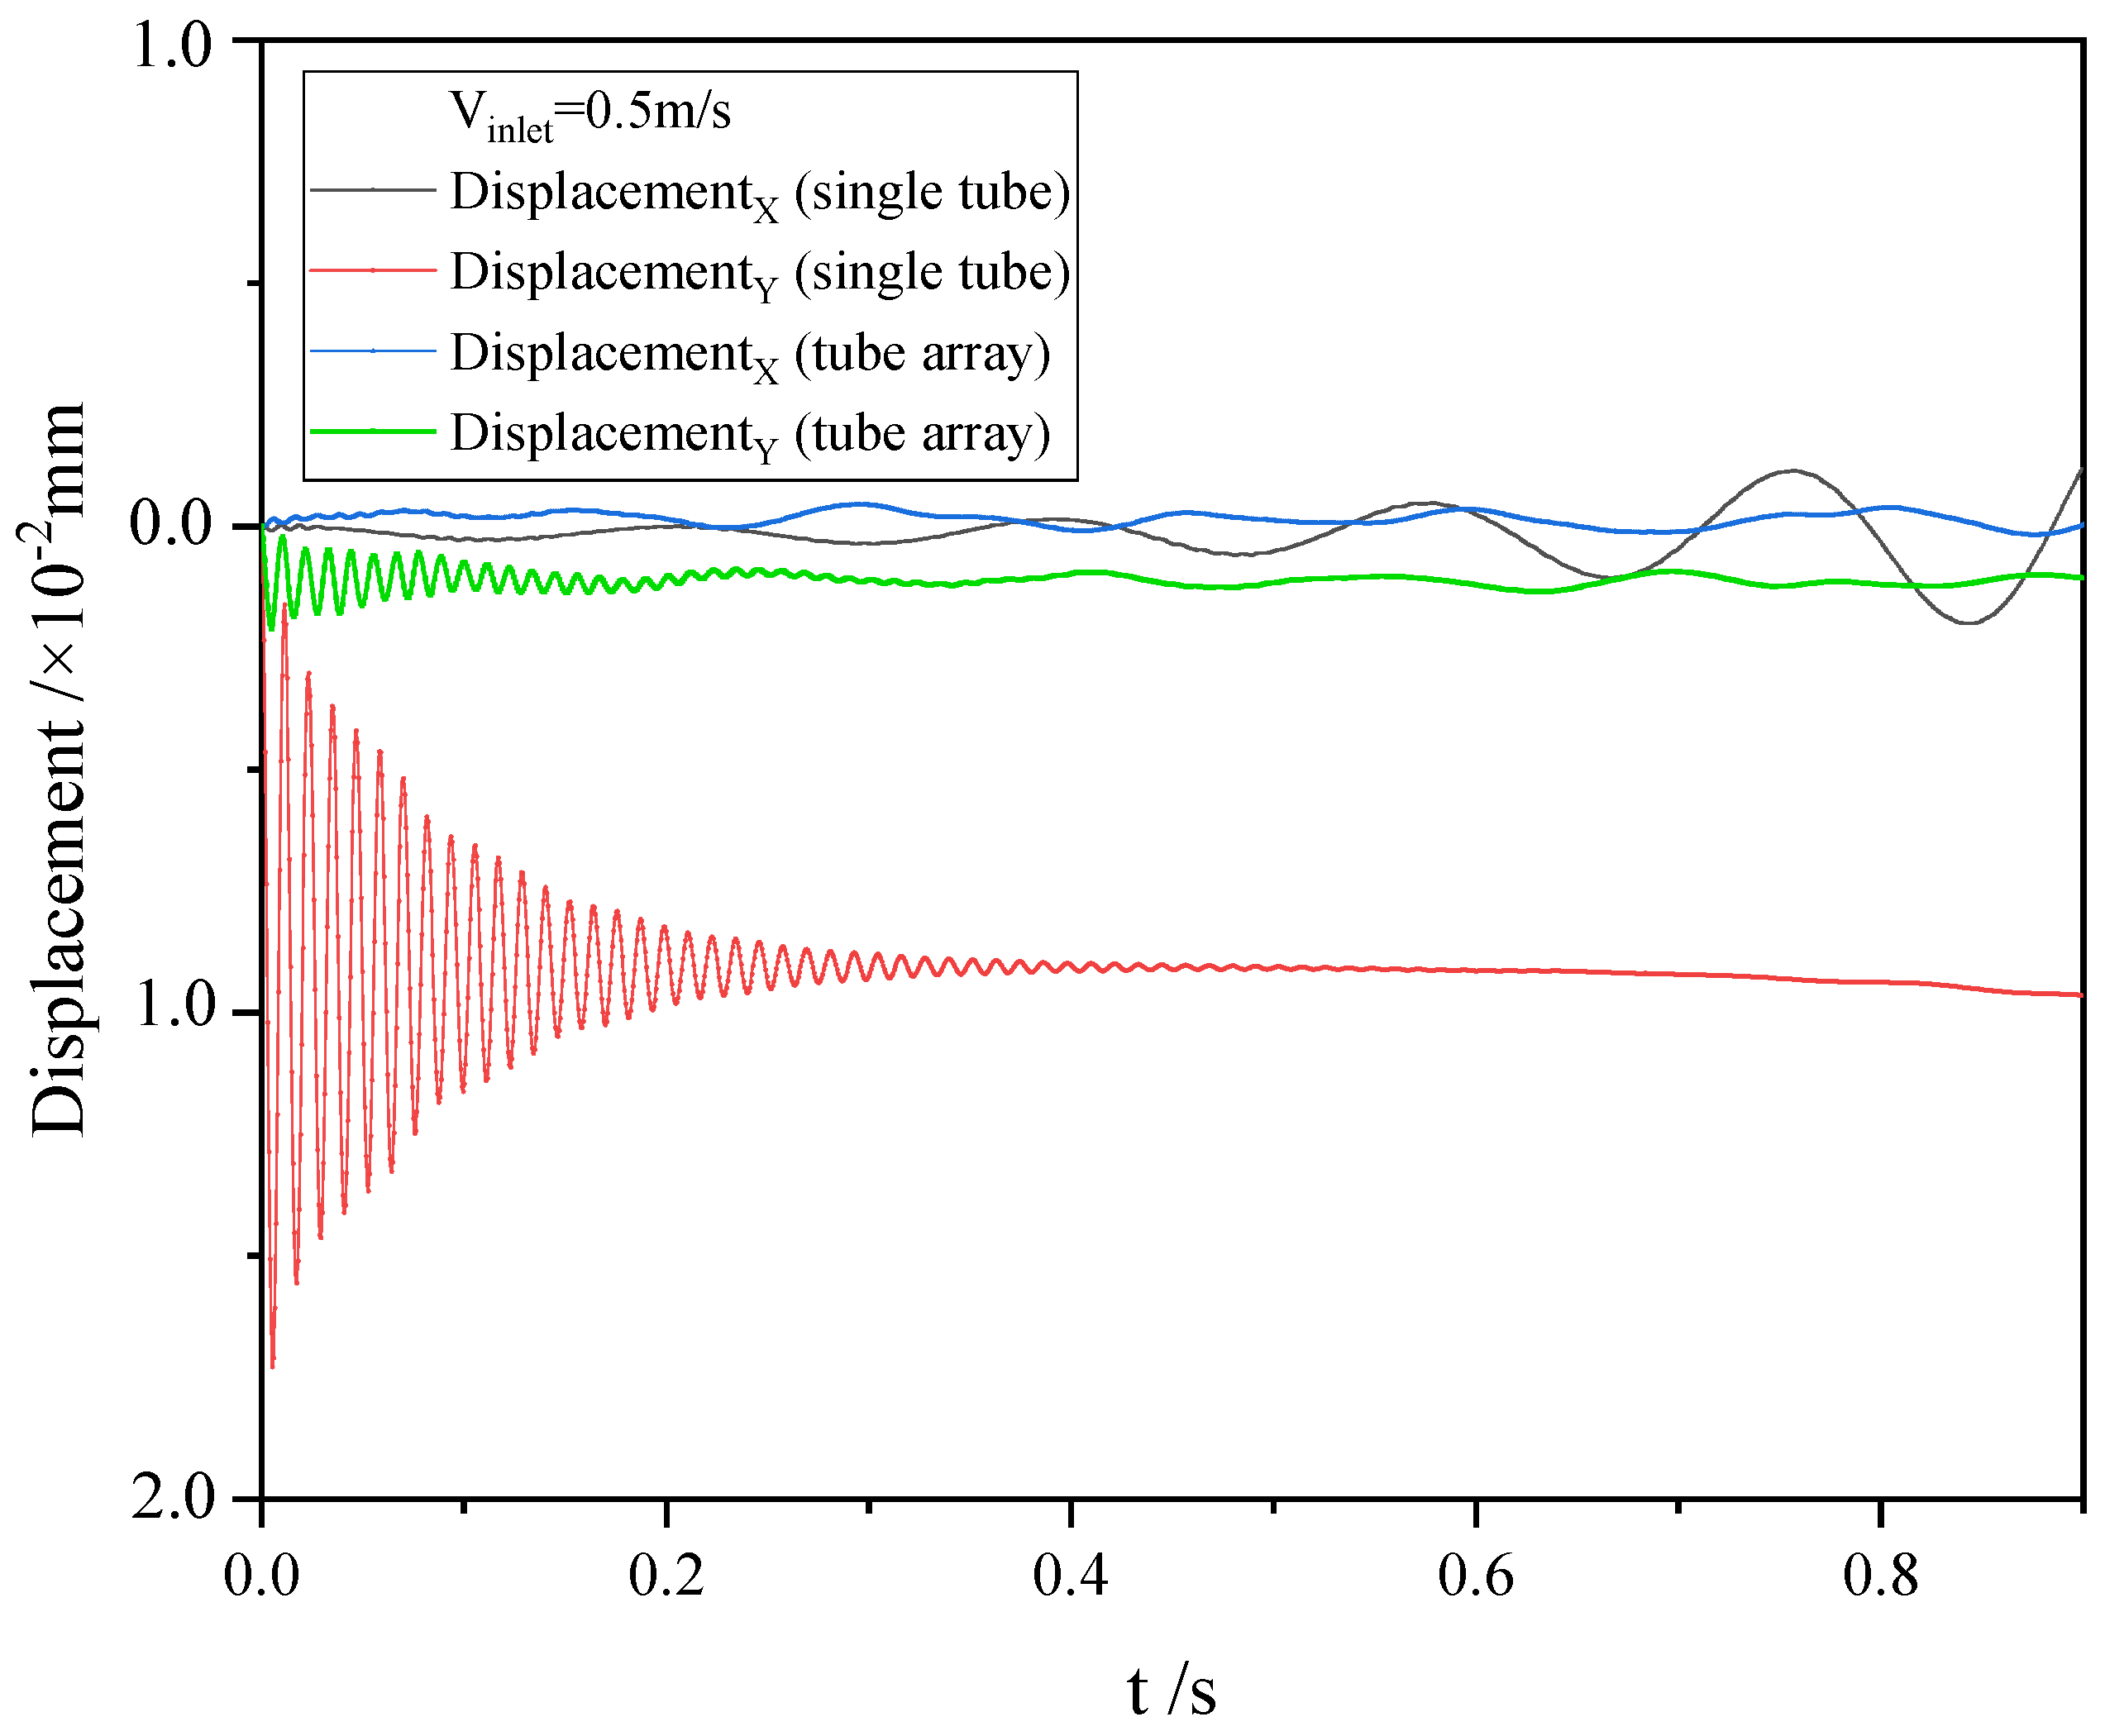
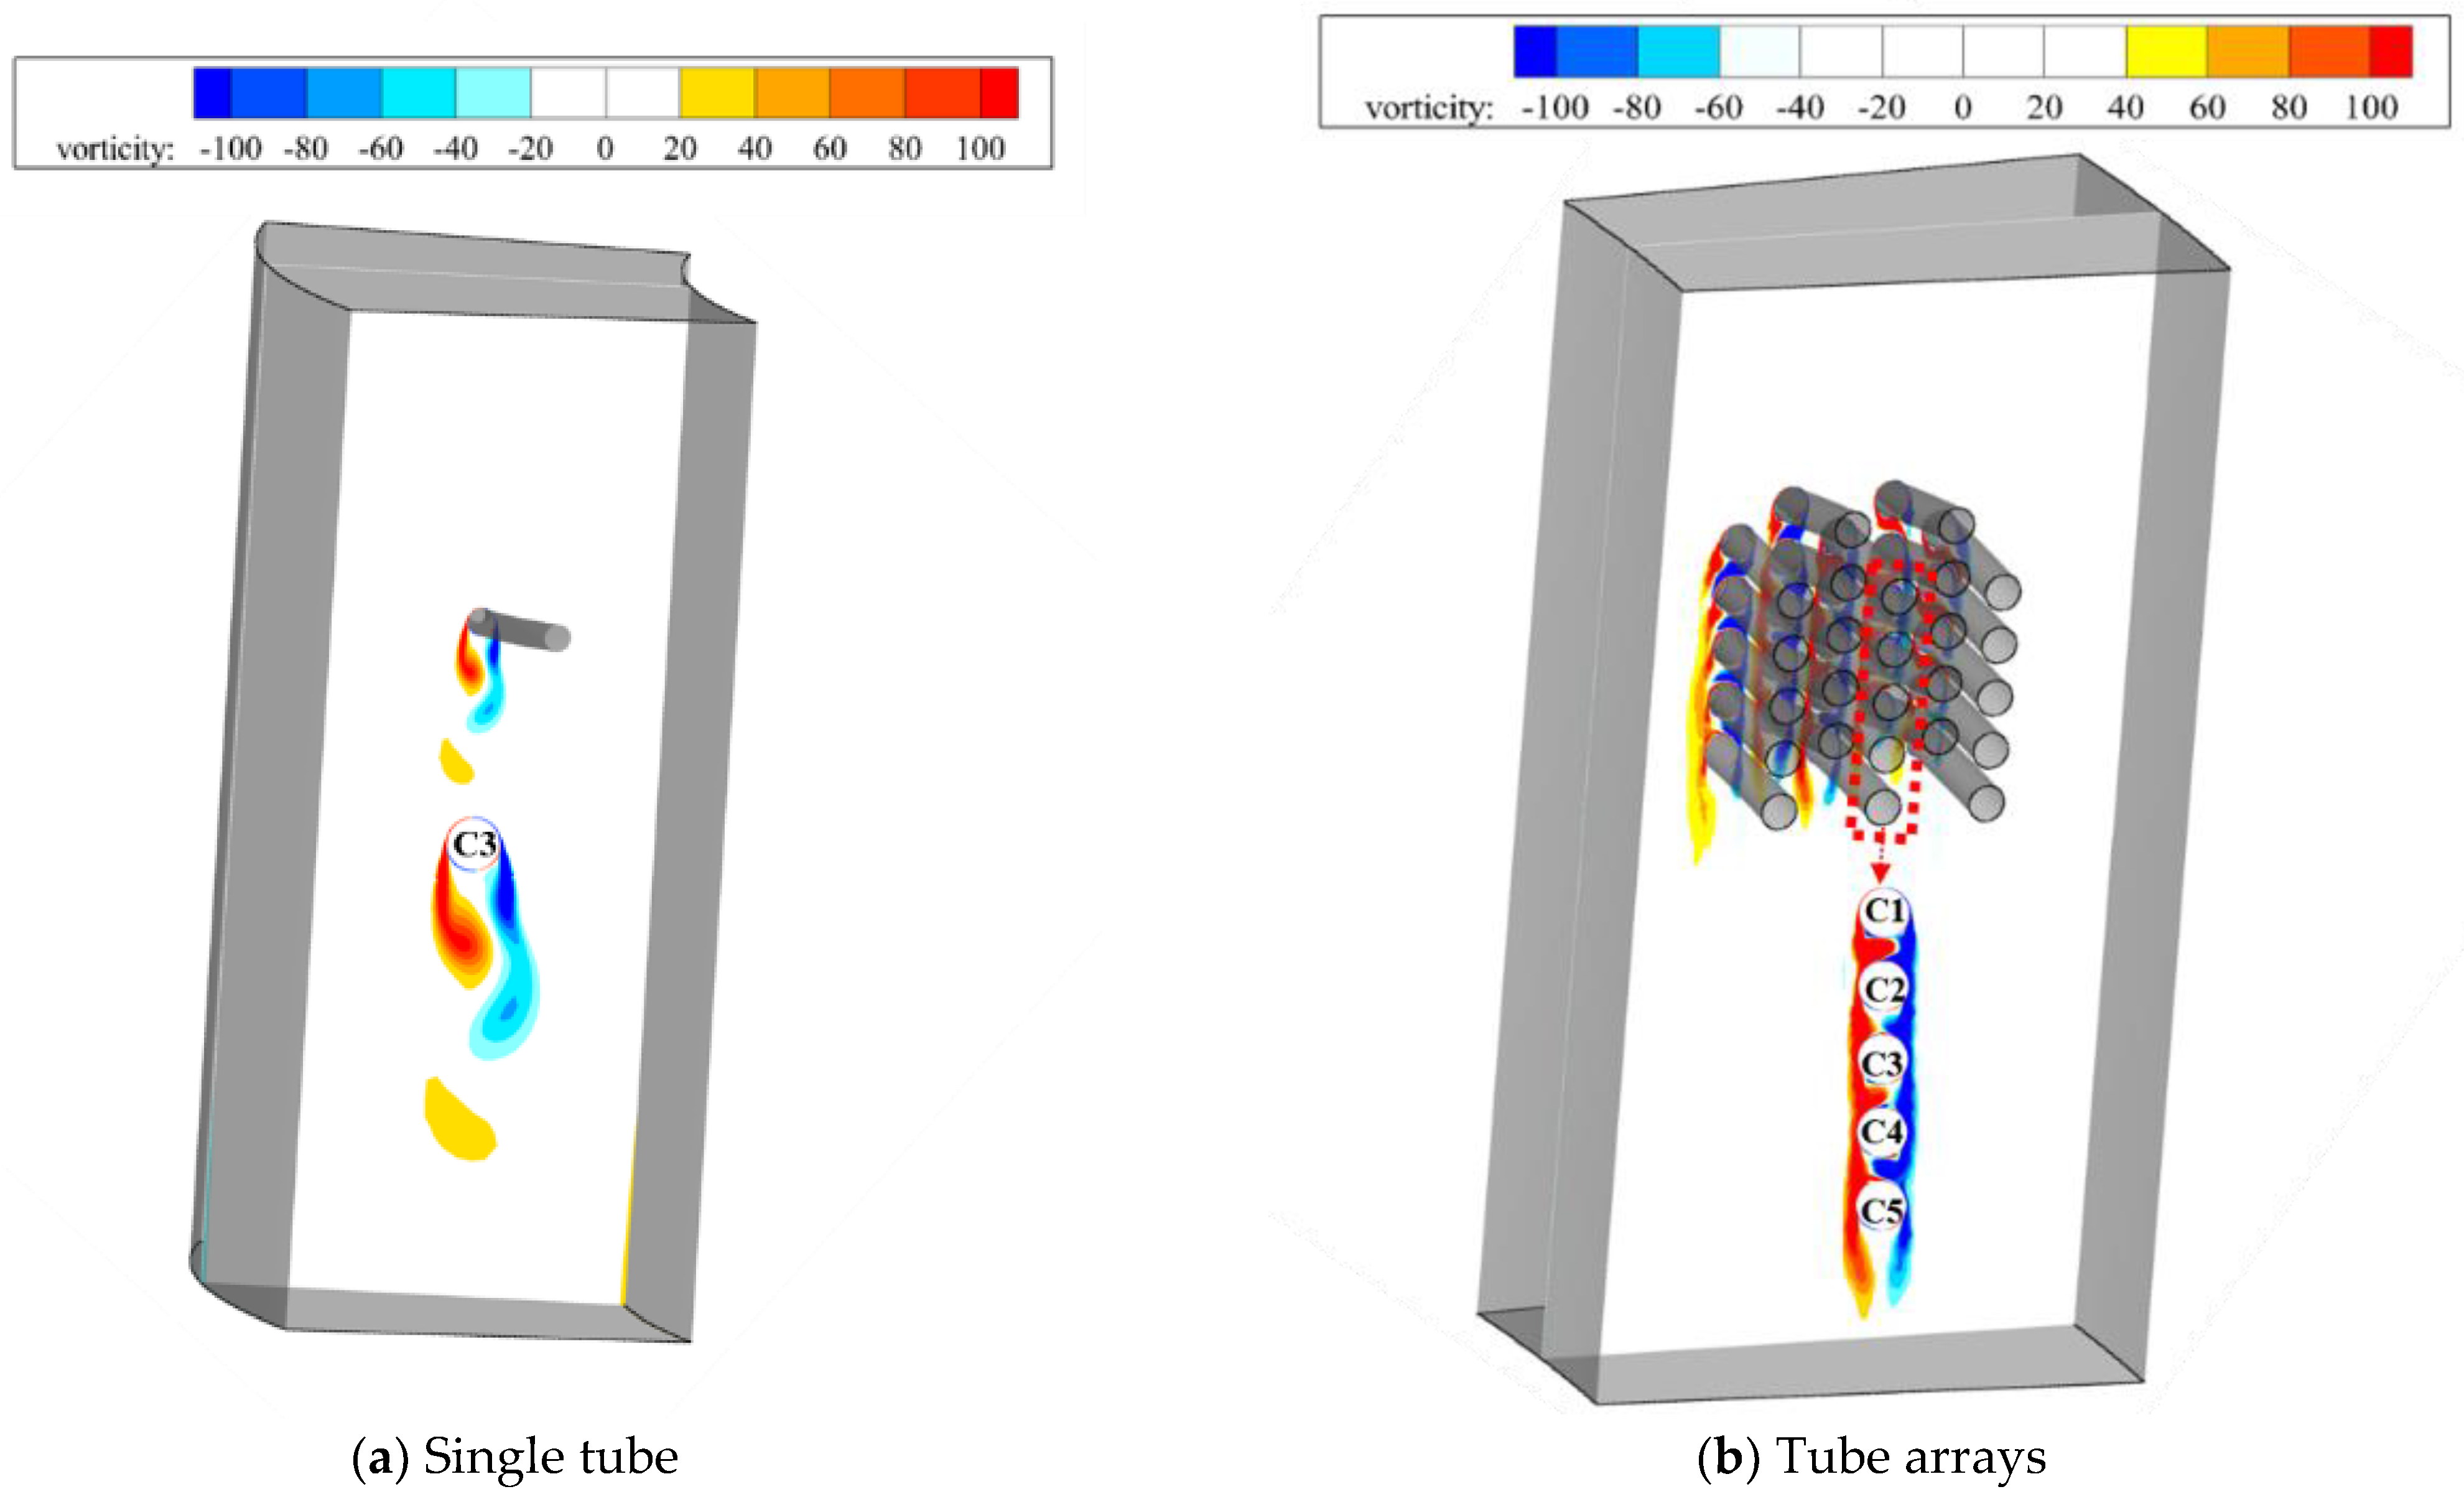
4.1. Influence of Tube Arrays and Single Tube on Target Tube Vibration

In the coupled analysis of FIV, the first-order mode is usually used to establish the vibration equation of the heat exchange tube [16,25], but the influence of higher modes on vibration is ignored. In this paper, the analysis method considering multi-order modes established in Section 2.2 is adopted. The single tube calculation model is established as shown in Figure 7. The influence of tube arrays and the single tube on the vibration response of the heat exchange tube is studied.
When there are multiple adjacent tubes around the target tube, the fluid force of the target tube will be affected [26], thereby affecting the vibration response of the target tube. Therefore, this paper further studies the influence of adjacent tubes on the vibration of the target tube under operating conditions (inlet velocity is 0.5 m/s). Figure 8 compares the vibration response differences of target tube C3 in the tube arrays model and the single tube model. It can be seen from the figure that the target tube C3 in both models has a small amplitude oscillation due to the fluid excitation. In the single tube model, the target C3 oscillates with an amplitude of 0.017 mm at the equilibrium position of Y = −0.09 mm. In contrast, the vibration equilibrium position of the target tube in the tube arrays is y = −0.001 mm, and the maximum axial vibration amplitude is 0.002 mm, which is 12% of the vibration amplitude of the target tube in the single tube model. The axial vibration of the target tube gradually decreases, and the radial vibration gradually increases, which means that the vibration gradually changes from axial to radial. As shown in Table 3, when the inlet velocity is 0.5 m/s, the radial root mean square displacement of the target tube decreases by 33%, and the axial amplitude of the target tube decreases by 88% at the initial disturbance. The results show that the vibration of C3 is obviously weakened by the existence of adjacent helical tubes. Figure 9 compares the z = 0 plane vortices near C3 in the single tube and tube arrays at this velocity. The vortices form and fall off at 4D at the tail of a single tube. In the tube arrays, the shear layer in the near-wall region of the helical tube directly adheres to the target tube C3, then falls off and forms a counter vortex in the wake region. However, due to the influence of the downstream helical tube, it does not develop into a Karmen vortex street. Therefore, the existence of adjacent tubes weakens the impact of fluid on the target tube, and obviously weakens the vibration of the target tube.

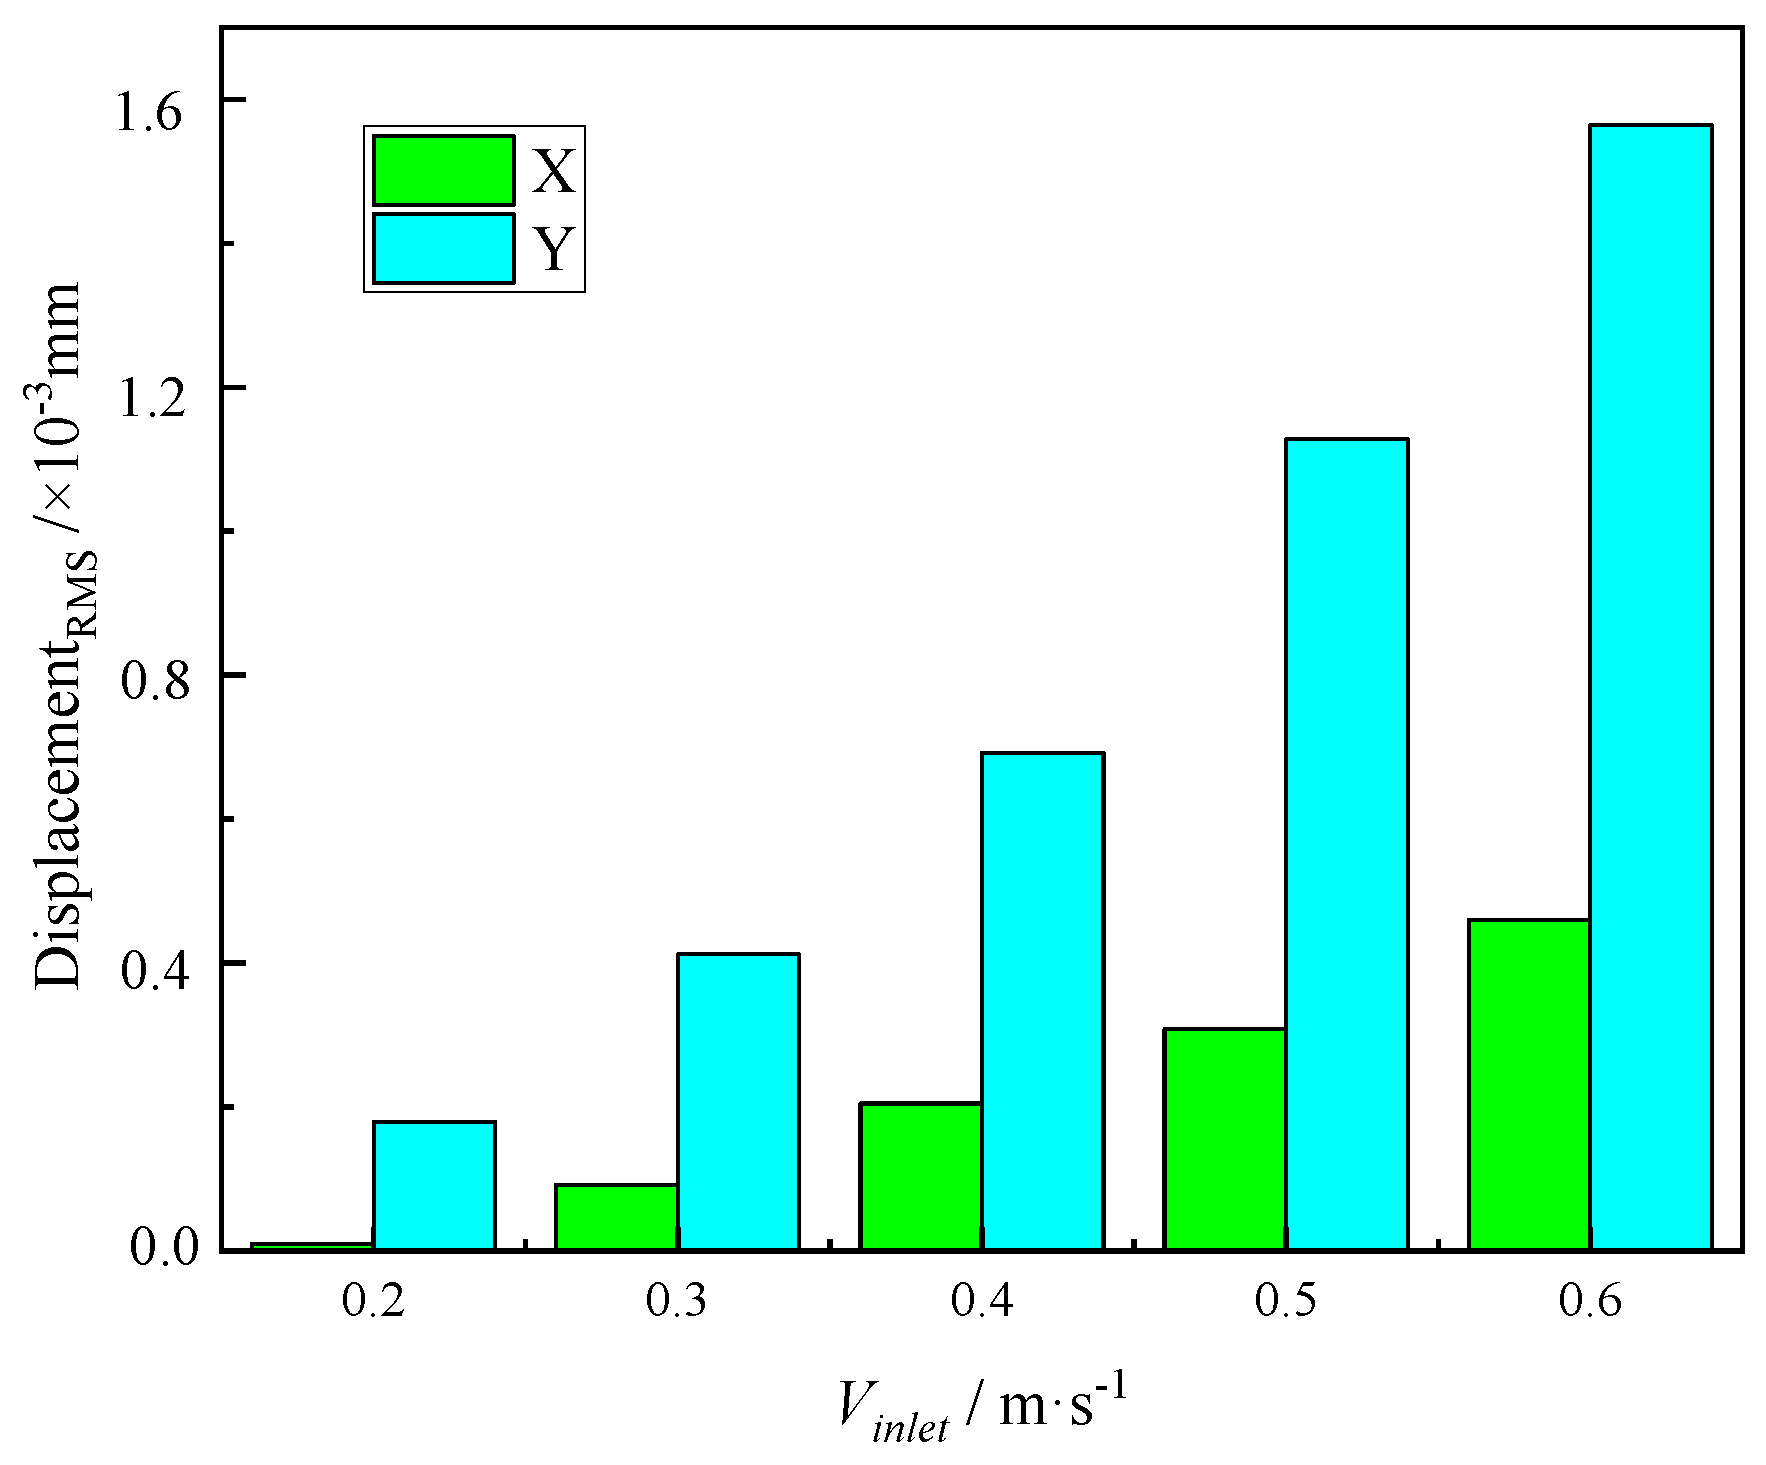
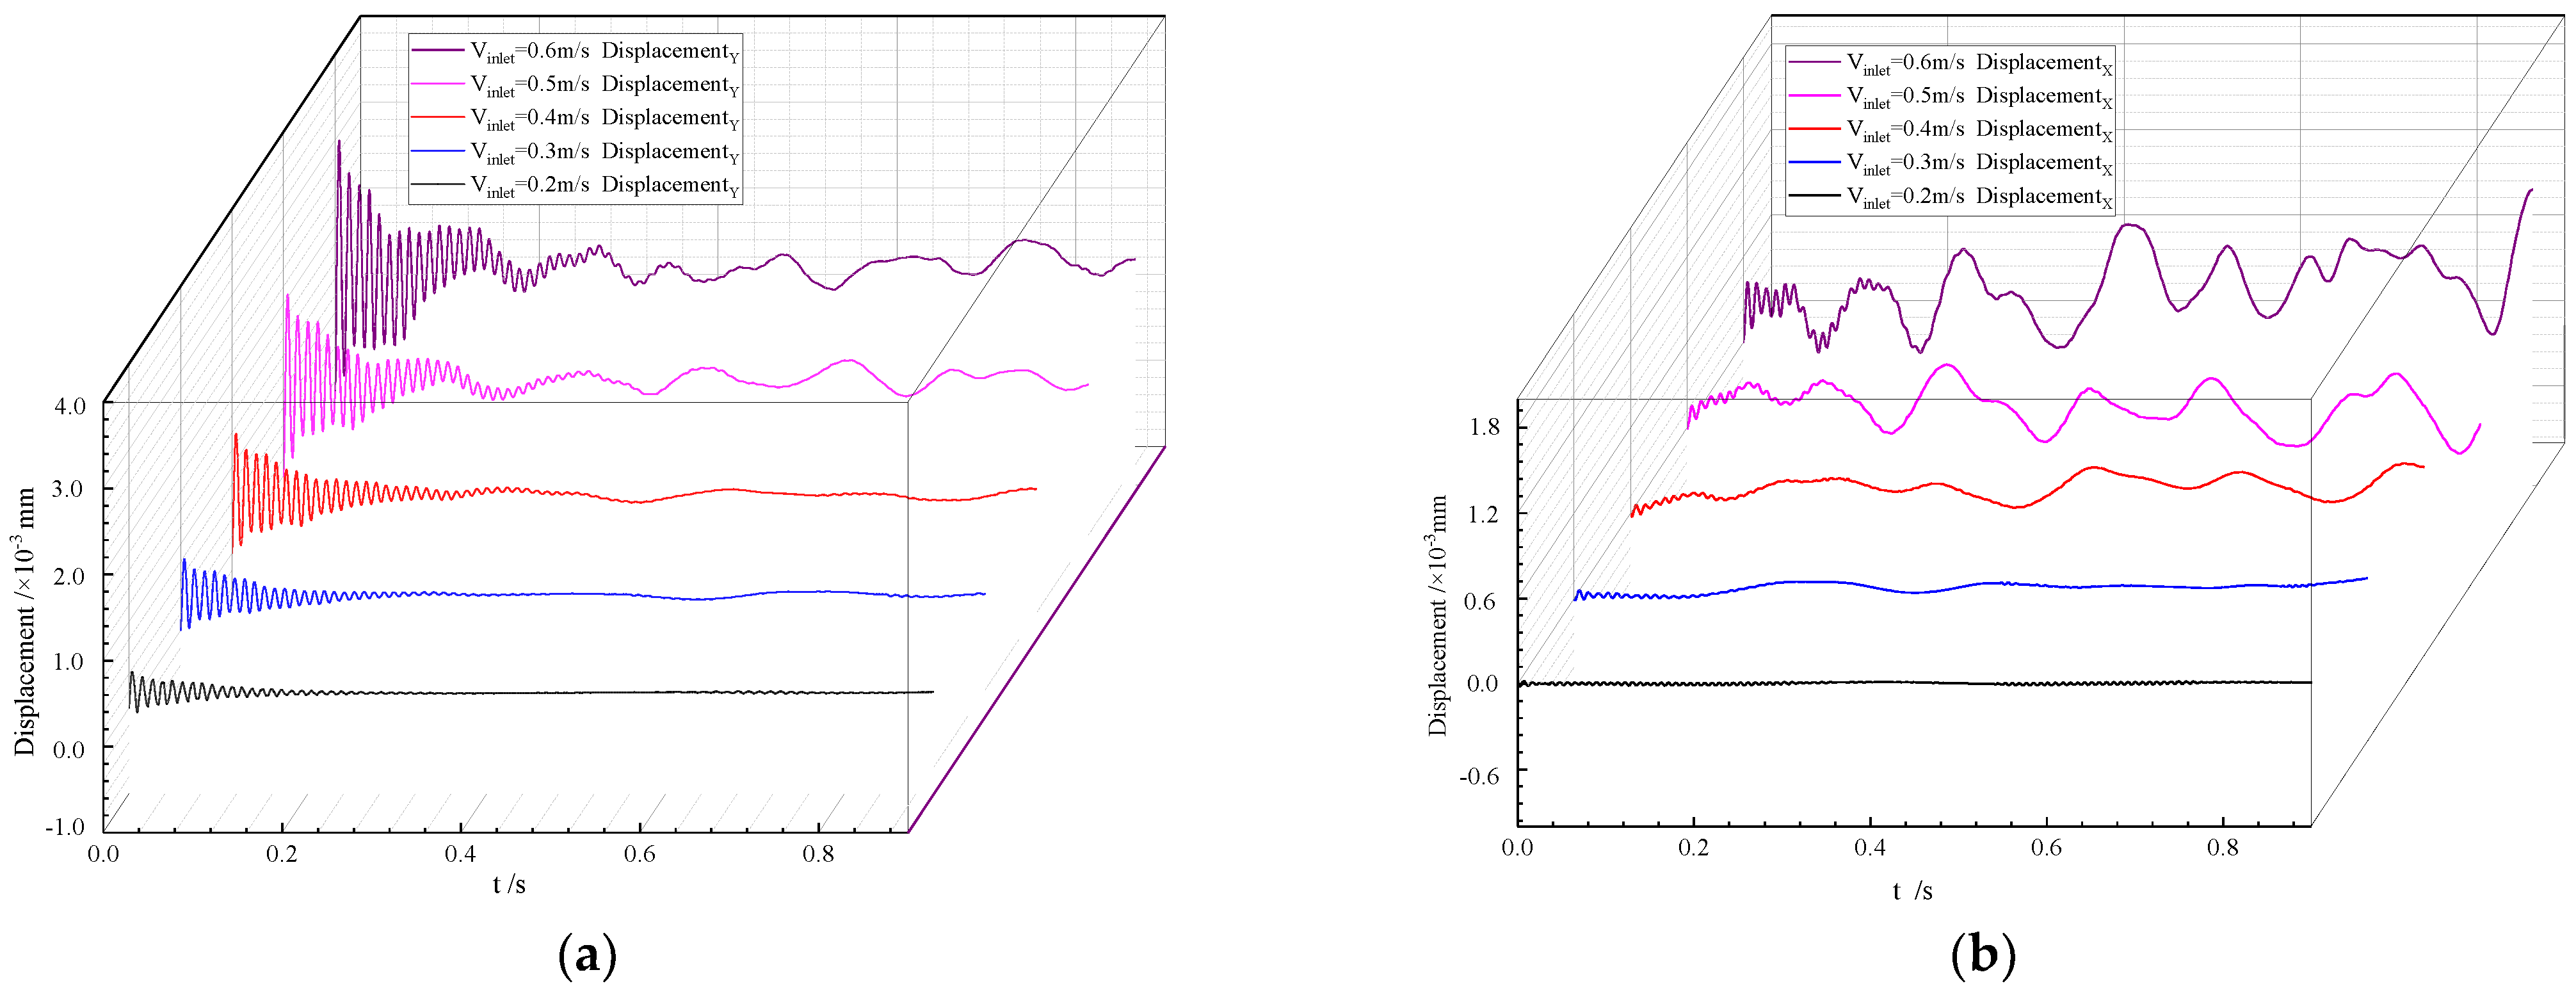
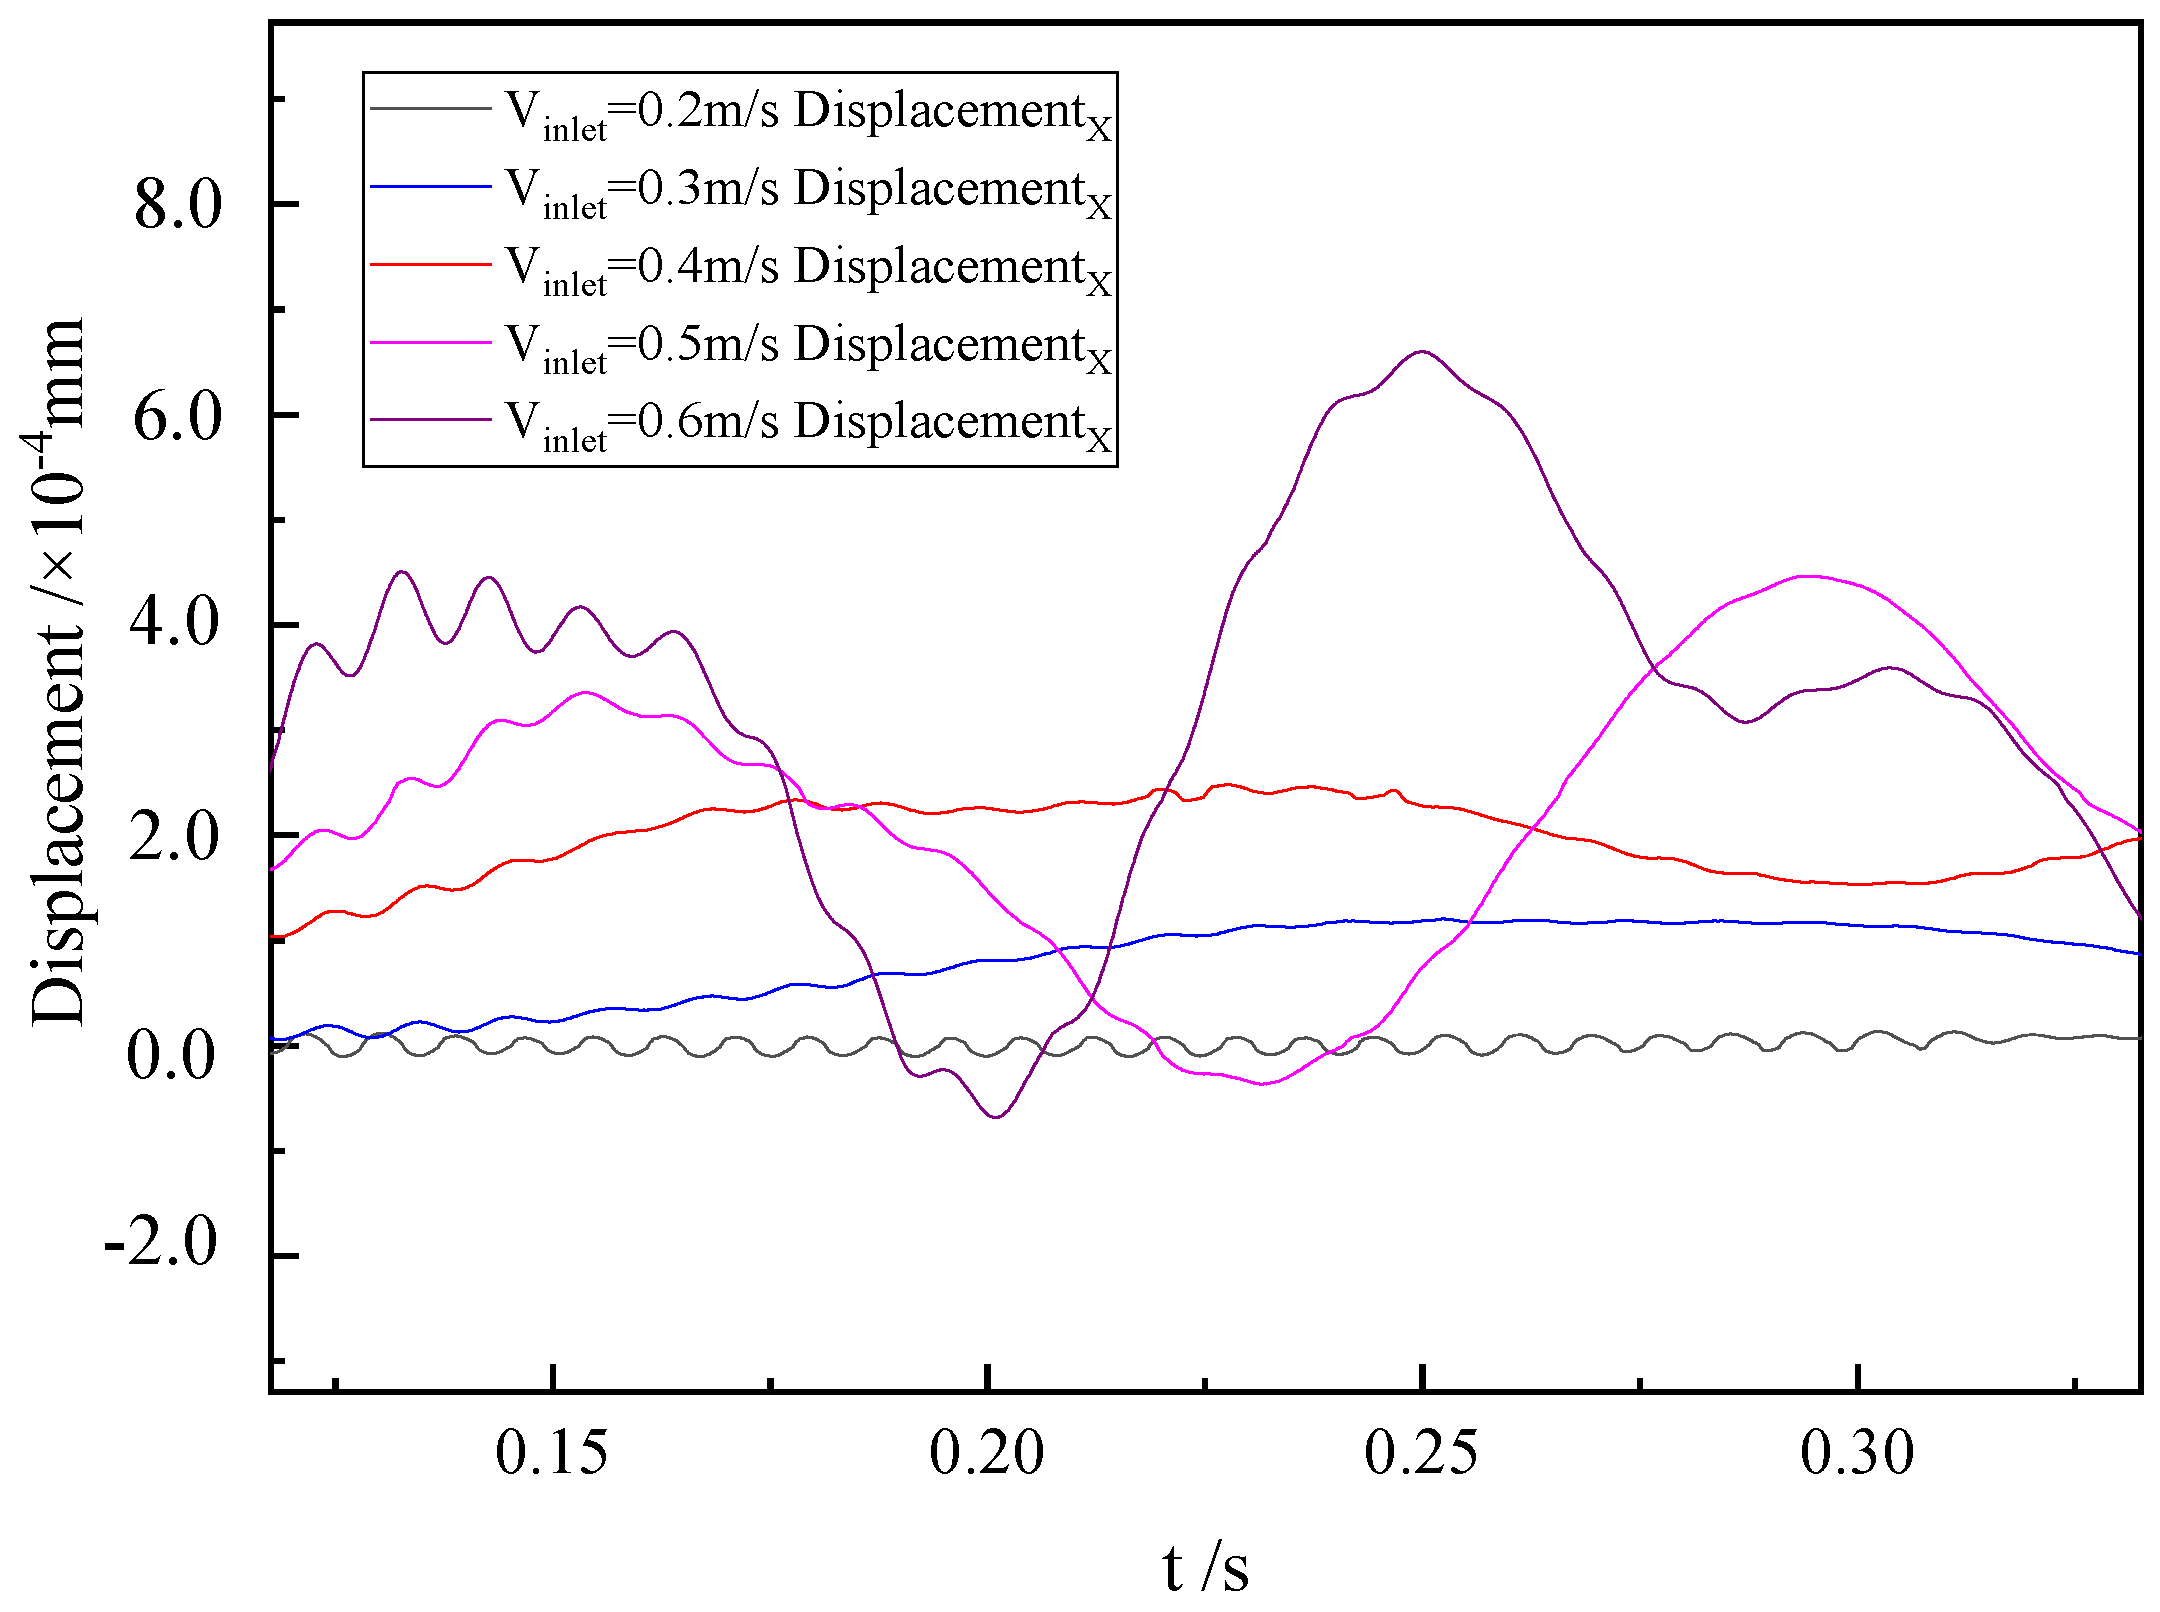
4.2. Vibration Behaviors at Different Velocities

The FIV response calculation of the helical tube bundle under different inlet flow velocities is carried out to obtain the RMS vibration amplitude of the target tube in axial and radial directions, as shown in Figure 10. The results show that the amplitude of C3 increases gradually with the increase of inlet velocity, and the axial amplitude will be greater than the radial at the same velocity. Moreover, with the increase of flow velocity, the growth rate of axial vibration amplitude decreases gradually. The axial and radial displacement response of C3 is shown in Figure 11. The axial amplitude gradually weakens with time, and the radial amplitude is maintained at the x-axis, resulting in a slight up–down vibration. With the increase of flow velocity, the fluctuation of vibration displacement increases and the response period decreases, as shown in Figure 12. In conclusion, when the FIV occurs in the helical tube, its amplitude is mainly axial vibration. With the increase of flow velocity, the increase rate of axial vibration amplitude decreases gradually, and the vibration period decreases gradually.

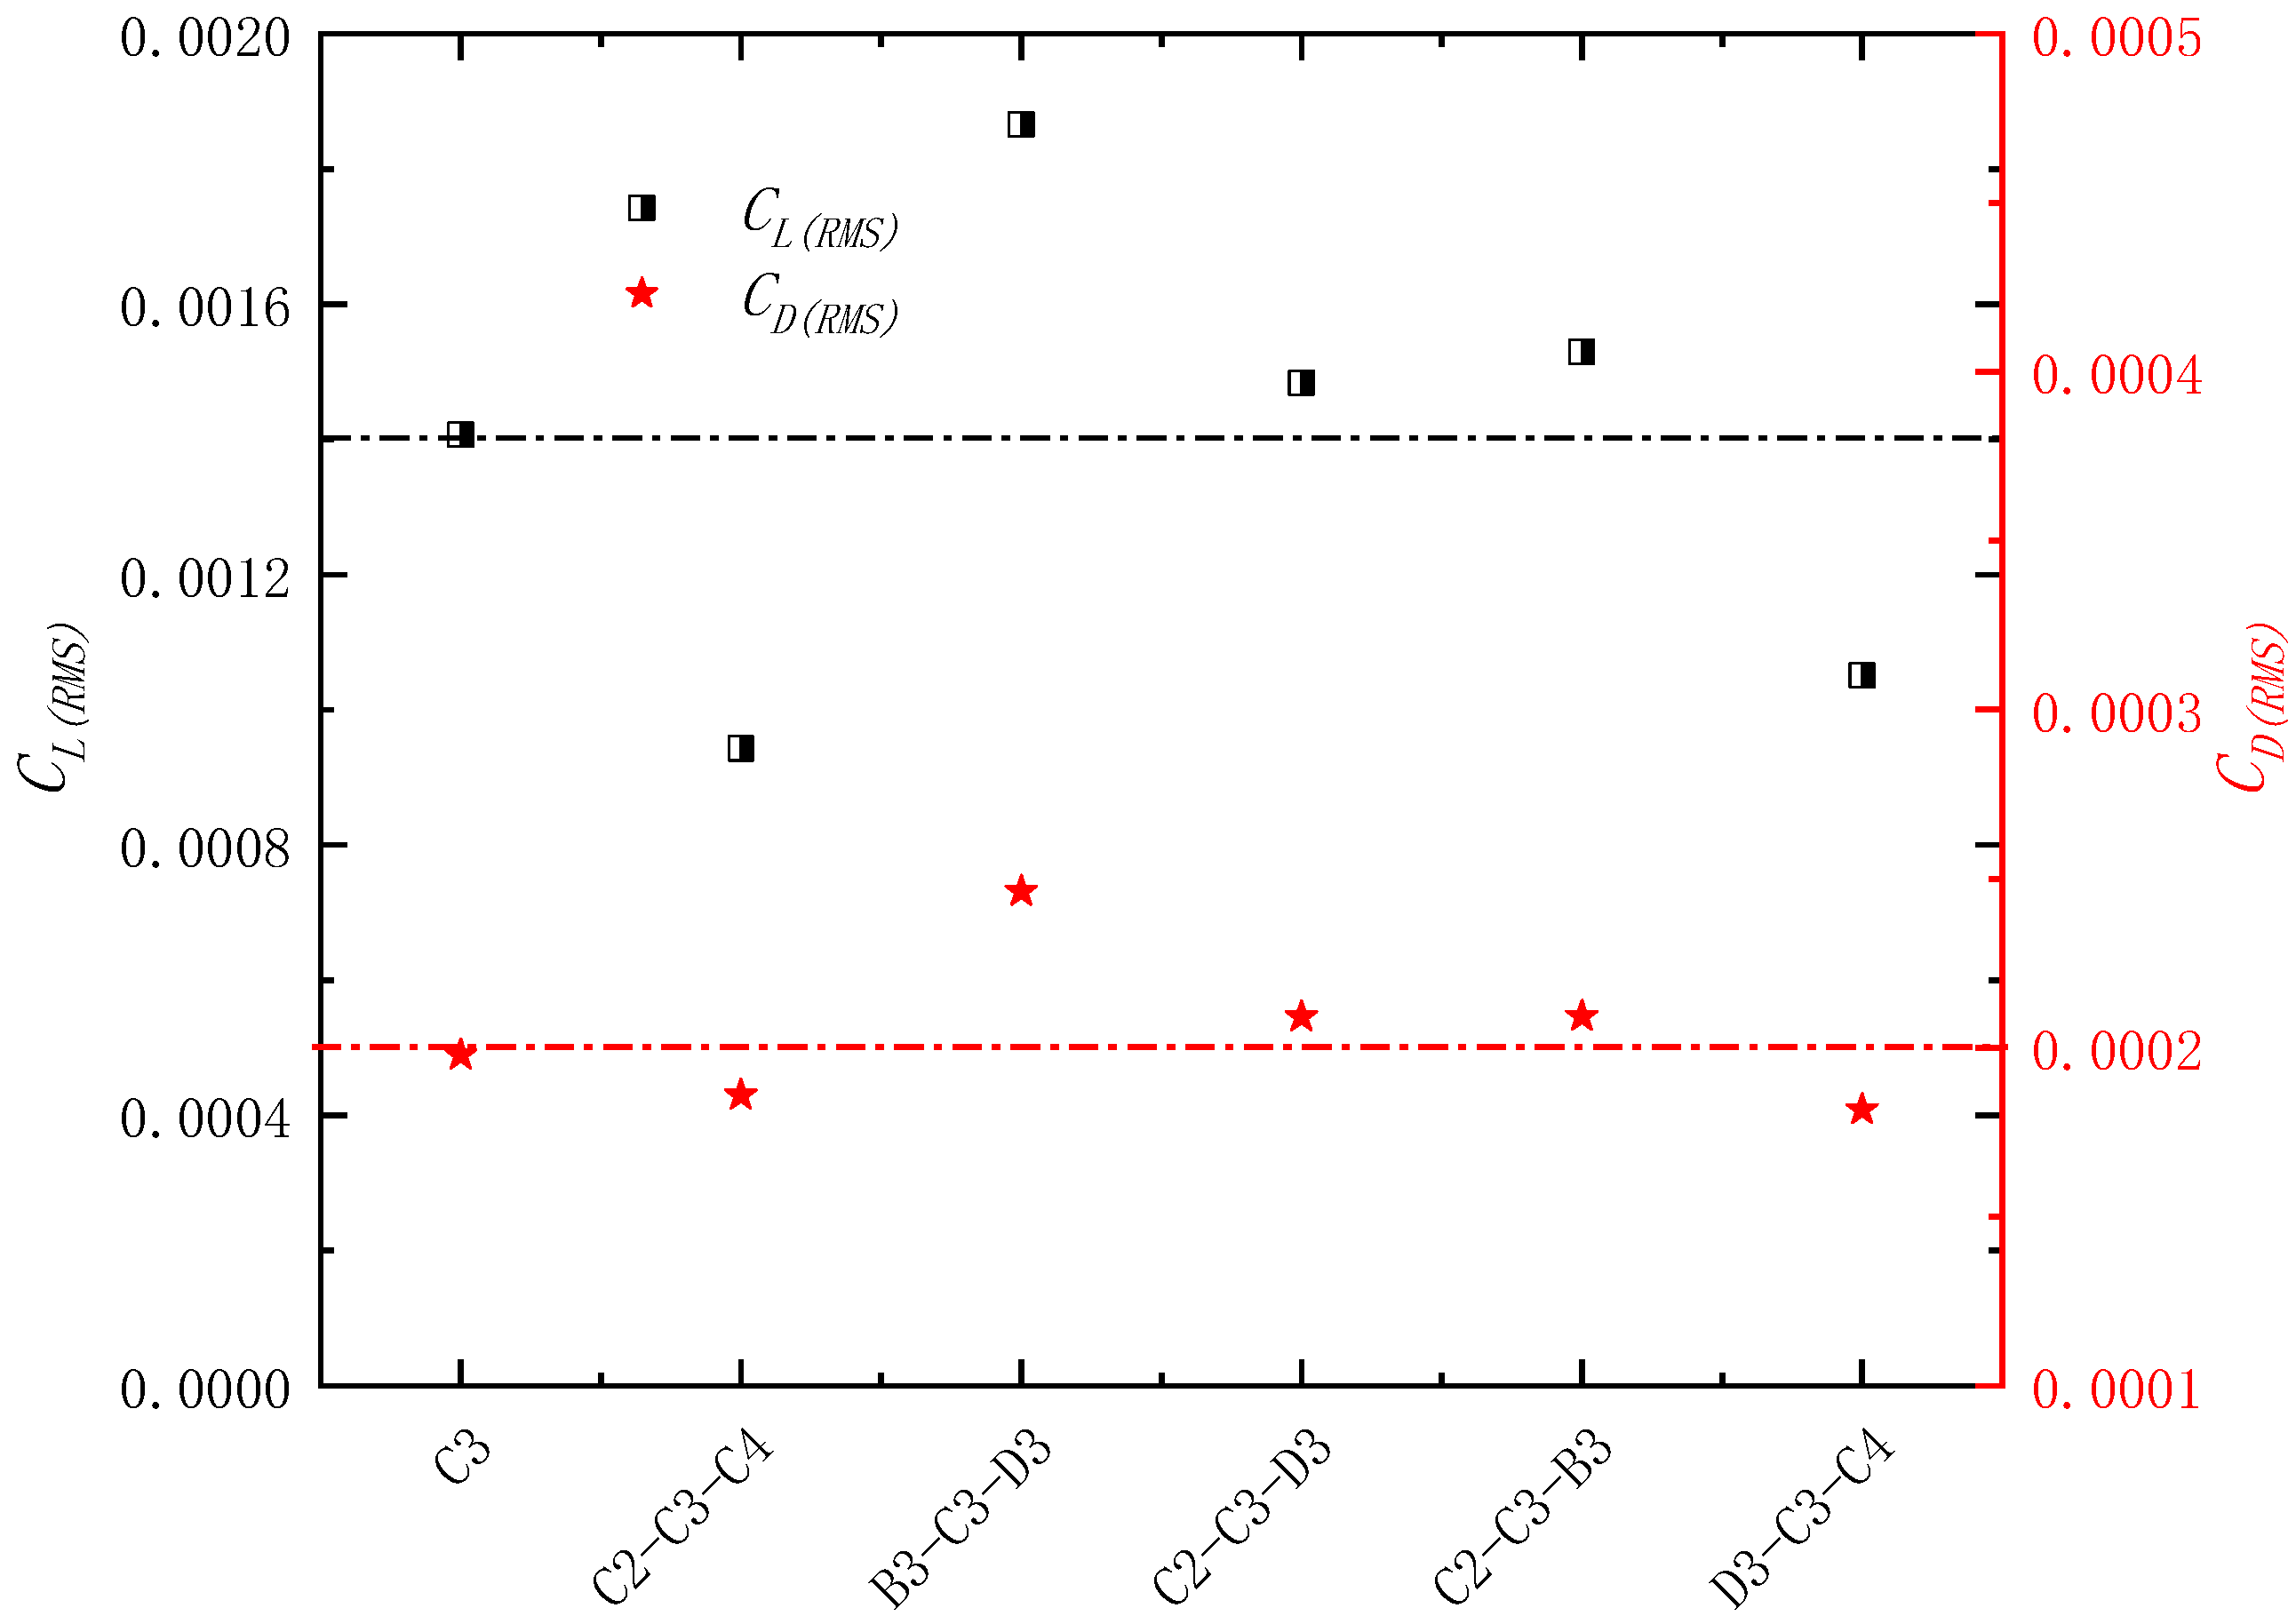
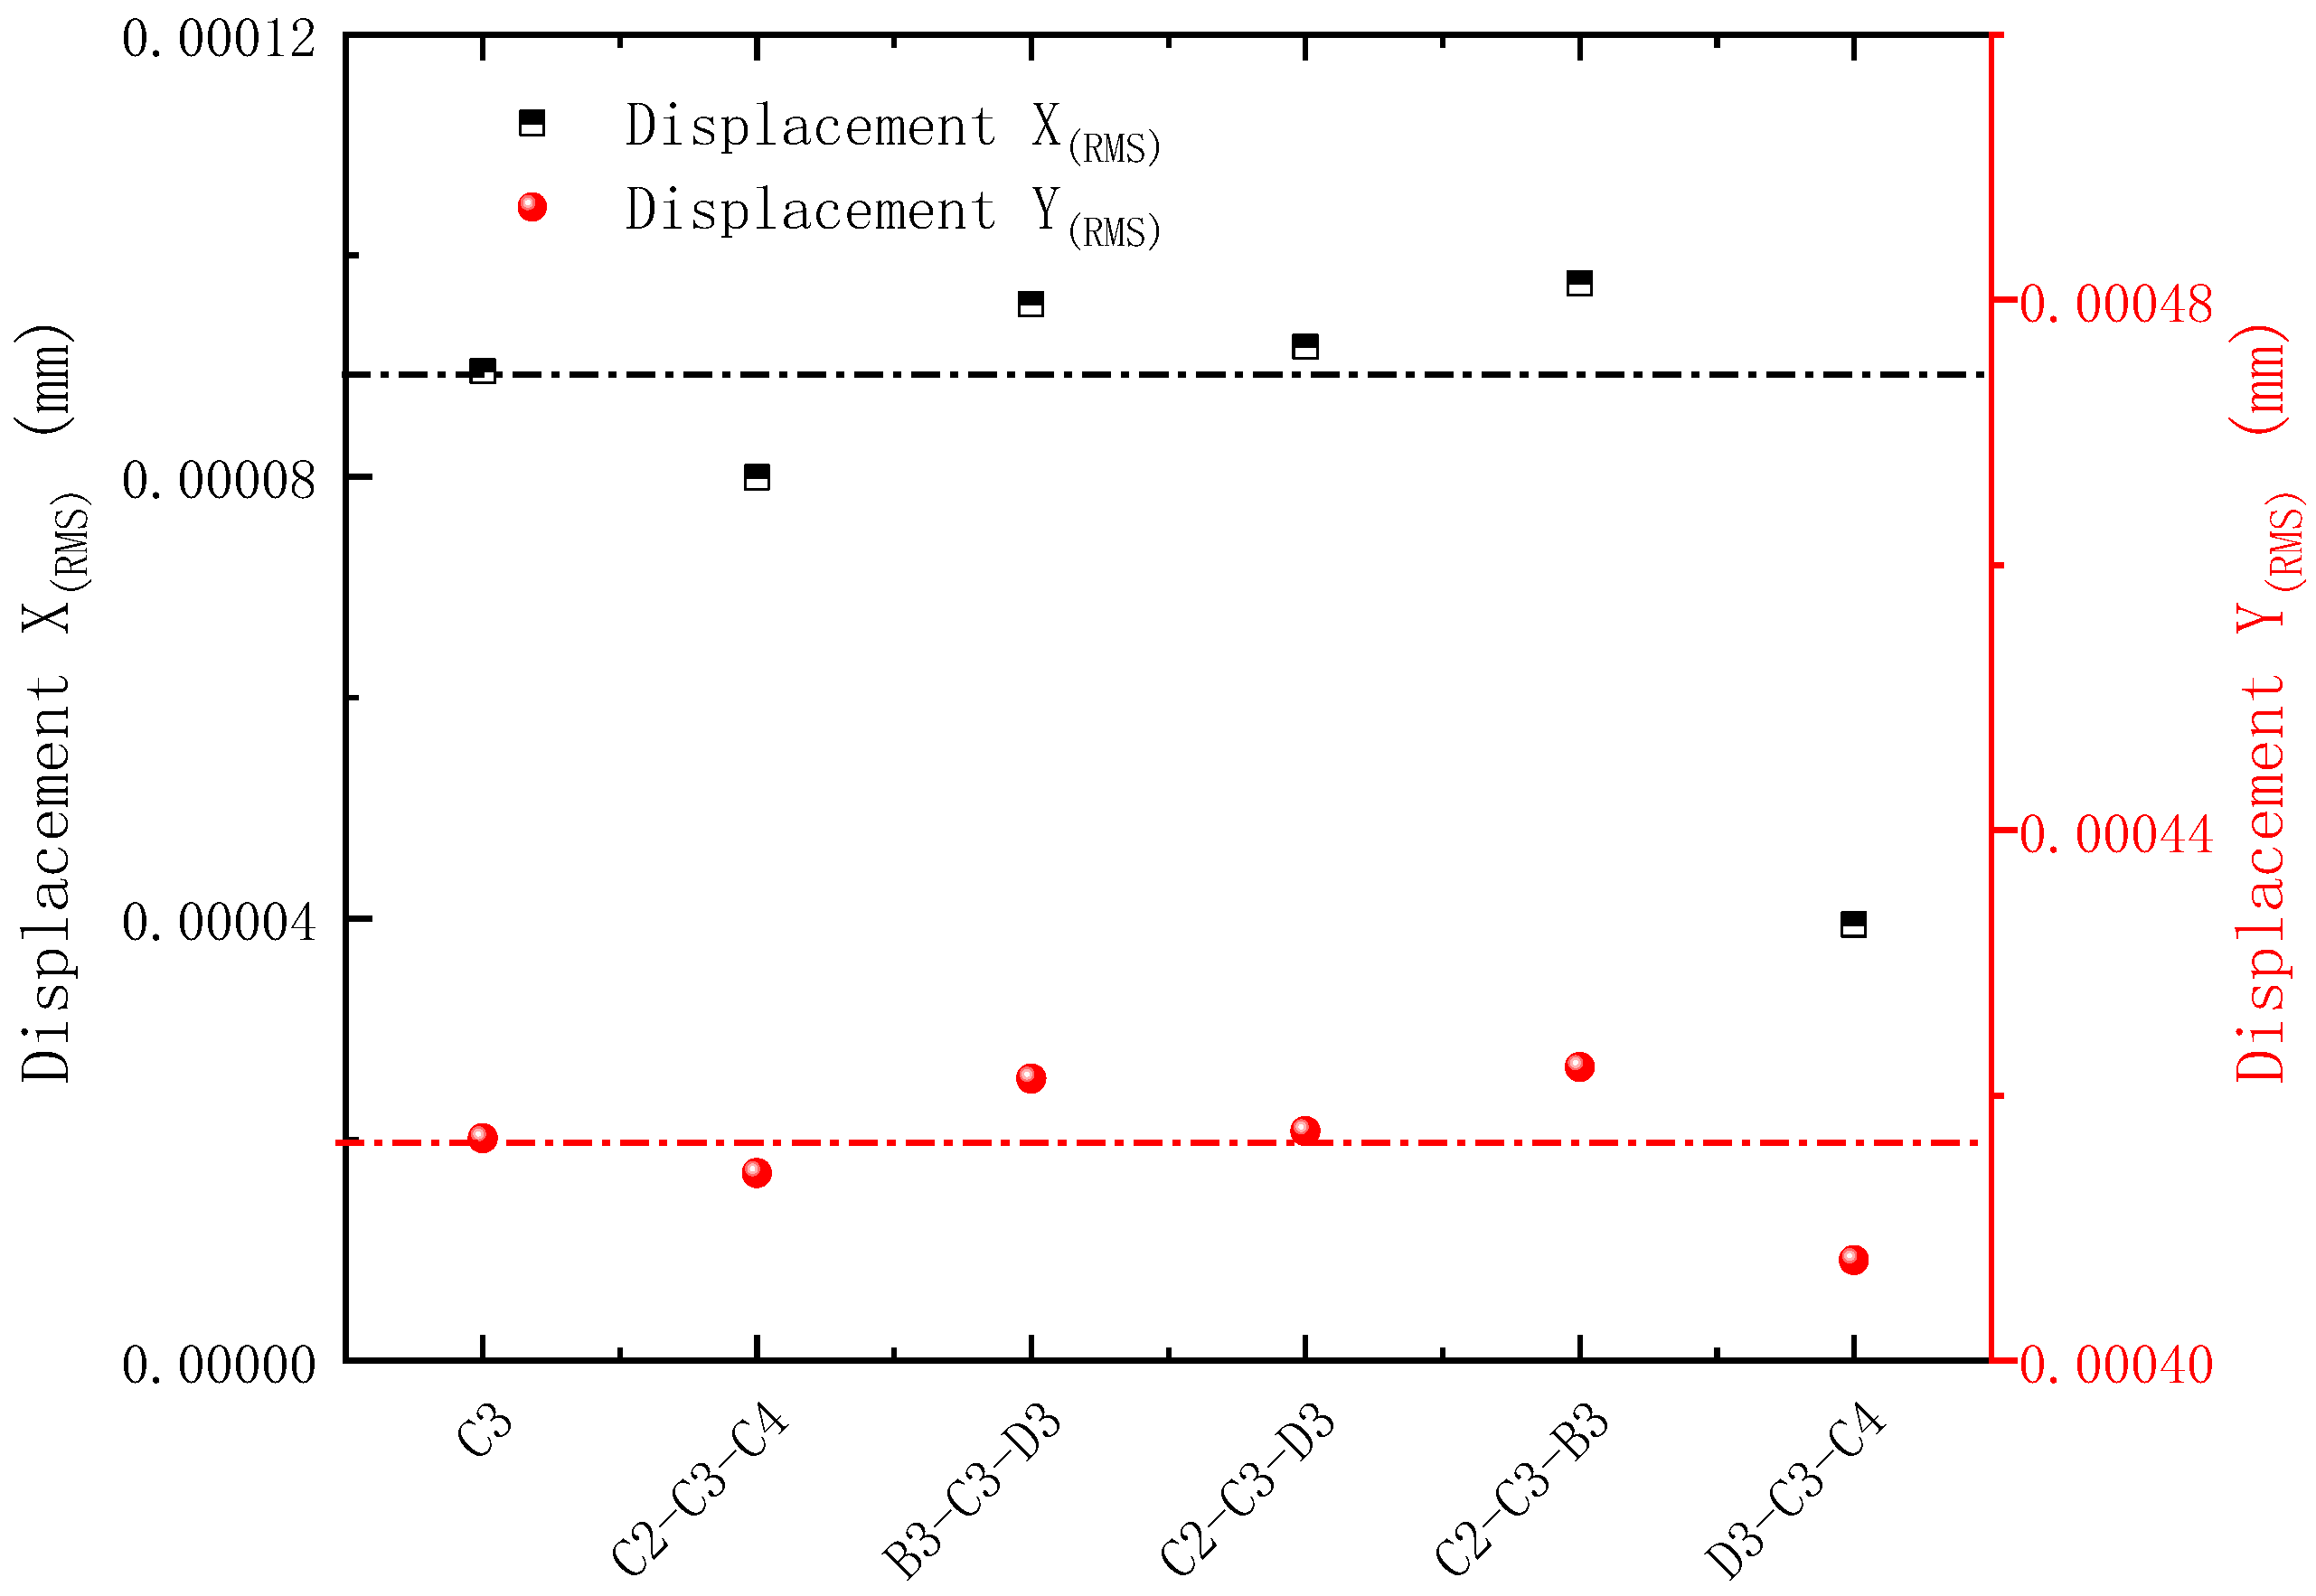
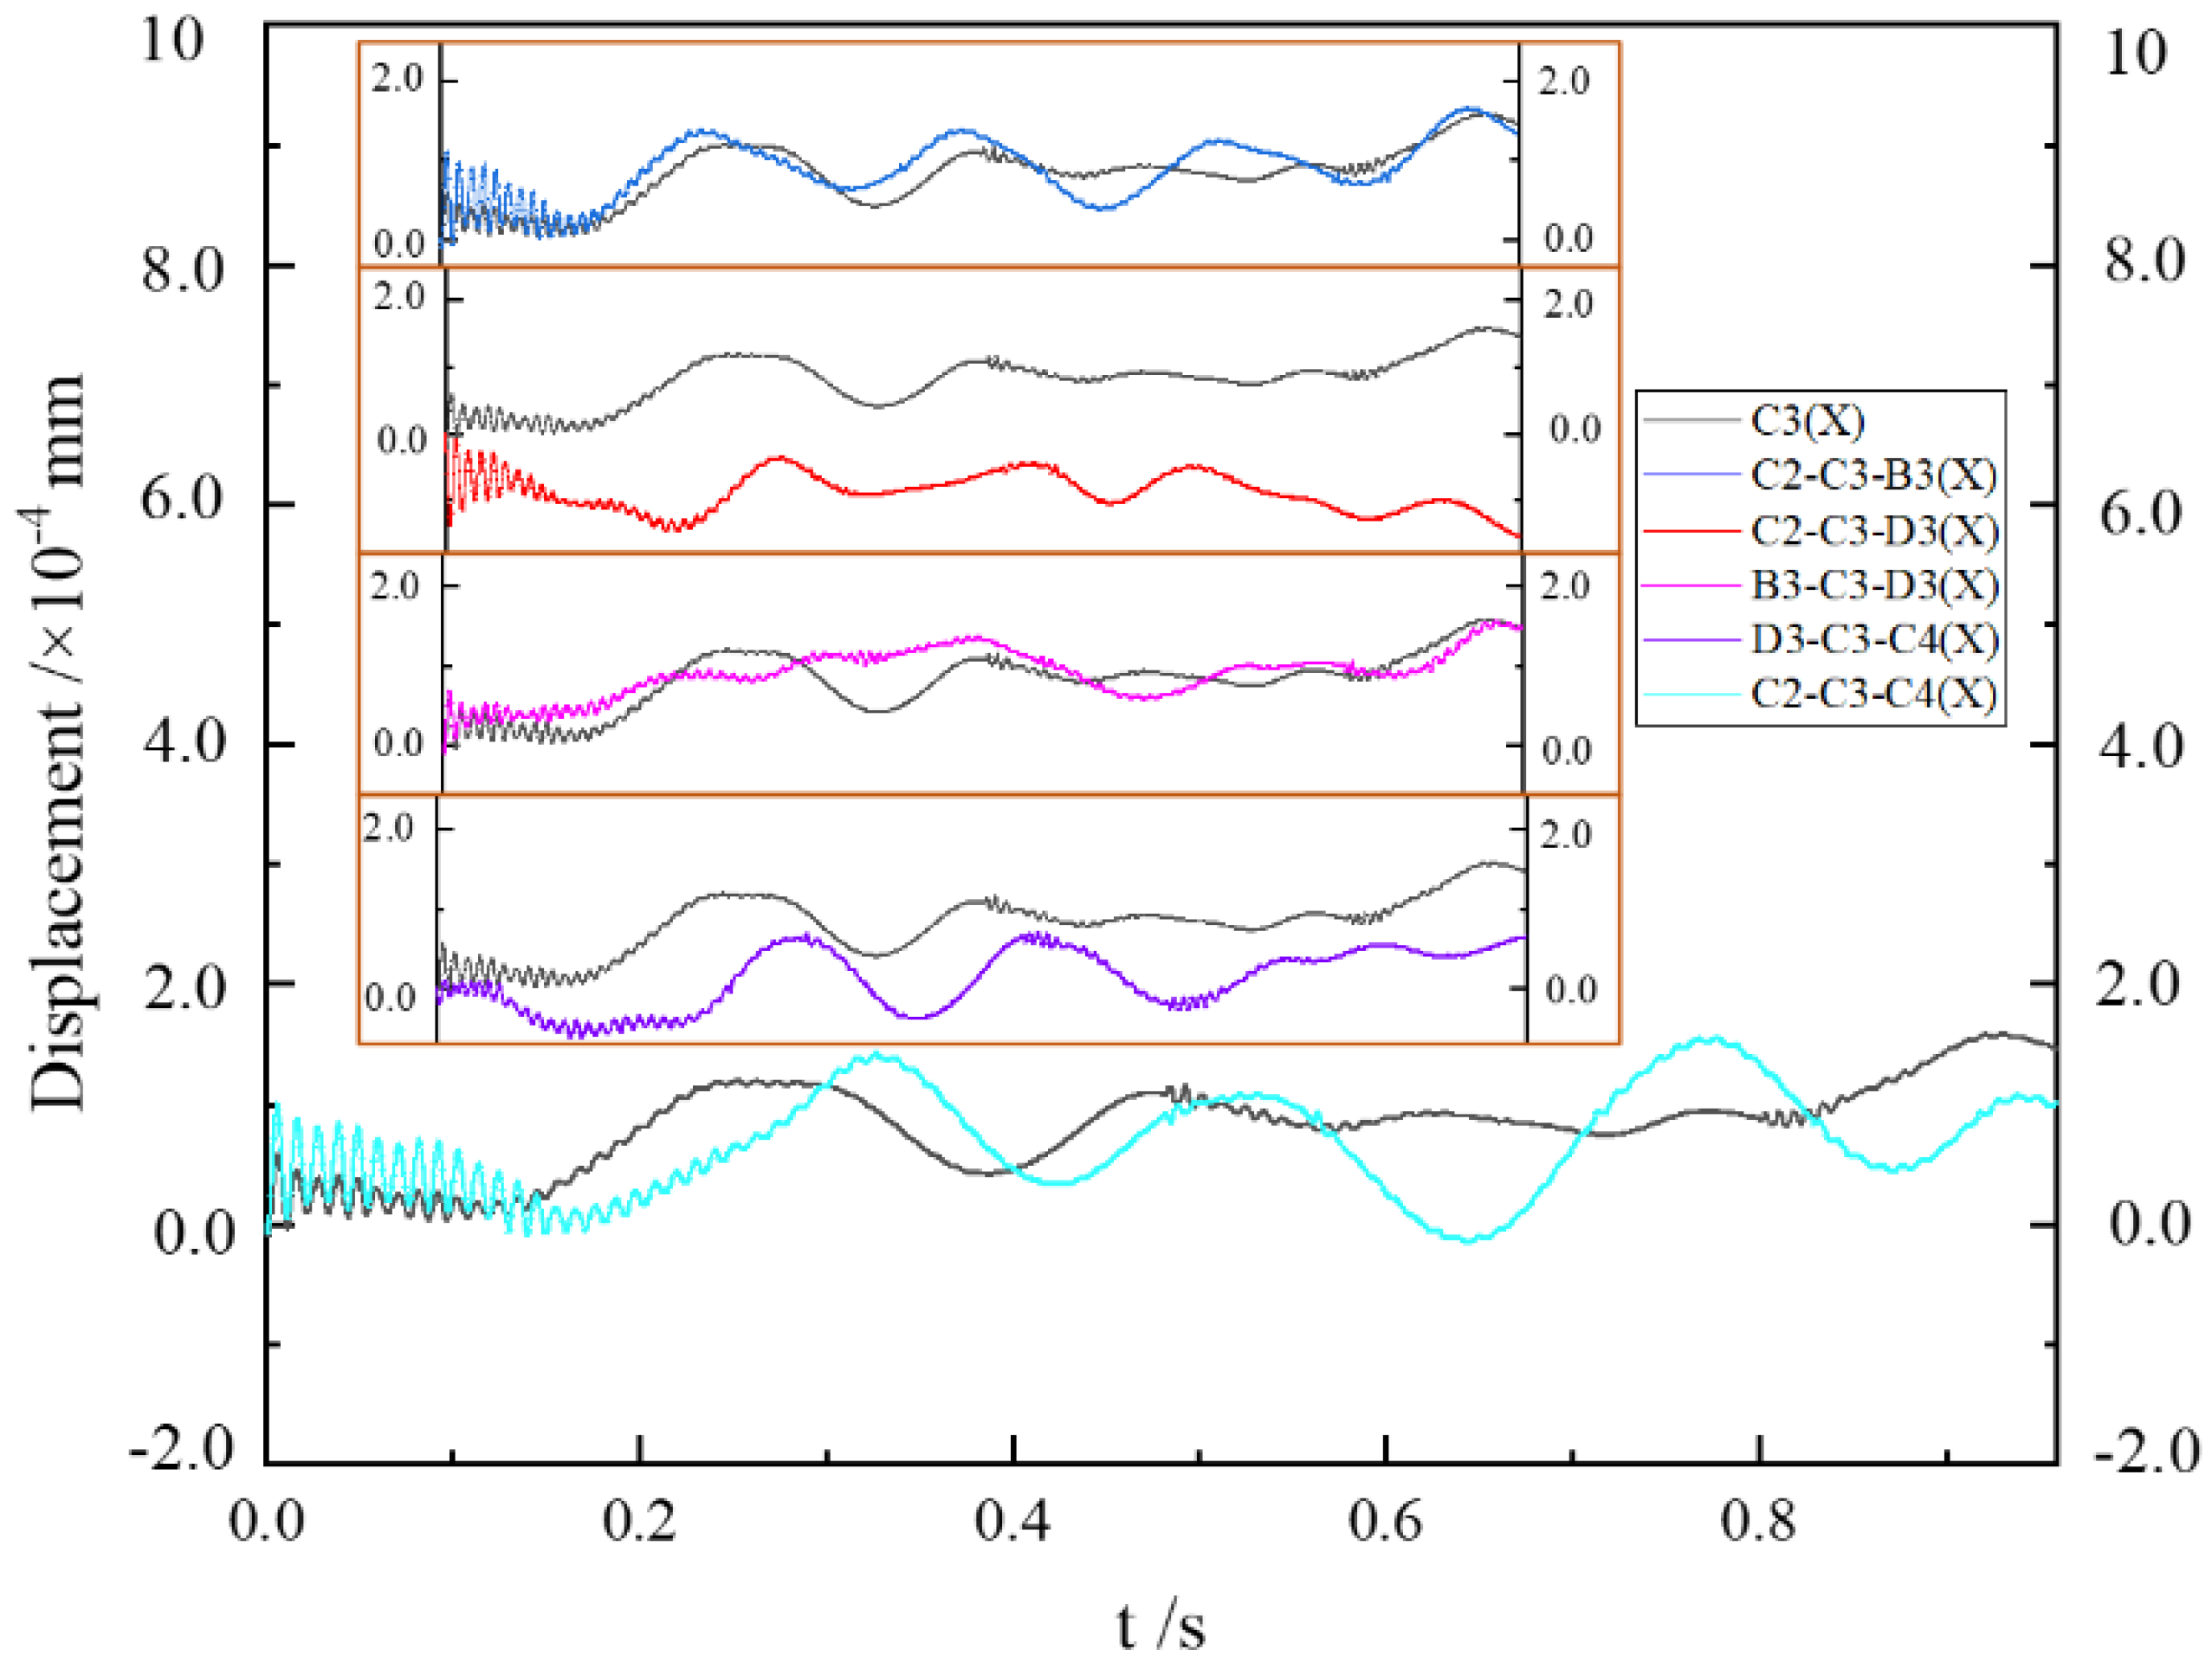
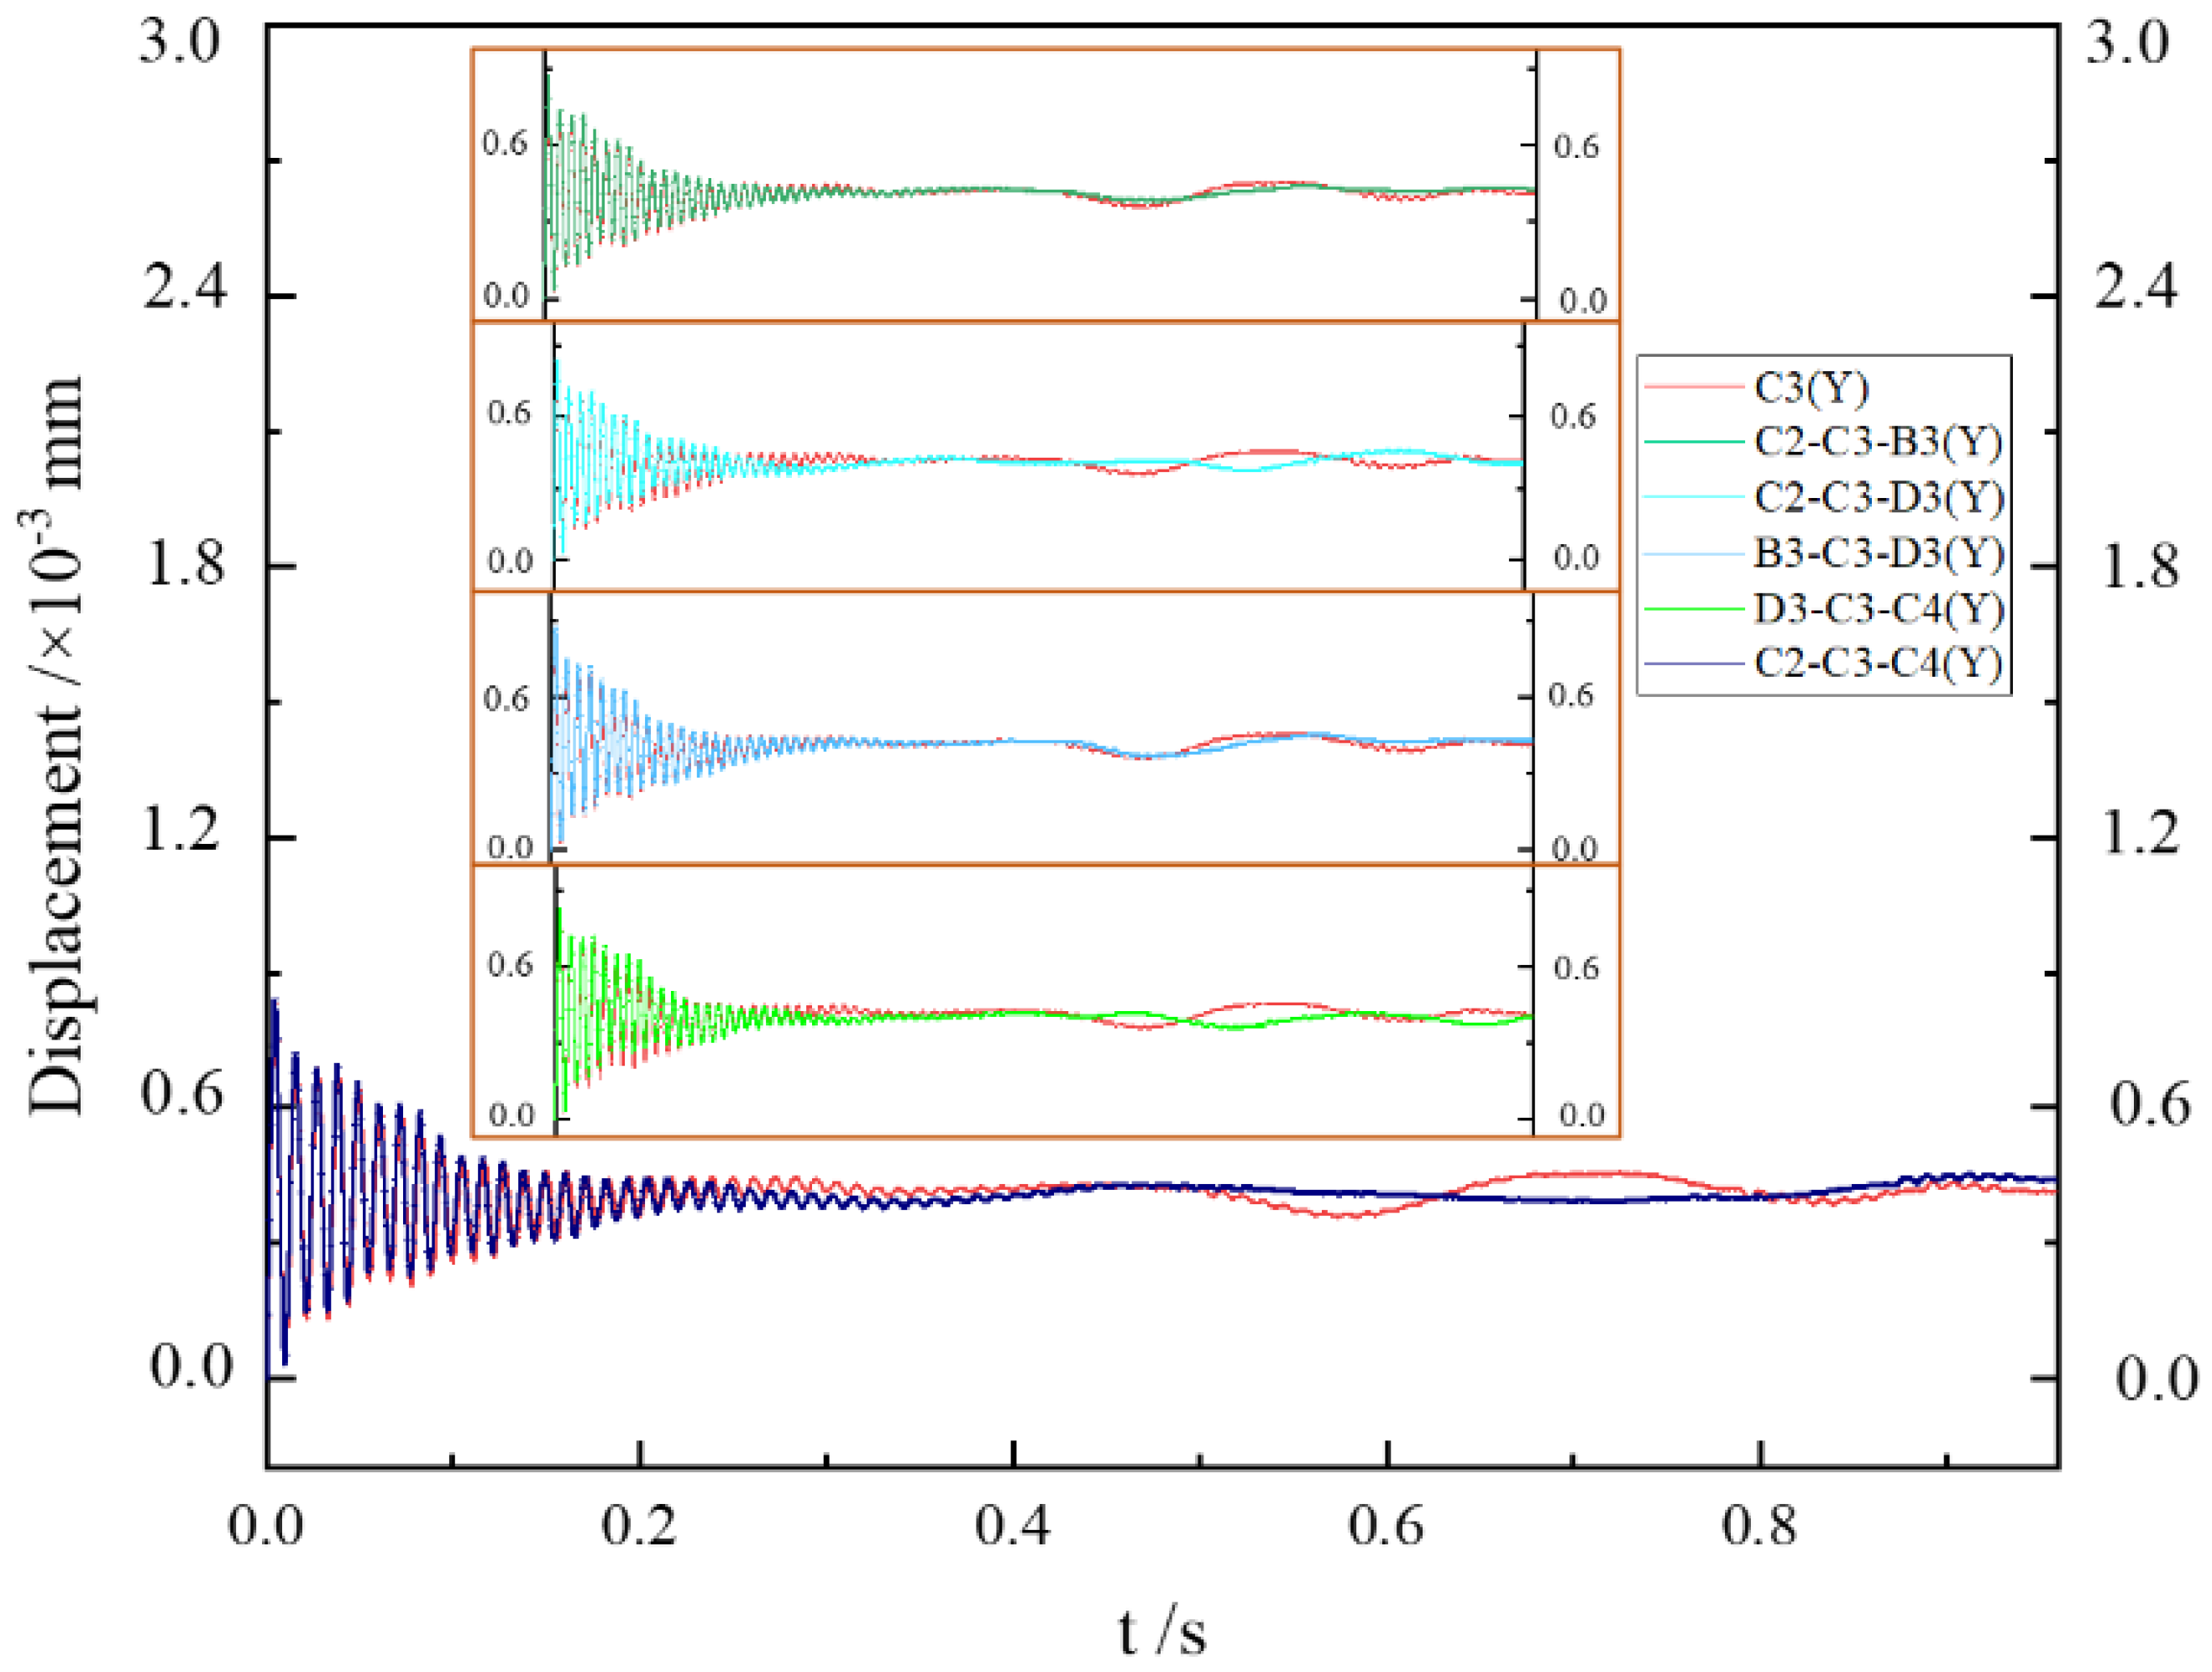
4.3. Influence of Adjacent Tube Vibrations on Target Tube Vibration

To study the influence of the vibration of adjacent tubes in helical tube arrays on the vibration response of the target tube, which is based on the three-order modes superposition coupling algorithm proposed in this paper, three adjacent tubes were set up in the tube arrays according to the different positions of the helical tubes. The three helical tubes vibrate at the same time, in which the C3 tube is the target tube, and the follow-up research mainly focuses on the target tube. The setting of the vibrating tube is shown in Figure 13b–f, including working conditions C2-C3-C4, B3-C3-D3, C2-C3-D3, C2-C3-B3, and D3-C3-C4. The black tube in helical tube arrays indicates that the vibration can vibrate, while the white tube cannot vibrate. The inlet velocity of the tube arrays is set to 0.3 m/s.
The lift and drag coefficient of C3 under different working conditions are monitored and compared. The time-domain distribution of the C3 lift-drag coefficient is obtained. As shown in Figure 14, the RMS of the lift-drag coefficient of C3 under different working conditions has different changes compared with the self-excited vibration of C3 in tube arrays.
Compared with the vibration of only three tubes and one tube of C3 in the helical tube arrays, it can be seen from Figure 14 that for D3-C3-C4 and C2-C3-C4, when the corresponding multiple tube arrays vibrate at the same time, the lift and drag fluctuation of C3 is weakened. The corresponding radial vibration displacement under this working condition is reduced by 55.9% and 10.7%, and the axial displacement is reduced by 2.2% and 0.6%, respectively, as shown in Figure 15. For B3-C3-D3, C2-C3-D3 and C2-C3-B3, respectively, when the corresponding multiple tube arrays vibrate at the same time, they all increase the fluctuation of the lift and drag of C3, which causes the radial displacement to increase by 6.8%, 2.4%, 8.8% respectively, and the axial displacement is increased by 1.1%, 0.1%, and 1.3%, respectively. As shown in Figure 16 and Figure 17, the radial and axial displacement responses of these working conditions are also compared. It can be concluded that when three adjacent helical tubes vibrate at the same time, B3-C3-D3, C2-C3-D3, and C2-C3-B3 enhance the vibration of C3 in the direction of lift and drag, while C2-C3-C4 and D3-C3-C4 weaken the vibration of C3 in the direction of lift and drag to varying degrees.

5. Conclusions

In this paper, a three-order modes superposition coupling method based on CFD/CSD is proposed, and the method is used to study the FIV of 3D helical tube arrays. Through the modal analysis and FIV response analysis of the helical tube, the following conclusions are obtained:
(1) When the FIV occurs in the helical tube, its amplitude is mainly axial vibration. With the increase of flow velocity, the increase rate of axial vibration amplitude decreases gradually, and the vibration period decreases gradually.
(2) Compared with a single tube, the helical tube in the tube arrays has a shear layer near the wall and directly adheres to the target tube, then falls off and forms a counter vortex in the wake region. However, due to the influence of the downstream helical tube, it does not develop into a Karmen vortex street. Therefore, the existence of adjacent tubes weakens the impact of fluid on the target tube, and obviously weakens the vibration of the target tube.
(3) When adjacent tubes vibrate, the vibration response of the target tube will be affected. The vibration of adjacent tubes changes the balance position of the target tube vibration. In the FIV analysis of helical tubes, the influence of adjacent tubes needs to be considered.
The three-order modes superposition coupling algorithm based on CFD/CSD proposed in this paper only considers the first three natural frequencies and vibration modes of the helical tube, and does not take more modes into account in the helical tube vibration equation. Therefore, the algorithm proposed in this paper will be optimized in the future. In this paper, the relevant research work was only carried out in single-phase fluid water. In the follow-up, different fluid media can be studied, including two-phase flow and whether phase transition occurs. This paper mainly studies the flow-induced vibration characteristics of helical tube bundles under multi-order mode superposition, and the influence of adjacent tubes on the vibration of target tubes has been determined. It can be estimated that the current observations provide a basis and reference for the design and application of spiral tube steam generators.

Author Contributions

Conceptualization, Z.D. and X.B.; methodology, Z.D.; software, D.T.; validation, Z.D., Y.Z. and D.T.; formal analysis, Z.D. and Y.Z.; investigation, X.B. and J.Y.; resources, Z.D. and D.T.; data curation, X.B. and Y.Z.; writing—original draft preparation, Y.Z. and D.L.; writing—review and editing, Y.Y. and D.L.; visualization, X.B. and Y.Z.; supervision, D.T.; project administration, Z.D.; funding acquisition, Z.D. All authors have read and agreed to the published version of the manuscript.

Funding

This work was funded by the National Natural Science Foundation of China (Grant Nos. 52175279, 52175194, 52105215, 52075047), Natural Science Foundation of Zhejiang Province (LY20E050022), Zhejiang Province Welfare Technology Applied Research Project (Grant Nos. LGG20E050017, LGG20E050017), and Fundamental Research Funds for the Provincial Universities of Zhejiang (Grant No. RF-A2019008).

Conflicts of Interest

The authors declare no conflict of interest.

References

  1. Weikl, M.; Braun, K.; Weiss, J. Coil-wound heat exchangers for molten salt applications. Energy Procedia 2014, 49, 1054–1060. [Google Scholar] [CrossRef]
  2. Reyes, J.N., Jr. NuScale plant safety in response to extreme events. Nucl. Technol. 2012, 178, 153–163. [Google Scholar] [CrossRef]
  3. Hoffer, N.V.; Anderson, N.A.; Sabharwall, P. Development and transient analysis of a helical-coil steam generator for high temperature reactors. J. Young Investig. 2011, 22, 40–50. [Google Scholar]
  4. Kim, E.K.; Kim, S.O. Sodium-Cooled Fast Reactor Helical Coil Steam Generator. In Proceedings of the Transactions of the Korean Nuclear Society Autumn Meeting, Jeju, Republic of Korea, 21–22 October 2010; p. 47. [Google Scholar]
  5. Connors, H., Jr. Fluid elastic vibration of tube arrays excited by cross flow. In Proceedings of the ASME Symposium on Flow-Induced Vibration in Heat Exchanger, Winter Annual Meeting, New Orleans, LA, USA, 9–14 December 1970; pp. 42–47. [Google Scholar]
  6. Tan, W.; Wu, H.; Zhu, G. Investigation of the Vibration Behavior of Fluidelastic Instability in Closely Packed Square Tube Arrays. Trans. Tianjin Univ. 2018, 25, 124–142. [Google Scholar] [CrossRef] [Green Version]
  7. Qing-Lei, J.; Ji-Yun, Z.; Xian-Yuan, W. Analysis of Fluid-Induced Excitation Forces in Triangular Tube Arrays Based on the LES Method. In Proceedings of the 2013 21st International Conference on Nuclear Engineering, Chengdu, China, 29 June–2 August 2013. [Google Scholar]
  8. Jo, J.C.; Jhung, M.J. Flow-induced vibration and fretting-wear predictions of steam generator helical tubes. Nucl. Eng. Des. 2008, 238, 890–903. [Google Scholar] [CrossRef]
  9. Yuan, H.; Solberg, J.; Merzari, E.; Kraus, A.; Grindeanu, I. Flow-induced vibration analysis of a helical coil steam generator experiment using large eddy simulation. Nucl. Eng. Des. 2017, 322, 547–562. [Google Scholar] [CrossRef]
  10. Lee, S.; Delgado, M.; Hassan, Y. Experimental investigation of the isothermal flow field across slant 5-tube bundles in helically coiled steam generator geometry using PIV. Nucl. Eng. Des. 2018, 338, 261–268. [Google Scholar] [CrossRef]
  11. Delgado, M.; Hassan, Y.A.; Anand, N.K. Experimental flow visualization study using particle image velocimetry in a helical coil steam generator with changing lateral pitch geometry. Int. J. Heat Mass Transf. 2019, 133, 756–768. [Google Scholar] [CrossRef]
  12. Lv, J.; Wang, F.; Guo, L.; Liu, Z. CFD/CSD approach to predict hypersonic aerothermoelastic response of a wing. Procedia Eng. 2015, 126, 123–127. [Google Scholar] [CrossRef] [Green Version]
  13. Chung, H.; Cao, S.; Philen, M.; Beran, P.S.; Wang, K.G. Cfd-csd coupled analysis of underwater propulsion using a biomimetic fin-and-joint system. Comput. Fluids 2018, 172, 54–66. [Google Scholar] [CrossRef]
  14. Carrión, M.; Steijl, R.; Woodgate, M.; Barakos, G.; Munduate, X.; Gomez-Iradi, S. Aeroelastic analysis of wind turbines using a tightly coupled CFD–CSD method. J. Fluids Struct. 2014, 50, 392–415. [Google Scholar] [CrossRef]
  15. Ma, L.; Zhao, Q.; Zhao, M. Computation analyses of aeroelastic loads of rotor based on CFD/CSD coupling method. J. Aeronaut. 2017, 38, 53–66. [Google Scholar]
  16. Tang, D.; Bao, S.; Luo, L.; Zhu, H.; Cui, H. A CFD/CSD coupled method with high order and its applications in flow induced vibrations of tube arrays in cross flow. Ann. Nucl. Energy 2019, 130, 347–356. [Google Scholar] [CrossRef]
  17. Zou, Q.; Ding, L.; Wang, H.; Wang, J.; Zhang, L. Two-degree-of-freedom flow-induced vibration of a rotating circular cylinder. Ocean Eng. 2019, 191, 106505. [Google Scholar] [CrossRef]
  18. Ma, Y.; Luan, Y.; Xu, W. Hydrodynamic features ofthree equally spaced, long flexible cylinders undergoing flow-induced vibration. Eur. J. Mech./B Fluids 2020, 79, 386–400. [Google Scholar] [CrossRef]
  19. Guo, K.; Xu, W.; Jia, Z.; Tan, W. Investigation of Fluid-Elastic Instability in Tube Arrays at Low Mass Damping Parameters in Cross-Flow. J. Press. Vessel. Technol. 2020, 142, 011401. [Google Scholar] [CrossRef]
  20. Hai, B.S.Z.; Di, T.; Wei, Y.; Xipeng, H. Numerical simulation of coupled vibration between heat transfer tube bundles under the lateral action of single-phase fluid. Nucl. Power Eng. 2020, 243, 120–124. [Google Scholar]
  21. Achenbach, E. Distribution of local pressure and skin friction around a circular cylinder in cross-flow up to Re = 5 × 10⁶. J. Fluid Mech. 1968, 34, 625–639. [Google Scholar] [CrossRef]
  22. Lee, S.J.; Hassan, Y.A. Numerical investigation of helical coil tube bundle in turbulent cross flow using large eddy simulation. Int. J. Heat Fluid Flow 2020, 82, 108529. [Google Scholar] [CrossRef]
  23. Duan, R.-Q.; Jiang, S.-Y. Numerical investigation of gas flow distribution and thermal mixing in helically coiled tube bundle. J. Nucl. Sci. Technol. 2008, 45, 704–711. [Google Scholar] [CrossRef]
  24. Tang, D.; Bao, S.; Lv, B.; Cui, H.; Luo, L.; Xu, M. Investigation of shedding patterns and its influences on lift performances of a cylinder bundle in cross flow. J. Mech. Sci. Technol. 2019, 33, 2651–2663. [Google Scholar] [CrossRef]
  25. Ni, W.; Zhang, X.; Xu, F.; Zhang, W.; Kang, Z. Numerical investigation of bifurcation characteristics under perturbations in vortex induced vibration of cylinder with two degrees of freedom. Ocean Eng. 2019, 188, 106318. [Google Scholar] [CrossRef]
  26. Bao, S.; Zhu, H.; Tang, D.; Yuan, W.; Huang, X. Numerical Simulation Research on Coupling Vibration of Heat Transfer Tube Bundles under Lateral Action of Single-Phase Fluid. Nucl. Power Eng. 2020, 41, 111–115. [Google Scholar]
Figure 1. Experimental model of helical tube array [10].
Energies 15 09082 g001
Figure 2. Comparison of the time−averaged pressure coefficient distribution on the tube.
Energies 15 09082 g002
Figure 3. Helical tube array model and its simplified model: (a) Five-layer helical tube array model, (b) simplified to a 8° sector model [22].
Energies 15 09082 g003
Figure 4. Helical tube arrays calculation model.
Energies 15 09082 g004
Figure 5. Grid region division and grid division: (a) CFD simulation domain where the green planes represent the interfaces between each section; (b) overall grid model; (c) grid near the C3 tube.
Energies 15 09082 g005aEnergies 15 09082 g005b
Figure 6. Grid independence verification.
Energies 15 09082 g006
Figure 7. Single helical tube calculation model and grid division.
Energies 15 09082 g007
Figure 8. C3 vibration response.
Energies 15 09082 g008
Figure 9. Plane vortices of Z = 0 near C3 in single tube and tube arrays.
Energies 15 09082 g009
Figure 10. C3 displacement.
Energies 15 09082 g010
Figure 11. Vibration displacement response of C3: (a) axial; (b) radial.
Energies 15 09082 g011
Figure 12. Partial radial vibration displacement response of C3.
Energies 15 09082 g012
Figure 13. Distribution of vibrating tubes: (a) C3; (b) C2-C3-C4; (c) B3-C3-D3; (d) C2-C3-D3; (e) C2-C3-B3; (f) D3-C3-C4.
Energies 15 09082 g013
Figure 14. Comparison of the lift and drag coefficient of C3 in the time domain.
Energies 15 09082 g014
Figure 15. Axial and radial displacement comparison of C3.
Energies 15 09082 g015
Figure 16. Radial displacement comparison of three vibrating helical tubes.
Energies 15 09082 g016
Figure 17. Axial displacement comparison of three vibrating helical tubes.
Energies 15 09082 g017
Table 1. Coefficient deviation under various turbulence models.
ModelDeviation at Maximum Negative CPRange Maximum Deviation
RANS modelk-ε8.12%64.53%
k-ω23.34%40.10%
SST k-ω14.47%26.74%
Transition SST2.51%8.70%
Table 2. Boundary conditions and calculation settings.
ProjectContent
Solution typePressure-based
Solution methodSteady + transient
Turbulence modelTransition SST
Fluid mediumWater
Entrance conditionVelocity inlet
Export conditionPressure outlet
Left and right boundary of flow fieldSymmetry
Tube wallNo slip wall
Table 3. Radial root mean square displacement of the C3 vibration response.
Vinlet/m·s−1TypeRadial Root Mean Square Displacement/mm
0.5Tube arrays4.081 × 10−4
Single tube6.111 × 10−4
Publisher’s Note: MDPI stays neutral with regard to jurisdictional claims in published maps and institutional affiliations.

