1. Introduction
Load monitoring and identification systems make it possible to determine the electricity consumption of individual units of equipment connected to the electrical system of a building. These techniques can generally be grouped into intrusive and non-intrusive monitoring.
In ILM (Intrusive Load Monitoring) systems, energy consumption is measured by installing a transducer on each individual load. ILM systems provide high accuracy but installing sensors on each load is often too complicated and cannot be implemented in an existing plant. This is mainly because of, but not limited to, the space constraints that make it difficult to install transduction and communication systems.
In Non-Intrusive Load Monitoring (NILM) systems, on the other hand, energy consumption is measured at the user connection point. Starting from this measure, the individual contributions relating to each load are obtained by “disaggregating” them.
In this way, the hardware installation is considerably simplified, as it is only necessary to measure voltage and current, or often even only current. However, considerably more complex data processing is required to identify the absorptions of the individual devices.
The energy disaggregation problem can be formulated as in (1):
where
is the measured aggregate signal,
is the contribution of the
loads, and
is the sum of the noise and estimation error.
Hart proposed the first NILM algorithm in 1985 [
1], which used edge detection and clustering for event identification. Hart classifies household appliances according to their different operating states:
- (I)
Electric loads with two operating states (ON/OFF);
- (II)
Electric loads with a finite number of operating states, also called finite state machines (FSM). The switching pattern of these appliances makes it possible for the disaggregation algorithm to identify their operation;
- (III)
Electrical loads with continuously variable power absorption, without a fixed number of states, therefore known as continuously variable devices (CVD). Therefore, it is very difficult to disaggregate this type of equipment from aggregate load measurements;
- (IV)
Electric loads that remain active for days or weeks, consuming energy at a constant rate, and are therefore called “permanent consumption devices” [
2].
Hart’s algorithm was viable in some cases; however, it had limitations in the management of multi-state appliances, as they were managed as a set of distinct ON/OFF appliances. In addition, the continuously variable and permanently consuming equipment could not be detected correctly. NILM systems built on the current knowledge of algorithms represent accurate measurement systems that can be installed both remotely and directly inside electrical panels. The local installation foresees an embedded microcontroller that enables the acquisition and processing of the signals locally. The remote installation, on the other hand, involves the transmission of data to the cloud to be processed and displayed through a dedicated user interface [
2]. In this second case, the system is even less intrusive, as it does not require the installation of a specific NILM system on the electrical system, as it uses the measurements transmitted by the smart energy meter. The NILM function can then be activated without requiring the installation of any specific hardware. The problem with these systems is that the period with which consumption is acquired is of the order of a second, or even more. Disaggregation therefore requires different data processing techniques. As an alternative to “traditional” algorithms [
1,
3], better solutions were proposed by researchers which involve either the measurement of other quantities in addition to the real power or the use of different algorithms [
4,
5]. Machine learning (ML) techniques were also proposed [
6,
7,
8,
9,
10,
11,
12,
13,
14,
15]. ML techniques adopt algorithms that use computational methods to “learn” information directly from available data [
16]. Algorithms based on both supervised and unsupervised learning were proposed. In supervised learning (inside installation), training is performed with labeled data, that is, with input data whose outputs are known. In other words, the training data must include examples of the aggregate power (or current) drawn and the relative power (or currents) drawn by individual loads. Some supervised training systems classify events by processing the spectrogram of the aggregate absorbed current [
17] or by analyzing generic appliance models on specific appliance instances using the load signatures extracted from the aggregate current [
18]. On the other hand, unsupervised training-based approaches (remote installation) eliminate the need for prior knowledge of loads. These systems process sequences of real power measurements measured at low sampling rates [
9]. Recent algorithms are based on source separation through non-negative tensor factorization, hidden Markov models and hidden factorial Markov models [
9,
10,
11,
12,
13]. These techniques learn individual appliance patterns following a training period based on synchronous measurements of aggregate power and measured power at the appliance level. Based on the number of appliances to be recognized, these systems will have different state space sizes to estimate. Hence, the computational overload is directly related to the complexity of the model.
Deep Learning (DL) is a type of ML that provides computers with the ability to perform human-like tasks, such as forecasting, speech recognition, or image identification. In DL applications, algorithms are used that are based on layered models called Artificial Neural Networks (ANN) [
19,
20,
21,
22].
In recent years, many characteristic limitations of NILM systems were overcome thanks to the use of DL algorithms that allow such monitoring systems to adapt to “unseen” houses in the training phase. DL algorithms have also led to advances in accuracy. The initially proposed algorithms based on the Factorial Hidden Markov Models [
12,
17], which once represented the state-of-the-art of these systems, were replaced by models based on convolutional neural networks [
23]. The possibility of avoiding training on specific users is obviously a fundamental aspect, as it significantly reduces activation times and costs. In some applications, which adopt systems capable of recognizing a wider range of devices, a short training phase is accepted [
5]. In other cases, more than the consumption profile, it is necessary to detect the real-time status of the loads [
24].
An important aspect of NILM systems, in addition to the implementation of algorithmic systems, is linked to the application field of these technologies [
25]. Having access to information relating to the energy consumption of individual appliances can help consumers achieve greater awareness of the costs of their bills, which potentially results in a self-correction of their behavior in order to gradually avoid energy waste [
26,
27]. However, the potential applications of NILM systems in residential and industrial settings go beyond the recommendations aimed at energy saving. Energy disaggregation can also be used in the management of Smart Grids to monitor the loads connected to a distributed network and predict consumption peaks [
28,
29,
30,
31,
32,
33,
34,
35]. This allows the electricity distribution body to propose discount offers or tariff programs based on consumer habits. An interesting application is to extend NILM systems to the substation level. This provides operators with a convenient way to understand the status of the network, improving the efficiency of demand-side management [
36]. A well-designed NILM system may be able to provide timely alarms that allow the user to prevent dangerous failures of their devices [
37,
38,
39,
40,
41,
42,
43,
44,
45,
46,
47,
48]. Finally, NILM systems and the consumption profiles of the individual household appliances that derive from them were proposed for monitoring the Activities of Daily Livings (ADL) in order to serve Ambient Assisted Living (AAL) systems [
49,
50,
51,
52,
53,
54]. Human activity can be deduced from modeling the use of household appliances, as they are strongly linked to daily activities.
In this work, some possibilities for integrating NILM systems into the applications that were introduced above are shown. Our contributions are summarized as follows. First an analysis of the state-of-the-art NILM technologies is presented, critically illustrating the advantages and disadvantages of the different solutions and implementation contexts. Then, various applications of these systems are analyzed, both in the industrial and residential sectors, illustrating their advantages in different contexts.
The rest of the article is structured as follows.
Section 2 will detail proposals for energy management systems (EMS) that implement NILM systems.
Section 3 will introduce the problem of Demand Response (DR) in distribution networks and illustrate the main works in which, through NILM systems, the most significant benefits were obtained.
Section 4 will focus more attention on the possibility of using energy disaggregation systems for the detection of anomalies and malfunctions, while
Section 5 will analyze the proposed use of these systems for the detection of ADL. Finally,
Section 6 will report the conclusions and final remarks.
2. NILM for Energy Management Systems
An EMS allows the user to measure and control the use and production of energy within a plant. Due to the benefits offered to both the consumers and distributors of electricity, EMSs are becoming increasingly important for reducing consumption. The most demanding sector, from the point of view of electricity consumption, is represented by buildings, which consume 40% of the total primary energy [
26]. Studies have shown that the potential bill savings for consumers who are provided with detailed information on the individual consumption of their devices can exceed 12% [
27]. An EMS first and foremost analyzes the electrical energy consumption of appliances in order to schedule their use. In addition, it manages the flow of electrical power from renewable sources and storage when they are locally available.
2.1. EMS for Smart Homes and Microgrids
NILM techniques allow for the real-time detection of devices that are active. They can be used within EMSs, providing information on the electrical consumption of individual appliances. To apply these techniques advantageously, it is firstly important to classify the load devices on the basis of the programmability or, otherwise, of their use. The former are devices whose operation cannot be delayed (e.g., lighting, kitchen, or refrigerator). The latter devices can operate in variable time intervals based on the price of energy (e.g., washing machines and dryers). Heating, Ventilation, and Air Conditioning (HVAC) systems are particularly important to this aim.
The EMS allows you to program the switching on of appliances, giving higher priority to appliances that have a higher energy consumption. In addition to power consumption, the switching times, operating range, and frequency of use for each class of equipment are important parameters for load management. These parameters are provided by NILM systems. In [
28,
29], the reduction in the cost of electricity is achieved by formulating the problem as a minimization problem, taking into account the scheduling flexibility of household appliances by consumers. The results show that the system can reduce the cost of energy for consumers in a meaningful way. These load scheduling techniques facilitate the time shift of existing loads in off-peak periods, so costs are minimized.
Çimen et al. [
30] propose an NILM-based EMS to manage the operation of household appliances, in coordination with renewable sources and batteries within a residential microgrid. Residential grids include energy storage systems, some distributed generation units and one or more homes. These electrical systems can be used both in connected mode and in stand-alone mode, thanks to their flexible structure.
Figure 1 shows the structure of the proposed microgrid.
On the power supply side, the energy sources include the public grid, a photovoltaic system, a wind turbine, and an energy storage system unit. Each system is managed by a microcontroller, through the information obtained from a NILM system, such as appliance activations, turn-on and turn-off times, power absorbed in the various operating conditions, and periods preferred by the user. The system optimizes the energy supplied by renewable source plants by minimizing the absorption of electricity from the grid.
In [
31], Xia et al. propose an EMS that allows minimization of the cost of domestic electricity while satisfying the needs of comfort and safety. The system consists of a first module called the Solar Energy Management System which maximizes solar energy utilization, and a second module called the Appliances Scheduling System which minimizes the electricity load during peak hours. Using this EMS, the running time of the appliance is automatically programmed based on considerations concerning the preferences of the family, the day-ahead electricity price, and the historical data of electricity use. At the same time, the system uses the photovoltaic system and the storage systems in order to consume the minimum amount of energy from the grid. In the two subsystems that make up the EMS, a smart meter is used to collect the reading of the household’s overall energy consumption and transmit it to the energy disaggregation module.
The framework modules, shown in
Figure 2, are described below.
Energy generation prediction module: this module generates a forecast based on historical meteorological data for the considered position.
Solar energy management module: this module controls the switch starting from the output of the previous block, the state of the battery, and the price of electricity. The various loads can be powered by both the solar system and the electricity grid; therefore, the system will include a controlled switch capable of connecting both power sources by absorbing energy from one or the other source. Therefore, this module optimizes the use of the collected solar energy. When the photovoltaic energy production exceeds the load demand, the photovoltaic energy is used as a priority, and the surplus energy is stored in the storage system. Only in the event that the photovoltaic energy (generated during the day or stored during the night) is not sufficient to support all the appliances in operation, does the system absorb energy from the grid.
Energy disaggregation module: in order to implement efficient programming, the EMS should be aware of the details of the runtime of each device to deduce the activities of users on an average day. The preferences and habits of users are deduced on the basis of this detailed information at the appliance-level by imposing a certain level of priority, so as not to upset their routine too much. Therefore, to obtain appropriate planning strategies for a certain household, the consumption patterns of each appliance are key information.
Classifier module: this module is designed to discriminate between the programmable and non-programmable devices. The classification process is based on various parameters such as the flexibility and user preferences for each device. Initially, the classification module generates a profile of user preferences, preset according to the varied devices and historical data.
Appliances scheduling module: this module classifies appliances as programmable or non-programmable and is responsible for programming the start time of programmable ones.
2.2. NILM Systems in EMS
The optimal scheduling of appliances is traced back to an optimization problem, formulated as (2), solved through dynamic programming algorithms to search for sequences of states of each appliance that lead to a lower cost of electricity at the end of the day:
where cost is the sum of the costs of the energy absorbed by the grid,
N is the number of schedulable appliances,
is a set of discrete time intervals over a whole day (configurable by each user), and
is the price of electricity over the interval
t.
The problem appears to be a constrained optimization problem since the time intervals that can be taken into consideration in the search for the minimum must be compatible with the information on the user behavior of the appliances, obtained from energy disaggregation.
Each appliance is characterized by a working mode m which is associated with both a specific power absorption, , and a different impact on the result. For example, a dishwasher that performs a wash in eco mode has a reduced energy consumption as it heats less water, but takes longer to finish the cycle, with a consequent impact on user comfort. Therefore, the optimization algorithm must find a working mode that minimizes the cost of the bill while maintaining certain levels of comfort.
To take into account the user’s satisfaction, the parameter
is introduced, which is equal to one when the appliances work in the period preferred by the user and decreases as this period varies. Its distribution model can be changed by a factor ξ, depending on the degree of tolerance.
Figure 3 shows the distribution of user satisfaction as a function of a hypothetical appliance operating time.
The scheduling algorithm must therefore also try to maximize the user’s comfort level. This problem can be formulated as in (3):
where
corresponds to the user satisfaction value, introduced above, at time
for appliance
.
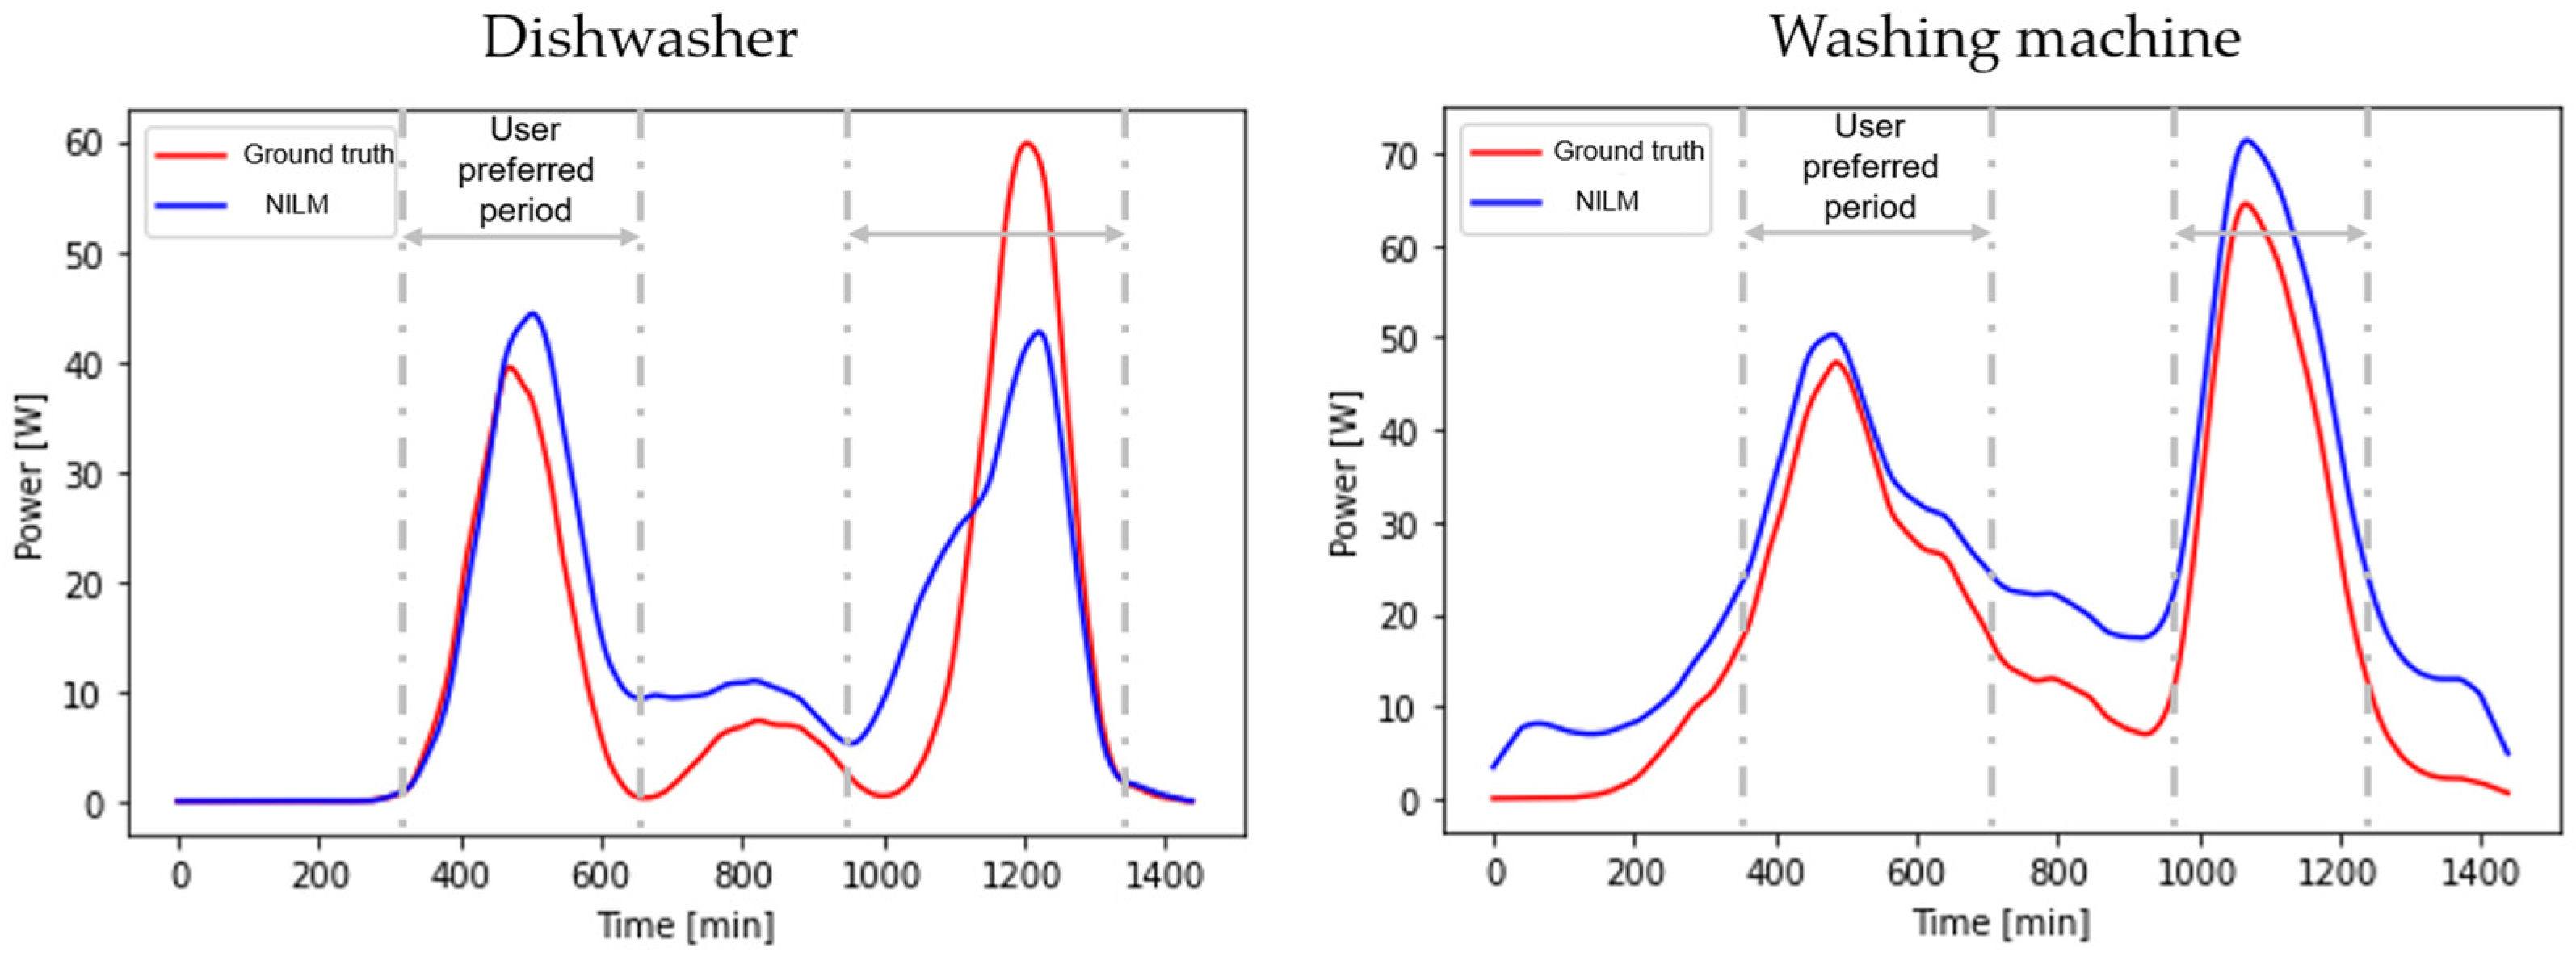
As previously introduced, the parameters necessary for scheduling household appliances can be obtained with the aid of the NILM algorithm. As an example,
Figure 4 shows the power distributions of two appliances over 24 h.
We obtained these distributions by processing the power measurements available from the REFIT dataset [
32], which provides aggregate and appliance-level power metering for several homes over a period of approximately two years. The red curve represents the power distribution, calculated with the power measurements at the appliance level. We obtained the blue curve by processing the corresponding aggregate power signal through an artificial Sequence-to-Point neural network, implemented in accordance with [
23]. Since the REFIT dataset contains aggregated power and power supply data at the appliance level for 21 homes, data from homes that had washing machines and dishwashers were used for training the model. A house not seen during the training phase was therefore chosen to obtain the analysis shown in
Figure 4. The peaks indicate the periods when the device is used most frequently. Therefore, if the appliance is scheduled outside the gray dotted lines, customer satisfaction could be reduced according to the curve in
Figure 3.
Similarly, in [
33] the authors propose a NILM system based not on DL as in [
30], but on Bayesian theory. The proposed system also provides for the scheduling of appliances in order to optimize the power flows in a Smart Home. In [
34] the IoT criteria for implementing an EMS based on NILM are outlined. In particular, the cited work refers to FHMM algorithms, but what was said can also be extended to other approaches such as DL, Combinatorial Optimization, and event-based.
An NILM system serving an EMS must have a high level of disaggregation accuracy; therefore, it must be able to determine, as closely as possible, the energy consumption profiles at the appliance level. It must also be able to provide information on the status (ON or OFF) in which the devices are positioned in order to guarantee correct feedback in scheduling. Comparing EMSs based on NILM with those based on ILM, it is clear that the main drawback linked to the use of NILM systems lies in their lower accuracy in estimating information, as can also be guessed from
Figure 4. In fact, NILM algorithms will always present greater uncertainty in estimating consumption and appliance status compared to intrusive systems. However, the use of NILM systems allows one to obtain the necessary feedback for energy management through a single installation, which represents a significant advantage, especially for those homes that were not born “smart”.
3. NILM for Demand Response in Smart Grids
The spread of energy production plants from non-programmable renewable sources, such as wind and sun, requires greater flexibility of the electricity system, to ensure grid stability. With energy being difficult to store on a large scale, the balance between supply and demand can sometimes be delicate. To meet these needs, active demand management programs are created, ensuring greater flexibility and efficiency in the energy infrastructure.
Demand Response (DR) refers to the active management of energy demand, which involves the modulation of energy demand by commercial and industrial consumers as market conditions change. For example, in Italy this method was introduced by the Regulatory Authority for Energy, Networks and the Environment (ARERA) and is used by the operator of the national electricity transmission grid (Terna). DR mechanisms allow commercial and industrial consumers to respond to market signals by increasing or reducing their energy consumption, with the aim of responding to peaks in the demand or supply of electricity. This allows for greater flexibility and stability of the grid, and more efficient use of infrastructure and energy resources.
As an example of the functioning of the DR, we can consider the following steps.
The network operator foresees a network stability problem and sends a balancing request to the aggregator (i.e., the intermediary between the dispatcher and the end users).
The aggregator notifies its customers of the dispatching.
The customer manually or automatically implements the modulation plan to reduce the load.
The customer receives remuneration in exchange for the dispatch capacity.
The DR solution makes it possible to generate revenue for consumers based on their flexibility. With DR, grid operators can reduce energy consumption at peak times and consequently, the production of additional energy, improving grid stability. The two forms of DR already consolidated are:
DR associated with network interuption tolerance: the consumer voluntarily chooses to reduce their withdrawals from the grid without notice via disconnection in exchange for an economic consideration (the minimum power is 1 MW).
DR linked to multi-hour tariffs: prices change according to the band and day of withdrawal, thus stimulating users to consume energy in moments of lower load and less grid congestion.
There is also a third innovative form of DR:
In addition to large production plants or industrial loads, even users who have residential energy storage systems can offer balancing services to the electricity grid. It is therefore also possible for residential users to actively contribute with their energy storage system, rather than passively with simple connection/disconnection. The end user can choose, based on the opportunities present in the MDS, whether to withdraw or sell, store, or consume energy. To manage the storage system, the aggregator installs a communication and remote-control system.
The Role of NILM in DR Programs
A further step towards an increasingly distributed and sustainable model can be obtained by integrating NILM systems into DR programs aimed at residential users. As already discussed for the EMSs, NILM systems allow the aggregator to know the flexibility parameters of a user, making it possible to formulate an advantageous offer that does not affect the comfort of families.
Lucas et al. [
35] proposed an algorithm for estimating the flexibility of the different electrical loads for DR purposes. The interactions between the actors are shown in
Figure 5.
The request for a DR in a certain time window is reported by the network operator to the aggregator or to the Balance Service Provider (BSP). The BSP evaluates availability and flexibility, on the basis of user data, made available by an NILM system. The BSP interacts with the network operator and subsequently with the users. In particular, the NILM system provides information about the flexibility of users by analyzing the timestamps relating to the operating intervals.
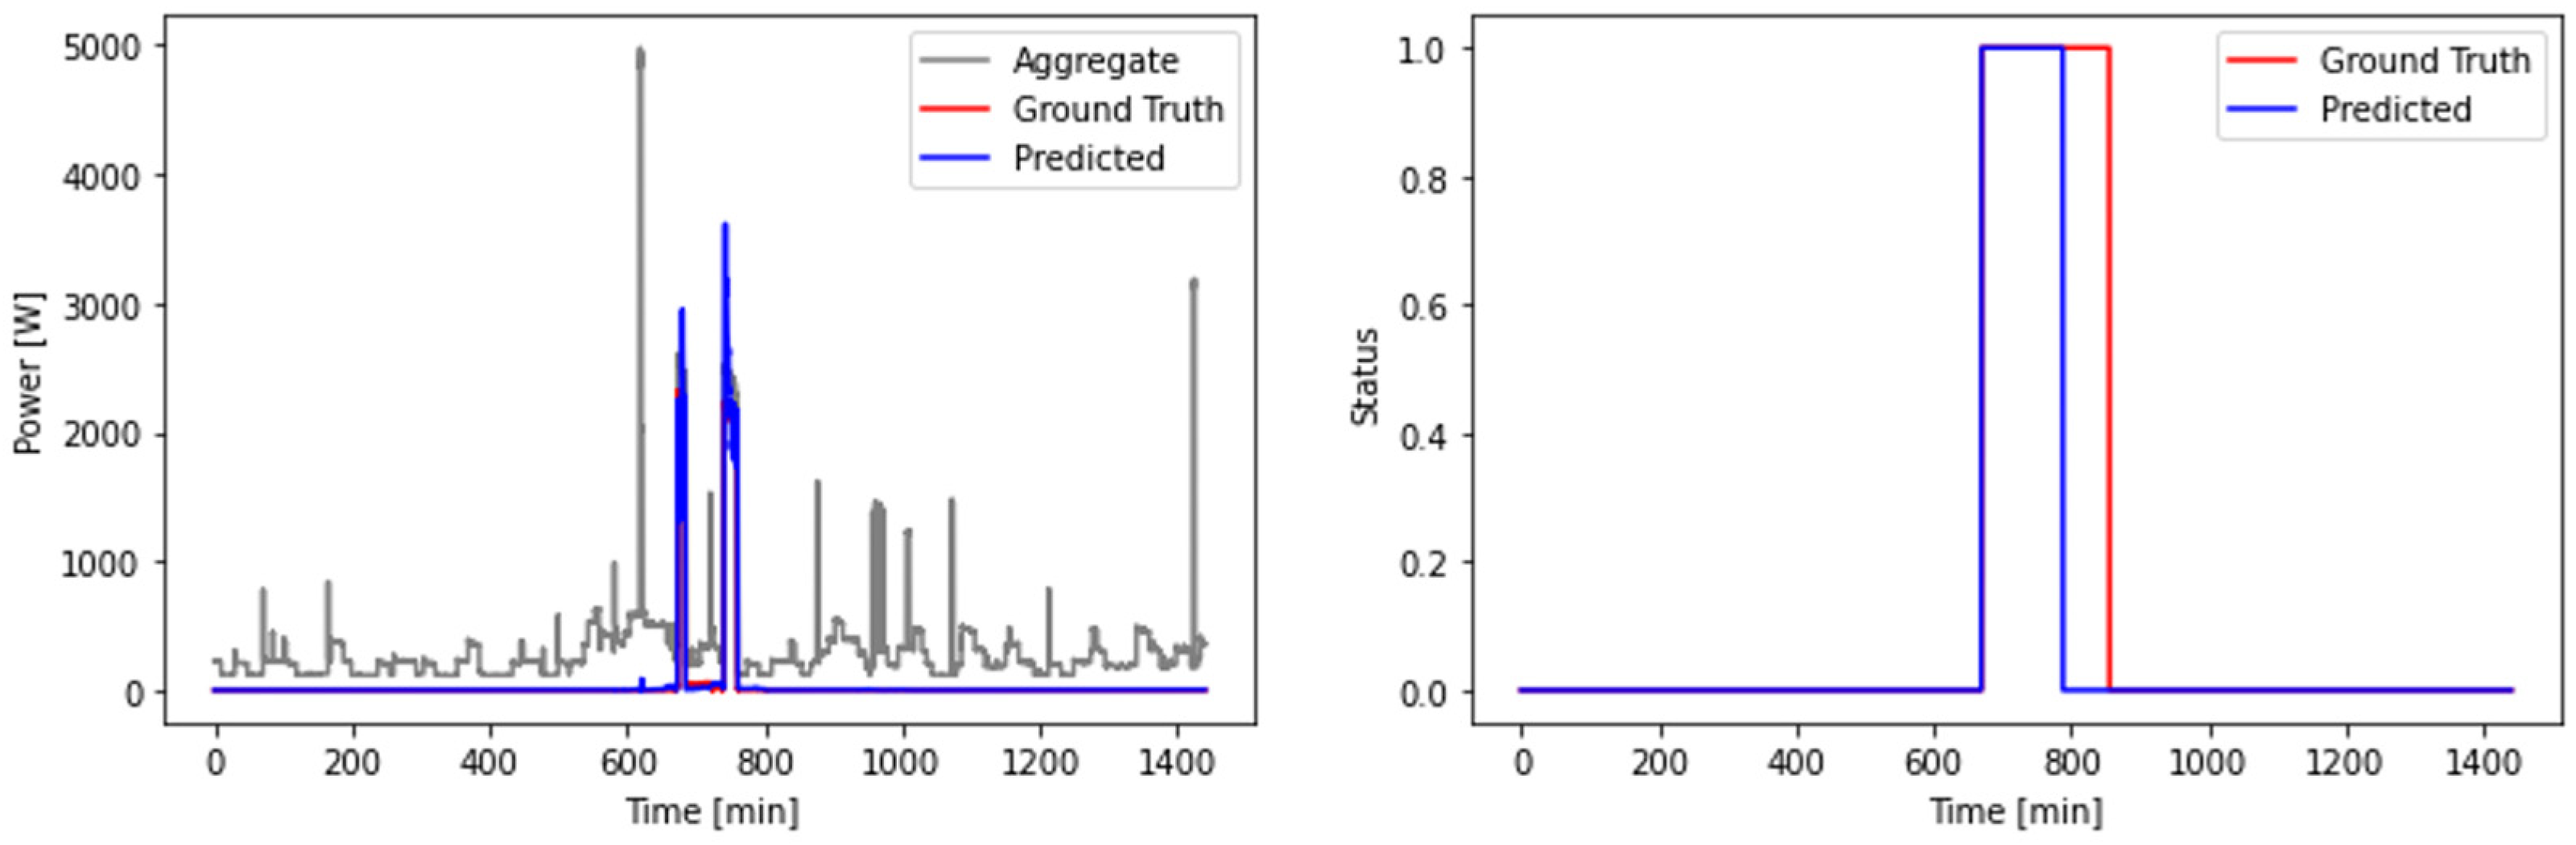
Figure 6 shows an example of the information supplied by an NILM system, obtained in a similar way to that described for
Figure 4. The figure illustrates a case relating to the operating cycle of a dishwasher over a 24 h window. It should be noted that the greater length of the operating cycle, indicated by the actual measurement, is characterized by very low power consumption, which is therefore negligible. In fact, the NILM system in this particular case demonstrates an excellent generalization capability.
The applicability of NILM systems within smart grids was evaluated in [
36]. In particular, the following were evaluated: the opportunity of deferred use of electrical loads during the handling of consumption peaks; the possibility of proposing discount deals or time-of-use pricing programs to incentivize customers to postpone part of their energy demand; and finally, the potential of customers to defer loads.
This study was also conducted using the REFIT dataset [
32]. Since the goal is to simulate a small smart grid, they assumed that the REFIT houses were connected to the same sub-grid, focusing the analyses over a three-month period (April to June 2014). The houses were chosen because, being in the same region of England, they are subject to the same climatic conditions. Therefore, by adding the profiles of total power absorbed by them, it was possible to simulate a smart grid.
In analyzing the total energy consumption in the different days of the week, some interesting trends were noted. Weekends have a higher average energy consumption than weekdays (which is predictable, as occupants leave for work and/or school reasons). The energy consumption profile presents peaks during a 5 h block in the evening from approximately 16:00 to 21:00 and similarly during a smaller 3 h block in the morning from approximately 5:00 to 8:00 (in line with typical school/working hours). Two energy peaks also occur on weekends, with an evening peak from around 16:00 to 21:00 and a peak in the morning from around 7:00 to 11:00. However, although it is lower than in the morning and evening, energy consumption even remains high during the day.
Based on these models, peak and off-peak hours were defined. Peak periods of consumption can increase the risk for the grid, so the goal is to find opportunities to level demand by encouraging customers to change their behavior. The loads that have the greatest advantage in terms of deferral were identified by carefully examining the energy consumption of the various houses and appliances during peaks in energy consumption at the grid level. As previously discussed, appliances such as washing machines, dryers and dishwashers are potentially deferrable appliances, as they do not have a great impact on comfort (i.e., they do not affect lifestyle by changing mealtimes or free time), so attempts are made to postpone these loads at off-peak hours.
Table 1 shows a summary of the power consumption including the total and deferrable loads (dishwasher, washing machine, dryer, etc.) for each home, during peak and off-peak periods, and the consequent potential cost savings. In off-peak periods, no distinction is made between deferrable and non-deferrable loads as there is no need to move them. The analysis in
Table 1 assumes that loads such as dishwashers, washers and dryers are disaggregated through an NILM system, which produces estimates subject to accuracy limits. To this aim, they conducted further analysis on the influence of the accuracy of NILM disaggregation on the total loss of revenue in a variable rate DR program. At the design stage, it is essential to understand how disaggregation inaccuracies affect the estimation of results in DR programs, as this allows decisions to be made that take into account the opportune margin of uncertainty. It is also essential to be able to rely on extremely efficient NILM systems, which allow one to obtain results that are as truthful as possible.
4. Anomaly Detection and Maintenance
As previously discussed, NILM systems continuously monitor the absorption of individual devices connected to the electrical grid. An innovative application is to use these systems to detect anomalies in electrical loads. To accomplish this task, the NILM systems, in addition to estimating the energy consumption of the appliance, must also be able to faithfully determine the power absorption profile over time, which is then analyzed by the anomaly identification systems.
4.1. Anomaly Detection with NILM
In the works [
37,
38,
39], the first NILM systems for the detection of anomalies were proposed. These systems make it possible to identify faults in air conditioners, refrigeration systems, and waste disposal systems powered by autonomous circuits. Rashid et al. [
40] presented a study on the ability of an energy disaggregation system to identify the anomalies of household appliances inside an apartment. The algorithm, based on a Factorial Hidden Markov Model (FHMM), starts from the measurement of the aggregate power supplied by the smart meter and is based on pre-established rules to estimate the type of anomaly and its temporal position.
The study focuses on the analysis of refrigerators and air conditioners, as common, high-consumption, compressor-based appliances. Any failure of the compressor, or of any other part that affects it, is reflected in the profile of absorbed power. Depending on the type of fault, the durations of the ON and OFF conditions differ significantly from the nominal ones, although these deviations could also be due to different causes.
For example, an elongated duty cycle may be due to a clogged air conditioner filter, its incorrect configuration or a failure of the refrigerator door. Similarly, a higher switching frequency between the ON and OFF states can occur, due to damage in the compressor, short circuits, or refrigerant leaks. Appliances such as refrigerators have different absorption profiles depending on the time of day, as shown in the
Figure 7.
Furthermore, a malfunction can result in both higher and lower power consumption. Therefore, using the total daily consumption to estimate anomalies may not be accurate. As can be seen from
Figure 7, both anomalous conditions result in a daily energy consumption higher than that of normal behavior. An observation based solely on daily energy consumption does not explain the type of anomaly, i.e., if there was a problem with an elongated duty cycle or more frequent switching between the ON and OFF state. For these reasons, the authors have proposed an analysis of the average energy consumption taking into account the characteristics of the device; the method is called UNUM. UNUM is an anomaly detection algorithm consisting of a training and a test phase. During the training phase, the statistical model of the device is built, starting from the profile of the power absorbed during normal operation. During the test phase, the input is the profile of the power absorbed by the device during the day, and the algorithm issues indications on the presence or absence of anomalies.
The identification of the ON/OFF states of the compressor occurs through a clustering algorithm known as k-means [
41], which provides two clusters corresponding to the states and the relative power measurements. Note that the power absorbed during the OFF state is not zero because a device can continue to absorb power even when the compressor is OFF.
The time of the power measurements at the extremes that define the single state are identified. From these measurements, we calculate the duration,
, and the energy consumed in each state,
. For both the ON and OFF states, the means of the
and
are calculated, associating them with
and
, respectively. Furthermore, the standard deviation of
, denoted by
, is calculated. During the analysis, it was observed that the air conditioner and the refrigerator draw power differently at different times of the day, which is logical.
Figure 7 shows the signature of the work cycle of the appliance during the day and night, and significant differences are noticed. Therefore, separate models were built: one for the day (06:00–18:00 h) and the other for the night.
The algorithm first takes the data on the power profile absorbed by a device and calculates all the parameters described above. Next, the method described below is used to decide if the profile has anomalies and, if so, what kind of anomalies they are (increased duty cycle or switching frequency):
If an appliance frequently passes from the ON to the OFF state and vice versa, as for “abnormal behavior 2” in
Figure 8, in an ON/OFF cycle, it will consume less energy than in the normal case (presenting, however, a higher consumption in the overall operating time). Therefore, an anomaly associated with “anomalous behavior 2” must be identified as follows:
where
is a control parameter that determines how many standard deviations from the historical profile should be tagged as an anomaly. Intuitively,
n controls the granularity of the anomaly: a small value of n means that an anomaly is flagged if a minor deviation is observed and vice versa.
- b.
If an appliance remains in its ON state for an excessively long period (prolonged work cycle), the energy consumed within a cycle will be greater than normal:
- c.
If an appliance remains on for a prolonged period and remains off for a longer period than normal, this is not an anomaly, because it is a condition that occurs when the appliance is switched on after a long period:
This set of rules allows the UNUM algorithm to indicate the status of the anomaly in an informative way, so as to allow a quick decision-making process on which type of anomaly is present and, since two separate models are used for day and night, in which part of the day the anomaly occurs.
To evaluate the effectiveness of the UNUM algorithm, the data obtained by the NILM system were processed, comparing the results with those obtained by applying the algorithm to the data measured directly on the appliance.
The following metrics were used to indicate the accuracy of both the NILM and anomaly detection systems:
where
represents the power measured at the appliance level for the appliance
and
represents the corresponding estimate provided by the NILM algorithm. The lower the ANE value, the more precise the disaggregation algorithm will be for the appliance
:
With precision, the percentage of true anomalies detected is taken into consideration and compared to the total number of anomalies detected (and therefore alarms triggered). In addition, the percentage of true anomalies detected is maintained and compared to the total number of anomalies (detected or not) and compared to the recall. The higher the F1 score’s value, the more accurate the anomaly detection algorithm will be.
The results showed that a good number of abnormal cases for an appliance can be correctly identified if the ANE is less than 0.1. The choice of the NILM technique is therefore determined by the ANE value achieved for the household appliances of interest.
It was observed that as control parameter n increases in the UNUM algorithm, the recall decreases. This is because, as n increases, observations with a lower standard deviation are treated as normal observations, thus increasing false negative results. At the same time, an increase in makes it less likely that small deviations are considered anomalies, resulting in fewer false positives (and therefore false alarms) and a higher precision value. An accurate choice of the control parameter n based on the trade-off between recall and precision is therefore essential.
4.2. Condition-Based Maintenance
Condition-Based Maintenance (CBM) refers to all those activities aimed at maintenance, which are based on the data collected by monitoring the status of the equipment. This type of maintenance differs from the traditional one, which instead is performed on a scheduled basis or when faults occur. Failure alerts are provided from the collected data to help plan equipment repairs or replacements.
The goal of a CBM system is to detect minor failures and take action before they turn into more dangerous failures. These minor faults are often invisible to operators and therefore require analysis of the electrical power measurement. An NILM system can allow CBM to be an effective tool by detecting and identifying both equipment signatures and their anomalous behaviors. An important feature of these systems is the presence of a user interface that helps the operator make operational decisions in an intuitive way. An NILM system was deployed aboard the United States Navy [
42] to monitor energy and faults in electrical installations with minimal invasiveness, thereby installing a minimum number of sensors to monitor various loads on board. The loads monitored by the NILM Dashboard [
43] are motors, engines, generators, and pumps. The monitored loads are all the ON/OFF type (Type I), with the exception of a diesel purifier, which is an FSM and for which each state is considered separately. The NILM systems installed on ships have two primary objectives: the first is to detect anomalies to improve the functioning of the system, and the second is to give operators better awareness by identifying the operating programs of the equipment. The NILM system used is an event-based system, i.e., a first algorithm is used to detect events, and then an artificial neural network, trained to identify anomalous situations starting from the measurement of active and reactive power on the three phases, is used.
In this way, the NILM system detects all those events that occur as a result of status changes of the various loads, thus acquiring knowledge on the operating programs of the individual equipment.
More specifically, there are five parameters for diagnostics:
The active and reactive power absorbed in stationary conditions;
The power factor;
The time between activation and shutdown, indicated as Average Run Duration;
The total time in which the equipment is operational over 24 h, indicated as the Total Run Time;
The number of discrete operations per day, indicated as Daily Actuations.
These metrics help detect degradation in equipment material, such as that which occurs from mechanical wear and corrosion. The wear of a motor bearing can be reflected as a change in power consumption [
44], while corroded heaters could be reflected as a change in power factor. The NILM system monitors heaters and pumps which are controlled by automatic closed-loop systems based on thermostats or tank-level sensors. Therefore, the Daily Actuations, total run time and average run duration are also useful in identifying sensor and automation failures that could cause too frequent stimulation or insufficient operation. In fact, a failed thermostatic controller or a broken tank indicator can cause excessively long or repeated periods of equipment activation [
45]. However, it is important to note that frequent pump activations or even a single long activation are not necessarily cause for alarm. This is taken into consideration by monitoring the 24 h average of the Average Run Duration, power, and power factor parameters, and taking into account the Daily Actuations and Total Run Time. The 24 h evaluation prevents false alarms following brief anomalies. Depending on whether the loads are activated less or more frequently, stricter controls are necessary, so the period can be easily adjusted for various applications.
In [
46], techniques were presented to identify progressive failures starting from measurements obtained through a NILM system and provide analysis of vibrations, materials, and the analyzed electrical signatures. In the work presented in [
38], performances obtained using FHMM are shown, and in [
47] the authors propose a similar system for the detection of anomalies on the consumption patterns of household appliances, but instead based on an autoencoder.
The CBM parameters described above are communicated on the NILM dashboard through diagnostic indicators divided into three levels of signaling, namely, healthy operation, fault warning, and definitive fault alarms, as shown in
Figure 9. Establishing the correct threshold for each region of the indicators is critical in order to be usable by the ship’s crew. Several techniques were proposed to determine the failure thresholds related to industrial applications. In [
48], the authors proposed a statistical process control (SPC) method, where an NILM system collects data that are used for SPC analysis. The deviation in parameters from historical data is an indication of a possible failure. SPC allows for the exact determination of when a deviation should determine a fault warning and how much deviation is acceptable. The system defines a center line, a lower control limit (LCL), and an upper control limit (UCL). If a parameter reaches the lower or upper control limits, warnings are issued. SPC analysis defines the center line as the arithmetic mean of the various parameters considering a standard normal distribution for each parameter. In this application, a normal distribution does not adequately fit the data. The best results are obtained using a Weibull distribution, typical of many machinery reliability applications [
48].
An interesting consideration is that if an operator knows that some piece of equipment should be in operation, but the NILM-based CBM system shows no activity, i.e., the daily actuations have dropped to zero, there is evidence of a failure. This can happen for several reasons and is not necessarily indicative of equipment failure. First, it could indicate a complete failure of some piece of equipment. Second, it could be due to a broken sensor, as a result of which the load does not turn on, even when it should. Alternatively, it could be due to a degraded part of the equipment, which causes a change in absorption compared to the value considered normal by the NILM, so the load is actually functioning but the NILM does not consider it to be so.
However, to help a user identify abnormal behavior, an NILM-based CBM system should track changes not only in the behavior of the equipment in terms of the number of starts and stops but also in the power draw of the device. The problem lies in the impracticability of training NILM systems on all anomalous signatures because the variations depend on the type of anomaly. Therefore, the NILM identification algorithms are trained on the data obtained during correct operations. Nevertheless, a priori knowledge of the operation of the equipment can help define the equipment even in its degraded state. CBM and electromechanical fault detection systems can be developed cost-effectively and quickly through the use of NILM systems. The load analysis discussed in [
40] shows that through a selection of statistical parameters, these systems can analyze a wide range of system anomalies and assess the health of individual equipment.
5. Ambient Assisted Living
The concept of Ambient Assisted Living (AAL) represents a set of technological solutions (including home automation systems) designed to make the home environment active, smart, and collaborative. It must be effective in supporting independent living and be able to provide greater safety and well-being in carrying out the ADL. These solutions go beyond the technological content, but also include aspects of design and the analysis of the needs of society, psychology, and medicine. This differentiates AAL from home automation, which is specifically focused on technology and automation in the home environment. Despite this, both technologies have something in common. Almost all AAL projects are focused on home automation. Knowing a person’s ability to undertake normal ADL is an essential part of the AAL, as it allows for the diagnosis to be made. There are several ADLs that can be deduced from the data obtained with smart meters or sensors installed in the home, using NILM algorithms [
49]. The following list highlights the main ADL that can be detected through a patient’s interaction with their electrical devices:
Eating patterns: for the purpose of detecting abnormal or altering changes in eating habits. These types of behavioral changes provide key indicators regarding the patient’s overall health.
Sleep Patterns: changes in sleep patterns can provide insight into a patient’s mental and physical well-being. Sleep disturbances are often key indicators of various mental health problems.
Routine alterations: it is vital for detecting changes in a patient’s behavior and forms a fundamental part of the AAL system, in order to facilitate an independent life. Identifying a change of course, especially in more serious conditions such as dementia, may indicate the need for immediate intervention.
Nory et al. [
50] proposed an NILM system that monitors the ADL starting from the identification of active electrical devices within the home. The algorithm identifies the various powered devices, recording information on their switching ON or OFF, from which it obtains useful information for the AAL purposes. For example, detecting a light turning on indicates that someone is entering a room. Consequently, every device in the house is virtually transformed into an additional sensor, without disturbing the user’s privacy.
Specifically, the authors analyzed four activities (preparing and consuming food, hygiene, dressing, and grooming) in four periods (i.e., morning, day, evening, and night) and two additional activity levels (day and night).
Table 2 shows the relationships between rooms, appliances, and ADL. However, the relationship between individual appliance activation and ADL is not inductive. To this aim, a factor
was defined that determines the weight of an appliance
in
. If the appliance is very representative of an activity, this will have a high weight for the classification of the activity; therefore, this weighing process allows one to take into account the functionality of each appliance. For example, the coffee machine, which is used frequently in the morning, receives the maximum weight in the “breakfast” ADL. On the contrary, the kitchen light receives the minimum (not zero) because there is a lower ratio between the “feeding” activity and the kitchen light. In the event that a room is only equipped with lighting, the room lights will have the higher weight in detecting this activity. As an example, for “hygiene” activity detection, the bathroom light will be the main indicator, unless another appliance such as a hair dryer is currently being used. Downstream of this, if at a certain moment a certain subset of active devices is detected, the activity carried out at that moment will be the one that maximizes the weight factors, in accordance with (11):
where
is the number of appliances and
is equal to 1 if appliance
i has occurred, otherwise it is 0.
Zhang et al. [
51] used a Latent Dirichlet Allocation (LDA) algorithm [
52] to create a model of the use of household appliances that allowed them to deduce the activities carried out by the occupants, starting from their absorption profiles. It is a probabilistic model used mainly for text processing, which deduces the semantic meaning of a document by analyzing the similarity between the distribution of the terms of the document with that of a specific topic. In a similar way, given a certain time interval, the states in which the appliances are found in that time interval are used to infer the activity (or activities) in progress. A system of this type can be created using the information of an NILM system, allowing the costs and intrusiveness of the sensors to be minimized.
An AAL system makes the home smart by digitizing it through smart sensors and appliances that form a network capable of providing automated services to the user based on their lifestyle. To provide these services, the house equipped with an AAL system can use information from NILM systems, such as those described above, to primarily monitor the resident’s activities. A general scheme of the system is shown in
Figure 10. The system is therefore able to analyze the data collected on the activities of the resident in his environment. Based on this analysis, the digital environment can offer tailor-made services for the resident and assist them in their daily life. Data from the NILM-based AAL system are transmitted over Wi-Fi to the homes of family members, friends, healthcare assistants, and doctors. In this way, it is possible to constantly monitor the health of the resident. In the event of an accident or emergency, rapid assistance can be provided through direct communication between the participants. It is evident that an NILM system designed for AAL applications must be able to determine the state (ON or OFF) of the various monitored devices. In this case, it is no longer necessary to know the absorbed electrical quantities. For example, in [
53,
54], systems are proposed that are able to infer the ADLs starting from the power profile of each appliance, identifying normal and anomalous patterns. This type of approach is limiting compared to the systems described previously as it would not allow reactive interventions in a short time. Therefore, an easy-to-install system that allows the status of the various electrical loads to be analyzed is ideal for an application of this type [
15].
6. Conclusions and Final Remarks
The technology of NILM systems was mainly developed to achieve different forms of energy saving. These systems can be used efficiently for other purposes as well. The work presented allows the reader to understand how NILM systems can be used in measurement, diagnostics, and automation systems.
In this work, the advantages and disadvantages of the various NILM applications, in both the residential and industrial sectors, were critically analyzed. The most significant works for each application were introduced, their objectives were defined, and the specific characteristics required for the NILM system were identified. In particular, in energy management and DR applications, the importance of high precision in reproducing the power consumption profiles of the different loads that the NILM must have was discussed. The NILM for energy management should also give precise indications on the status of the devices in order to allow correct scheduling. In anomaly detection applications, it is essential that the NILM system reproduces the profile of the power absorbed by the load as faithfully as possible, even (or above all) when this profile presents anomalies. In CBM applications, it is important that the system correctly detects all events, corresponding to the switching ON and OFF of the monitored loads, and correctly measures the electrical quantities involved. On the other hand, applications for AAL do not require a precise determination of the consumption of the various devices and appliances, but rather it is more important that their status is reported in a relatively short time.


