Article

Application of Technology to Develop a Framework for Predicting Power Output of a PV System Based on a Spatial Interpolation Technique: A Case Study in South Korea

1
Department of Architectural Design and Engineering, Incheon national University, Incheon 22012, Republic of Korea
2
Department of Building Equipment System and Fire Protection Engineering, Chungwoon University, Incheon 22100, Republic of Korea
3
Department of Building System Technology, Daelim University College, Anyang 13916, Republic of Korea
*
Author to whom correspondence should be addressed.
Energies 2022, 15(22), 8755; https://doi.org/10.3390/en15228755
Submission received: 16 October 2022 / Revised: 18 November 2022 / Accepted: 18 November 2022 / Published: 21 November 2022
(This article belongs to the Topic Solar and Wind Power and Energy Forecasting)

Abstract

:
To increase the accuracy of photovoltaic (PV) power prediction, meteorological data measured at a plant’s target location are widely used. If observation data are missing, public data such as automated synoptic observing systems (ASOS) and automatic weather stations (AWS) operated by the government can be effectively utilized. However, if the public weather station is located far from the target location, uncertainty in the prediction is expected to increase owing to the difference in distance. To solve this problem, we propose a power output prediction process based on inverse distance weighting interpolation (IDW), a spatial statistical technique that can estimate the values of unsampled locations. By demonstrating the proposed process, we tried to improve the prediction of photovoltaic power in random locations without data. The forecasting accuracy depends on the power generation forecasting model and proven case, but when forecasting is based on IDW, it is up to 1.4 times more accurate than when using ASOS data. Therefore, if measured data at the target location are not available, it was confirmed that it is more advantageous to use data predicted by IDW as substitute data than public data such as ASOS.

1. Introduction

Renewable energy, which is receiving increased attention, is considered an optimal solution to overcome the energy crisis and alleviate environmental pollution triggered by the burning of fossil fuels, owing to the rapid depletion of fossil fuel resources [1]. Among several renewable energy resources, solar energy, which is environmentally friendly and abundantly available worldwide, is considered a promising energy source [2]. Photovoltaic (PV) systems are representative renewable energy systems that utilize solar energy and are widely implemented because of their simple installation, carbon-free operation, and sustainability [3]. However, PV systems are directly or indirectly affected by atmospheric variables such as insolation and temperature [4]; therefore, in order to plan the PV system or to predict and manage the power output in a distributed grid, the weather (insolation, temperature, etc.) of the target location and the corresponding data are essential [5,6].
Ideally, data should be measured for prediction at the location of a solar power plant; however, in practice, it can be difficult to install measuring equipment at all solar power plants owing to the associated installation costs, the requirement for sensor calibration, and maintenance [7]. For the reasons mentioned above, when data observation is difficult, public data, such as an automated synoptic observing system (ASOS) and automatic weather station (AWS) operated by the local community or government, can be applied [8,9]. However, increased distances between the observation stations will likely impede the application of the measured values from public data as arbitrary target location values, causing uncertainty depending on the separation distance. According to a study by Husain et al. [9], distances between public observation stations in Spain ranged from at least 5 km to 450 km. Similarly, within Korea, public observation stations for solar radiation are spaced 4.4–469 km apart, with an average distance between stations of 205.7 km. Therefore, it is expected that the quality of PV system output management can be improved by predicting the weather variables of an arbitrary location where an observation station is not installed, rather than using public data to represent locations situated far apart.
Solar radiation can be predicted using various methodologies, including physical [10,11] and empirical models [12,13], as well as machine learning and artificial intelligence techniques [14,15]. However, these methods estimate weather variables locally in areas where observations of weather variables are available or where empirical review is possible and, as such, represent the weather or specific station where the measurement has been performed [16]. Therefore, to determine regional weather variables, spatial interpolation is necessary, or the application of physical models that create a regular grid for spatially distributed variables [17]. Spatial interpolation can be defined as the process of estimating a given variable value for non-sampled locations from data collected at sampled locations in any one area [18]. It can be utilized to predict weather such as solar radiation and air temperature in an area where data measured directly by observation equipment are unavailable.
Thus, spatial interpolation has been used to predict solar radiation in several studies. Wu et al. [19] used extrapolation and interpolation methods to estimate photosynthetically active radiation and found that interpolation methods such as the triangular interpolation network (TIN) and inverse distance weighting (IDW) are more accurate than extrapolation methods. Moreover, Hodam et al. [20] estimated the humidity, temperature, wind speed, insolation, etc., of India using the IDW and kriging methods and confirmed that IDW exhibited superior station-wise validation performance compared to kriging. Jeong et al. [21] estimated the daily global solar radiation of Canada using the interpolation method of IDW, ordinary kriging (OK), nearest neighbor (NN), and artificial neural network (ANN) models. The results confirmed that the interpolation method was more accurate in areas with dense observation stations, with average R-square values of the study area of 0.84, 0.86, and 0.83 for the IDW, OK, and NN methods, respectively. Additionally, Park and Park [22] estimated the solar radiation in South Korea using spatial interpolation methods, such as IDW, spline, simple kriging (SK), and OK, and confirmed that the mean absolute error (MAE) of OK was the most accurate at 0.724 MJ·m−2·day−1. Although this study confirmed the applicability of spatial interpolation in Korea, only half of the government-run meteorological agency stations were used for analysis. Furthermore, as Korea has a climate with four distinct seasons, the amount of solar radiation varies by season or month, which should be considered during analyses.
Therefore, in this study, a solar power generation prediction process using spatial interpolation was proposed, as shown in Figure 1. Additionally, the applicability of the spatial interpolation estimation method in Korea was verified through a case study.
To predict the output of the PV power plant, the prediction process was determined according to the presence or absence of PV power output data as the target variable and weather data as the independent variable. With past power output data for predicting the power output of a PV plant, both physical methods and data training methods (e.g., machine learning and regression models) can be used, depending on the presence or absence of weather data. However, when data on the power output of the PV plant are unavailable, a physical method that can be predicted simply without target data should be used. However, even if a physical method is used, weather data are necessary. In particular, solar radiation data must be used for simple PV system energy prediction calculations estimating losses with a single empirically defined parameter, while more comprehensive calculations also consider the information of the mean temperature at the location [23].
Therefore, in this study, the process shaded gray in Figure 1 was used as a case study to verify the process of applying the IDW method to predict the amount of power output at the location where the PV system would be installed. To verify the above-mentioned process, all public stations currently operated by the Korean government were used as data, and solar radiation and temperature were estimated monthly. In addition, six PV power plants were selected as case studies, and the amount of power output was predicted by a physical method using solar radiation and temperature values predicted by IDW. The possibility of using the IDW technology was confirmed through the verification of prediction accuracy.
The process proposed in this study is expected to contribute to improving PV output prediction in locations where data are not sampled. More notably, we demonstrated the PV power forecasting process using spatial statistics technology in Korea, which has four distinct seasons throughout the year. Therefore, the effectiveness of the proposed technology can be confirmed under various conditions of temperature and solar radiation.

2. Methods

2.1. IDW

Inverse distance weighting interpolation is a tool that uses nearby measured values to predict values in areas where parameters are not measured. Therefore, the IDW model is widely used for climate parameter and solar radiation predictions in regions not equipped with measuring instruments [24]. More specifically, it can estimate the influence of each measured point on the target area, while decreasing the effect of the observation points according to distance. Therefore, the nearest measurement has a greater influence on the predicted value and is estimated to be more similar than those farther away.
The general equation is represented as Equation (1):
Z x = i = 1 n λ i x Z x i i = 1 n λ i x
where Z x is the predicted parameter for location x and Z x i is the observed parameter at location x i , n is the number of measured points surrounding the prediction location, and λ i x is the weight of parameter Z x i .
The weights at location x i can be determined using Equation (2):
λ i x = 1 / d i b
where d i is the distance between the predicted location and each measured location. The distance weighting factor b implies that, as this value increases, the influence of data farther from the target area decreases, and the b = 2 value is typically used [25,26,27].
In this study, IDW interpolation was implemented using the GIS program (QGIS), and was conducted by setting weighting factor b = 2 and interpolation pixel range to 129 × 122 pixels. The size of the pixel was set to 5 × 5 km; hence, solar radiation and ambient air temperature predicted with a resolution of 5 km were analyzed. The IDW analysis area was all of South Korea and the neighboring coast, ranging from 33°06′ N to 38°36′ N and 124°36′ E to 131°52′ E.

2.2. Conversion to Slope Surface of Solar Radiation

In this study, solar radiation at the target location was predicted using spatial statistical techniques with data from the Korea Meteorological Administration (KMA). The solar radiation measured by ASOS is the total solar radiation in the horizontal plane, global horizontal irradiance (GHI); therefore, the input data used for prediction are also the total solar radiation at the horizontal surface. Thus, the result of the prediction is also the global horizontal solar radiation at the target location. However, in the physical model used to predict power generation, the amount of solar radiation projected onto the slope surface of the PV system was used. For this reason, solar radiation predicted by the spatial statistical technique was converted to slope solar radiation for each case study.
In the process of converting predicted global horizontal solar radiation into slope solar radiation, the solar radiation ratio of slope surface to horizontal surface at each case study location was used. As both horizontal and slope solar radiation were measured in each case study, the ratio of horizontal to slope solar radiation was calculated for each month. Slope solar insolation was calculated by applying a conversion ratio to the predicted solar radiation of each case study location.

2.3. Forecasting Method of PV Power Output

The technology for forecasting the solar power output of PV systems can be approached using two methods. The first method is to model a PV system using analytical equations, which consist of a set of mathematical equations that describe the physical state and dynamic motion of the atmosphere [28]. Representatively, there are PV performance, physical, and parametric methods, and they have an advantage compared to the statistical method in that it is possible to obtain the power output of the power plant before construction because it does not require historical data [29].
The second method is to predict PV power output using statistical and machine learning methods. These methods are based on a sequence of observations of one or more parameters measured at successive instants in time [30]. It includes regression methods, artificial intelligence (AI) techniques, machine learning (ML), and hybrid methods such as artificial neural networks (ANNs), k-nearest neighbor (kNN), extreme learning machine (ELM), and support vector machine (SVM) [31]. To implement an accurate forecasting model with these methods, it must be based on the use of measured weather forecast data [32]; therefore, it is used when measurements can be made from the field [33].
For the process proposed in this study, it was assumed that solar power output and meteorological data could not be measured from the field. Therefore PV power output is predicted using the physical method, which can predict without data measured from the field where the PV power plant is located.
Power output of a PV array with maximum power is determined using Equation (3) [34]:
P = A c G T , i η m p η e
where A c is the array area (m2), G T , i is incident solar radiation on the array (kWh), η m p is the maximum power point efficiency of the array (%), η e is the efficiency of any power conditioning equipment or performance ratio (%). As η e is the installation performance of the system, independent of the direction and inclination of the panel, the quality of the solar installation was estimated. It includes all the losses that depend on the size of the system, technology used, and site. The types of losses that affect the performance ratio η e include shadow, temperature, DC and AC cable, inverter, and dust loss [35,36]. Performance ratio η e determined in the annual technical standard (ATB) of the National Renewable Energy Laboratory (NREL) and the PVWatts program was 86% (system loss of 14%), and the same performance ratio was calculated in this study [37,38].
Power output of a PV array with the point tracking equation is given by Equation (4):
P = A c G T , i η m p 1 0.05 t 0 25
where A c is the array area (m2), G T , i is incident solar radiation on the array (kWh), η m p is the maximum power-point efficiency of the array (%), t 0 is the outside air temperature (°C). According to Wan et al. [39], and Sarkara et al. [40], the above equation is derived experimentally, and power generation can be estimated accurately when the panel efficiency, solar radiation, and temperature are known.

2.4. Model Evaluation Method

Mean absolute percentage error (MAPE) is used as an indicator of estimation error and is defined by Equation (5):
MAPE = 100 % N n = 1 N y n y ^ n y n
where N is the number of estimates within the evaluation period, y n is the actual value, and y ^ n is the estimated value. To evaluate the estimation accuracy of the proposed IDW, the accuracy range of MAPE was classified; the classification criteria are listed in Table 1.
Mean absolute percentage error is used as an evaluation index in various studies related to spatial statistical analysis. Kuo, Chen, and Huang predicted solar radiation by IDW interpolation, wherein MAPE averaged 4.30% and 3.71%, respectively, for each case study [41]. Loghmari, Timoumi, and Messadi reported that the percentage of errors in global solar radiation predicted by IDW was 5.11% on average between regions [42]. Wu et al. also predicted the temperature of two case areas using spatial statistical techniques such as IDW, kriging, and spline, and the average MAPE was 5.19% [43].

3. Case Study and Data

3.1. Investigated PV System

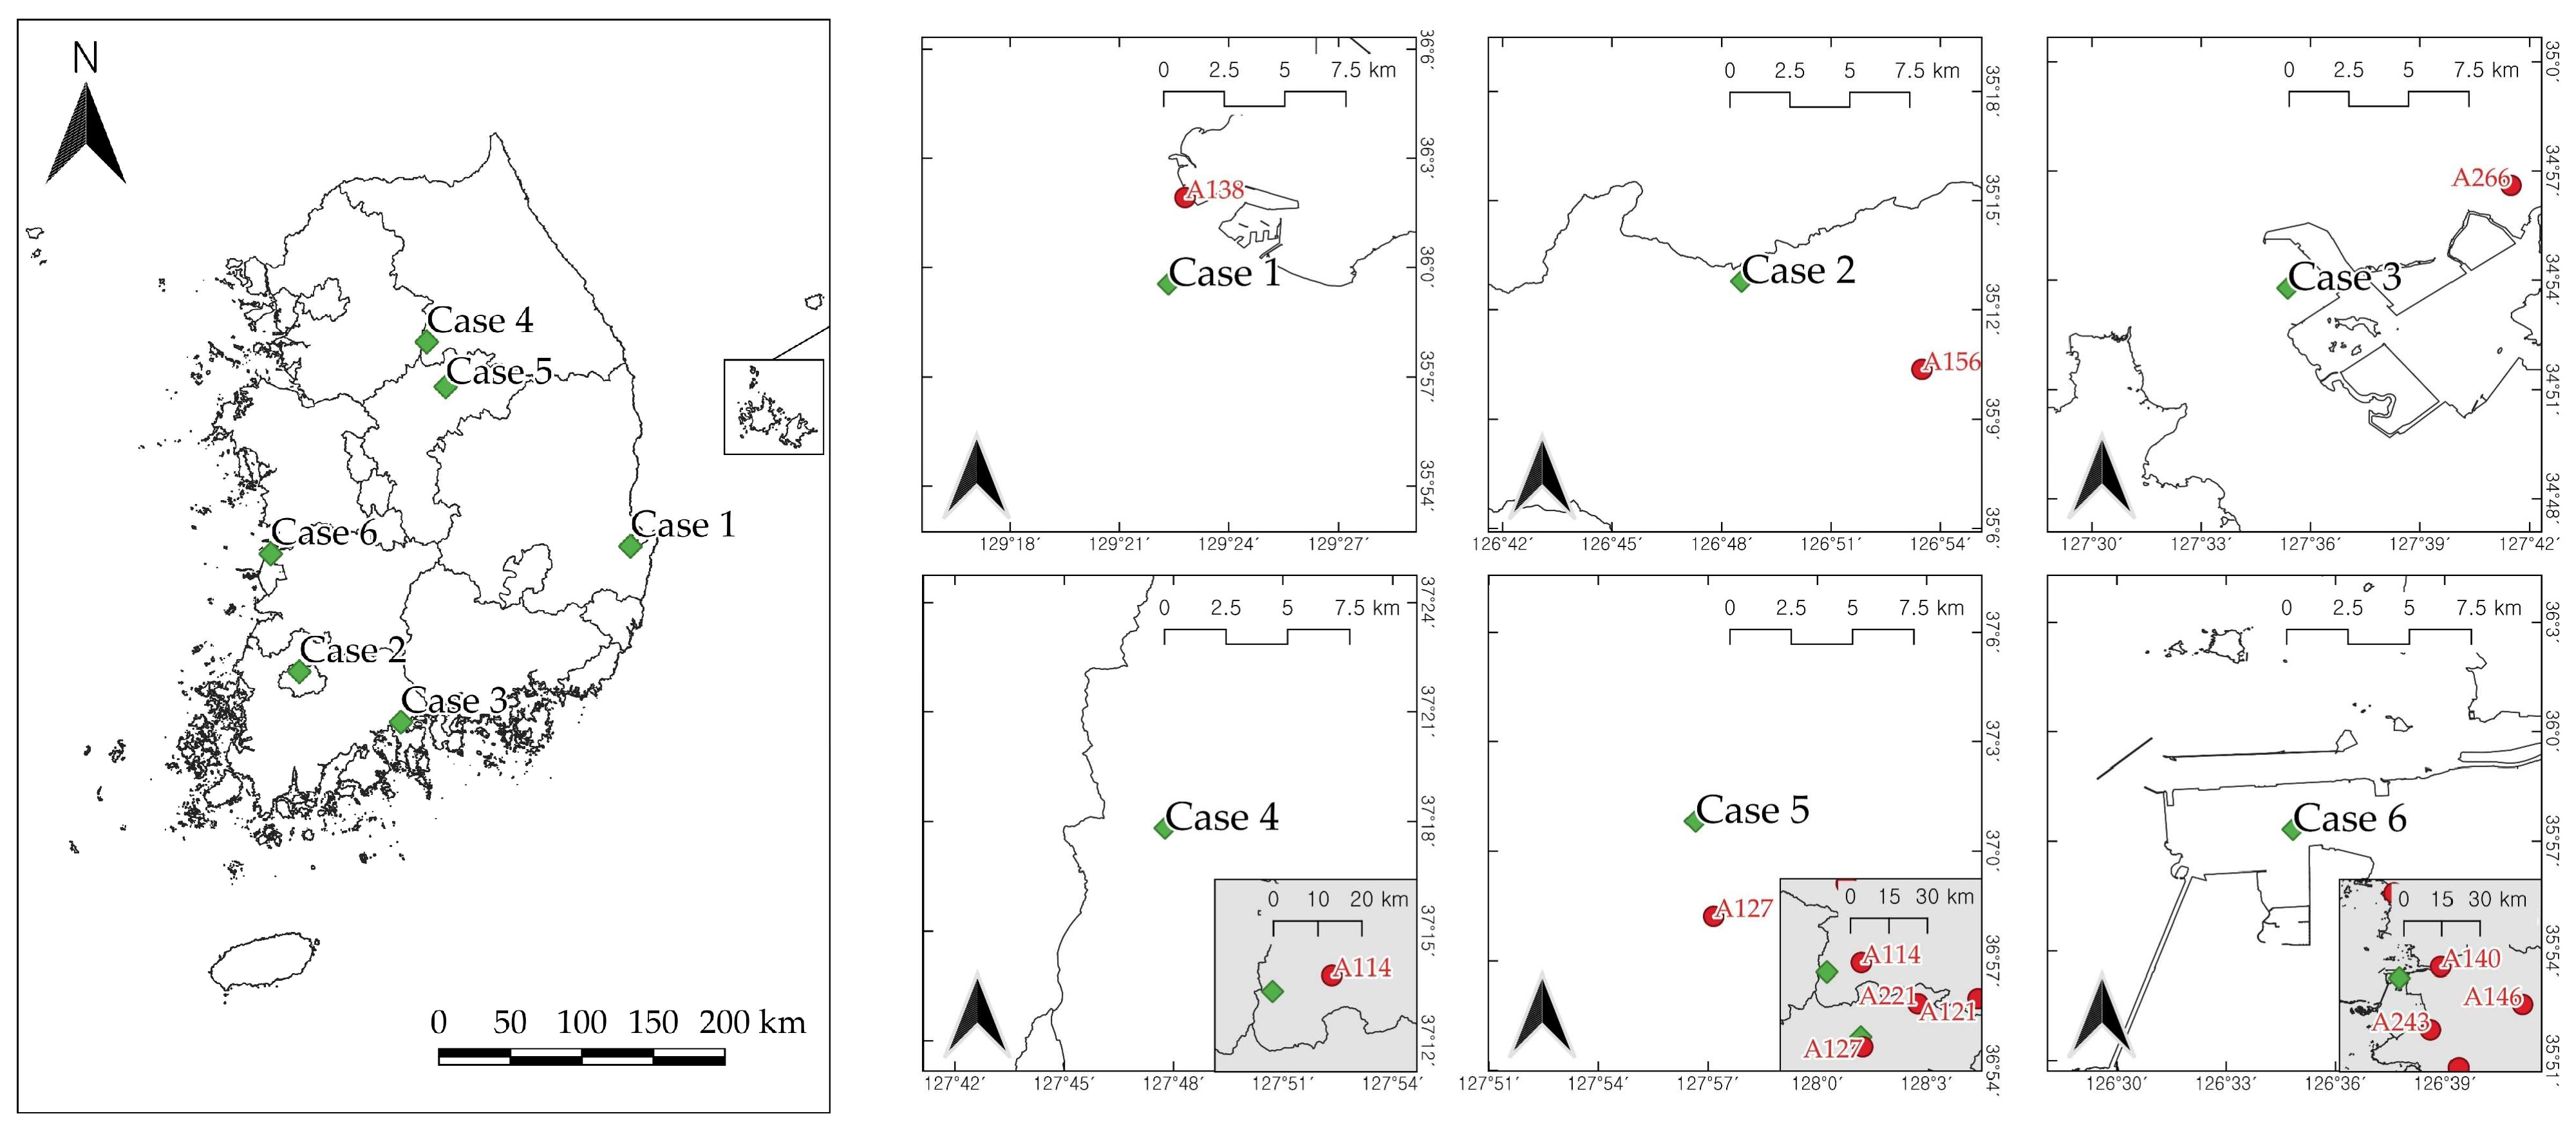
The case studies were selected as solar power plants in Pohang, Gwangju, Suncheon, Wonju, Chungju, and Gunsan; their locations are shown in Figure 2.
If it is assumed that there are no PV power generation data and environmental variable data, it can be divided into methods using nearby public data and data estimated using spatial statistical techniques when predicting the power generation of each case. The automated synoptic observing system, a public data observatory used for prediction, was determined as the nearest observatory in a straight line for each case. Each case study differs in distance to the nearest ASOS from a minimum of 4.45 km to a maximum of 50.09 km and was designated as Case 1 to Case 6 according to the distance of the nearest ASOS that observes solar radiation. Table 2 and Table 3 show the closest ASOS information and PV power plant information for each case.

3.2. ASOS Station

In this study, ASOS public data operated by the KMA National Climate Data Center were used as the surrounding data to implement IDW technology. As of 2022, there are 95 observatories that measure ambient air temperature among the ASOS operated by the KMA and 44 observatories that measure solar radiation. Therefore, when estimating solar radiation with IDW, 44 ASOS were used for analysis, and when estimating ambient air temperature, data from 94 ASOS were used. Among the 95 observatories that measured outdoor temperatures, Sejong (ID A239) was excluded because it contained a period during which it was not operational in the analysis period. The data analysis period was from April 2019 to March 2020, and IDW analysis was performed by calculating the monthly average daily cumulative solar radiation and daily average ambient air temperature. The location of the ASOS observatory is shown in Figure 3.

4. Results and Discussion

4.1. IDW Interpolation

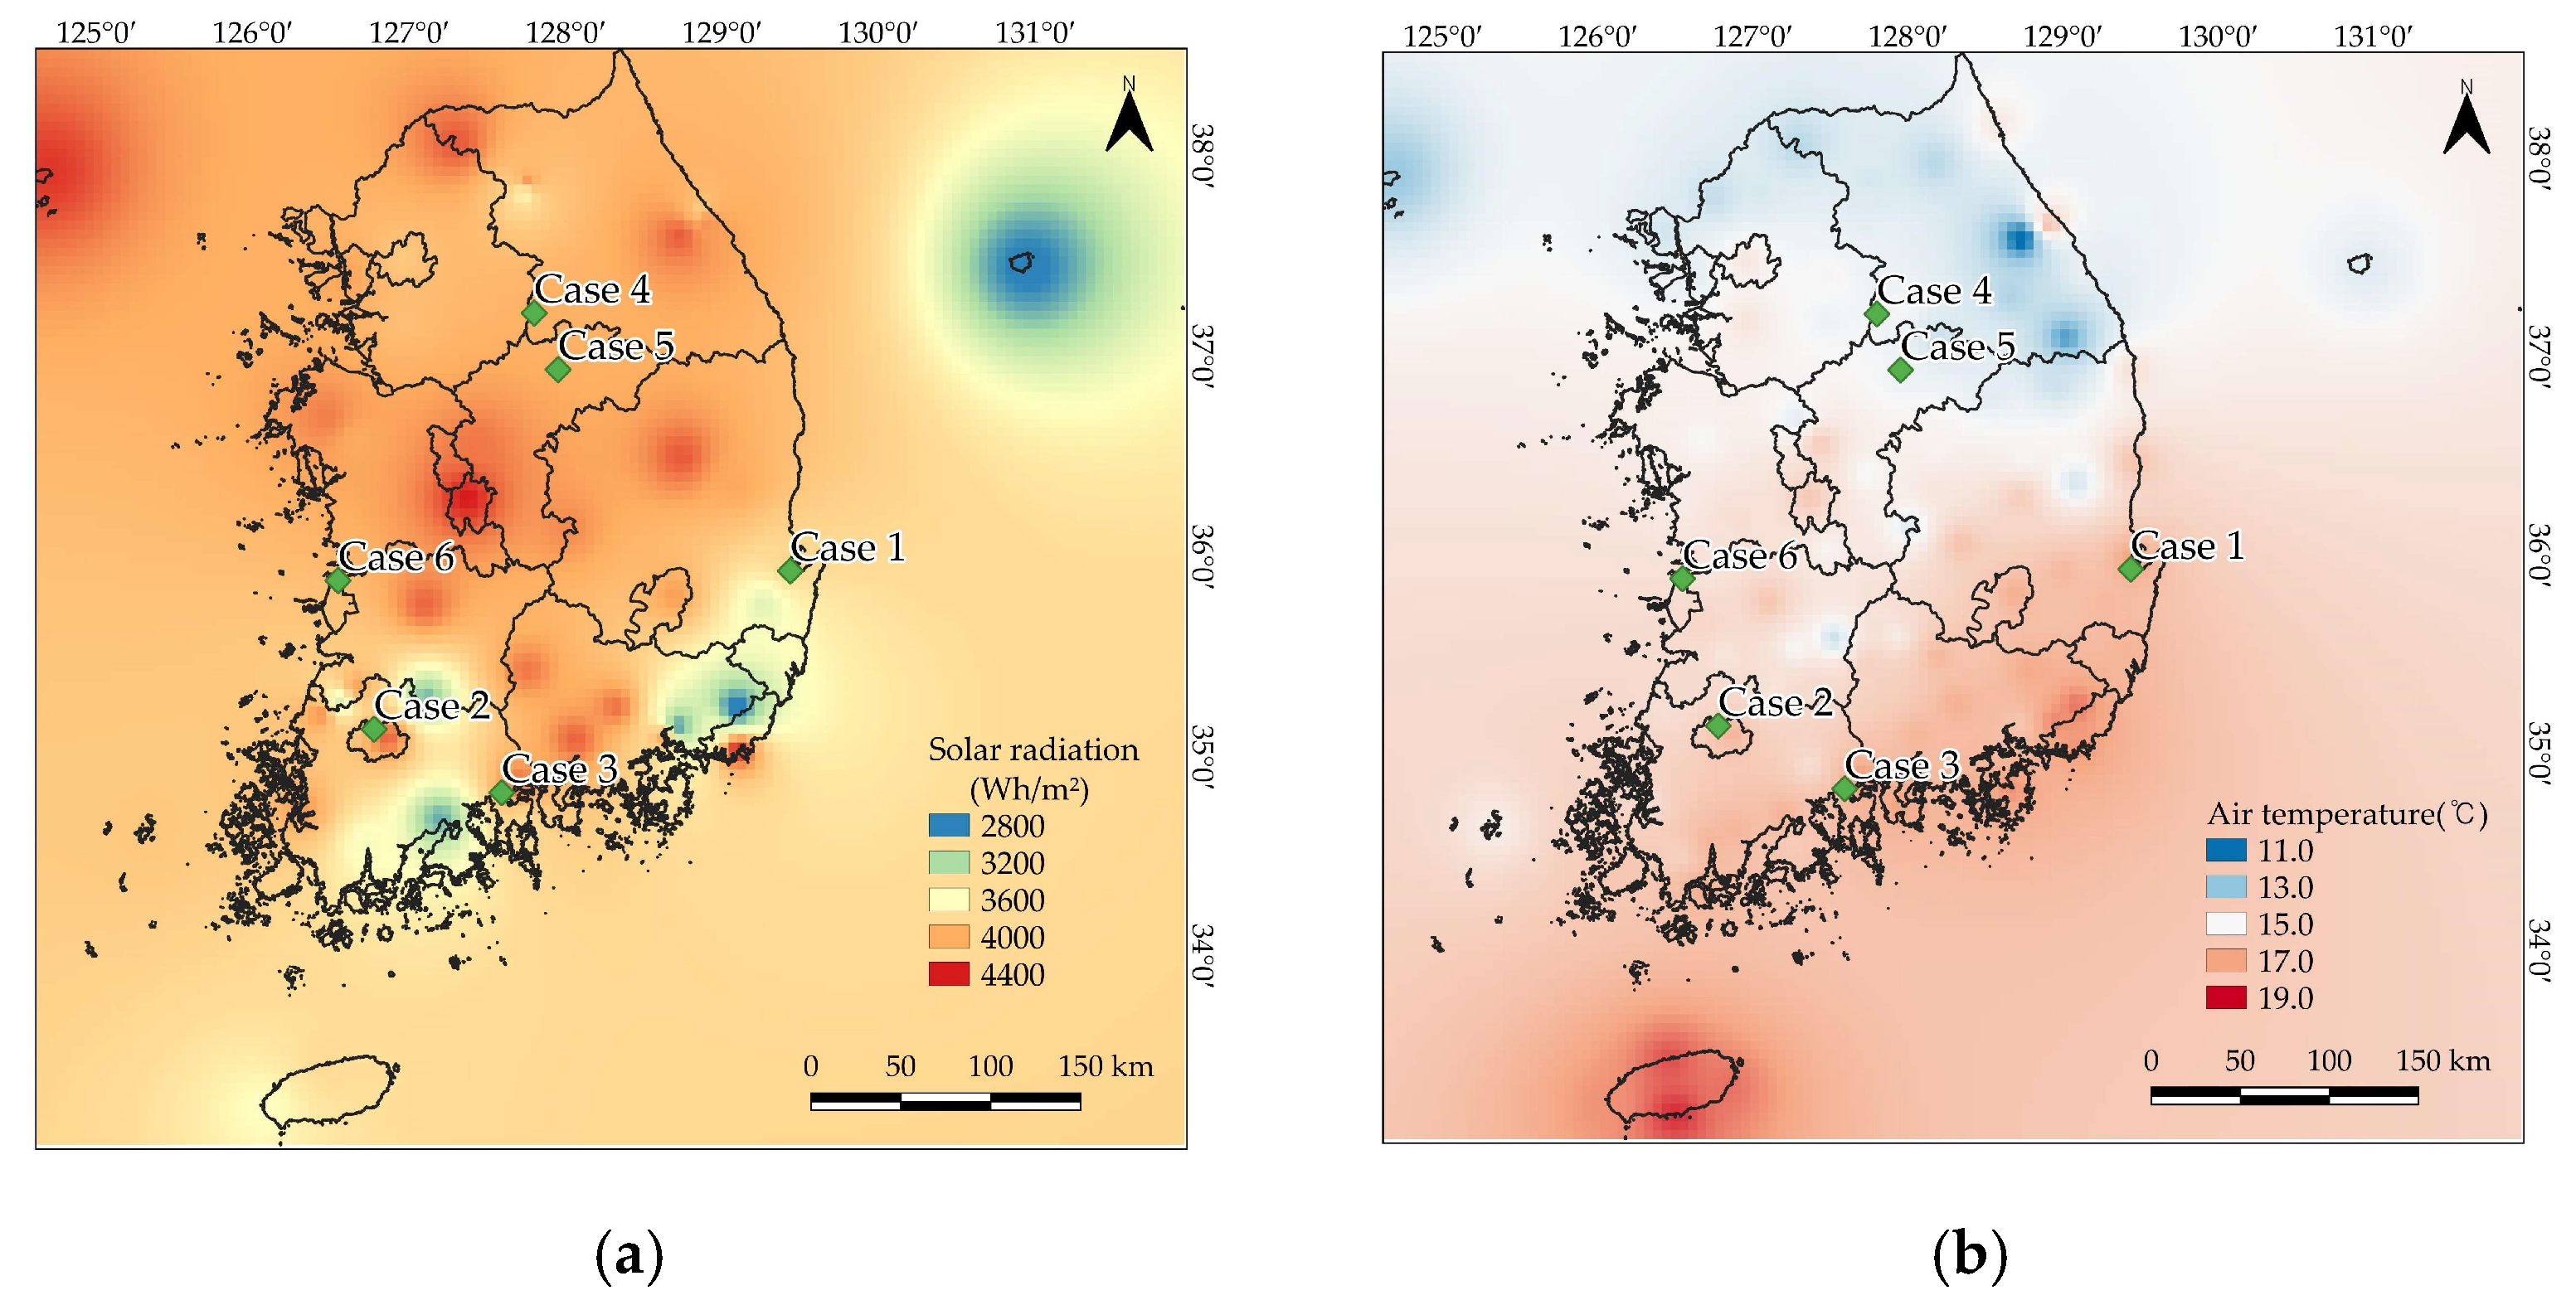
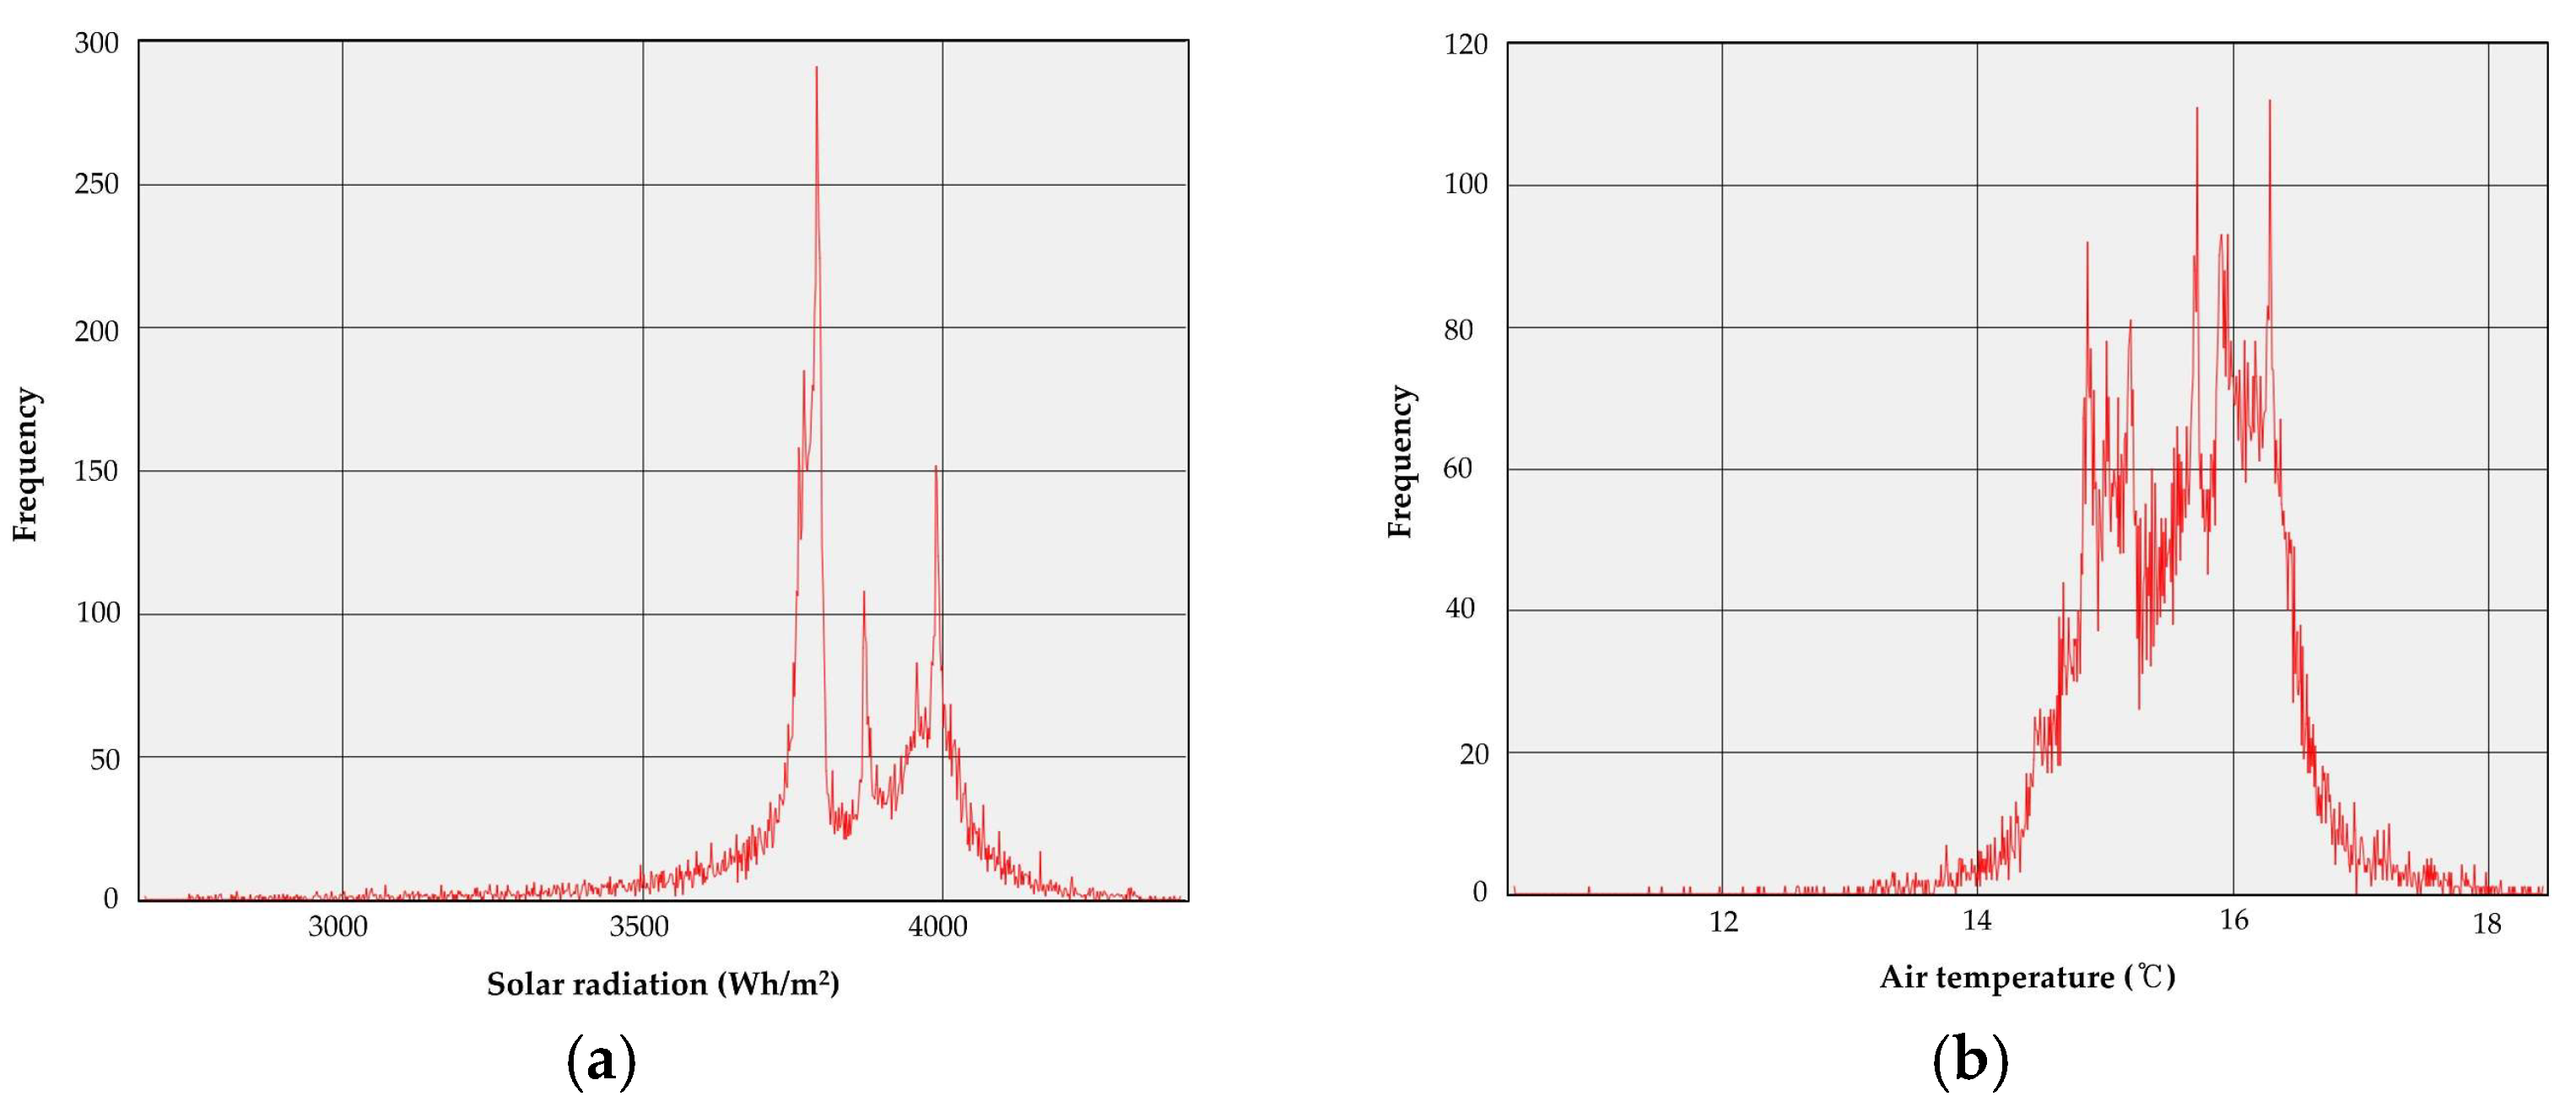
To predict the solar radiation of PV plants without ASOS stations or weather observation equipment, the monthly average value of the daily accumulated solar radiation and monthly average air temperature during the daytime between April 2019 and March 2020 was predicted using IDW interpolation. Figure 4 is a representative figure showing an average annual prediction map of accumulated daily solar radiation and a prediction map of the monthly average temperature during the daytime. The predicted pixels in Figure 4 exhibit a histogram distribution, as shown in Figure 5. Average annual cumulative solar insolation in Korea was predicted to be in the range of at least 2671.5 Wh/m2 to 4396.8 Wh/m2, and in general, the solar radiation of the south coast and Ulleung Island located in the east was lower than that of the other regions. Additionally, the average monthly temperatures during daytime hours in Korea were predicted to be in the range of at least 10.4 °C to 18.4 °C. The temperature distribution in Korea tended to decrease toward the north of the territory.
The IDW results of the six cases were confirmed by the pixel value of the location, including each case. To evaluate how similar the predicted IDW value was to the actual value, it was compared with the actual value measured at each case location, and MAPE was calculated. In addition, cross-validation was performed by calculating MAPE between the measured value of the closest ASOS to the study case location and the actual value at the study case location and comparing ASOS error with IDW prediction error. Generally, when predicting power generation to build a solar power plant, the solar radiation observed in the nearest ASOS is used if there is no solar radiation observation value in the planned power plant area. Therefore, the subject of cross-validation was determined to be the closest ASOS observation value.
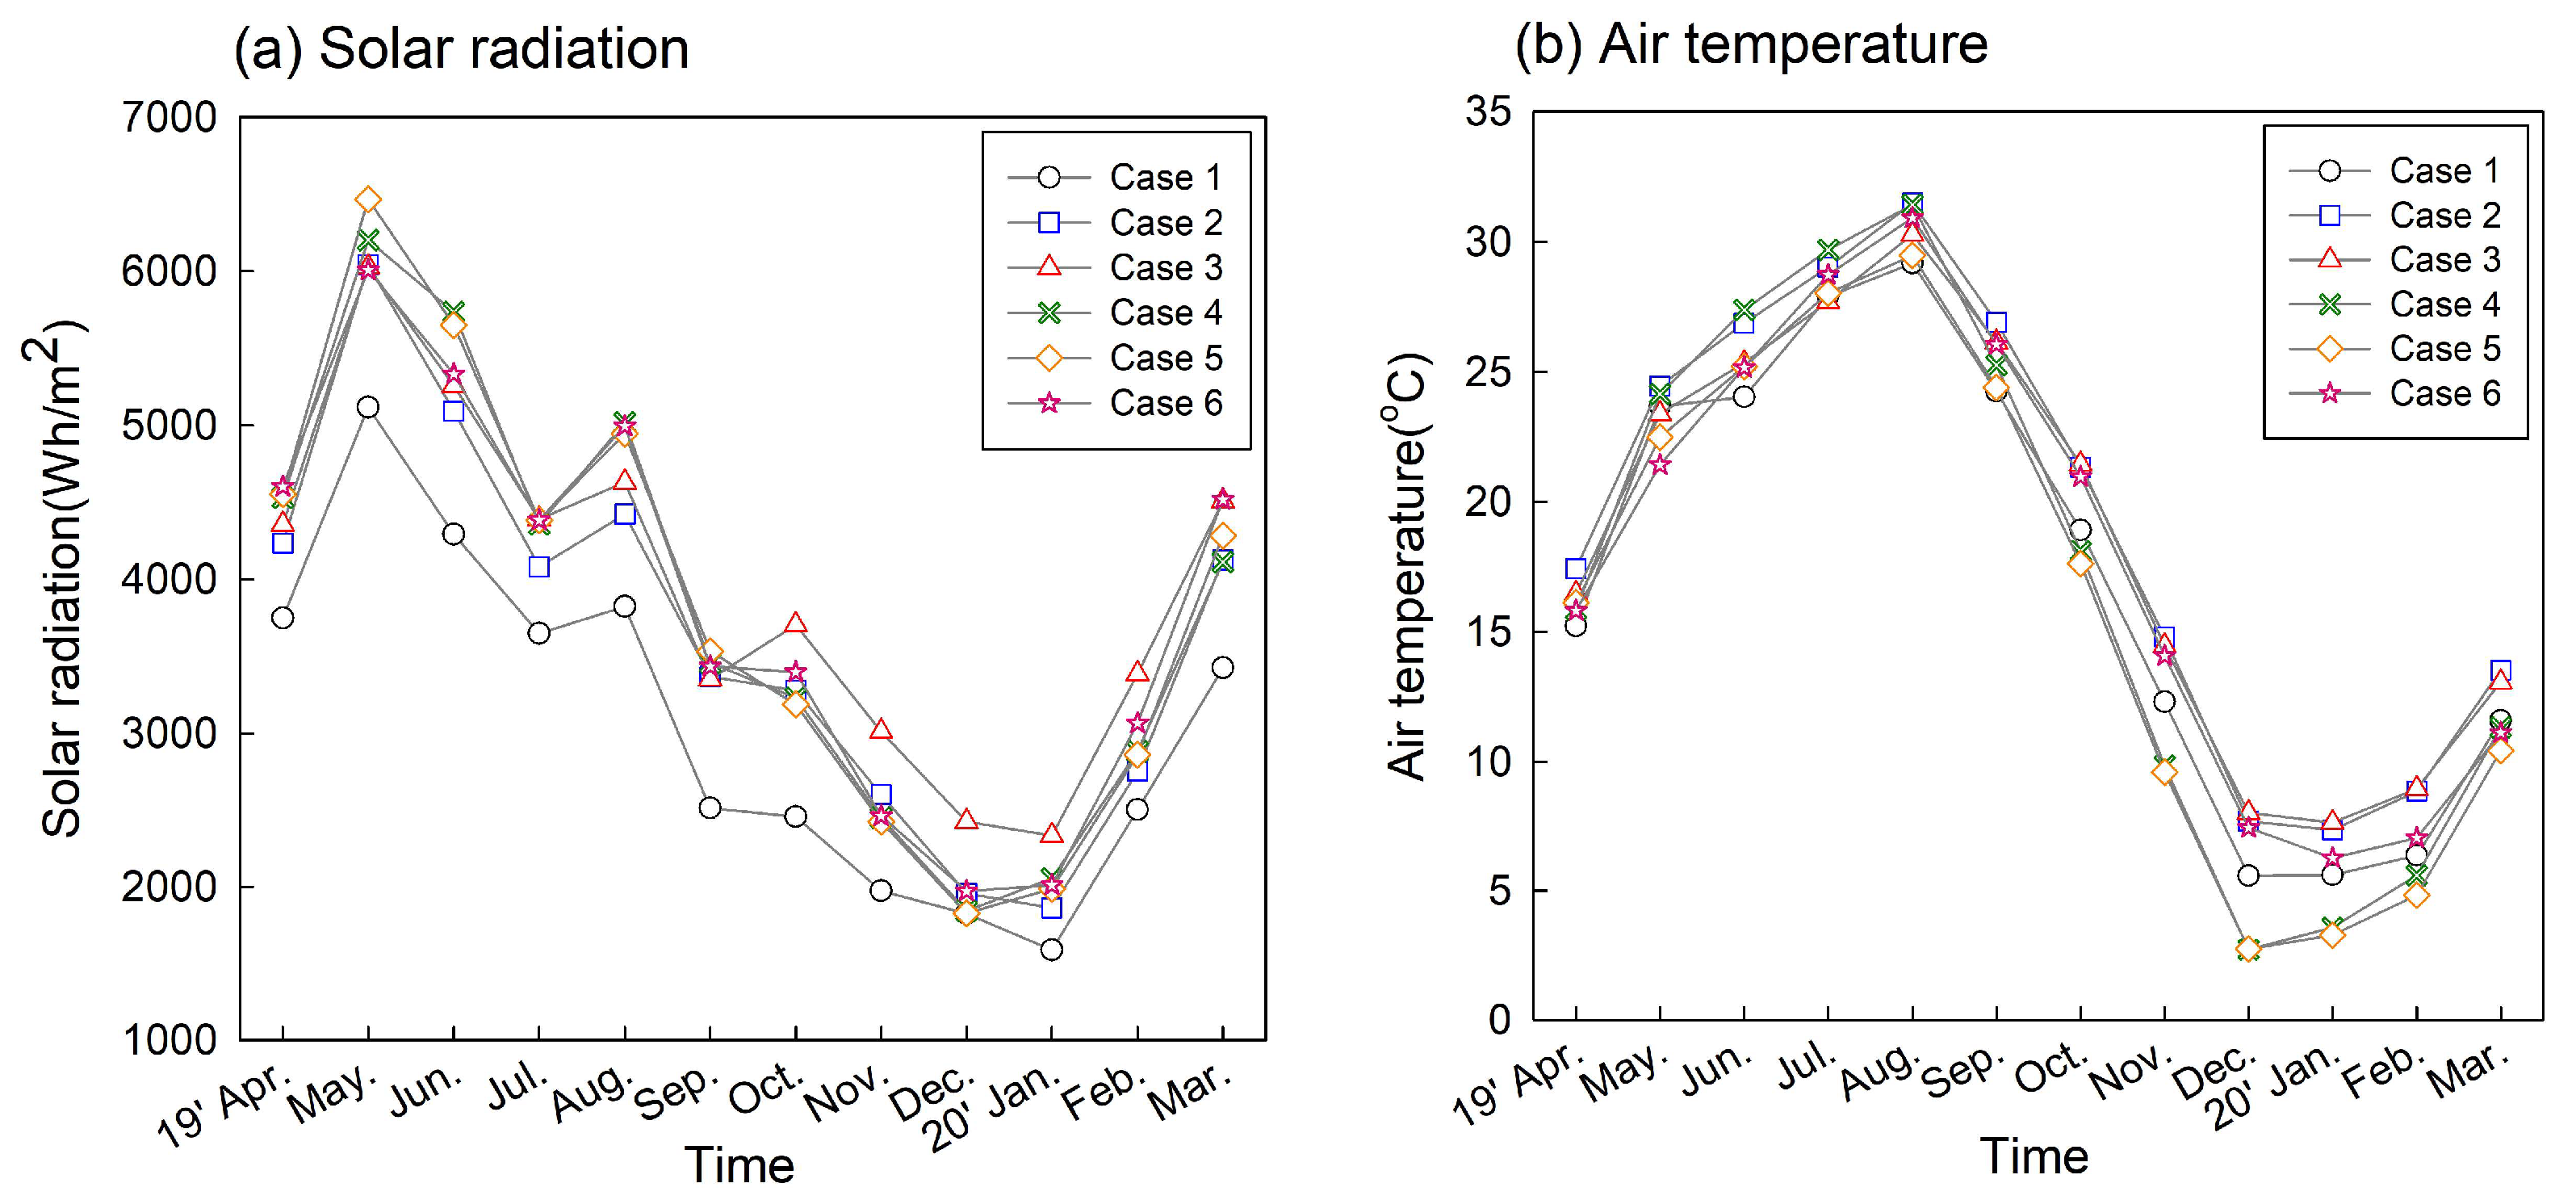
Before the prediction, actual horizontal total solar radiation and temperature measured at the location of each case exhibited a distribution, as shown in Figure 6. In all cases, the highest solar radiation occurred in May, and then solar radiation gradually decreased, showing the lowest distribution in December and January. South Korea experiences a wet temperate climate because it is geographically surrounded by sea on three borders. Hence, climate represents the major contributor to the spatial variability of solar radiation, trumping its latitudinal influence. Although the zenith angle of the sun is lowest in June, owing to the monsoon season, the amount of incoming radiation is less in June than in May [44]. Temperatures at each case location were highest in August and then gradually decreased to the lowest in December–January. As the summer season in Korea starts around June, the temperature distribution increases from June to the highest in August, and the temperature distribution was low during the winter season from December to February. The seasonal characteristics of Korea are reflected in these cases.

4.1.1. IDW Interpolation of Horizontal Total Solar Radiation

Table 4 shows the result of IDW and observed values of ASOS in each case compared to the actual horizontal total solar radiation of each case confirmed in Figure 6a and their errors.
The 12-month total average MAPE of IDW results in six cases was 9.17%, and the accuracy according to Table 1 was analyzed as “Very Good.”
In particular, by month, the average MAPE of predicted solar radiation in July was the most accurate at 5%, while that between April and September was also very good, with less than 10%. In contrast, during the period from October 2019 to March 2020, the average accuracy was 12.30%.
Case 3 was predicted most accurately with an average MAPE of 2.12% for 12 months, and MAPE of Cases 4, 5, and 6 was 5.12%, 6.25%, and 5.09%, respectively, which was very accurate. Case 2 was analyzed at 11.95%, which showed good accuracy, whereas Case 1 had a low accuracy of 24.51%. Cases 1 and 2 were found to have relatively low accuracy, even though the distance to the nearest ASOS was within 10 km. The amount of solar radiation estimated using IDW in Cases 1 and 2 was overestimated from at least 192.4 Wh/m2 to 74.2 Wh/m2 compared to actual measured solar radiation, and this trend also occurred at the nearest ASOS. Therefore, it is assumed that such uncertainty and inaccuracy occurred because of the influence of temporary and irregular elements, such as clouds and shade, or blind elements, such as regional characteristics, in the case study areas.

4.1.2. IDW Interpolation of Air Temperature during Daytime

Table 5 shows the result of IDW and observed values of ASOS in each case compared to the actual air temperature confirmed in Figure 6b and their errors. Here, only daytime air temperature data, during which the PV system can be operated, were used for analysis.
When IDW was used to predict the temperature at the location of the cases, the 12-month average error was 13.1%, which is a “Good” level, according to Table 1.
Specifically, the accuracy of IDW with the average of cases by month was accurate, with an average MAPE of less than 10% between July and October, with September being the most accurate (8.10%). Although it exceeds 20% from December to February, the difference between the predicted and measured values is only ~1 °C. In this period, the air temperature in Korea was less than that in other periods, so the rate of error was large, even with a small difference.
By case, the 12-month average MAPE of Case 1 was most accurately predicted at 7.77%, with only 0.13 °C deviation from the actual air temperature. Other cases were also analyzed with MAPE between 10 and 20%, and considered to be relatively accurate. Among the other cases, Case 2 had the lowest accuracy, and MAPE was 17.45%. In Case 2, the average annual measured value and predicted value differed by approximately 2.9 °C.

4.1.3. Comparative Analysis between ASOS and IDW

The issue of how accurate IDW is compared to ASOS is the background for deciding whether to use ASOS data or IDW forecasts when predicting PV power output at locations without public meteorological stations. Therefore, in this section, the accuracy of IDW confirmed in the previous section is compared and analyzed with that of ASOS. The accuracy of ASOS is the MAPE between the observed value of the closest ASOS in each case and the actual value measured at the location of the case.
In the prediction of the horizontal total solar radiation, the 12-month average MAPE of the six cases was approximately 1.2 times more accurate than the 12-month average MAPE of the ASOS. Although ASOS and IDW are similar in terms of MAPE values, 10.91% and 9.17%, respectively, the values of 12-month average solar radiation differ by 98.1 Wh/m2 as the ASOS is 4054.0 Wh/m2 and the predicted IDW is 3955.8 Wh/m2. Therefore, IDW prediction value is considered more accurate than ASOS.
Figure 7a shows IDW results and ASOS accuracies for each case. Among the six cases, Case 3 showed the highest accuracy compared with ASOS. When compared with the average error of 12 months, the IDW accuracy of Case 3 was ~2.3 times higher than that of ASOS, and at this time, MAPE had a difference of approximately 2.8%. Also, in Cases 2 and 6, IDW was 1.9 times and 1.3 times more accurate, respectively, and MAPE differed by 4.7% and 4.1%, respectively. However, in Cases 1 and 4, the accuracy of IDW and ASOS was similar, and in Case 5, ASOS was more accurate than IDW. In Case 5, the MAPE of IDW was 1.2% greater than that of ASOS. Considering the results collectively, if IDW estimates the actual value, it is more accurate than ASOS; therefore, solar radiation prediction is considered effective.
In the prediction of air temperature, the 12-month total average MAPE of all cases was found to be 13.1%. However, compared to ASOS, the error was smaller than that of IDW, and the 12-month average error of ASOS was 11.6%. Although IDW can be judged to be inaccurate as the closest ASOS has a smaller error than IDW, the 12-month average air temperature of the closest ASOS value (16.1 °C) and the IDW predicted value (15.8 °C) is only a 0.2 °C difference. Therefore, the IDW prediction value is considered to be similar to the ASOS-measured value.
Figure 7b shows IDW air temperature prediction results and ASOS accuracy for each case. In most cases, the accuracy of ASOS and IDW was similar to that of MAPE, with a difference of less than 3%. The difference between the predicted temperature of IDW and the observed temperature of ASOS was also analyzed to be within 0.3 °C. In Case 3, the prediction error of IDW was found to be approximately 1.6 times larger than that of ASOS. However, even in Case 3, the difference in temperature between the two was only 0.6 °C, so it cannot be said that there is a significant difference. Therefore, unlike insolation, temperature is thought to have little effect on prediction by IDW and it is considered that the effect of IDW is very small in predicting the temperature.

4.2. PV Power Output Forecasting

4.2.1. Estimation of Formulae That Use Only Solar Radiation Factor

In this section, the amount of power output of the PV system is predicted using the meteorological factors predicted by IDW in the previous section. We focused on analyzing the effect of using IDW when estimating the amount of PV power output in places where there were no observations and checking the difference using public data.
The physical model, Equation (3), predicts PV power output using array area, module efficiency, performance ratio, and insolation variables. The only meteorological environmental variable included in the formula is solar insolation, and solar radiation predicted by IDW was substituted in this formula to estimate PV power output and confirm the difference with the actual power output. Additionally, PV power output was estimated by substituting the solar radiation of the nearest ASOS and comparing it with the estimated IDW value. Through this, we analyzed the effect of using IDW instead of public data when predicting PV power generation. In addition, the results predicted by the actual weather environment data measured at the location of the case were reviewed.
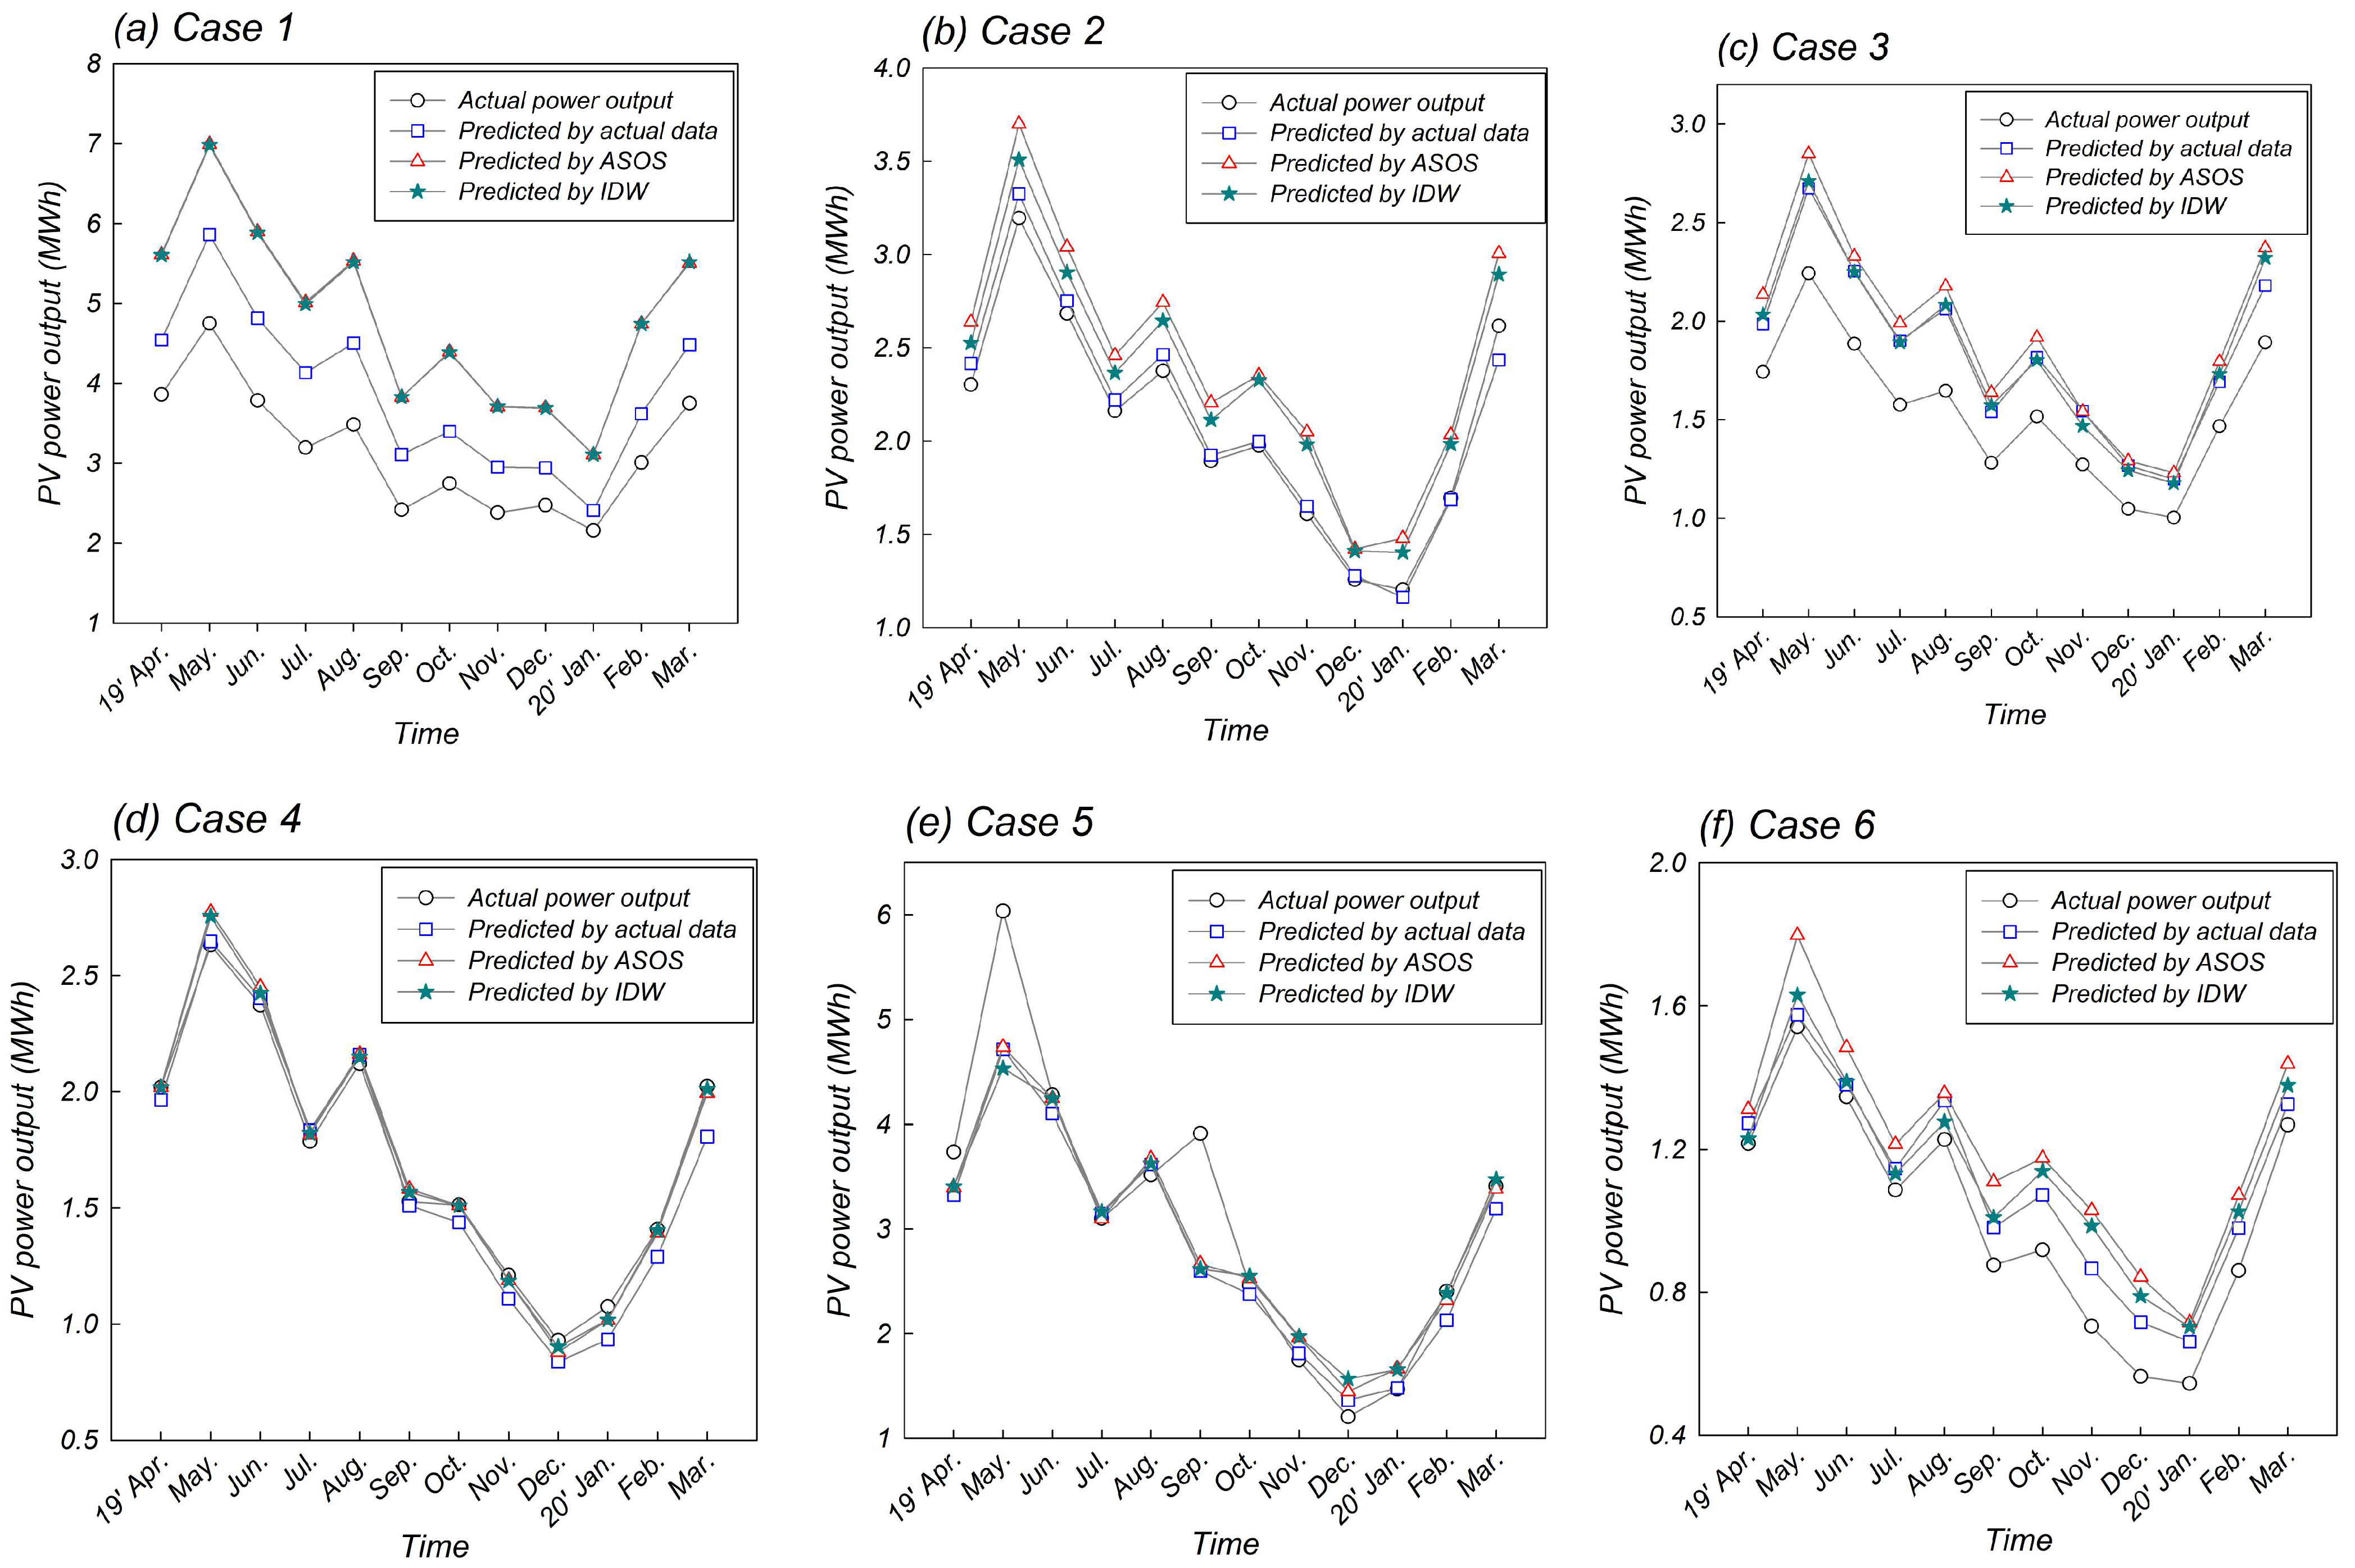
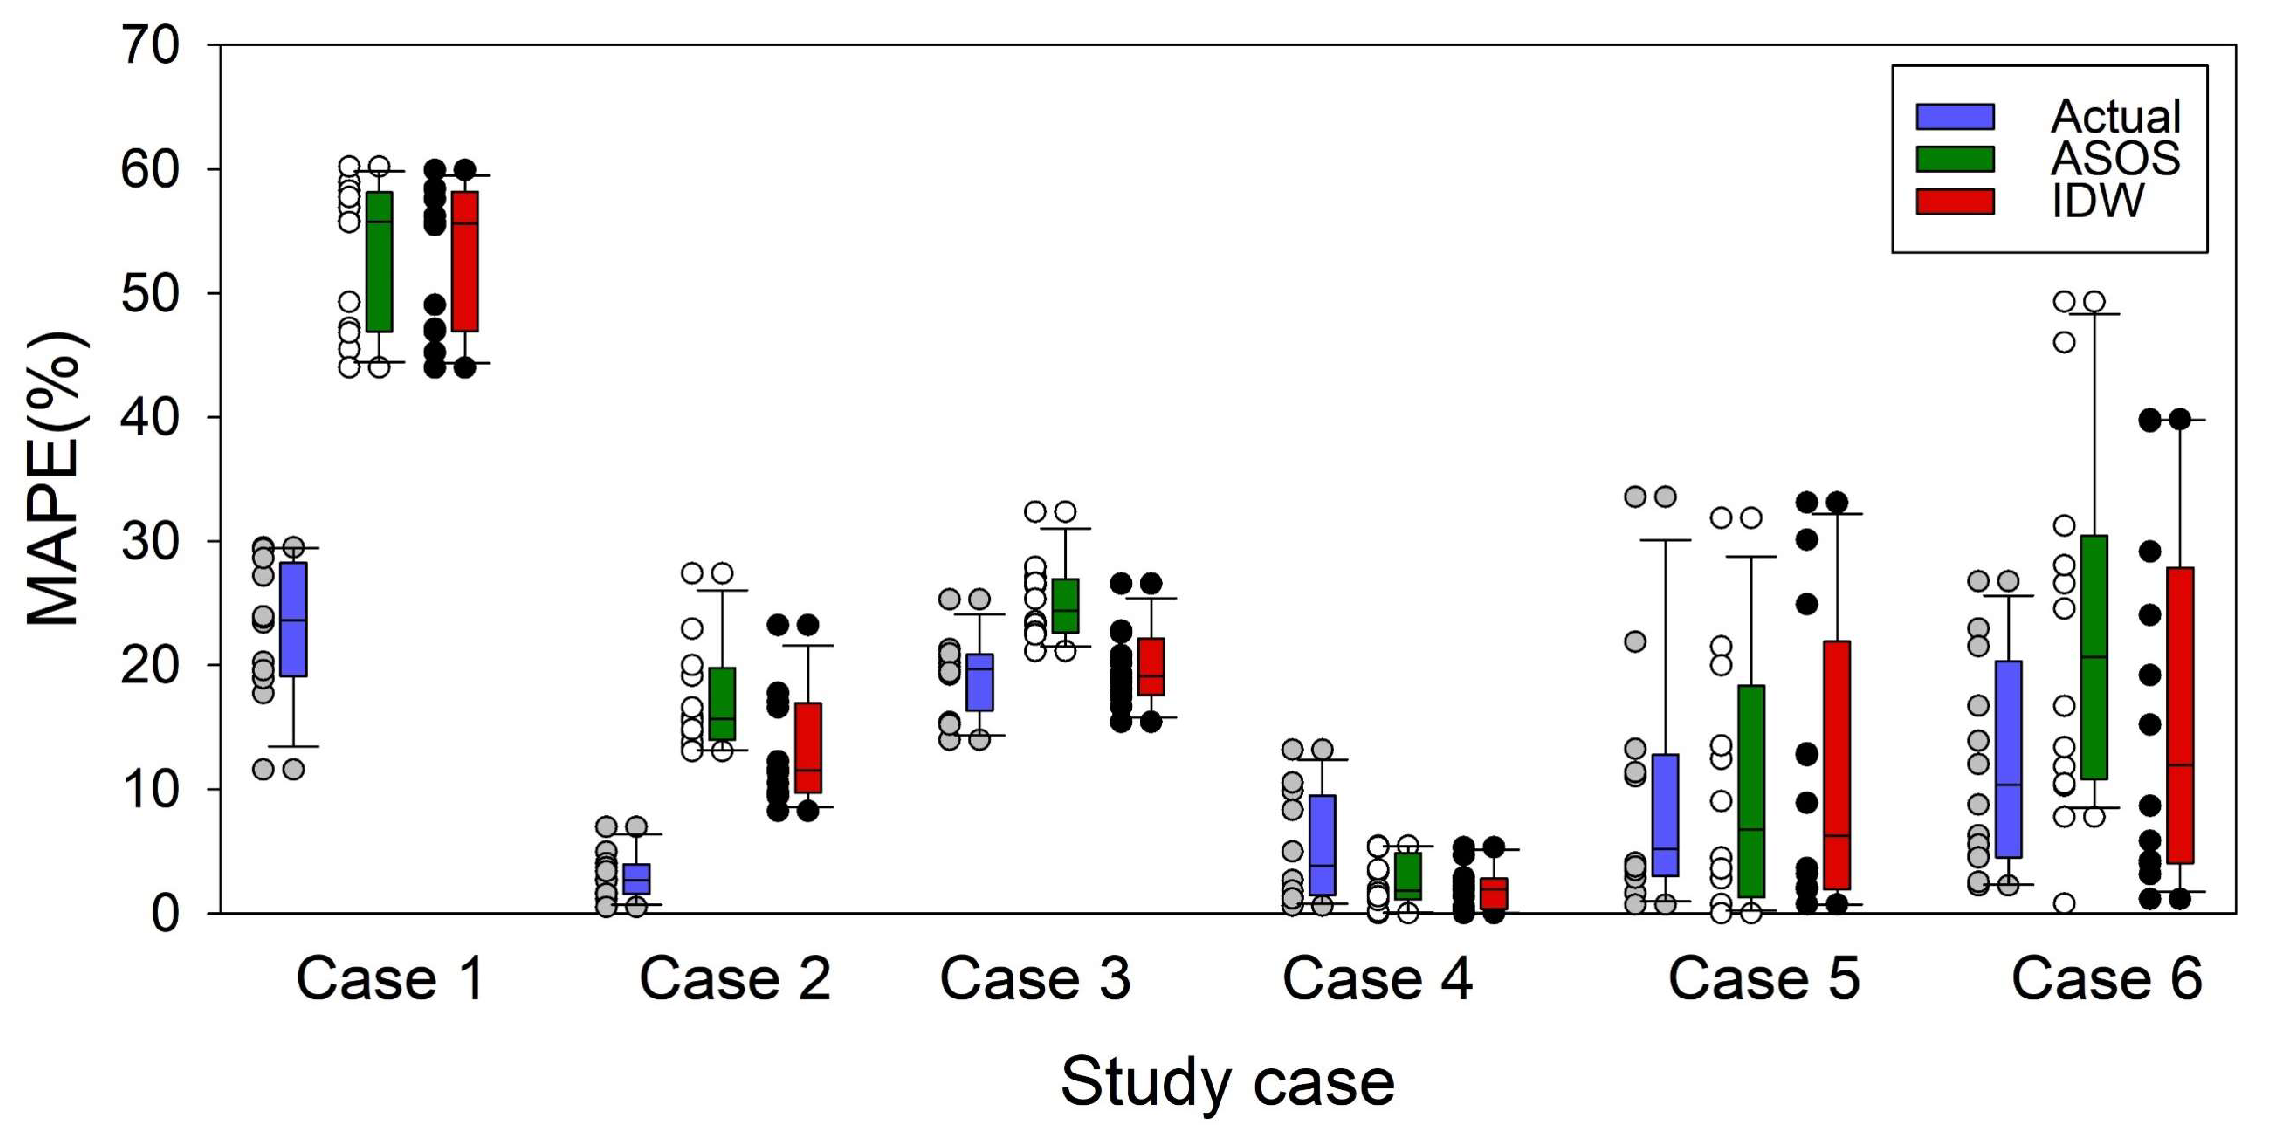
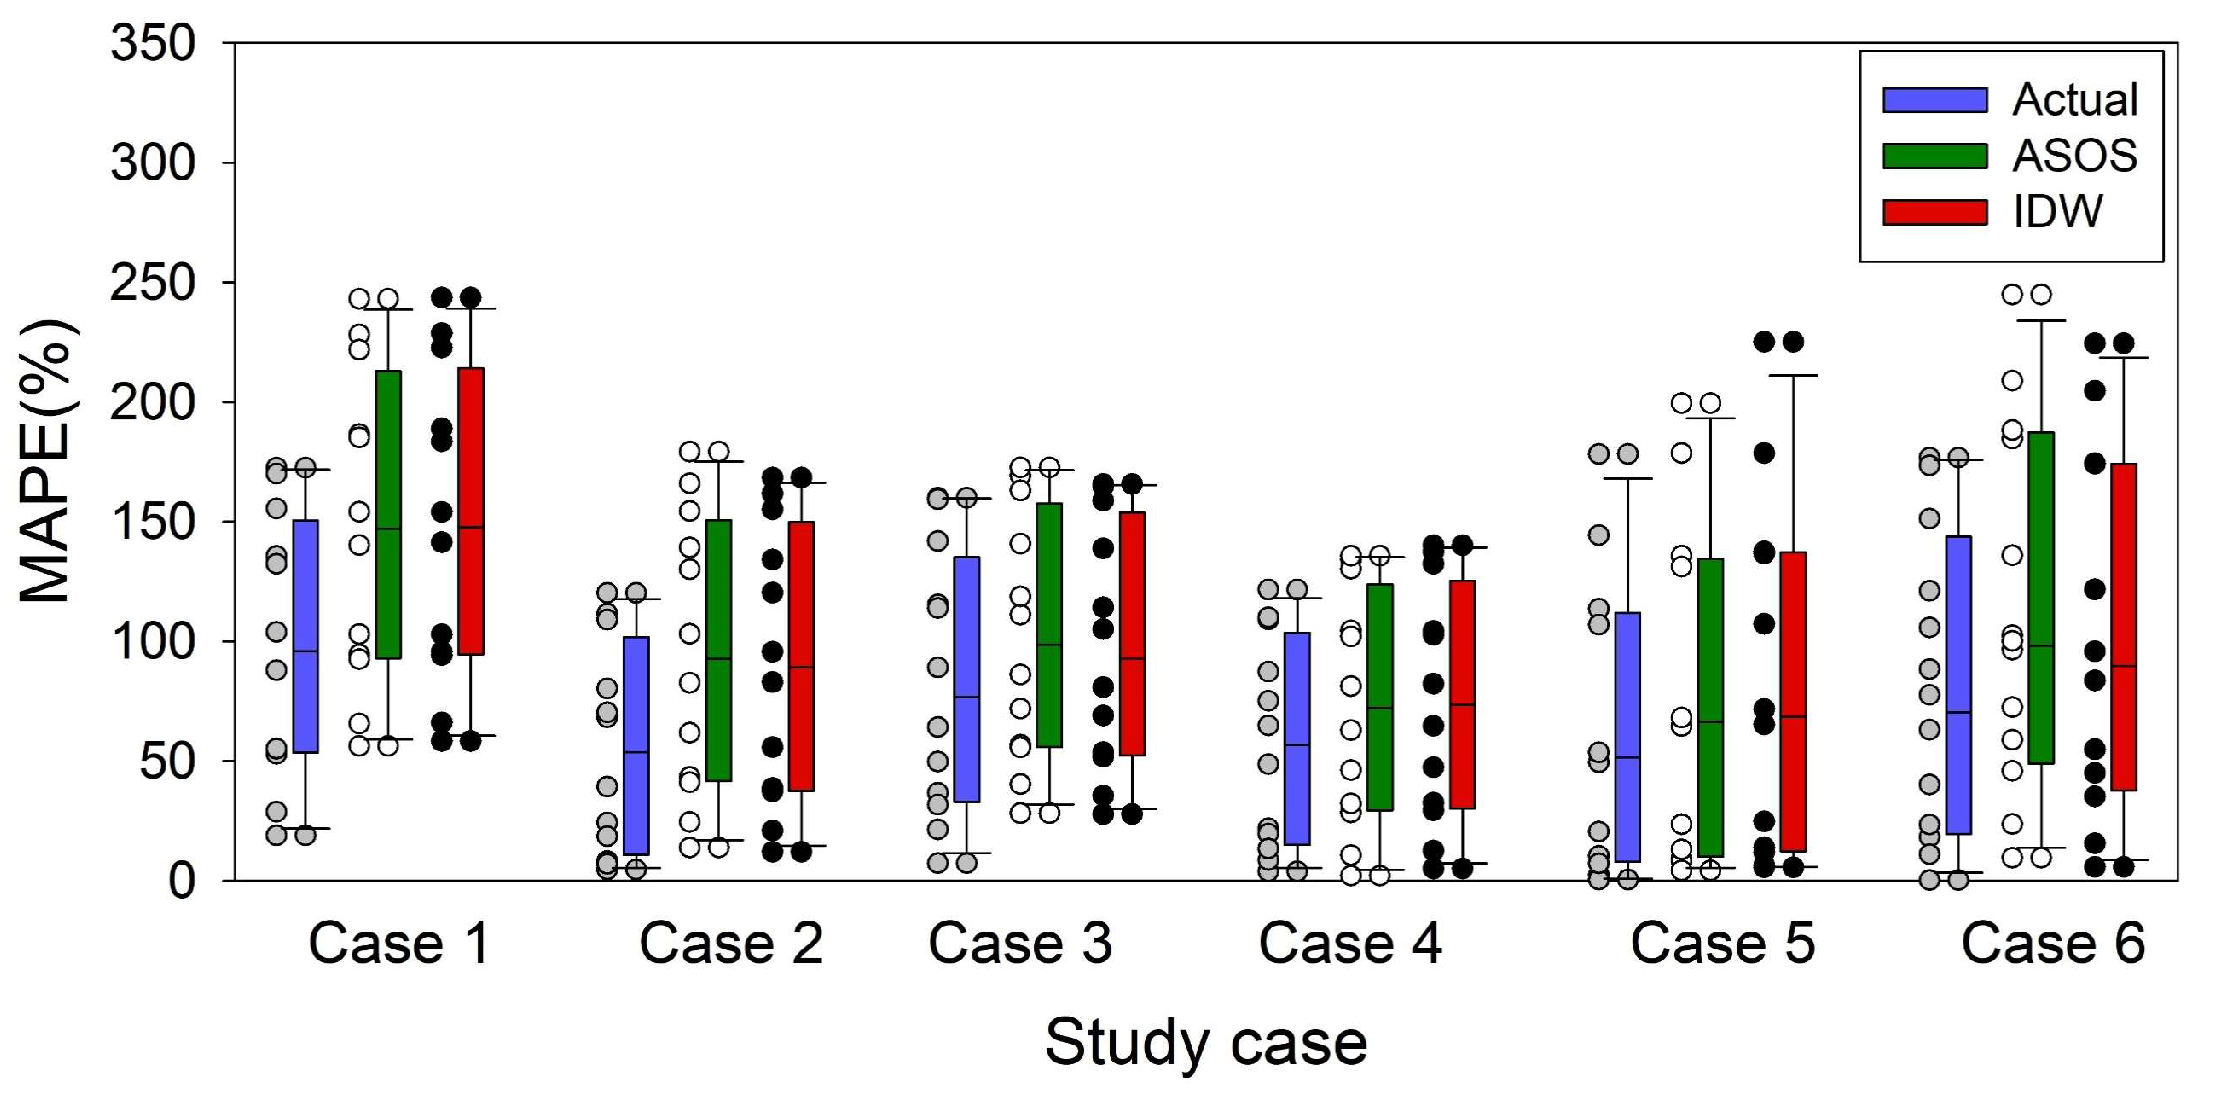
Figure 8 shows the actual monthly power output for each case and the power output predicted by the actual weather data, ASOS data, and IDW data. As the number and capacity of PV modules are different for each case, the amount of power output is different; however, in common, the amount of power output is greatest in May–June, when solar radiation is substantial, and shows the smallest trend in December–January. In general, the predicted output is larger than actual output. As mentioned in Section 4.1.1, the real environment is affected by temporary and irregular blind elements, such as clouds and shadows, but the formula cannot reflect them all. Therefore, the predicted power output is generally larger than the actual output. The accuracy of predicted power output for each case, MAPE, was analyzed, as shown in Figure 9. The circle in the figure indicates the MAPE for each month and represents the boxplot of the circles. It represents the results predicted by actual insolation measured at each case location, ASOS insolation, and IDW insolation. Although there were differences by case, the six cases were generally the most accurate when predicted using actual insolation, and the total average MAPE of the six cases was 12.0%. The next most accurate was IDW solar radiation, followed by ASOS solar radiation, and total average MAPE was 19.2% and 21.8%, respectively.
More specifically, by analyzing IDW prediction results for each case, Case 4 was found to be very accurate, with an average of 2.0% for 12 months, and Cases 2, 3, 5, and 6 were 13.1%, 19.8%, 11.3%, and 16.2%, respectively. According to Table 1, accuracy was analyzed as “Good”. Although the prediction of Case 5 was “Fail” at 52.8%, in many cases, including Case 5, the accuracy of estimating power output was better or similar when IDW was used rather than ASOS. Therefore, it may be better to use IDW technology to determine which data are effective when there are no measurement data for the target location.
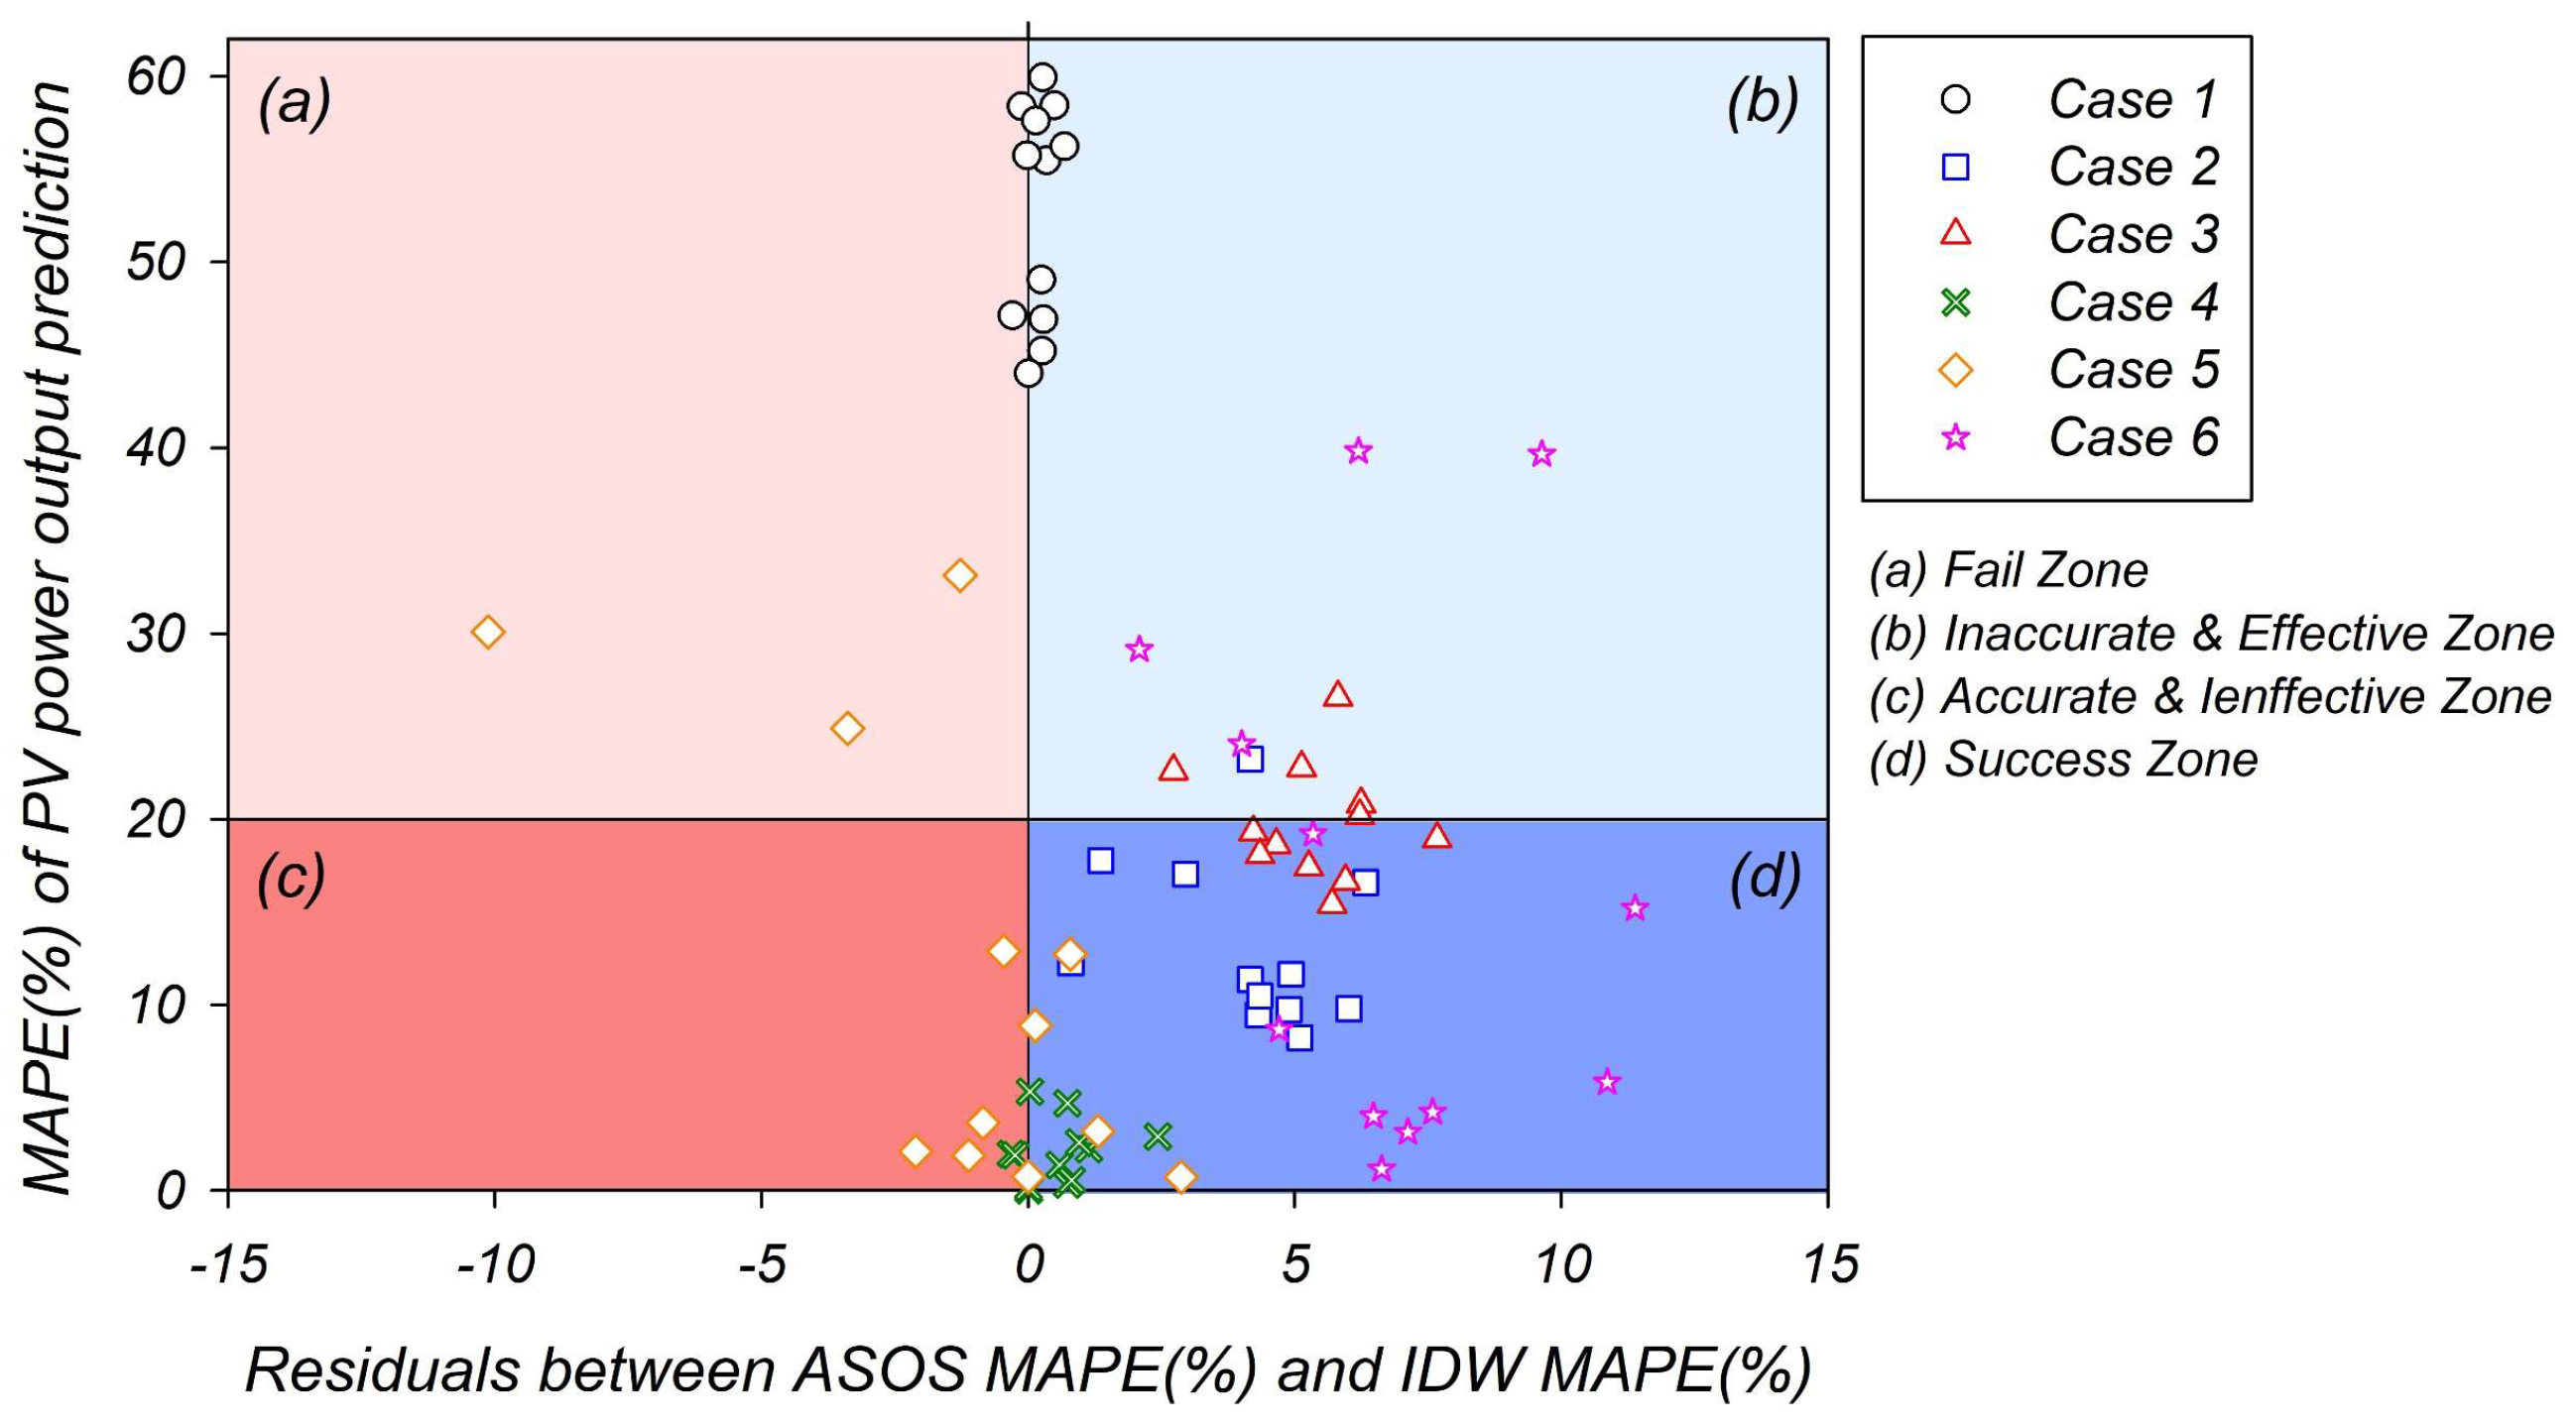
To confirm concretely and visually whether using IDW technology is better than using nearby public data when there are no measurement data at the target location, it is expressed as a discriminant graph, as shown in Figure 10. The horizontal axis means the difference between the MAPE of the power output predicted by ASOS solar radiation and MAPE of the power output predicted by IDW solar radiation. Here, the blue area means that PV power output prediction by IDW is more accurate, and it is defined as “effective” in contrast to using ASOS data. The vertical axis indicates the MAPE of PV generation forecasting, and according to Table 1, less than 20%, which is a “good” level, was defined as an accurate area and more than 20% as an inaccurate area. According to the discriminant graph, it can be classified as (a) an incorrect and ineffective fail zone, (b) an inaccurate but effective zone, (c) an accurate but ineffective zone, and (d) an accurate and effective success zone. As confirmed in Figure 9, the accuracy of PV generation forecasting may be accurate or inaccurate for each case, but many prediction results are located in zones (b) and (d), which are more effective than the ASOS. This means that using IDW can be more accurate with a high probability when there are no measurement data for the target location. If analyzed numerically, the prediction result using Equation (3) shows that ~83.3% of the monthly prediction results of the six cases are zones (b) and (d).

4.2.2. Estimation of Formulae That Use Solar Radiation and Air Temperature

Among the physical models that predict the amount of solar power generation, Equation (4) includes the array area, array efficiency, solar radiation variables, and outdoor temperature variables. Therefore, PV power output was estimated by substituting solar radiation and air temperature predicted by IDW technology, and the difference with actual power output was confirmed. As in Section 4.2.1, PV power output estimated by the variables of IDW prediction, predicted by ASOS measurement value and actual meteorological variables measured at the location of the cases, were reviewed together.
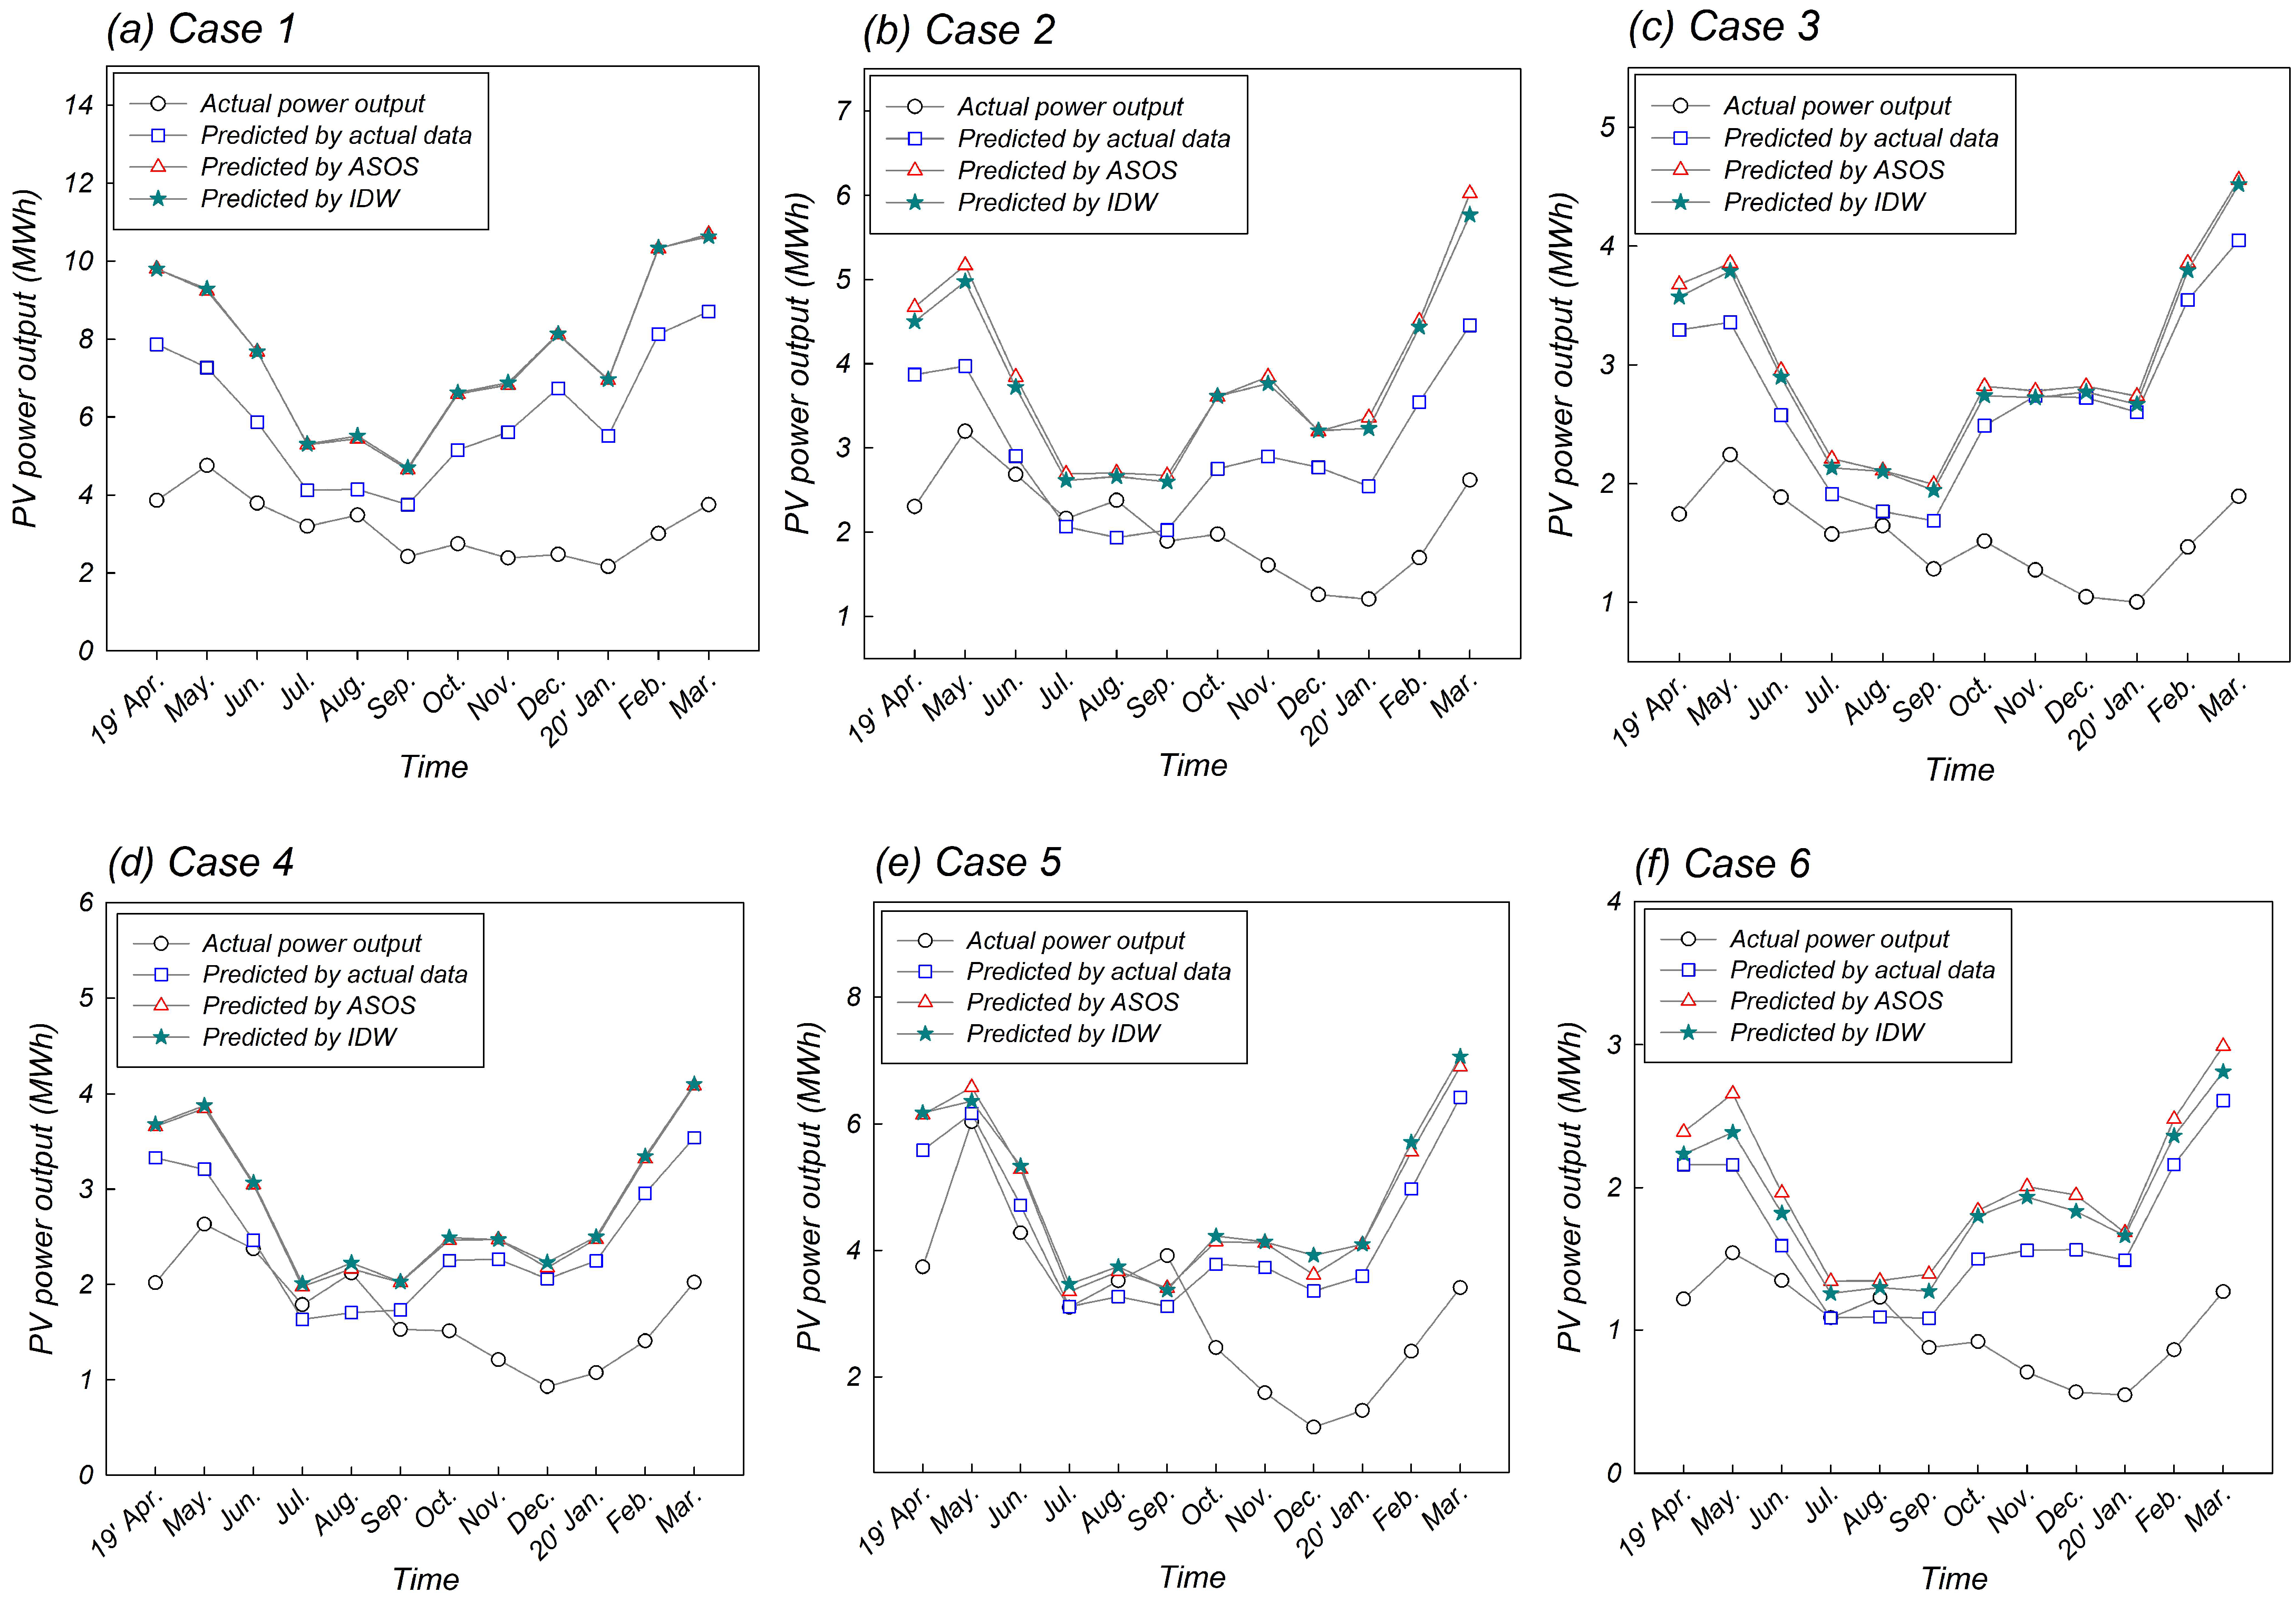
The output of each case, estimated using Equation (4), is shown in Figure 11. The power output predicted by Equation (4) was generally higher than the actual power output; in particular, the error was very large in periods other than July to September when the outdoor air temperature was lower than 25 °C. Figure 12, which shows the accuracy of the predicted output for each case, also shows that the error is very large. In the figure, the circle represents the MAPE of each month and the boxplot of the circles. The error was very large even when predicting power output using actual weather data measured at the location of the cases, although there was a difference in the degree of each case, and average MAPE of the six cases was 72.8%. The accuracy of the results predicted by IDW solar radiation and temperature was 74.2% in Case 4, which was the smallest, followed by Case 5 at 82.0%, Case 2 at 90.2%, Case 3 at 97.1%, Case 6 at 103.0%, and Case 1 at 145.4%. Therefore, it showed an unacceptable range of errors as a predictive model of PV power output.
Equation (4) has a structure similar to that of Equation (3), but it is a form of additionally multiplying a certain ratio according to the outside temperature. In this formula, to reflect the increase in the module temperature owing to the increase in the outside temperature and the decrease in efficiency and power generation, it is inferred that a ratio of less than 1 is multiplied if it is 25 °C or more. However, it is conjectured that this ratio does not fit the current situation in Korea.
Although the result of PV power output prediction was an error in an unacceptable range, the results of Equation (4) were also analyzed to confirm whether using IDW technology improves prediction accuracy compared to using nearby public data. The result of the power generation predicted by Equation (4) is also shown in using the discriminant graph described in Section 4.2.1. The discrimination graph by Equation (4) is expressed in Figure 13. Because the prediction error of Equation (4) was very high, approximately 87.5% of the monthly prediction results of the six cases were distributed in zones (a) and (b).
Regardless of whether the error rate itself is accurate or inaccurate, it is possible to infer which is more effective using IDW or ASOS data based on the results in zones (b) and (d). Prediction results located in zones (b) and (d) were 54.1% of the total monthly prediction results, which was not significantly different from the proportion of results located in zones (a) and (c). This means that it cannot be determined with certainty that either one of them is definitely superior, whether using ASOS data or IDW to predict PV power output. Nevertheless, it can be inferred that the prediction by IDW is more positive because the results distributed in zones (b) and (d) are relatively farther from zero than those located in zones (a) and (c). In other words, the farther away from the zero point on the horizontal axis in the discriminant graph, the better the accuracy compared with the counterpart. Although it is unclear whether IDW or ASOS data are better to utilize, as the ratios distributed in (a) and (c) and (b) and (d) are similar, the degree and quality of accuracy when using IDW data may be more positive.

5. Conclusions

Photovoltaic power output forecasting is necessary for the overall management of a PV system, such as designing capacity, planning efficient operation, or detecting abnormalities during operation. Because of this necessity, various methodologies for predicting PV power output are being developed; in particular, prediction technology using machine learning and big data is developing rapidly. However, despite the high level of accuracy due to the use of technologies such as machine learning and AI using big data, it is a method that requires data learning; therefore, most of the technologies require benchmark data to use the technology. In this study, an IDW-based prediction framework was proposed for predicting power output when there are no meteorological data (i.e., benchmark data) from the location where the PV system or a power plant are installed.
When estimating the amount of power output using the PV power output prediction model, if there are meteorological data at the location of the power plant, it is more accurate to predict the amount of power output using this data. However, if there are no measured data, it was confirmed that it is more beneficial to use the weather data predicted by IDW, rather than public data such as ASOS, as replacement data. The forecasting accuracy depends on the power generation forecasting model and proven case, but when comparing the 12-month average prediction error value of each case, the prediction error can be reduced up to 0.58 times compared to when using ASOS data. Further, the use of IDW is suitable when predicting power output, because the probability of improving accuracy when using IDW is higher than that when using ASOS.
In addition, it was found that the final accuracy of the power output predicted based on spatial statistical techniques is determined by the accuracy of predicting weather data with IDW and PV power output using weather data from the location where the power plant is installed. More precisely, the final accuracy of the power output predicted with IDW was analyzed in a manner similar to the sum of the accuracy of predicting the meteorological variable by IDW and accuracy of the power output predicted by actual meteorological data measured at the location of the PV plant. Therefore, if the power prediction model is accurate, the accuracy of the IDW-based PV prediction results is expected to improve.
Similarly, this study used only two physical models, but if other predictive models were used, it is expected that the accuracy would be improved. Furthermore, if the accuracy of IDW itself is improved by adjusting the distance coefficient and selecting stations for spatial statistics, the effect of predicting the amount of PV power output using spatial statistics is expected to increase.

Author Contributions

Conceptualization, Y.L. and D.C.; methodology, Y.J.; software, Y.L.; validation, Y.J., Y.L., and M.K.; formal analysis, Y.L.; investigation, Y.J.; resources, D.C.; data curation, M.K.; writing—original draft preparation, Y.L.; writing—review and editing, D.C.; visualization, M.K.; supervision, Y.J.; project administration, D.C.; funding acquisition, D.C. All authors have read and agreed to the published version of the manuscript.

Funding

This work was supported by the National Research Foundation of Korea (NRF) grant funded by the Korean government (MSIT) (No. 2020R1F1A1073949).

Institutional Review Board Statement

Not applicable.

Informed Consent Statement

Not applicable.

Data Availability Statement

Not applicable.

Conflicts of Interest

The authors declare no conflict of interest.

References

  1. Gouda, S.G.; Hussein, Z.; Luo, S.; Yuan, Q. Model selection for accurate daily global solar radiation prediction in China. J. Clean. Prod. 2019, 221, 132–144. [Google Scholar] [CrossRef]
  2. Feng, Y.; Hou, W.; Cui, N.; Gong, D.; Gao, L. Machine learning models to quantify and map daily global solar radiation and photovoltaic power. Renew. Sust. Energ. Rev. 2020, 118, 109393. [Google Scholar] [CrossRef]
  3. Choi, J.; Lee, I.-W.; Cha, S.-W. Analysis of data errors in the solar photovoltaic monitoring system database: An overview of nationwide power plants in Korea. Renew. Sust. Energ. Rev. 2022, 156, 112007. [Google Scholar] [CrossRef]
  4. Hossain, M.S.; Mahmood, H. Short-term photovoltaic power forecasting using an LSTM neural network and synthetic weather forecast. IEEE Access 2020, 8, 172524–172533. [Google Scholar] [CrossRef]
  5. Huld, T.; Müller, R.; Gambardella, A. A new solar radiation database for estimating PV performance in Europe and Africa. Sol. Energy 2012, 86, 1803–1815. [Google Scholar] [CrossRef]
  6. Chung, M.H. Estimating solar insolation and power generation of photovoltaic systems using previous day weather data. Adv. Civ. Eng. 2020, 2020, 8701368. [Google Scholar] [CrossRef]
  7. Gueymard, C.A.; Myers, D.R. Validation and ranking methodologies for solar radiation models. In Modeling Solar Radiation at the Earth’s Surface: Recent Advances, 1st ed.; Badescu, V., Ed.; Springer: London, UK, 2008; pp. 479–509. [Google Scholar]
  8. Lima, F.J.L.; Martins, F.R.; Pereira, E.B.; Lorenz, E. Forecast for surface solar irradiance at the Brazilian Northeastern region using NWP model and artificial neural networks. Renew. Energy 2016, 87, 807–818. [Google Scholar] [CrossRef]
  9. Alsamamra, H.; Ruiz-Arias, J.A.; Pozo-Vázquez, D.; Tovar-Pescador, J. A comparative study of ordinary and residual kriging techniques for mapping global solar radiation over southern Spain. Agric. For. Meteorol. 2009, 149, 1343–1357. [Google Scholar] [CrossRef]
  10. Hofierka, J.; Šúri, M. The solar radiation model for open source GIS: Implementation and applications. In Proceedings of the Open Source GIS-GRASS Users Conference, Trento, Italy, 11–13 September 2002. [Google Scholar]
  11. Ceballos, J.C.; Bottino, M.J.; Souza, J.M. A simplified physical model for assessing solar radiation over Brazil using GOES 8 visible imagery. J. Geophys. Res. Solid Earth 2004, 109, D02211. [Google Scholar] [CrossRef]
  12. Gois, G.; Souza, J.C.S.; de Oliveira-Júnior, J.F.; Delgado, R.C.; Lyra, G.B.; Teodoro, P.E. Models to estimate incident solar radiation on Seropédica, Rio de Janeiro. Biosci. J. 2016, 32, 505–513. [Google Scholar] [CrossRef]
  13. Lima, A.O.; Lyra, G.B.; de Souza, J.L.; Lyra, G.B.; de Oliveira-Júnior, J.F.; Santos, A.A.R. Assessment of monthly global solar irradiation estimates using air temperature in different climates of the state of Rio de Janeiro, Southeastern Brazil. SN Appl. Sci. 2019, 1, 1002. [Google Scholar] [CrossRef] [Green Version]
  14. dos Santos, C.M.; Escobedo, J.F.; Teramoto, É.T.; da Silva, S.H.M.G. Assessment of ANN and SVM models for estimating normal direct irradiation (Hb). Energy Convers. Manag. 2016, 126, 826–836. [Google Scholar] [CrossRef] [Green Version]
  15. da Silva, M.B.P.; Escobedo, J.F.; Rossi, T.J.; dos Santos, C.M.; da Silva, S.H.M.G. Performance of the Angstrom-Prescott model (A-P) and SVM and ANN techniques to estimate daily global solar irradiation in Botucatu/SP/Brazil. J. Atmos. Sol.-Terr. Phys. 2017, 160, 11–23. [Google Scholar] [CrossRef]
  16. Pessanga, M.S.; dos Santos, L.M.; Lyra, G.B.; Lima, A.O.; Lyra, G.B.; de Souza, J.L. Interpolation methods applied to the spatialization of monthly solar irradiation in a region of complex terrain in the state of Rio de Janeiro in the southeast of Brazil. Model. Earth Syst. Environ. 2021, 7, 1565–1578. [Google Scholar] [CrossRef]
  17. Martins, F.R.; Pereira, E.B. Estudo comparative daconfiabilidade de estimativas de irradiação solar para o sudeste brasileiro obtidas a partir de dados de satélite e por interpolação/extraplação de dados de superfície. Rev. Bras. Geofísica 2011, 29, 265–276. [Google Scholar] [CrossRef]
  18. Burrough, P.A.; McDonnell, R.A.; Lloyd, C.D. Principles of Geographical Information Systems, 3rd ed.; Oxford University Press: New York, NY, USA, 2015. [Google Scholar]
  19. Wu, G.; Leeuw, J.; Skidmore, A.; Liu, Y.; Prins, H. Comparison of extrapolation and interpolation methods for estimating daily photosynthetically active radiation (PAR). Geo. Spat. Inf. Sci. 2012, 13, 235–242. [Google Scholar] [CrossRef] [Green Version]
  20. Hodam, A.; Sarkar, S.; Marak, A.G.R.; Bandyopadhyay, A.; Bhadra, A. Spatial interpolation of reference evapotranspiration in India: Comparison of IDW and Kriging methods. J. Inst. Eng. A 2017, 98, 511–524. [Google Scholar] [CrossRef]
  21. Jeong, D.I.; St-Hilaire, A.; Gratton, Y.; Bélanger, C.; Saad, C. A guideline to select an estimation model of daily global solar radiation between geostatistical interpolation and stochastic simulation approaches. Renew. Energy 2017, 103, 70–80. [Google Scholar] [CrossRef] [Green Version]
  22. Park, J.H.; Park, J.K. Comparison of spatial interpolation methods for the estimation of solar radiation in South Korea. Glob. J. Pure. Appl. Sci. 2013, 1, 555–561. [Google Scholar]
  23. Breci, K.; Topič, M. Photovoltaics (PV) system energy forecast on the basis of the local weather forecast: Problems, uncertainties and solutions. Energies 2018, 11, 1143. [Google Scholar] [CrossRef] [Green Version]
  24. Wagner, P.D.; Fiener, P.; Wilken, F.; Kumar, S.; Schneider, K. Comparison and evaluation of spatial interpolation schemes for daily rainfall in data scarce regions. J. Hydrol. 2021, 464–465, 388–400. [Google Scholar] [CrossRef]
  25. Otieno, H.; Yang, J.; Liu, W.; Han, D. Influence of rain gauge density on interpolation method selection. J. Hydrol. Eng. 2014, 19, 04014024. [Google Scholar] [CrossRef]
  26. Goovaerts, P. Geostatistical approaches for incorporating elevation into the spatial interpolation of rainfall. J. Hydrol. 2000, 288, 113–129. [Google Scholar] [CrossRef]
  27. Wojciech, M. Inverse distance weighting method optimization in the process of digital terrain model creation based on data collected from a multibeam echosounder. Appl.Geomat. 2020, 12, 397–407. [Google Scholar] [CrossRef]
  28. Monteiro, C.; Fernandez-Jimenez, L.A.; Ramirez-Rosado, I.J.; Muñoz-Jimenez, A.; Lara-Santillan, P.M. Short-Term forecasting models for photovoltaic plants: Analytical versus soft-computing techniques. Math. Probl. Eng. 2013, 2013, 767284. [Google Scholar] [CrossRef] [Green Version]
  29. Antonanzas, J.; Osorio, N.; Escobar, R.; Urraca, R.; Martinez-de-Pison, F.J.; Antonanzas-Torres, F. Review of photovoltaic power forecasting. Sol. Energy 2016, 136, 78–111. [Google Scholar] [CrossRef]
  30. Montgomery, D.C.; Jennings, C.L.; Kulahci, M. Introduction to Time Series Analysis and Forecasting, 1st ed.; Wiley: Hoboken, NJ, USA, 2008. [Google Scholar]
  31. Mellit, A.; Pavan, A.M.; Ogliari, E.; Leva, S.; Lughi, V. Advanced methods for photovoltaic output power forecasting: A review. Appl. Sci. 2020, 10, 487. [Google Scholar] [CrossRef] [Green Version]
  32. D’Alessandro, V.; Di Napoli, F.; Guerriero, P.; Daliento, S. An automated high-granularity tool for a fast evaluation of the yield of PV plants accounting for shading effects. Renew. Energy 2015, 83, 294–304. [Google Scholar] [CrossRef]
  33. Mellit, A.; Kalogirou, S.A. Artificial intelligence techniques for photovoltaic applications: A review. Prog. Energy Combust. Sci. 2008, 34, 574–632. [Google Scholar] [CrossRef]
  34. Duffie, J.A.; Beckman, W.A. Solar Engineering of Thermal Processes, 3rd ed.; Wiley: Hoboken, NJ, USA, 2006. [Google Scholar]
  35. SAUR ENERGY. Available online: https://www.saurenergy.com/solar-energy-blog/here-is-how-you-can-calculate-the-annual-solar-energy-output-of-a-photovoltaic-system (accessed on 25 March 2016).
  36. United States Environmental Protection Agency. Available online: https://www.epa.gov/green-power-markets/green-power-equivalency-calculator-calculations-and-references (accessed on 25 February 2022).
  37. NREL Annual Technology Baseline. 2021. Available online: https://atb.nrel.gov/electricity/2021/commercial_pv (accessed on 15 October 2022).
  38. NREL PVWatts® Calculator. 2021. Available online: https://pvwatts.nrel.gov (accessed on 15 October 2022).
  39. Wan, C.; Zhao, J.; Song, Y.; Xu, Z.; Lin, J.; Hu, Z. Photovoltaic and solar power forecasting for smart grid energy management. CSEE J. Power Energy Syst. 2015, 1, 38–46. [Google Scholar] [CrossRef]
  40. Sarkara, S.; Rao, U.; Prema, V.; Bhargav, J.; Shourya, T.R. Novel modular LS-SVM based regression model for prediction of solar power. Int. J. Eng. Sci. Manag.-Multidiscip. J. VTU 2019, 1, 1–7. [Google Scholar]
  41. Kuo, P.H.; Chen, H.C.; Huang, C.J. Solar Radiation Estimation Algorithm and Field Verification in Taiwan. Energies 2018, 11, 1374. [Google Scholar] [CrossRef]
  42. Loghmari, I.; Timoumi, Y.; Messadi, A. Performance comparison of two global solar radiation models for spatial interpolation purposes. Renew. Sust. Energ. Rev. 2018, 82, 837–844. [Google Scholar] [CrossRef]
  43. Wu, W.; Gan, R.; Li, J.; Cao, X.; Ye, X.; Zhang, J.; Qu, H. A spatial interpolation of meteorological parameters considering geographic semantics. Adv. Meteorol. 2020, 2020, 9185283. [Google Scholar] [CrossRef]
  44. Park, J.K.; Das, A.; Park, J.H. A new approach to estimate the spatial distribution of solar radiation using topographic factor and sunshine duration in South Korea. Energy Conserv. Manag. 2015, 101, 30–39. [Google Scholar] [CrossRef]
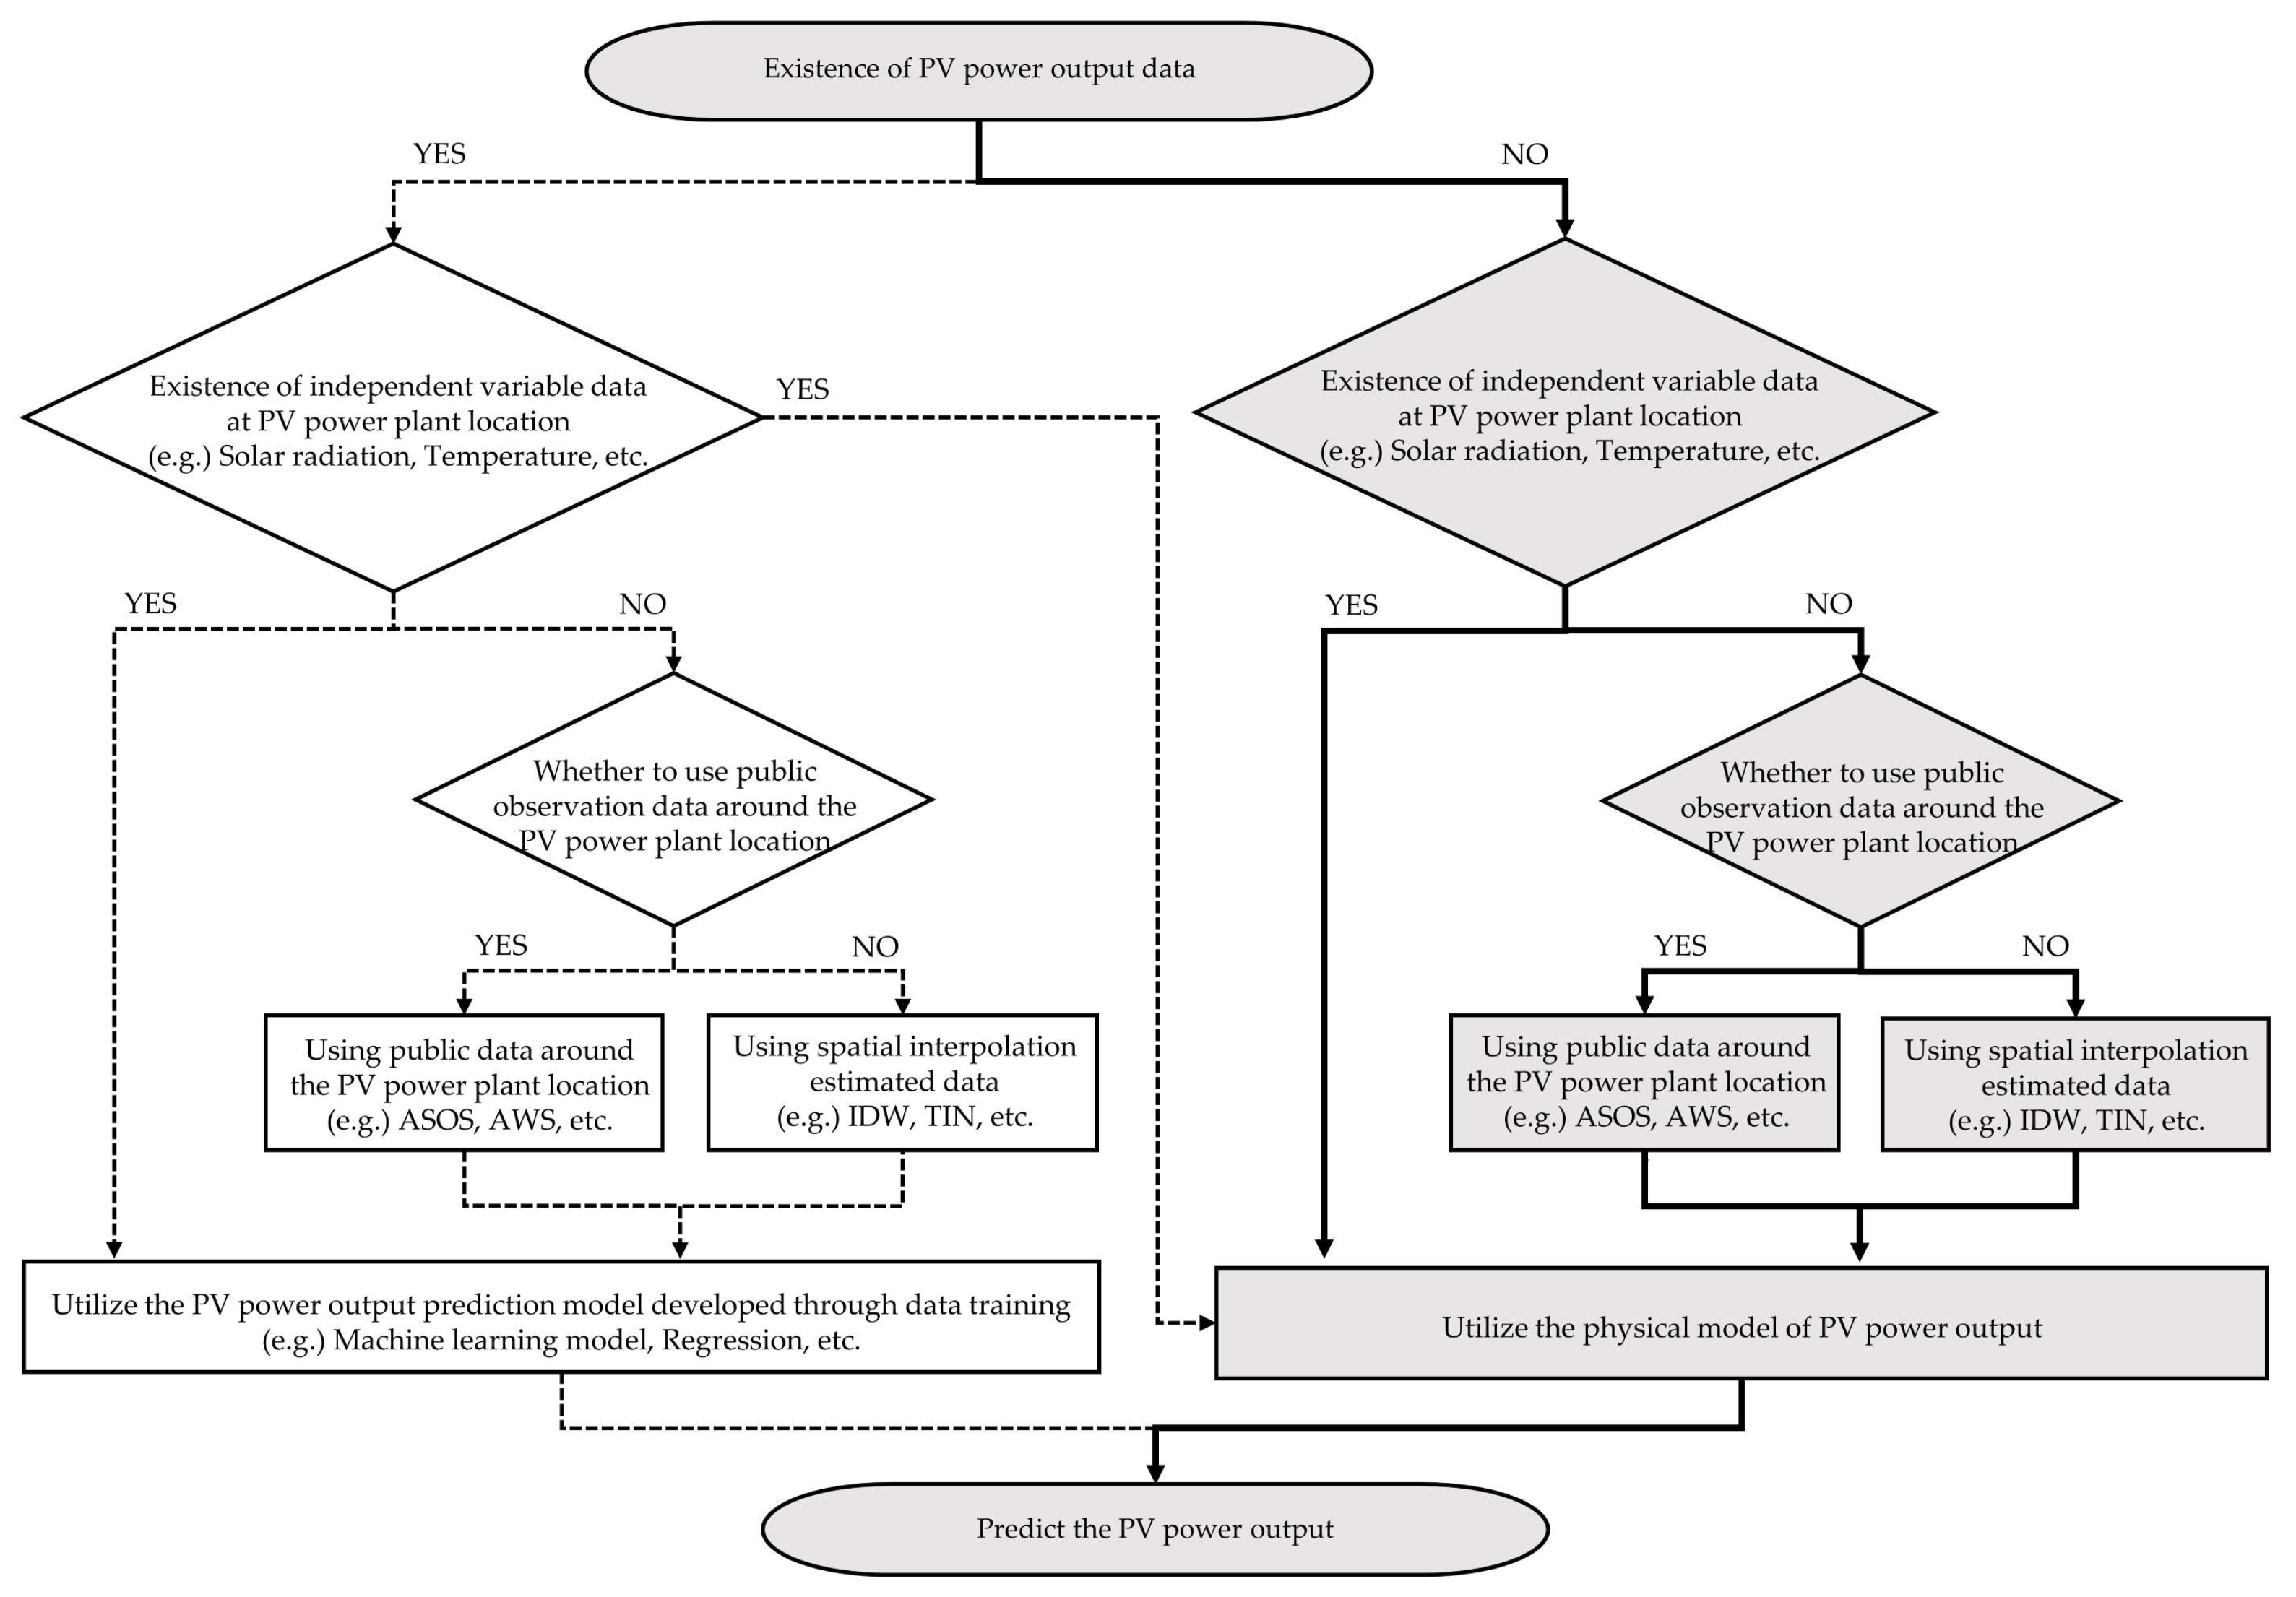
Figure 1. Conceptual diagram of photovoltaic (PV) power output prediction process applying spatial statistical techniques.
Energies 15 08755 g001
Figure 2. Spatial maps showcasing the detailed location of each study area and the location of the nearest ASOS station in each study case (Case 1–Case 6).
Energies 15 08755 g002
Figure 3. Spatial map depicting the ASOS stations in South Korea. (a) ASOS meteorological station to measure air temperature, (b) ASOS meteorological station to measure solar radiation.
Energies 15 08755 g003
Figure 4. Spatial map depicting the ASOS stations in South Korea. (a) Annual average of daily cumulative solar radiation, (b) Average annual temperature during the daytime.
Energies 15 08755 g004
Figure 5. Histogram of results (values of pixels) predicted by IDW. (a) Annual average of daily cumulative solar radiation, (b) Average annual temperature during the daytime.
Energies 15 08755 g005
Figure 6. Actual observations of case studies. (a) Monthly average of daily cumulative solar radiation, (b) Monthly average temperature during the daytime.
Energies 15 08755 g006
Figure 7. Boxplot of monthly MAPE for ASOS and IDW in each case; (a) solar radiation, (b) air temperature.
Energies 15 08755 g007
Figure 8. Monthly actual PV power output for each case and predicted power output estimated by Equation (3).
Energies 15 08755 g008
Figure 9. Box plot of error MAPE predicted by Equation (3) according to the data type substituted.
Energies 15 08755 g009
Figure 10. Discriminant graph classifying the accuracy of the power output result predicted by Equation (3).
Energies 15 08755 g010
Figure 11. Monthly actual PV power output for each case and predicted power output estimated by Equation (4).
Energies 15 08755 g011
Figure 12. Box plot of error MAPE predicted by Equation (4) according to the data type substituted.
Energies 15 08755 g012
Figure 13. Discriminant graph classifying the accuracy of the power output result predicted by Equation (4).
Energies 15 08755 g013
Table 1. Mean Absolute Percentage Error (MAPE) estimation accuracy classification [41].
MAPE Value (%)Model Accuracy
MAPE < 10Very good (The closer to 0 the better)
10 ≤ MAPE < 20Good
20 ≤ MAPE < 50Reasonable
50 ≤ MAPEFalse
Table 2. Information on public meteorological stations adjacent to each case.
IDStateSolar Radiation Measured ASOSAir Temperature Measured ASOS
Closest ASOS Closest
ASOS ID
Distance to
Closest ASOS (km)
Closest ASOS Closest
ASOS ID
Distance to
Closest ASOS (km)
Case 1PohangPohangA1384.45PohangA1384.45
Case 2GwangjuGwangjuA1568.73GwangjuA1568.73
Case 3SuncheonGwangyangA26610.67GwangyangA26610.67
Case 4WonjuWonjuA14414.08WonjuA14414.08
Case 5ChungjuWonjuA14435.93ChungjuA1274.86
Case 6GunsanJeonjuA14650.09GunsanA14017.22
Table 3. Information of PV system for each case.
IDStatePV System Specification
Total
Capacity
Number of PVPV ModulesPmax of
Module
Maximum Power
Voltage
(Vpmax)
Maximum Power
Current
(Ipmax)
Open
Circuit Voltage(Voc)
Short
Circuit Current
(Isc)
Rated
Efficiency
Sum of Cell Area per
Module
(MW)(W)(V)(A)(V)(A)(%)(m2)
Case 1Pohang1.128376030036.78.1845.88.6315.381.75
Case 2Gwangju0.618187233037.78.7645.49.4116.551.67
Case 3Suncheon0.461153630043.28.7841.99.2816.381.53
Case 4Wonju0.499151233037.78.7645.49.4116.551.67
Case 5Chungju1.010306033033.939.7441.5710.1519.561.51
Case 6Gunsan0.29790033037.78.7645.49.4116.551.67
Table 4. Monthly average of daily cumulative solar radiation estimated by IDW for each case study, and the difference between the observed value and closest ASOS * value of each study case. (* indicates nearest location).
IDMonthActualEstimation
(IDW)
MAPE
(IDW)
ASOS *MAPE
(ASOS *)
IDMonthActualEstimation
(IDW)
MAPE
(IDW)
ASOS *MAPE
(ASOS *)
Wh/m2Wh/m2%Wh/m2%Wh/m2Wh/m2%Wh/m2%
Case 119′ Apr.3749.34624.123.334632.423.55Case 219′ Apr.4235.94428.34.544625.79.20
May5118.16092.319.036104.319.27May6041.56375.75.536725.411.32
Jun.4293.45247.322.225259.022.49Jun.5094.05373.65.495626.810.46
Jul.3648.34401.520.654420.721.17Jul.4083.54350.76.544522.610.75
Aug.3824.24684.322.494698.922.87Aug.4423.64749.87.374927.511.39
Sep.2513.83095.323.133092.923.03Sep.3367.93698.09.803861.414.65
Oct.2457.83174.429.163179.829.38Oct.3276.73814.816.423859.117.77
Nov.1973.22479.425.652479.125.64Nov.2601.63122.820.033228.424.09
Dec.1824.22285.825.302289.625.51Dec.1955.52161.410.532176.811.32
20′ Jan.1587.32048.229.032048.429.0520′ Jan.1861.62246.720.682368.827.24
Feb.2502.33279.131.053282.231.17Feb.2754.23240.117.643321.620.60
Mar.3424.14212.523.034204.122.78Mar.4126.74901.218.775093.923.44
Average3076.33802.024.513807.624.66Average3651.94038.611.954194.816.02
Case 319′ Apr.4357.24459.52.354687.17.57Case 419′ Apr.4530.54655.62.764656.22.78
May6029.36109.51.336425.66.57May6202.46455.64.086501.04.81
Jun.5257.75246.20.225432.33.32Jun.5735.05784.00.855848.61.98
Jul.4391.44374.10.394600.64.76Jul.4356.54326.60.694313.01.00
Aug.4631.14677.51.004892.45.64Aug.5018.94996.90.445025.90.14
Sep.3350.63423.42.173566.56.44Sep.3457.53590.13.833623.64.80
Oct.3705.83677.40.763914.85.64Oct.3230.23394.35.083394.05.07
Nov.3011.42865.94.833007.60.13Nov.2450.22622.07.012628.57.28
Dec.2424.72378.31.912471.71.94Dec.1842.91985.87.751936.05.06
20′ Jan.2333.52294.31.682397.12.9220′ Jan.2054.82240.79.052239.99.01
Feb.3385.73464.92.343592.66.11Feb.2881.93133.98.753110.77.94
Mar.4509.84799.66.434906.28.79Mar.4114.04573.611.174536.110.26
Average3949.03980.92.124157.94.97Average3822.93979.95.123984.55.01
Case 519′ Apr.4553.54663.02.414656.22.26Case 619′ Apr.4602.94447.53.384739.32.96
May6469.96220.60.916501.00.48May6008.66220.63.536859.114.15
Jun.5651.25848.66.085848.611.23Jun.5333.25364.90.605735.77.55
Jul.4383.94405.00.484313.01.62Jul.4384.54330.51.234645.85.96
Aug.4946.54962.90.335025.91.60Aug.4995.34776.523.885074.031.60
Sep.3532.03555.90.683623.62.59Sep.3435.23532.52.833881.813.00
Oct.3187.33422.07.363394.06.48Oct.3397.83610.96.273727.49.70
Nov.2425.92639.28.792628.58.35Nov.2462.42800.513.732924.718.78
Dec.1827.52099.314.871936.05.94Dec.1970.42171.010.182320.817.78
20′ Jan.1987.12224.311.942239.912.7220′ Jan.2010.92137.26.282171.77.99
Feb.2859.63203.512.033110.78.78Feb.3065.63208.34.653352.29.35
Mar.4284.64658.98.744536.15.87Mar.4517.84698.84.014902.48.51
Average3842.43991.96.253984.55.02Average3848.73941.65.094194.69.78
Table 5. Monthly average of air temperature estimated by IDW, and the difference between observation value and nearest ASOS * value in each case study. (* indicates nearest location).
IDMonthActualEstimation
(IDW)
MAPE
(IDW)
ASOS *MAPE
(ASOS *)
IDMonthActualEstimation
(IDW)
MAPE
(IDW)
ASOS *MAPE
(ASOS *)
°C°C%°C%°C°C%°C%
Case 119′ Apr.15.2214.921.9815.01.73Case 219′ Apr.17.4414.3517.7214.516.65
May23.6722.116.6122.35.90May24.4520.6015.7321.014.23
Jun.24.0322.556.1622.65.98Jun.26.8722.9614.5423.313.44
Jul.27.8926.724.1826.83.74Jul.29.0226.0110.3726.29.81
Aug.29.1827.814.7028.13.74Aug.31.4927.7012.0428.110.93
Sep.24.2523.911.4324.10.72Sep.26.9123.8511.3624.210.18
Oct.18.9119.040.7319.21.67Oct.21.3218.2914.2118.612.56
Nov.12.3013.096.4513.38.47Nov.14.8012.3216.7712.714.11
Dec.5.597.0626.307.228.72Dec.7.715.9223.166.318.23
20′ Jan.5.626.4614.856.616.6220′ Jan.7.365.4026.555.919.33
Feb.6.387.5017.617.619.06Feb.8.876.5526.196.922.40
Mar.11.5811.842.2511.60.13Mar.13.5210.7220.7510.522.04
Average17.0516.927.7717.038.04Average19.1516.2217.4516.5215.33
Case 319′ Apr.16.4714.7610.3515.46.56Case 419′ Apr.15.8613.6513.9113.812.80
May23.3920.9510.4621.77.10May24.1520.7913.9021.212.42
Jun.25.3422.849.8623.28.53Jun.27.3823.2315.1623.613.78
Jul.27.6925.617.5125.96.44Jul.29.6926.0212.3526.311.46
Aug.30.2827.648.7328.36.39Aug.31.4227.1813.4827.811.54
Sep.26.1423.739.2224.17.92Sep.25.2522.779.8323.08.79
Oct.21.4518.8412.1519.78.07Oct.18.1016.648.0516.96.41
Nov.14.4613.099.4514.03.53Nov.9.859.196.779.26.19
Dec.8.046.6217.677.47.60Dec.2.722.488.802.59.33
20′ Jan.7.656.0820.586.811.4820′ Jan.3.582.7921.993.211.76
Feb.8.967.3218.328.010.17Feb.5.614.0328.024.028.15
Mar.13.0611.5111.9012.08.47Mar.11.339.9412.319.813.80
Average18.5816.5812.1817.217.69Average17.0814.8913.7115.1112.20
Case 519′ Apr.16.1213.8014.4013.913.81Case 619′ Apr.15.8213.7712.9613.713.71
May22.4920.857.3121.16.21May21.4219.847.4119.68.57
Jun.25.2123.387.2623.66.44Jun.25.1722.4510.7922.311.60
Jul.28.0226.176.6126.45.72Jul.28.7325.939.7526.09.58
Aug.29.4727.267.4827.85.51Aug.30.9227.5211.0127.99.65
Sep.24.4022.846.4123.05.57Sep.26.0523.3510.3723.410.06
Oct.17.6316.516.3716.94.32Oct.20.9717.8514.8918.113.62
Nov.9.608.966.638.96.79Nov.14.0711.2719.9111.518.49
Dec.2.742.0226.082.124.64Dec.7.455.0332.425.329.13
20′ Jan.3.282.4824.252.815.1320′ Jan.6.284.4229.584.528.03
Feb.4.843.8620.283.822.27Feb.7.065.4123.475.226.45
Mar.10.4410.033.939.95.22Mar.11.129.9110.869.217.15
Average16.1914.8511.4215.0210.14Average17.9215.5616.1215.5616.34
Publisher’s Note: MDPI stays neutral with regard to jurisdictional claims in published maps and institutional affiliations.