Article

On the Stability of Particle–Particle Interaction during Gravitational Settling

Department of Ocean and Mechanical Engineering, Florida Atlantic University, 777 Glades Road, Boca Raton, FL 33431, USA
*
Author to whom correspondence should be addressed.
Energies 2022, 15(22), 8721; https://doi.org/10.3390/en15228721
Submission received: 20 October 2022 / Revised: 10 November 2022 / Accepted: 16 November 2022 / Published: 20 November 2022
(This article belongs to the Special Issue Hydraulic Fracturing: Progress and Challenges)

Abstract

:
The elevated energy demand and high dependency on fossil fuels have directed researchers’ attention to promoting and advancing hydraulic fracturing (HF) operations for a sustainable energy future. Even though previous studies have demonstrated that the proppant suspension and positioning in slickwater play a vital role during the shut-in stage of the HF operations, minimal experimental work has been conducted on the fundamental proppant–proppant interaction mechanisms, especially a complete mapping of the interactions. This study utilizes high-speed imaging to provide a 2D space- and time-resolved investigation of two-particle (proppant models: 2 mm Ø, 2.6 g · cm 3 ) interactions during gravitational settling in different initial spatial configurations and rheological properties. The mapping facilitates the identification of various interaction regimes and newly observed particle trajectories. Pure water results at a settling particle Reynolds number ( R e p ) ~ 470 show an unstable particle–particle interaction regime characterized by randomness while altering pure water to a 25% (v/v) water–glycerin mixture ( R e p   ~   200 ) transitions an unstable interaction to a stable prominent repulsion regime where particles’ final separation distance can extend up to four times the initial distance. This indicates the existence of R e p at which the stability of the interactions is achieved. The quantified trajectories indicate that when particles are within minimal proximity, a direct relation between repulsion and R e p exists with varying repulsion characteristics. This was determined by observing unique bottle-shaped trajectories in the prominent repulsion regimes and further highlighted by investigating the rate of lateral separation distance and velocity characteristics. Additionally, a threshold distance in which the particles do not interact (or negligibly interact) and settle independently seems to exist at the normalized 2D lateral separation distance.

1. Introduction

The advancements in technology have been correlated to increased global energy demand and consumption [1,2,3]. Given the current rate of technological progression, the U.S. Energy Information Administration (EIA) projects an increase in the worldwide energy demand that can reach up to 50% by the year 2050. This rapid energy demand has led to rising concerns about the sustainability of energy sources, especially fossil fuels, due to their vital role in global energy production. According to the EIA, oil and natural gas alone accounted for 68% (65.03 quadrillion British thermal units) of U.S. energy production in 2020 [4]. The elevated demand and high dependency on conventional oil have paved the path for scientists and engineers to explore new sources of oil production to secure sustainable energy sources for future generations [5,6]. Unconventional oil reservoirs have opened doors to a new era of energy production [7,8,9]. Unlike conventional oil, unconventional oil is trapped in low-permeability formations underground, such as shale rock [10,11,12]. The entrapment of unconventional oil in these formations poses a challenge in which the need for more sophisticated drilling approaches is required. Hydraulic fracturing (HF) has provided access to unconventional oil reservoirs with technological advancements in horizontal and vertical drilling techniques [13,14,15,16], making HF a promising technology for a more sustainable energy future. The HF process can be classified into the following main stages: perforation, injection, and shut-in. The perforation stage involves initiating micro-sized fractures in the shale formation using a perforating gun; this is followed by the injection stage, which involves injecting a highly pressurized particle-laden fluid (slurry) known as “slickwater”, mainly composed of water and sand proppants (99.5%) and also containing chemical additives (0.5%), into the formation. The highly pressurized incompressible fluid expands the initiated fractures and occupies the shale formation. Along with the fluid, the sand proppants are distributed in the fractures, after which the shut-in stage is begun. During shut-in, the injection is terminated, and fluid pressure is reduced. Naturally, the fractures tend to close due to elevated in situ stresses, while the transported sand proppants “prop” the fractures open and aid in the prevention of their complete closure, allowing the flow of hydrocarbons when the well is reopened [17,18,19].
Due to the proppants’ vital propping role in the injection and shut-in stages, the efficiency of HF operations depends on proppant suspension and placement in fractures [20,21,22,23,24,25]. A significant challenge for HF operations during the shut-in phase is the premature proppant settling due to the slickwater’s low viscosity properties [26,27,28]. The rapid proppant settling relates to low extraction efficiency due to reduced fracture conductivity [29]. This has led researchers and engineers to investigate proppant settling behaviors and understand particle–particle interaction mechanisms and their effect on slurry distribution in fractures. Initially, various analyses relied on single-particle Stokes law to model and understand proppant settling in HF operations [30]. While they provided some fundamental understanding of the behavior, they lacked accuracy due to excluding proppant–proppant interactions during settling and the low range of particle Reynolds number only, at which Stokes law is applicable. On the other hand, slurry (multi-proppant) settling was initially investigated by Daneshy [31]. Using numerical approaches, the author obtained a correlation that describes a slurry’s settling velocity as a function of a single particle settling velocity and particle volumetric concentration.
ν s = ν 0   [ 1 c v 10 1.82 c v ]
where ν s is slurry settling velocity, c v is volumetric particle concentration, and ν 0 is single particle settling velocity.
A few years later, Clark et al. [32] experimentally investigated proppant settling in a vertical fracture model. They obtained particle settling data from a parallel plate apparatus in which they produced a correlation that was different yet still a function of single-particle settling velocity and volumetric particle concentration.
ν s = 1 1 + 6.88   c v   ν 0
A more recent study conducted by Gadde [33] simulated the settling of proppants in fractures. They mentioned that various settling rates could significantly impact the final proppant placement in fractures. Their simulation model obtained the following second-order polynomial correlation.
ν s = ν 0 ( 2.37 c v 2 3.08 c v + 1 )
All previous models demonstrated that the hindrance of proppants settling due to increased proppant volumetric concentration reduces the overall slurry settling velocity for a given fluid viscosity denoted by ν 0 . However, as a first step towards promoting hindered settling in fractures, it is necessary to understand the proppant interactions and their effect on the placement and positioning of each other. While investigations of two spheres settling side by side indicate that when two sphere are initially separated by a small gap, they repel each other due to flow blockage in between them [34,35], minimal experimental work has been conducted on the nature of repulsion and its characteristics in various flow regimes, especially a complete mapping of the interactions. Liu et al. [36] investigated the interactions for particles larger than typical proppant size leading to varying flow characteristics compared to those of this study. Their results were limited to   R e p = 300 . This study aims to investigate the newly experimented range of pure water ( R e p ~ 470) and highlight its unique characteristics when compared to lower R e p cases.
The presented study aims to promote the understanding of particle–particle interaction during gravitational settling in different spatial configurations and rheological properties with two proppant models (2 mm Ø, 2.6 g · cm 3 ). Using high-speed imaging, 2D space- and time-resolved mapping of particle–particle interactions was utilized to extract information and identify various repulsion behaviors and characteristics as a function of the initial separation distance between the particles and particles’ settling Reynolds number ( R e p ). Additionally, the study identified and promoted a prominent repulsion regime that yields a favorable proppant positioning for an overall hindered settling in actual HF operations.

2. Materials and Methods

2.1. Materials

Polymethylmethacrylate (PMMA) sheets (1.7 and 3.175 mm thick) were purchased from McMaster-Carr (Elmhurst, IL, USA) for the fabrication of a Hele-Shaw cell device and miniature components as part of the particle release system. To print the mechanical particle release system, 3D SpiderMaker Premium Matte PLA filament (1.75 mm) was purchased from Shinkong Synthetic Fiber Corp. Glycerin (lab grade, purity ≥99.5%) was purchased from Fisher Chemical (Fair Lawn, NJ, USA) for altering fluid properties. High-precision (2 mm Ø, 2.6 g · cm 3 ) black glass particles (precision grade 25 as per ISO 3290) were purchased from Redhill Precision Specialty Balls (Lincoln, NE, USA) and utilized as proppant models in the experiments.

2.2. Experimental Apparatus

To visually observe the particle behavior, a polymethylmethacrylate (PMMA) Hele-Shaw cell transparent to visible light was designed using a 3D CAD design software package (SolidWorks, 3DS, Vélizy-Villacoublay, France). The created geometry was then exported as geometric faces and extruded cut using a laser cutter (VersaLaser VLS2.30, Universal Laser Systems, Inc., Scottsdale, AZ, USA); the obtained faces were then assembled using a cyanoacrylate to form the cell. A 3D mechanical release system was designed using SolidWorks; the system is composed of a shaft arm with an extruded cut slot that fits miniature laser-cut PMMA plates, a top lid, and a motor housing. The release system design was then exported to an STL format and 3D printed (Dremel Digilab 3D20, Mt Prospect, IL, USA).
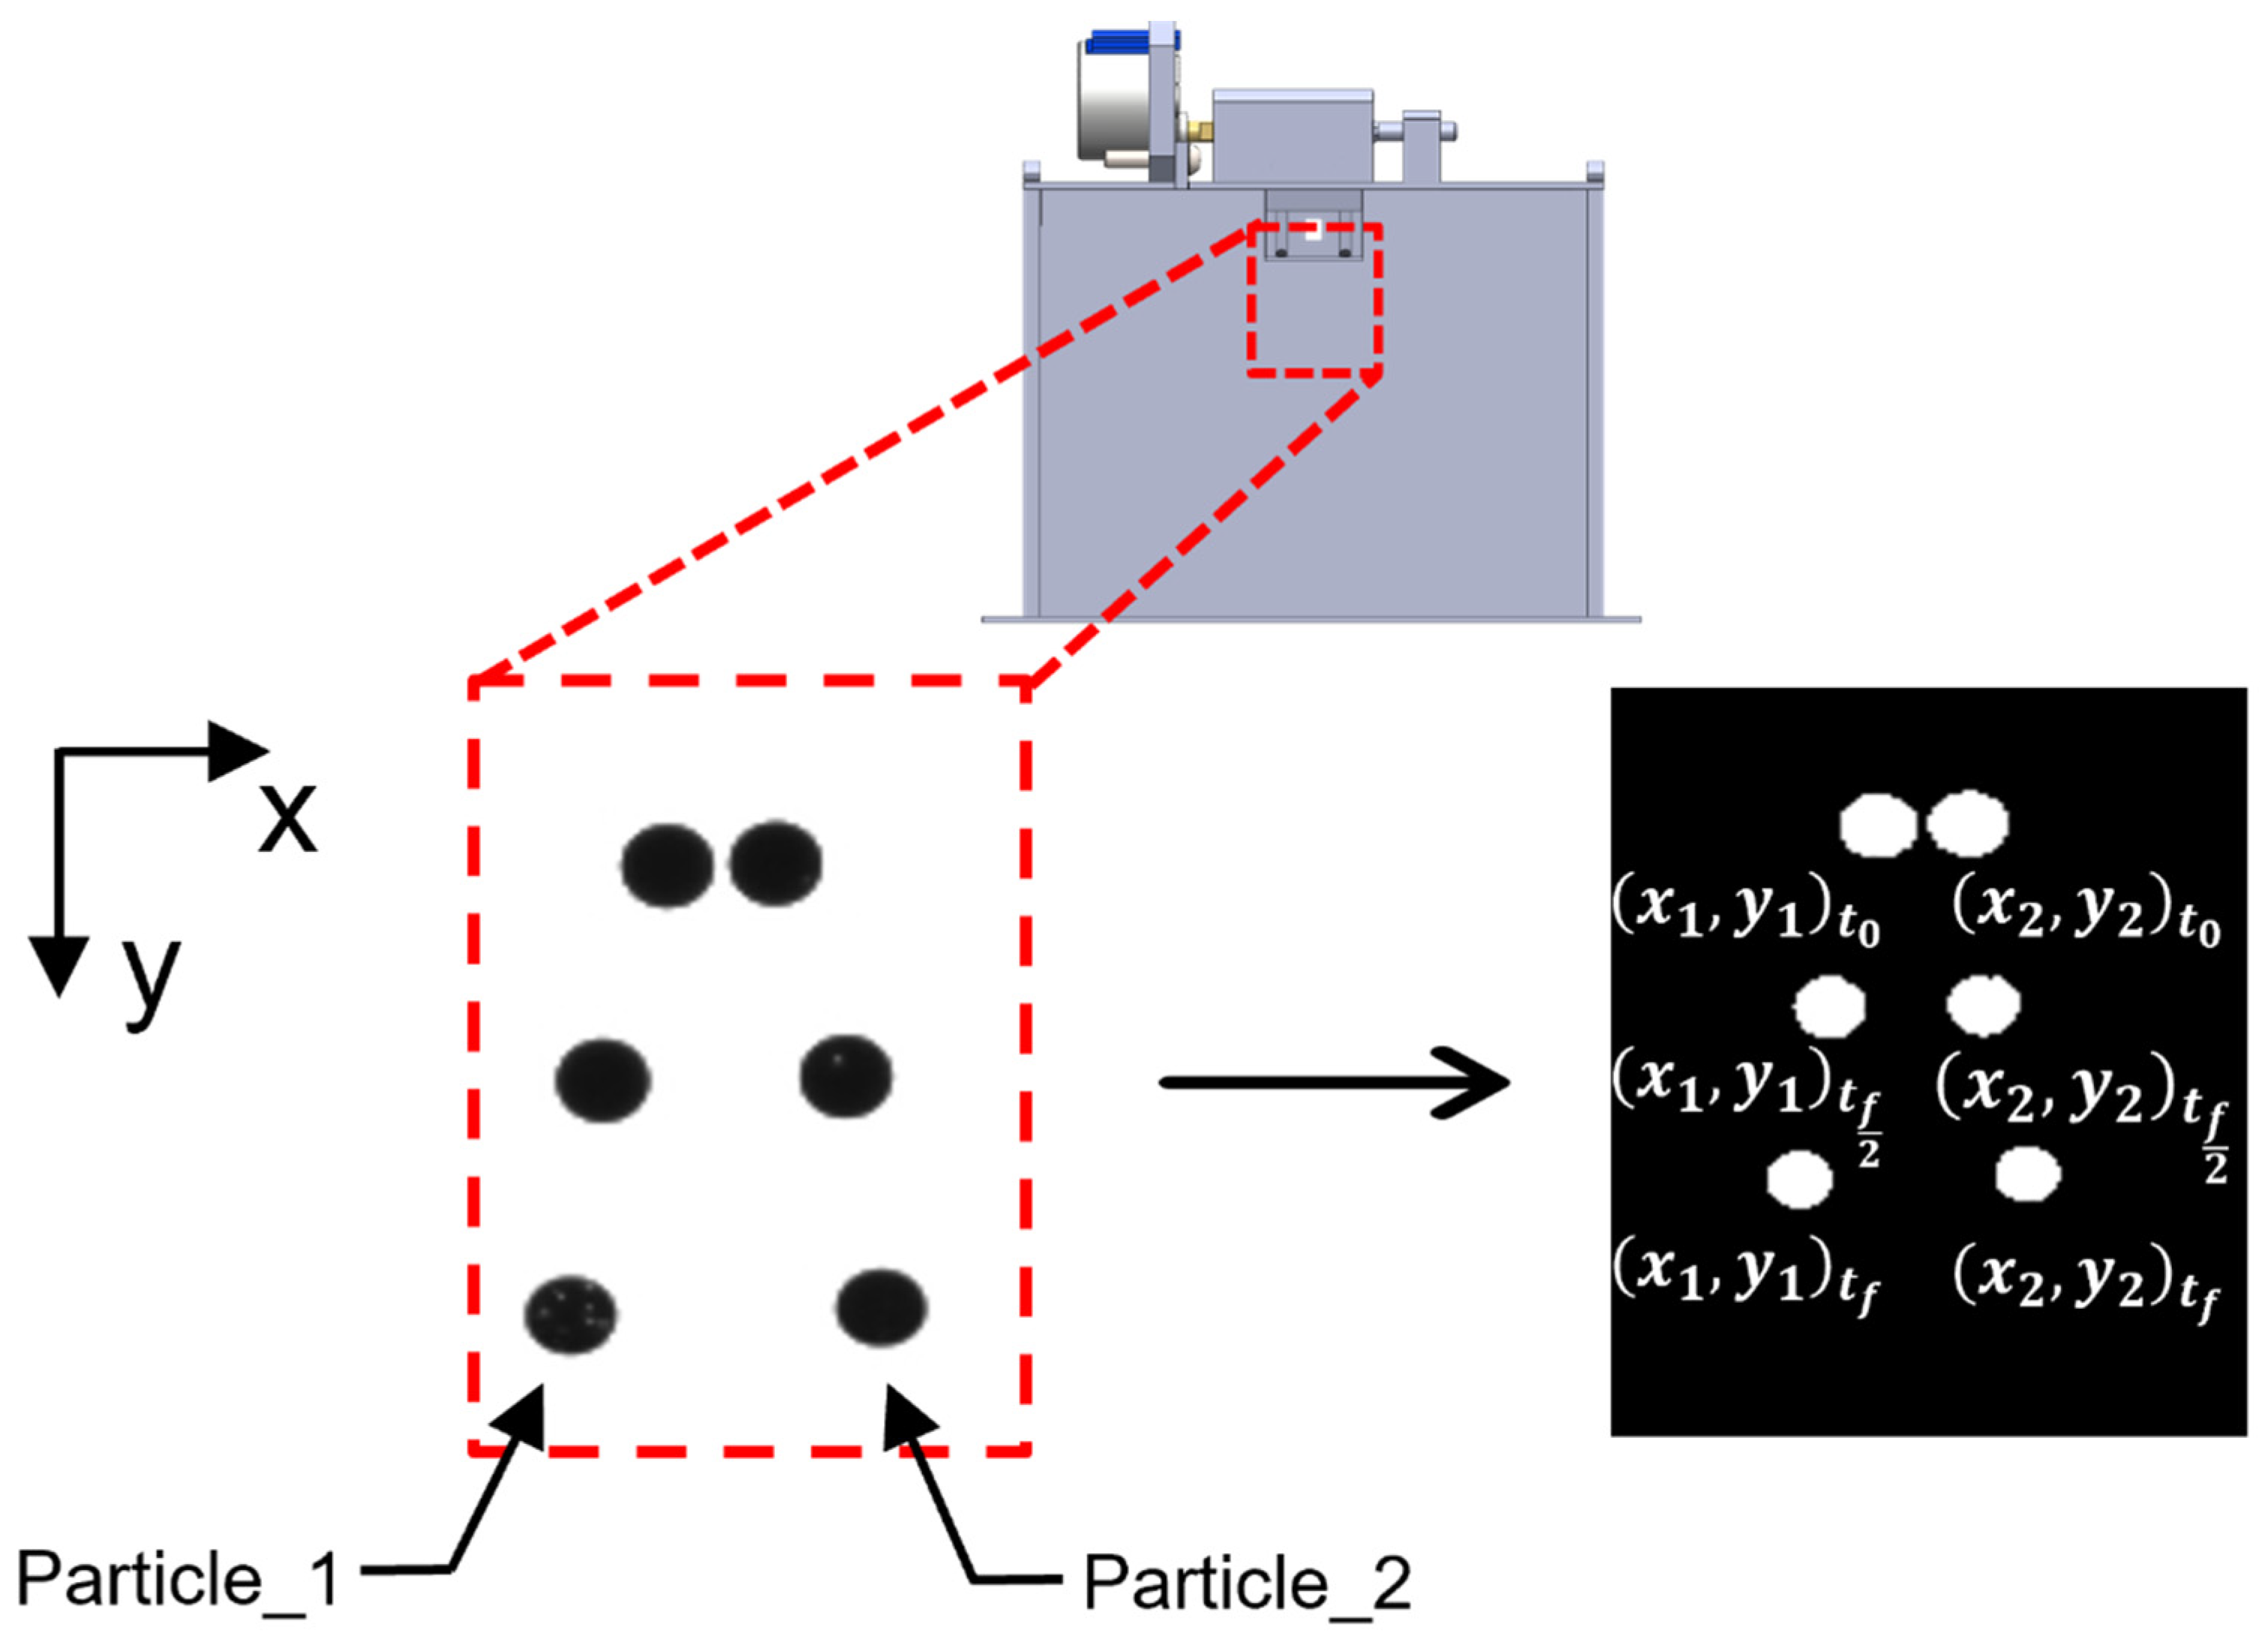
Figure 1 demonstrates the overall view of the experimental setup; on top of the cell lies the 3D-printed mechanical release system directly connected to the stepper motor, which was controlled by the Arduino microcontroller. The experimental procedure can be explained as follows: (1) the lighting and high-speed camera were enabled; (2) the desired solution was filled into the cell; (3) the mechanical release system was placed on the cell where all connections were made; (4) the particles were located into their desired initial position before the release; (5) the release system was then actuated through a user controlled Arduino code where zero initial release velocity was achieved with minimal angular incremental step release, resulting in insignificant flow disturbance. Additionally, to minimize variabilities in the experiment, the particles utilized were chosen to be high-precision spherical particles with minimal variation in sphericity and density (precision grade 25 per ISO 3290; 2 mm Ø, 2.6 g · cm 3 ). A 50 W LED dual gooseneck light source (AmScope, Irvine, CA, USA) was utilized for the illumination of the setup, and a high-speed camera (TS5, Fastec Imaging Corp., San Diego, CA, USA) was used to capture and record the settling process at the maximum frequency of 1000 frames per second. The images were then exported for processing, in which the segmentation and particle centroid information extraction was completed using a developed MATLAB (MathWorks, Natick, MA, USA) algorithm.

2.3. Testing Parameters

The experiments were performed considering the following two parameters: (1) initial separation distance between the particles (denoted as δ 0 ) and (2) rheological properties which directly alter the settling regime and particle Reynolds number R e p . In addition to testing in pure water, the experimental design was completed based on a factorial design with two factors and four levels for initial separation distance and rheological properties. To quantify the repulsive behavior at a wide range of initial separation distances, the following four distances were selected for the study: 3D, 2D, 1D, and 0.25D (where D = particle diameter). The closest proximity condition was 0.25D, which is the smallest possible distance to fabricate. Figure 2 demonstrates the separation distances used in the experiment; the particles were precisely held in the desired initial position by two back-to-back laser-cut PMMA plates.
Before performing the experiments in altered fluid viscosity, pure water was first utilized to perform initial experiments. Then, several (v/v) mixtures (100%, 75%, 50%, and 25%) of glycerin and water were utilized to investigate the effect of varying fluid viscosity and particle Reynolds number ( R e p ) on the interaction.
R e p = ρ V D   μ
where ρ = fluid density, V = particle velocity, D = particle diameter, and μ = fluid dynamic viscosity.

2.4. Data Analysis and Processing

Data analysis was started by obtaining the images of each associated experiment from the high-speed camera. A developed MATLAB algorithm was utilized to process the images. The algorithm first converted the images to greyscale, and then a binary set of images was obtained using thresholding. With the aid of the image processing toolbox, the images were segmented to filter out the object of interest only within a defined pixel area that matches the particles’ size. The segmented images provide 2D centroid locations of particles in the space (Figure 3). The data segregation was performed by applying an asymptote on the plane of symmetry between the particles’ initial positions. The final output was a two-column vector of each particle’s x and y centroid positions in space, while the time domain was obtained from the camera sampling rate. The centroid positions were then used for obtaining particles’ trajectory and velocity information, as discussed in Section 3. Lastly, it is important to note that variations of particles’ trajectories in the z-direction were minimal, and therefore, the fundamental repulsive behavior was investigated in the x–y plane.

3. Results and Discussion

3.1. Results in Pure Water

The experiment was initiated by testing the particle–particle interaction in pure water. An individual experiment lasted approximately 200 milliseconds, in which around 200 data points were obtained imaging at 1000 Hz sampling frequency. Initially, visual observations of instabilities in the interactions between the particles were made. The considerable fluctuations of particle trajectories were shown as randomness in the particles’ trajectories. It is important to note that there seemed to be an interaction between the particles, yet it was difficult to quantify it due to its coupling with the instabilities. To confirm the visual observations of the random behavior in our experiments, we performed thirty repeated experiments at a 2D initial separation distance. After processing, we confirmed that the interaction is purely random in the pure water regime. Figure 4 demonstrates the particle x displacement normalized by particle diameter ( s ( t ) x D ) as a function of time for the thirty repeated experiments. The random behavior increased as the time of the experiment progressed; this can be demonstrated by inspecting the initial time range of the experiment (0 to ~100 millisecond), where a significant overlap between the particles’ positions existed in all thirty experiments. In contrast, disorder mechanisms seemed to take over for the remaining duration of the experiment. Based on both visual and quantified results, it was concluded that particle–particle interaction is random and unstable for the given particle size and density in pure water, implying that the particle–particle interaction during the settling in the actual HF regime is possibly unstable. In addition, it is necessary to identify if a stable and repeatable regime exists and how different the particle–particle interactions are in such a regime. This will be highlighted in the glycerin experiments presented in the following subsection.

3.2. Results in Glycerin–Water Mixture

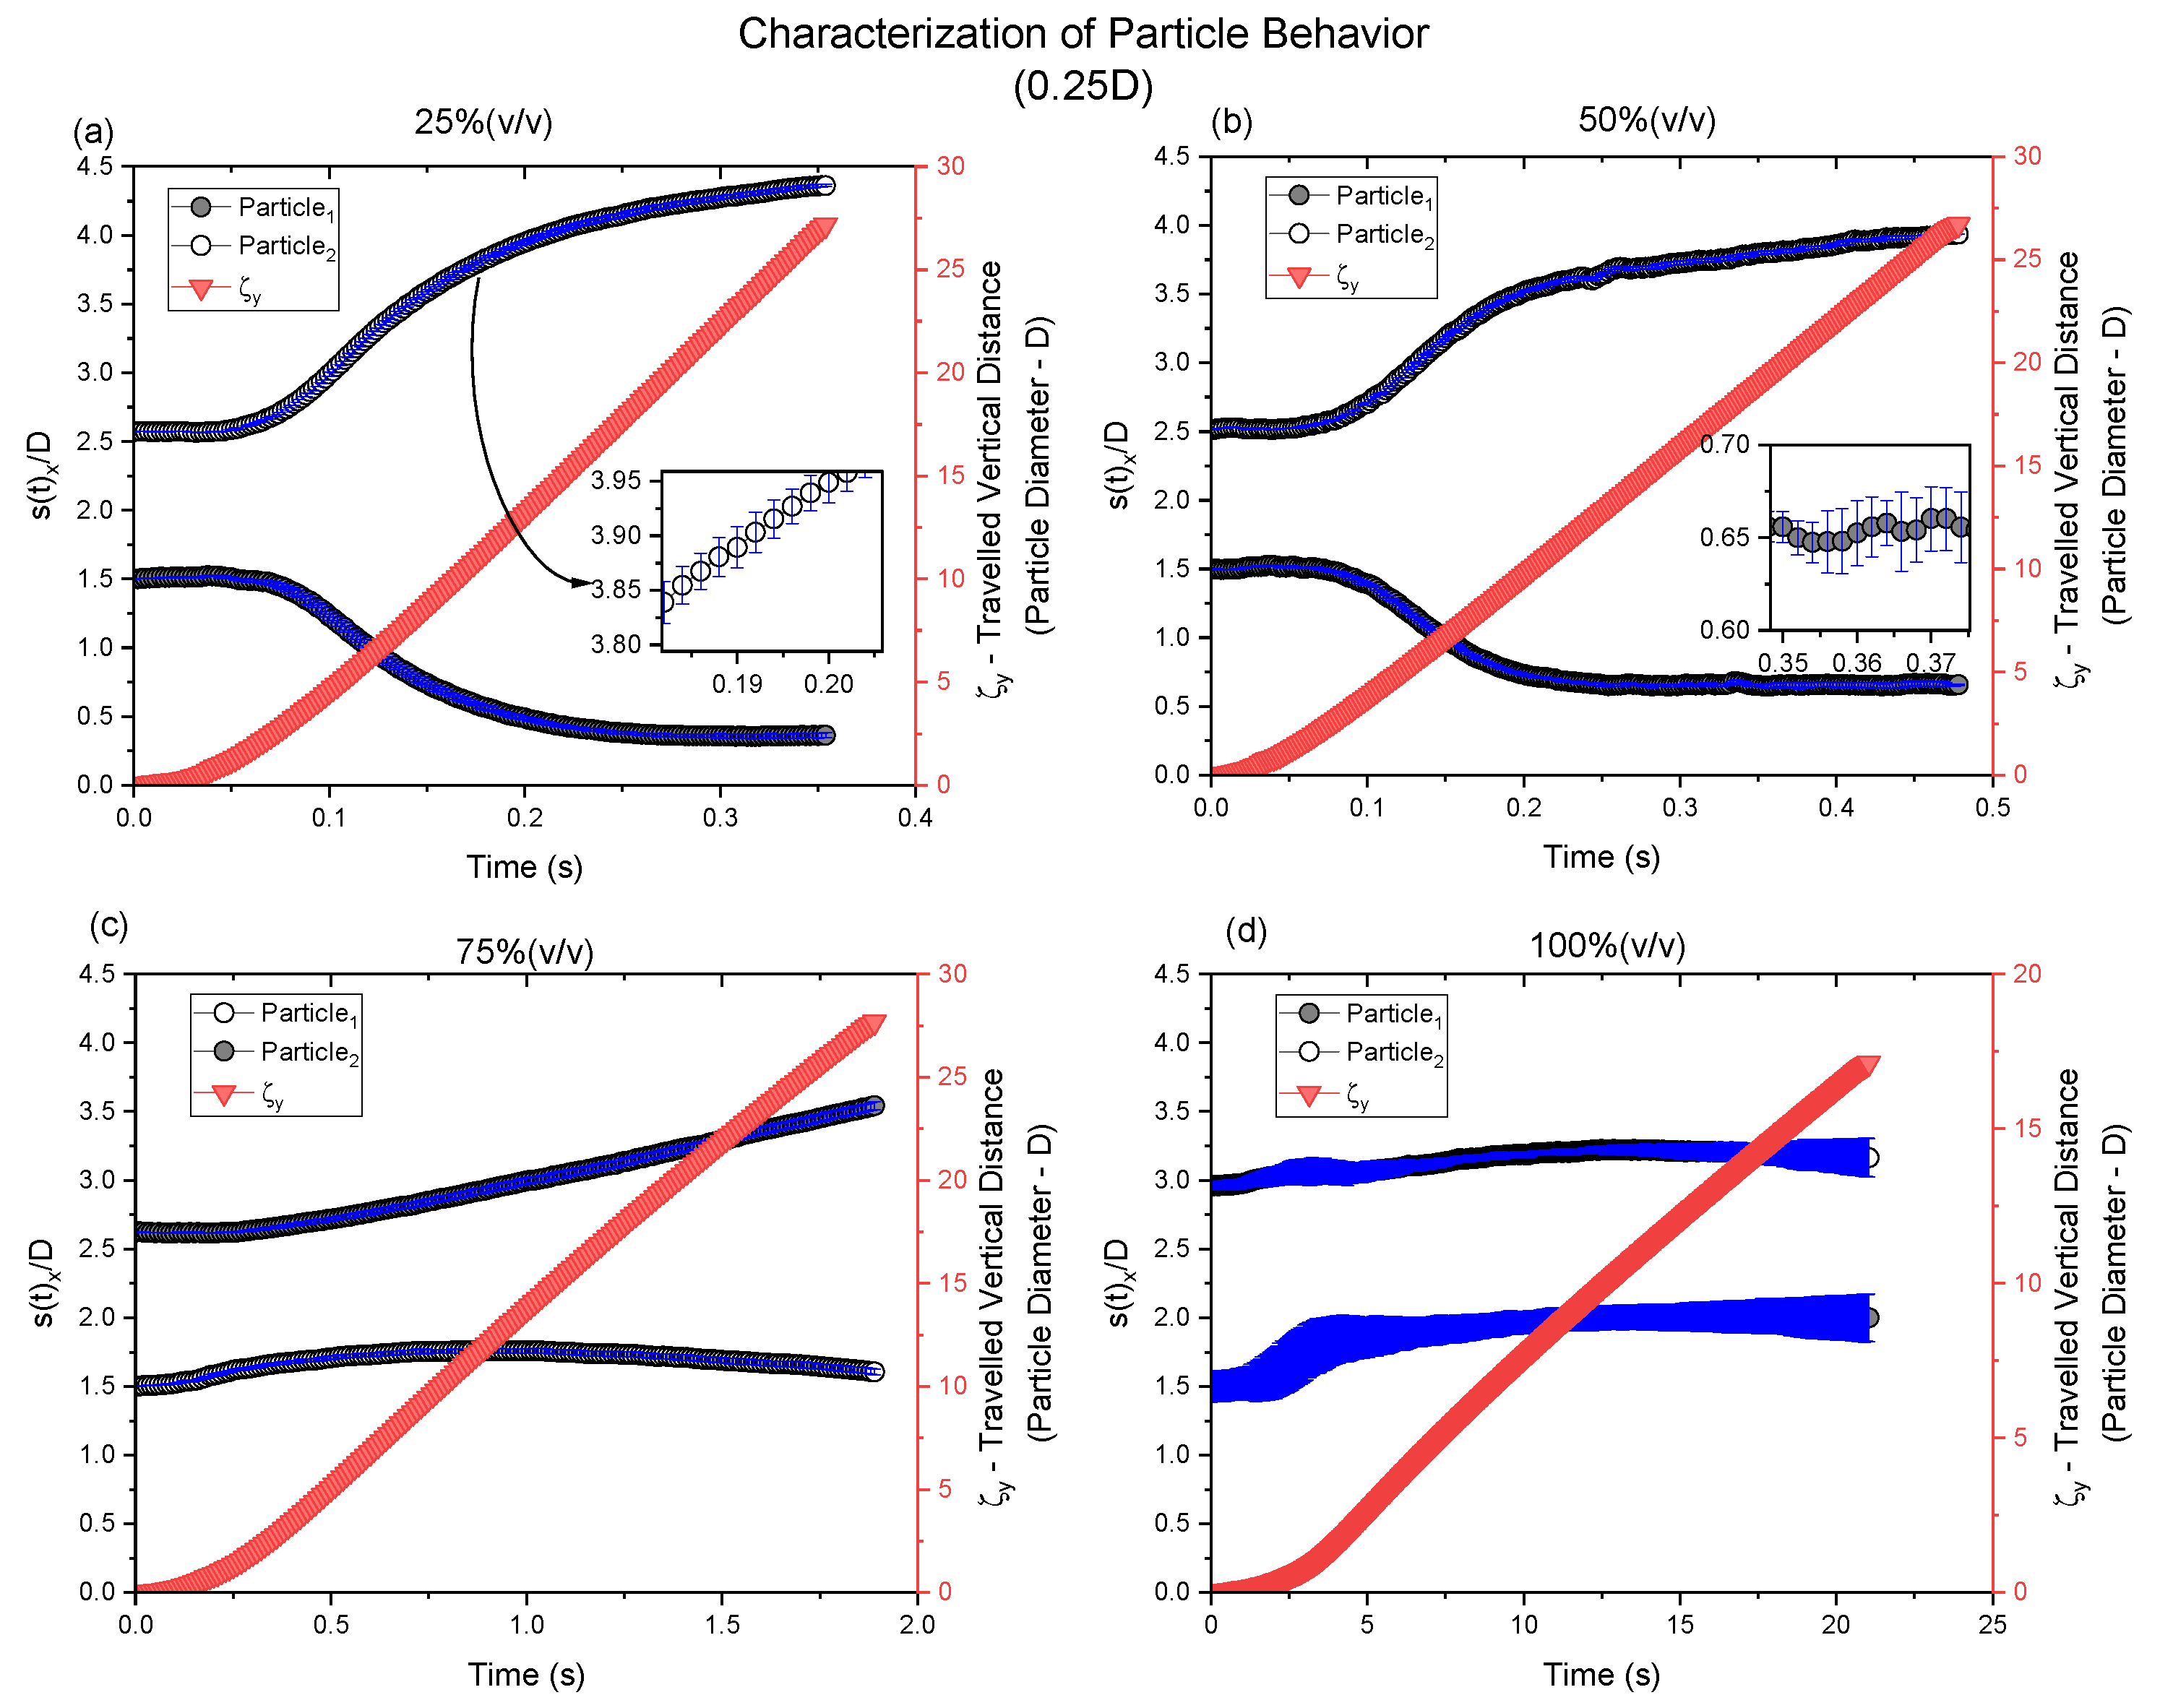
To identify a regime where the particle–particle repulsion characteristics were prominent and stable, a series of experiments was performed in four different (v/v) mixtures of glycerin–water (100%, 75%, 50%, and 25%). The first set of experiments was conducted for 0.25D initial separation distance. The experimental results show that a considerable increase in the stability of interactions in all cases was observed, which indicates that there is a high possibility of the existence of a critical R e p where the particle–particle interactions shift from an unstable to a stable regime. With a minimum of five repeated experimental results, the averaged normalized x-displacement of the particles as a function of time and vertical location (in particle diameter) was plotted for 75%, 50%, and 25% (v/v) mixture sets, as shown in Figure 5. The particle trajectories were observed to be highly overlapping compared to those in water. To provide insight and quantification of the repeatability of the experiments, error bars (standard error of the mean of the particle’s centroid positions) were added to all test cases. The magnified portions of the plots represented in Figure 5a,b highlight the typical range of error bars, indicating negligible variations in the centroid locations. For example, the average standard errors for particle 1 were calculated to be s ( t ) x D ± 0.01613, 0.01028, 0.01516, and 0.1212 for the 25%, 50%, 75%, and 100% (v/v) cases, respectively. On the other hand, particle 2 yielded s ( t ) x D ± 0.01334, 0.0094, 0.0189, and 0.05562 for 25%, 50%, 75%, and 100% (v/v). The uncertainty analysis has been further applied to cases of larger separation distance later in this section. It was both visually and quantitatively apparent that the particles do not interact in the 100% case (v/v) (i.e., Stokes regime). The experiment lasted for 20 seconds (Figure 5d), a significantly longer duration than other cases, where the particles settled in a vertical direction, maintaining the initial separation distance from start to end. However, as the viscosity of the solution decreased, the effect of particle–particle repulsion started to become prominent. For example, the 75% (v/v) condition demonstrated a repulsive behavior when compared to the non-interactive behavior in the 100% (v/v) case, and the repulsion lasted longer than the lower concentration cases. Although the interactive behavior seemed weak, the particles were constantly repelling from the beginning of the release to the bottom of the cell. Further reduction in the viscosity increased the repulsion between the particles, and the nature of the repulsion seemed to be different. This is demonstrated in the apparent bottle shape projected by the particle trajectories in the case of 50% (v/v). In this concentration, the particles have fully interacted, and a straight vertical settling occurs at the final separation distance.
Interestingly, in the case of 25% (v/v), the repulsion had reached a maximum potential when compared to all other performed experiments. The final separation distance extended to almost four times the initial position. A bottle shape projection that is similar to that of the 50% (v/v) case, but even more comprehensive can be seen. It is important to note that the time duration for all four glycerin experiments was different, indicating various settling regimes. The traveled distance was maintained constant at approximately 25 particle diameters (the same length as the Hele-Shaw cell).
Knowing that the interactions were minimal and non-existent in the cases of 75% and 100%, respectively, Figure 6 demonstrates the particle–particle interactions in the regime of prominent repulsion (25% and 50% v/v) for different initial separation distances, namely 3D, 2D, 1D, and 0.25D. The plot indicates the lateral separation distance between the two particles ( δ x ) as a function of time. The repulsive behavior is inversely proportional to the initial separation distance. The previously demonstrated strong repulsion for 0.25D is also visualized in yellow by a rapid increase in the lateral separation distance and a flattening out after the interaction was complete for 25% and 50% (v/v), while linear, negligible, and diminished interactions seemed to exist in 1D, 2D, and 3D cases, respectively.
Additionally, an interesting observation lies in the behavior of the 0.25D separation curve was observed for 50% (v/v), as it seemed to be bounded by the 2D separation curve. The bound could be interpreted as a verification that the particles’ interactions fade away when a 2D lateral distance separates them. This was demonstrated by the particles strong repulsion at the beginning of the release and, when the interaction was complete, they settled independently at the 2D final separation distance. An explanation of why this may not be the case for 25% (v/v) is as follows: the extreme repulsion in the case of 25% (v/v) may have allowed the particles to gain enough momentum due to their high lateral velocity at the initial duration of the experiment, which may have contributed to bypassing the threshold (2D) as shown in Figure 6a. Therefore, it was established that the lateral velocity analysis was necessary for a clearer understanding of the interactions, which will be discussed in the latter portion of this section. To provide quantitative uncertainty information on the lateral separation distance, the error bars of the mean of the quantified lateral separation distance were plotted for all test cases as shown in Figure 6. The error bars indicate the high repeatability in the experiments, highlighting the statistical significance between the various separation distances. Lastly, the inset representation in the 50% (v/v) case in Figure 6b supports the argument made about the bound of the 0.25D curve by the 2D curve, namely the overlap in the error bars highlights the statistical insignificance, where the two curves are highly matched. The quantified error bars of the mean lateral separation distance in the 25% (v/v) case were as follows: δ x ± 0.043 mm, ± 0.044 mm, ± 0.032 mm, and ± 0.013 mm for 0.25D, 1D, 2D, and 3D, respectively. On the other hand, the 50% (v/v) case yielded the following standard errors: δ x ± 0.027 mm, ± 0.012 mm, ± 0.014 mm, and ± 0.11 mm for 0.25D, 1D, 2D, and 3D, respectively.
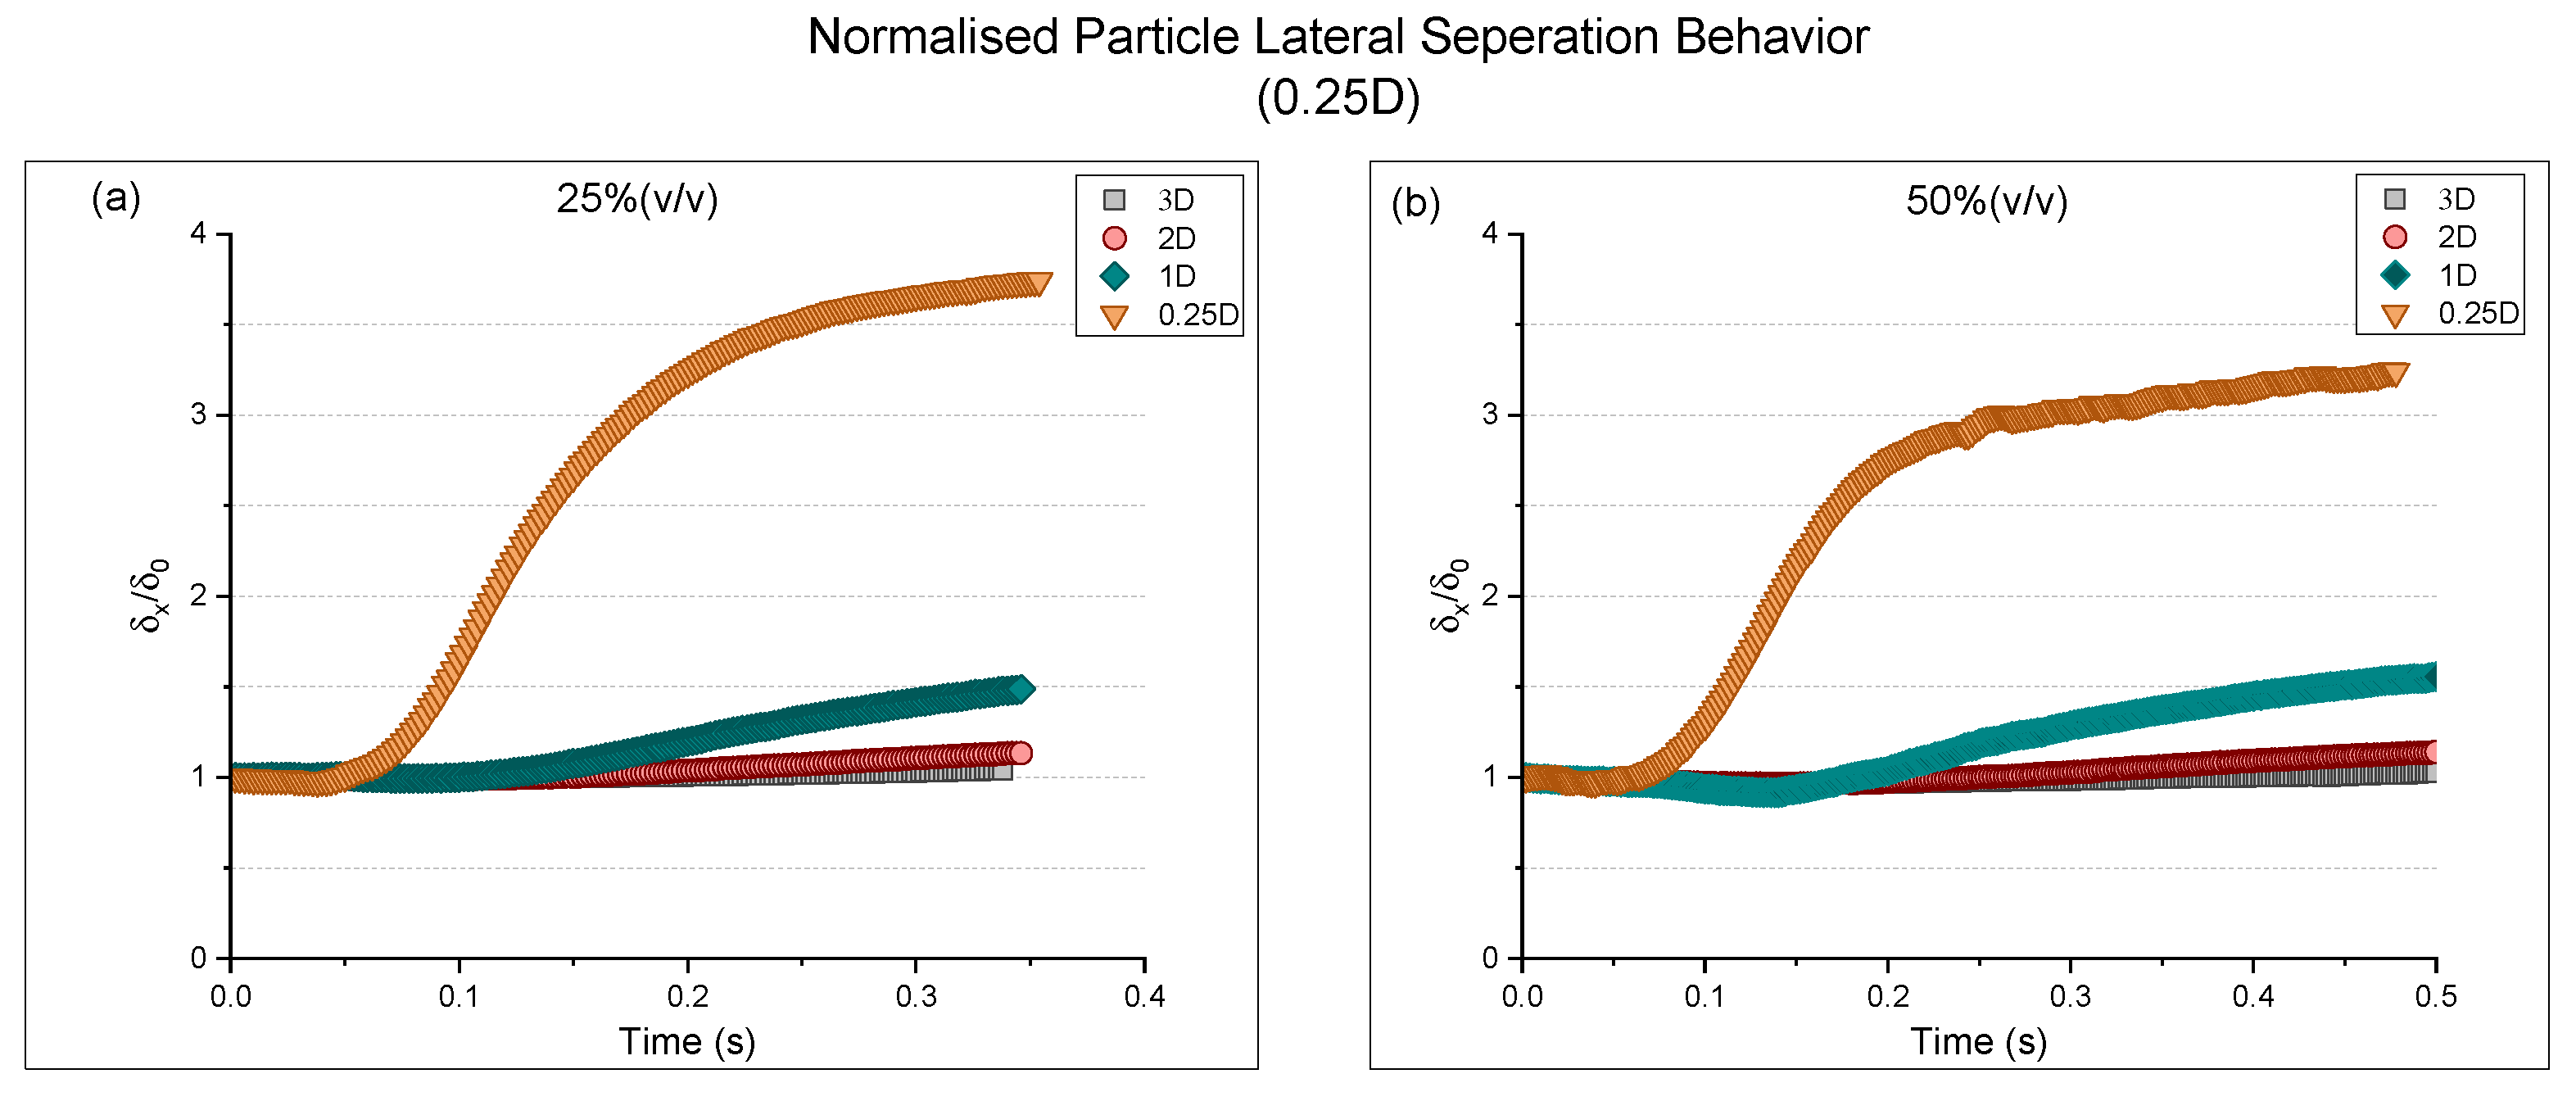
To further highlight the varying repulsion characteristics, the lateral separation distance normalized by the initial separation distance was plotted in Figure 7. For the case of 0.25D, prominent repulsion can be observed, and particle final separation distances reached up to four and three times the initial separation distances for 25% and 50% (v/v), respectively. On the other hand, 1D, 2D, and 3D separation distances yielded suppressed repulsion, showing similar behavior in 25% and 50% (v/v). The 1D separation distance demonstrated a repulsive behavior that seemed linear and not augmented. Even though the repulsion was not as prominent in 0.25D separation, the repulsive behavior persisted as the particles settled towards the bottom of the cell. This indicated that the interaction between the particles was not strong but rather long in duration. Differences in behavior in 25 and 50% were minimal for the 2D and 3D cases. Both conditions highlighted minimal interactive behavior between the particles, where steady vertical settling was dominant.
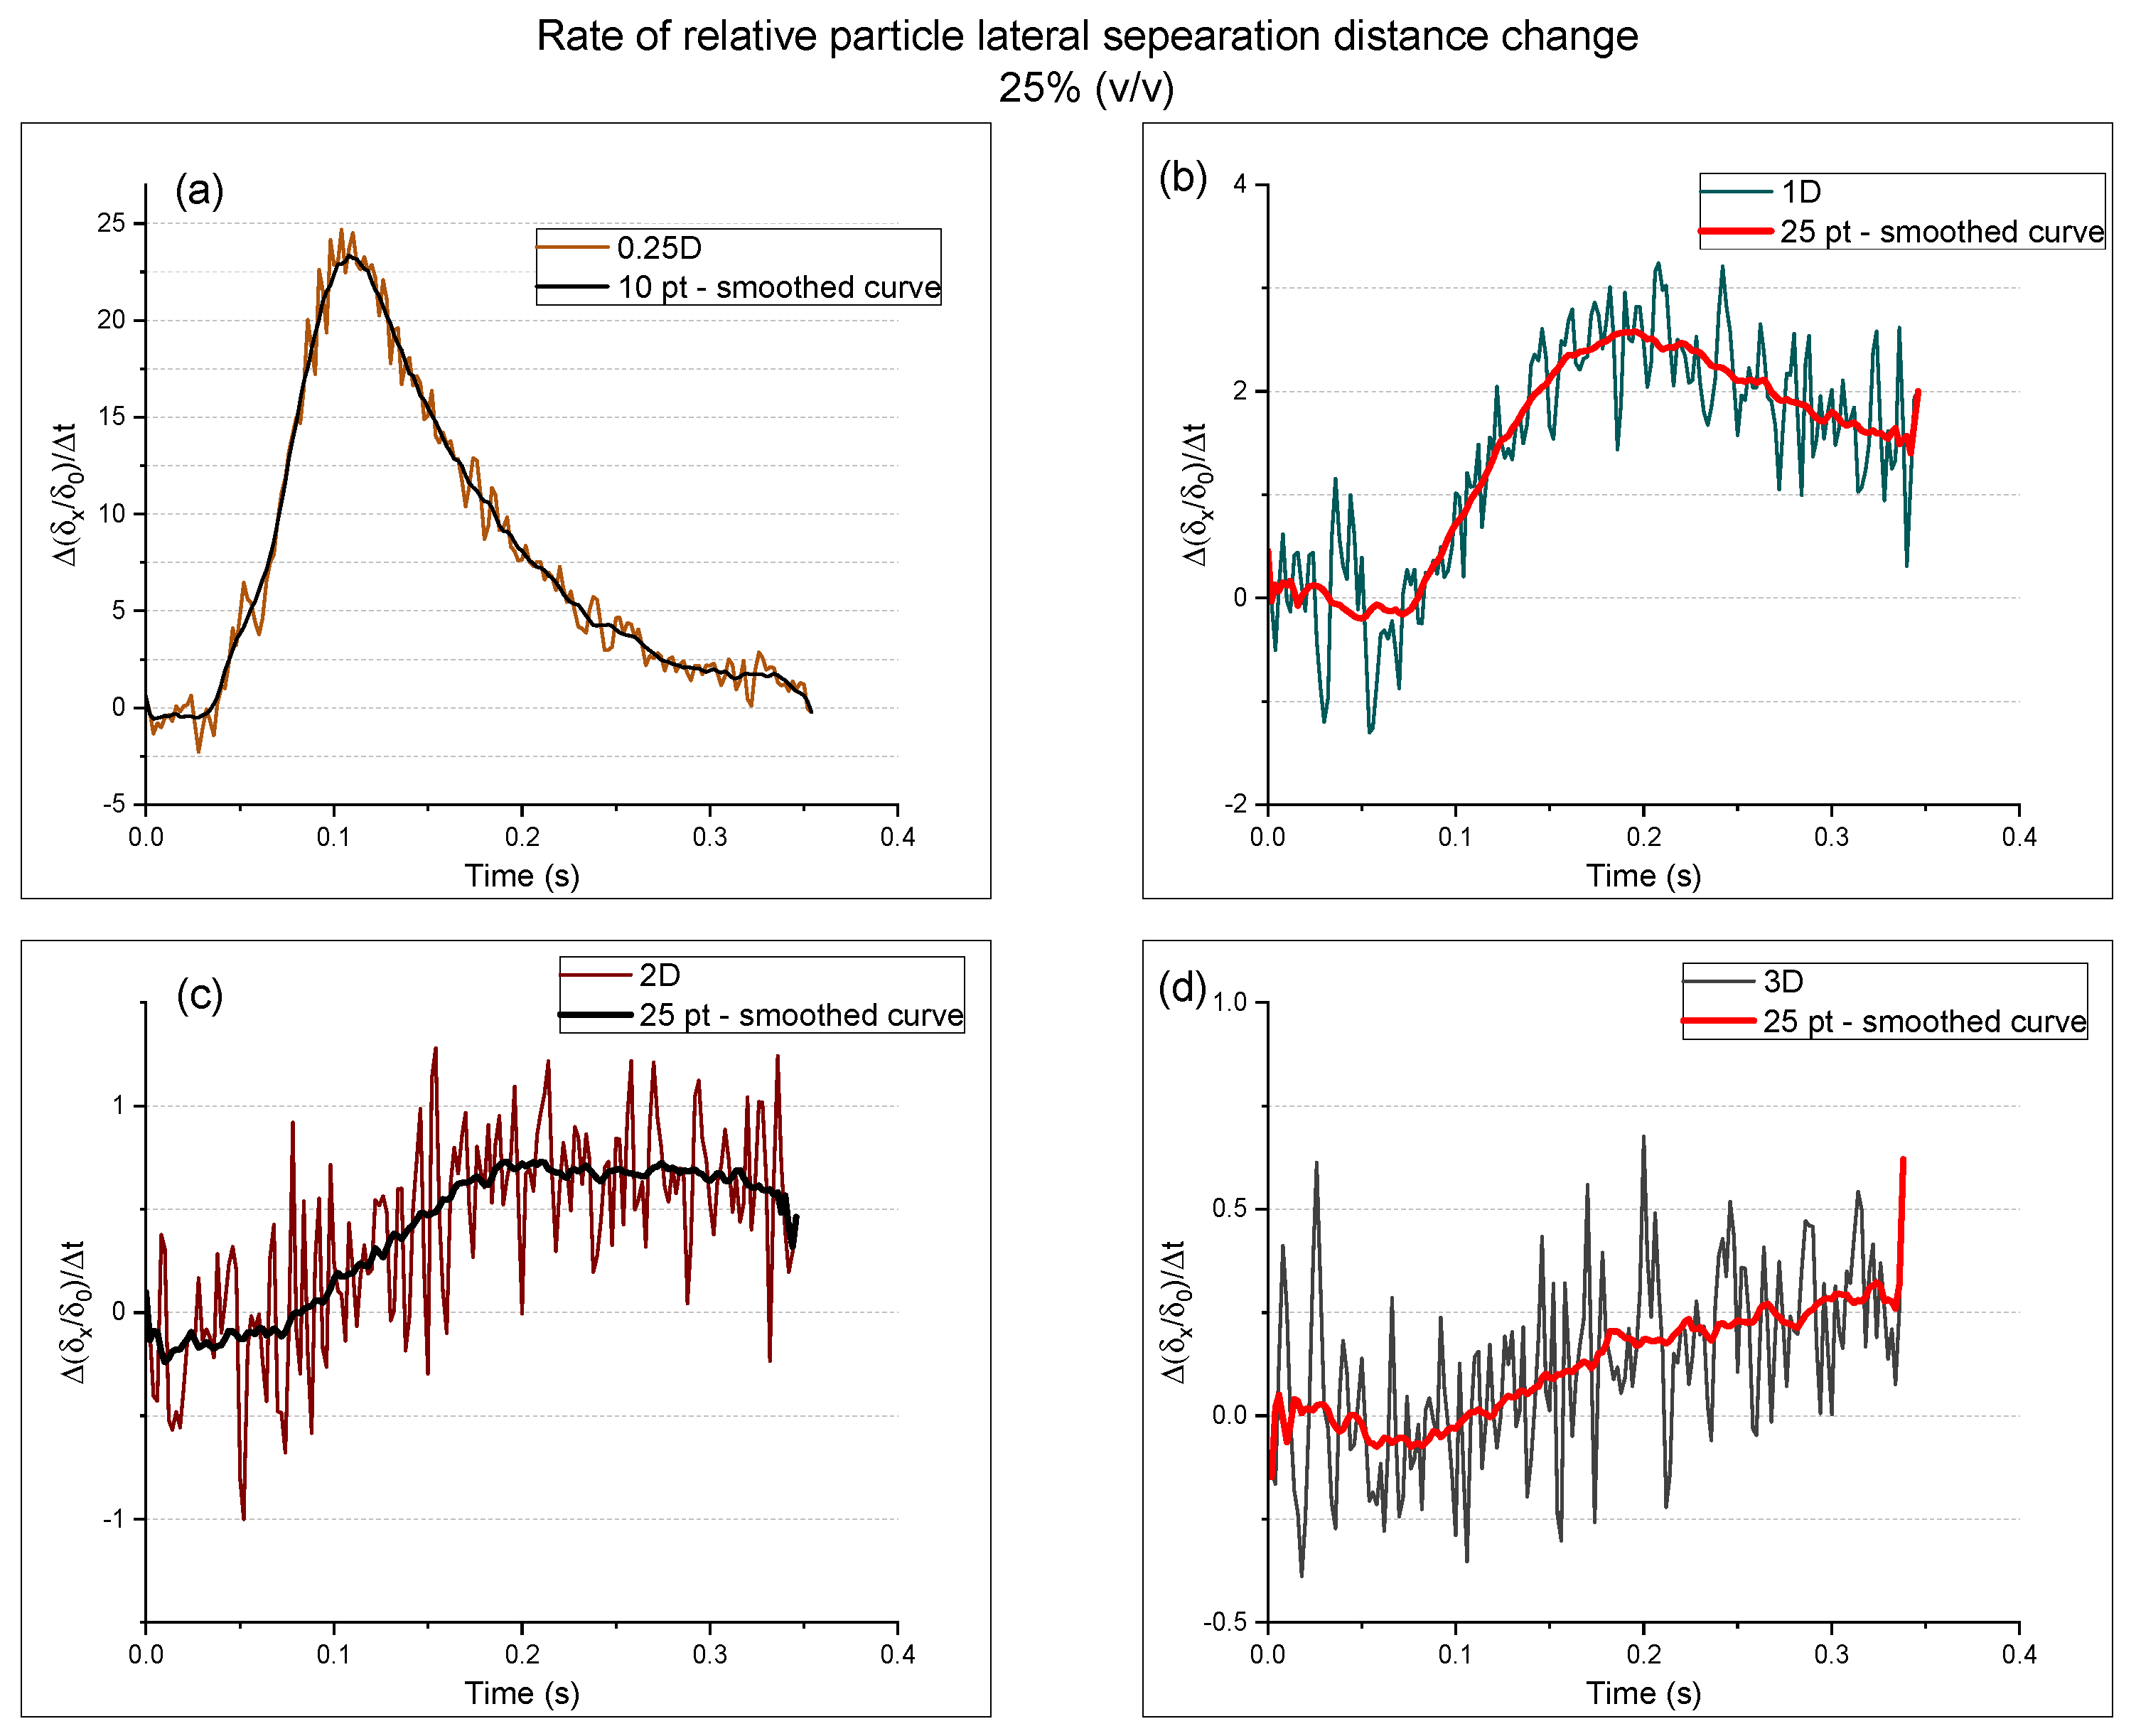
While both 25% and 50% (v/v) cases demonstrated a stable and desirable prominent repulsive behavior, a more thorough analysis was performed on the case of 25% (v/v) given its practical utilization in HF when compared to the 50% (v/v). The rate of relative particle lateral separation distance change as a function of time was plotted in Figure 8. Due to elevated fluctuations, a 10-point weighted average smoothing algorithm was utilized to demonstrate the behavior. Interestingly, the rate at which separation occurs can reach up to 24 times the original distance per millisecond, represented by the peak happening approximately around t = 110 milliseconds (Figure 8a). The peak formation was an indication that the repulsion was initially prominent, and after some time, the particles’ effect on each other started to fade away until they settled independently. The peak was significantly smaller in magnitude in the case of 1D, negligible for 2D, and almost diminished for the 3D case.
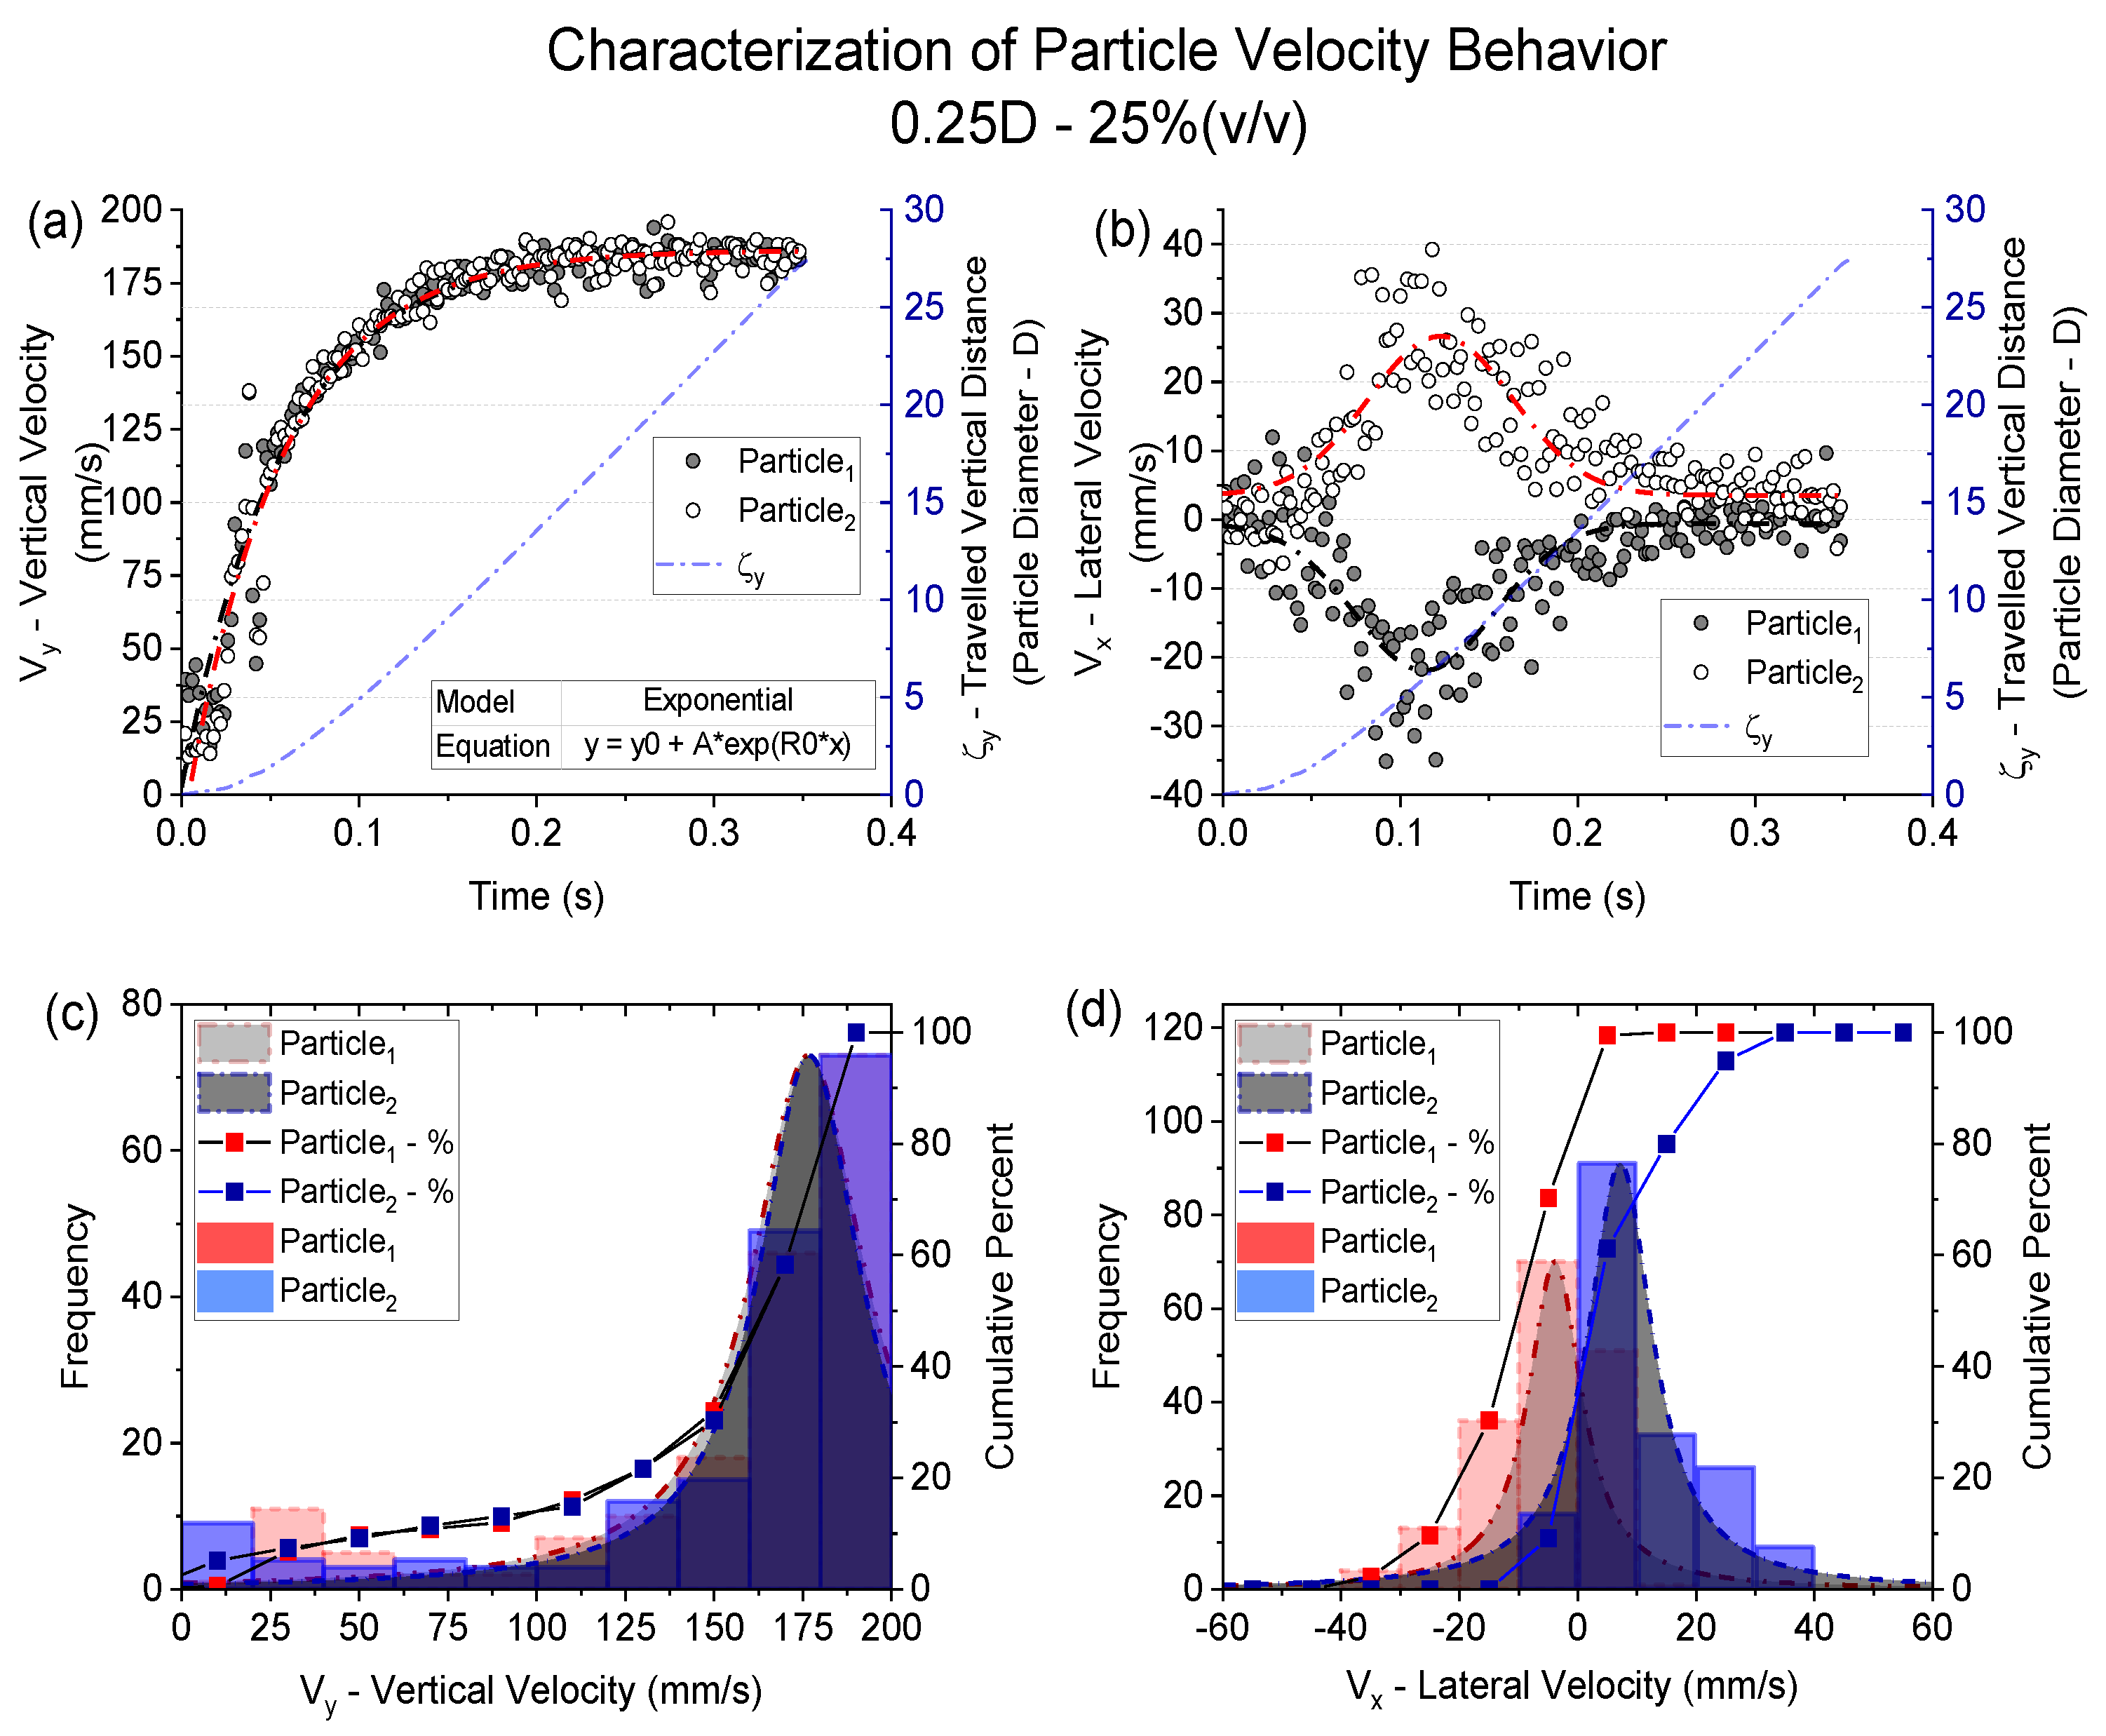
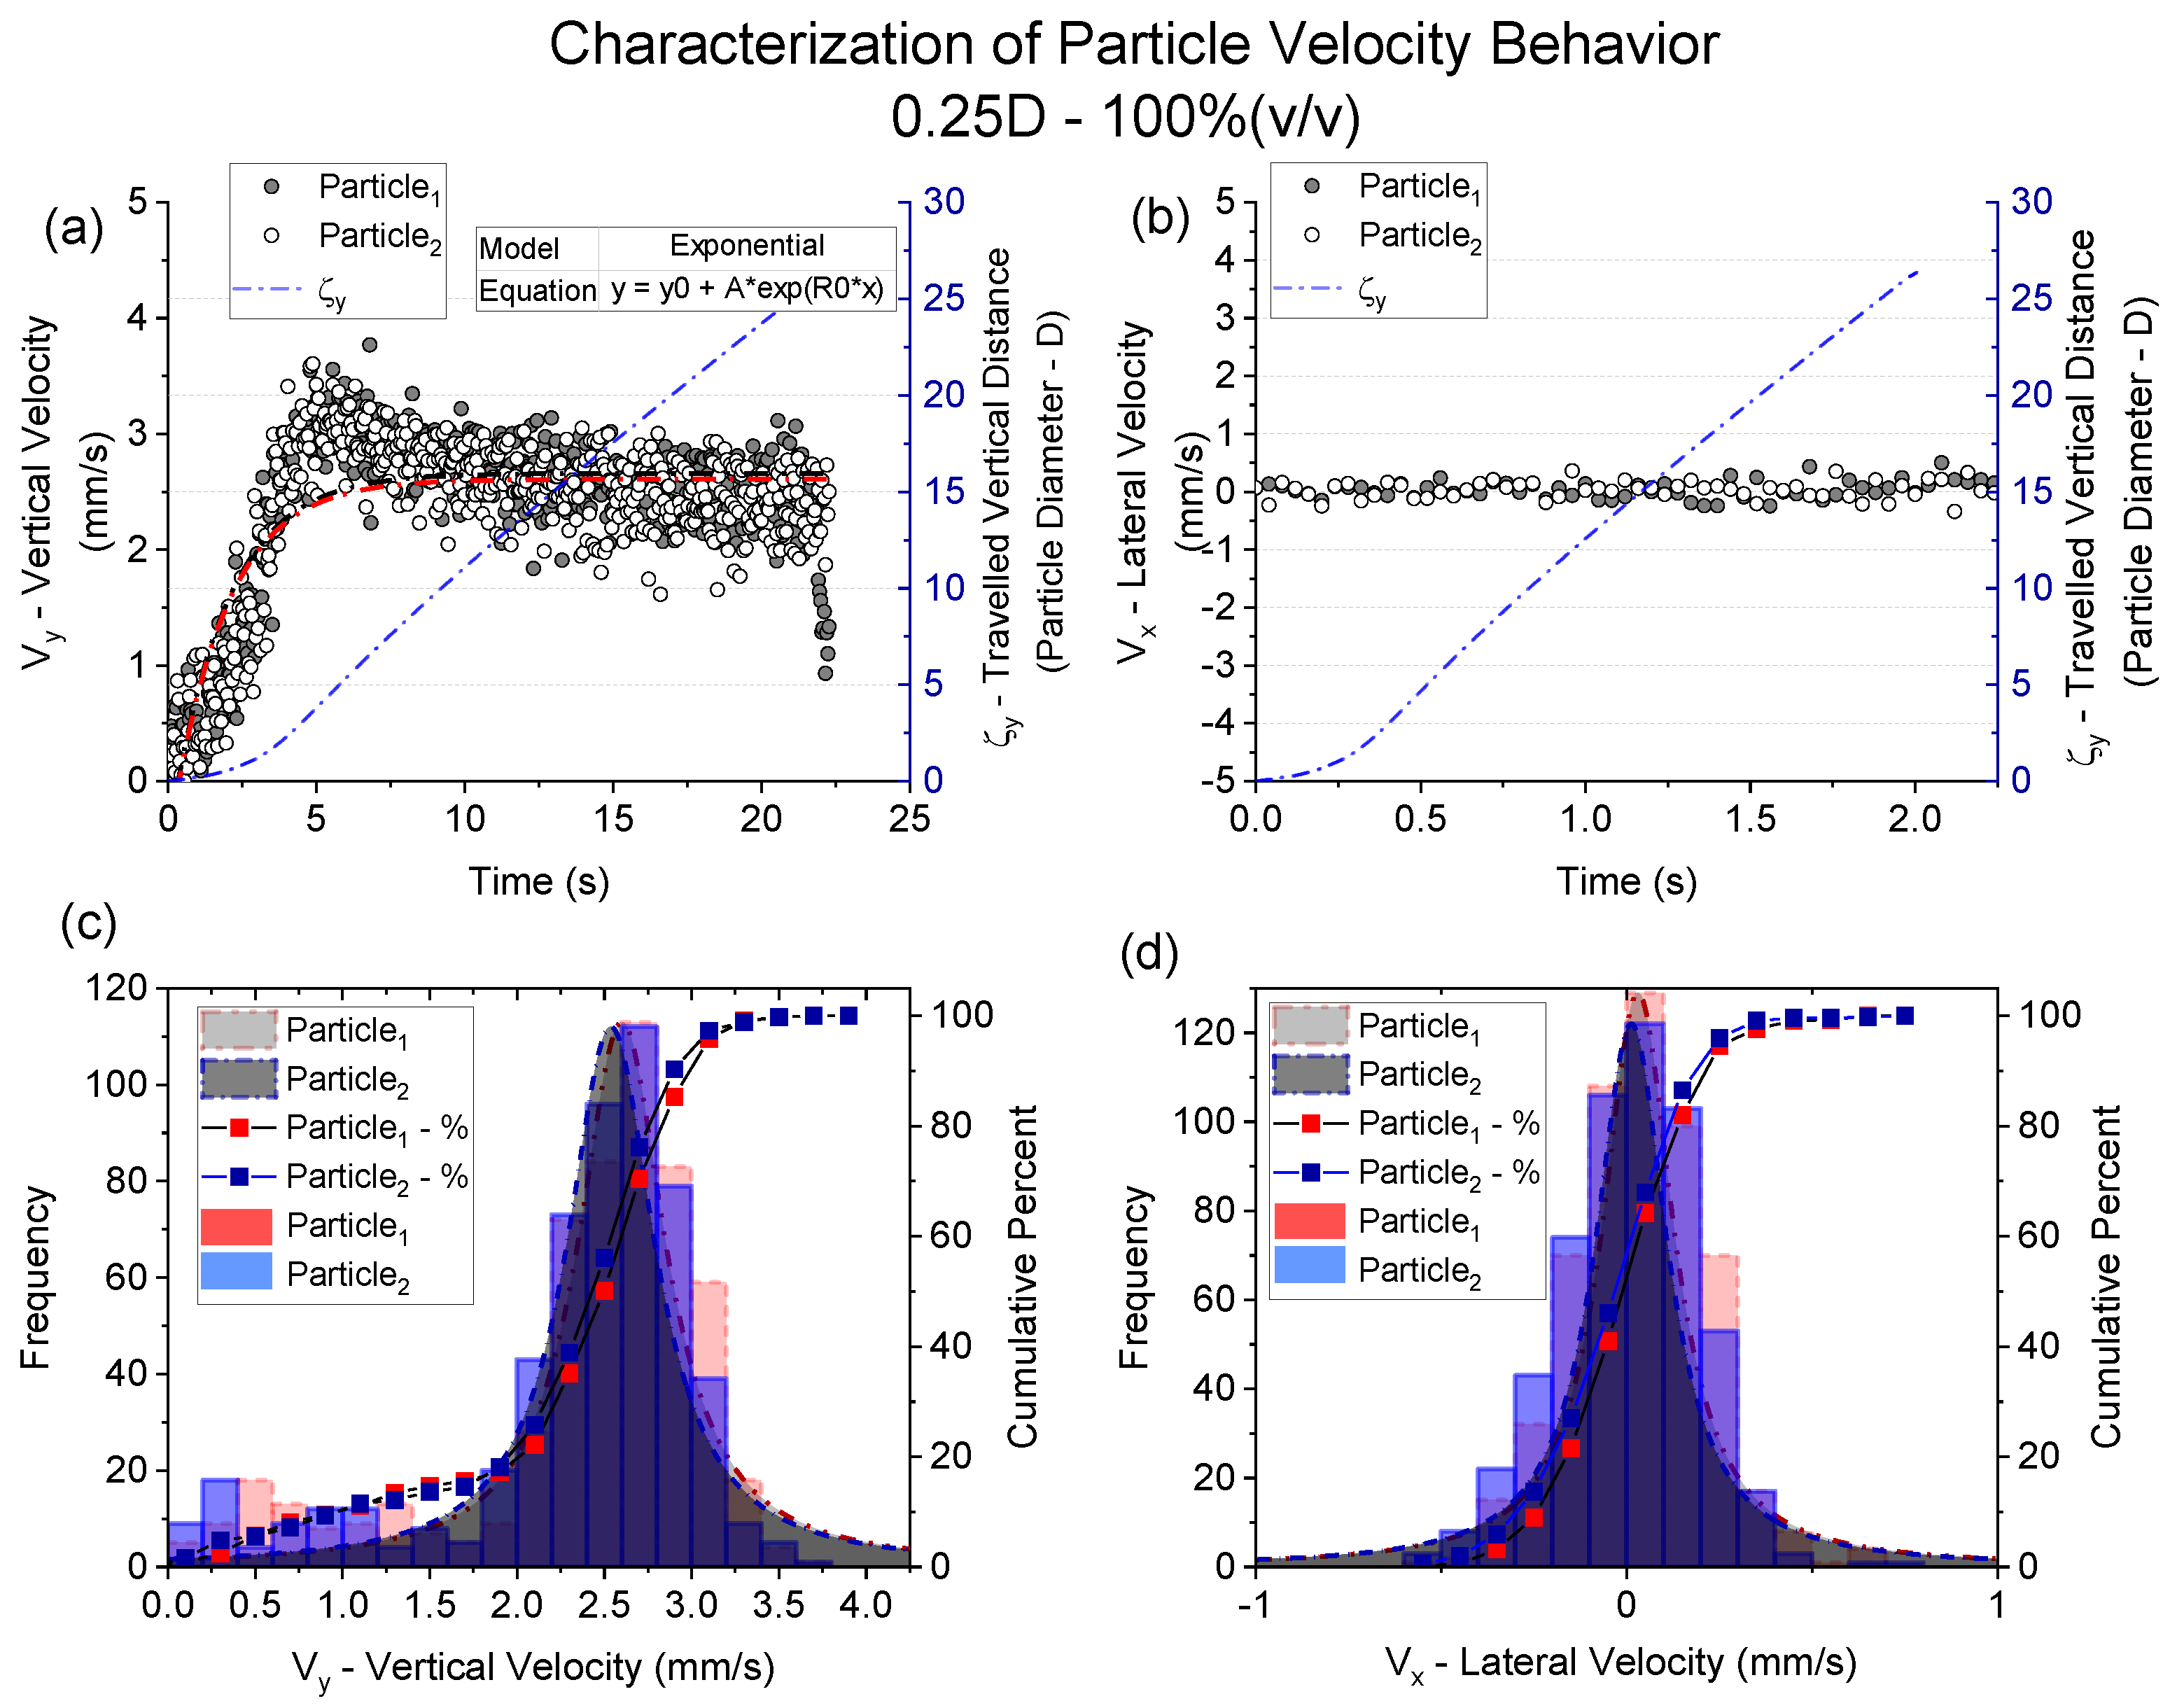
A velocity analysis was performed to further quantify the particles’ repulsive behavior as a function of the associated R e p . Figure 9 and Figure 10 show the vertical and lateral velocity components of the extreme cases 0.25D–25% and 0.25D–100%, respectively. Inspecting Figure 9, the settling velocity was determined based on the histogram analysis, where a Lorentz fit was utilized to construct the probability density function (PDF) for both velocity components. The instantaneous vertical velocity data points were fitted using an exponential decay function. Even though the sampled data have shown a range of velocity fluctuations, the function fit demonstrated a high prediction accuracy (R2 = 0.95) in capturing the acceleration regime and the terminal velocity for a range of 300 milliseconds.
On the other hand, the lateral velocity component has posed a challenge in obtaining a model with comparable accuracy to that of the vertical components due to high fluctuations in a smaller range of velocity magnitude (Figure 9b). Using a trial and error approach, a Gaussian curve fit facilitated an acceptable model representing the interaction. The function’s peak indicated a symmetric plateau in both particles’ lateral velocity components. As time progressed, the particles reached a zero-lateral velocity. This suggests a finite duration where repulsion was prominent, and then the particles settle independently. Figure 10, on the other hand, demonstrates the complete opposite spectrum where a diminished particle–particle interaction was observed with the lateral velocity fluctuating about a zero mean for the 100% (v/v) case. A similar velocity analysis approach was utilized for all experiments to construct the settling velocity values shown in Table 1. Viscosity and density information were calculated using the aqueous glycerol models developed by Cheng [37] and Volk and Kähler [38]. Then, the averaged R e p was computed for each associated set.
Comparisons can be made with the experimental and numerical study performed by Joseph et al. [34]. While the authors’ work is different from ours, as they investigated larger sphere interactions, their results indicated that two side-by-side spheres always repel in a Newtonian fluid and attract in a non-Newtonian visco-elastic fluid. This result is well in agreement with our results, where we quantified repulsive behavior in Newtonian fluids. Future work shall include a similar investigation but in a non-Newtonian visco-elastic fluid for a full mapping and understanding of attractive behavior. Similarly, the numerical study conducted by Kim et al. [35] highlighted the repulsive behavior of two spheres with prominence in close proximity conditions. Furthermore, this investigation shares the lower range of the particle Reynolds number 0 < R e p < 50 with that of Wu and Manassesh’s [39] experimental study. While the authors’ particle sizes were different from those of this experiment, both experiments showed that the particles do not interact in the low range of R e p but showed an apparent interaction as the R e p was increased. More specifically, the acquired data from both experiments showed that the particles do not interact when the R e p 1 , and repulsive behavior was observed as R e p was increased beyond 1. Additionally, our work has filled in the data gap of particle–particle interactions in the range 40 < R e p < 500 , which falls closer to the actual R e p in HF operations [19,40]. Similarly, our experimental work varies from that of Liu et al. [36], as the authors’ particles are larger than the typical proppant size. Moreover, their results were limited to only   R e p = 300 . On the hand, our results in the newly experimented range have shown that particle–particle interactions are unstable in pure water ( R e p ~ 470), and a threshold exists in which interactions transition from unstable to stable between pure water and 25% (v/v). Lastly, it is important to note that the performed study provides valuable insight into the fundamental dual particle interactions in a size similar to that of proppants. This study is the first step in understanding slurry interactive behavior when particles are in close proximity. An expansion to this study with multi-particle interactive settling in a similar fluid regime is necessary for a complete understanding of slurry settling.

4. Conclusions

The current study investigated the fundamental particle–particle interactions in various settling regimes to better understand proppant distribution in HF operations. A high-speed mapping of the particle–particle interactive behavior in 2D space and time was utilized to uncover the repulsive behavior as a function of the initial separation distance between the particles and fluid properties. Various interaction regimes and particle trajectories were identified and further studied to better understand the interactions. Experimental results obtained from pure water ( R e p   ~   470 ) have shown unstable particle interactions characterized by randomness. On the other hand, altering pure water to a 25% (v/v) water–glycerin mixture ( R e p   ~   200 ) transitioned the interaction regime from an unstable, random interaction regime to a stable and prominent repulsive regime, indicating a critical R e p at which the transition occurs. This also implies that there may be an ideal slickwater viscosity alteration regime that may be utilized to yield favorable proppant positioning characteristics in actual HF operations. This can be achieved with the utilization of viscofiers (e.g., polymers). The results also indicated that the repulsive behavior was most prominent in the case of 0.25D–25% and 0.25D–50% (v/v), as shown by the varying versions of bottle-shaped trajectories, where the final lateral separation distance can extend up to four and three times the initial distance, respectively. The particle–particle interactions faded away as the fluid viscosity was increased, demonstrated by a minimal and diminished repulsion for the cases 0.25D–75% and 0.25D–100% (v/v), respectively.
Additionally, a threshold distance in which the particles do not interact (or negligibly interact) seemed to exist at a 2D separation distance. The threshold distance represents a separation distance where the particles’ effect on each other vanishes with no repulsion. This was demonstrated by releasing the particles at an initial separation distance of 2D and observing minimal interaction. A second confirmation was shown with a bound of the 0.25D separation curve by the 2D separation curve at 50% (v/v). On the other hand, in the case of 25% (v/v), the 0.25D lateral separation curve exceeded the threshold (2D), which may be explained by a prominent gain in the lateral velocity that allowed for exceeding the threshold. Future work includes the exact identification of the threshold at which particle–particle interactions transition from an unstable to a stable regime and its utilization in a multiple-particle settling experiment to promote hindered slurry settling velocity.

Author Contributions

Conceptualization, M.H. and M.K.; methodology, M.H. and M.K.; software, M.H.; validation, M.H., M.G. and M.K.; formal analysis, M.H. and M.K.; investigation, M.H.; resources, M.K.; data curation, M.H.; writing—original draft preparation, M.H.; writing—review and editing, M.H., M.G., M.K.; visualization, M.H.; supervision, M.K.; project administration, M.K.; funding acquisition, M.K. All authors have read and agreed to the published version of the manuscript.

Funding

This research received no external funding.

Data Availability Statement

The data presented in this study are available on request from the corresponding author.

Conflicts of Interest

The authors declare no conflict of interest.

References

  1. Ahmed, K.; Ozturk, I. What new technology means for the energy demand in China? A sustainable development perspective. Environ. Sci. Pollut. Res. 2018, 25, 29766–29771. [Google Scholar] [CrossRef] [PubMed]
  2. Shah, K.U. Potential clean energy transition pathways in the U.S. Virgin Islands using carbon sensitive policy options. Energy Sustain. Dev. 2022, 71, 89–103. [Google Scholar] [CrossRef]
  3. Paramati, S.R.; Shahzad, U.; Doğan, B. The role of environmental technology for energy demand and energy efficiency: Evidence from OECD countries. Renew. Sustain. Energy Rev. 2022, 153, 111735. [Google Scholar] [CrossRef]
  4. U.S. Energy Facts Explained—Consumption and Production—U.S. Energy Information Administration (EIA). Available online: https://www.eia.gov/energyexplained/us-energy-facts (accessed on 17 January 2022).
  5. Zou, G.; Zhang, G.; Tao, S.; Hu, S.; Li, X.; Li, J.; Dong, D.; Zhu, R.; Yuan, X.; Hou, L.; et al. Geological Features, Major Discoveries and Unconventional Petroleum Geology in the Global Petroleum Exploration. Pet. Explor. Dev. 2010, 37, 129–145. [Google Scholar] [CrossRef]
  6. Klasic, M.; Schomburg, M.; Arnold, G.; York, A.; Baum, M.; Cherin, M.; Cliff, S.; Kavousi, P.; Miller, A.T.; Shajari, D.; et al. A review of community impacts of boom-bust cycles in unconventional oil and gas development. Energy Res. Soc. Sci. 2022, 93, 102843. [Google Scholar] [CrossRef]
  7. Gargiulo, M.; Chiodi, A.; de Miglio, R.; Simoes, S.; Long, G.; Pollard, M.; Gouveia, J.P.; Giannakidis, G. An Integrated Planning Framework for the Development of Sustainable and Resilient Cities—The Case of the InSMART Project. Procedia Eng. 2017, 198, 444–453. [Google Scholar] [CrossRef]
  8. Hosseini, S.H.; Shakouri, G.H.; Kazemi, A. Oil price future regarding unconventional oil production and its near-term deployment: A system dynamics approach. Energy. 2021, 222, 119878. [Google Scholar] [CrossRef]
  9. Chew, K.J. The Future of Oil: Unconventional Fossil Fuels. Philos. Trans. R. Soc. A Math. Phys. Eng. Sci. 2014, 372, 20120324. [Google Scholar] [CrossRef]
  10. Boak, J.; Kleinberg, R. Shale Gas, Tight Oil, Shale Oil and Hydraulic Fracturing. In Future Energy: Improved, Sustainable and Clean Options for Our Planet; Elsevier Science: Amsterdam, The Netherlands, 2020; pp. 67–95. [Google Scholar] [CrossRef]
  11. Jiao, F. Re-recognition of “unconventional” in unconventional oil and gas. Pet. Explor. Dev. 2019, 46, 847–855. [Google Scholar] [CrossRef]
  12. Wang, H.; Ma, F.; Tong, X.; Liu, Z.; Zhang, X.; Wu, Z.; Li, D.; Wang, B.; Xie, Y.; Yang, L. Assessment of Global Unconventional Oil and Gas Resources. Pet. Explor. Dev. 2016, 43, 925–940. [Google Scholar] [CrossRef]
  13. Mahmud, H.B.; Ermila, M.; Bennour, Z.; Mahmud, W.M.; Mahmud, H.B.; Ermila, M.; Bennour, Z.; Mahmud, W.M. A Review of Fracturing Technologies Utilized in Shale Gas Resources. In Emerging Technologies in Hydraulic Fracturing and Gas Flow Modelling; IntechOpen: London, UK, 2020. [Google Scholar] [CrossRef]
  14. Robbins, K. Awakening the Slumbering Giant: How Horizontal Drilling Technology Brought the Endangered Species Act to Bear on Hydraulic Fracturing. Case West. Reserve Law Rev. 2013, 63, 4. [Google Scholar]
  15. Hassett, K.; Forum, A.M.-O.E. Benefits of Hydraulic Fracking. 2013. Available online: https://ora.ox.ac.uk (accessed on 17 January 2022).
  16. Kroepsch, A.C. Horizontal Drilling, Changing Patterns of Extraction, and Piecemeal Participation: Urban Hydrocarbon Governance in Colorado. Energy Policy 2018, 120, 469–480. [Google Scholar] [CrossRef]
  17. Danso, D.K.; Negash, B.M.; Ahmed, T.Y.; Yekeen, N.; Omar Ganat, T.A. Recent Advances in Multifunctional Proppant Technology and Increased Well Output with Micro and Nano Proppants. J. Pet. Sci. Eng. 2021, 196, 108026. [Google Scholar] [CrossRef]
  18. Wang, J.; Elsworth, D. Role of Proppant Distribution on the Evolution of Hydraulic Fracture Conductivity. J. Pet. Sci. Eng. 2018, 166, 249–262. [Google Scholar] [CrossRef]
  19. Barbati, A.C.; Desroches, J.; Robisson, A.; McKinley, G.H. Complex Fluids and Hydraulic Fracturing. Annu. Rev. Chem. Biomol. Eng. 2016, 7, 415–453. [Google Scholar] [CrossRef] [PubMed] [Green Version]
  20. McMechan, D.E.; Shah, S.N. Static Proppant-Settling Characteristics of Non-Newtonian Fracturing Fluids in a Large-Scale Test Model. SPE Prod. Eng. 1991, 6, 305–312. [Google Scholar] [CrossRef]
  21. Ahmad, F.A.; Miskimins, J.L. Proppant Transport and Behavior in Horizontal Wellbores Using Low Viscosity Fluids. In Proceedings of the SPE Hydraulic Fracturing Technology Conference and Exhibition, The Woodlands, TX, USA, 5–7 February 2019. [Google Scholar] [CrossRef]
  22. Liang, F.; Sayed, M.; Al-Muntasheri, G.A.; Chang, F.F.; Li, L. A Comprehensive Review on Proppant Technologies. Petroleum 2016, 2, 26–39. [Google Scholar] [CrossRef] [Green Version]
  23. Yu, W.; Zhang, T.; Du, S.; Sepehrnoori, K. Numerical Study of the Effect of Uneven Proppant Distribution between Multiple Fractures on Shale Gas Well Performance. Fuel 2015, 142, 189–198. [Google Scholar] [CrossRef]
  24. Tong, S.; Mohanty, K.K. Proppant Transport Study in Fractures with Intersections. Fuel 2016, 181, 463–477. [Google Scholar] [CrossRef]
  25. Tan, Y.; Pan, Z.; Liu, J.; Feng, X.T.; Connell, L.D. Laboratory Study of Proppant on Shale Fracture Permeability and Compressibility. Fuel 2018, 222, 83–97. [Google Scholar] [CrossRef]
  26. Bulova, M.; Nosova, K.; Willberg, D.; Lassek, J. Benefits of the Novel Fiber-Laden Low-Viscosity Fluid System in Fracturing Low-Permeability Tight Gas Formations. In Proceedings of the SPE Annual Technical Conference and Exhibition, San Antonio, TX, USA, 24–27 September 2006; Volume 5, pp. 3479–3486. [Google Scholar] [CrossRef]
  27. Cui, C.; Wang, Z.; Wu, Z.; Cheng, X.; Ye, Y. Comprehensive Proppant Settling Model in Hydraulic Fractures of Unconventional Gas Reservoir Considering Multifactorial Influence. Arab. J. Geosci. 2020, 13, 1–8. [Google Scholar] [CrossRef]
  28. Sahai, R.; Moghanloo, R.G. Proppant Transport in Complex Fracture Networks—A Review. J. Pet. Sci. Eng. 2019, 182, 106199. [Google Scholar] [CrossRef]
  29. Yao, S.; Chang, C.; Hai, K.; Huang, H.; Li, H. A Review of Experimental Studies on the Proppant Settling in Hydraulic Fractures. J. Pet. Sci. Eng. 2021, 208, 109211. [Google Scholar] [CrossRef]
  30. Montgomery, C. Fracturing Fluids. In Proceedings of the ISRM International Conference for Effective and Sustainable Hydraulic Fracturing, Brisbane, Australia, 20–22 May 2013. [Google Scholar] [CrossRef] [Green Version]
  31. Daneshy, A.A. Numerical Simulation of Sand Transport in Hydraulic Fracturing. J. Pet. Technol. 1978, 30, 132–140. [Google Scholar] [CrossRef]
  32. Clark, P.E.; Manning, F.S.; Quadir, J.A.; Guler, N. Prop Transport in Vertical Fractures. Proc. In Proceedings of the SPE Annual Technical Conference and Exhibition, San Antonio, TX, USA, 4–7 October 1981. [Google Scholar] [CrossRef]
  33. Gadde, P.B.; Liu, Y.; Norman, J.; Bonnecaze, R.; Sharma, M.M. Modeling Proppant Settling in Water-Fracs. Proc. In Proceedings of the SPE Annual Technical Conference and Exhibition, Houston, TX, USA, 26–29 September 2004; pp. 373–382. [Google Scholar] [CrossRef]
  34. Joseph, D.D.; Liu, Y.J.; Poletto, M.; Feng, J. Aggregation and Dispersion of Spheres Falling in Viscoelastic Liquids. J. Non-Newton. Fluid Mech. 1994, 54, 45–86. [Google Scholar] [CrossRef]
  35. Kim, I.; Elghobashi, S.; Sirignano, W.A. Three-Dimensional Flow over Two Spheres Placed Side by Side. J. Fluid Mech. 1993, 246, 465–488. [Google Scholar] [CrossRef]
  36. Liu, J.; Zhang, P.; Xiao, Y.; Wang, Z.; Yuan, S.; Tang, H. Interaction between Dual Spherical Particles during Settling in Fluid. Phys. Fluids 2021, 33, 013312. [Google Scholar] [CrossRef]
  37. Cheng, N.S. Formula for the Viscosity of a Glycerol−Water Mixture. Ind. Eng. Chem. Res. 2008, 47, 3285–3288. [Google Scholar] [CrossRef]
  38. Volk, A.; Kähler, C.J. Density Model for Aqueous Glycerol Solutions. Exp. Fluids 2018, 59, 75. [Google Scholar] [CrossRef] [Green Version]
  39. Wu, J.; Manasseh, R. Dynamics of Dual-Particles Settling under Gravity. Int. J. Multiph. Flow 1998, 24, 1343–1358. [Google Scholar] [CrossRef]
  40. Tomac, I.; Tartakovsky, D.M. Experimental Evaluation of Turbulent Flow and Proppant Transport in a Narrow Fracture. In Proceedings of the 43rd Workshop on Geothermal Reservoir Engineering, Stanford, CA, USA, 12–14 February 2018. [Google Scholar]
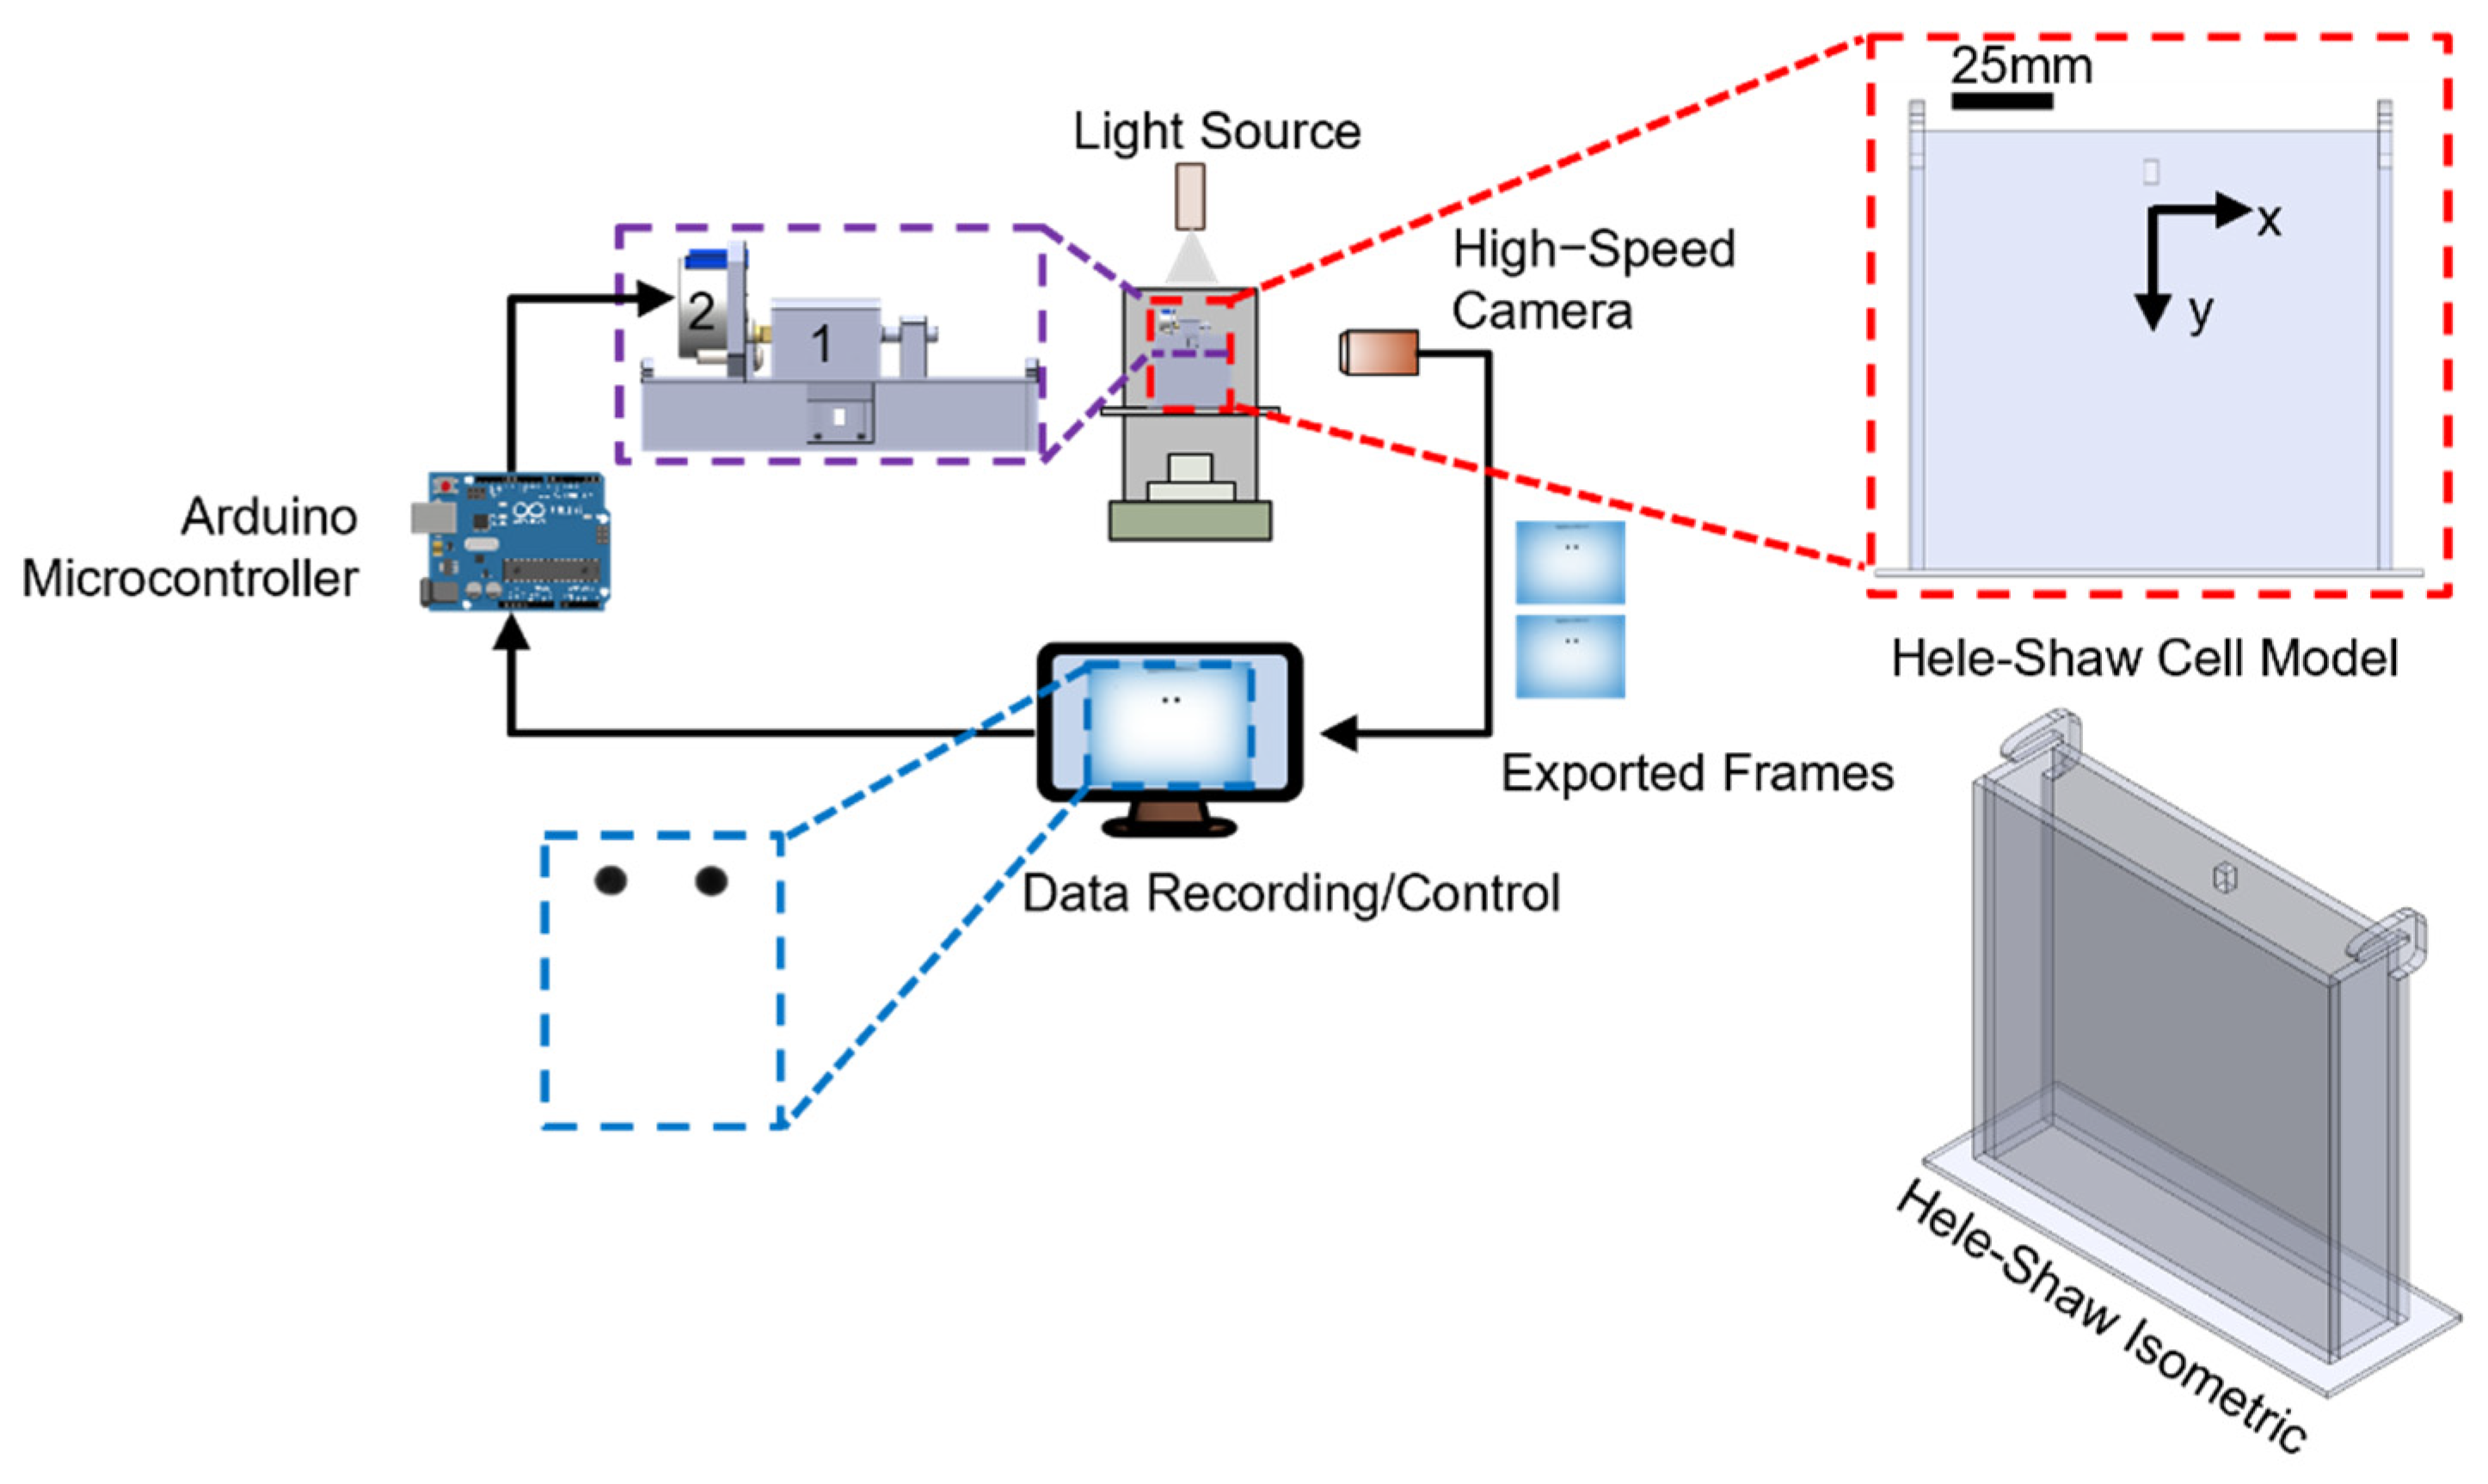
Figure 1. Schematic representing Hele-Shaw experimental apparatus. The particles were released from their initial location with the aid of a mechanical release system (#1) directly driven with a stepper motor (#2) and controlled with an Arduino microcontroller. High-speed imaging was utilized to map the positions of the particles in 2D space and time.
Energies 15 08721 g001
Figure 2. Configurations of initial separation distances between particles using two back-to-back laser-cut PMMA plates.
Energies 15 08721 g002
Figure 3. Schematic representing frames acquired with particle position at various time frames. The frames were segmented using MATLAB, resulting in 2D mapping of particle positions during settling.
Energies 15 08721 g003
Figure 4. A plot representing particle x displacement normalized by particle diameter as a function of time for thirty repeated experiments at 2D initial separation distance. It demonstrates the random behavior and unstable particle–particle interactions in pure water.
Energies 15 08721 g004
Figure 5. Plots representing normalized particle vertical and lateral positions as function of time in four different (v/v) mixtures of glycerin and water: (a) 25%, highest repulsion behavior demonstrated in a wide bottle-shaped trajectory; (b) 50%, less prominent repulsion demonstrated by a flattened bottle-shaped trajectory; (c) 75%, linear repulsion; and (d) 25%, no interaction.
Energies 15 08721 g005
Figure 6. Plots representing particle lateral separation distance ( δ x ) as a function of time for prominent repulsion (v/v) mixtures of glycerin and water, (a) 25% and (b) 50%, at various initial separation distances ( δ 0 ) —3D, 2D, 1D, and 0.25D. The plots indicate an inverse relationship between initial separation distance and lateral separation distance.
Energies 15 08721 g006
Figure 7. Plots representing particle normalized lateral separation distance ( δ x δ 0 ) as a function of time for glycerin and water mixtures, (a) 25% (v/v) and (b) 50% (v/v), at various separation distances ( δ 0 ) —3D, 2D, 1D, and 0.25D. The plots indicate an inverse relationship between initial and lateral separation distances.
Energies 15 08721 g007
Figure 8. Plots representing the rate of normalized relative particle lateral separation distance Δ ( δ x δ 0 )   Δ t as a function of time for prominent repulsion regime 25% (v/v) at various initial separation distances. ( δ 0 ) : (a) 3D, (b) 2D, (c) 1D, and (d) 0.25D. The plots indicate an inverse relationship between the rate of normalized relative particle lateral separation distance and lateral separation distance.
Energies 15 08721 g008
Figure 9. Plots representing an example of particles’ velocity components: (a) vertical and (b) lateral for 0.25D–25%(v/v) and their associated histogram distributions (c,d). Prominent repulsion is apparent in lateral velocity components.
Energies 15 08721 g009
Figure 10. Plots representing an example of particles’ velocity components: (a) vertical and (b) lateral for 0.25D–100% (v/v) and their associated histogram distributions (c,d). No interaction regime demonstrated by the lateral velocity fluctuating about a zero mean velocity.
Energies 15 08721 g010
Table 1. Characterization of dual settling particles’ averaged Reynolds number for a 0.25D initial separation distance.
Concentration
% ( v g v w )
Viscosity
( P a · s )
Density
( k g · m 3 )
Averaged Settling Velocity
( m m · s 1 )
Averaged Particle Reynolds Number
( R e p )
1001.4141260.82.6<<1
750.0551205.532.71
500.0081142.0122.845
250.0021071.5186.6200
00.001998.1234.9469
The computed Reynolds number values are based on averaged dual particles’ settling velocity.
Publisher’s Note: MDPI stays neutral with regard to jurisdictional claims in published maps and institutional affiliations.