Abstract
This paper investigates the effect of the electric double layer capacitor (EDLC) in reducing stress and prolonging the battery lifespan in a hybrid energy storage system (HESS). A 65 F, 16.2 V EDLC supercapacitor was connected in a laboratory experiment to produce its charge/discharge profile at a constant current of 5 and 10 A. The EDLC’s Faranda or “two branch model” mathematical parameters were extracted from the experimental charge/discharge profile. The extracted parameters were used as inputs to design the Python/MATLAB/Simulink (PMS)-hybrid model of the EDLC. The charge/discharge profiles of the simulated PMS model of the EDLC were then compared to the charge/discharge profiles derived from the experimental setup of the EDLC and were found to match. The PMS model of the EDLC was then used as a subcomponent in an HESS system modelled in MATLAB/Simulink. Using constant load conditions, the battery’s voltage, current, power and state of charge (SOC) were analyzed for a battery energy storage system (BESS) without a supercapacitor and then compared to an HESS system with a supercapacitor in an experimental setup. This process was repeated with the simulated PMS model of the EDLC in MATLAB/Simulink for HESS and without the EDLC for BESS. Finally using a variable load in an experimental setup, the battery’s voltage and current were analyzed for a BESS system and compared to an HESS system. All these data show that, in an HESS system with a supercapacitor, there is less stress on the battery with a load applied. This is indicated by the voltage and current values in an HESS system being consistently more stable with respect to time as compared to the BESS system. As a result, in an HESS system, the battery will have a longer lifespan.
1. Introduction
The need for the storage and backup of electrical power has given rise to the use and development of energy storage devices (ESD) [1] that can store the electrical energy produced. The most widespread and popular ESDs are batteries such as the lead-acid batteries and the lithium-ion batteries, just to name a few. While batteries have a high energy density, they exhibit low power densities [2], which hinder their performance in high-power fluctuating applications. In a battery energy storage system (BESS), the stress and instability [3] exerted on the battery in these instances lead to the reduction in the battery lifespan and increased costs in having to replace them. This has become one of the drawbacks and disadvantages of micro-grid BESS systems.
To counter this, a supercapacitor, or Electric Double-Layer Capacitor (EDLC), is connected in parallel with the battery in a hybrid energy storage system (HESS) to negate a lot of the effects of the high-power fluctuations [4,5,6]. The supercapacitor, with its high-power density and high charge/discharge cycles, responds quicker than the battery to the instantaneous change in power demands while leaving the battery to take care of the medium- and long-term energy needs. HESS configurations are used in diverse places such as micro-grids, hybrid electric vehicle (EV) cars [6] and uninterrupted power supply systems to optimize power usage and increase battery lifespans.
This research will aim to establish the effect of the EDLC on the battery in an HESS system by analyzing the voltage, current, power and state of charge (SOC) graphs of the battery in an HESS and compare these indicators to those in a BESS system without the EDLC. The voltage, current, power, charge used and the state of charge (SOC) values of the battery were first obtained experimentally and then by simulation. The simulation model consists of a Python/MATLAB/Simulink (PMS)-hybrid model [7] of the EDLC as a sub-component in a MATLAB/Simulink model for the HESS configuration. In the case of the BESS configuration, the EDLC is removed.
So far, most of the simulations of the hybrid energy storage systems [8,9] and the modelling of supercapacitors [10] have been carried out in purely MATLAB/Simulink simulation environments. In [8,9,10] the authors modelled the EDLC in MATLAB/Simulink and then simulated the HESS system [8,9] to determine the effect of the EDLC on the lifespan of the battery. In all these instances, the MATLAB/Simulink EDLC model integrated well with the battery in the HESS system, and simulations showed that the EDLC creates stability, reduces stress on the battery and thus helps to increase the battery lifespan.
In paper [11], the authors investigated a hybrid energy storage system (HESS) consisting of a superconductor and a battery to cater to power fluctuations in a micro-grid system. A control system based on a real-time digital simulator was introduced together with a battery lifetime prediction model. Experimental and simulation results showed that the HESS had the lifespan of the battery increasing from 6.38 years to 9.21 years when compared to a battery-only system.
A new control system to reduce battery aging which consists of a supercapacitor and a battery in a micro-grid energy storage system was proposed by the authors in [12]. Simulations were performed for a wind hybrid energy storage system, and by using this control system for it, a marked reduction in the battery peak current and the ampere hour throughput was observed, which will lead to an extension of the battery lifespan.
Similar work was carried out by the authors in [13], employing a power sharing method (PSM) in a hybrid storage system consisting of a li-ion battery and supercapacitor. The hybrid PSM was tested in a 10 MW system in the UK and USA to determine the impact on the battery lifespan. The results showed that by using the PSM and the hybrid storage system, the stress on the battery was significantly reduced.
Battery stress reduction and lifespan research was conducted in other HESS systems in [5,14,15,16,17], where the results concluded that the presence of the EDLC does indeed reduce battery stress and help to prolong battery lifespan.
The innovation or contribution of this research lies in the design of a Python/MATLAB/Simulink (PMS)-hybrid model of the EDLC model, which is first tested independently and then later incorporated with a battery in an HESS system for simulative purposes with the PMS-hybrid model to improve battery lifespan. Previous research on modelling EDLCs and HESS systems has focused mainly on a MATLAB/Simulink [8,10] approach or a model without the Python component. The main reason for incorporating Python programming is for its flexibility factor.
The outline of the work is as follows: Section 1 introduces the topic and discusses the literature on HESS systems and what other authors have achieved regarding this topic. Section 2 deals with the method that was used to carry out this research. Section 3 shows the results achieved. Section 4 analyzes and discusses the results. Finally, Section 5 concludes the work.
2. Methodology
2.1. Modelling and Parameter Extraction from the Live EDLC to Develop the PMS-Hybrid Simulation Model of the EDLC
The datasheet values of the actual EDLC that was modelled and then used as a sub-component in an HESS configuration can be seen in Table 1 below.

Table 1.
EDLC datasheet parameters.
The EDLC’s equivalent circuit parameters derived for this research were based on and obtained from the “two branch” or Faranda model of equivalent circuit models [18]. These parameters were crucial in designing and then simulating the Python/Matlab/Simulink (PMS)-hybrid model [7] of the EDLC and in later using the resulting model as a sub-component in the HESS configuration in MATLAB/Simulink. A laboratory experiment was initially setup where the EDLC was charged/discharged at a constant current of 5 and 10 A, respectively, to obtain its charge/discharge profile. The equivalent circuit parameters were then calculated from the experimental charge/discharge profiles using the equations and methods described in [18]. The “two branch” model is an electrical equivalent circuit representation of the EDLC that has been proven over the years to be quite reliable for EDLC simulation and in predicting EDLC behaviour.
Table 2 below shows the equivalent circuit parameters of the 65 F, 16.2 V EDLC derived at a constant current of 5 A from the charge profile.

Table 2.
EDLC-derived parameters at 5 A.
Table 3 below shows the equivalent circuit parameters of the 65 F, 16.2 V EDLC derived at a constant current of 10 A from the charge profile.

Table 3.
EDLC-derived parameters at 10 A.
Slight differences can be observed in the equivalent circuit values of C0, KV, C2 and R2 for 5 A and 10 A, but, otherwise, both sets of parameters correlate with similar values of supercapacitors in the literature and are within acceptable ranges.
After acquiring the parameters, these parameters were used as inputs to the designed Python/MATLAB/Simulink (PMS)-hybrid model [7]. The Python/MATLAB/Simulink (PMS)-hybrid model in Figure 1 was used to simulate the EDLC.
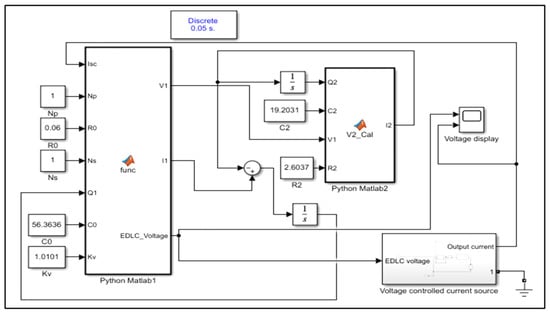
Figure 1.
Python/MATLAB/Simulink (PMS) model.
The PMS model works by taking in the derived parameters as inputs in the sub-component of Simulink. The distinct curve characteristics of the EDLC were produced through a Python code encapsulated in MATLAB. The Python code communicates with the MATLAB code in certain sub-sections of the algorithm for calculating the different values. The results of this are returned to Simulink, where they are displayed on a scope and at the same time downloaded to Excel files for record and data keeping. The voltage-controlled current source is used to supply the input current to pulse the PMS EDLC model in a repeated cycle.
The simulated charge/discharge profiles of the EDLC emanating from the PMS-hybrid model were subsequently compared to the live experimental charge/discharge profiles to determine the accuracy of the derived parameters and the designed PMS-hybrid model. The comparison is analyzed in the Section 3.
2.2. Design of the Experimental HESS Model and the MATLAB/Simulink Simulation HESS Model with a PMS-Hybrid EDLC as a Sub-Component
The EDLC parameters derived from the experimental charge/discharge profile of the live 65 F, 16.2 V EDLC were used to design the PMS-hybrid model of the EDLC. The actual 65 F, 16.2 V EDLC was used in the design of the experimental HESS circuit, and the PMS-hybrid model of the EDLC was used to design the MATLAB/Simulink [9] simulation HESS model. The experimental HESS model consists of the following components: the 65 F, 16.2 V EDLC and a 12 V lead-acid battery whose parameters are shown in Table 4. These two are the main components in the HESS. A 0–20 V variable DC power supply was used to charge the battery and the EDLC, a 5.2 Ω, 20 W variable resistor load can be set up to draw a constant or a variable current, a 20 A, 200 mV shunt resistor of a low impedance value was used to measure the current drawn by the load at the battery and, finally, a four-channel 20 MHZ Tektronix oscilloscope was used to measure the circuit voltage and current at any point.

Table 4.
Lead-acid battery parameters.
The block diagram summarizing the components of the experimental HESS can be seen in Figure 2 below. The experimental HESS circuit focuses mainly on the current demand from the load side by placing the supercapacitor after the battery on the load side.
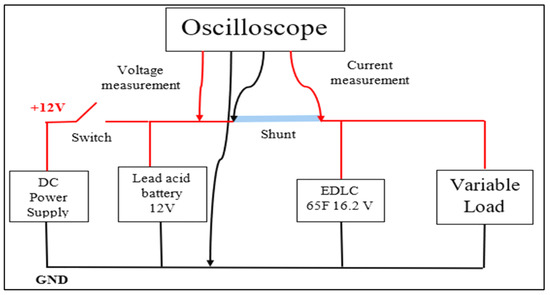
Figure 2.
Experimental Hybrid Energy Storage System block diagram.
Figure 3 shows the components in the experimental HESS circuit connected in the actual laboratory experiment. The 0–20 V variable DC-power supply, the 65 F, 16.2 V, EATON model EDLC, the RS-PRO 12 V Sealed lead-acid battery (7 Ah), a 20 A, 200 mV shunt resistor, a four-channel 20 MHz Tektronix oscilloscope and the 5.2 Ω, 20 W variable load can be clearly seen in the circuit below.
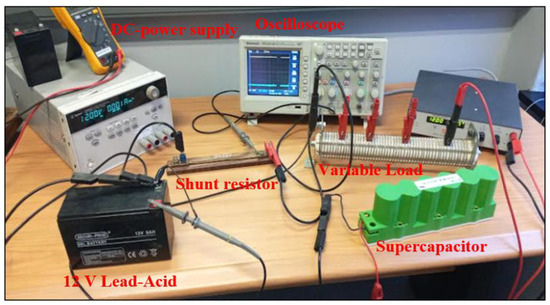
Figure 3.
Experimental Hybrid Energy Storage System (HESS) laboratory setup.
The experiment involved first connecting only the fully charged battery in-circuit in a battery energy storage system (BESS) [19,20] configuration with the load. The values of the battery voltage and current were measured. The battery power utilization, the charge used and the state of charge (SOC) of the battery as a function of time were then calculated under a constant load condition. Under a variable load condition, only the battery voltage and current fluctuations were measured. Equations (1)–(4) below were used to calculate the charge utilization of the battery and the SOC of the battery as a function of time. The total or accumulative battery charge is given in (1), derived from [8,15],
where Ah is the ampere-hours battery rating and total charge is the maximum charge that this battery can hold.
Derived from [8,15], the charge used is:
where is the battery discharge current and is the time duration.
Derived from [8,15], the charge remaining is:
Derived from [8,15], the SOC is:
where SOC is the state of charge of the battery at any time.
The discharge voltage, current, power, charge used and SOC of the battery were obtained for the BESS experiment. The EDLC was added to the experimental circuit by connecting it in parallel to the battery to turn it into a hybrid energy storage system (HESS). The voltage and current were measured, and the power, battery charge used and SOC were derived in a manner similar to what was performed in the BESS experiment. The battery data obtained under the BESS configuration were compared to the battery data obtained under the HESS configuration, and the results were analyzed in the Section 3 and Section 4. The lead-acid battery and the EDLC were pre-charged to a voltage of 12 V before running these experiments.
The HESS simulation model was designed with the PMS-hybrid model of the EDLC as a sub-component in the MATLAB/Simulink HESS model. To use the PMS-hybrid model as a sub-component in the MATLAB/Simulink HESS model, one input and one output of the PMS-hybrid model of the EDLC must be considered. The input to the PMS model of the EDLC is the node which supplies the current. The output of the PMS model of the EDLC is the node which generates the voltage, as shown in Figure 1. In the HESS simulation model in Figure 4 the node is connected to the node in the PMS sub-component, and the “1” node is connected to node in the PMS sub-component. The simulation setup, shown in Figure 4, consists of the designed EDLC PMS-hybrid model encapsulated as a subsystem, an in-built Simulink lead-acid battery, a Simulink resistive load, a Simulink scope for data capturing, a Simulink current measuring meter, connected in series with the battery, as was performed in the experimental setup, and a Simulink voltage measuring device in parallel with the load. The lead-acid battery and the EDLC had built-in voltages.
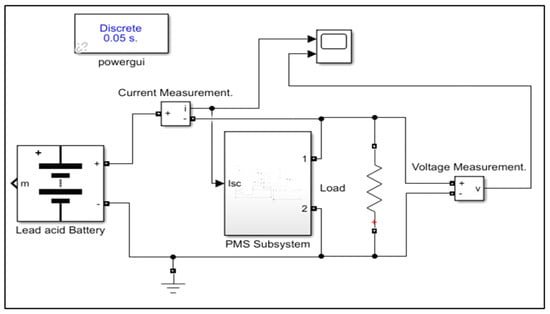
Figure 4.
Simulated Hybrid Energy Storage System (HESS) MATLAB/Simulink model.
The simulation model was first configured with a battery-only (BESS) setup similar to what was performed in the laboratory experiment, and then the battery voltage, current and SOC were captured in the BESS configuration. The simulation was repeated with a lead-acid battery and a PMS EDLC in an HESS configuration; the exact same data were captured. The graphs for the battery voltage, current and SOC for the BESS and HESS configurations were then compared.
3. Results and Analysis
3.1. Results for the EDLC
The EDLC’s experimental charge profiles obtained at a constant current of 5 and 10 A were superimposed on each other, as can be seen in the graph in Figure 5. It can be clearly seen that the charge profile for 10 A has a much higher gradient than the charge profile for 5 A, resulting in the 16.2 V EDLC reaching its maximum voltage of 16.2 V within a shorter time at 10 A. This result is consistent with the theory of charging the EDLC at a higher current.
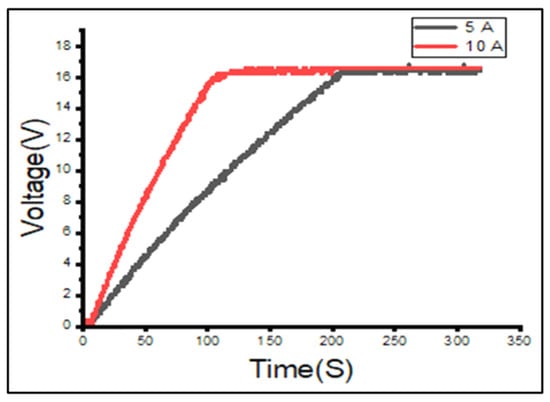
Figure 5.
EDLC’s experimental charge profile at 5 and 10 A.
The experimental discharge profiles of the EDLC can be seen in Figure 6 below. The discharge profiles are obtained by discharging the EDLC at a constant current of 5 and 10 A. The EDLC discharges within a shorter time at the higher current of 10 A than it does at 5 A. This is depicted by the higher gradient of the 10 A discharge profile. The supercapacitor charge profiles in Figure 5 are not exactly linear and have a bit of decay but do not exactly match the exponential decay seen in the discharge profile in Figure 6. They both truly come from a constant-current supply/load; however, for them to perfectly match each other, they would have to come from an ideal experimental charge/discharge profile of a supercapacitor. However, this does not occur in the experiment because you have some hysteresis losses in the charge/discharge cycle since the constant current is maintained by a 5.2 Ω, 20 W potentiometer variable resistor load with coils, as seen in Figure 3. The potentiometer contacts also play a role in the resistive load.
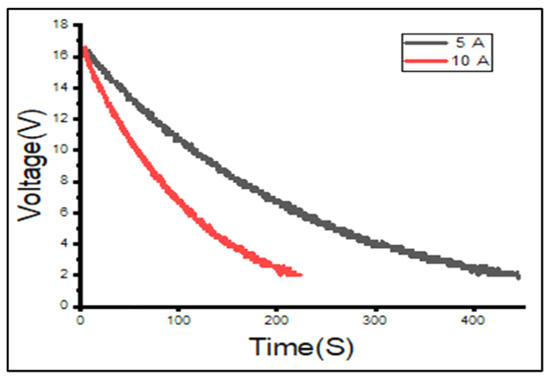
Figure 6.
EDLC experimental discharge profile at 5 and 10 A.
The simulated EDLC charge profiles are obtained by executing the PMS-hybrid model designed in Section 2.1. The charge profiles are carried out for both 5 and 10 A by utilizing the extracted set of parameters in Table 2 for 5 A and the extracted set of parameters in Table 3 for 10 A. Both charge profiles are superimposed in Figure 7 below. Just as in the experimental results, in the simulation charge profiles, the 10 A plot shows a higher gradient than the 5 A plot. The simulated charge profiles from the PMS-hybrid model show a smoother curve than those derived from the experiment, which is potentially due to the Python simulation of the supercapacitor character.
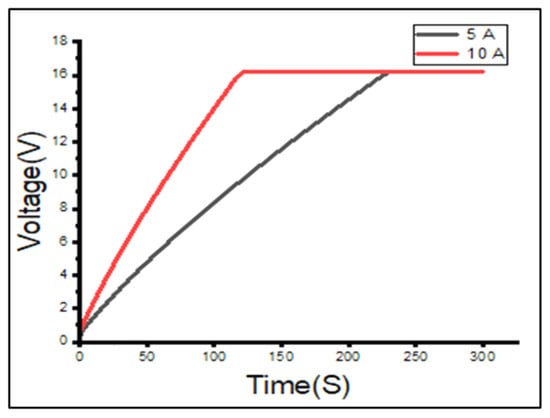
Figure 7.
EDLC simulated charge profile at 5 and 10 A.
The simulated discharge profiles of the EDLC can be seen in Figure 8 below. The simulated discharge profiles show the EDLC discharging within a shorter time at 10 A than at 5 A.
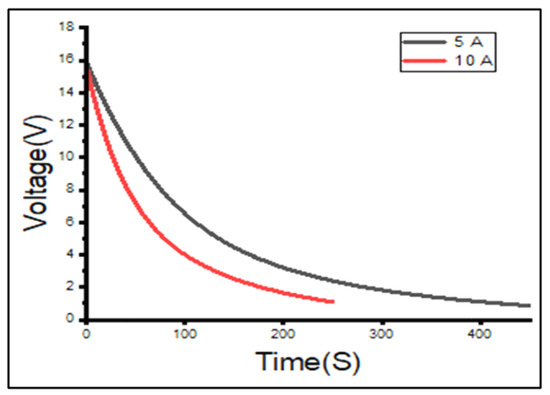
Figure 8.
EDLC simulated discharge profile at 5 and 10 A.
Figure 9 shows the experimental and simulated charge profiles superimposed on the same graph in order to enhance comparison between the two models, as indicated in Section 3 A. In the charge profiles, it can be seen that, for both 5 and 10 A currents, the experimental and simulated graphs exhibit almost a perfect match. This reflects a correct extraction of the parameters from the live EDLC. There is, however, a slight difference or lag between the experimental profile and the simulation profile for both currents. This lag is brought about by a few factors, including: the parameters extracted need to be input to the Simulink sub-component of the PMS model; there is a feedback loop in the PMS model in Figure 1 which consists of the voltage-controlled current source taking the output voltage of the EDLC generating a current and feeding it back as the input current to the EDLC; this has a time requirement and introduces some delay. The simulation of the EDLC in MATLAB has a clock delay cycle of . Lastly, when using programming languages such as Python and C++, they introduce a smoothening effect on the curve that is perceived as a slight lag.
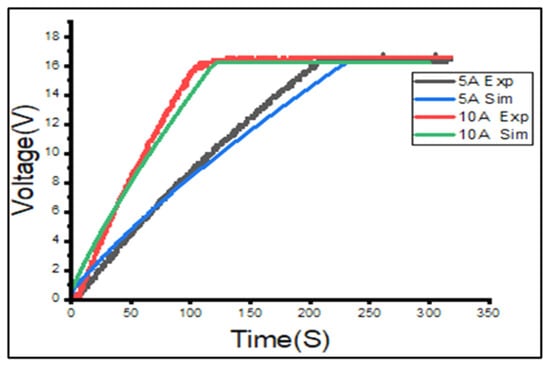
Figure 9.
Experimental and simulated charge profiles superimposed at 5 and 10 A.
Figure 10 below shows the experimental and simulated discharge profiles of the EDLC superimposed on the same graph. The discharge profiles for both 5 and 10 A currents show a slightly more pronounced difference or variation between the experimental and simulated graphs. The reason for this, apart from the voltage-controlled current source contribution highlighted in the preceding paragraph, is that the “two branch” model parameters were extracted from the experimental charge profiles, inserted into the PMS model and used for both charge and discharge profiles, whilst they are only an estimate for the discharge profile. This was performed to automate the charge/discharge cycle process when the EDLC is used as a sub-component in the HESS model to evaluate its effect on the battery in the HESS.
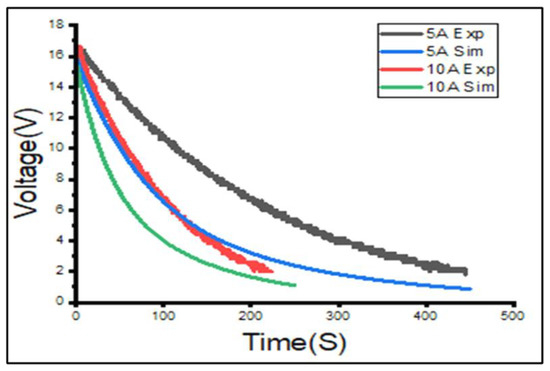
Figure 10.
Experimental and simulated discharge profiles superimposed at 5 and 10 A.
3.2. Results for Experimental HESS and Simulated HESS Relating to Battery Life
3.2.1. Experimental HESS Results
The battery voltage values measured experimentally for both the BESS and HESS configurations can be seen in Figure 11. The BESS graph shows a sudden drop in voltage, while the HESS curve shows a more stable drop in voltage. The variation between the curves in the BESS and HESS configurations is highlighted by the green circle with short dashes. In the HESS system, the voltage drop is reduced by 17%. The reduction in voltage occurs due to the load connection which draws current from the battery. In the BESS configuration, the load draws a larger current from the battery; as a result, there is a larger drop in voltage. In the HESS configuration, the load draws a smaller current from the battery since the supercapacitor supplies some of the current, and the impedance from the battery looking in the direction of the load, is higher due to the presence of the supercapacitor. Hence, the battery voltage in an HESS configuration varies less than that in a BESS configuration and is more stable. This applies less stress on the battery and can improve its lifespan.
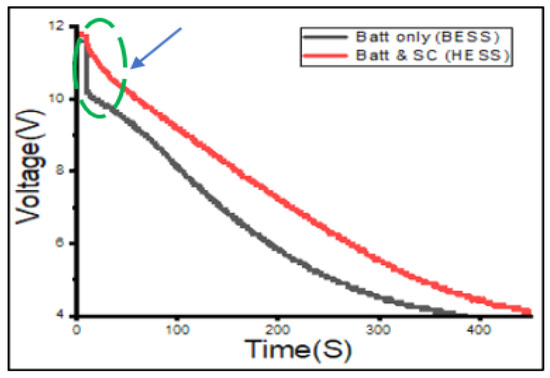
Figure 11.
Experimental BESS and HESS voltages superimposed.
The battery current values measured experimentally for both the BESS and HESS configurations can be seen in Figure 12. The green circle with short dashes shows the variation between the battery current in the BESS and HESS configurations. The sudden spike in current experienced by the battery in the BESS configuration went up to a peak of approximately 37 A. This increase in current was very sudden. In the HESS configuration the increase in battery current is less sudden, more controlled and reaches a peak of about 19 A. The battery peak current drawn by the load in the HESS configuration is approximately 48.6% lower than that in the BESS configuration at the onset. The current drawn in HESS does not spike and is more controlled and stable due to the presence of the EDLC. This puts less stress on the battery and can prolong its lifespan.
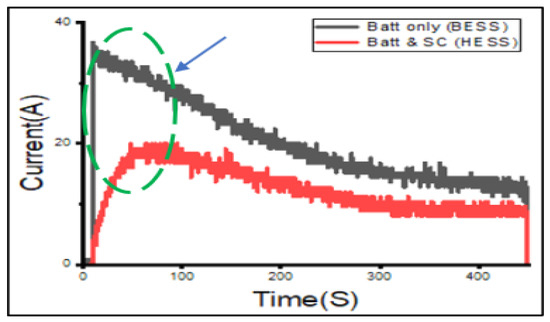
Figure 12.
Experimental BESS and HESS currents superimposed.
The battery power results obtained experimentally for both the BESS and HESS configurations can be seen in Figure 13. The power drawn from the battery in the BESS configuration is higher than that drawn in the HESS configuration. In the HESS setup, the power drawn at the onset is reduced by 48.6%. The power drawn in the BESS setup exhibits a sharp spike. In the HESS setup, the power drawn is more stable and controlled. The power drawn in the BESS setup has a larger variation than that in the HESS setup. This means that the battery in the HESS setup will experience less stress and improve battery life. Additionally, the sudden surge of power in a BESS setup can potentially damage a load, whereas, in the HESS setup with the supercapacitor present, the load is partially protected.
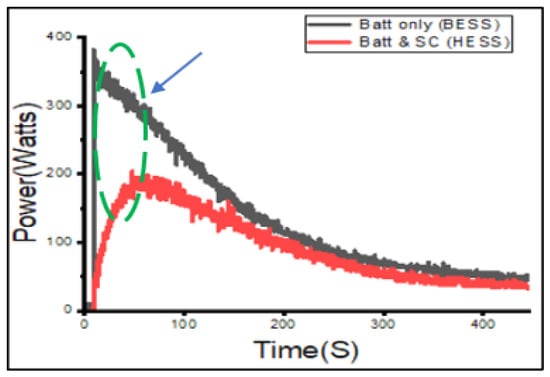
Figure 13.
Experimental BESS and HESS power superimposed.
The charge utilization curves derived experimentally for both the BESS and HESS configurations can be seen in Figure 14 below. In the HESS configuration, the amount of charge used from the battery during the discharge process is less than that of the BESS configuration. The difference is indicated by the green circle with short dashes. The charge utilized in the HESS setup by the battery after 8 min is 44% less than that in the BESS. This indicates that the battery would last longer for a single discharge cycle in the HESS setup. The charge utilization curve in the BESS setup has a larger gradient as compared to the HESS curve. Figure 14 shows that the cumulative battery charge used at the time 500 s of the experiment is less in the HESS setup than it is in the BESS setup. The area under the curve gives the total charge of the battery.
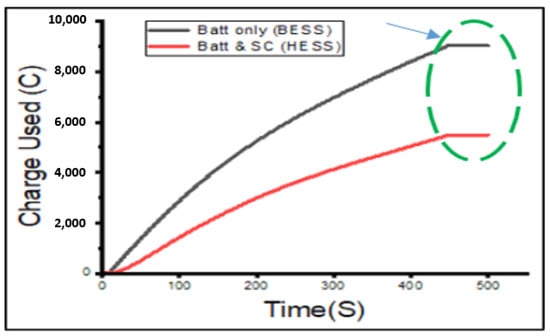
Figure 14.
Experimental BESS and HESS charge utilization superimposed.
The SOC results calculated from the experiment for both the BESS and HESS configurations can be seen in Figure 15. The battery SOC percentile in the BESS setup decreased within a shorter time and at a higher gradient than that in the HESS setup. At a runtime of 500 s, the battery SOC in the HESS setup was 98.25%, and the battery SOC in the BESS setup was 96.75%. This indicates that there is more charge left in the battery in the HESS than in the BESS at the same time.
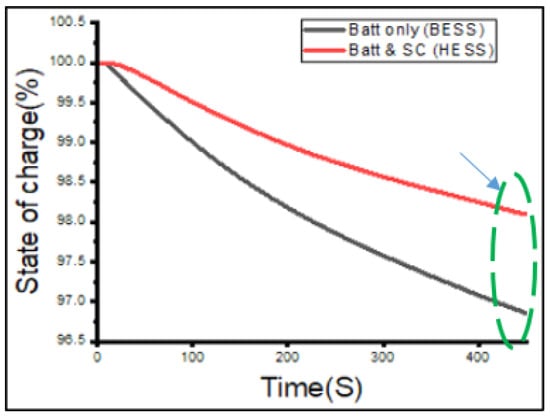
Figure 15.
Experimental BESS and HESS State of Charge (SOC) remaining superimposed.
3.2.2. Simulated HESS Results
The simulation results obtained with the PMS-hybrid EDLC model in MATLAB/Simulink (HESS) and without the PMS-hybrid EDLC model in MATLAB/Simulink (BESS) are given in this section. The simulated voltage values can be seen in Figure 16. The figure shows that, in the BESS setup, the battery voltage drops more significantly than in the HESS setup. This proves that less stress is exerted on the battery due to the presence of the EDLC in the HESS. The trends of the voltage values in the simulated setup follow a similar pattern as those in the experimental setup, validating the simulation model.
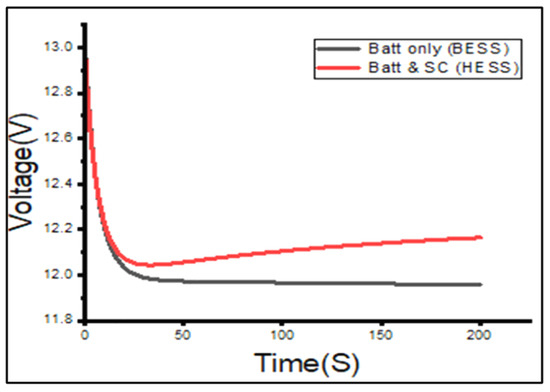
Figure 16.
Simulated BESS and HESS battery voltage values.
Figure 17 shows that, in the BESS setup, the battery current remains consistently high and does not drop. This applies stress on the battery. In the HESS system, the battery current is less than that in the BESS system, and it gradually decreases; as a result, the current drawn from the battery is not large and it is controlled, reducing the stress on the battery. This is due to the presence of the EDLC sharing the battery workload, resulting in a relief of stress on the battery. The reduction in current in the HESS system is indicated in [12], therefore validating the result in this work. The trends of the current values in the simulated setup follow a similar pattern to those in the experiment, validating the simulation. It is observed that the graphs of the battery indicators in the HESS system derived from the simulated PMS model are much smoother than those obtained with other modelling tools, as in [12]. This makes it easier to analyze the trends of battery indicators and values in an HESS system. This can be seen in Figure 17. This is a common observation with programming languages such as Python and C++.
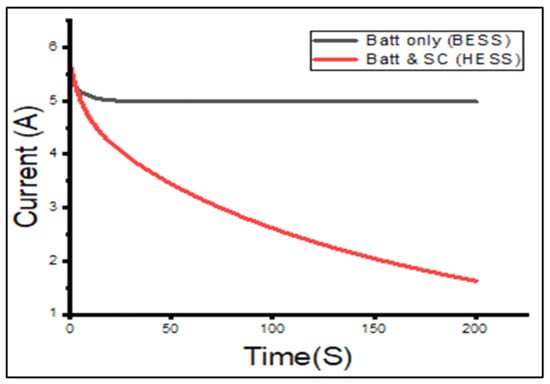
Figure 17.
Simulated BESS and HESS battery current values.
The simulation results in Figure 18 show that the battery SOC decreases [21] rapidly under the BESS configuration with a high gradient as compared to that of the HESS, which decreases gradually. The final battery SOC percentile in the BESS is approximately 96.75%, and, in the HESS, it is approximately 98.25% after 200 s, which is a variance of about 1.5%, correlating with the experimental model and validating the simulation. The higher SOC in the HESS model is achieved by the presence of the EDLC. The EDLC is strategically placed after the battery to deal with the load demand fluctuations and to protect the battery from the load, as is detailed in the next section.
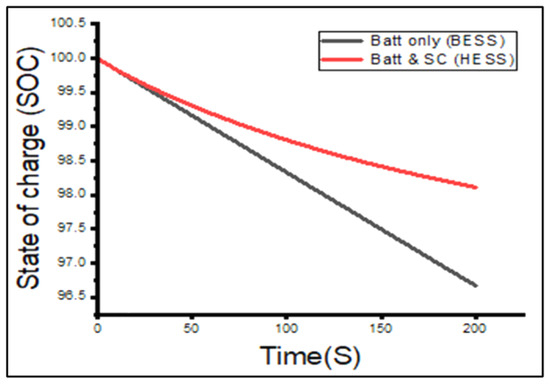
Figure 18.
Simulated BESS and HESS SOC percentiles.
3.2.3. Variable Load/Current Results for the Experimental HESS Only
In this experiment, a variable load was used, whose resistance was varied by increasing and then decreasing the load every 10 s. Figure 19 shows the resulting voltage trajectories for the BESS and HESS configurations when a variable load is used.
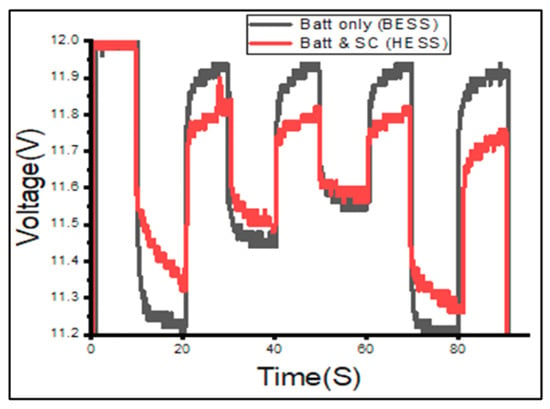
Figure 19.
Experimental BESS and HESS battery voltage fluctuations due to a variable load.
The battery voltage in a BESS configuration has larger amplitudes for each repeated cycle as compared to that in the HESS configuration. This means that the battery in a BESS configuration experiences more stress with a variable load.
Figure 20 shows a similar result for the current profile with a variable load. The current drawn in a BESS shows larger amplitudes per cycle and spikes at the onset of the demand, whilst in the HESS configuration, the current shows a lower amplitude and fewer variations.
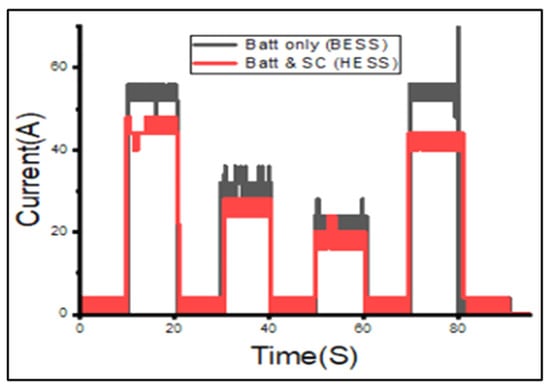
Figure 20.
Experimental BESS and HESS battery current fluctuations due to a variable load.
4. Discussions
All of the results given above conclusively indicate that the presence of the EDLC in an HESS configuration has a positive effect on the health of a battery due to the reduced variations of indicators such as battery voltage, current, charge utilized and SOC. This improves battery lifespan compared to when the EDLC is absent in a BESS configuration. The relationship between the change in the indicators and the battery aging effects is summarized in Table 5 below. The aging processes of a lead-acid battery are detailed in [12].

Table 5.
Changes in Battery Stress indicators and lifespan.
Battery sulfation involves the accumulation of lead sulfate on the plates of a battery. This process is exacerbated by rapid discharging, overcharging and undercharging of the battery, caused by current values.
Battery degradation of active material or aging involve the partial conversion of the active material in a battery, that is, the lead dioxide ( and lead sulfate . This is normally caused by high-voltage fluctuations. The average values of the percentiles of the indicators that are directly related to stress on the battery are taken, such as the battery voltage, whose voltage drop is reduced by 17%, battery current, where the current spike is reduced by 48.6%, battery power, whose spike was reduced by 48.6%, and charge used, which was reduced by 44%. Taking the average of the percentile changes in the indicators gives a potential increase in battery lifespan of approximately 39.5%.
5. Conclusions
In this research, a 16.2 V, 65 F EDLC or supercapacitor is modelled using the “two branch model”. The parameters of the EDLC using the “two-branch model” were extracted from the charge profile of the live EDLC experimentally at a constant current of 5 and 10 A. These parameters were used as inputs to Simulink sub-components to accurately model a Python/MATLAB/Simulink (PMS)-hybrid model of an EDLC. In the PMS-hybrid model, Python was used to program sub-sections of the EDLC, which communicated with the MATLAB code. The PMS-hybrid model of the EDLC was successfully incorporated as a subsystem into a MATLAB/Simulink system with a lead-acid battery to form an HESS model for simulation purposes. The same setup was used experimentally to form an experimental HESS model. A photovoltaic (PV) system [22] is not modeled in this work; only the load demand-side perspective is analyzed.
The battery in a BESS system without a supercapacitor experiences high levels of voltage and current fluctuations that exert stress on the battery and shorten its lifespan. In order to counter this, an EDLC is connected in parallel with the battery on the load side to form an HESS. The EDLC, because of its high-power density, absorbs the sudden spike currents and responds more quickly to fluctuating power demands from the load. The EDLC shares the supply of current to the load with the battery in an HESS system, thus protecting the battery. This, in the long term, saves the battery and prolongs its lifespan, reducing the overall cost associated with replacing batteries. The experimental HESS and simulation HESS results prove these results when compared to battery-only BESS systems. The battery voltage values in an HESS were reduced by 17%, the current values were reduced by almost 48.6%, the power values were reduced by 48.6% and the SOC of the battery increased by 1.5% when compared to BESS systems. Optimized energy utilization [23] and energy storage systems are key elements in todays’ technological world.
Author Contributions
Conceptualization, C.T.T. and P.U.; methodology, C.T.T.; software, C.T.T.; validation, C.T.T. and P.U.; formal analysis, C.T.T. and P.U.; investigation, C.T.T. and P.U.; resources, C.T.T.; data curation, C.T.T.; writing—original draft preparation, C.T.T.; writing—review and editing, P.U.; visualization, P.U.; supervision, P.U.; project administration, P.U.; funding acquisition, P.U. All authors have read and agreed to the published version of the manuscript.
Funding
This research was funded by the University of South Africa. The APC was funded by the University of South Africa.
Institutional Review Board Statement
The Unisa School of Engineering (SOE) Ethics Review Committee has found this study to be a negligible-risk study since no humans are involved in the work. The ERC approval number is 2021/CSET/SOE/067.
Informed Consent Statement
Not applicable.
Data Availability Statement
Not applicable.
Acknowledgments
We would like to acknowledge the resources and support provided by the University of South Africa in the completion of this work, and we would also like to acknowledge the resources provided by Circuit Breaker Industries (CBI) Electric Low Voltage, Gauteng, South Africa.
Conflicts of Interest
The authors declare no conflict of interest.
References
- Danila, E. History of the first energy storage systems. In Proceedings of the 3rd International Symposium on the History of Electrical Engineering and of Tertiary Level Engineering Education, Iasi, Romania, 27–29 October 2010. [Google Scholar]
- Prasad, G.G.; Shetty, N.; Thakur, S.; Bommegowda, K.B. Supercapacitor technology and its applications: A review. IOP Conf. Ser. Mater. Sci. Eng. 2019, 561, 012105. [Google Scholar] [CrossRef]
- Sayed, K.; Kassem, A.M.; Aboelhassan, I.; Aly, A.M.; Abo-Khalil, A.G. Role of supercapacitor energy storage in DC microgrid. Menoufia J. Electron. Eng. Res. 2019, 28, 263–268. [Google Scholar] [CrossRef]
- Camara, M.A. Modeling of a hybrid energy storage system supplied by a photovoltaic source to feed a DC motor. Int. J. Renew. Sustain. Energy 2013, 2, 222–228. [Google Scholar] [CrossRef]
- Jing, W.; Lai, C.H.; Wong, S.H.W.; Wong, M.L.D. Battery-supercapacitor hybrid energy storage system in standalone DC microgrids: A review. IET Renew. Power Gener. 2017, 11, 461–469. [Google Scholar] [CrossRef]
- Saha, R.; Dey, J.P.V. Battery and ultra-capacitor based hybrid energy storage system. In Proceedings of the IEEE 16th India Council International Conference (INDICON), Rajkot, India, 13–15 December 2019; pp. 1–4. [Google Scholar]
- Tshiani, C.T.; Umenne, P. The characterization of the Electric Double-Layer Capacitor (EDLC) using Python/MATLAB/Simulink (PMS)-hybrid model. Energies 2022, 15, 5193. [Google Scholar] [CrossRef]
- Argyrou, M.C.; Christodoulides, P.; Marouchos, C.C.; Kalogirou, S.A. Hybrid battery-supercapacitor mathematical modeling for PV application using Matlab/Simulink. In Proceedings of the 53rd International Universities Power Engineering Conference (UPEC), Glasgow, UK, 4–7 September 2018; pp. 1–6. [Google Scholar]
- Sahin, M.E.; Blaabjerg, F. A hybrid PV-battery/supercapacitor system and a basic active power control proposal in MATLAB/Simulink. Electronics 2020, 9, 129. [Google Scholar] [CrossRef]
- Sahin, M.E.; Blaabjerg, F.; Sangwongwanich, A. Modelling of supercapacitors based on simplified equivalent circuit. CPSS Trans. Power Electron. Appl. 2021, 6, 31–39. [Google Scholar] [CrossRef]
- Li, J.; Xiong, R.; Mu, H.; Cornélusse, B.; Vanderbemden, P.; Ernst, D.; Yuan, W. Design and real-time test of a hybrid energy storage system in the microgrid with the benefit of improving the battery lifetime. Appl. Energy 2018, 218, 470–478. [Google Scholar] [CrossRef]
- Gee, A.M.; Dunn, R.W. Novel battery/supercapacitor hybrid energy storage control strategy for battery life extension in isolated wind energy conversion systems. In Proceedings of the 45th International Universities Power Engineering Conference (UPEC2010), Cardiff, UK, 31 August–3 September 2010; pp. 1–6. [Google Scholar]
- Bahloul, M.; Khadem, S.K. Impact of power sharing method on battery life extension in HESS for grid ancillary services. IEEE Trans. Energy Convers. 2018, 34, 1317–1327. [Google Scholar] [CrossRef]
- Hajiaghasi, S.; Salemnia, A.; Hamzeh, M. Hybrid energy storage system for microgrids applications: A review. J. Energy Storage 2018, 21, 543–570. [Google Scholar] [CrossRef]
- Oussama, H.; Othmane, A.; Amine, S.M.; Amine, H.M.; Abdeselem, C.; Abdelkader, A.B. Modeling and control a DC-microgrid based on PV and HESS Hybrid Energy Storage System. Presented at the First International Conference on Smart Grids, CIREI’, Oran, Algeria, 4–6 March 2019; pp. 1–5. [Google Scholar]
- Li, F.; Xie, K.; Yang, J. Optimization and analysis of a hybrid energy storage system in a small-scale standalone microgrid for Remote Area Power Supply (RAPS). Energies 2015, 8, 4802–4826. [Google Scholar] [CrossRef]
- Suzuki, S.; Baba, J.; Shutoh, K.; Masada, E. Effective application of Superconducting Magnetic Energy Storage (SMES) to load leveling for high speed transportation system. IEEE Trans. Appl. Supercond. 2004, 14, 713–716. [Google Scholar] [CrossRef]
- Faranda, R.; Gallina, M.; Son, D.T. A new simplified model of Double-Layer Capacitors. In Proceedings of the International Conference on Clean Electrical Power, Capri, Italy, 21–23 May 2007; pp. 706–710. [Google Scholar]
- Papic, I. Simulation model for discharging a lead-acid battery energy storage system for load leveling. IEEE Trans. Energy Convers. 2006, 21, 608–615. [Google Scholar] [CrossRef]
- Bai, Y.; Li, J.; He, H.; Dos Santos, R.C.; Yang, Q. Optimal design of a hybrid energy storage system in a plug-in hybrid electric vehicle for battery lifetime improvement. IEEE Access 2020, 8, 142148–142158. [Google Scholar] [CrossRef]
- Lin, X.; Zhang, J. Battery aging-aware energy management strategy with dual-state feedback for improving life cycle economy by using multi-neural networks learning algorithm. J. Energy Storage 2022, 46, 103890. [Google Scholar] [CrossRef]
- Ogudo, K.A.; Umenne, P. Design of a PV based power supply with a NonInverting Buck-Boost Converter. In Proceedings of the IEEE PES/IAS PowerAfrica Conference, Abuja, Nigeria, 20–23 August 2019; pp. 545–549, ISBN 978-1-7281-1010-3. [Google Scholar]
- Umenne, P.; Srinivasu, V.V. Femtosecond-laser fabrication of micron and sub-micron sized S-shaped constrictions on high T c superconducting YBa2Cu3O7−x thin films: Ablation and lithography issues. J. Mater. Sci. Mater. Electron. 2016, 28, 5817–5826. [Google Scholar] [CrossRef]
Publisher’s Note: MDPI stays neutral with regard to jurisdictional claims in published maps and institutional affiliations. |
© 2022 by the authors. Licensee MDPI, Basel, Switzerland. This article is an open access article distributed under the terms and conditions of the Creative Commons Attribution (CC BY) license (https://creativecommons.org/licenses/by/4.0/).